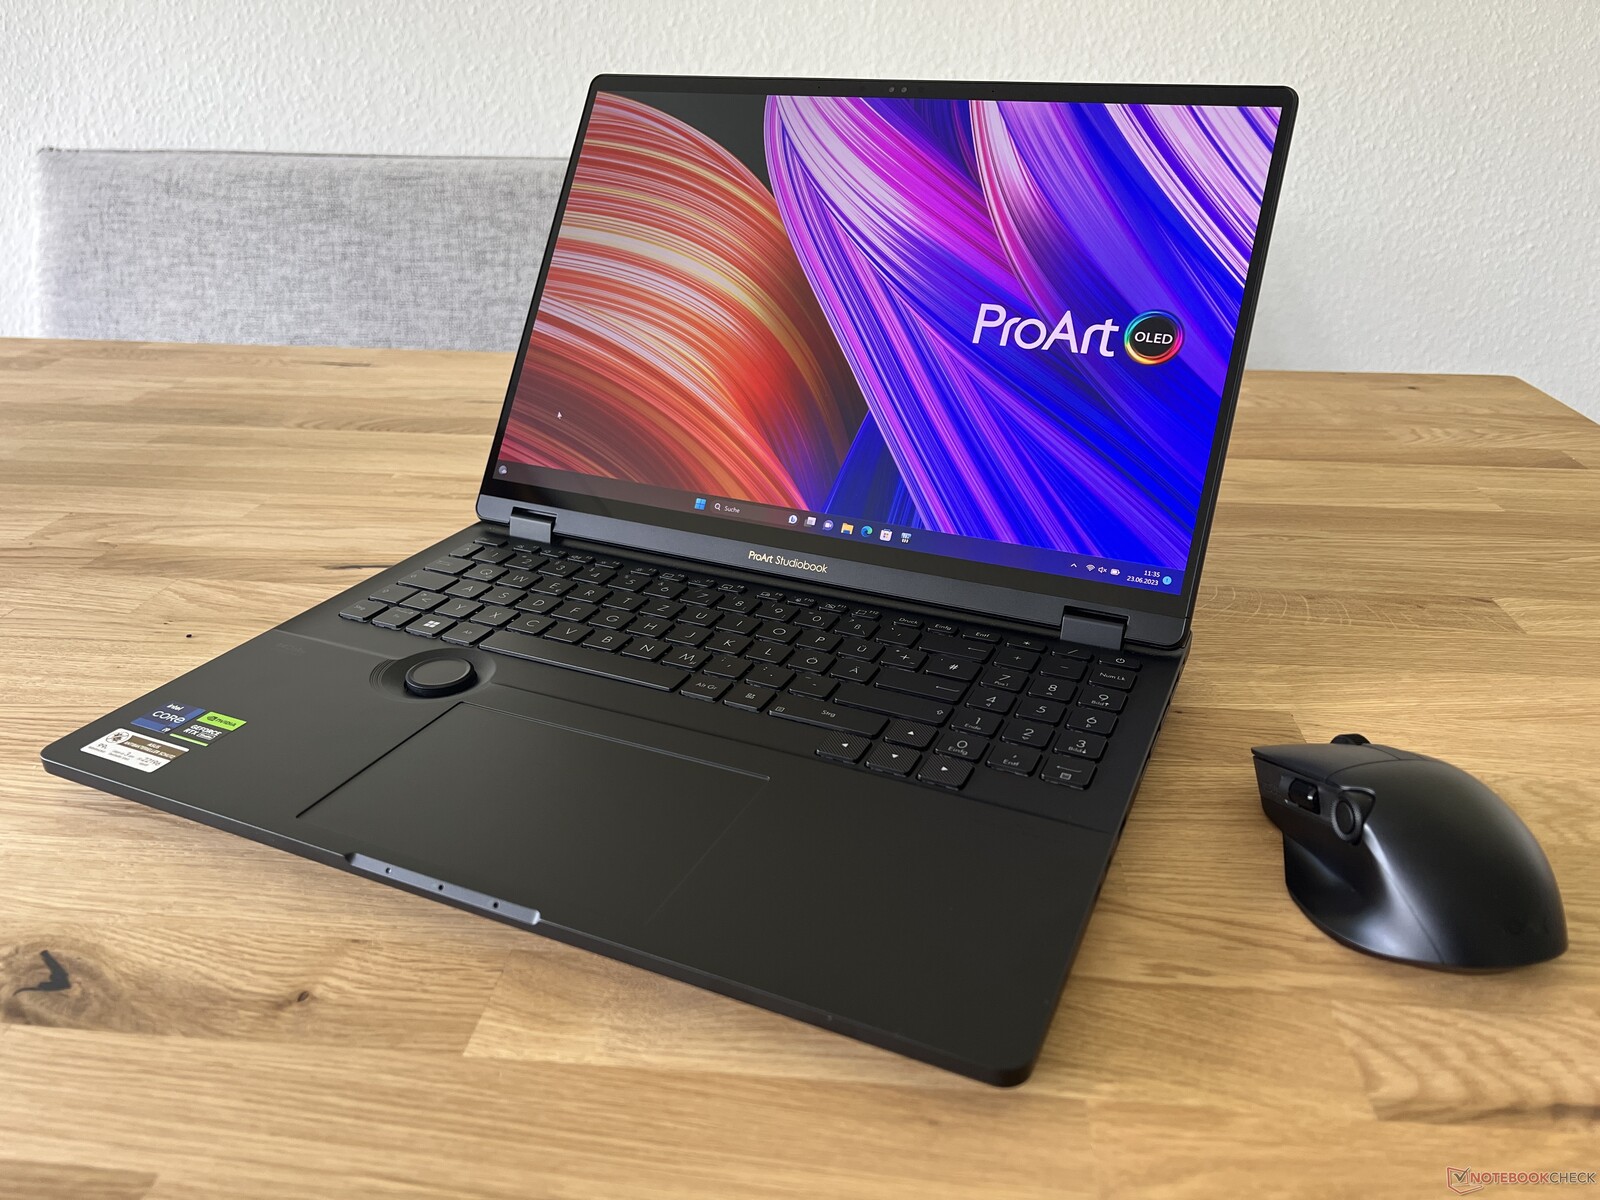
Asus ProArt Studiobook 16 OLED recension: Multimedia-bärbar dator med extrem CPU-prestanda
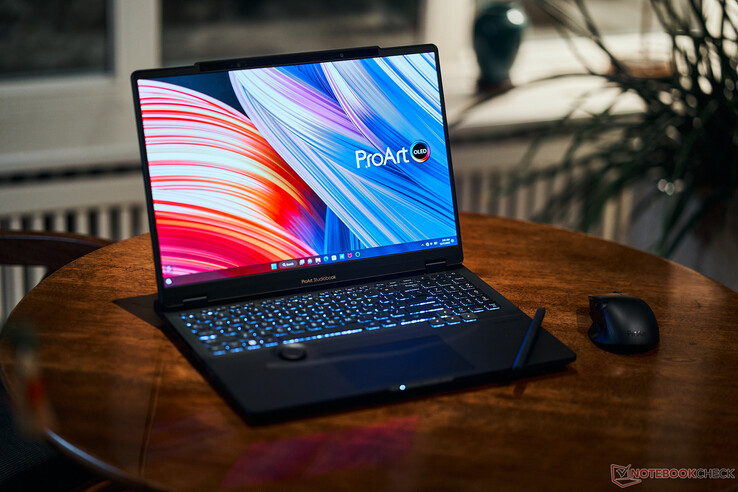
Asus riktar sig främst till kreativa användare med ProArt Studiobook 16 och erbjuder en extra inmatningsfunktion i DialPad. Den nuvarande Studiobook 16 OLED 2023 använder Intels snabbaste mobila processor,Core i9-13980HX, i kombination med den nya GeForce RTX 4070 Laptop.skärmen har också förändrats, eftersom 4K OLED har bytts ut mot en 3K pekskärmsmodell med 120 Hz. Vår testenhet är high-end-modellen med 64 GB RAM och en 4 TB PCIe SSD för 3999 EUR (4380 USD). Alternativt finns det också en variant med RTX 4070 Laptop, 32 GB RAM och en 2 TB SSD för 3499 EUR (3800 USD) eller en RTX 4060 bärbar datormed 32 GB RAM och en 1 TB SSD för 2 999 EUR (3300 USD).
Potentiella konkurrenter i jämförelse
Gradering | Datum | Modell | Vikt | Höjd | Storlek | Upplösning | Pris |
|---|---|---|---|---|---|---|---|
| 86.1 % v7 (old) | 06/2023 | Asus ProArt Studiobook 16 OLED H7604 i9-13980HX, GeForce RTX 4070 Laptop GPU | 2.4 kg | 23.9 mm | 16.00" | 3200x2000 | |
| 86.2 % v7 (old) | 03/2023 | Gigabyte AERO 16 OLED BSF i9-13900H, GeForce RTX 4070 Laptop GPU | 2.1 kg | 18 mm | 16.00" | 3840x2400 | |
| 89.4 % v7 (old) | 04/2023 | Samsung Galaxy Book3 Ultra 16 i7-13700H, GeForce RTX 4050 Laptop GPU | 1.8 kg | 16.5 mm | 16.00" | 2880x1800 | |
| 89.2 % v7 (old) | 04/2023 | MSI Stealth 17 Studio A13VH-014 i9-13900H, GeForce RTX 4080 Laptop GPU | 3 kg | 21.3 mm | 17.30" | 3840x2160 | |
| 93.7 % v7 (old) | 03/2023 | Apple MacBook Pro 16 2023 M2 Max M2 Max, M2 Max 38-Core GPU | 2.2 kg | 16.8 mm | 16.20" | 3456x2234 | |
| 88 % v7 (old) | 04/2023 | Asus Zephyrus Duo 16 GX650PY-NM006W R9 7945HX, GeForce RTX 4090 Laptop GPU | 2.7 kg | 29.7 mm | 16.00" | 2560x1600 |
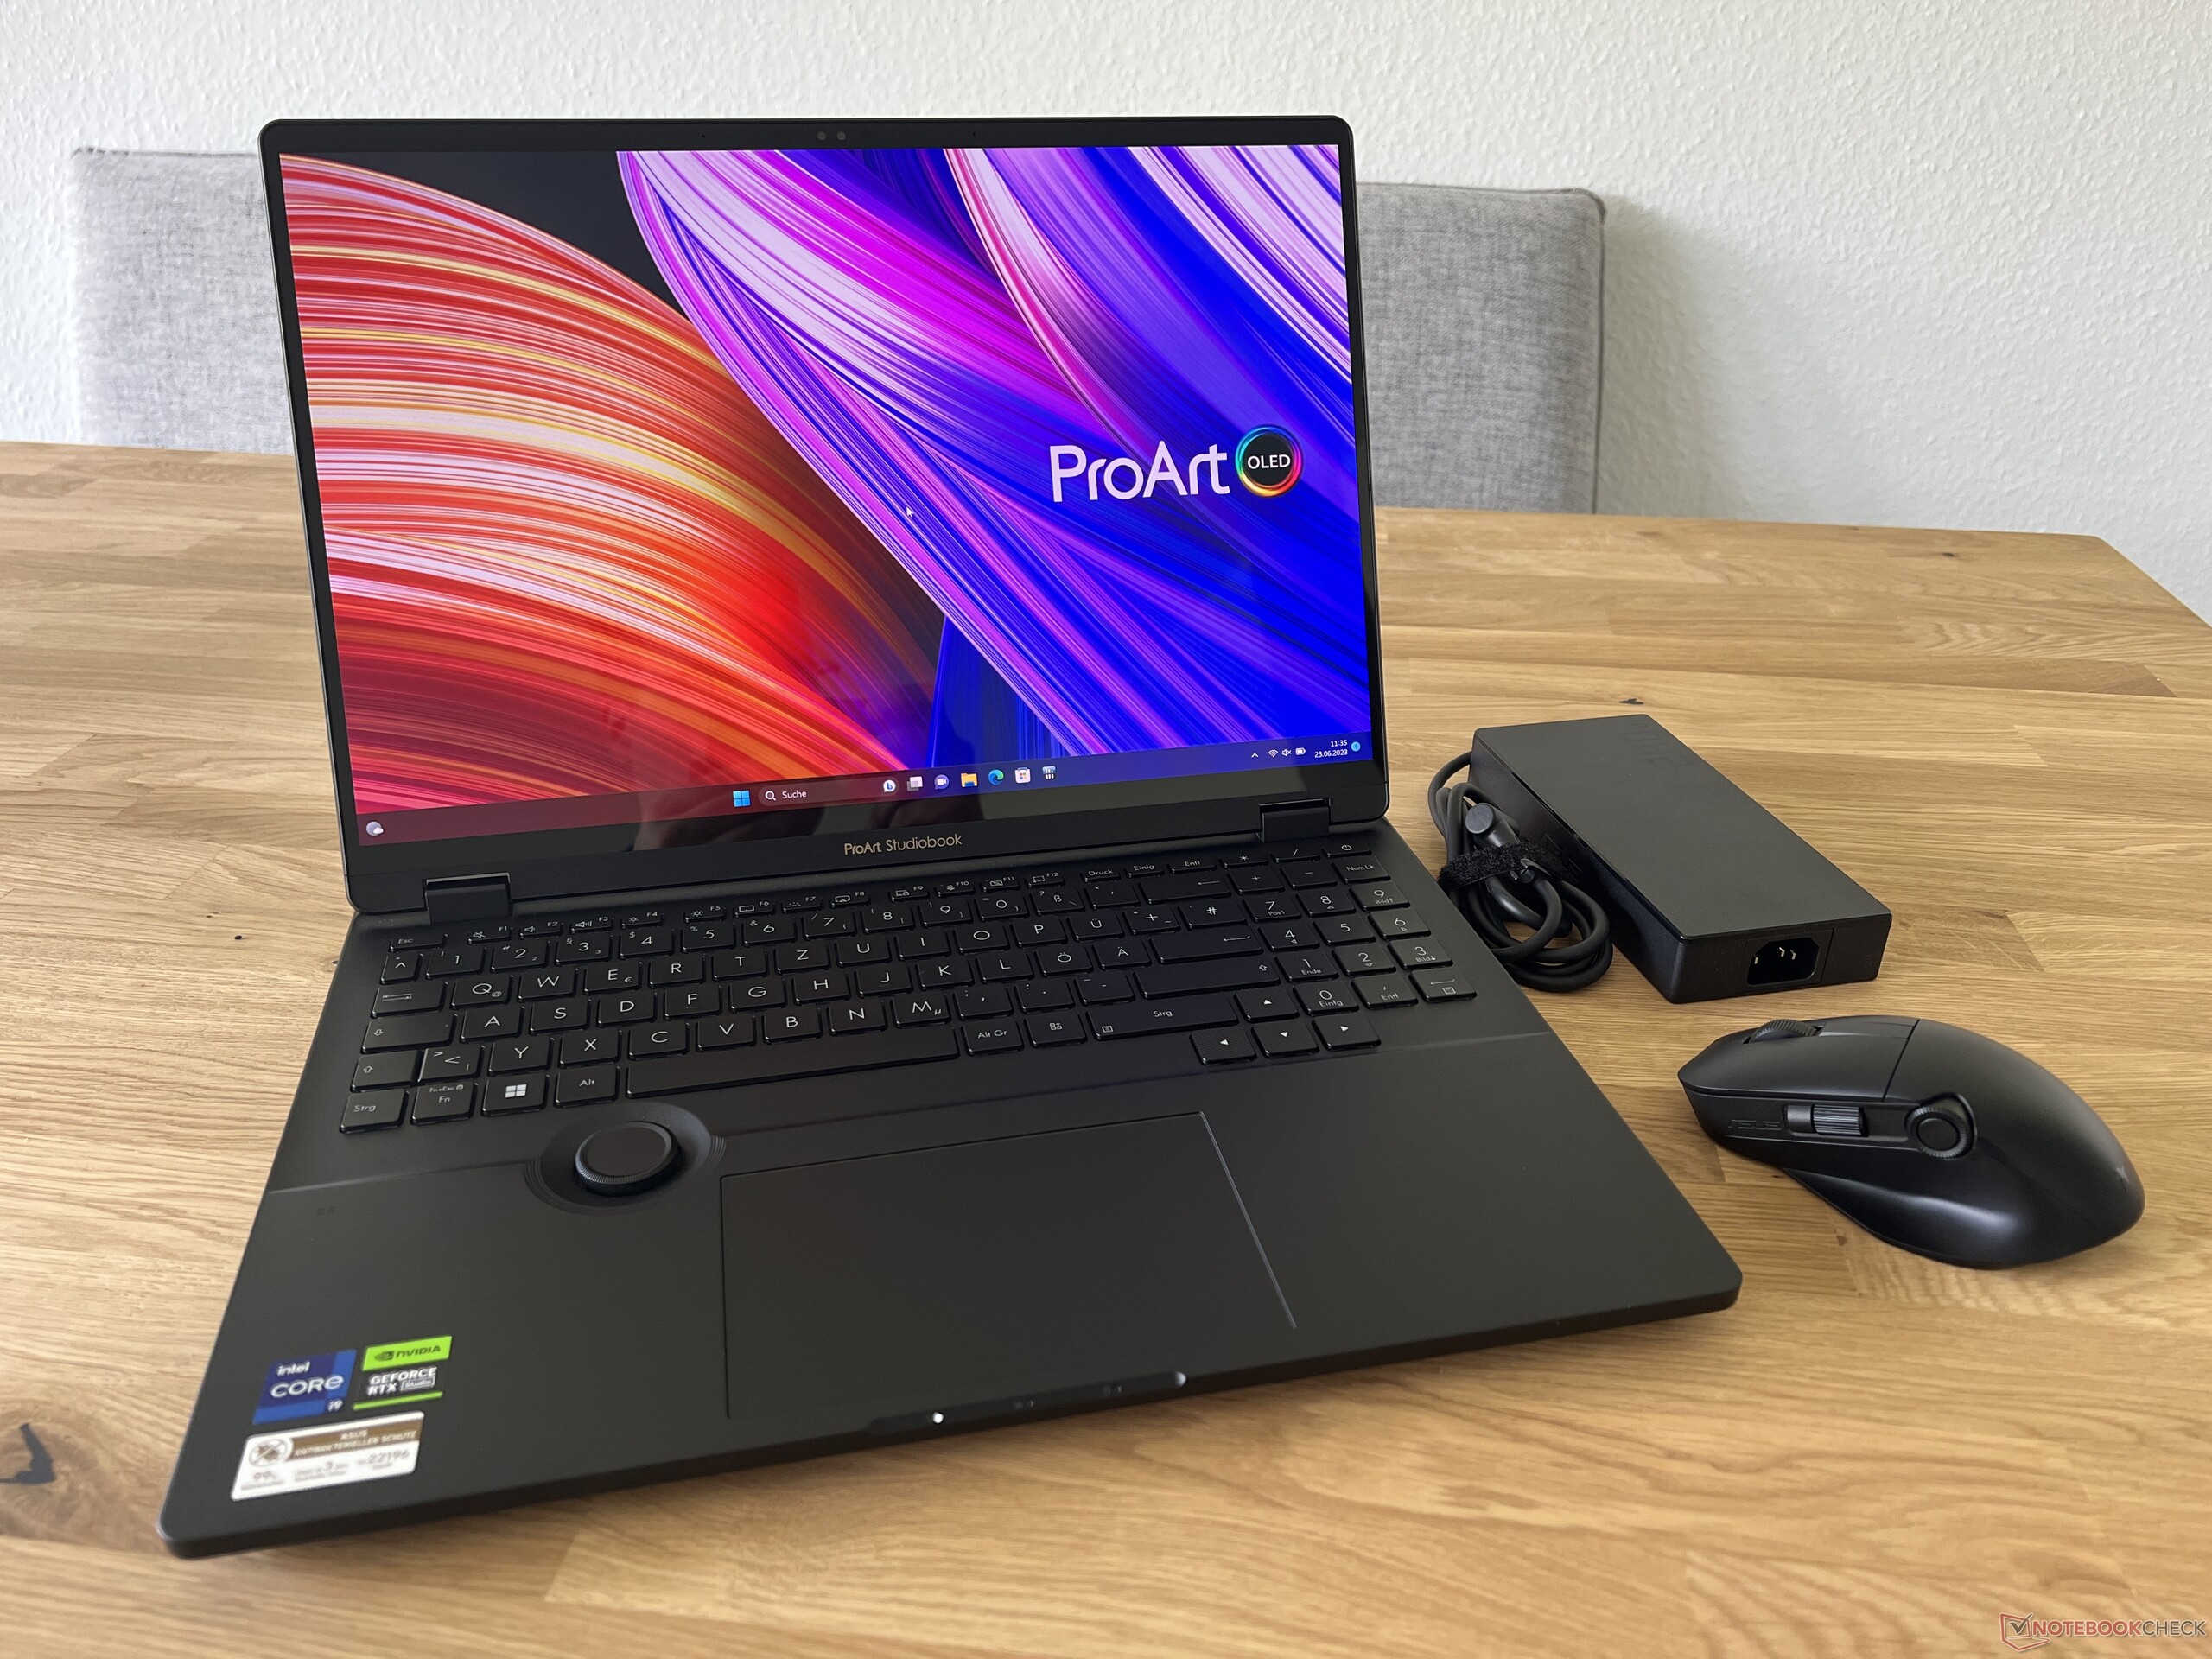
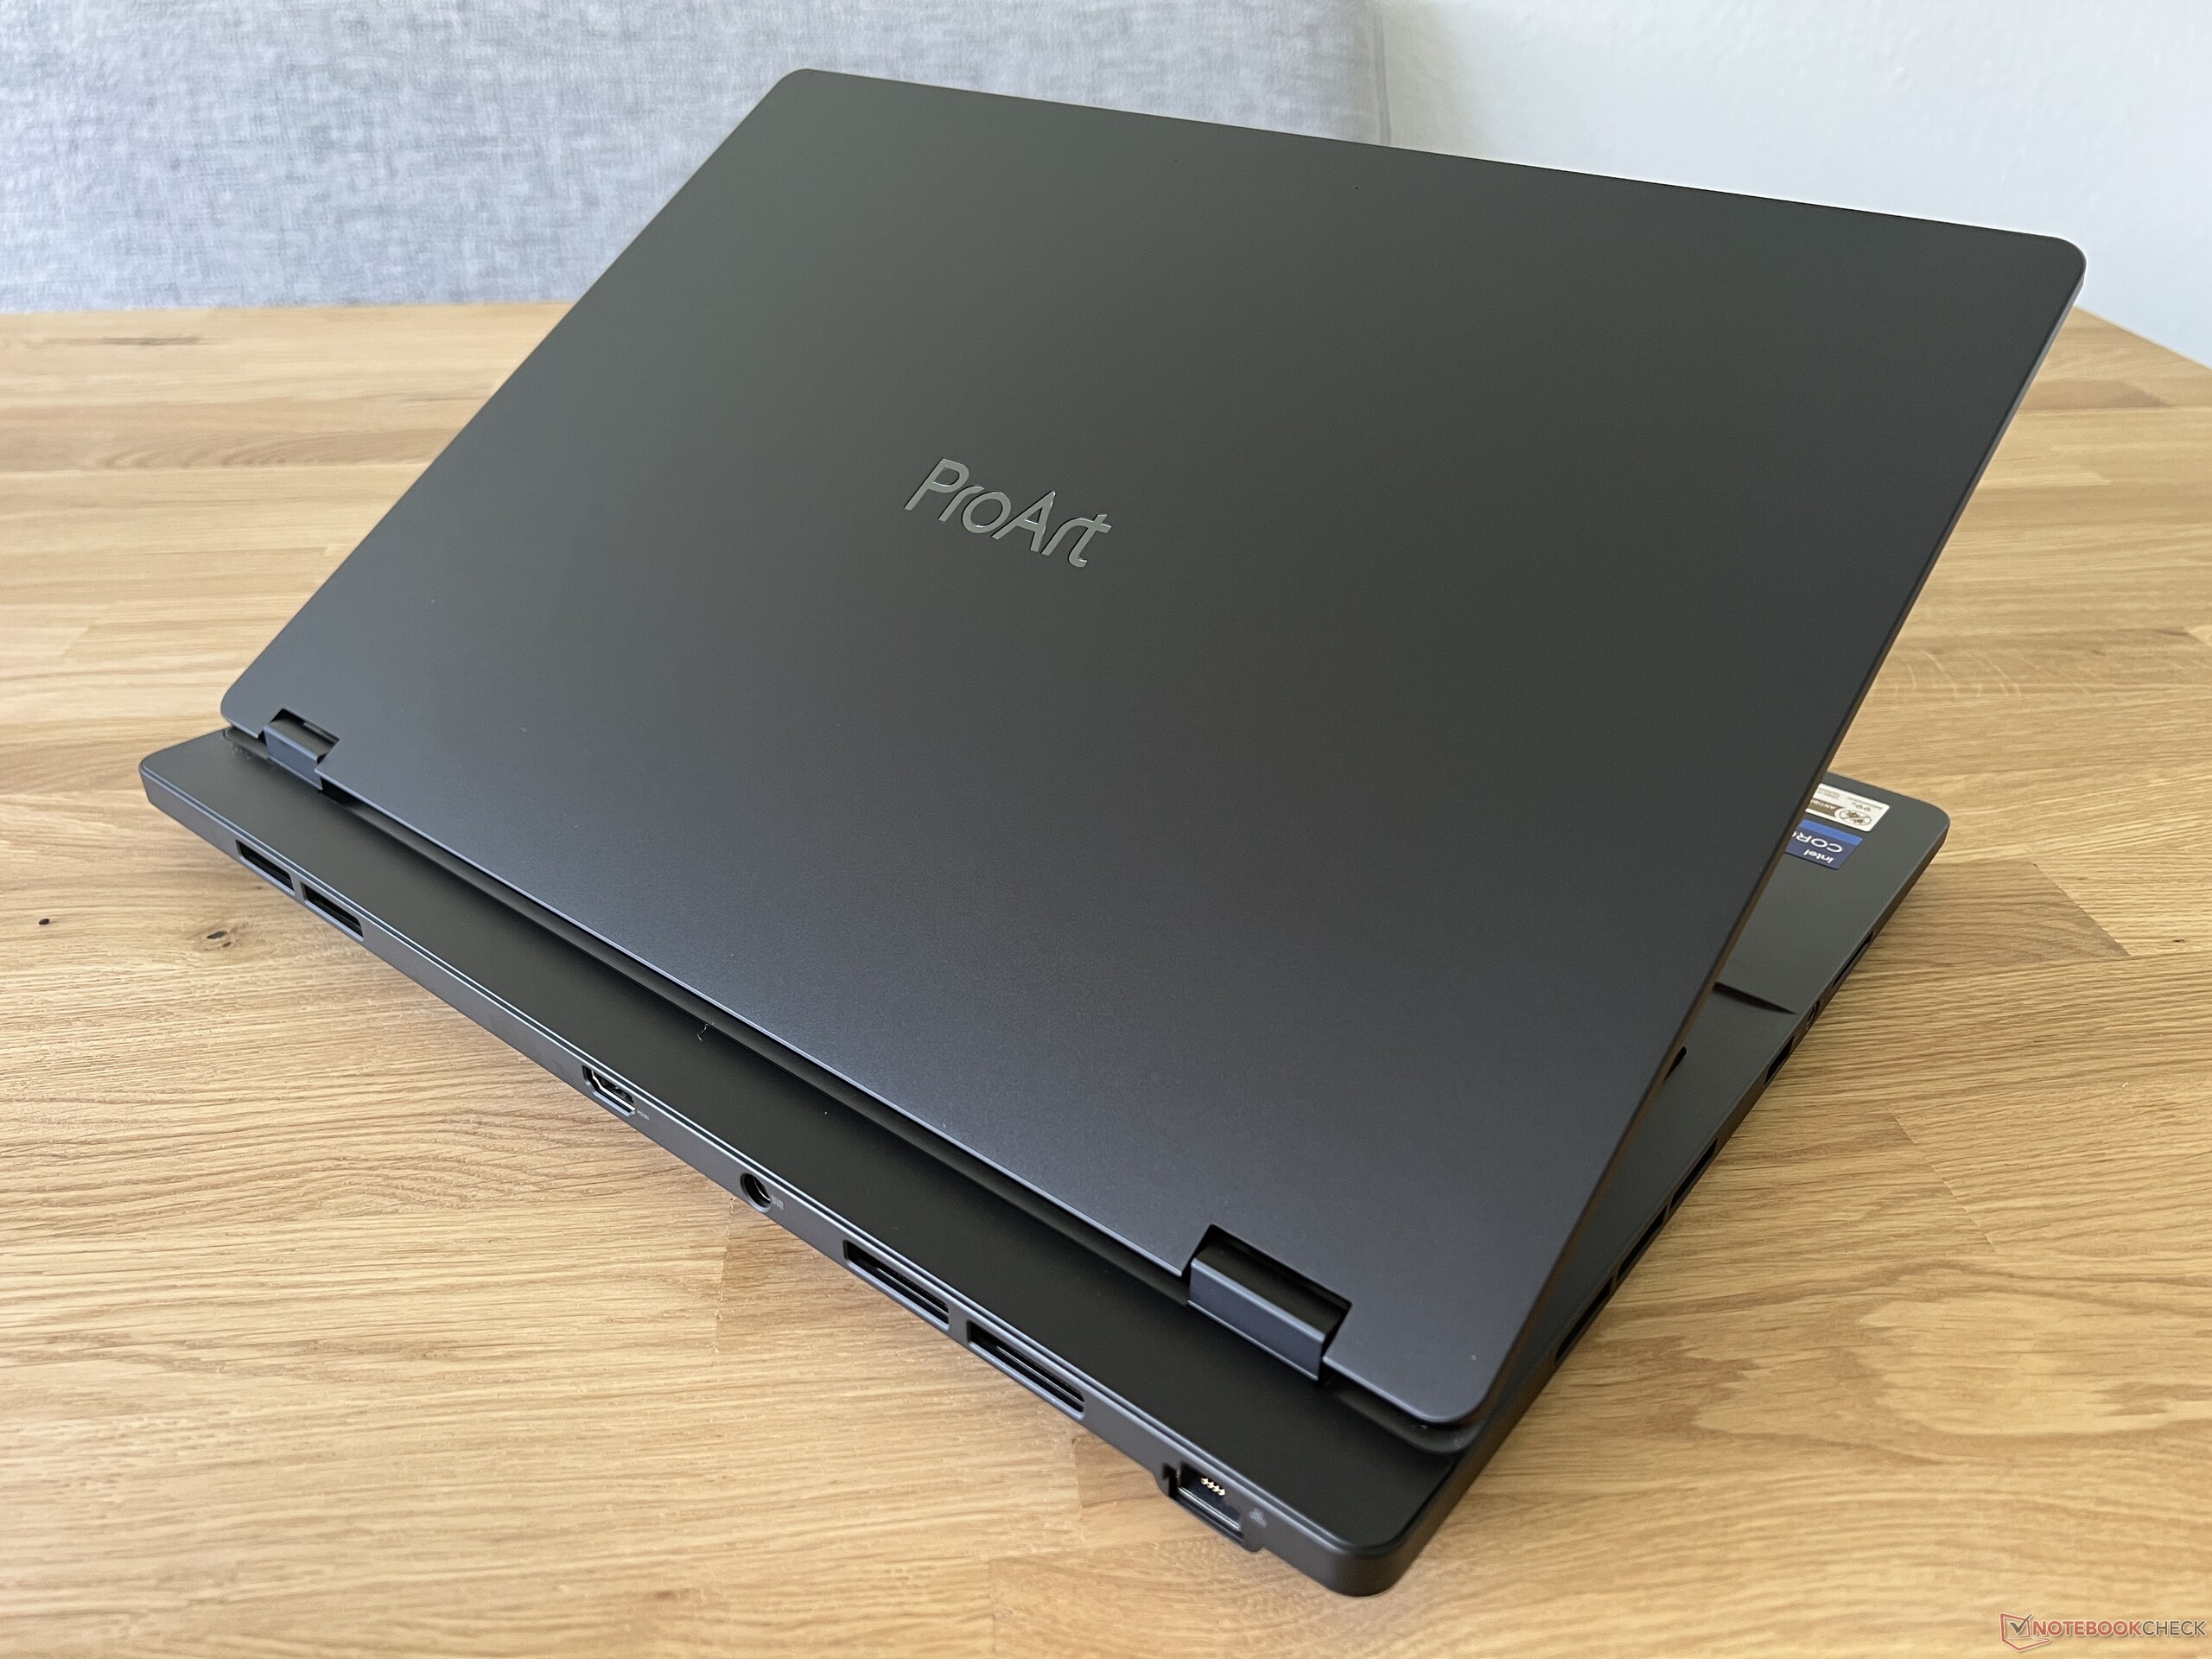
Case - ProArt är återhållsam
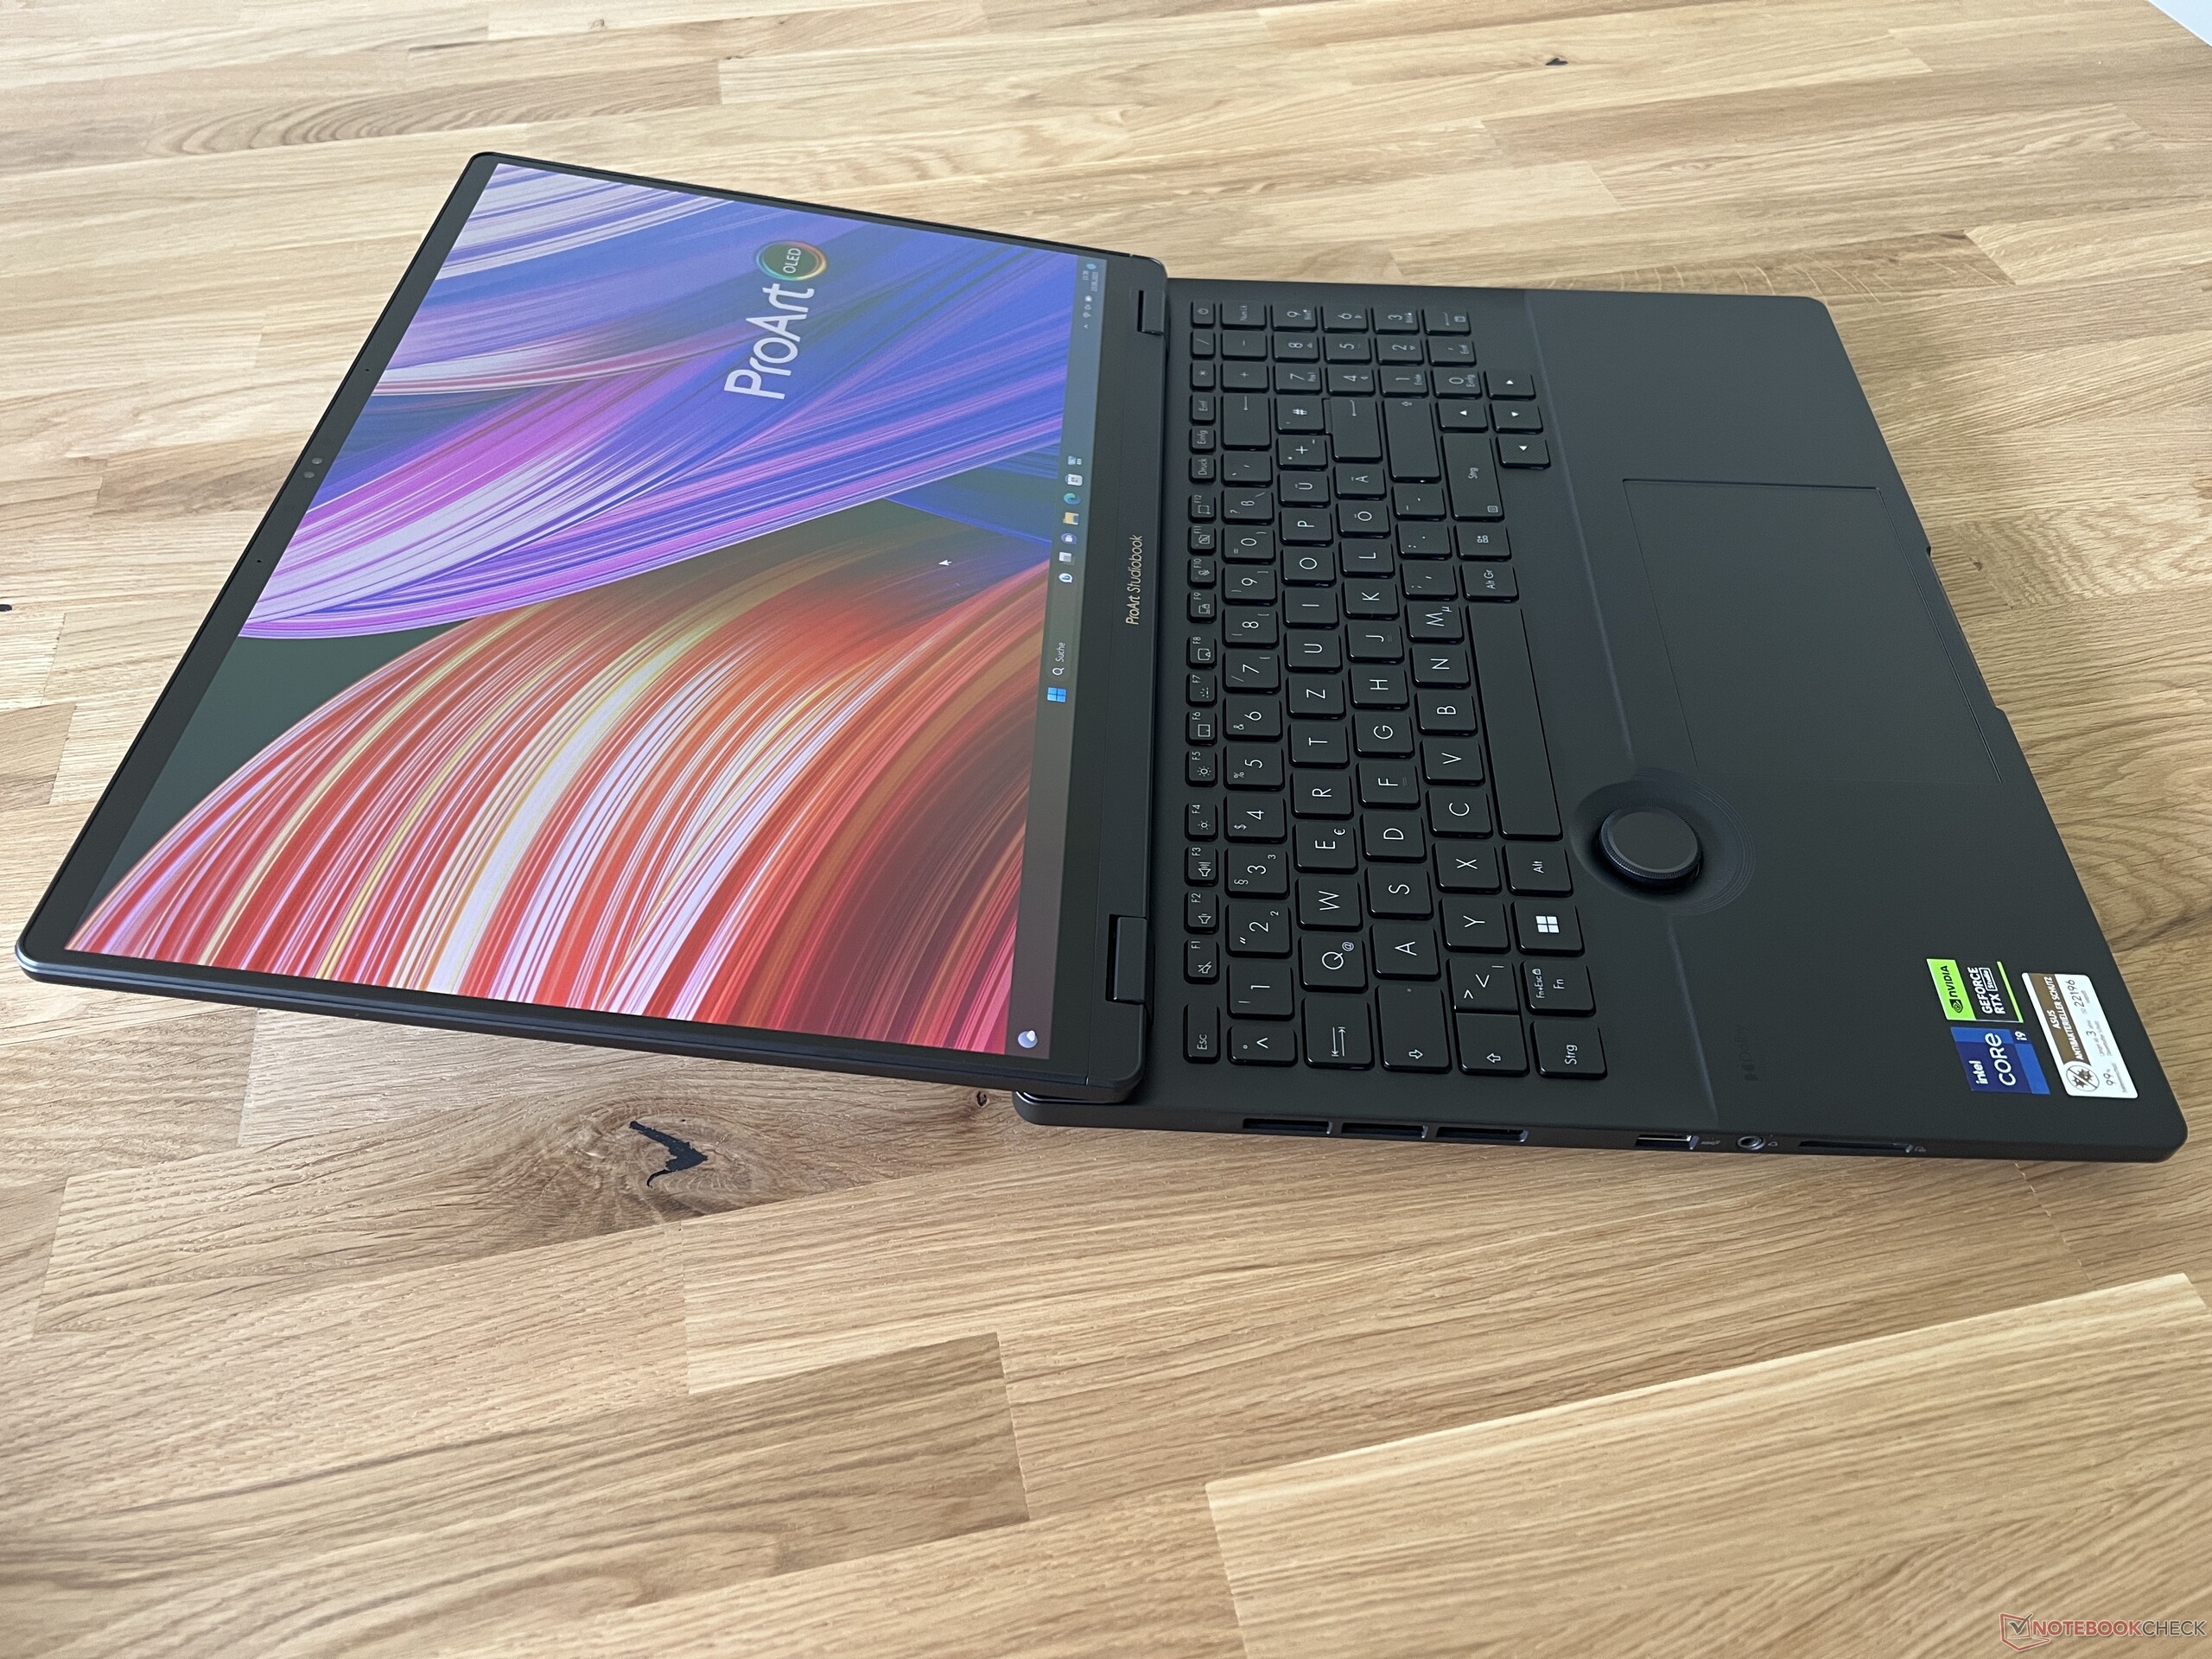
Asus använder svart plast för ProArt Studiobook 16, vilket känns ganska högkvalitativt. Det enda problemet är de släta ytorna, som är mycket mottagliga för fingeravtryck. Överlag är designen mycket återhållsam och bortsett från ProArt-logotypen på locket finns det inga andra visuella accenter. Så snart du öppnar locket fångar den stora DialPad under tangentbordet omedelbart ditt öga. Locket sitter något framför basenheten, men detta möjliggör också en maximal öppningsvinkel på nästan 180 grader
Stabiliteten är utmärkt, både för basenheten och locket. Inga knarrande ljud hörs vid vridbelastning och inget kan heller bucklas till. Gångjärnen är väljusterade: de förhindrar effektivt att enheten kränger och håller skärmen säkert på plats. Endast vid mycket små vinklar (mindre än 20 grader) stängs locket av sig självt på grund av vikten.
Med en vikt på knappt 2,5 kg är Studiobook inte lätt och på grund av sin storlek inte heller särskilt portabel. Notebooken ryms fortfarande i stora ryggsäckar, men tar naturligtvis mycket plats som en 16-tummare. Den är också den största 16-tummaren i jämförelsegruppen och inte heller mycket mindre än 17-tummare. Den bärbara datorn är också ganska tjock på cirka 2,5 cm och överträffas bara avZephyrus Duomed sin andra skärm. För 240-watts strömförsörjningen måste du räkna med ytterligare 740 gram för transport.
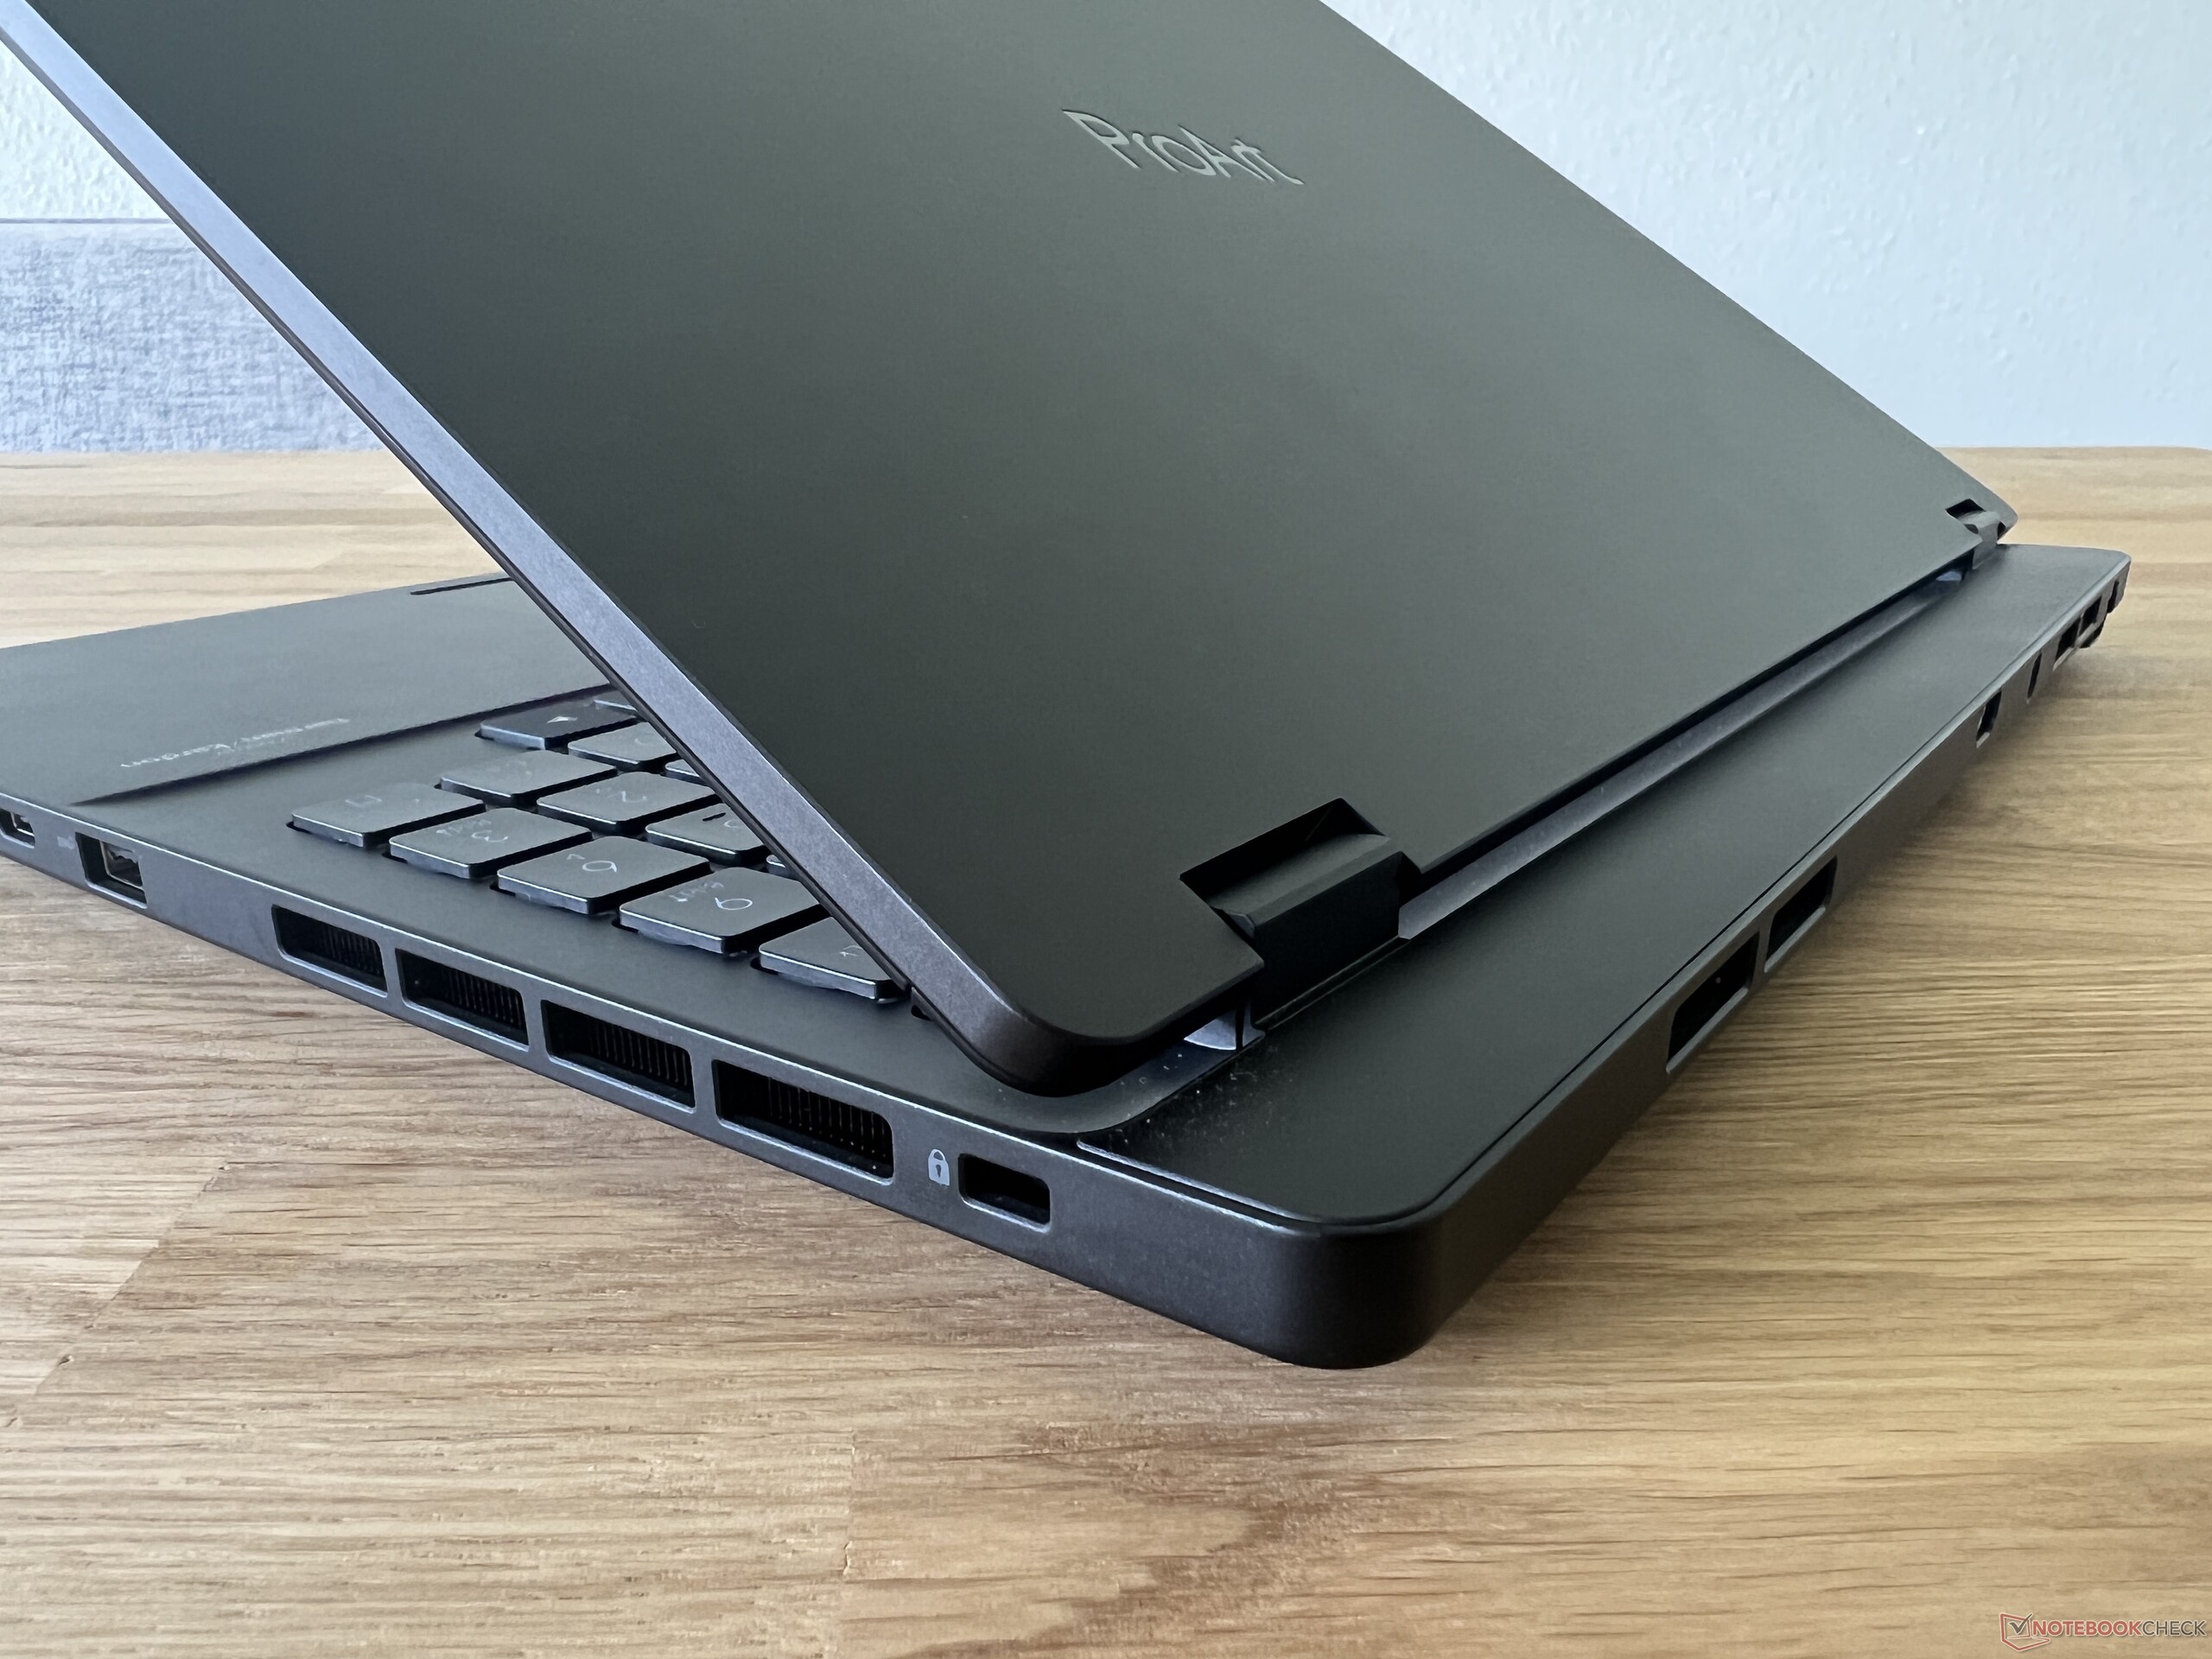
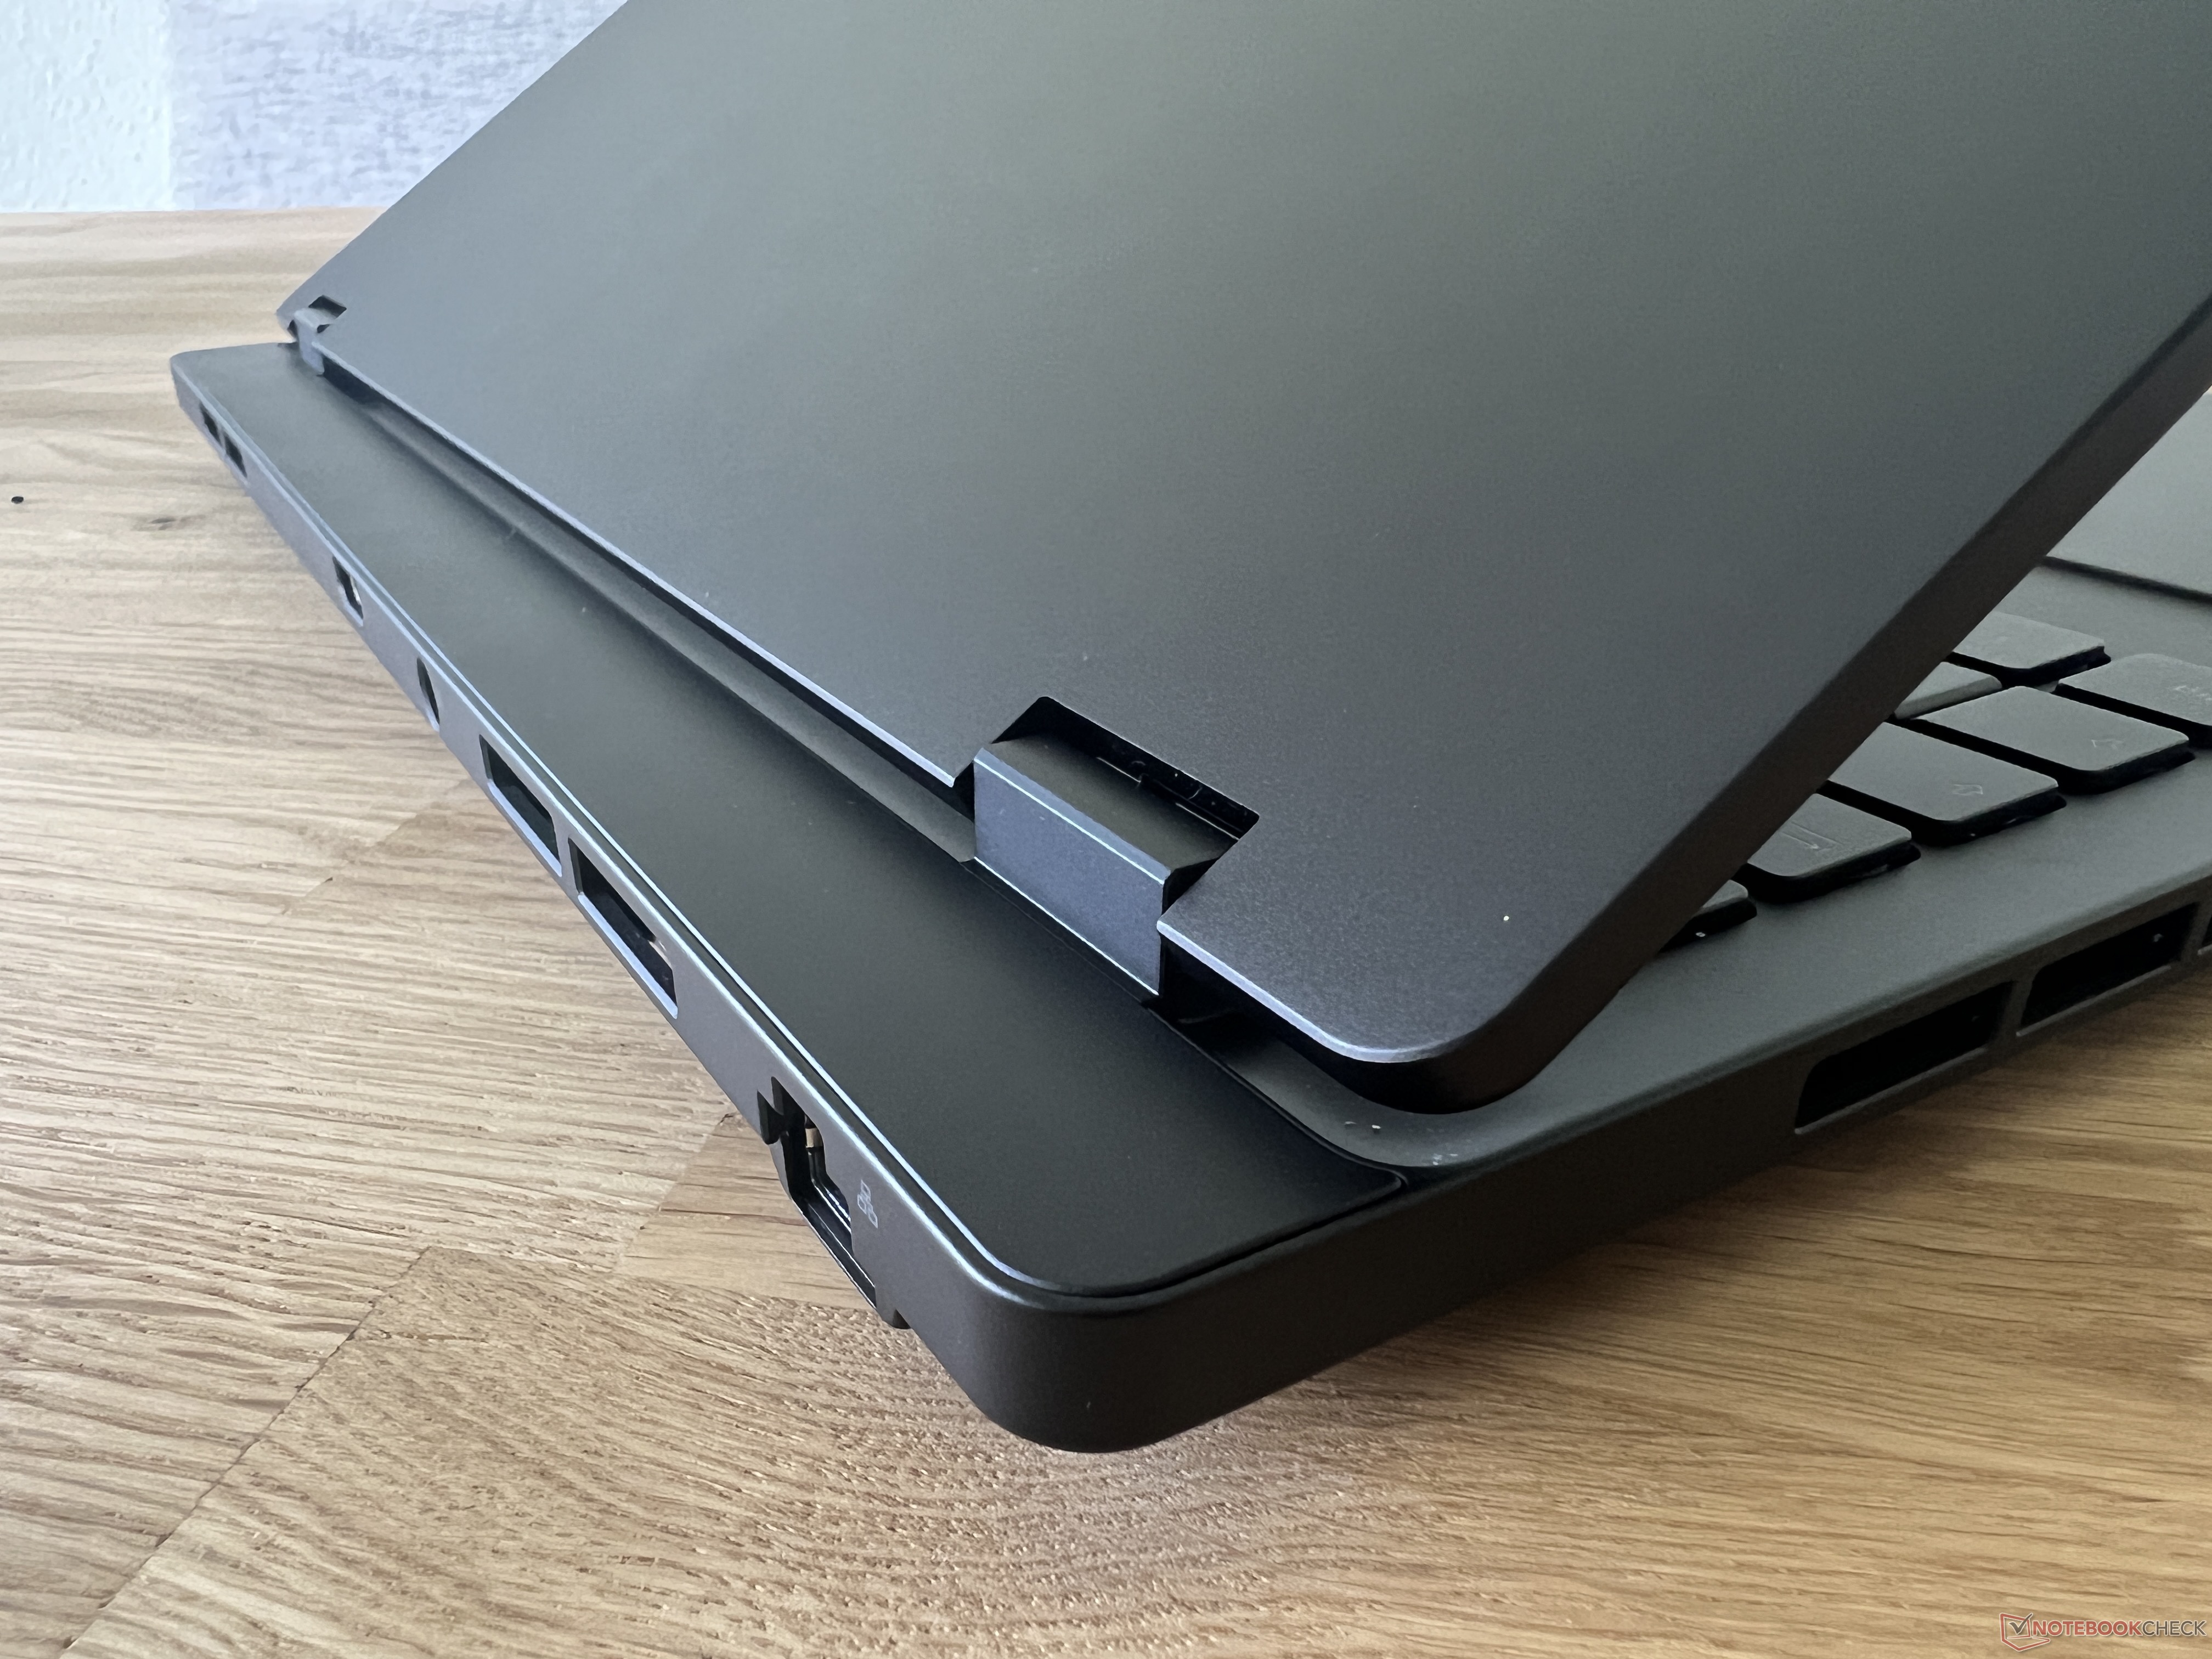
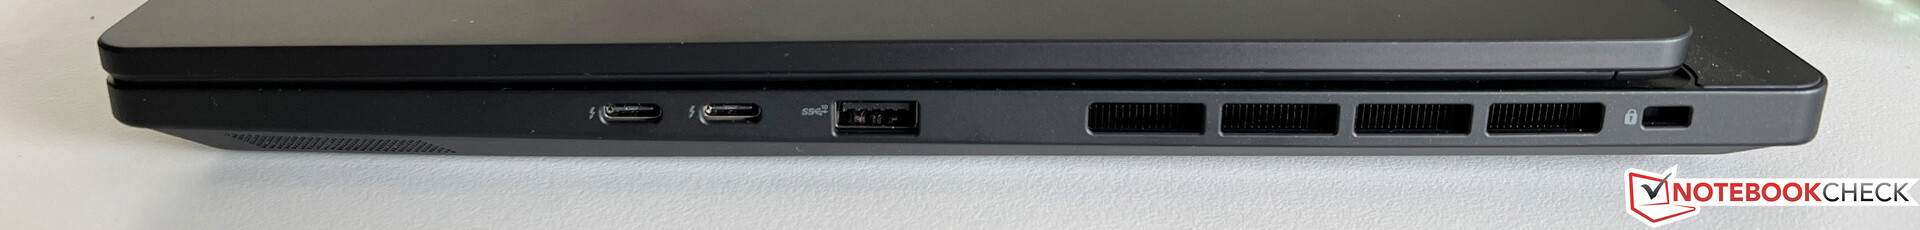
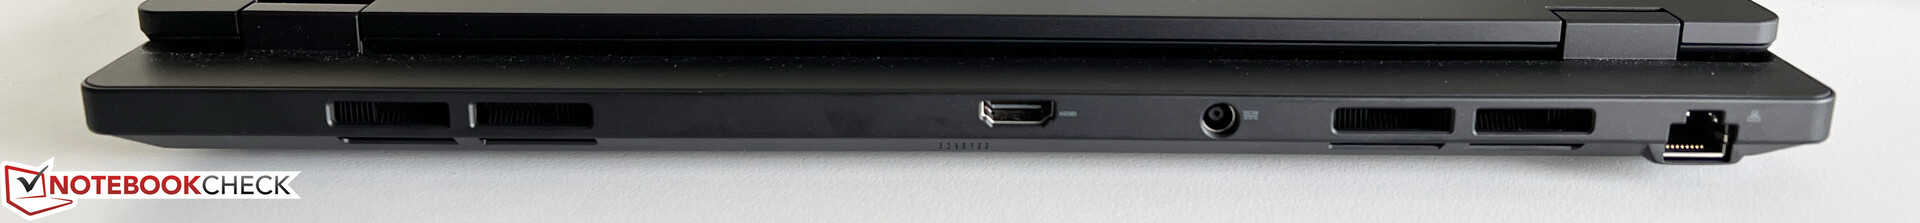
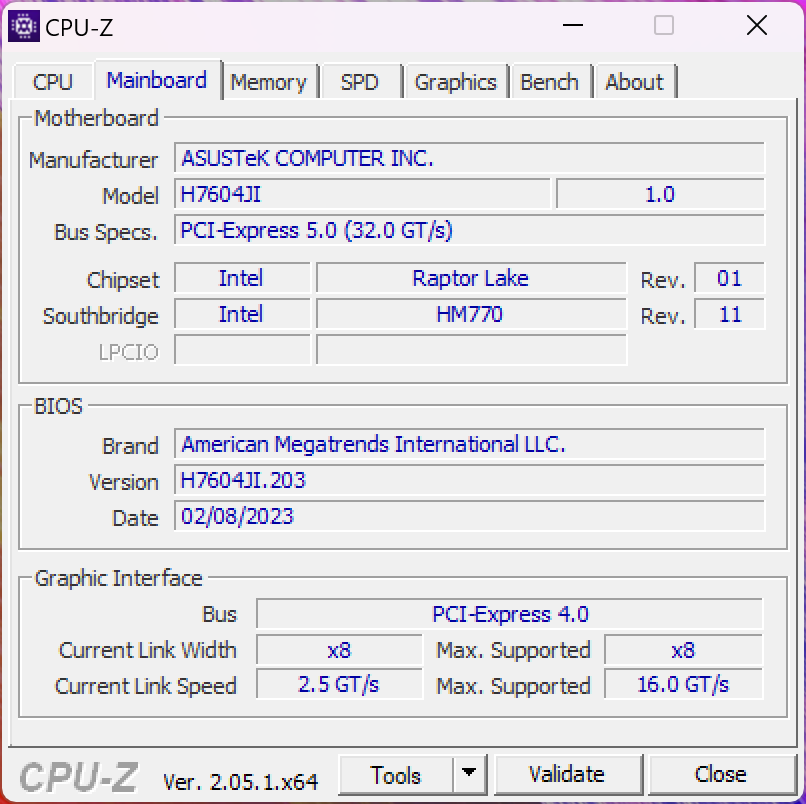
Utrustning - Thunderbolt 4 och HDMI 2.1
Portarna är fördelade över de främre områdena på båda sidorna och baksidan. De flesta USB-portarna finns på framsidan till höger, vilket kan bli trångt när de är fullt upptagna. Å andra sidan har Asus placerat strömuttaget, Ethernet-porten och HDMI-utgången på baksidan, där de inte är i vägen.
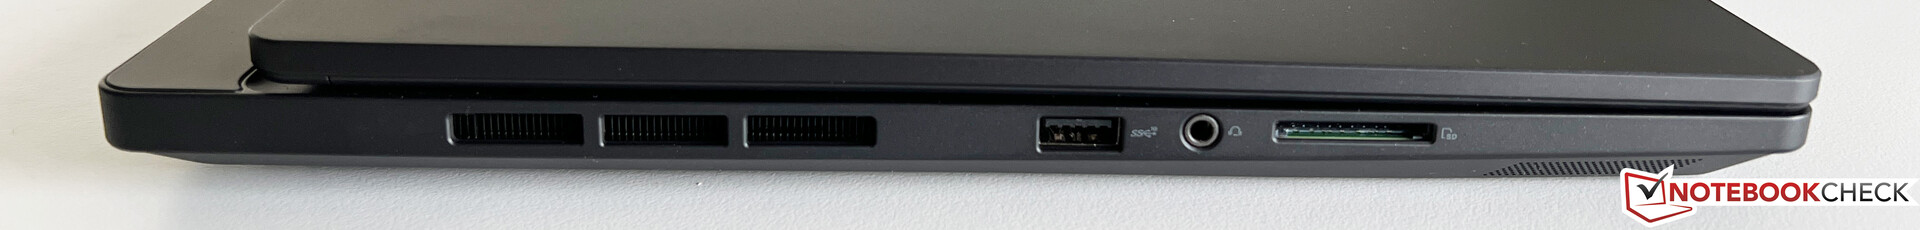
SD-kortläsare
På vänster sida finns den fullfjädrade SD-kortläsaren, som bara uppnår genomsnittliga överföringshastigheter via vårt referenskort (Angelbird AV Pro V60). Mycket mer är möjligt här, som tävlingen visar.
| SD Card Reader | |
| average JPG Copy Test (av. of 3 runs) | |
| Apple MacBook Pro 16 2023 M2 Max (Angelbird AV Pro V60) | |
| Asus Zephyrus Duo 16 GX650PY-NM006W (Angelbird AV Pro V60) | |
| Gigabyte AERO 16 OLED BSF | |
| Genomsnitt av klass Multimedia (23 - 531, n=37, senaste 2 åren) | |
| Samsung Galaxy Book3 Ultra 16 (AV PRO microSD 128 GB V60) | |
| Asus ProArt Studiobook 16 OLED H7604 (Angelibird AV Pro V60) | |
| MSI Stealth 17 Studio A13VH-014 | |
| maximum AS SSD Seq Read Test (1GB) | |
| Asus Zephyrus Duo 16 GX650PY-NM006W (Angelbird AV Pro V60) | |
| Apple MacBook Pro 16 2023 M2 Max (Angelbird AV Pro V60) | |
| Genomsnitt av klass Multimedia (37.3 - 1455, n=36, senaste 2 åren) | |
| Gigabyte AERO 16 OLED BSF | |
| Asus ProArt Studiobook 16 OLED H7604 (Angelibird AV Pro V60) | |
| Samsung Galaxy Book3 Ultra 16 (AV PRO microSD 128 GB V60) | |
| MSI Stealth 17 Studio A13VH-014 | |
Kommunikation
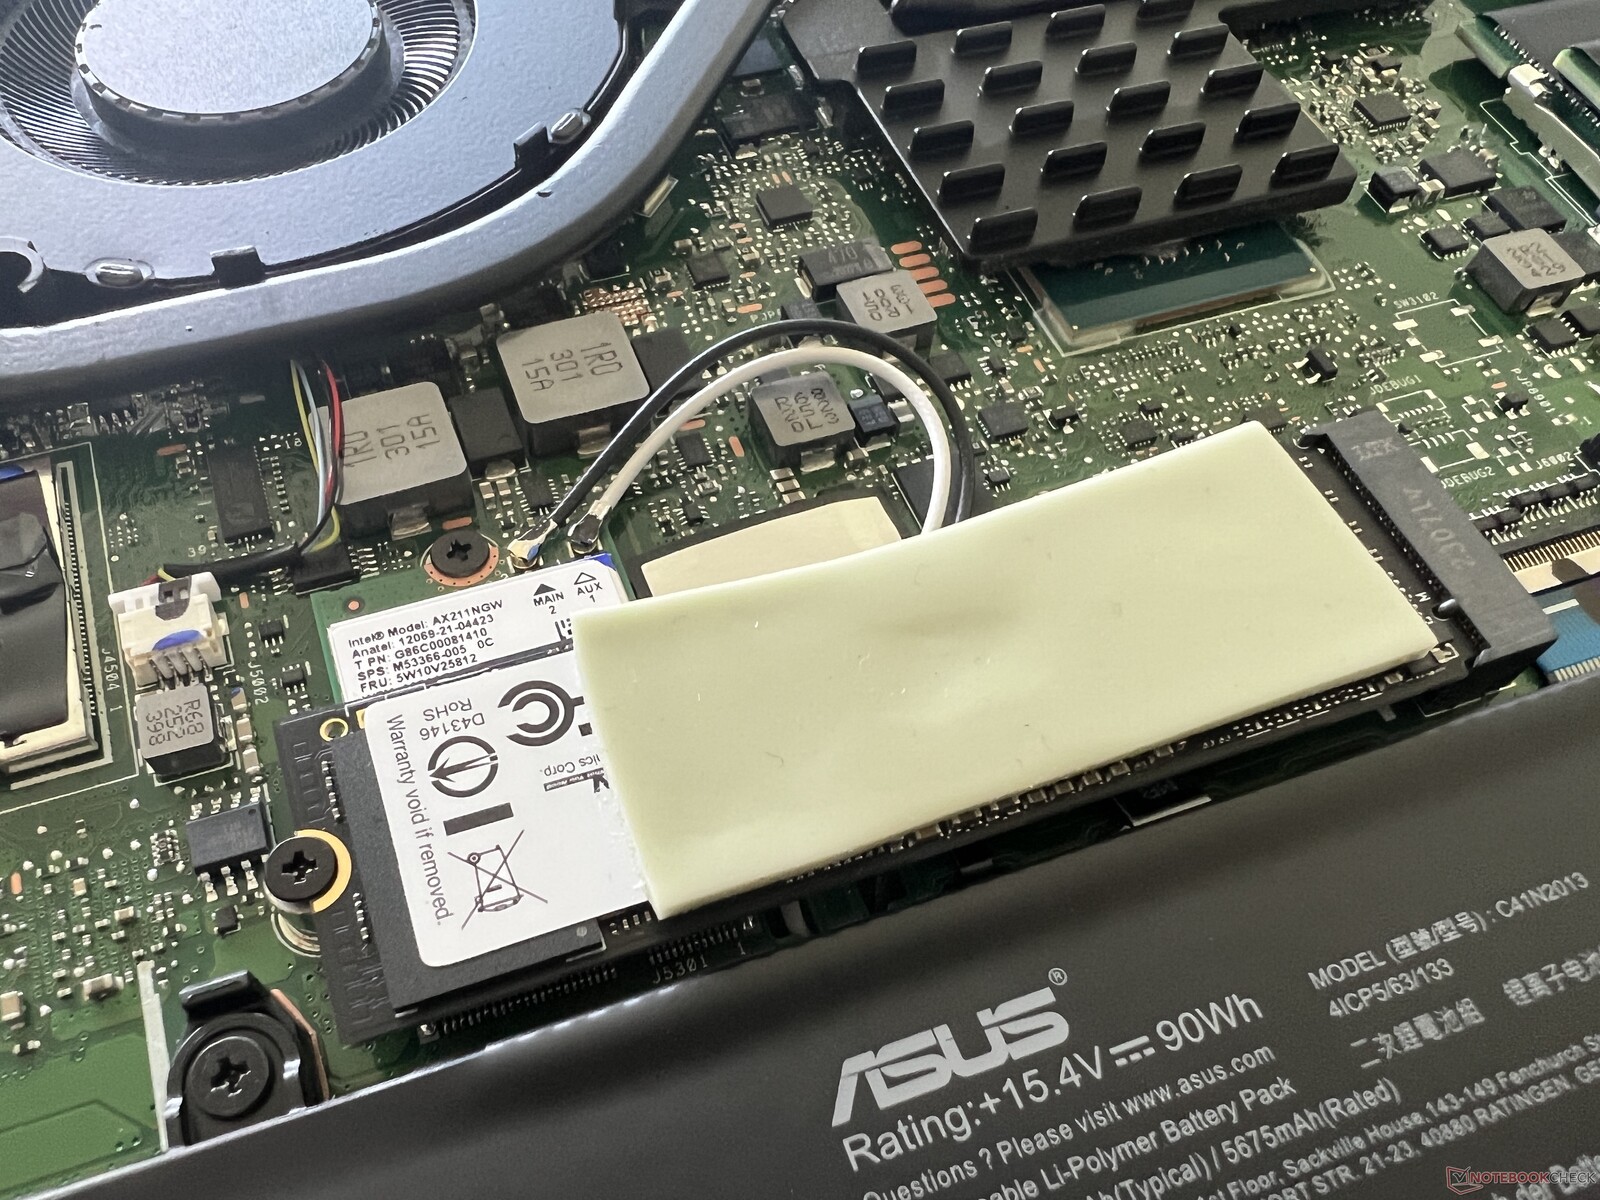
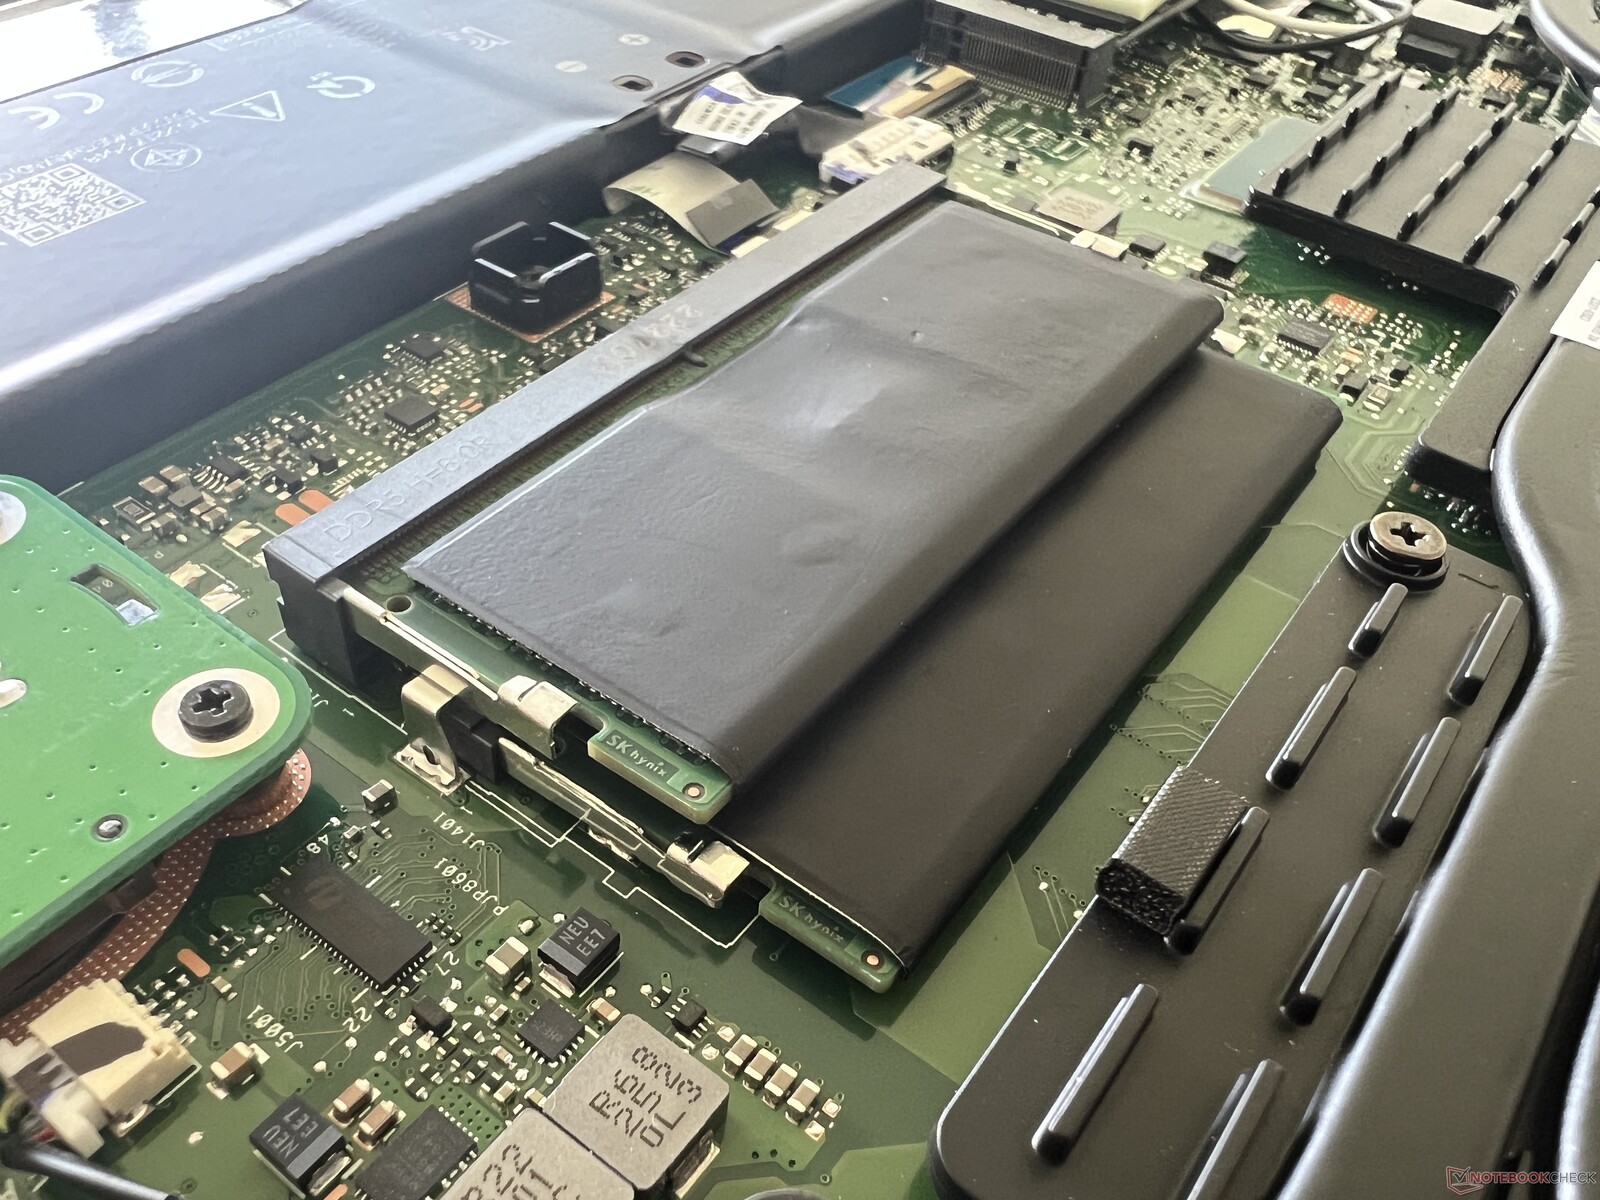
Asus installerar Intels moderna AX211 WLAN-modul, som är placerad under den primära SSD-enheten och kan bytas ut. I tandem med vår referensrouter från Asus är överföringshastigheterna mycket höga och stabila. Vi upplevde inga problem med WLAN-stabiliteten under vår granskning. En 2,5 Gbit/s Ethernet-port för trådbundna nätverk finns också på baksidan.
| Networking | |
| Asus ProArt Studiobook 16 OLED H7604 | |
| iperf3 transmit AXE11000 | |
| iperf3 receive AXE11000 | |
| Gigabyte AERO 16 OLED BSF | |
| iperf3 transmit AXE11000 6GHz | |
| iperf3 receive AXE11000 6GHz | |
| Samsung Galaxy Book3 Ultra 16 | |
| iperf3 transmit AXE11000 | |
| iperf3 receive AXE11000 | |
| MSI Stealth 17 Studio A13VH-014 | |
| iperf3 transmit AXE11000 | |
| iperf3 receive AXE11000 | |
| iperf3 transmit AXE11000 6GHz | |
| iperf3 receive AXE11000 6GHz | |
| Apple MacBook Pro 16 2023 M2 Max | |
| iperf3 transmit AXE11000 6GHz | |
| iperf3 receive AXE11000 6GHz | |
| Asus Zephyrus Duo 16 GX650PY-NM006W | |
| iperf3 transmit AXE11000 6GHz | |
| iperf3 receive AXE11000 6GHz | |
Webbkamera
Webbkameran på 1080p tar hyfsade bilder i bra ljusförhållanden, men de är också något förvrängda. En IR-modul är också installerad, som stöder ansiktsigenkänning via Windows Hello.


Tillbehör
Vår testenhet levererades med Asus Pen 2.0 samt den trådlösa ProArt-musen MD300, som har en RRP på 180 USD. Precis som den bärbara datorn har musen en liten DialPad installerad på sidan. Huruvida du kan använda den på ett meningsfullt sätt beror på vilken programvara du använder. Det är lite irriterande att man måste installera ArmoryCrate för att justera musinställningarna och att man inte kan göra detta i ProArt Creator Hub. Vid testning fungerade musen perfekt och klickningarna var mycket exakta, men också högljudda. De tysta knapparna på Logitech-möss, till exempel, är mycket tystare.
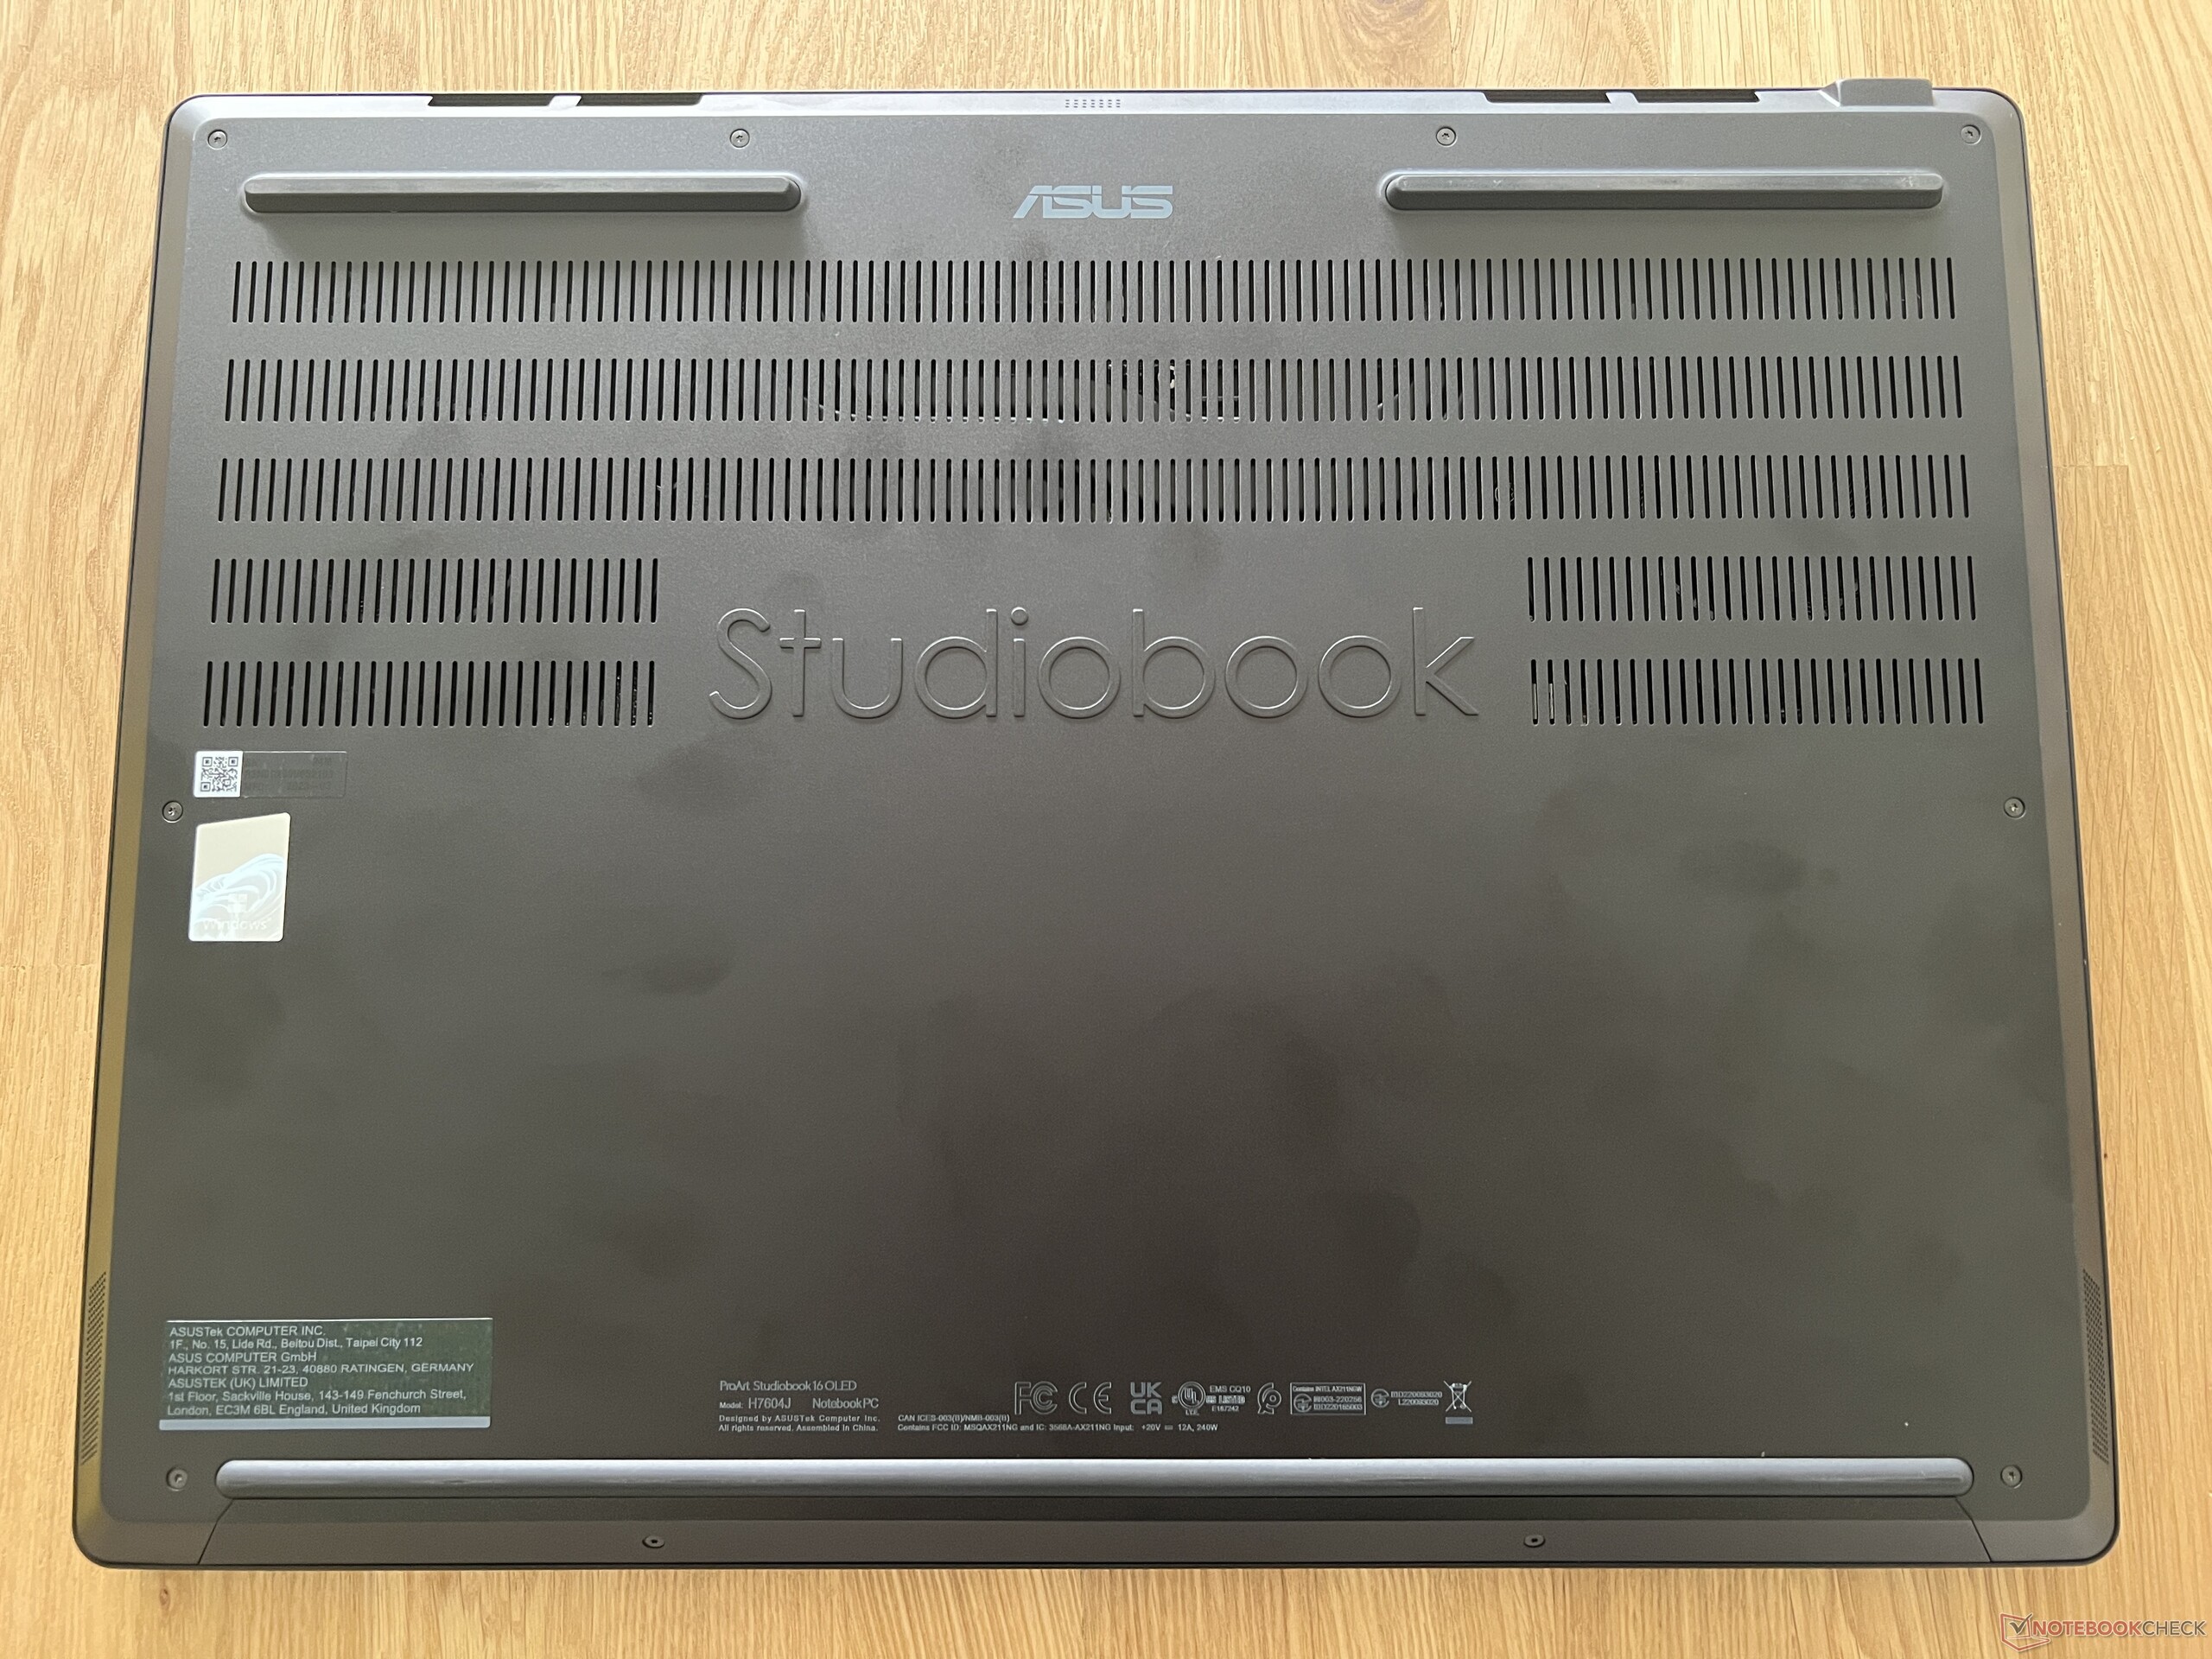
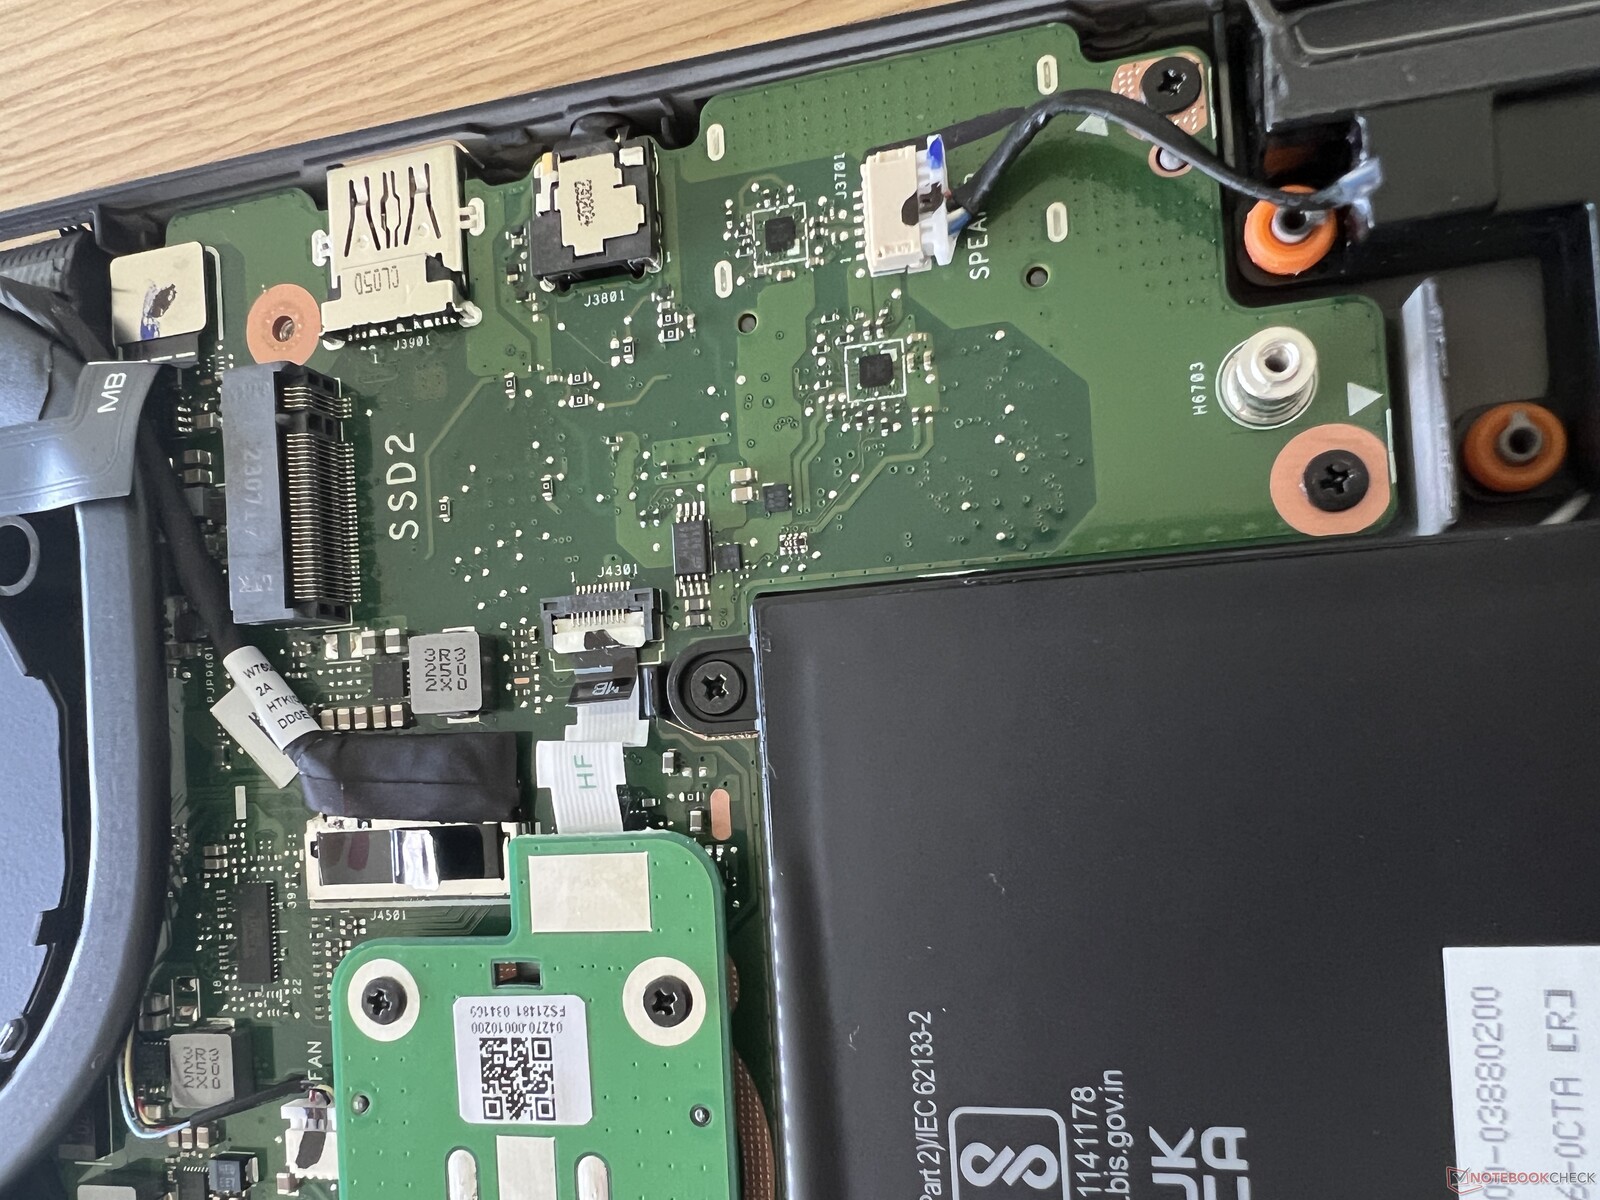
Underhåll
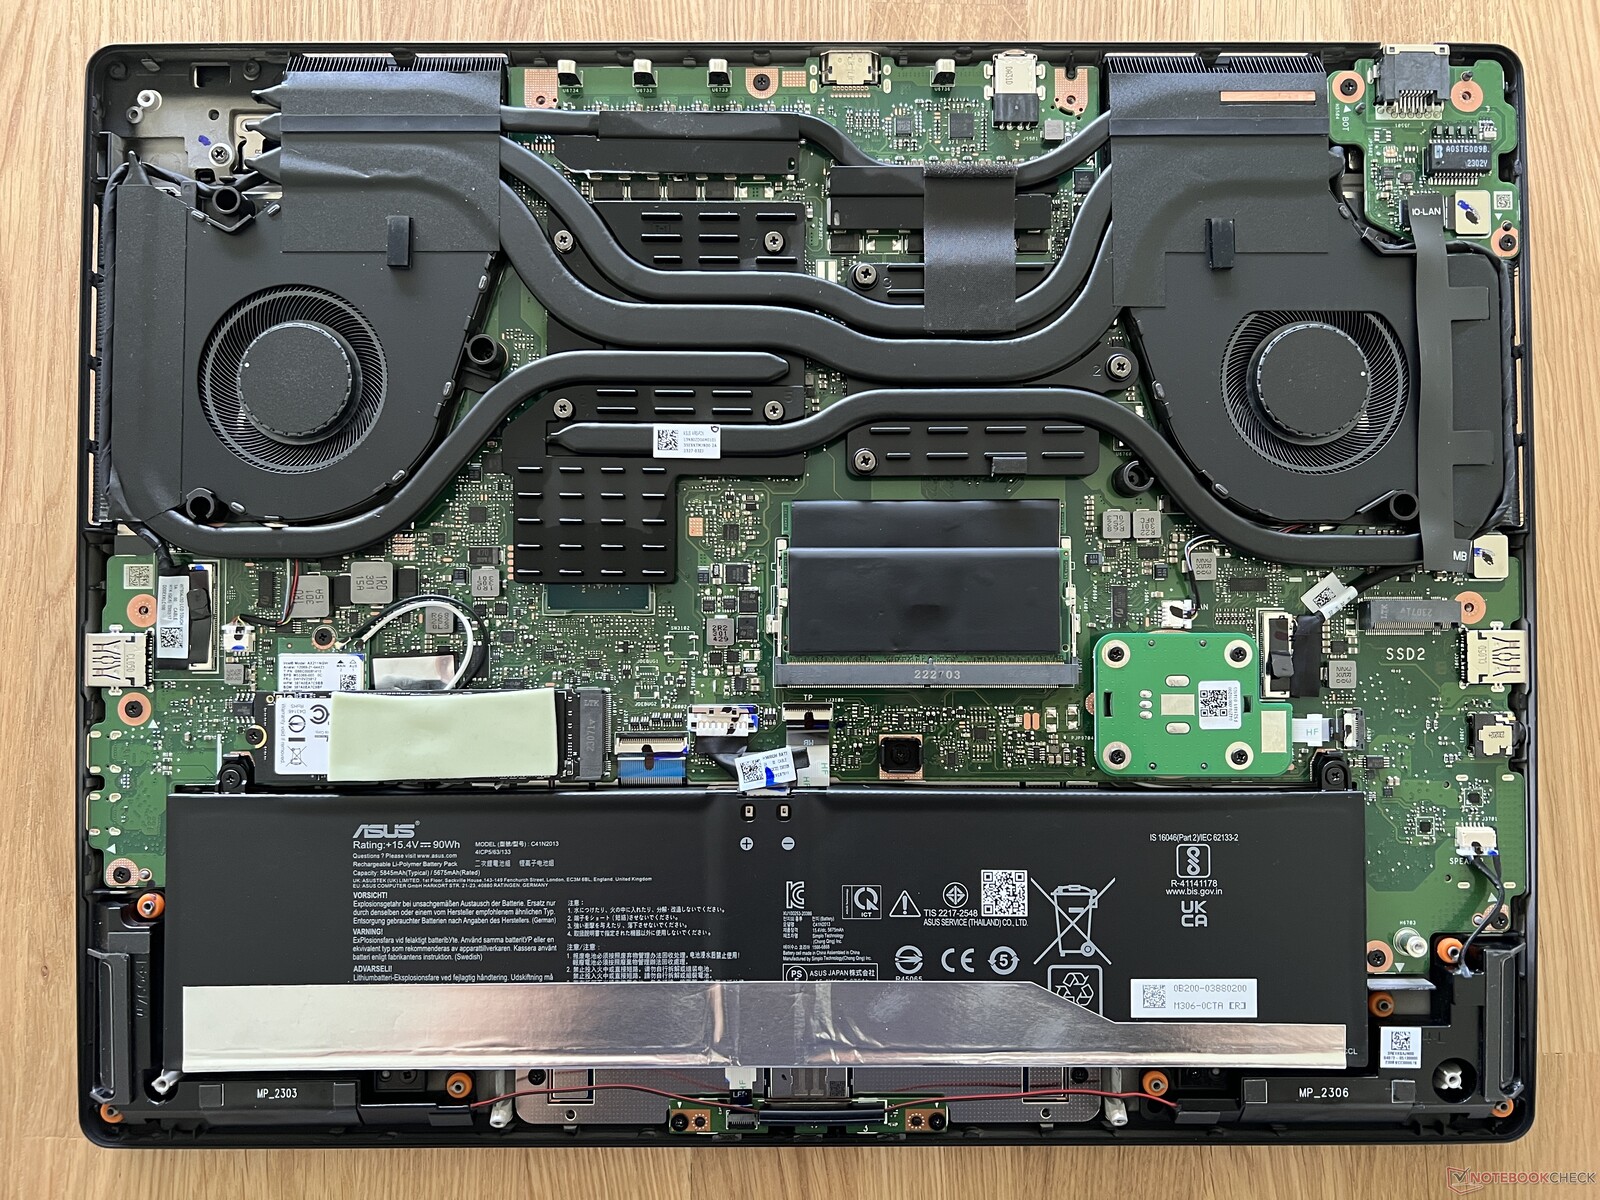
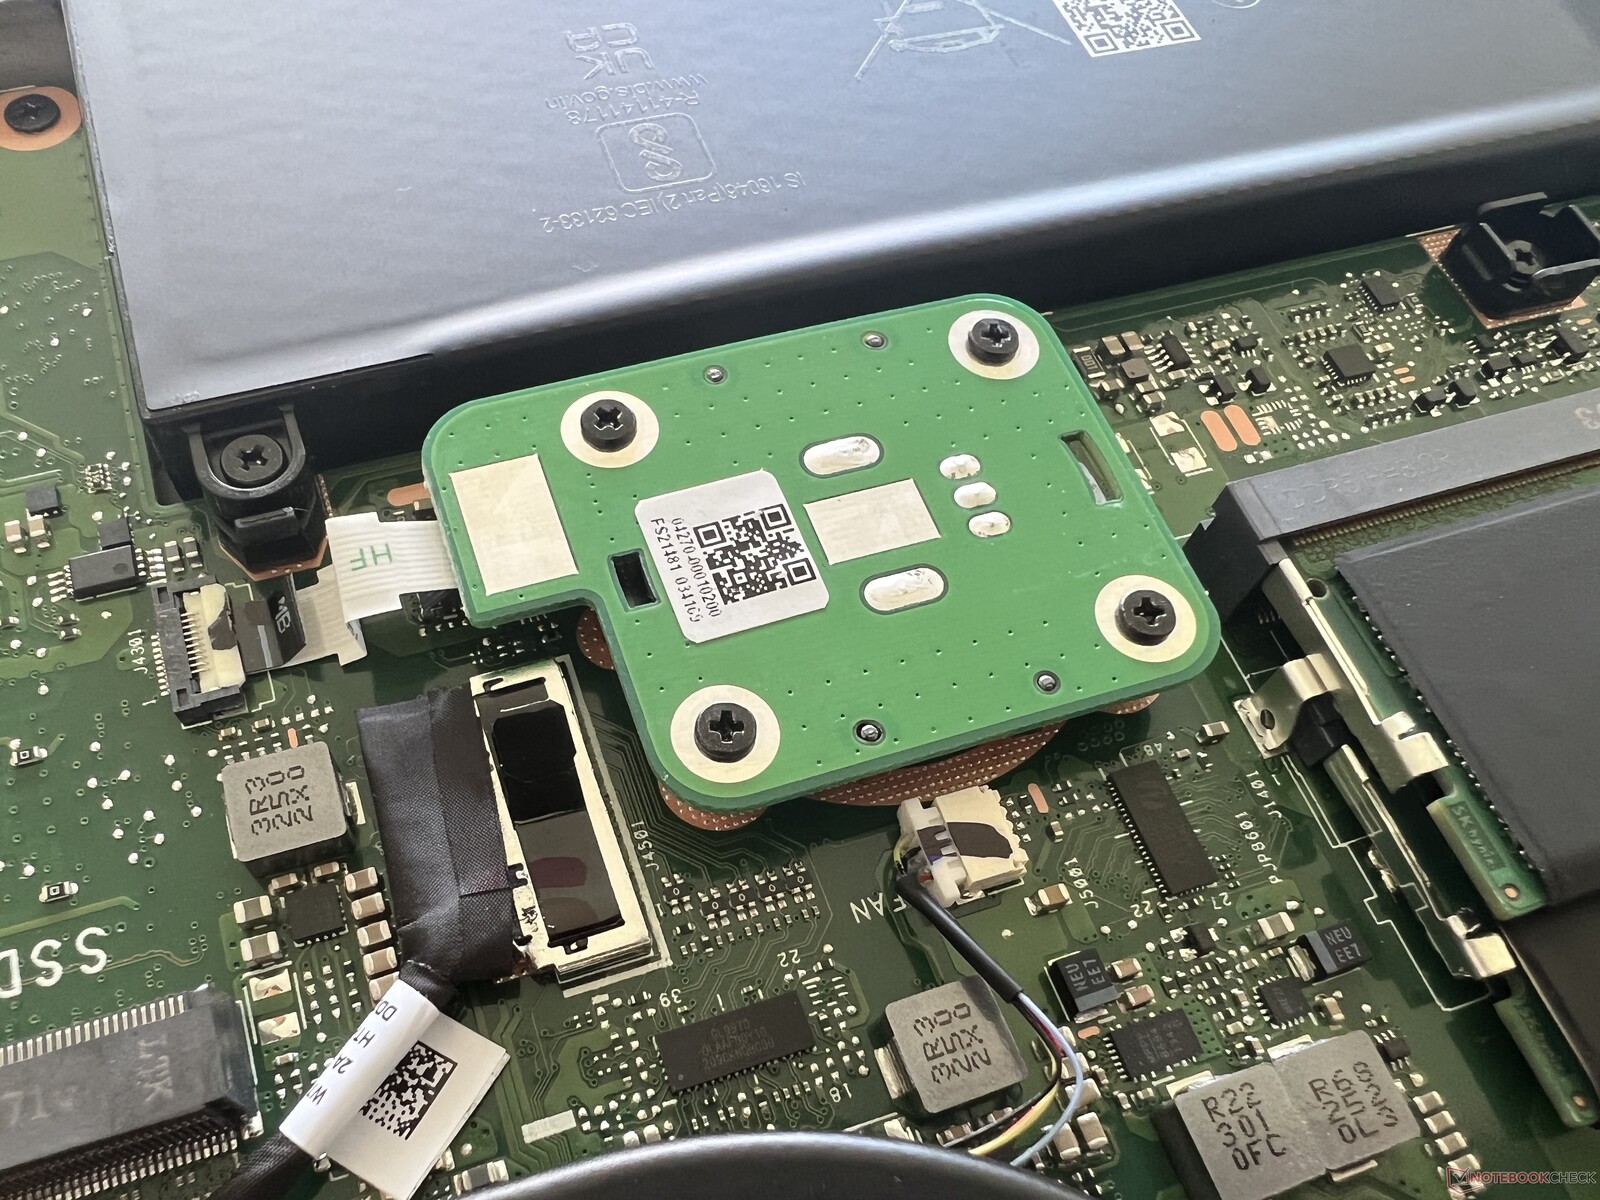
Den nedre höljeskåpan sitter fast med 10 Torx-skruvar (T5) och är fortfarande mycket hårt åtdragen efter att dessa skruvar har tagits bort. Det enklaste sättet att bända upp locket är vid de bakre fläktutgångarna. Inuti dominerar det stora kylsystemet och underhållsalternativen är också mycket bra, allt från WLAN-modulen (under den primära SSD-enheten), två SO DIMM-kortplatser till de två M.2 2280-kortplatserna för SSD-enheter. Vad som också är slående här är hur mycket utrymme den extra DialPad tar upp
Inmatningsenheter - DialPad och numpad
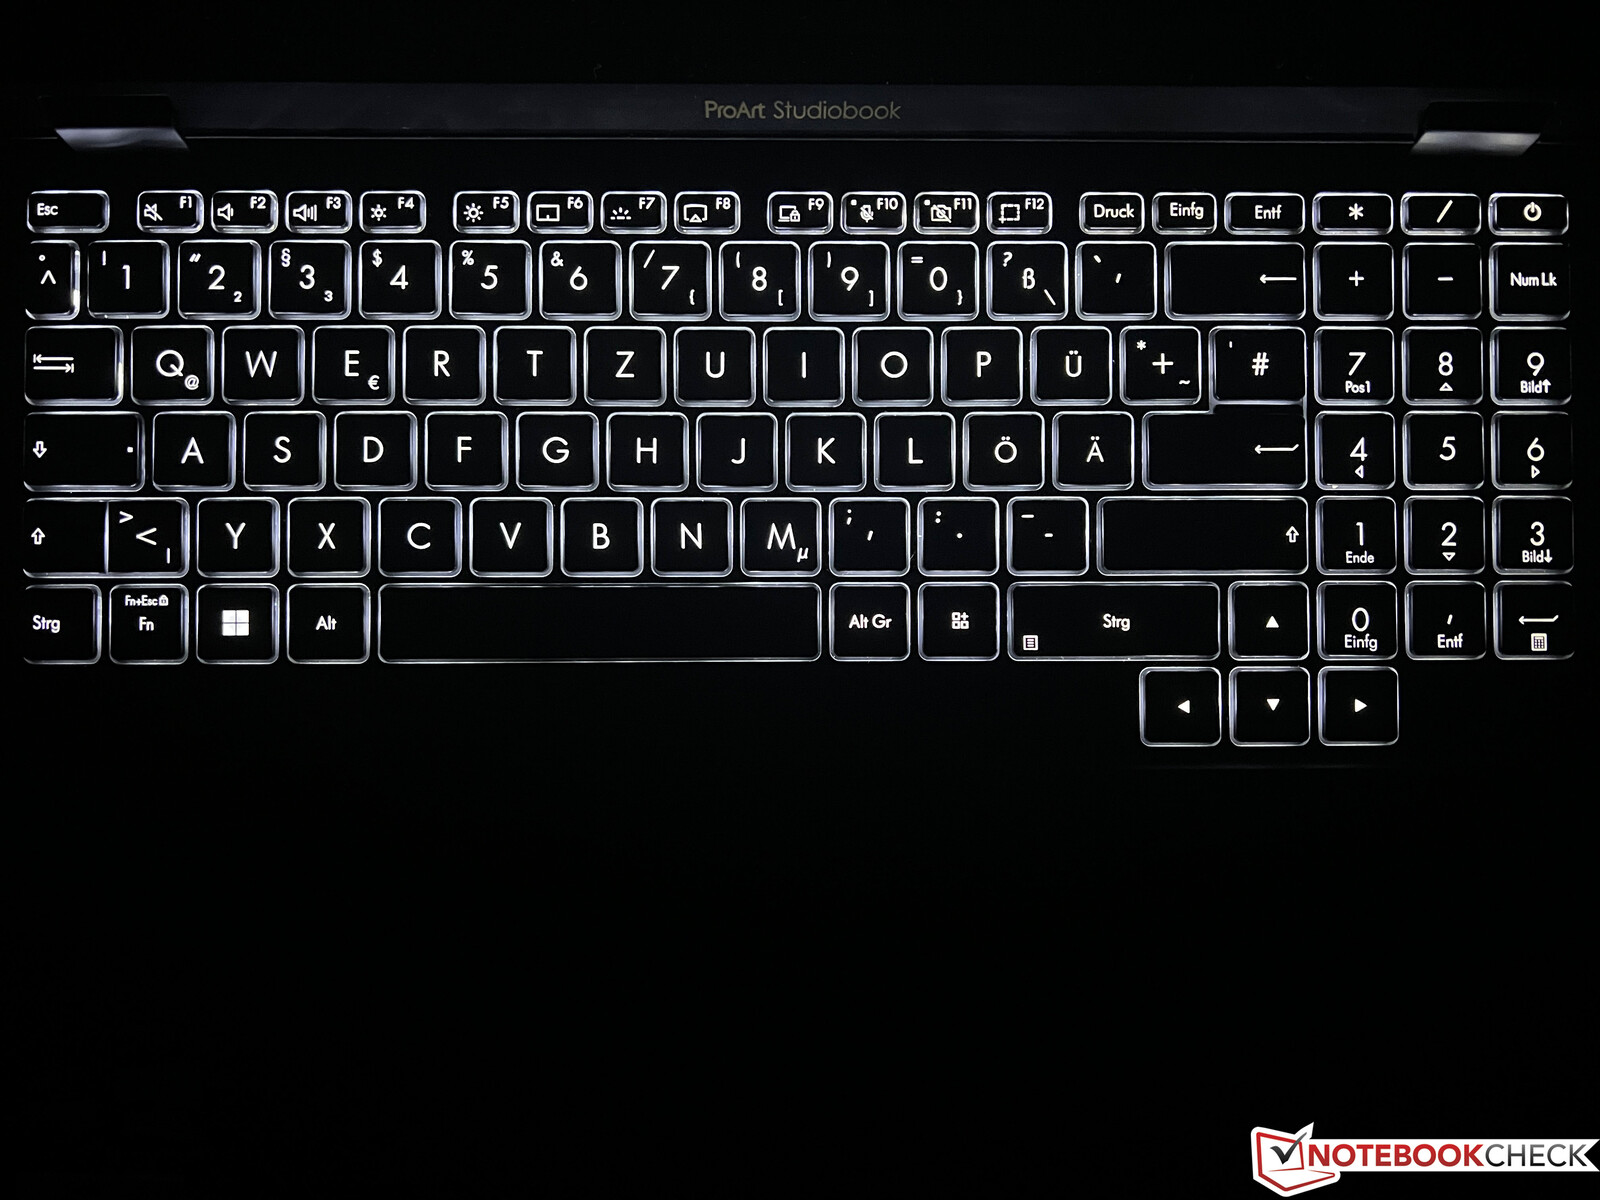
Tangentbord
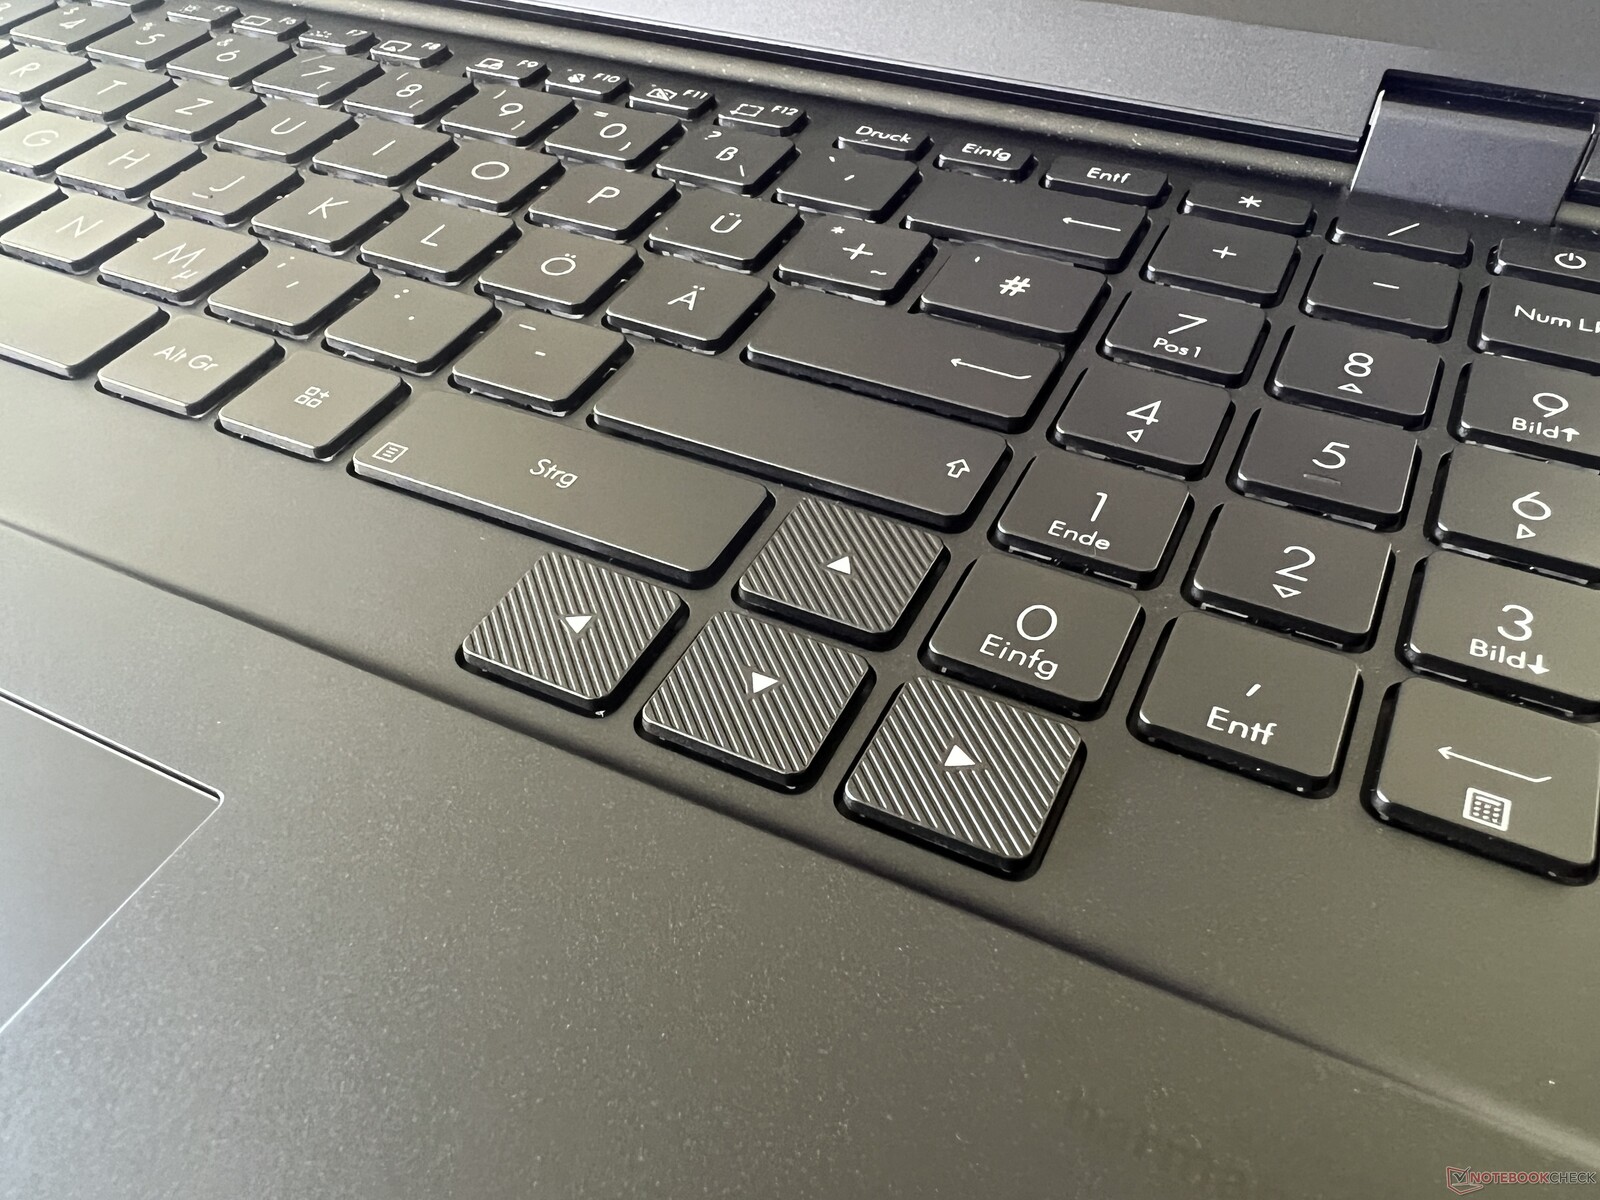
Tangentbordet har en rörelse på 1,4 mm och en dedikerad numpad. Skrivkänslan är hyfsad, men tangenterna är inte de tystaste och i synnerhet mellanslagstangenten är ganska högljudd. Layouten tar också lite tid att vänja sig vid, eftersom piltangenterna är stora, men har flyttats nedåt. Den enradiga Enter-tangenten är inte heller perfekt. Det finns en vit belysning i tre steg, men den aktiveras inte automatiskt via en sensor.
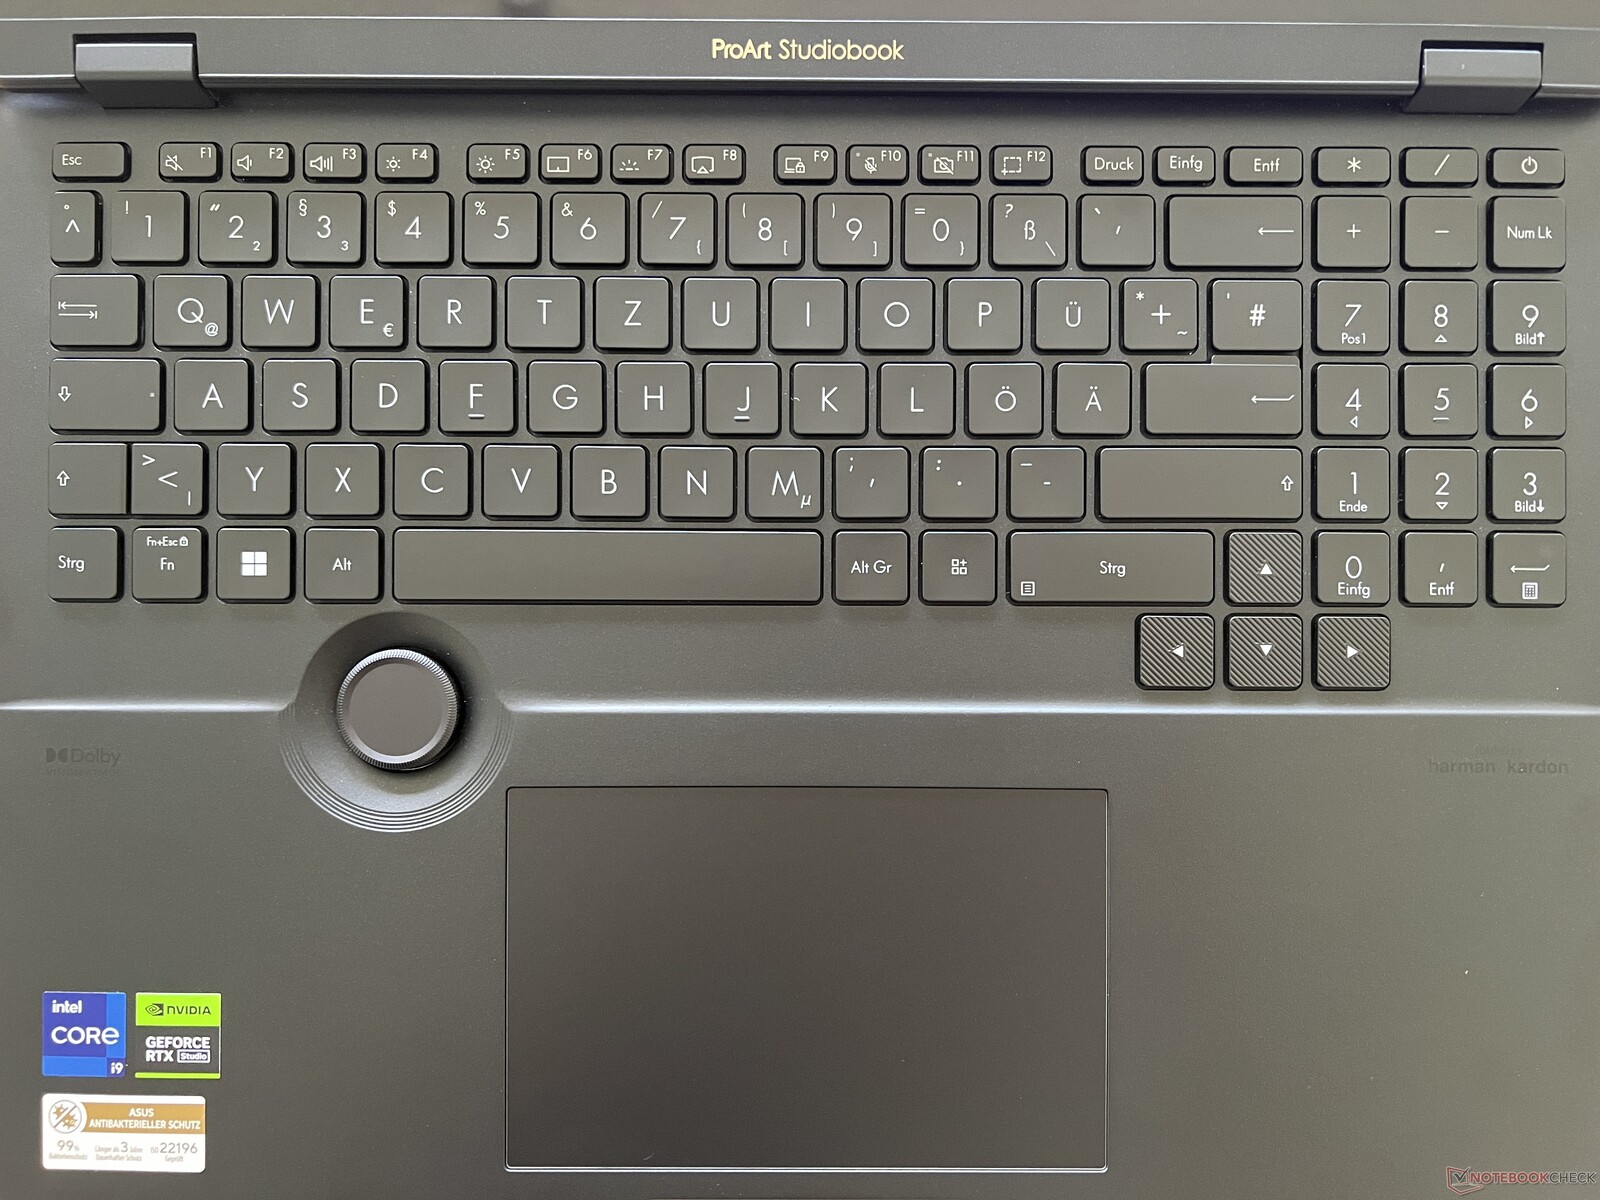
Pekplatta
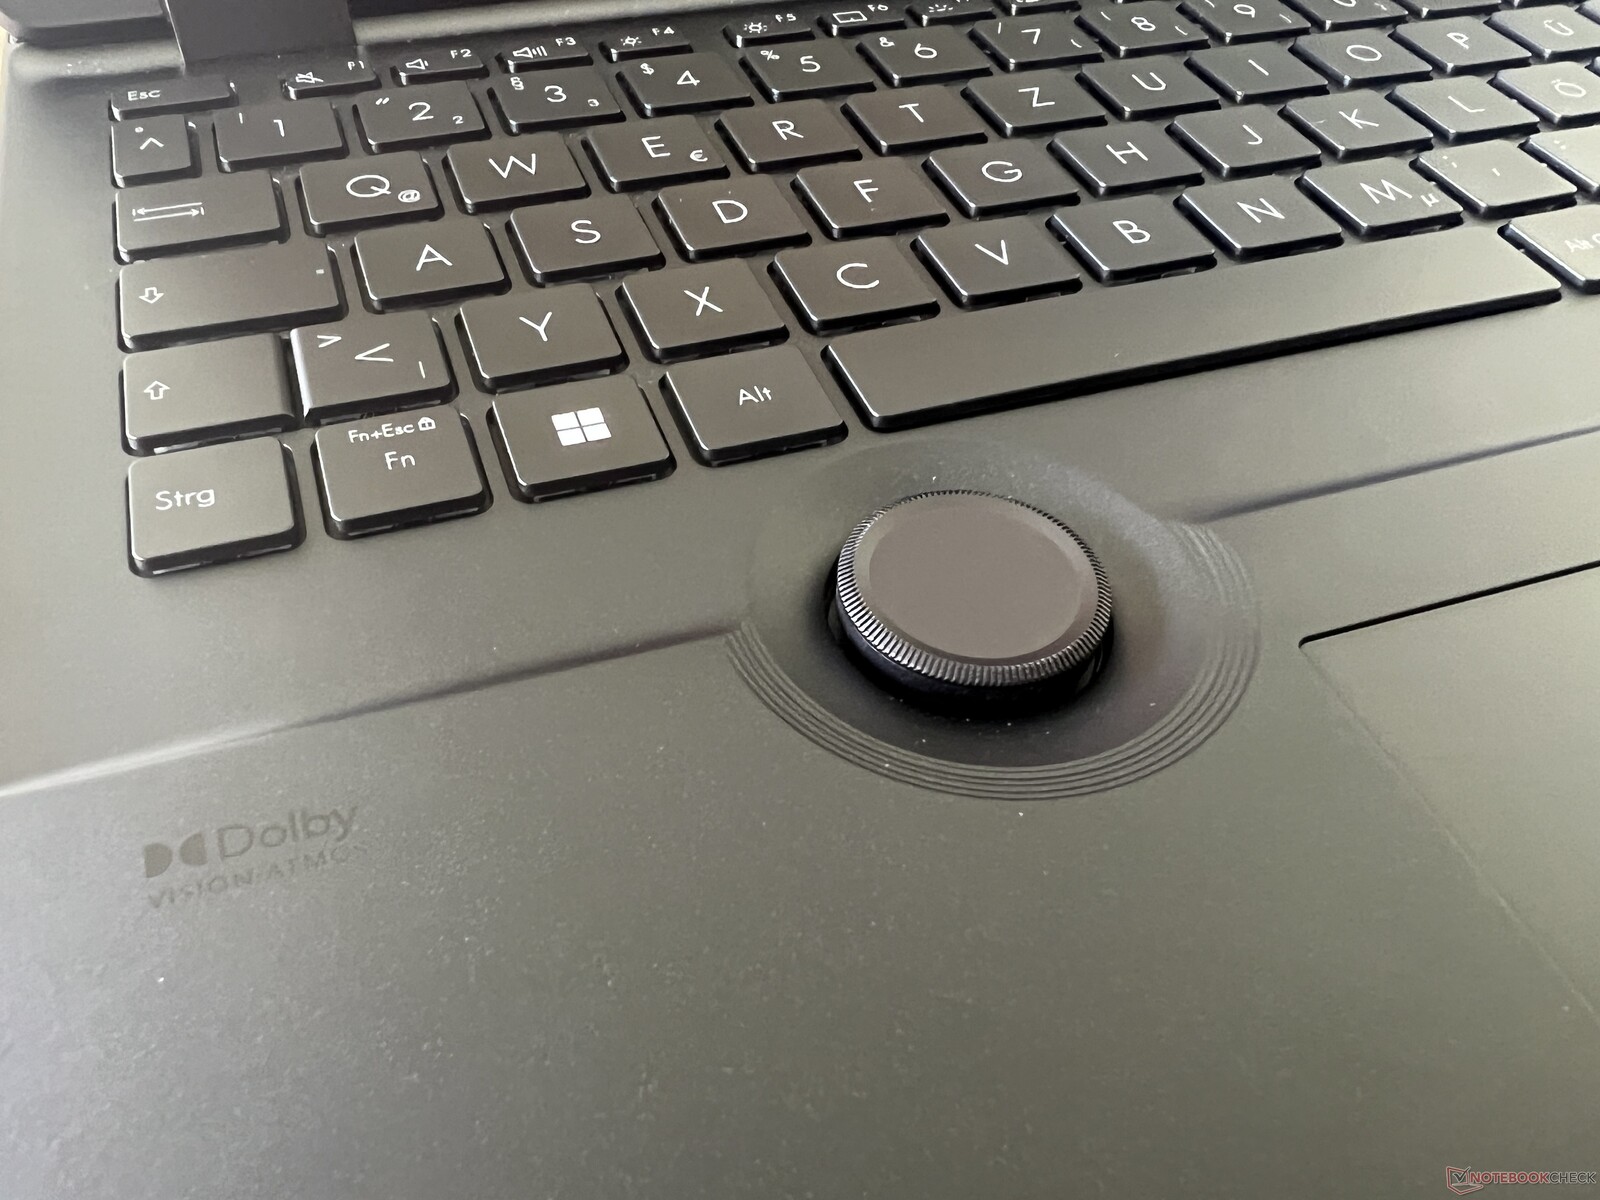
Den stora pekplattan fungerar utmärkt och kan klickas överallt, vilket kännetecknas av ett fylligt och tyst klickljud. Den speciella funktionen är DialPad, en stor roterande tryckknapp mellan pekplattan och tangentbordet. Implementeringen med Adobe-apparna fungerar bra, men mus- och tangentkombinationen är vanligtvis snabbare. Vid normal skrivbordsanvändning kan ljusstyrka och volym också justeras via DialPad, men detta går mycket snabbare via de vanliga specialtangenterna eller F-tangenterna.
Display - OLED-panel vid 120 Hz
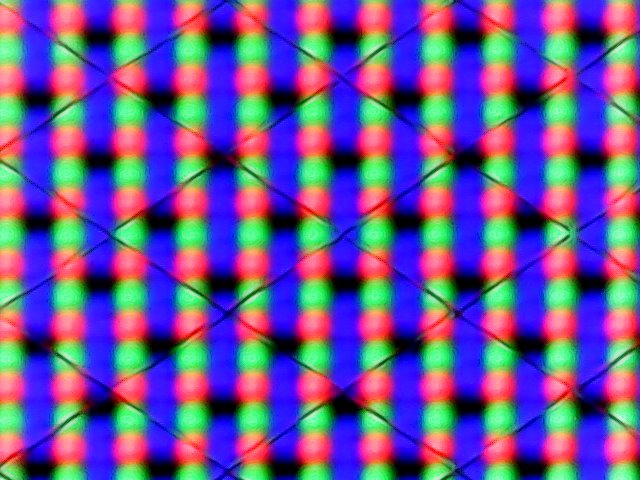
Asus satsar för närvarande fullt ut på OLED-skärmar och Studiobook är inget undantag. I motsats till föregångaren med sin 4K OLED-skärm används här en OLED-pekskärm med 3.200 x 2.000 pixlar och en högre frekvens på 120 Hz. Den subjektiva bildkvaliteten är mycket bra, men precis som i den nyligen granskade ZenBook Pro 14 verkar ljusa områden lite korniga vid närmare granskning, vilket beror på pekskiktet. Ljusstyrkan justeras inte automatiskt till det omgivande ljuset.
Vi fastställde en genomsnittlig ljusstyrka på 350 cd/m² i normalt SDR-läge, men tack vare det extremt låga svartvärdet för OLED-paneler är kontrastförhållandet mycket högt. I HDR-läge är maxvärdet nästan 580 cd/m² i ett litet bildutsnitt och cirka 480 cd/m² i en nästan helt vit bild. HDR-läget måste dock först aktiveras manuellt i Windows-inställningarna, varefter färgprofilerna inte längre kan användas. Det finns inga halos på OLED-paneler.
| |||||||||||||||||||||||||
Distribution av ljusstyrkan: 95 %
Mitt på batteriet: 346 cd/m²
Kontrast: 17450:1 (Svärta: 0.02 cd/m²)
ΔE ColorChecker Calman: 2.1 | ∀{0.5-29.43 Ø4.71}
calibrated: 2.1
ΔE Greyscale Calman: 1.2 | ∀{0.09-98 Ø4.96}
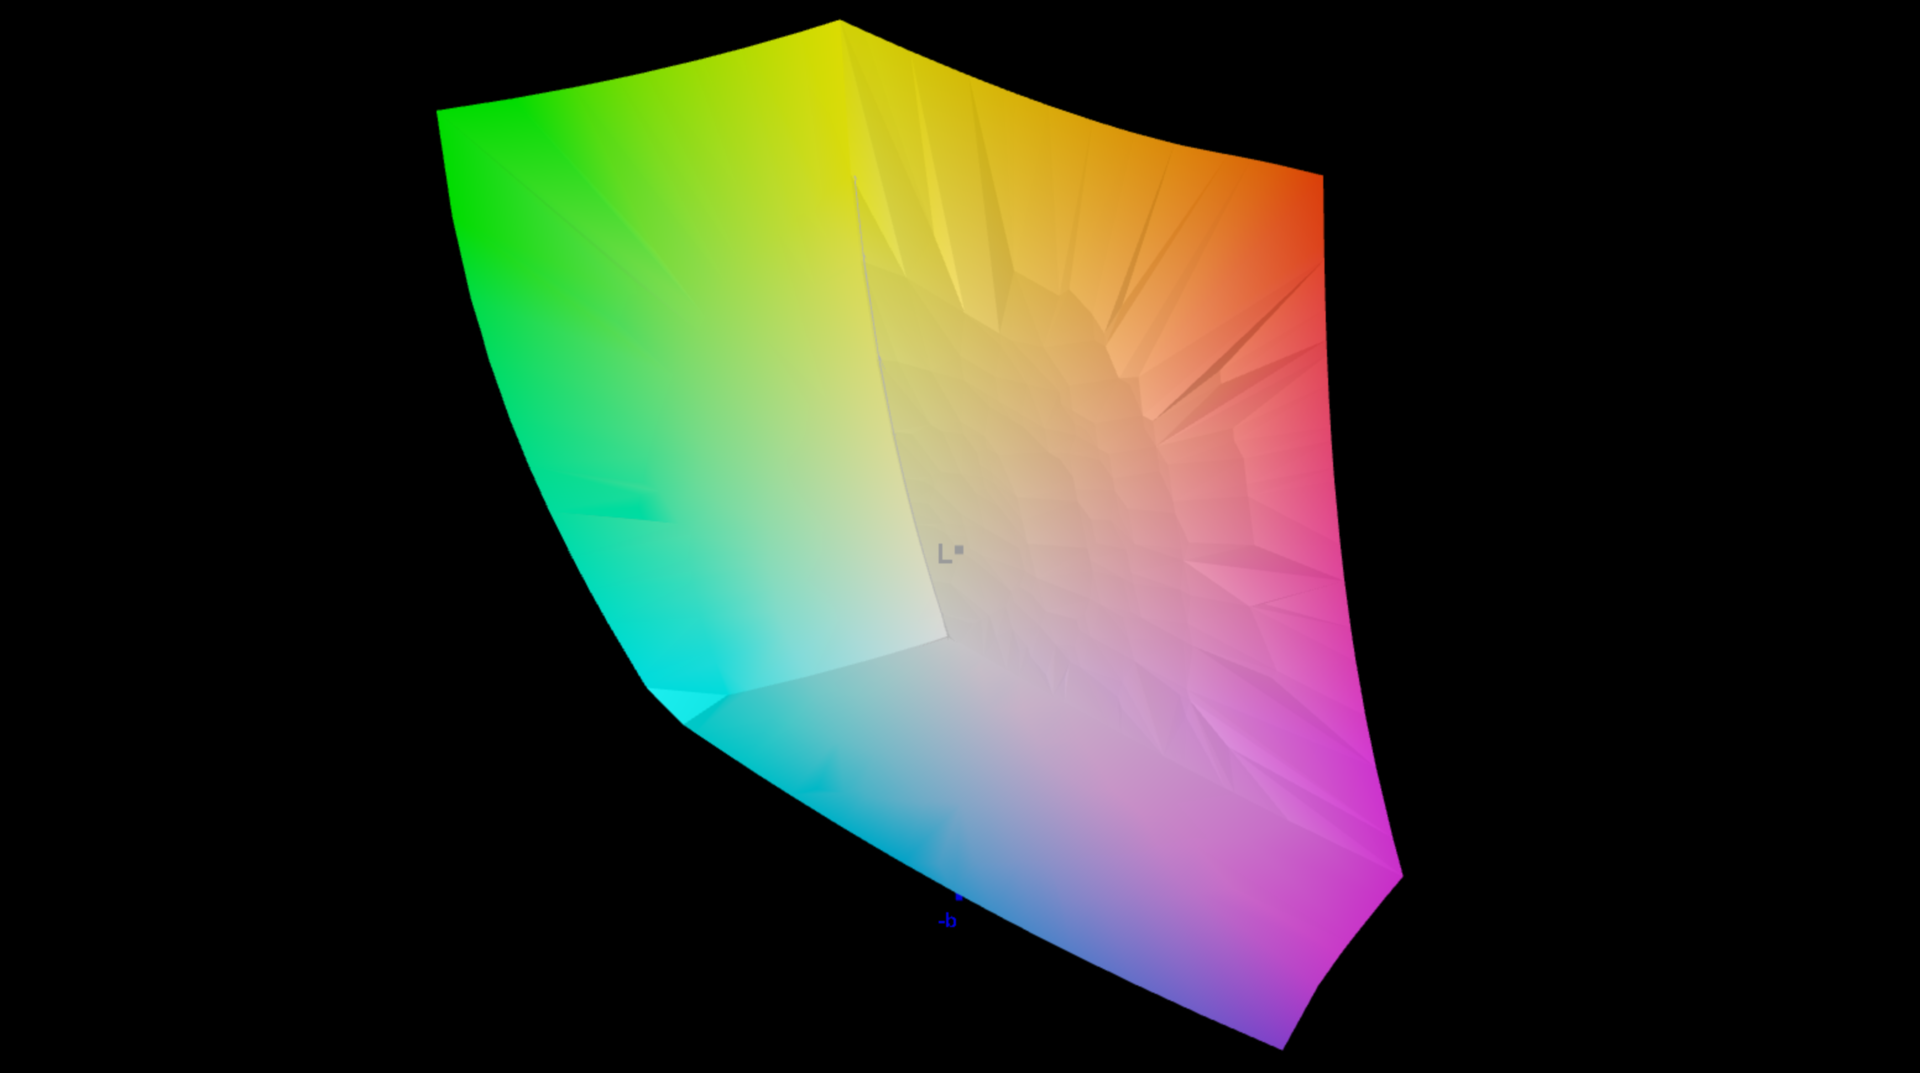
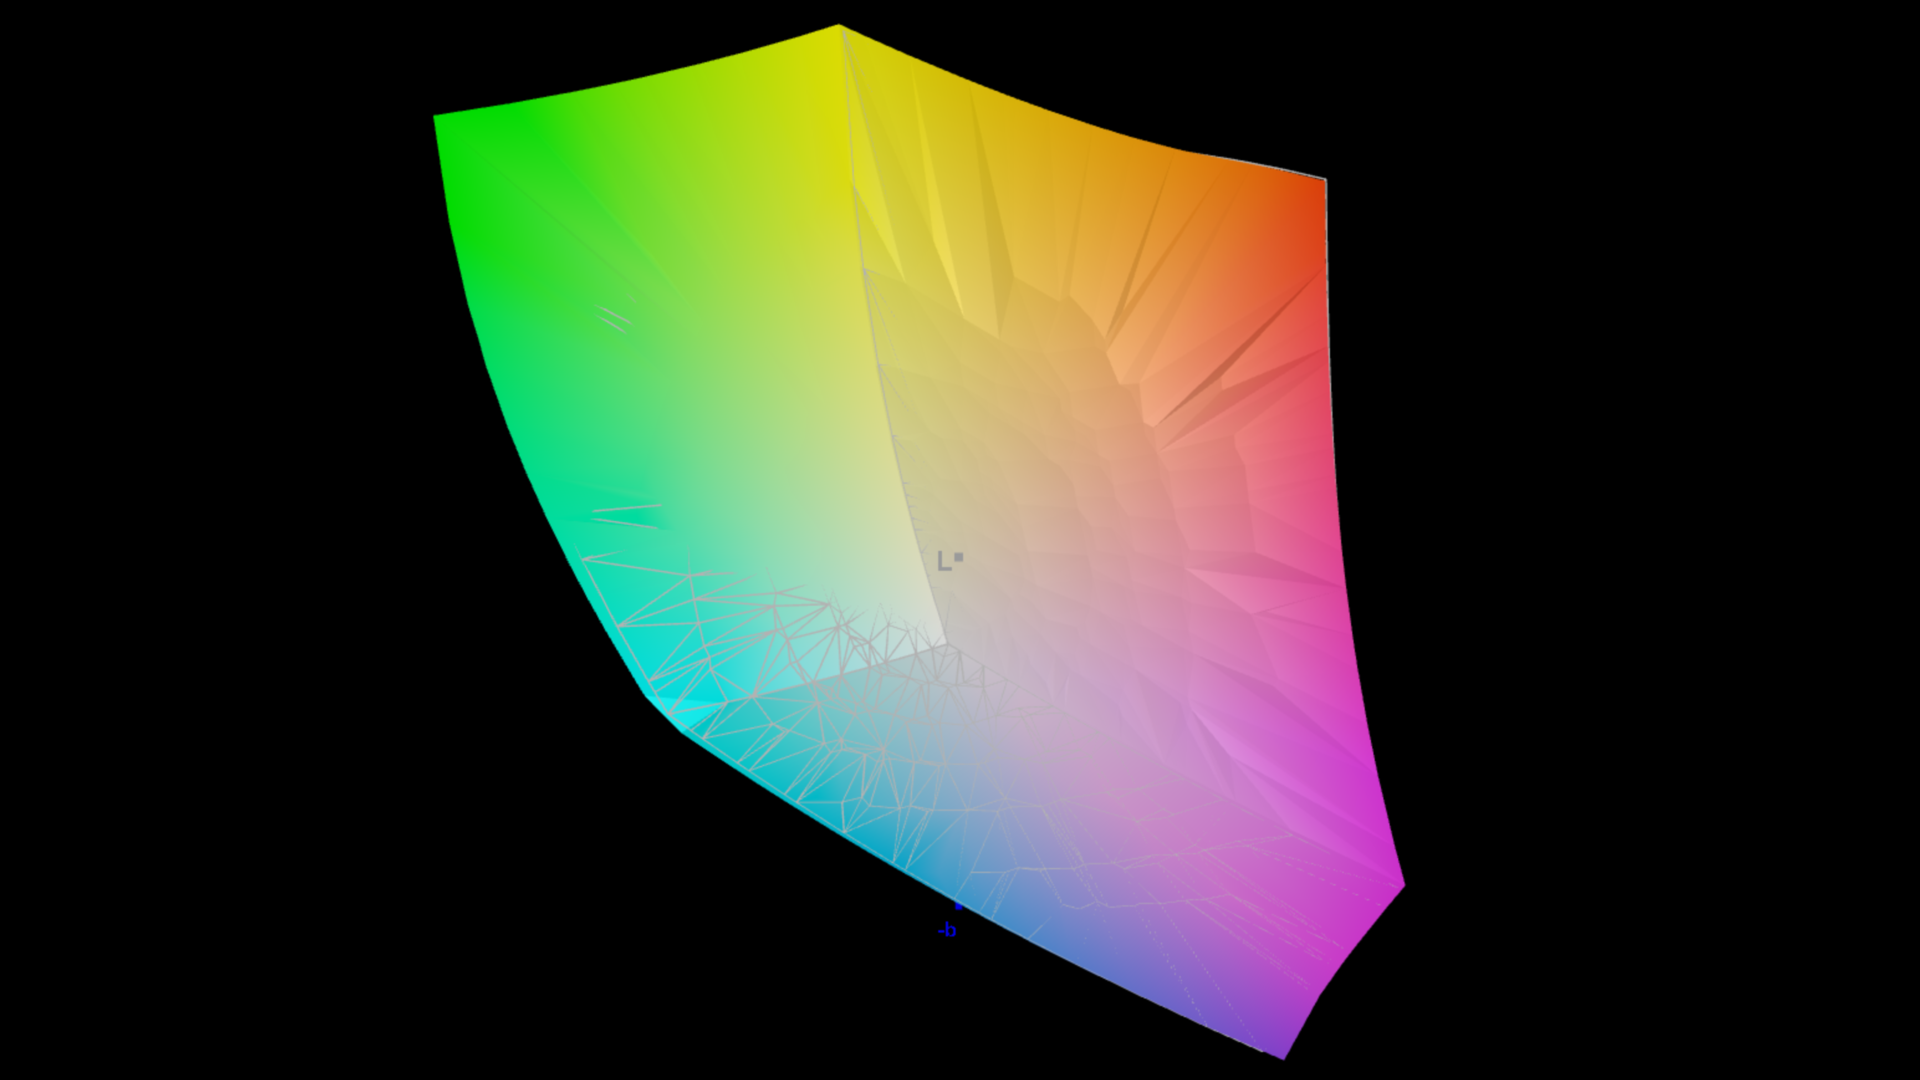
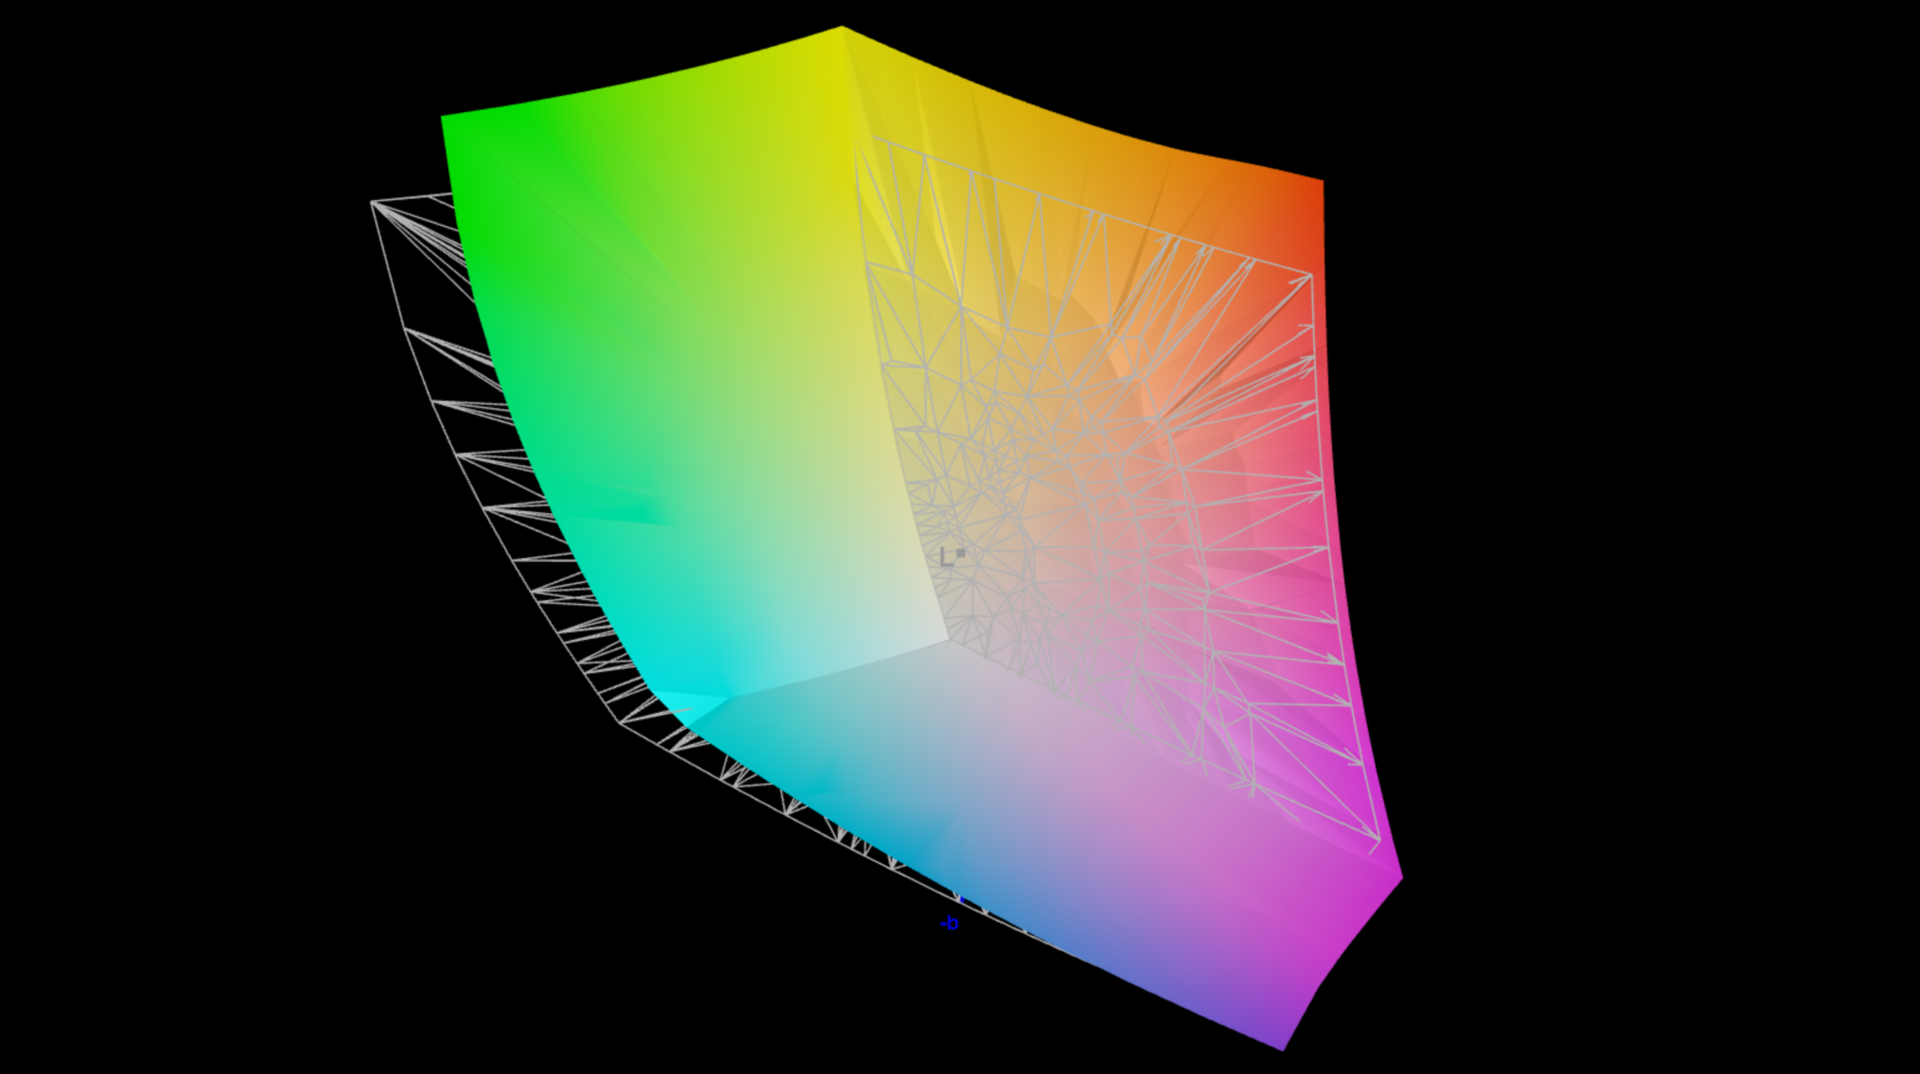
89.4% AdobeRGB 1998 (Argyll 3D)
100% sRGB (Argyll 3D)
99.6% Display P3 (Argyll 3D)
Gamma: 2.19
CCT: 6545 K
| Asus ProArt Studiobook 16 OLED H7604 ATNA60BX01-1, OLED, 3200x2000, 16" | Gigabyte AERO 16 OLED BSF Samsung SDC4191 (ATNA60YV09-0, OLED, 3840x2400, 16" | Samsung Galaxy Book3 Ultra 16 Samsung ATNA60CL03-0, AMOLED, 2880x1800, 16" | MSI Stealth 17 Studio A13VH-014 AUO41A2 B173ZAN06.C, Mini LED, 3840x2160, 17.3" | Apple MacBook Pro 16 2023 M2 Max Mini-LED, 3456x2234, 16.2" | Asus Zephyrus Duo 16 GX650PY-NM006W NE160QDM-NM4, MiniLED, 2560x1600, 16" | |
|---|---|---|---|---|---|---|
| Display | 3% | 3% | -1% | -1% | 1% | |
| Display P3 Coverage (%) | 99.6 | 99.9 0% | 99.9 0% | 92 -8% | 99 -1% | 99.4 0% |
| sRGB Coverage (%) | 100 | 100 0% | 100 0% | 99.1 -1% | 100 0% | 100 0% |
| AdobeRGB 1998 Coverage (%) | 89.4 | 96.4 8% | 96.3 8% | 94.07 5% | 88.5 -1% | 90.8 2% |
| Response Times | -195% | 18% | -3871% | -9710% | -2391% | |
| Response Time Grey 50% / Grey 80% * (ms) | 0.59 ? | 2 ? -239% | 0.49 ? 17% | 46.4 ? -7764% | 80.5 ? -13544% | 15.2 ? -2476% |
| Response Time Black / White * (ms) | 0.79 ? | 1.98 ? -151% | 0.65 ? 18% | 0.62 ? 22% | 47.2 ? -5875% | 19 ? -2305% |
| PWM Frequency (Hz) | 240 ? | 60 | 240 ? | 2400 | 14880 ? | 12000 ? |
| Screen | -9% | -15% | -12% | 370% | -15% | |
| Brightness middle (cd/m²) | 349 | 389.97 12% | 400 15% | 397.29 14% | 504 44% | 712 104% |
| Brightness (cd/m²) | 350 | 395 13% | 399 14% | 392 12% | 487 39% | 703 101% |
| Brightness Distribution (%) | 95 | 97 2% | 93 -2% | 93 -2% | 94 -1% | 95 0% |
| Black Level * (cd/m²) | 0.02 | 0.03 -50% | 0.03 -50% | 0.02 -0% | 0.001 95% | 0.07 -250% |
| Contrast (:1) | 17450 | 12999 -26% | 13333 -24% | 19865 14% | 504000 2788% | 10171 -42% |
| Colorchecker dE 2000 * | 2.1 | 2 5% | 2.3 -10% | 2.52 -20% | 1.5 29% | 1.7 19% |
| Colorchecker dE 2000 max. * | 5.5 | 4.1 25% | 4.15 25% | 3.91 29% | 3.3 40% | 4 27% |
| Colorchecker dE 2000 calibrated * | 2.1 | 1.68 20% | 1.66 21% | 2.52 -20% | 1.2 43% | |
| Greyscale dE 2000 * | 1.2 | 2.23 -86% | 2.7 -125% | 2.78 -132% | 2.1 -75% | 2.8 -133% |
| Gamma | 2.19 100% | 2.41 91% | 2.266 97% | 2.63 84% | 2.25 98% | 2.21 100% |
| CCT | 6545 99% | 6323 103% | 7047 92% | 6412 101% | 6882 94% | 6978 93% |
| Totalt genomsnitt (program/inställningar) | -67% /
-33% | 2% /
-7% | -1295% /
-561% | -3114% /
-1266% | -802% /
-351% |
* ... mindre är bättre
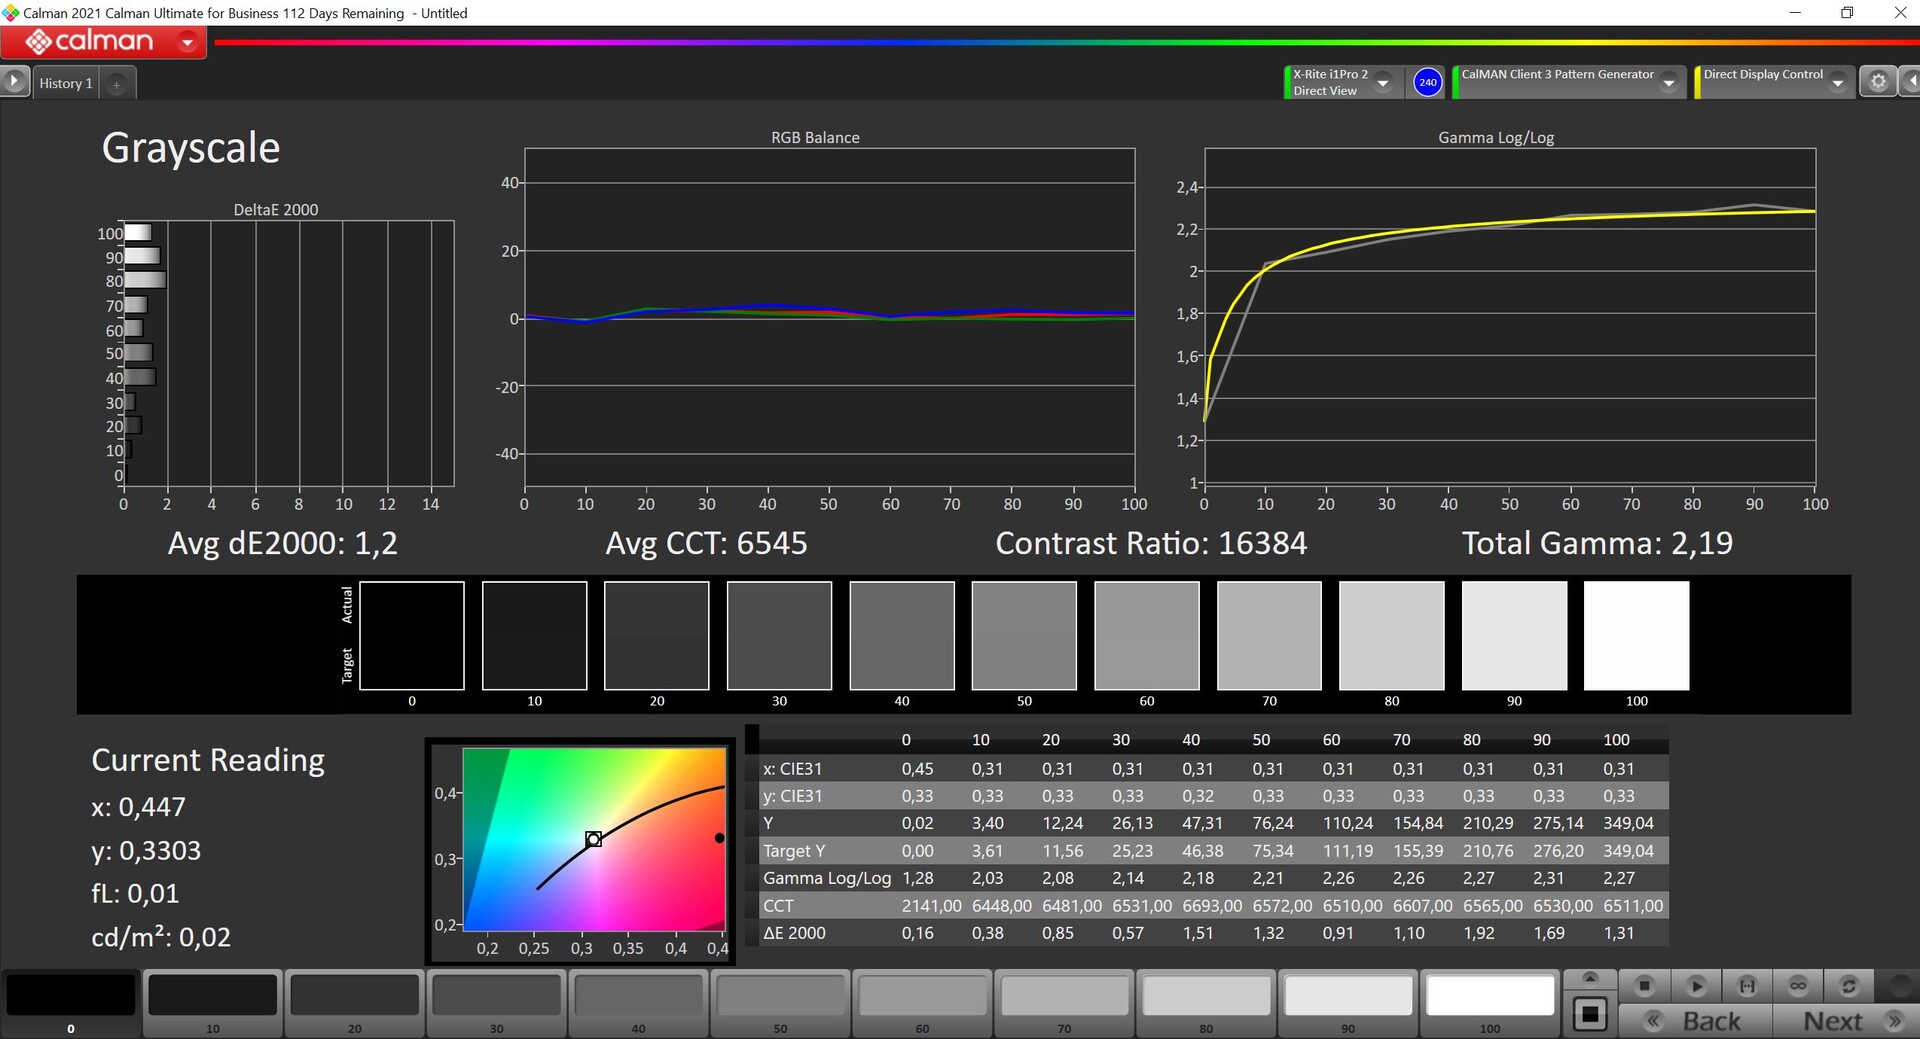
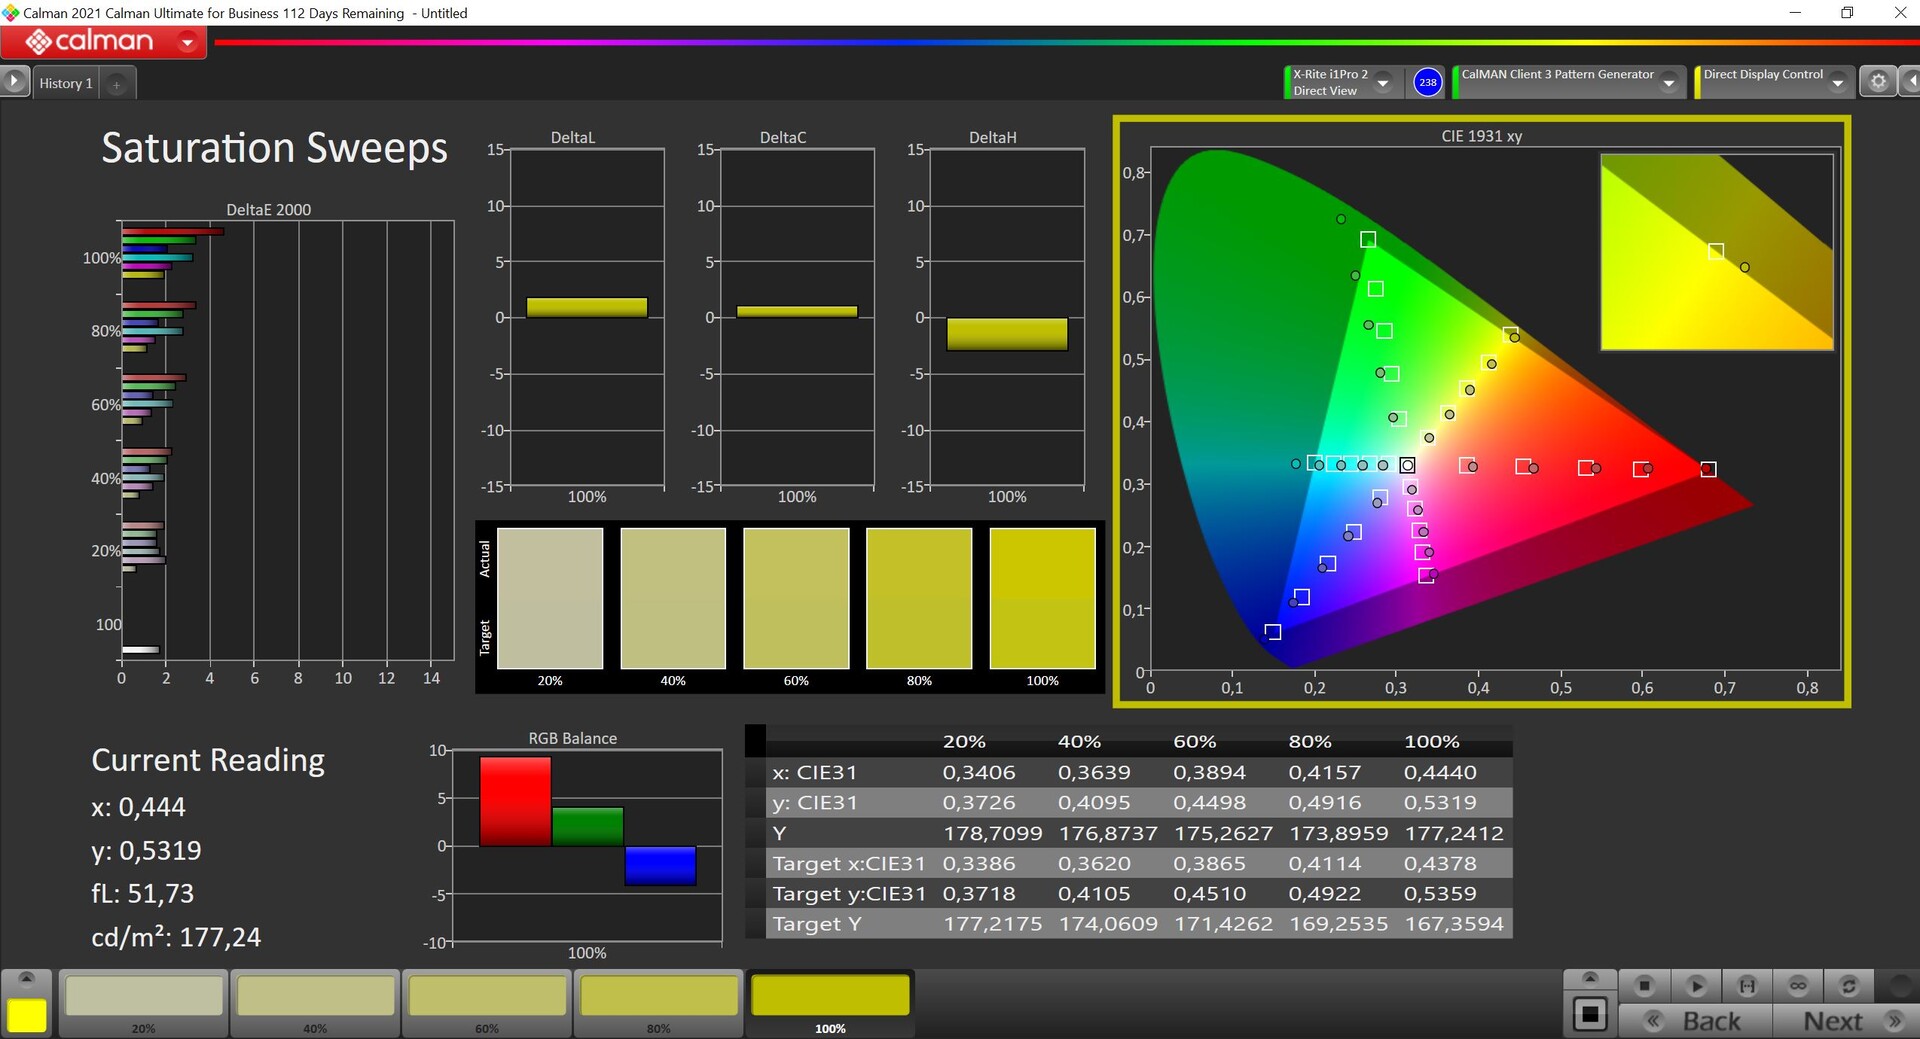
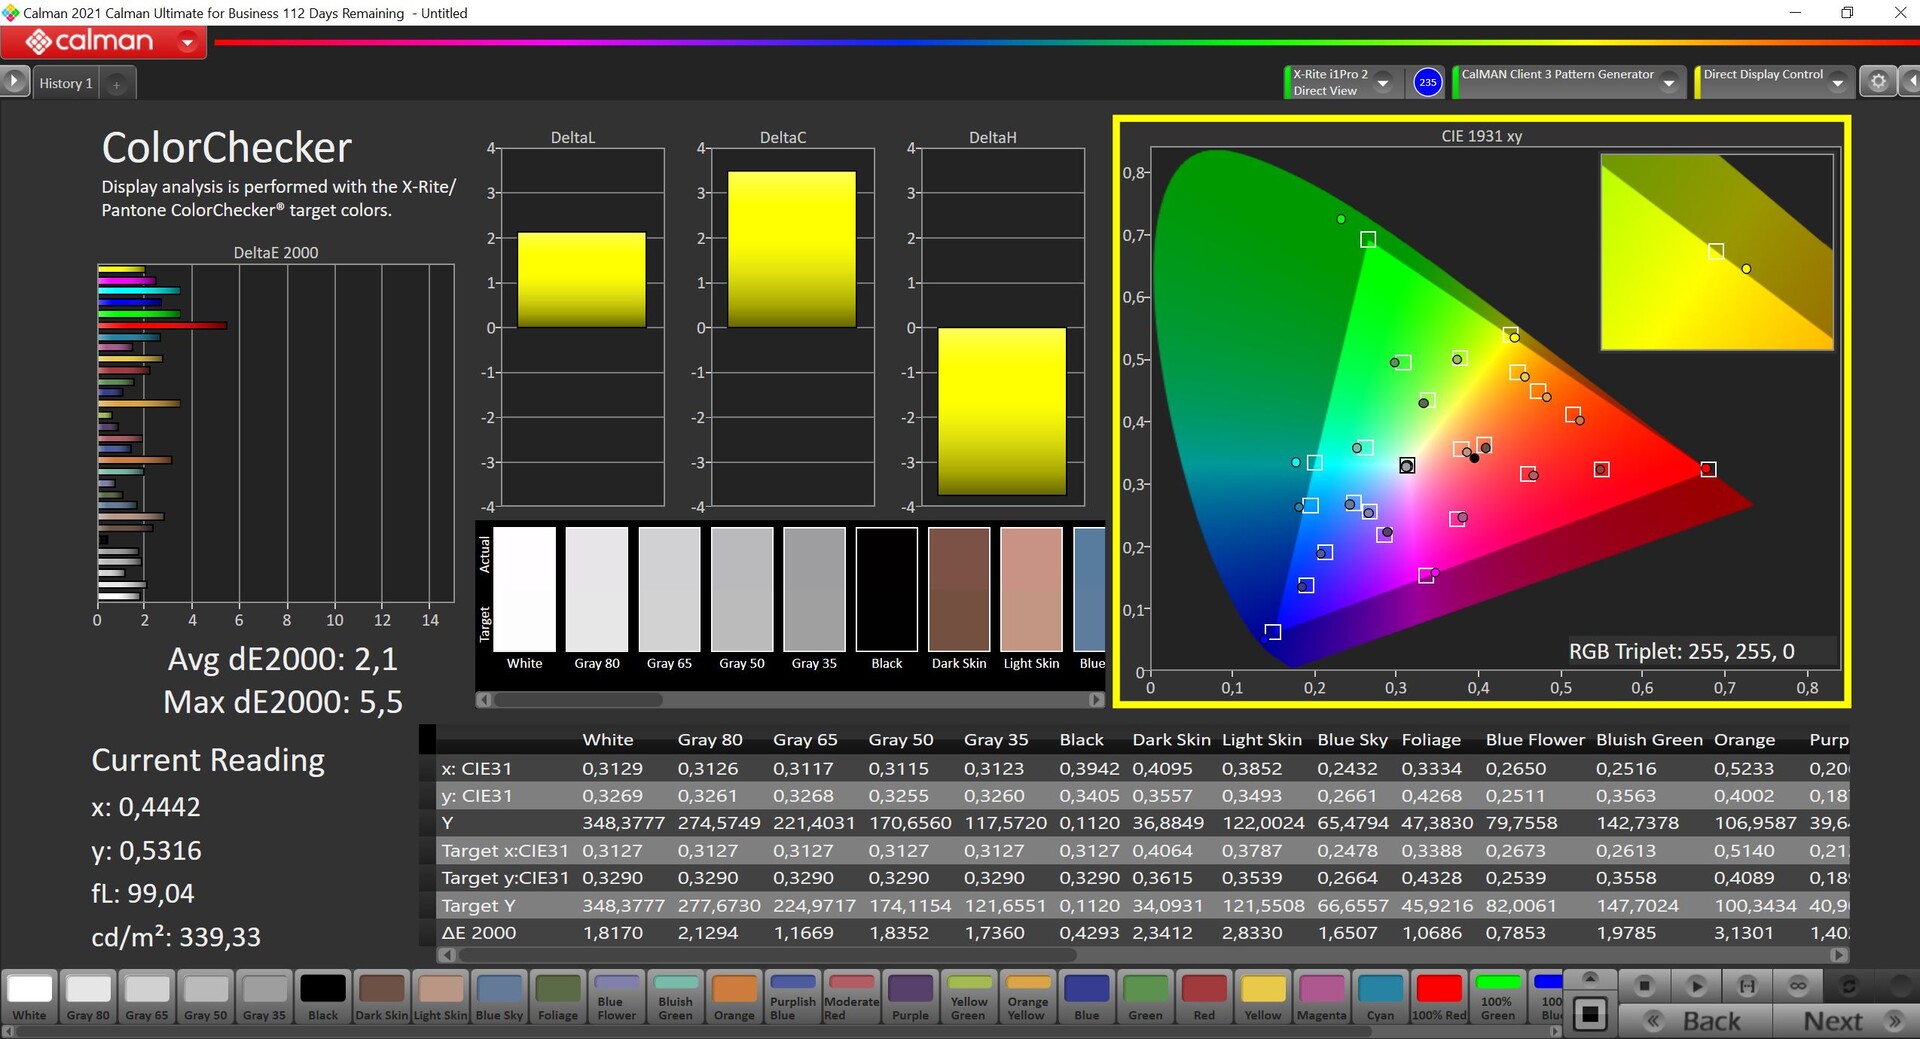
Som vanligt finns det flera färgprofiler i MyAsus-programvaran, där "Native" är förinställt som standard. Här är färgerna något övermättade, vilket bör resultera i en något kraftfullare bild i praktiken. Den mest exakta profilen är DisplayP3, som vi också använde för våra mätningar med den professionella CalMAN-mjukvaran (X-Rite i1 Pro 2). I grund och botten är resultaten redan mycket bra och det finns inga problem när det gäller färgkast eller färgtemperatur, även om vissa enskilda färger ligger över den viktiga avvikelsen på 3. Vi kunde inte korrigera detta med vår egen kalibrering, vilket är anledningen till att vi inte tillhandahåller en profil för nedladdning i det här specifika fallet. P3-färgrymden är helt täckt.
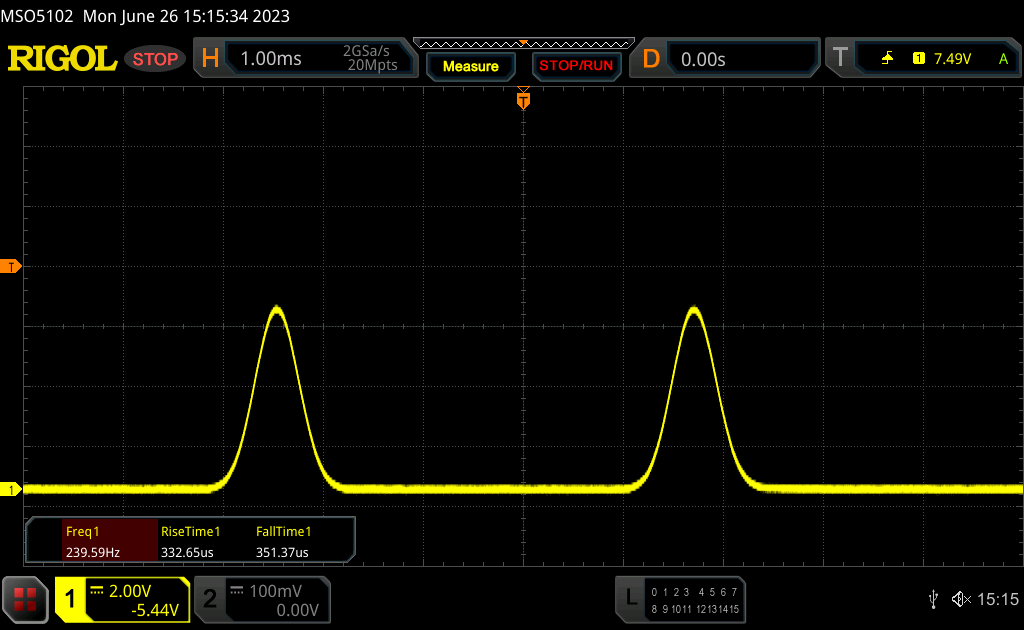
Visa svarstider
| ↔ Svarstid svart till vitt | ||
|---|---|---|
| 0.79 ms ... stiga ↗ och falla ↘ kombinerat | ↗ 0.34 ms stiga | 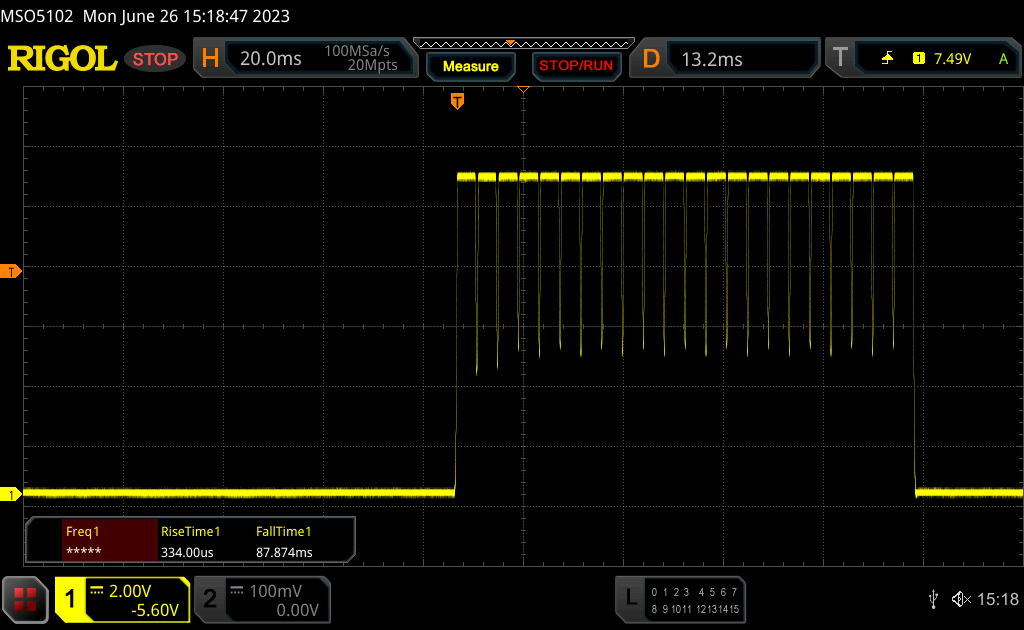 |
| ↘ 0.45 ms hösten | ||
| Skärmen visar väldigt snabba svarsfrekvenser i våra tester och borde vara mycket väl lämpad för fartfyllt spel. I jämförelse sträcker sig alla testade enheter från 0.1 (minst) till 240 (maximalt) ms. » 2 % av alla enheter är bättre. Det betyder att den uppmätta svarstiden är bättre än genomsnittet av alla testade enheter (19.8 ms). | ||
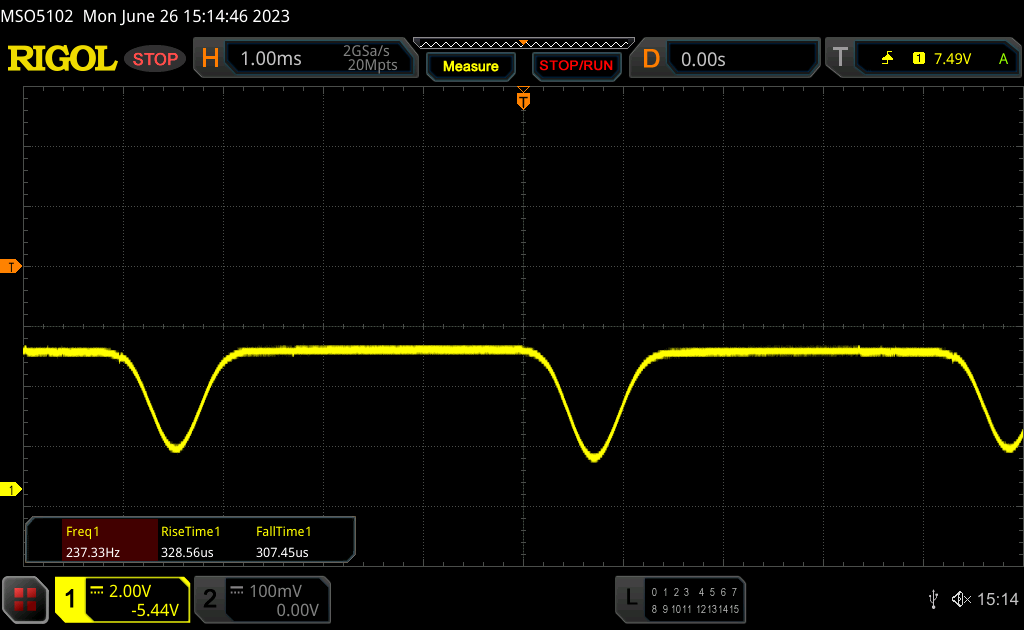
| ↔ Svarstid 50 % grått till 80 % grått | ||
| 0.59 ms ... stiga ↗ och falla ↘ kombinerat | ↗ 0.29 ms stiga | 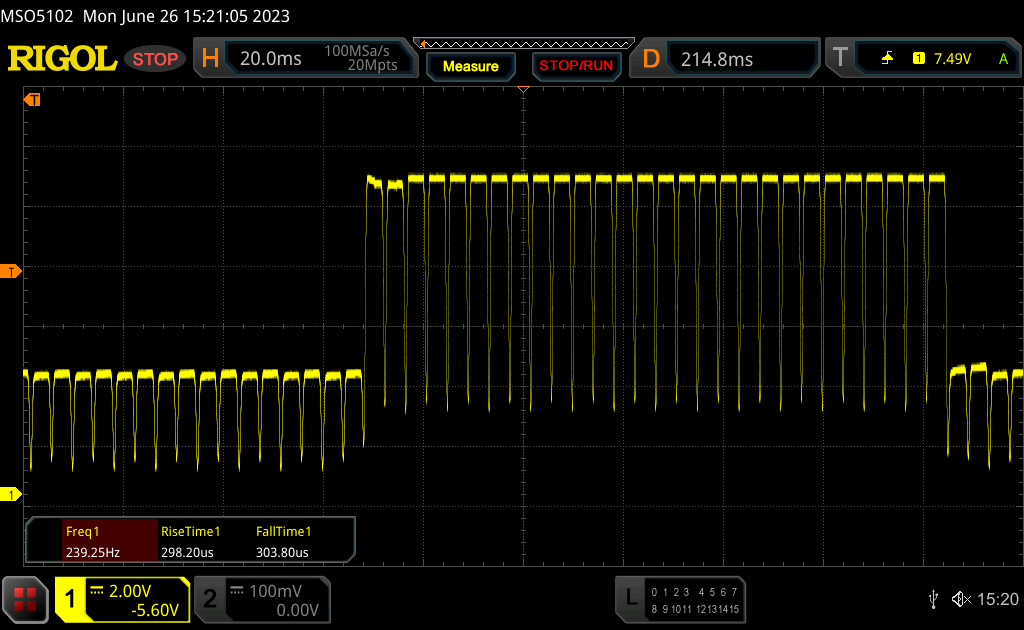 |
| ↘ 0.3 ms hösten | ||
| Skärmen visar väldigt snabba svarsfrekvenser i våra tester och borde vara mycket väl lämpad för fartfyllt spel. I jämförelse sträcker sig alla testade enheter från 0.165 (minst) till 636 (maximalt) ms. » 1 % av alla enheter är bättre. Det betyder att den uppmätta svarstiden är bättre än genomsnittet av alla testade enheter (31 ms). | ||
Skärmflimmer / PWM (Puls-Width Modulation)
| Skärmflimmer / PWM upptäckt | 240 Hz | ≤ 100 % ljusstyrka inställning | 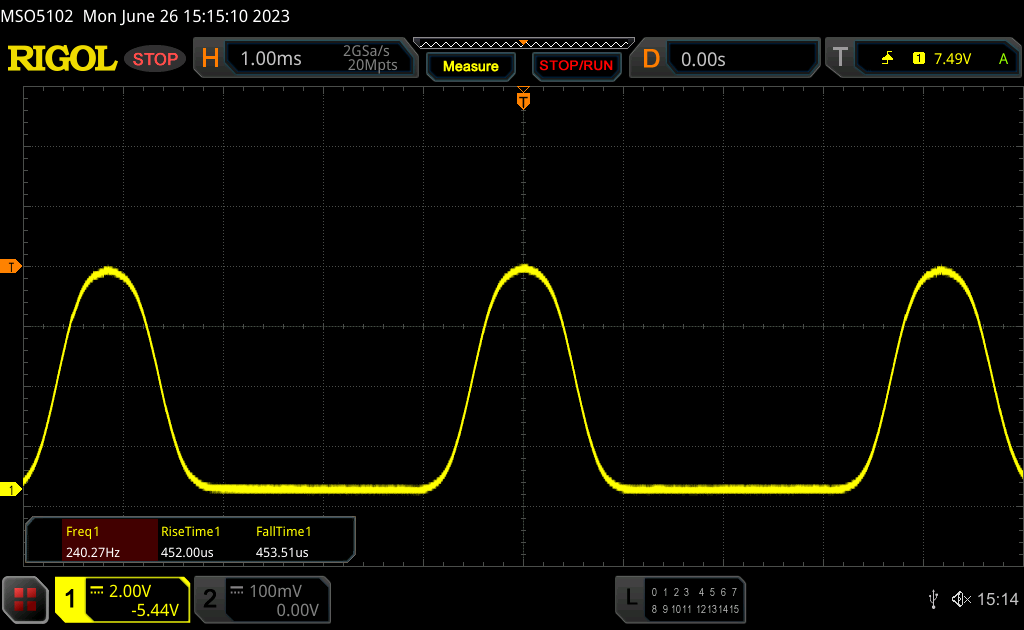 |
Displayens bakgrundsbelysning flimrar vid 240 Hz (i värsta fall, t.ex. med PWM) Flimrande upptäckt vid en ljusstyrkeinställning på 100 % och lägre. Det ska inte finnas något flimmer eller PWM över denna ljusstyrkeinställning. Frekvensen för 240 Hz är relativt låg, så känsliga användare kommer sannolikt att märka flimmer och uppleva ansträngda ögon vid den angivna ljusstyrkeinställningen och nedan. Som jämförelse: 52 % av alla testade enheter använder inte PWM för att dämpa skärmen. Om PWM upptäcktes mättes ett medelvärde av 7757 (minst: 5 - maximum: 343500) Hz. | |||
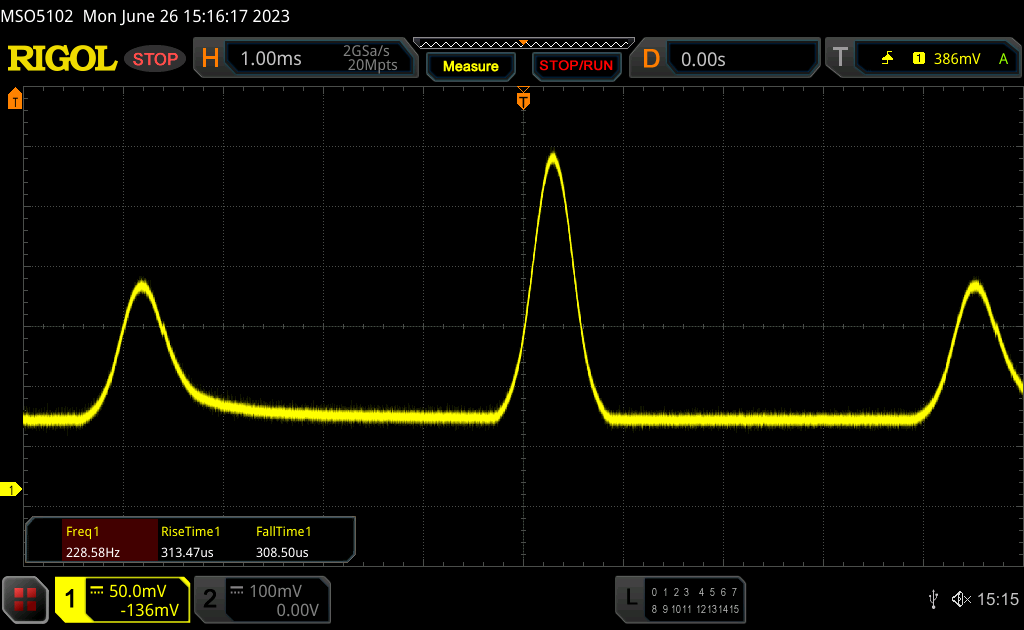
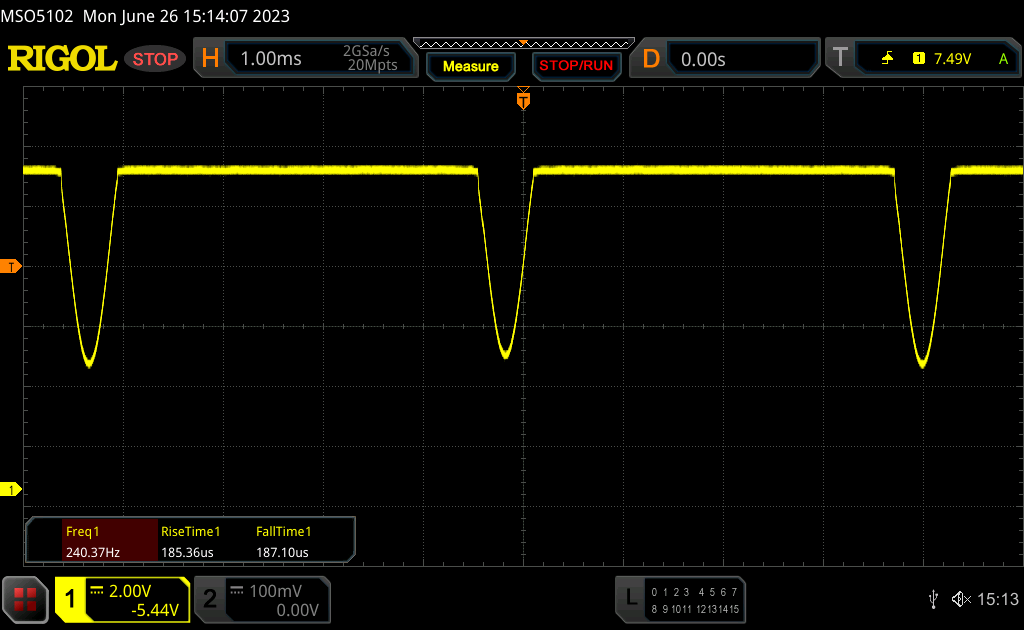
DC-dimning används i ljusstyrkeområdet från 100 till 60%, och klassisk PWM-flimmer vid 240 Hz under det. Så snart ljusstyrkan sjunker under 60% visas en varning om att DC-dimning inte längre är tillgänglig. Som ett alternativ finns den så kallade flimmerfria OLED-dimningen tillgänglig i MyAsus-programvaran, som vi undersökte i vår recension av Zenbook S 13 OLED. Det är verkligen ett användbart tillägg, men det är också besvärligt att behöva gå igenom programvaran hela tiden.
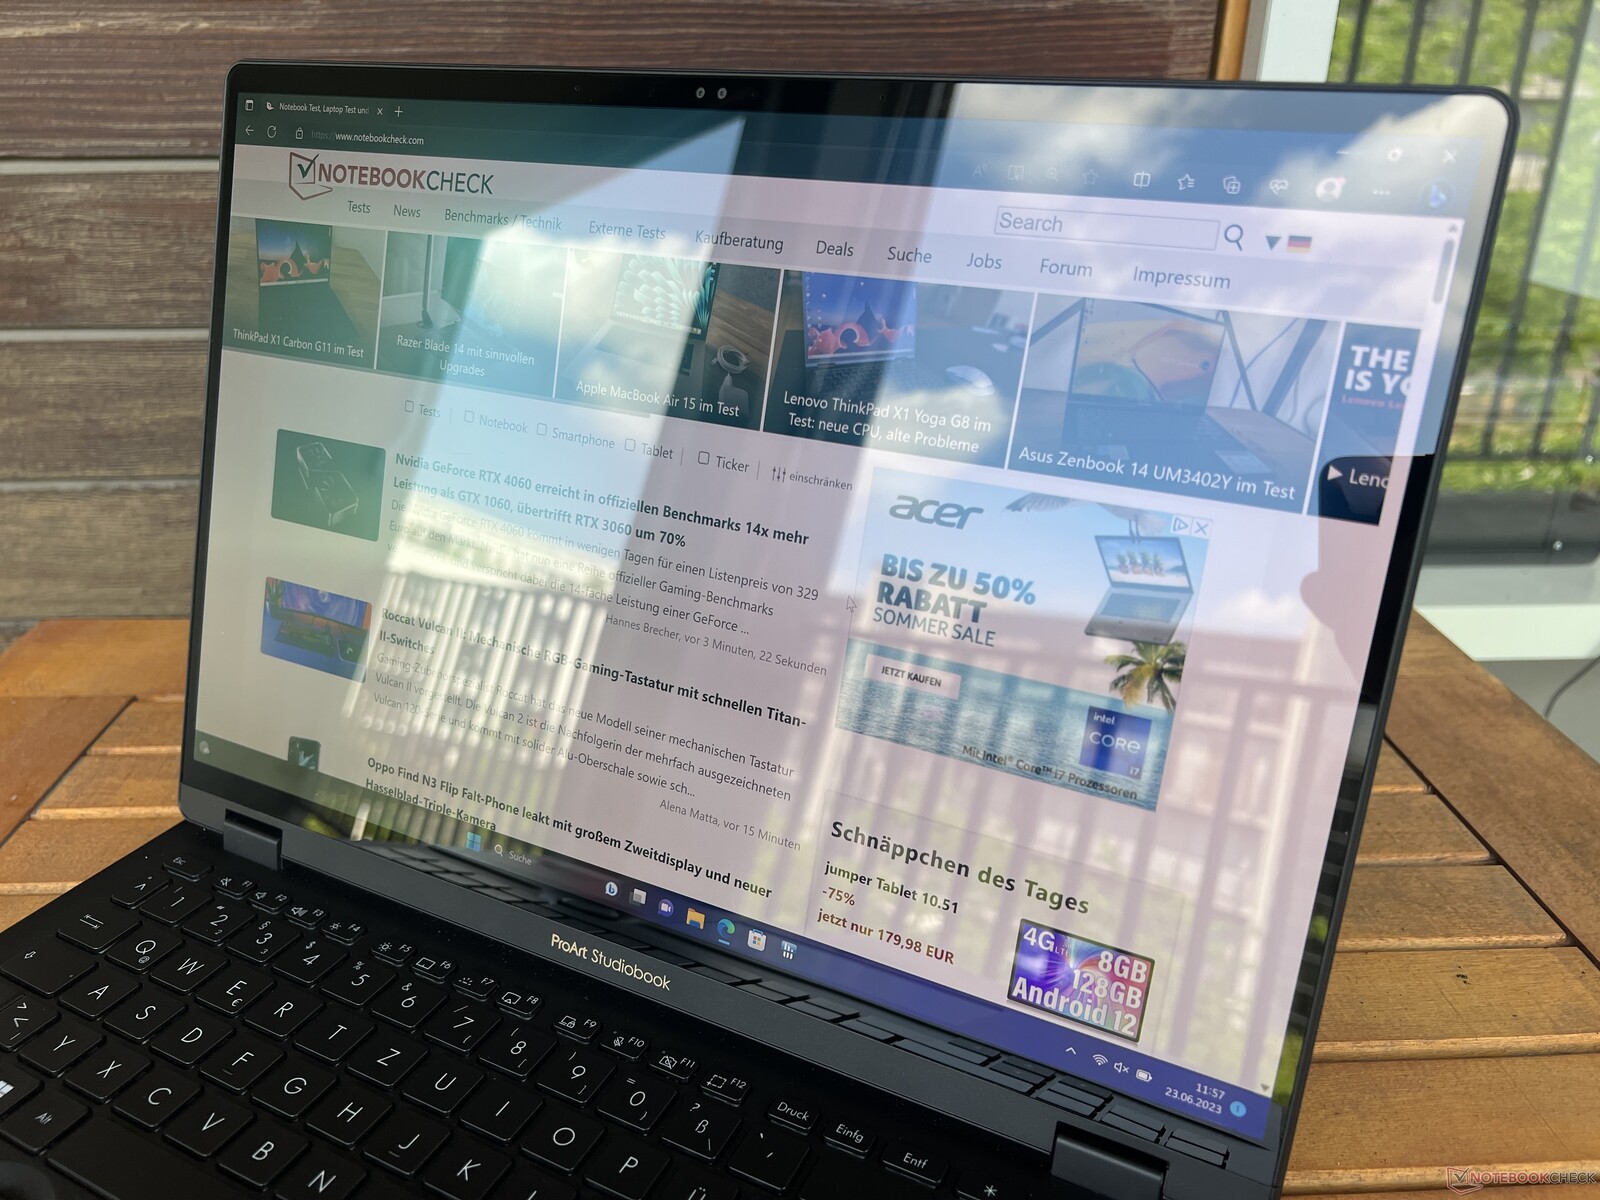
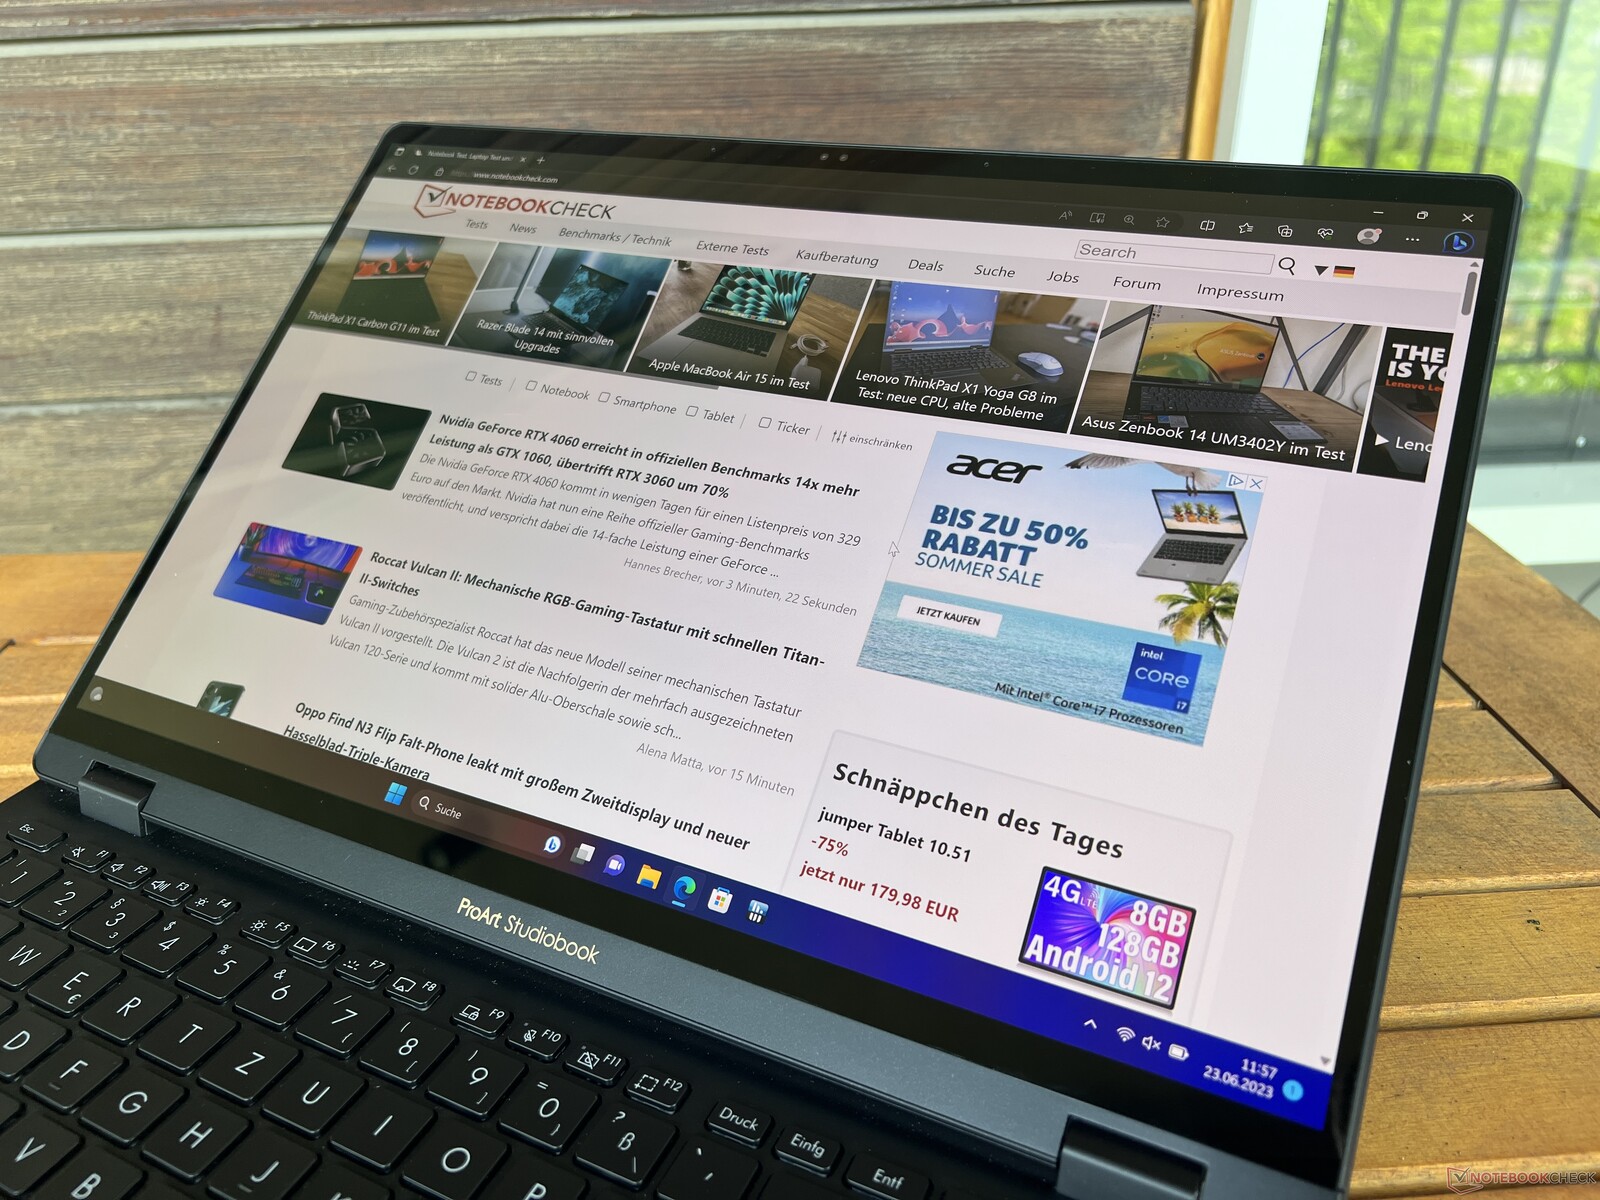
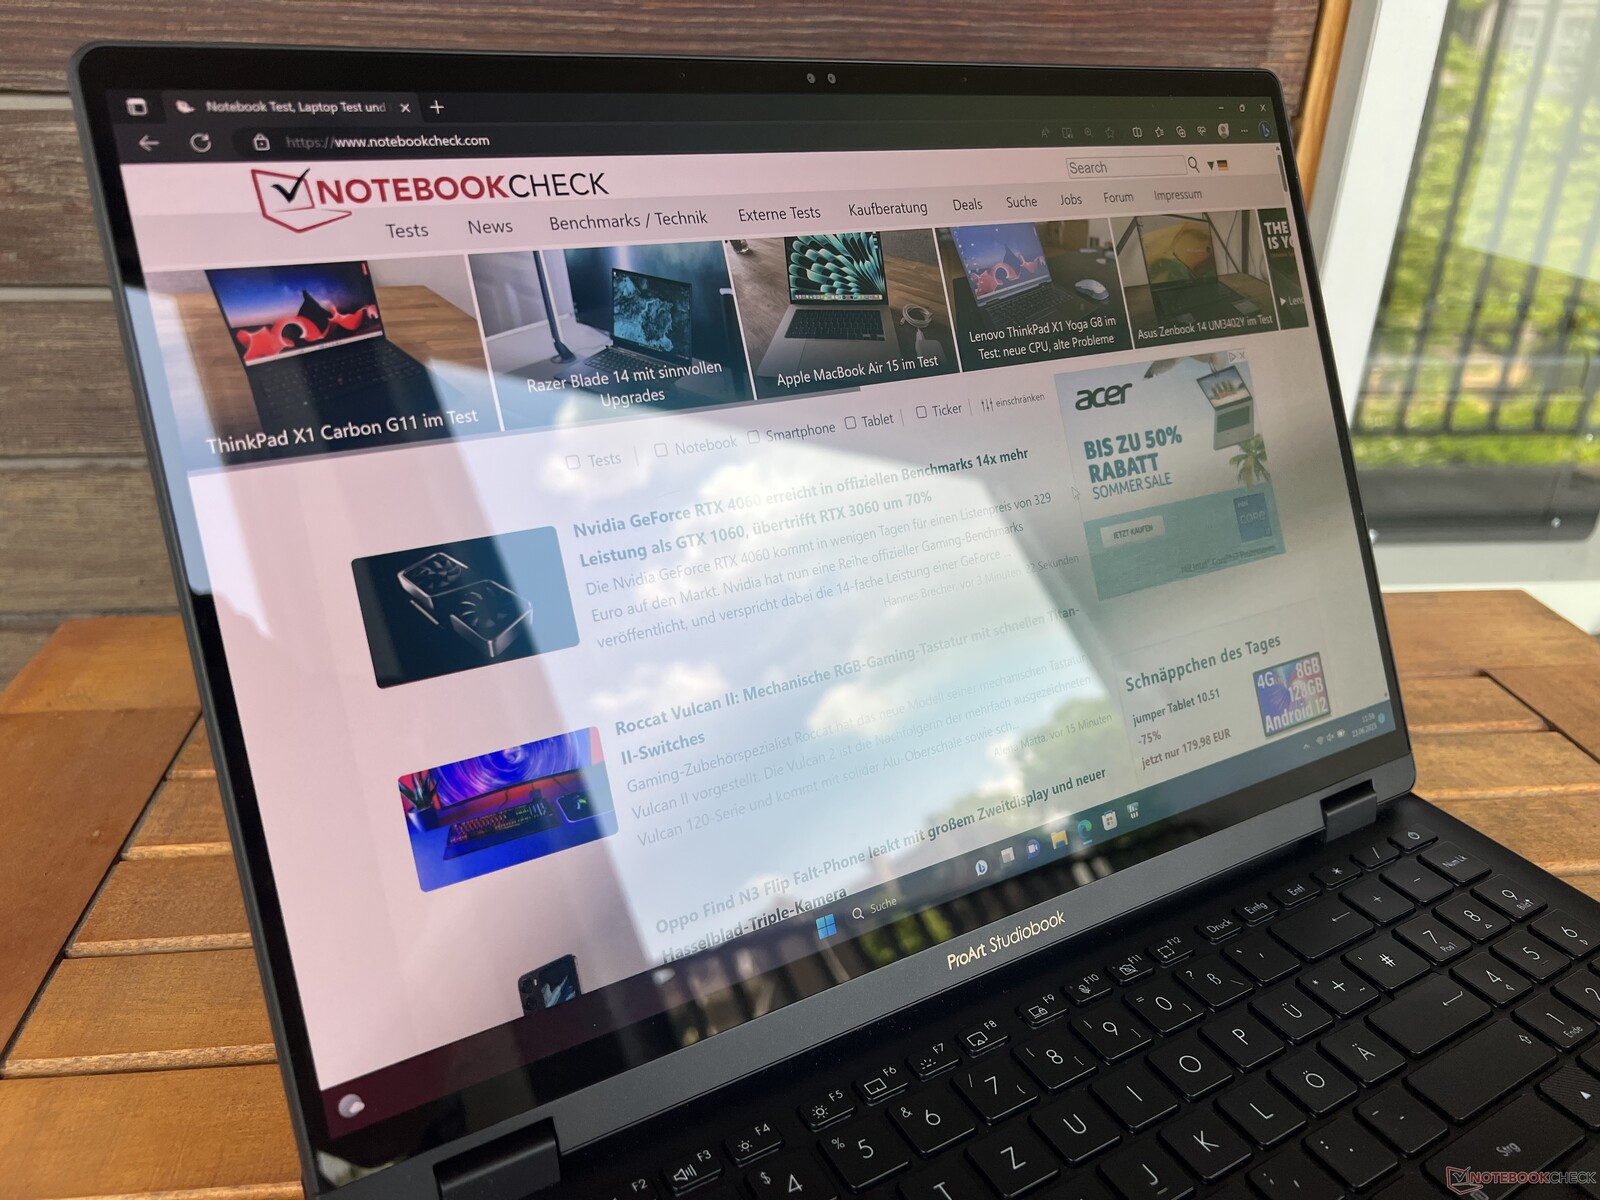
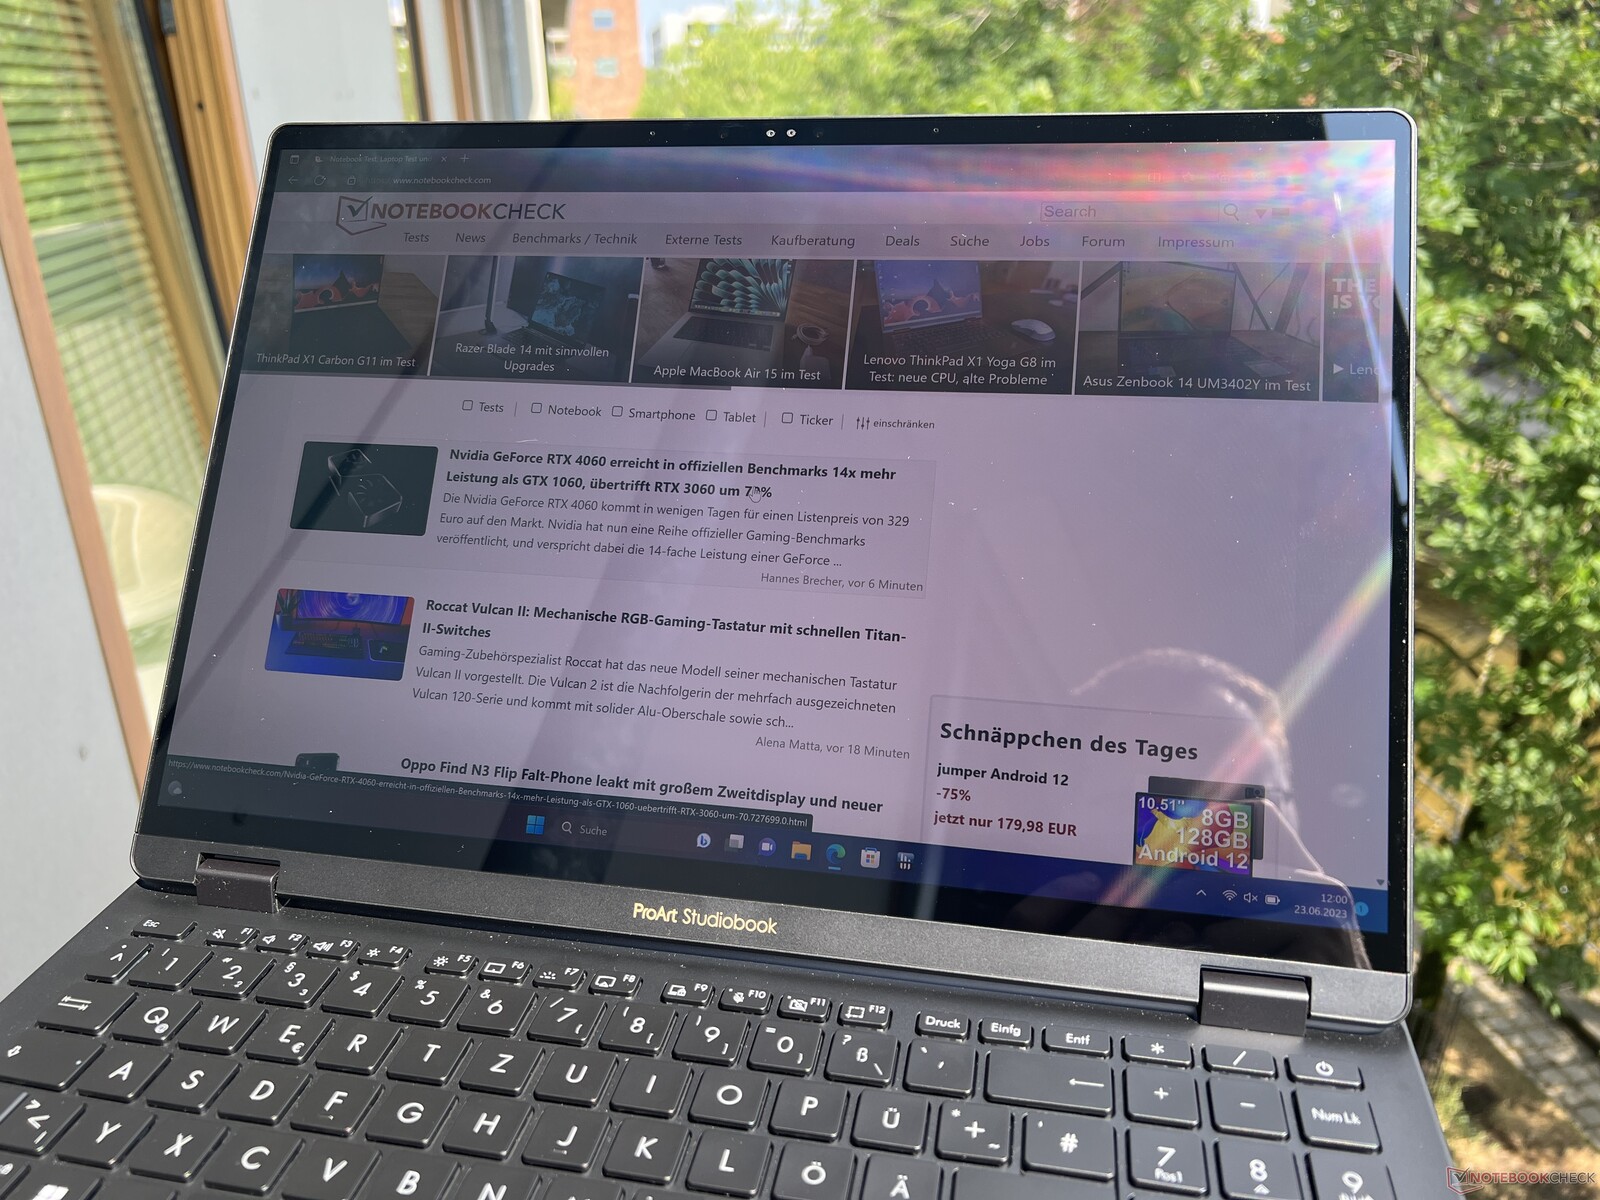
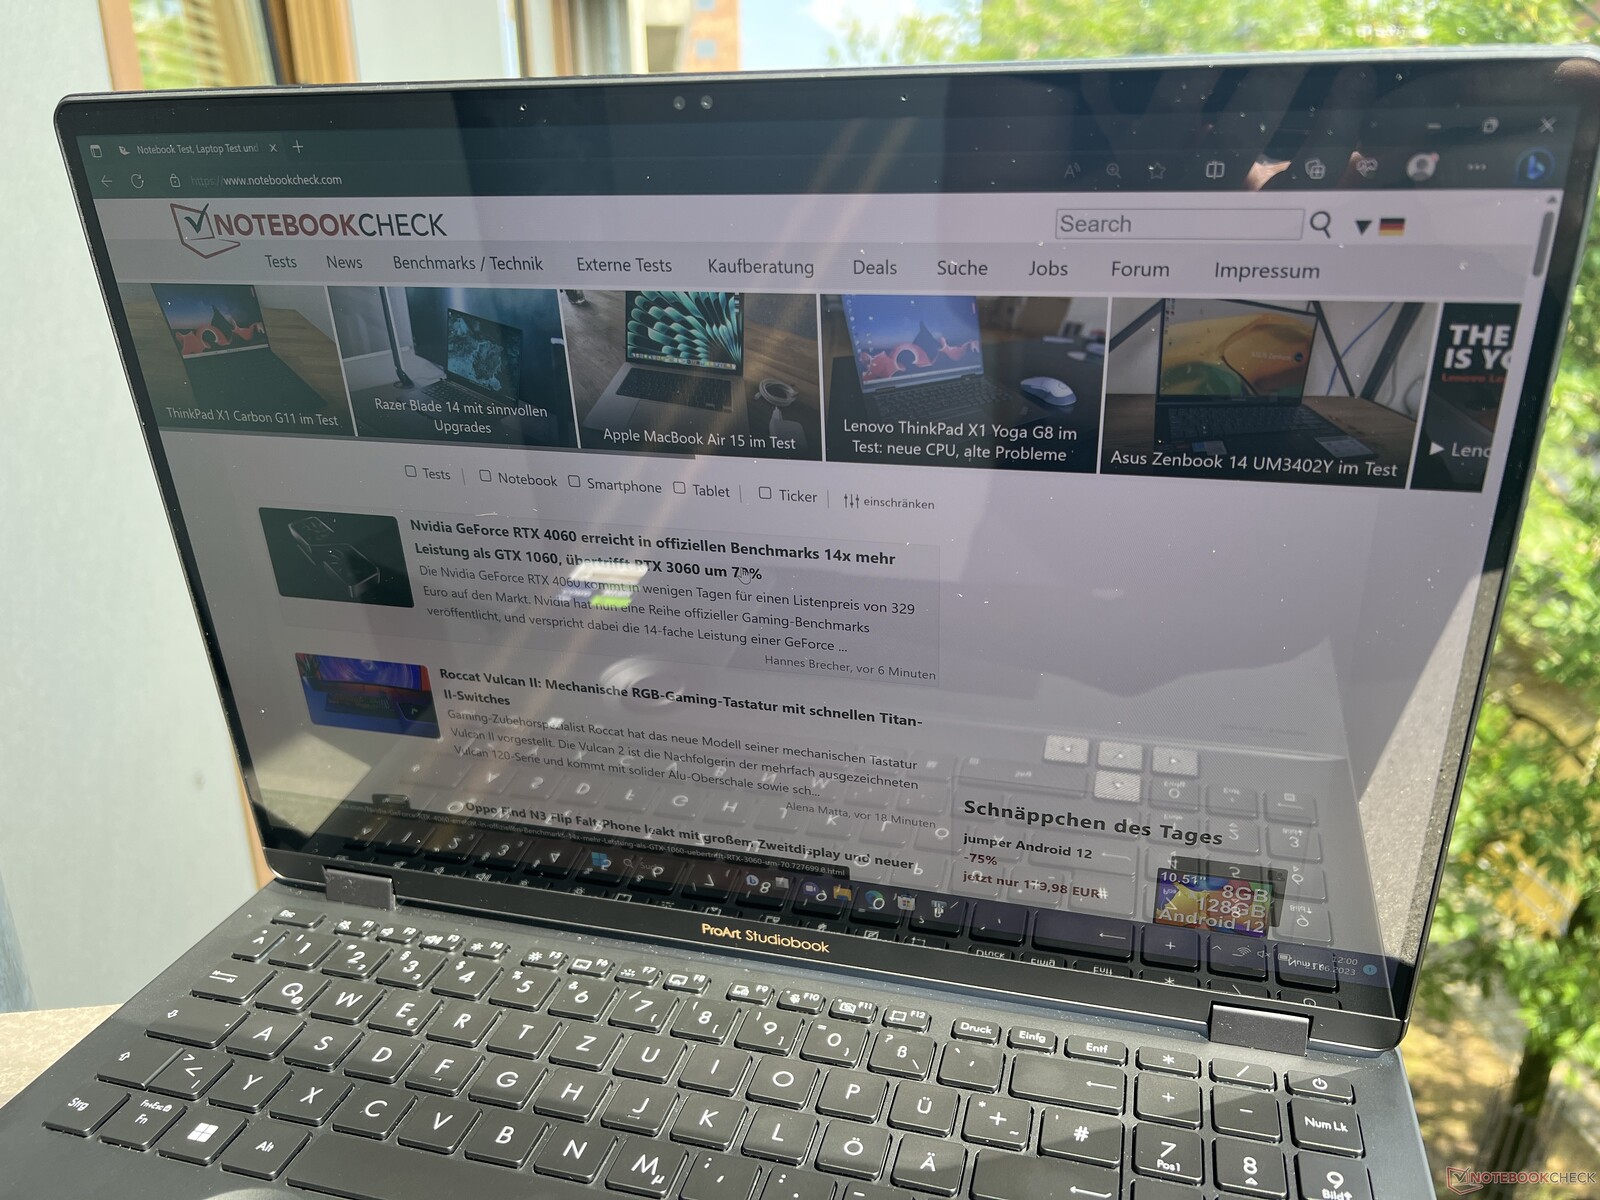
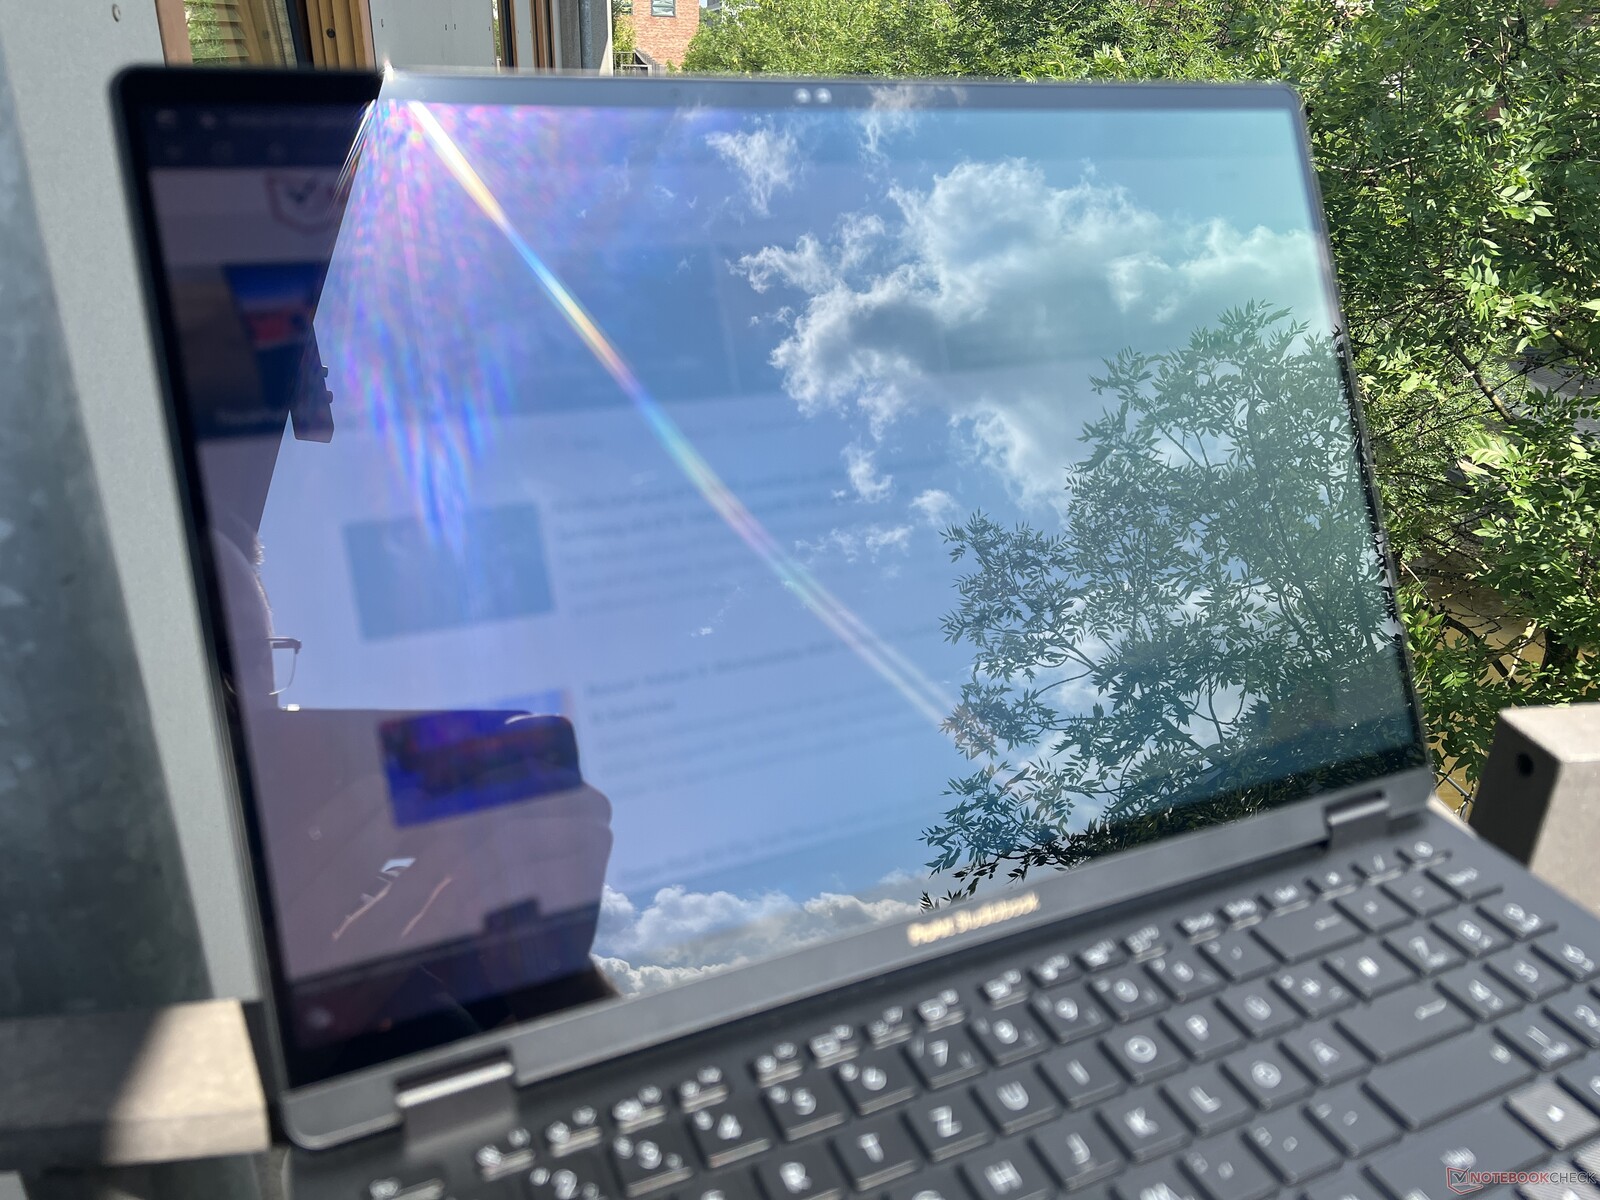
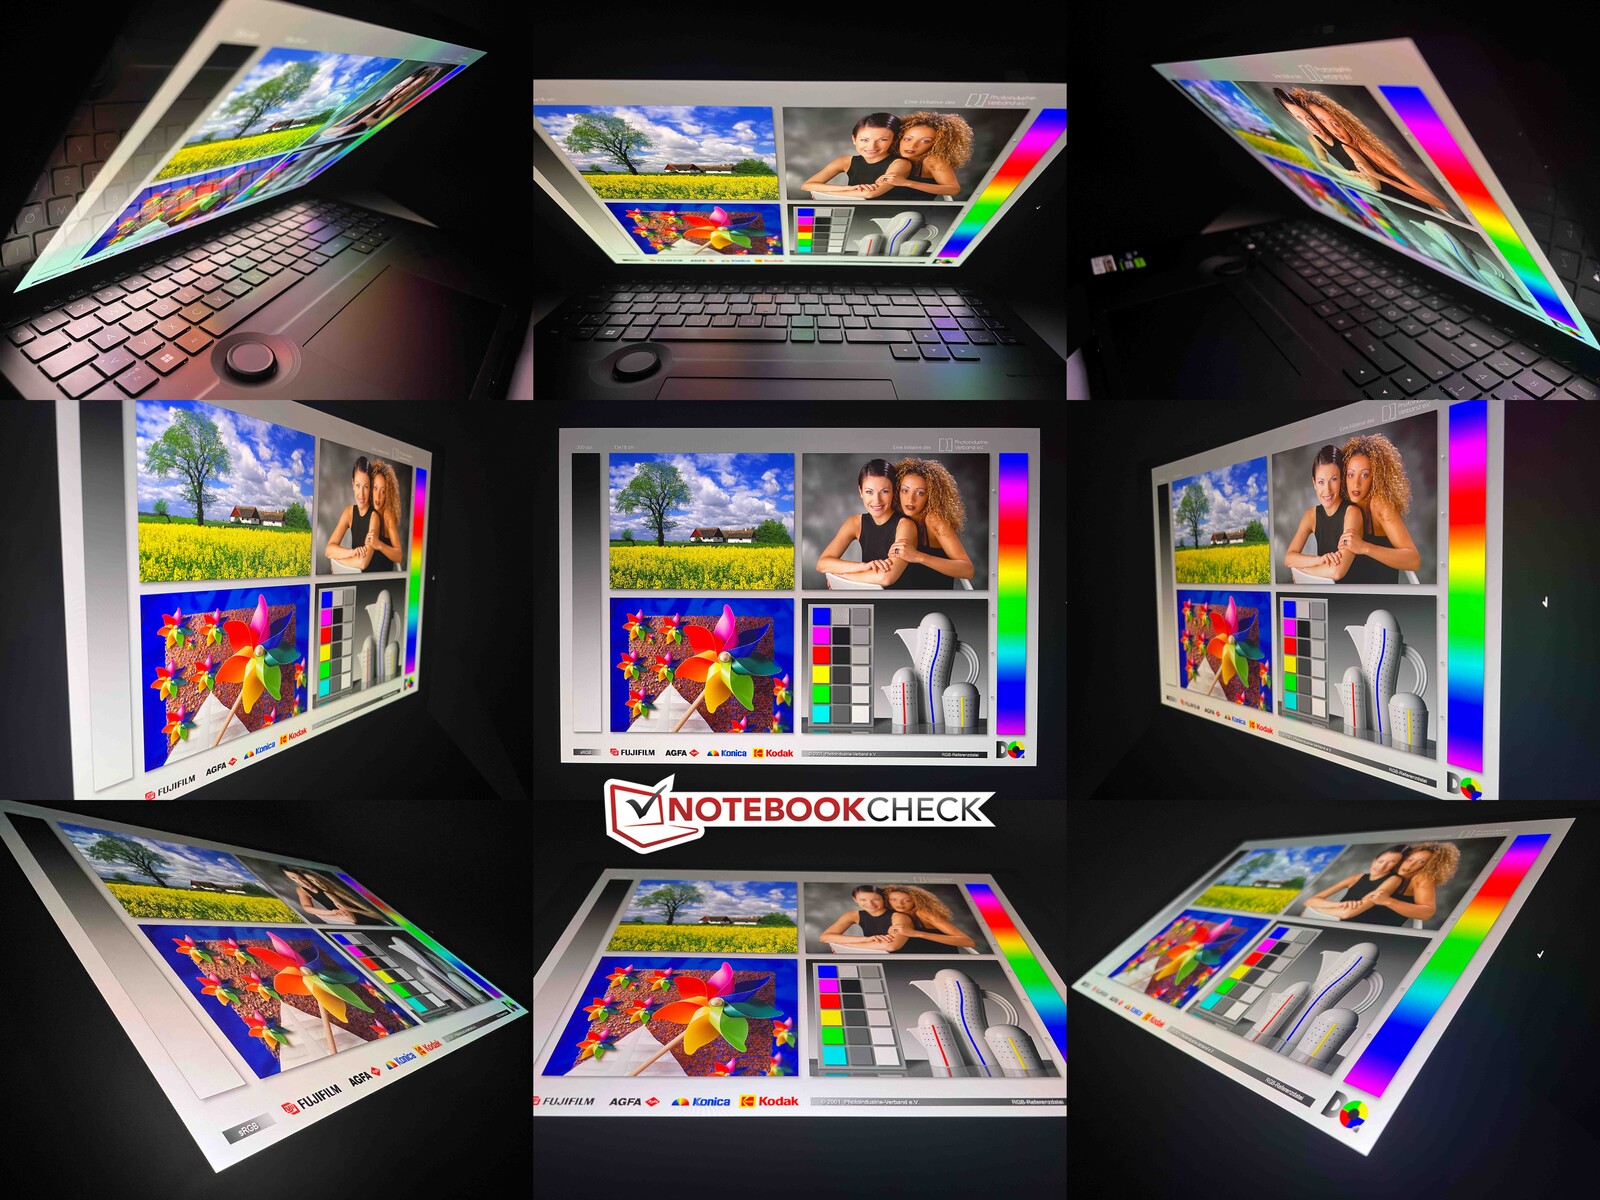
Pekskärmen är mycket reflekterande utomhus, så du bör undvika reflexer från fönster eller ljuskällor både inomhus och utomhus. Det är inte lätt, särskilt inte när solen skiner. Betraktningsvinkelns stabilitet är överlag mycket bra. Det är bara i mycket extrema vinklar som det typiska OLED-blåsticket uppträder.
Prestanda - Raptor Lake-HX & Ada Lovelace
Villkor för testning
Olika energiprofiler finns tillgängliga i den förinstallerade ProArt Creator Hub, som vi har listat i tabellen nedan. Vi utförde mätningarna och riktmärkena mestadels i Performance-läget , men vi tittar också på effekterna av de andra två lägena i vissa avsnitt.
| Energiprofil | CPU-belastning | GPU-belastning | Stresstest | Max. fläktvolym |
|---|---|---|---|---|
| Standard | 157/80 watt | 90 watt | CPU: 30 watt GPU: 80 watt |
47,6 dB(A) |
| Prestanda | 170/130 watt | 130 watt | CPU: 55 watt GPU: 105 watt |
56,7 dB(A) |
| Full hastighet | 170/130 watt | 130 watt | CPU: 64 watt 95 watt |
58,9 dB(A) |
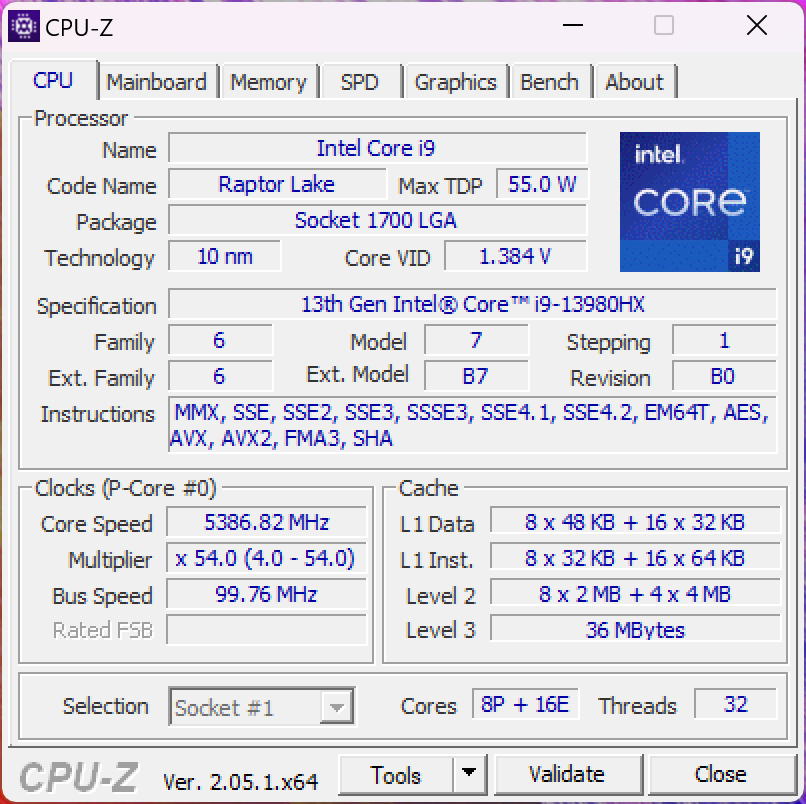
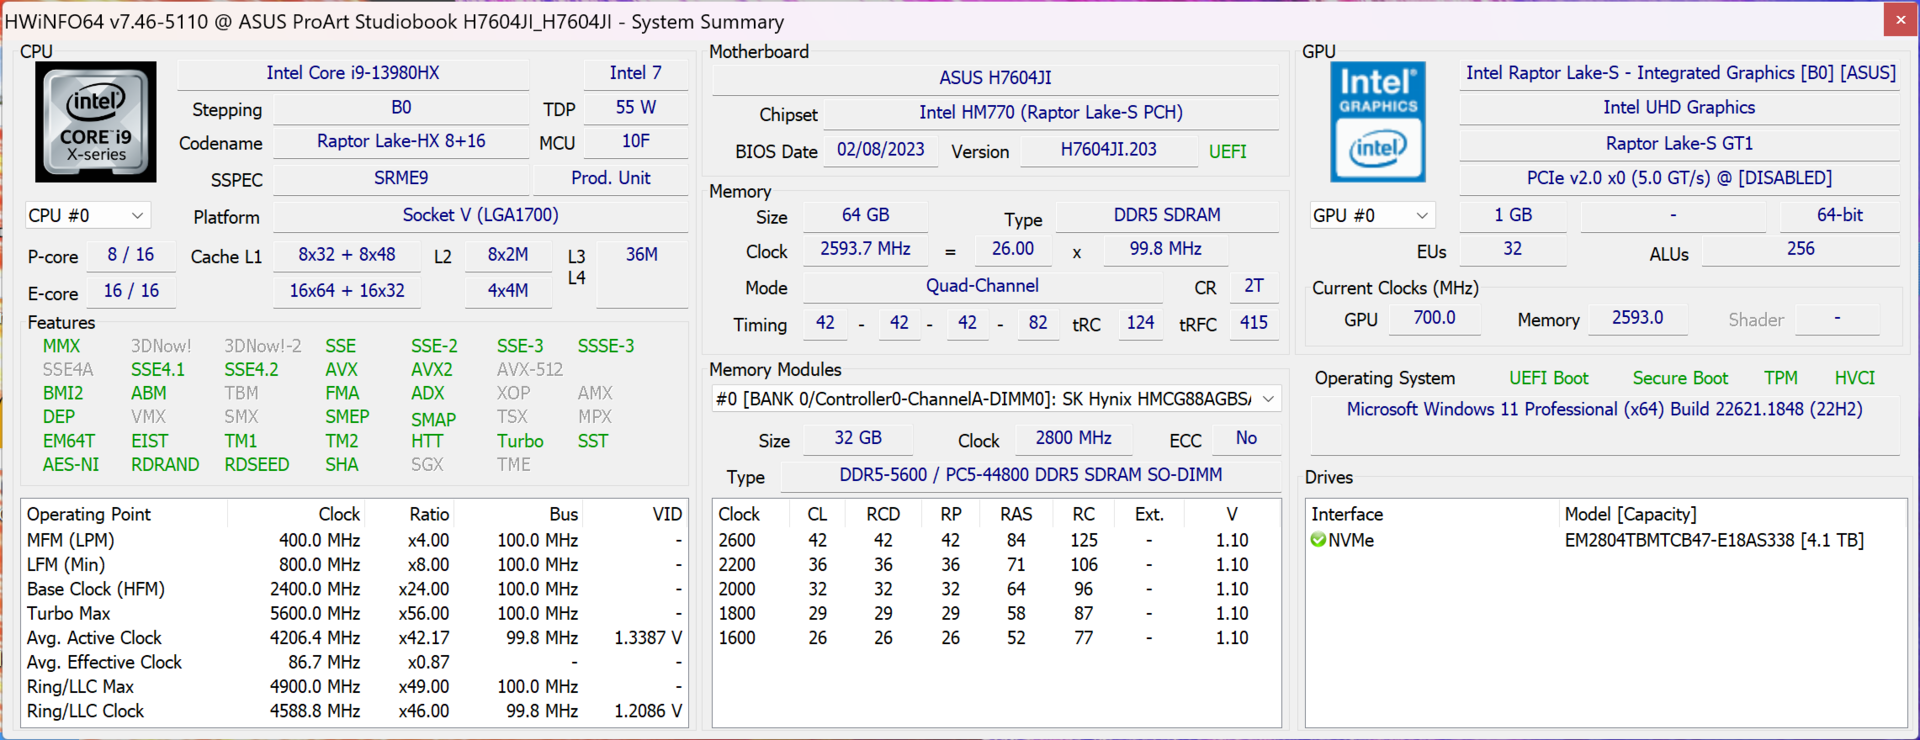
Processor - Core i9-13980HX
Intels nuvarande high-end-modell i Raptor Lake-serien för bärbara datorer, Core i9-13980HX, används som processor. Denna erbjuder 8 snabba prestandakärnor och 16 effektivitetskärnor, vilket är anledningen till att chipet kan bearbeta totalt 32 trådar samtidigt. I Studiobook förbrukar processorn upp till ~170 watt och planar ut på 130 watt efter några minuters ihållande belastning. I stora bärbara speldatorer arbetar processorn lite snabbare, men jämfört med jämförelsegruppen med normala Intel-processorer eller Apple M2 Max har Studiobook en stor fördel. När det gäller enkelkärnig prestanda är Core i9 också före den nya AMD Ryzen 9 7945HX, men den senare erbjuder ännu mer prestanda i flerkärniga tester samtidigt som den också arbetar mer effektivt
.
Bortom sockeln finns det inte mycket kvar att se av den bärbara datorns prestandaförmåga eftersom processorn bara får förbruka en mager 34/26 watt här. I CB R23-multitestet får den bara 11 576 poäng, vilket motsvarar ett underskott på 63%. StudioBook är därmed långsammare på batteriström änMacBook Pro 16 med sin M2 Maxdär det inte finns någon prestandaminskning på batteriström. Fler CPU-riktmärken finns tillgängliga i vår teknikavdelning.
Cinebench R15 Multi Sustained Load
Cinebench R23: Multi Core | Single Core
Cinebench R20: CPU (Multi Core) | CPU (Single Core)
Cinebench R15: CPU Multi 64Bit | CPU Single 64Bit
Blender: v2.79 BMW27 CPU
7-Zip 18.03: 7z b 4 | 7z b 4 -mmt1
Geekbench 5.5: Multi-Core | Single-Core
HWBOT x265 Benchmark v2.2: 4k Preset
LibreOffice : 20 Documents To PDF
R Benchmark 2.5: Overall mean
| CPU Performance rating | |
| Asus Zephyrus Duo 16 GX650PY-NM006W | |
| Asus ProArt Studiobook 16 OLED H7604 | |
| Genomsnitt Intel Core i9-13980HX | |
| Apple MacBook Pro 16 2023 M2 Max -6! | |
| MSI Stealth 17 Studio A13VH-014 | |
| Gigabyte AERO 16 OLED BSF | |
| Genomsnitt av klass Multimedia | |
| Samsung Galaxy Book3 Ultra 16 | |
| Cinebench R23 / Multi Core | |
| Asus Zephyrus Duo 16 GX650PY-NM006W | |
| Asus ProArt Studiobook 16 OLED H7604 | |
| Genomsnitt Intel Core i9-13980HX (28301 - 33052, n=11) | |
| MSI Stealth 17 Studio A13VH-014 | |
| Gigabyte AERO 16 OLED BSF | |
| Genomsnitt av klass Multimedia (4861 - 33362, n=74, senaste 2 åren) | |
| Samsung Galaxy Book3 Ultra 16 | |
| Apple MacBook Pro 16 2023 M2 Max | |
| Cinebench R23 / Single Core | |
| Asus ProArt Studiobook 16 OLED H7604 | |
| Genomsnitt Intel Core i9-13980HX (1825 - 2169, n=9) | |
| Genomsnitt av klass Multimedia (1128 - 2459, n=66, senaste 2 åren) | |
| Asus Zephyrus Duo 16 GX650PY-NM006W | |
| Gigabyte AERO 16 OLED BSF | |
| MSI Stealth 17 Studio A13VH-014 | |
| Samsung Galaxy Book3 Ultra 16 | |
| Apple MacBook Pro 16 2023 M2 Max | |
| Cinebench R20 / CPU (Multi Core) | |
| Asus Zephyrus Duo 16 GX650PY-NM006W | |
| Asus ProArt Studiobook 16 OLED H7604 | |
| Genomsnitt Intel Core i9-13980HX (10353 - 12437, n=10) | |
| MSI Stealth 17 Studio A13VH-014 | |
| Gigabyte AERO 16 OLED BSF | |
| Genomsnitt av klass Multimedia (1887 - 12912, n=57, senaste 2 åren) | |
| Samsung Galaxy Book3 Ultra 16 | |
| Apple MacBook Pro 16 2023 M2 Max | |
| Cinebench R20 / CPU (Single Core) | |
| Asus ProArt Studiobook 16 OLED H7604 | |
| Genomsnitt Intel Core i9-13980HX (717 - 825, n=10) | |
| Asus Zephyrus Duo 16 GX650PY-NM006W | |
| Genomsnitt av klass Multimedia (425 - 853, n=57, senaste 2 åren) | |
| MSI Stealth 17 Studio A13VH-014 | |
| Samsung Galaxy Book3 Ultra 16 | |
| Gigabyte AERO 16 OLED BSF | |
| Apple MacBook Pro 16 2023 M2 Max | |
| Cinebench R15 / CPU Multi 64Bit | |
| Asus Zephyrus Duo 16 GX650PY-NM006W | |
| Genomsnitt Intel Core i9-13980HX (4358 - 5172, n=11) | |
| Asus ProArt Studiobook 16 OLED H7604 | |
| MSI Stealth 17 Studio A13VH-014 | |
| Gigabyte AERO 16 OLED BSF | |
| Genomsnitt av klass Multimedia (856 - 5224, n=61, senaste 2 åren) | |
| Samsung Galaxy Book3 Ultra 16 | |
| Apple MacBook Pro 16 2023 M2 Max | |
| Cinebench R15 / CPU Single 64Bit | |
| Asus ProArt Studiobook 16 OLED H7604 | |
| Asus Zephyrus Duo 16 GX650PY-NM006W | |
| Genomsnitt Intel Core i9-13980HX (289 - 312, n=11) | |
| MSI Stealth 17 Studio A13VH-014 | |
| Genomsnitt av klass Multimedia (184.8 - 326, n=59, senaste 2 åren) | |
| Samsung Galaxy Book3 Ultra 16 | |
| Gigabyte AERO 16 OLED BSF | |
| Apple MacBook Pro 16 2023 M2 Max | |
| Blender / v2.79 BMW27 CPU | |
| Genomsnitt av klass Multimedia (100 - 557, n=58, senaste 2 åren) | |
| Samsung Galaxy Book3 Ultra 16 | |
| Gigabyte AERO 16 OLED BSF | |
| MSI Stealth 17 Studio A13VH-014 | |
| Genomsnitt Intel Core i9-13980HX (97 - 136, n=10) | |
| Asus ProArt Studiobook 16 OLED H7604 | |
| Asus Zephyrus Duo 16 GX650PY-NM006W | |
| 7-Zip 18.03 / 7z b 4 | |
| Asus Zephyrus Duo 16 GX650PY-NM006W | |
| Asus ProArt Studiobook 16 OLED H7604 | |
| Genomsnitt Intel Core i9-13980HX (104616 - 129804, n=10) | |
| MSI Stealth 17 Studio A13VH-014 | |
| Gigabyte AERO 16 OLED BSF | |
| Samsung Galaxy Book3 Ultra 16 | |
| Genomsnitt av klass Multimedia (26062 - 130368, n=55, senaste 2 åren) | |
| 7-Zip 18.03 / 7z b 4 -mmt1 | |
| Asus Zephyrus Duo 16 GX650PY-NM006W | |
| Asus ProArt Studiobook 16 OLED H7604 | |
| Genomsnitt Intel Core i9-13980HX (6230 - 7163, n=10) | |
| MSI Stealth 17 Studio A13VH-014 | |
| Genomsnitt av klass Multimedia (3666 - 7545, n=56, senaste 2 åren) | |
| Gigabyte AERO 16 OLED BSF | |
| Samsung Galaxy Book3 Ultra 16 | |
| Geekbench 5.5 / Multi-Core | |
| Genomsnitt Intel Core i9-13980HX (18475 - 22200, n=10) | |
| Asus ProArt Studiobook 16 OLED H7604 | |
| Asus Zephyrus Duo 16 GX650PY-NM006W | |
| Apple MacBook Pro 16 2023 M2 Max | |
| Gigabyte AERO 16 OLED BSF | |
| MSI Stealth 17 Studio A13VH-014 | |
| Genomsnitt av klass Multimedia (4652 - 20422, n=56, senaste 2 åren) | |
| Samsung Galaxy Book3 Ultra 16 | |
| Geekbench 5.5 / Single-Core | |
| Asus ProArt Studiobook 16 OLED H7604 | |
| Asus Zephyrus Duo 16 GX650PY-NM006W | |
| Genomsnitt Intel Core i9-13980HX (1796 - 2139, n=10) | |
| MSI Stealth 17 Studio A13VH-014 | |
| Apple MacBook Pro 16 2023 M2 Max | |
| Genomsnitt av klass Multimedia (805 - 2974, n=56, senaste 2 åren) | |
| Gigabyte AERO 16 OLED BSF | |
| Samsung Galaxy Book3 Ultra 16 | |
| HWBOT x265 Benchmark v2.2 / 4k Preset | |
| Asus Zephyrus Duo 16 GX650PY-NM006W | |
| Genomsnitt Intel Core i9-13980HX (27 - 33.4, n=9) | |
| Asus ProArt Studiobook 16 OLED H7604 | |
| MSI Stealth 17 Studio A13VH-014 | |
| Gigabyte AERO 16 OLED BSF | |
| Genomsnitt av klass Multimedia (5.26 - 36.1, n=56, senaste 2 åren) | |
| Samsung Galaxy Book3 Ultra 16 | |
| LibreOffice / 20 Documents To PDF | |
| Asus Zephyrus Duo 16 GX650PY-NM006W | |
| Gigabyte AERO 16 OLED BSF | |
| MSI Stealth 17 Studio A13VH-014 | |
| Genomsnitt av klass Multimedia (23.9 - 146.7, n=57, senaste 2 åren) | |
| Samsung Galaxy Book3 Ultra 16 | |
| Asus ProArt Studiobook 16 OLED H7604 | |
| Genomsnitt Intel Core i9-13980HX (35 - 51.4, n=10) | |
| R Benchmark 2.5 / Overall mean | |
| Gigabyte AERO 16 OLED BSF | |
| Samsung Galaxy Book3 Ultra 16 | |
| Genomsnitt av klass Multimedia (0.3604 - 0.947, n=56, senaste 2 åren) | |
| MSI Stealth 17 Studio A13VH-014 | |
| Asus Zephyrus Duo 16 GX650PY-NM006W | |
| Genomsnitt Intel Core i9-13980HX (0.3793 - 0.4462, n=10) | |
| Asus ProArt Studiobook 16 OLED H7604 | |
* ... mindre är bättre
AIDA64: FP32 Ray-Trace | FPU Julia | CPU SHA3 | CPU Queen | FPU SinJulia | FPU Mandel | CPU AES | CPU ZLib | FP64 Ray-Trace | CPU PhotoWorxx
| Performance rating | |
| Asus ProArt Studiobook 16 OLED H7604 | |
| Genomsnitt Intel Core i9-13980HX | |
| Gigabyte AERO 16 OLED BSF | |
| MSI Stealth 17 Studio A13VH-014 | |
| Genomsnitt av klass Multimedia | |
| Samsung Galaxy Book3 Ultra 16 | |
| AIDA64 / FP32 Ray-Trace | |
| Asus ProArt Studiobook 16 OLED H7604 | |
| Genomsnitt Intel Core i9-13980HX (21332 - 29553, n=9) | |
| MSI Stealth 17 Studio A13VH-014 | |
| Gigabyte AERO 16 OLED BSF | |
| Genomsnitt av klass Multimedia (2214 - 50388, n=53, senaste 2 åren) | |
| Samsung Galaxy Book3 Ultra 16 | |
| AIDA64 / FPU Julia | |
| Asus ProArt Studiobook 16 OLED H7604 | |
| Genomsnitt Intel Core i9-13980HX (108001 - 148168, n=9) | |
| MSI Stealth 17 Studio A13VH-014 | |
| Gigabyte AERO 16 OLED BSF | |
| Genomsnitt av klass Multimedia (12867 - 201874, n=54, senaste 2 åren) | |
| Samsung Galaxy Book3 Ultra 16 | |
| AIDA64 / CPU SHA3 | |
| Asus ProArt Studiobook 16 OLED H7604 | |
| Genomsnitt Intel Core i9-13980HX (5264 - 7142, n=9) | |
| MSI Stealth 17 Studio A13VH-014 | |
| Gigabyte AERO 16 OLED BSF | |
| Genomsnitt av klass Multimedia (626 - 8623, n=54, senaste 2 åren) | |
| Samsung Galaxy Book3 Ultra 16 | |
| AIDA64 / CPU Queen | |
| Genomsnitt Intel Core i9-13980HX (126758 - 143409, n=9) | |
| Asus ProArt Studiobook 16 OLED H7604 | |
| Samsung Galaxy Book3 Ultra 16 | |
| MSI Stealth 17 Studio A13VH-014 | |
| Gigabyte AERO 16 OLED BSF | |
| Genomsnitt av klass Multimedia (13483 - 181505, n=41, senaste 2 åren) | |
| AIDA64 / FPU SinJulia | |
| Genomsnitt Intel Core i9-13980HX (13785 - 17117, n=9) | |
| Asus ProArt Studiobook 16 OLED H7604 | |
| MSI Stealth 17 Studio A13VH-014 | |
| Gigabyte AERO 16 OLED BSF | |
| Samsung Galaxy Book3 Ultra 16 | |
| Genomsnitt av klass Multimedia (886 - 28794, n=54, senaste 2 åren) | |
| AIDA64 / FPU Mandel | |
| Asus ProArt Studiobook 16 OLED H7604 | |
| Genomsnitt Intel Core i9-13980HX (53398 - 73758, n=9) | |
| MSI Stealth 17 Studio A13VH-014 | |
| Gigabyte AERO 16 OLED BSF | |
| Genomsnitt av klass Multimedia (6395 - 105740, n=53, senaste 2 åren) | |
| Samsung Galaxy Book3 Ultra 16 | |
| AIDA64 / CPU AES | |
| Gigabyte AERO 16 OLED BSF | |
| Asus ProArt Studiobook 16 OLED H7604 | |
| Genomsnitt Intel Core i9-13980HX (105169 - 136520, n=9) | |
| MSI Stealth 17 Studio A13VH-014 | |
| Samsung Galaxy Book3 Ultra 16 | |
| Genomsnitt av klass Multimedia (8171 - 126790, n=54, senaste 2 åren) | |
| AIDA64 / CPU ZLib | |
| Asus ProArt Studiobook 16 OLED H7604 | |
| Genomsnitt Intel Core i9-13980HX (1513 - 2039, n=9) | |
| MSI Stealth 17 Studio A13VH-014 | |
| Gigabyte AERO 16 OLED BSF | |
| Samsung Galaxy Book3 Ultra 16 | |
| Genomsnitt av klass Multimedia (143.8 - 2022, n=54, senaste 2 åren) | |
| AIDA64 / FP64 Ray-Trace | |
| Genomsnitt Intel Core i9-13980HX (11431 - 16325, n=9) | |
| Asus ProArt Studiobook 16 OLED H7604 | |
| MSI Stealth 17 Studio A13VH-014 | |
| Gigabyte AERO 16 OLED BSF | |
| Genomsnitt av klass Multimedia (1014 - 26875, n=54, senaste 2 åren) | |
| Samsung Galaxy Book3 Ultra 16 | |
| AIDA64 / CPU PhotoWorxx | |
| MSI Stealth 17 Studio A13VH-014 | |
| Genomsnitt av klass Multimedia (8187 - 88154, n=54, senaste 2 åren) | |
| Asus ProArt Studiobook 16 OLED H7604 | |
| Samsung Galaxy Book3 Ultra 16 | |
| Genomsnitt Intel Core i9-13980HX (37069 - 52949, n=9) | |
| Gigabyte AERO 16 OLED BSF | |
Systemets prestanda
Systemets prestanda är utmärkt, både i de syntetiska referenserna och i praktiken. Inga problem uppstod heller under testningen.
CrossMark: Overall | Productivity | Creativity | Responsiveness
| PCMark 10 / Score | |
| Asus Zephyrus Duo 16 GX650PY-NM006W | |
| Gigabyte AERO 16 OLED BSF | |
| Genomsnitt av klass Multimedia (4325 - 10386, n=52, senaste 2 åren) | |
| Asus ProArt Studiobook 16 OLED H7604 | |
| Genomsnitt Intel Core i9-13980HX, NVIDIA GeForce RTX 4070 Laptop GPU (n=1) | |
| MSI Stealth 17 Studio A13VH-014 | |
| Samsung Galaxy Book3 Ultra 16 | |
| PCMark 10 / Essentials | |
| Asus Zephyrus Duo 16 GX650PY-NM006W | |
| Gigabyte AERO 16 OLED BSF | |
| Asus ProArt Studiobook 16 OLED H7604 | |
| Genomsnitt Intel Core i9-13980HX, NVIDIA GeForce RTX 4070 Laptop GPU (n=1) | |
| Samsung Galaxy Book3 Ultra 16 | |
| Genomsnitt av klass Multimedia (8025 - 11664, n=51, senaste 2 åren) | |
| MSI Stealth 17 Studio A13VH-014 | |
| PCMark 10 / Productivity | |
| Asus Zephyrus Duo 16 GX650PY-NM006W | |
| Genomsnitt av klass Multimedia (7323 - 18233, n=51, senaste 2 åren) | |
| MSI Stealth 17 Studio A13VH-014 | |
| Asus ProArt Studiobook 16 OLED H7604 | |
| Genomsnitt Intel Core i9-13980HX, NVIDIA GeForce RTX 4070 Laptop GPU (n=1) | |
| Gigabyte AERO 16 OLED BSF | |
| Samsung Galaxy Book3 Ultra 16 | |
| PCMark 10 / Digital Content Creation | |
| Asus Zephyrus Duo 16 GX650PY-NM006W | |
| Gigabyte AERO 16 OLED BSF | |
| MSI Stealth 17 Studio A13VH-014 | |
| Asus ProArt Studiobook 16 OLED H7604 | |
| Genomsnitt Intel Core i9-13980HX, NVIDIA GeForce RTX 4070 Laptop GPU (n=1) | |
| Genomsnitt av klass Multimedia (3651 - 16240, n=51, senaste 2 åren) | |
| Samsung Galaxy Book3 Ultra 16 | |
| CrossMark / Overall | |
| Asus ProArt Studiobook 16 OLED H7604 | |
| Genomsnitt Intel Core i9-13980HX, NVIDIA GeForce RTX 4070 Laptop GPU (n=1) | |
| Asus Zephyrus Duo 16 GX650PY-NM006W | |
| Apple MacBook Pro 16 2023 M2 Max | |
| Gigabyte AERO 16 OLED BSF | |
| Genomsnitt av klass Multimedia (866 - 2728, n=60, senaste 2 åren) | |
| MSI Stealth 17 Studio A13VH-014 | |
| Samsung Galaxy Book3 Ultra 16 | |
| CrossMark / Productivity | |
| Asus ProArt Studiobook 16 OLED H7604 | |
| Genomsnitt Intel Core i9-13980HX, NVIDIA GeForce RTX 4070 Laptop GPU (n=1) | |
| Asus Zephyrus Duo 16 GX650PY-NM006W | |
| Gigabyte AERO 16 OLED BSF | |
| Genomsnitt av klass Multimedia (931 - 2489, n=60, senaste 2 åren) | |
| MSI Stealth 17 Studio A13VH-014 | |
| Apple MacBook Pro 16 2023 M2 Max | |
| Samsung Galaxy Book3 Ultra 16 | |
| CrossMark / Creativity | |
| Apple MacBook Pro 16 2023 M2 Max | |
| Asus ProArt Studiobook 16 OLED H7604 | |
| Genomsnitt Intel Core i9-13980HX, NVIDIA GeForce RTX 4070 Laptop GPU (n=1) | |
| Asus Zephyrus Duo 16 GX650PY-NM006W | |
| Genomsnitt av klass Multimedia (907 - 3465, n=60, senaste 2 åren) | |
| Gigabyte AERO 16 OLED BSF | |
| MSI Stealth 17 Studio A13VH-014 | |
| Samsung Galaxy Book3 Ultra 16 | |
| CrossMark / Responsiveness | |
| Gigabyte AERO 16 OLED BSF | |
| Asus ProArt Studiobook 16 OLED H7604 | |
| Genomsnitt Intel Core i9-13980HX, NVIDIA GeForce RTX 4070 Laptop GPU (n=1) | |
| Asus Zephyrus Duo 16 GX650PY-NM006W | |
| MSI Stealth 17 Studio A13VH-014 | |
| Genomsnitt av klass Multimedia (605 - 2024, n=60, senaste 2 åren) | |
| Samsung Galaxy Book3 Ultra 16 | |
| Apple MacBook Pro 16 2023 M2 Max | |
| PCMark 10 Score | 7491 poäng | |
Hjälp | ||
| AIDA64 / Memory Copy | |
| Genomsnitt av klass Multimedia (11299 - 132135, n=54, senaste 2 åren) | |
| Asus ProArt Studiobook 16 OLED H7604 | |
| MSI Stealth 17 Studio A13VH-014 | |
| Samsung Galaxy Book3 Ultra 16 | |
| Genomsnitt Intel Core i9-13980HX (62189 - 80776, n=9) | |
| Gigabyte AERO 16 OLED BSF | |
| AIDA64 / Memory Read | |
| Genomsnitt av klass Multimedia (11624 - 174586, n=54, senaste 2 åren) | |
| Asus ProArt Studiobook 16 OLED H7604 | |
| Genomsnitt Intel Core i9-13980HX (62624 - 89096, n=9) | |
| MSI Stealth 17 Studio A13VH-014 | |
| Samsung Galaxy Book3 Ultra 16 | |
| Gigabyte AERO 16 OLED BSF | |
| AIDA64 / Memory Write | |
| Samsung Galaxy Book3 Ultra 16 | |
| Genomsnitt av klass Multimedia (11755 - 134998, n=54, senaste 2 åren) | |
| MSI Stealth 17 Studio A13VH-014 | |
| Asus ProArt Studiobook 16 OLED H7604 | |
| Genomsnitt Intel Core i9-13980HX (59912 - 79917, n=9) | |
| Gigabyte AERO 16 OLED BSF | |
| AIDA64 / Memory Latency | |
| Genomsnitt av klass Multimedia (7 - 535, n=53, senaste 2 åren) | |
| Samsung Galaxy Book3 Ultra 16 | |
| Gigabyte AERO 16 OLED BSF | |
| MSI Stealth 17 Studio A13VH-014 | |
| Genomsnitt Intel Core i9-13980HX (79.4 - 93.2, n=9) | |
| Asus ProArt Studiobook 16 OLED H7604 | |
* ... mindre är bättre
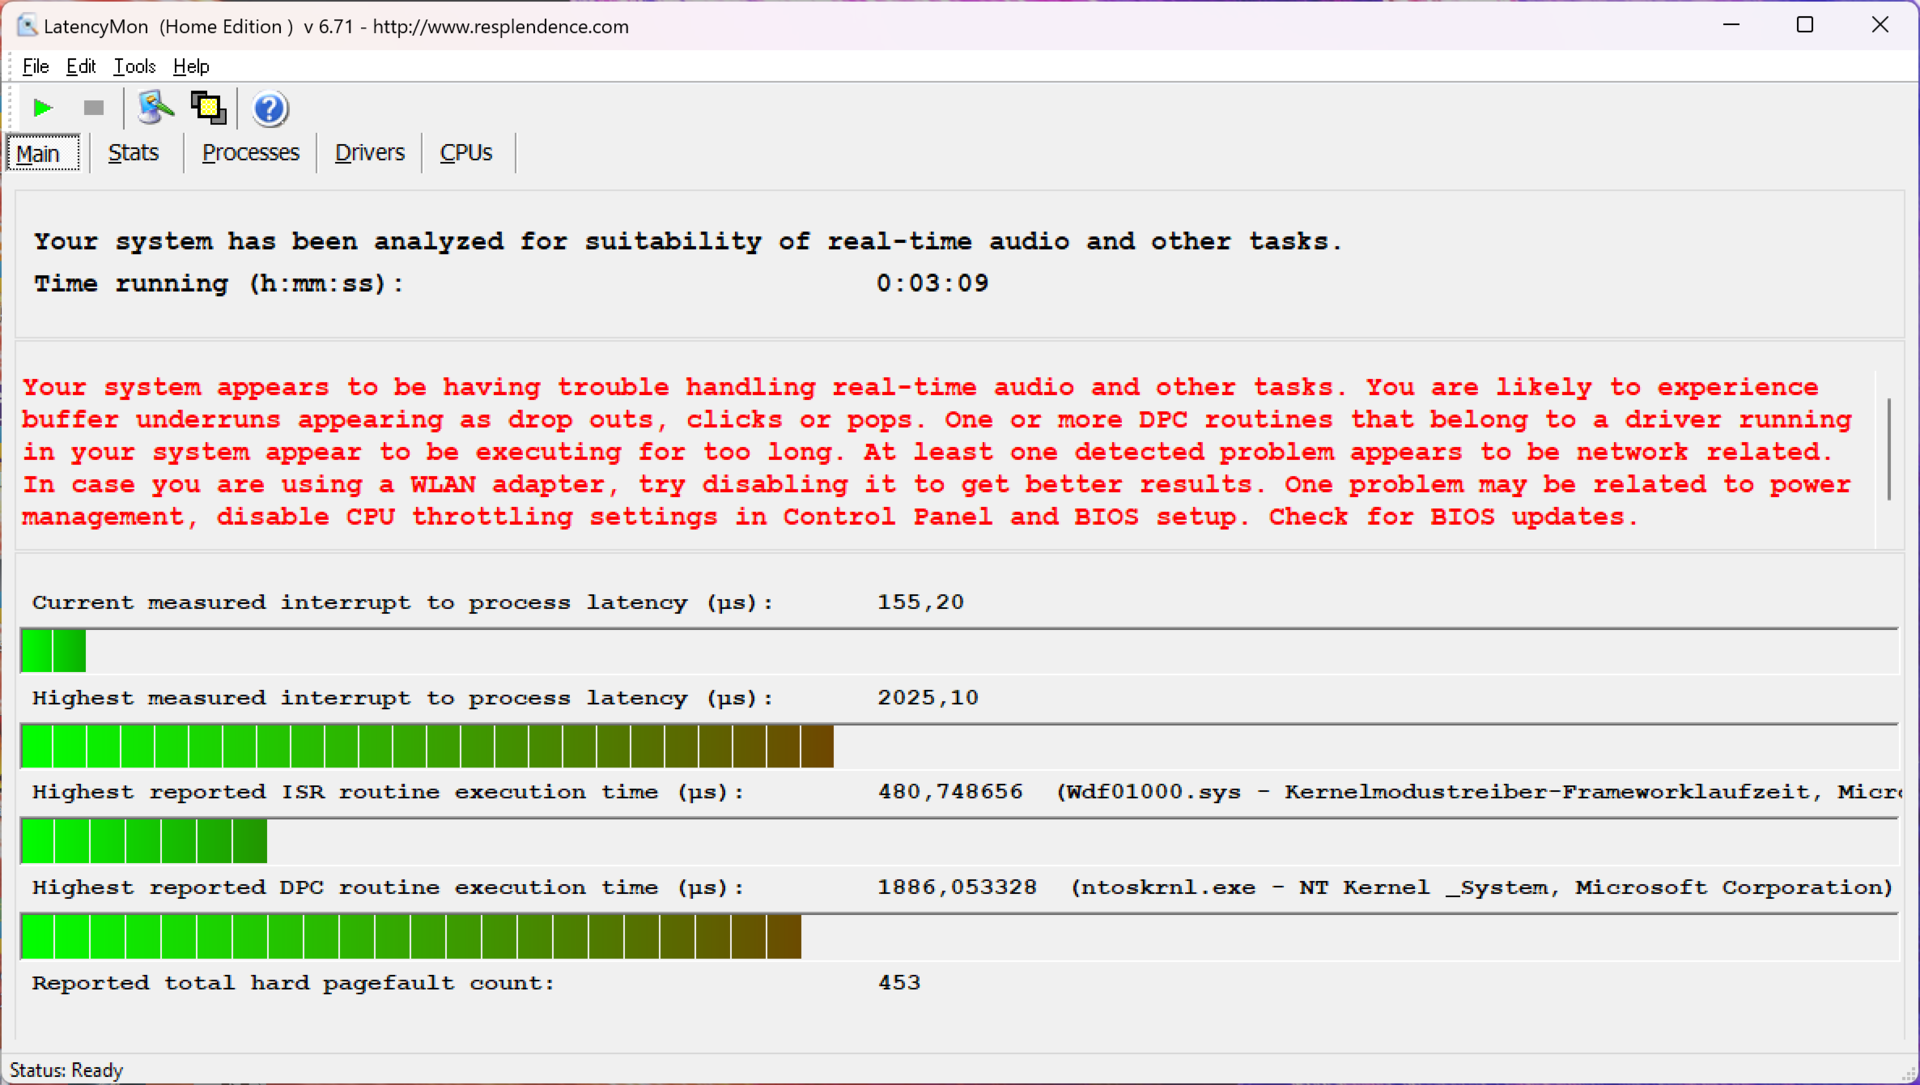
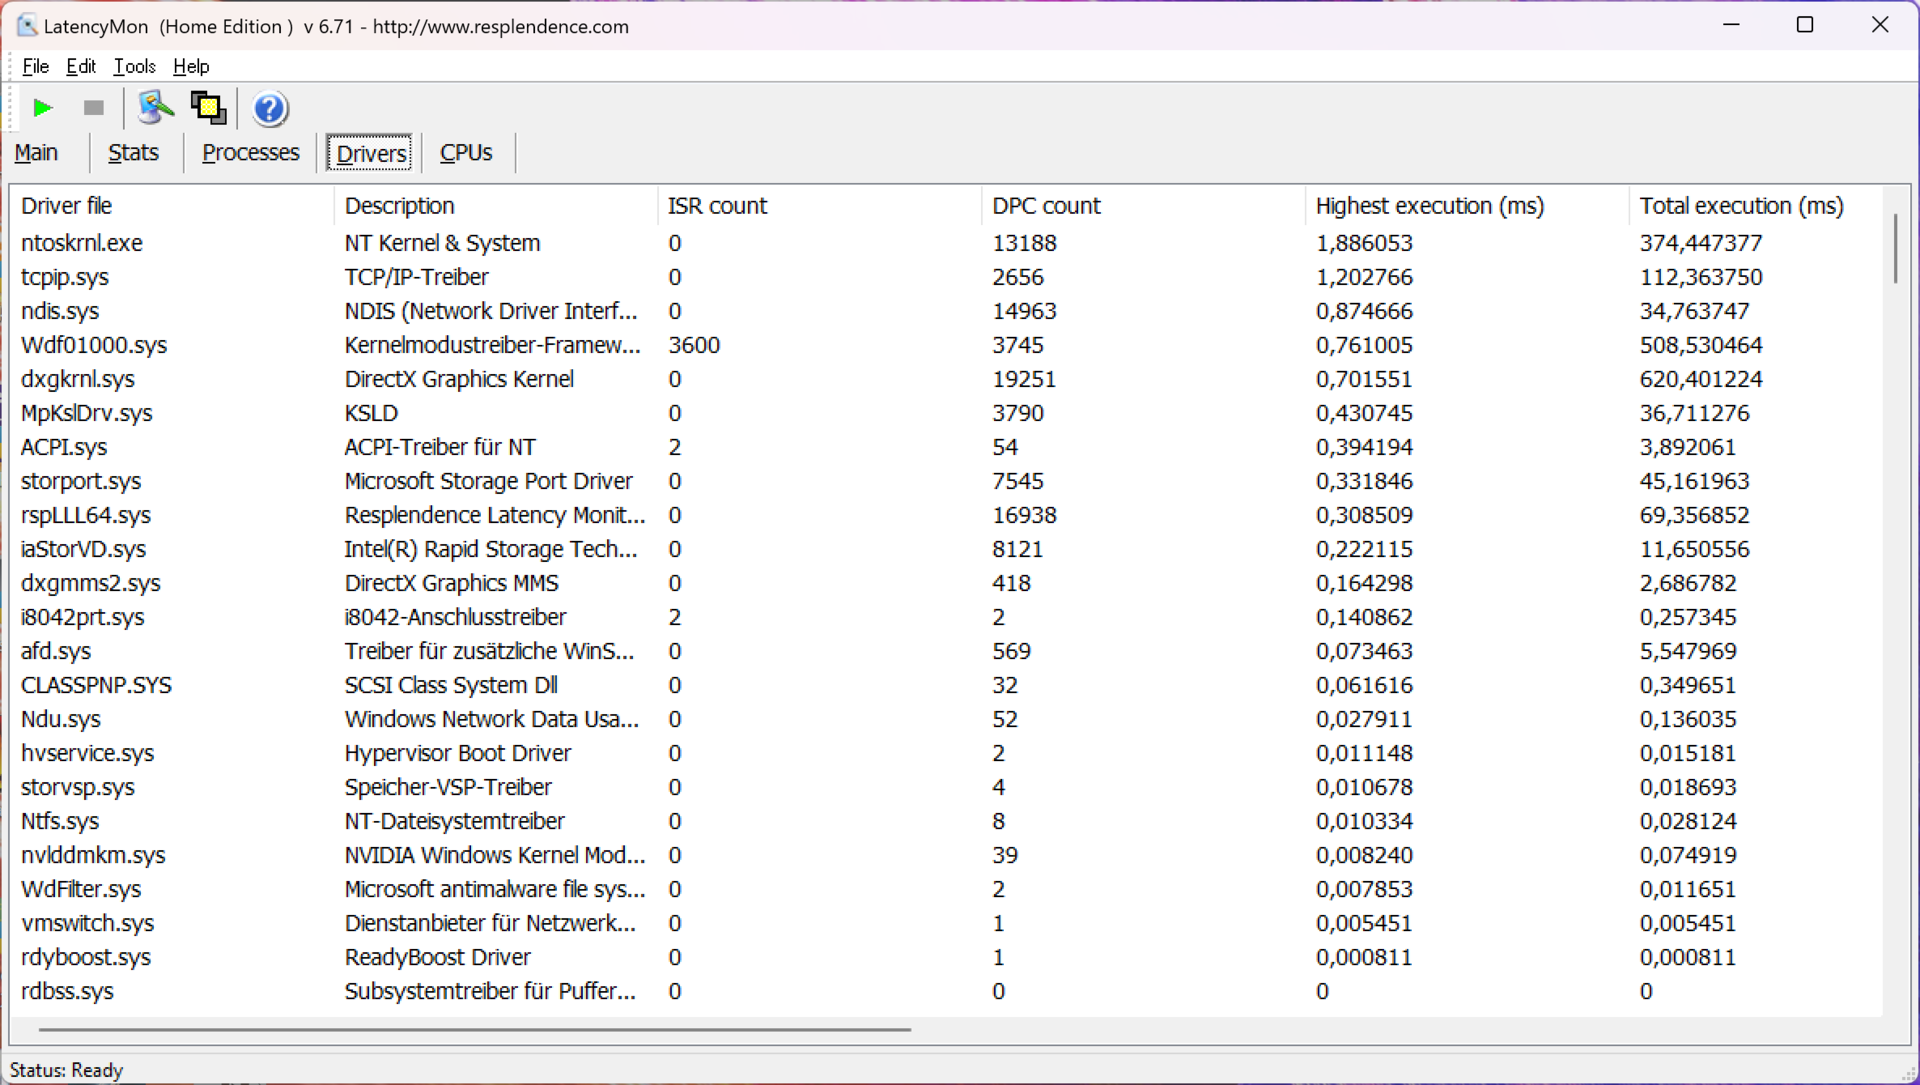
DPC-fördröjning
Studiobook är inte särskilt lämplig för ljudapplikationer i realtid. Höga latenser uppstod under den aktuella BIOS-versionen i vårt standardiserade latens-test.
| DPC Latencies / LatencyMon - interrupt to process latency (max), Web, Youtube, Prime95 | |
| Asus Zephyrus Duo 16 GX650PY-NM006W | |
| Samsung Galaxy Book3 Ultra 16 | |
| MSI Stealth 17 Studio A13VH-014 | |
| Asus ProArt Studiobook 16 OLED H7604 | |
| Gigabyte AERO 16 OLED BSF | |
* ... mindre är bättre
Lagringsenheter
En snabb PCIe 4.0 SSD från Phison används i vår testenhet, som erbjuder en enorm lagringskapacitet på 4 TB. Av detta är 3,63 TB fortfarande tillgängligt efter den första uppstarten. Enheten är mycket snabb med överföringshastigheter på mer än 7 GB/s och framför allt kan prestandan bibehållas konstant, även under permanent belastning. Detta är inte på något sätt standard. Studiobook 16 erbjuder dessutom ytterligare en M.2 2280-kortplats, som också är ansluten via det snabba PCIe 4.0-gränssnittet. Fler SSD-riktmärken listashär.

* ... mindre är bättre
Sustained Read Performance: DiskSpd Read Loop, Queue Depth 8
Grafik
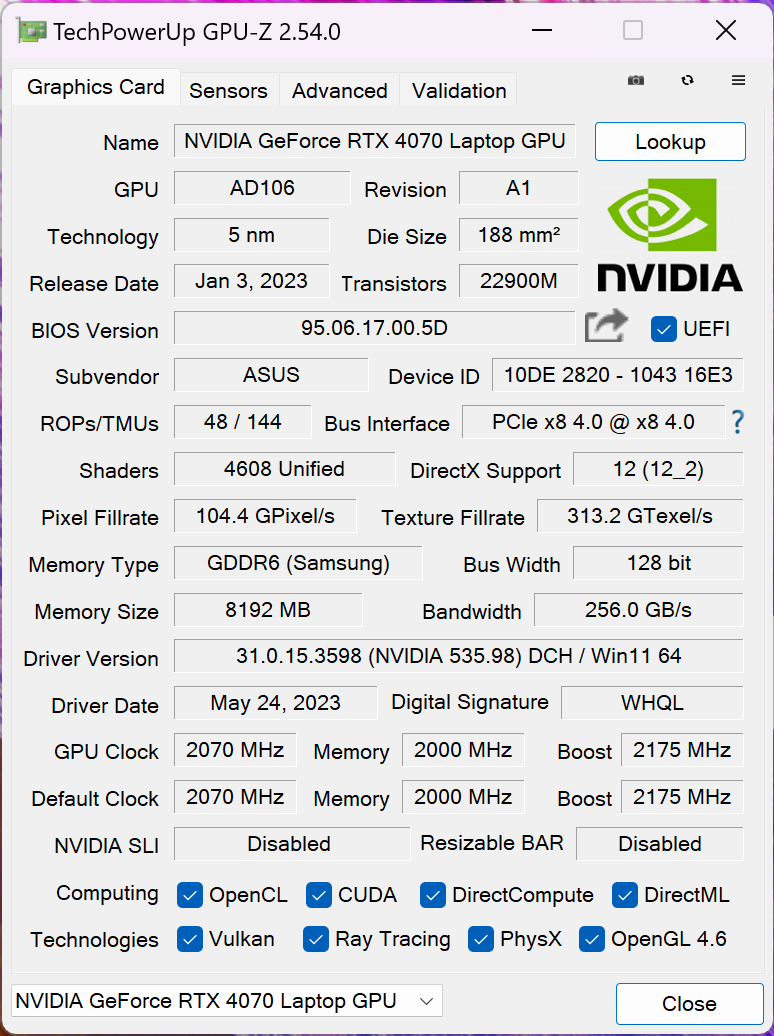
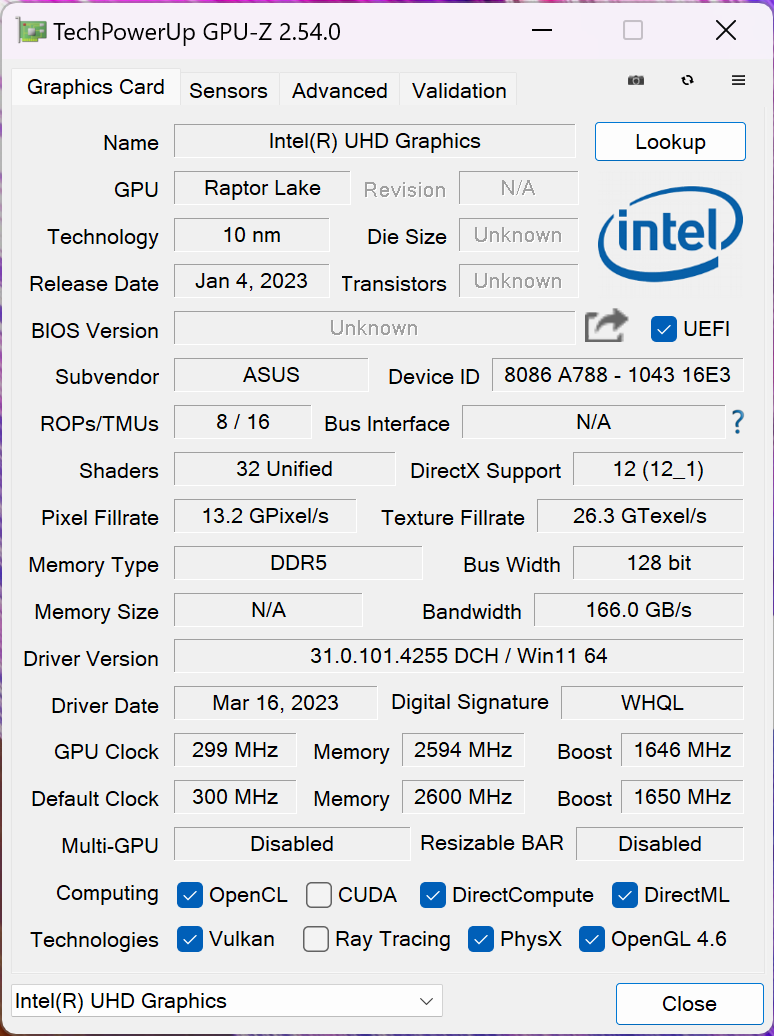
Förutom processorns integrerade GPU (UHD Graphics) är den snabba Nvidia GeForce RTX 4070 Laptop också installerad. Grafikomkopplingen sker via Optimus, men det finns ingen Advanced Optimus eller en MUX-omkopplare. Med en maximal TGP på 130 watt är detta en av de snabbaste 4070 bärbara modellerna, men den här siffran är lite vilseledande. Som vi såg i vår första recension av de nya mobila GPU: erna kan detta värde nås i syntetiska tester som FurMark, men spel är begränsat till cirka 105-110 watt eftersom GPU: n når sin maximala klocka här
I benchmarks ligger RTX 4070 på den förväntade nivån bakomRTX 4080 bärbar dator och den 4090 bärbar datorjämfört med den gamla Studiobook 16 med sin RTX 3070 Ti,är försprånget på 7-15% inte så stort, så en uppgradering är inte riktigt värt det här. GPU-prestandan förblir stabil under permanent belastning, men prestandan är cirka 40% lägre i batteriläge (max. TGP 40 watt). Fler GPU-riktmärken finns tillgängliga på här.
| 3DMark 11 Performance | 35000 poäng | |
| 3DMark Fire Strike Score | 25949 poäng | |
| 3DMark Time Spy Score | 12384 poäng | |
Hjälp | ||
| Blender / v3.3 Classroom OPTIX/RTX | |
| Genomsnitt av klass Multimedia (12 - 105, n=22, senaste 2 åren) | |
| Samsung Galaxy Book3 Ultra 16 | |
| Asus ProArt StudioBook 16 H7600ZW | |
| Schenker XMG Pro 15 (E23) | |
| Asus ProArt Studiobook 16 OLED H7604 | |
| Genomsnitt NVIDIA GeForce RTX 4070 Laptop GPU (18 - 30, n=68) | |
| Gigabyte AERO 16 OLED BSF | |
| MSI Stealth 17 Studio A13VH-014 | |
| Asus Zephyrus Duo 16 GX650PY-NM006W | |
| Blender / v3.3 Classroom CUDA | |
| Genomsnitt av klass Multimedia (20 - 186, n=22, senaste 2 åren) | |
| Samsung Galaxy Book3 Ultra 16 | |
| Asus ProArt StudioBook 16 H7600ZW | |
| Schenker XMG Pro 15 (E23) | |
| Asus ProArt Studiobook 16 OLED H7604 | |
| Genomsnitt NVIDIA GeForce RTX 4070 Laptop GPU (32 - 50, n=67) | |
| Gigabyte AERO 16 OLED BSF | |
| MSI Stealth 17 Studio A13VH-014 | |
| Asus Zephyrus Duo 16 GX650PY-NM006W | |
| Blender / v3.3 Classroom METAL | |
| Apple MacBook Pro 16 2023 M2 Max | |
| Genomsnitt av klass Multimedia (17.8 - 68, n=5, senaste 2 åren) | |
| Blender / v3.3 Classroom CPU | |
| Genomsnitt av klass Multimedia (134.5 - 1042, n=62, senaste 2 åren) | |
| Samsung Galaxy Book3 Ultra 16 | |
| Apple MacBook Pro 16 2023 M2 Max | |
| Gigabyte AERO 16 OLED BSF | |
| Genomsnitt NVIDIA GeForce RTX 4070 Laptop GPU (158 - 440, n=67) | |
| Asus ProArt StudioBook 16 H7600ZW | |
| MSI Stealth 17 Studio A13VH-014 | |
| Schenker XMG Pro 15 (E23) | |
| Asus ProArt Studiobook 16 OLED H7604 | |
| Asus Zephyrus Duo 16 GX650PY-NM006W | |
* ... mindre är bättre
Spelprestanda
Studiobook 16:s spelprestanda är mycket bra och även moderna titlar kan spelas i QHD-upplösning utan problem. Endast ray tracing kräver vanligtvis uppskalning för att kunna spelas smidigt. Ett bra exempel här är Cyberpunk 2077, där endast 26 FPS är möjligt med Ray Tracing Ultra-förinställningen, men detta blir 84 FPS med DLSS (inklusive Frame Generation). Naturligtvis kan hastighetsökningen variera beroende på titel och Cyberpunk är en flaggskeppstitel för DLSS. Spelprestandan förblir stabil under längre sessioner, men den övergripande fördelen jämfört med den gamla studioboken med dess RTX 3070 Ti är minimal.
Witcher 3 FPS Chart
| låg | med. | hög | ultra | QHD | |
|---|---|---|---|---|---|
| GTA V (2015) | 183.4 | 179 | 123 | 94.5 | |
| The Witcher 3 (2015) | 249 | 107.1 | |||
| Dota 2 Reborn (2015) | 215 | 192.8 | 184.4 | 171.6 | |
| Final Fantasy XV Benchmark (2018) | 162.4 | 114.7 | 85.2 | ||
| X-Plane 11.11 (2018) | 181.6 | 164.3 | 131.1 | ||
| Far Cry 5 (2018) | 187 | 162 | 154 | 145 | 117 |
| Strange Brigade (2018) | 315 | 162.1 | 150.6 | 142.7 | 95.3 |
| Shadow of the Tomb Raider (2018) | 153 | 103 | |||
| F1 2021 (2021) | 441 | 336 | 264 | 149.8 | 110.9 |
| Cyberpunk 2077 1.6 (2022) | 129 | 113 | 96 | 87 | 54 |
| F1 22 (2022) | 138.5 | 133.8 | 111.2 | 59.4 | 42.4 |
| Call of Duty Modern Warfare 2 2022 (2022) | 102 | 72 |
Utsläpp - Högt, högre, studiobok
Buller
De två fläktarna är vanligtvis tysta under vardagliga uppgifter, men blir snabbt högljudda så snart antingen CPU eller GPU kommer under stress. Vi har listat värdena i tabellen nedan, men vi rekommenderar i allmänhet hörlurar eller headset när du spelar. Du kan hoppa över Full Speed-läget här, eftersom det bara blir högre och det inte finns någon prestandafördel. Inga andra elektroniska ljud, som t.ex. vinande spole, upptäcktes
| Energiprofil | 3DMark 06 | Witcher 3 | Cyberpoint 2077 | Stresstest |
|---|---|---|---|---|
| Standard | 43,6dB(A) | 43,6dB(A) | 47,6dB(A) | 47,6dB(A) |
| Prestanda | 43,6 dB(A) | 43,6 dB(A) | 47,6 dB(A) | 47,6 dB(A) |
| Full hastighet | 58,9 dB(A) | 58,9 dB(A) | 58,9 dB(A) | 58,9 dB(A) |
Ljudnivå
| Låg belastning |
| 24.5 / 24.5 / 24.5 dB(A) |
| Hög belastning |
| 47.6 / 56.7 dB(A) |
 | ||
30 dB tyst 40 dB(A) hörbar 50 dB(A) högt ljud |
||
min: | ||
| Asus ProArt Studiobook 16 OLED H7604 GeForce RTX 4070 Laptop GPU, i9-13980HX, Phison EM2804TBMTCB47 | Gigabyte AERO 16 OLED BSF GeForce RTX 4070 Laptop GPU, i9-13900H, Gigabyte AG470S1TB-SI B10 | Samsung Galaxy Book3 Ultra 16 GeForce RTX 4050 Laptop GPU, i7-13700H, Samsung PM9A1 MZVL2512HCJQ | MSI Stealth 17 Studio A13VH-014 GeForce RTX 4080 Laptop GPU, i9-13900H, Samsung PM9A1 MZVL22T0HBLB | Apple MacBook Pro 16 2023 M2 Max M2 Max 38-Core GPU, M2 Max, Apple SSD AP2048Z | Asus Zephyrus Duo 16 GX650PY-NM006W GeForce RTX 4090 Laptop GPU, R9 7945HX, SK hynix PC801 HFS002TEJ9X101N | |
|---|---|---|---|---|---|---|
| Noise | -3% | 6% | 9% | 13% | -9% | |
| av / miljö * (dB) | 24.5 | 23 6% | 25 -2% | 24 2% | 23.9 2% | 23.9 2% |
| Idle Minimum * (dB) | 24.5 | 23 6% | 26 -6% | 24 2% | 23.9 2% | 23.9 2% |
| Idle Average * (dB) | 24.5 | 23 6% | 27 -10% | 24 2% | 23.9 2% | 32.9 -34% |
| Idle Maximum * (dB) | 24.5 | 33.64 -37% | 28 -14% | 24 2% | 23.9 2% | 36.5 -49% |
| Load Average * (dB) | 47.6 | 51.49 -8% | 40 16% | 34.49 28% | 36.6 23% | 42.9 10% |
| Witcher 3 ultra * (dB) | 55.9 | 55.27 1% | 39 30% | 48.29 14% | 35.1 37% | 51.2 8% |
| Load Maximum * (dB) | 56.7 | 55.24 3% | 41 28% | 49.66 12% | 43.2 24% | 56 1% |
* ... mindre är bättre
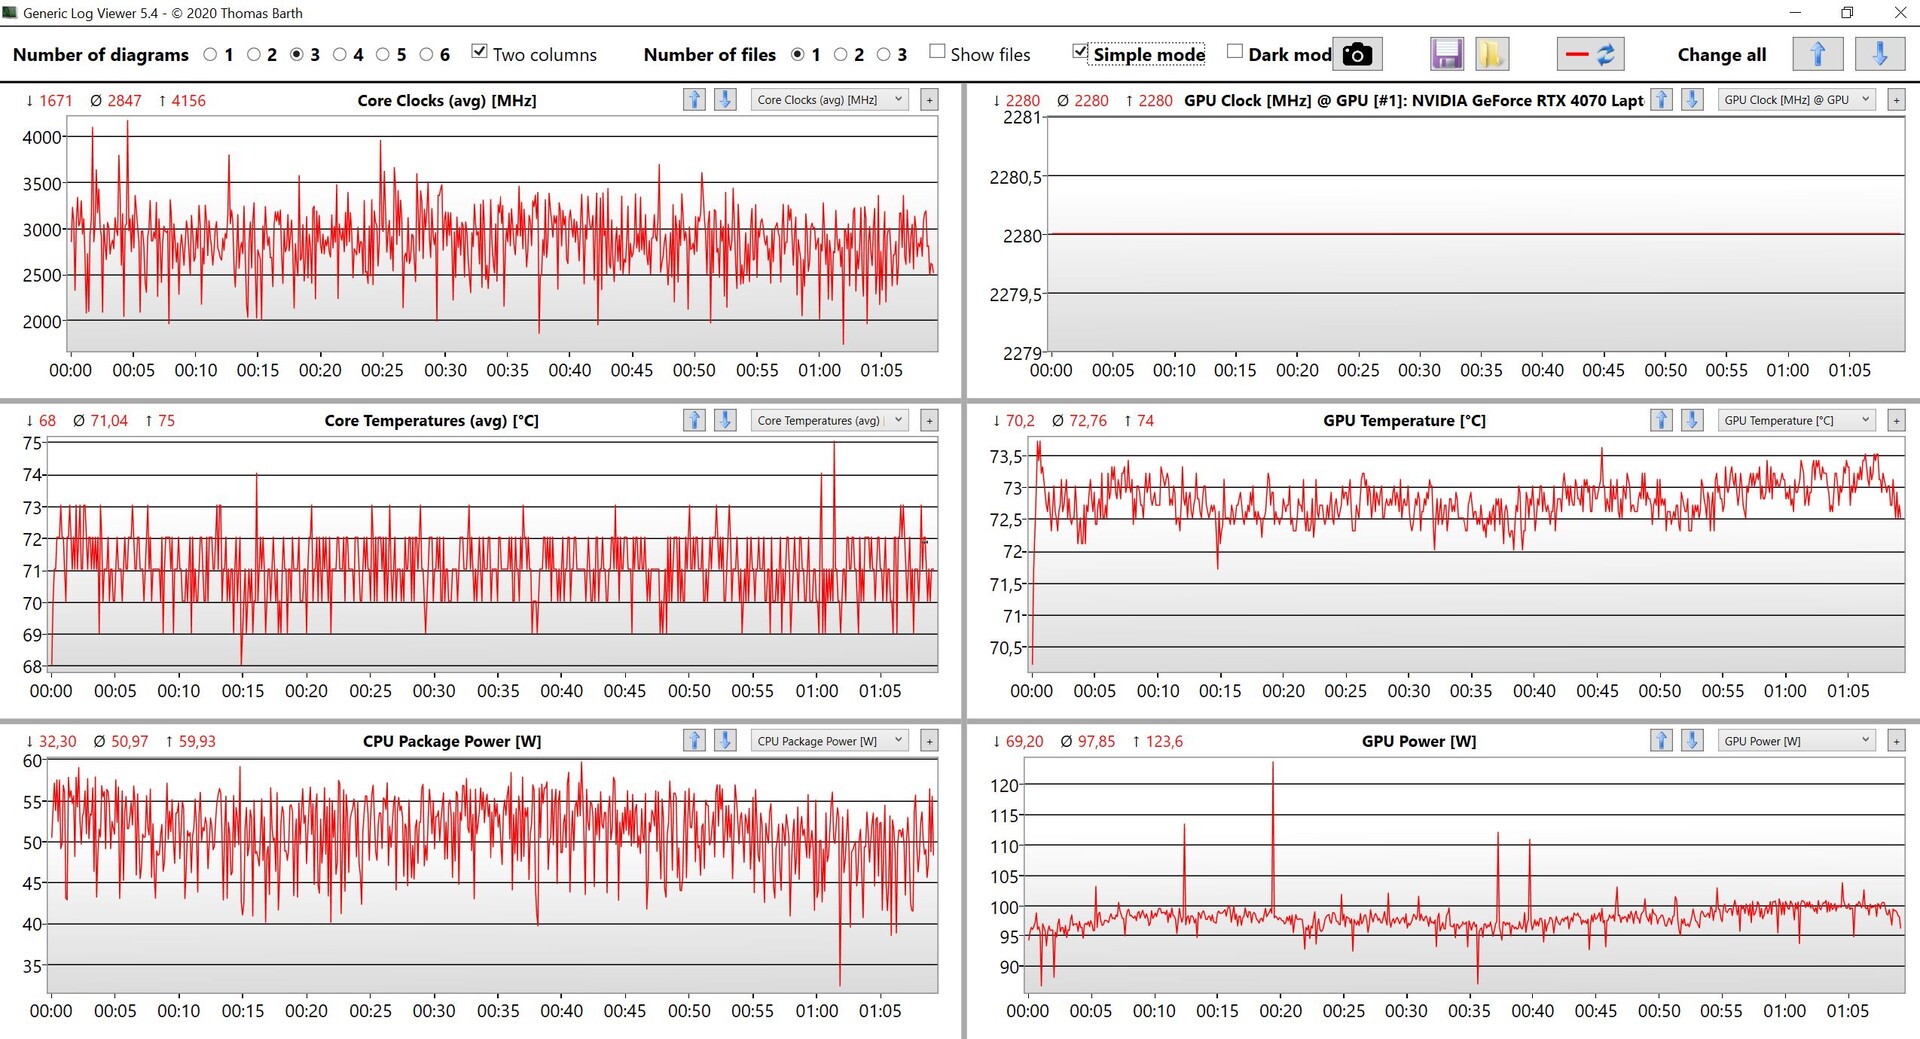
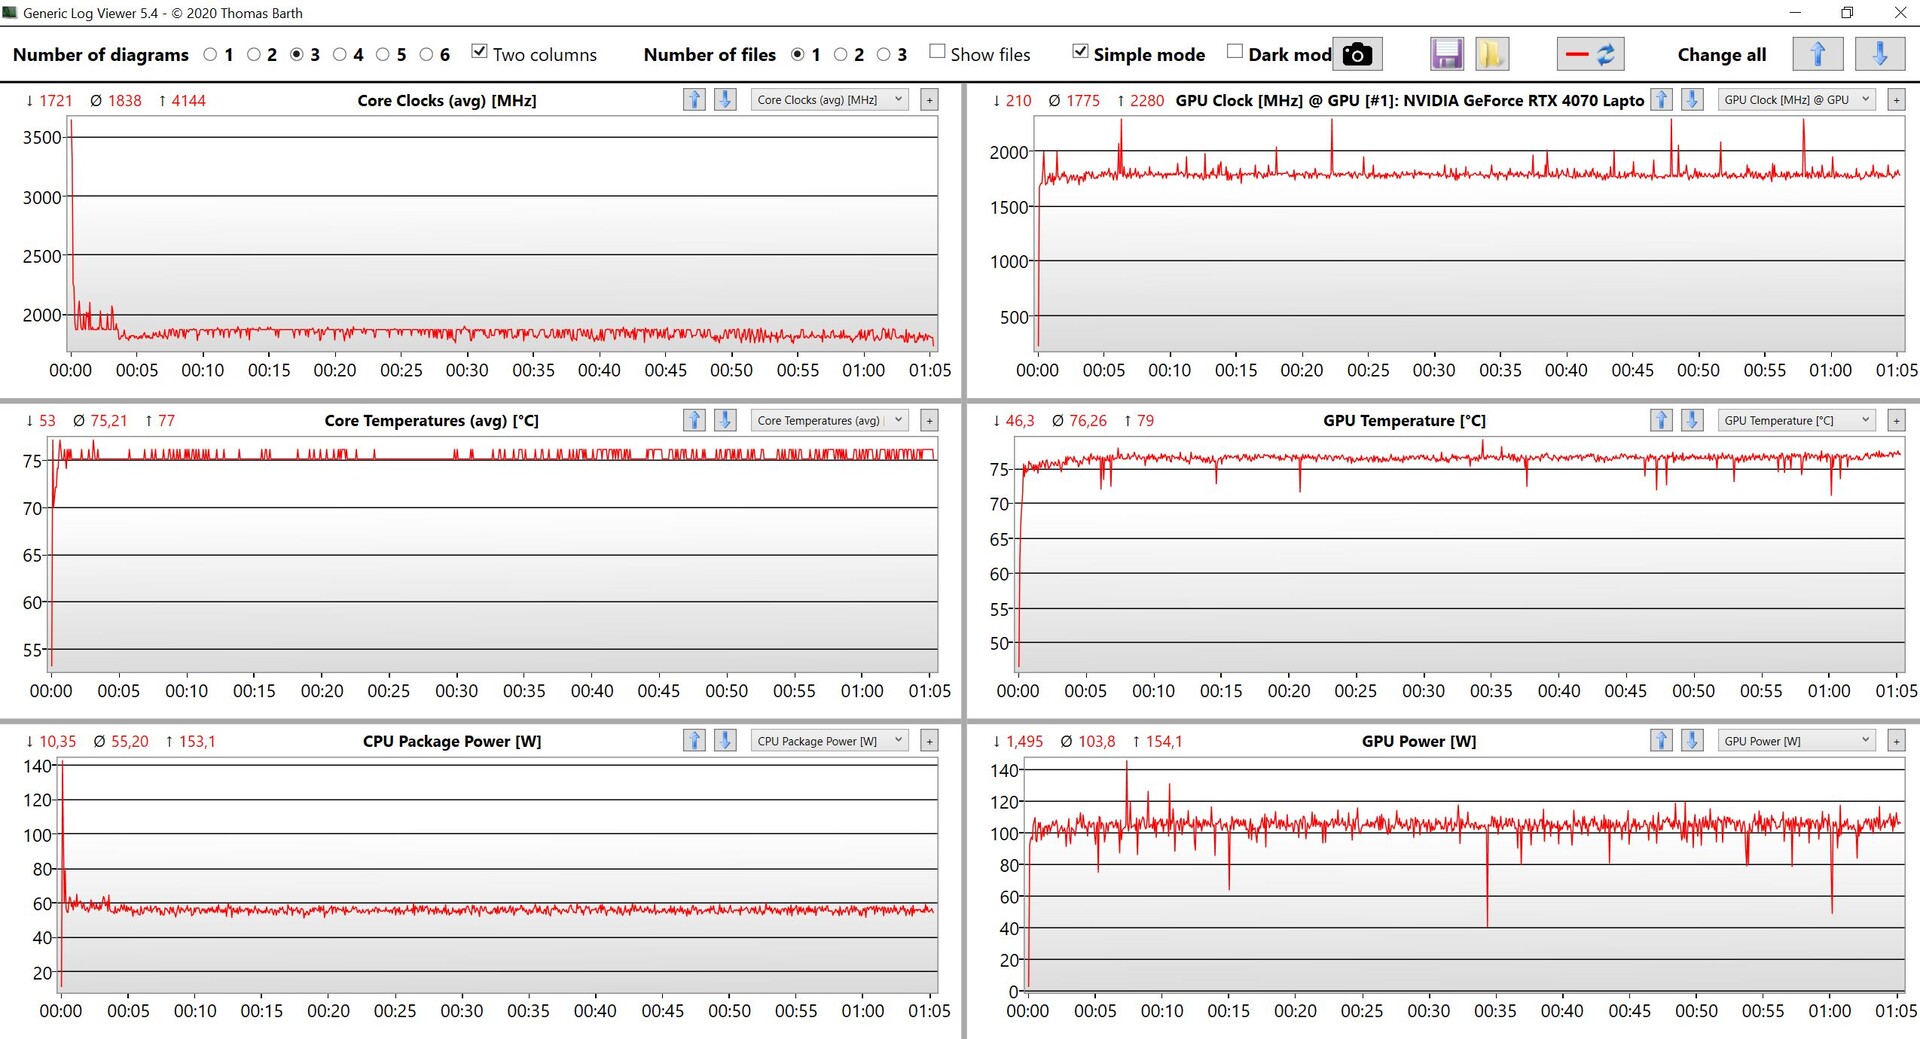
Temperatur
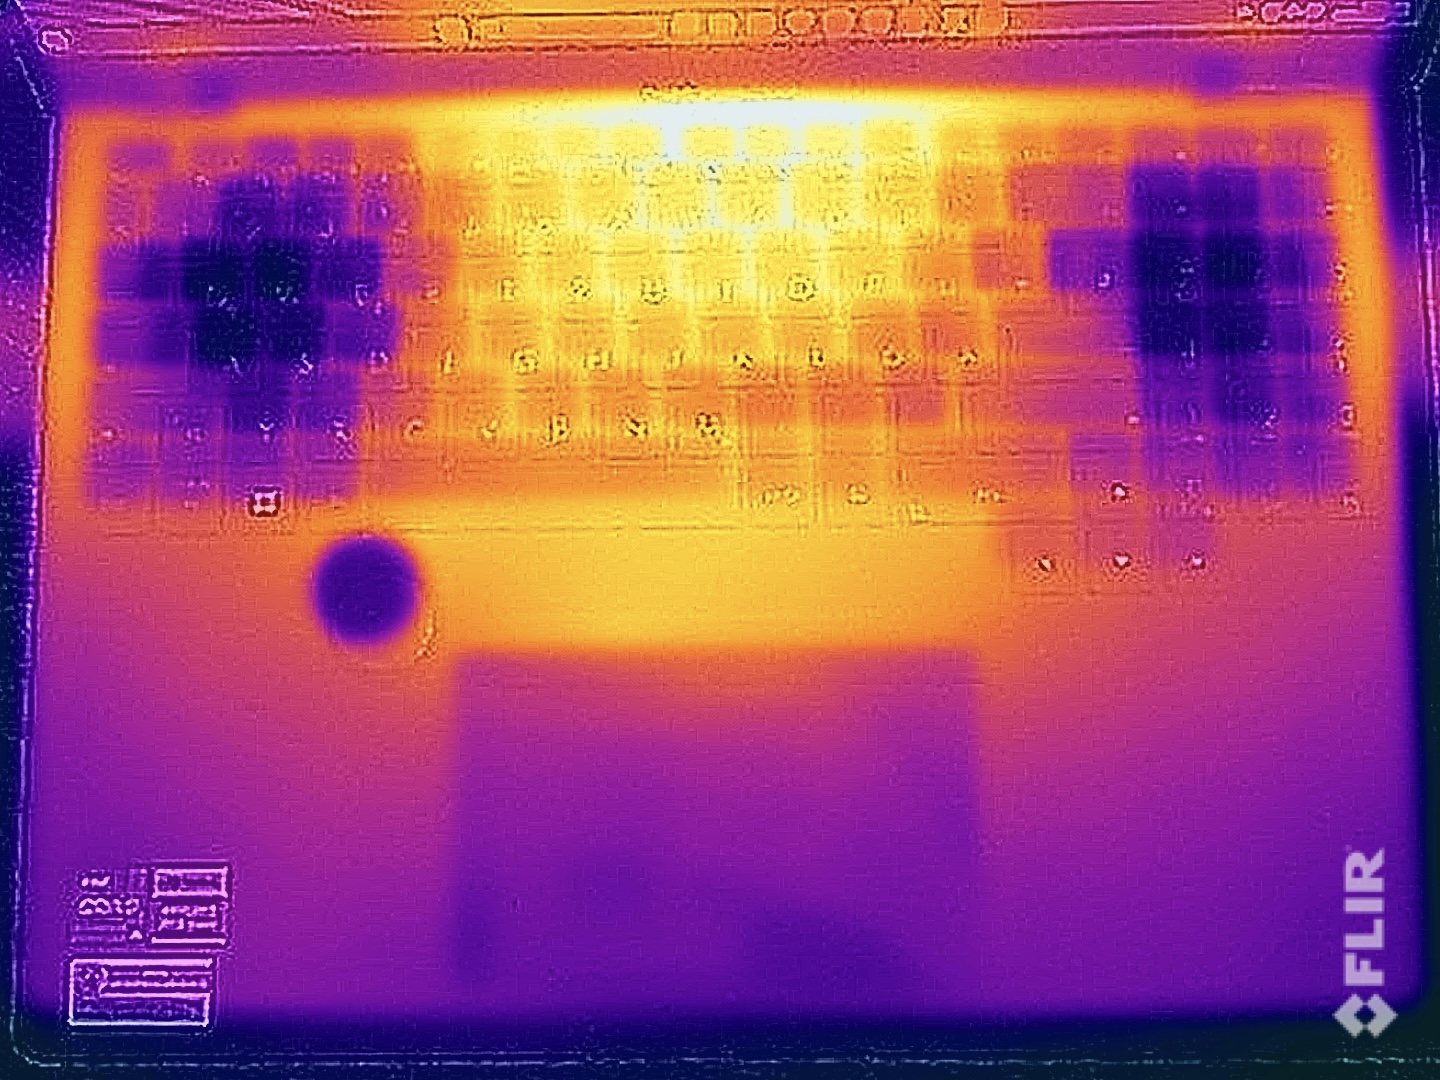
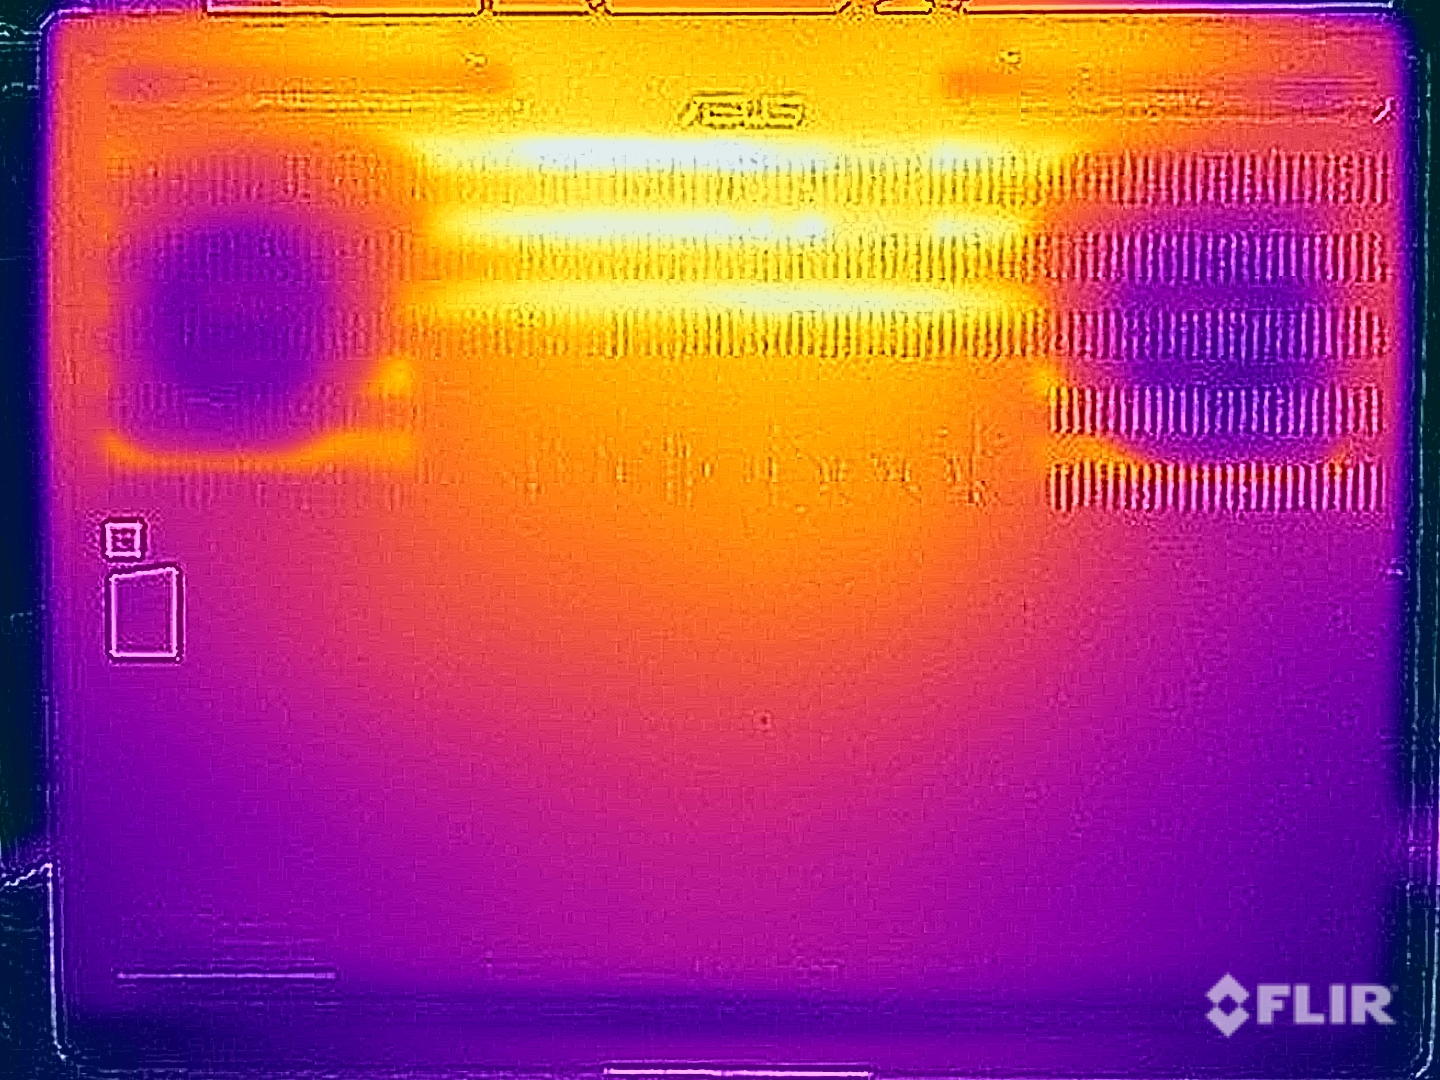
Yttemperaturerna är överlag oproblematiska, men datorns starka komponenter gör sig snabbt påminda, även i viloläge. Eftersom fläktarna inte körs här uppmätte vi mer än 30 °C. Under belastning är basenhetens ovansida fortfarande ganska bekväm med maximalt 45 °C och det finns inga begränsningar när du skriver. Undersidan når ett maximum på knappt 48 °C i mitten, vilket är anledningen till att du teoretiskt sett kan placera enheten i ditt knä (men det är osannolikt med tanke på storleken).
De två komponenterna planar ut mycket snabbt i stresstestet, varvid grafikkortet föredras av systemet och arbetar med cirka 105 watt, medan processorn fortfarande är ~55 watt. Ingen prestandaminskning direkt efter stresstestet registrerades.
(±) Den maximala temperaturen på ovansidan är 44.1 °C / 111 F, jämfört med genomsnittet av 36.8 °C / 98 F , allt från 21 till 71 °C för klassen Multimedia.
(-) Botten värms upp till maximalt 48 °C / 118 F, jämfört med genomsnittet av 39.1 °C / 102 F
(+) Vid tomgångsbruk är medeltemperaturen för ovansidan 31 °C / 88 F, jämfört med enhetsgenomsnittet på 31.3 °C / ### class_avg_f### F.
(±) När du spelar The Witcher 3 är medeltemperaturen för ovansidan 34.9 °C / 95 F, jämfört med enhetsgenomsnittet på 31.3 °C / ## #class_avg_f### F.
(+) Handledsstöden och pekplattan når maximal hudtemperatur (32.3 °C / 90.1 F) och är därför inte varma.
(-) Medeltemperaturen för handledsstödsområdet på liknande enheter var 28.7 °C / 83.7 F (-3.6 °C / -6.4 F).
| Asus ProArt Studiobook 16 OLED H7604 Intel Core i9-13980HX, NVIDIA GeForce RTX 4070 Laptop GPU | Gigabyte AERO 16 OLED BSF Intel Core i9-13900H, NVIDIA GeForce RTX 4070 Laptop GPU | Samsung Galaxy Book3 Ultra 16 Intel Core i7-13700H, NVIDIA GeForce RTX 4050 Laptop GPU | MSI Stealth 17 Studio A13VH-014 Intel Core i9-13900H, NVIDIA GeForce RTX 4080 Laptop GPU | Apple MacBook Pro 16 2023 M2 Max Apple M2 Max, Apple M2 Max 38-Core GPU | Asus Zephyrus Duo 16 GX650PY-NM006W AMD Ryzen 9 7945HX, NVIDIA GeForce RTX 4090 Laptop GPU | |
|---|---|---|---|---|---|---|
| Heat | 18% | 18% | -1% | 20% | 7% | |
| Maximum Upper Side * (°C) | 44.1 | 41 7% | 41 7% | 47 -7% | 44.2 -0% | 44.2 -0% |
| Maximum Bottom * (°C) | 48 | 47 2% | 44 8% | 54 -13% | 42.9 11% | 46.8 2% |
| Idle Upper Side * (°C) | 32.7 | 23 30% | 23 30% | 30 8% | 22.4 31% | 29.2 11% |
| Idle Bottom * (°C) | 34.9 | 23 34% | 26 26% | 32 8% | 22.3 36% | 30.2 13% |
* ... mindre är bättre
Högtalare
Ljudsystemet består av fyra högtalare som ger bra ljudkvalitet. Även om det inte är tillräckligt för att konkurrera med MacBook Pro 16eftersom det fortfarande saknar lite tryck, är det ändå tillfredsställande överlag. Prestandan är tillräcklig för videor och lite bakgrundsmusik, och du kan inte höra mycket från högtalarna under spel ändå på grund av de högljudda fläktarna.
Asus ProArt Studiobook 16 OLED H7604 ljudanalys
(+) | högtalare kan spela relativt högt (84 dB)
Bas 100 - 315 Hz
(±) | reducerad bas - i genomsnitt 14.1% lägre än medianen
(±) | linjäriteten för basen är genomsnittlig (9.5% delta till föregående frekvens)
Mellan 400 - 2000 Hz
(+) | balanserad mellan - endast 1.9% från medianen
(+) | mids är linjära (3.8% delta till föregående frekvens)
Högsta 2 - 16 kHz
(+) | balanserade toppar - endast 4.2% från medianen
(+) | toppar är linjära (3.9% delta till föregående frekvens)
Totalt 100 - 16 000 Hz
(+) | det totala ljudet är linjärt (11.2% skillnad mot median)
Jämfört med samma klass
» 17% av alla testade enheter i den här klassen var bättre, 4% liknande, 80% sämre
» Den bästa hade ett delta på 5%, genomsnittet var 17%, sämst var 45%
Jämfört med alla testade enheter
» 7% av alla testade enheter var bättre, 2% liknande, 91% sämre
» Den bästa hade ett delta på 4%, genomsnittet var 23%, sämst var 134%
Apple MacBook Pro 16 2023 M2 Max ljudanalys
(+) | högtalare kan spela relativt högt (86.1 dB)
Bas 100 - 315 Hz
(+) | bra bas - bara 3.9% från medianen
(+) | basen är linjär (5.7% delta till föregående frekvens)
Mellan 400 - 2000 Hz
(+) | balanserad mellan - endast 1.2% från medianen
(+) | mids är linjära (1.5% delta till föregående frekvens)
Högsta 2 - 16 kHz
(+) | balanserade toppar - endast 2.5% från medianen
(+) | toppar är linjära (1.7% delta till föregående frekvens)
Totalt 100 - 16 000 Hz
(+) | det totala ljudet är linjärt (4.9% skillnad mot median)
Jämfört med samma klass
» 0% av alla testade enheter i den här klassen var bättre, 0% liknande, 99% sämre
» Den bästa hade ett delta på 5%, genomsnittet var 17%, sämst var 45%
Jämfört med alla testade enheter
» 0% av alla testade enheter var bättre, 0% liknande, 100% sämre
» Den bästa hade ett delta på 4%, genomsnittet var 23%, sämst var 134%
Energihantering - StudioBook med kort batteritid
Strömförbrukning
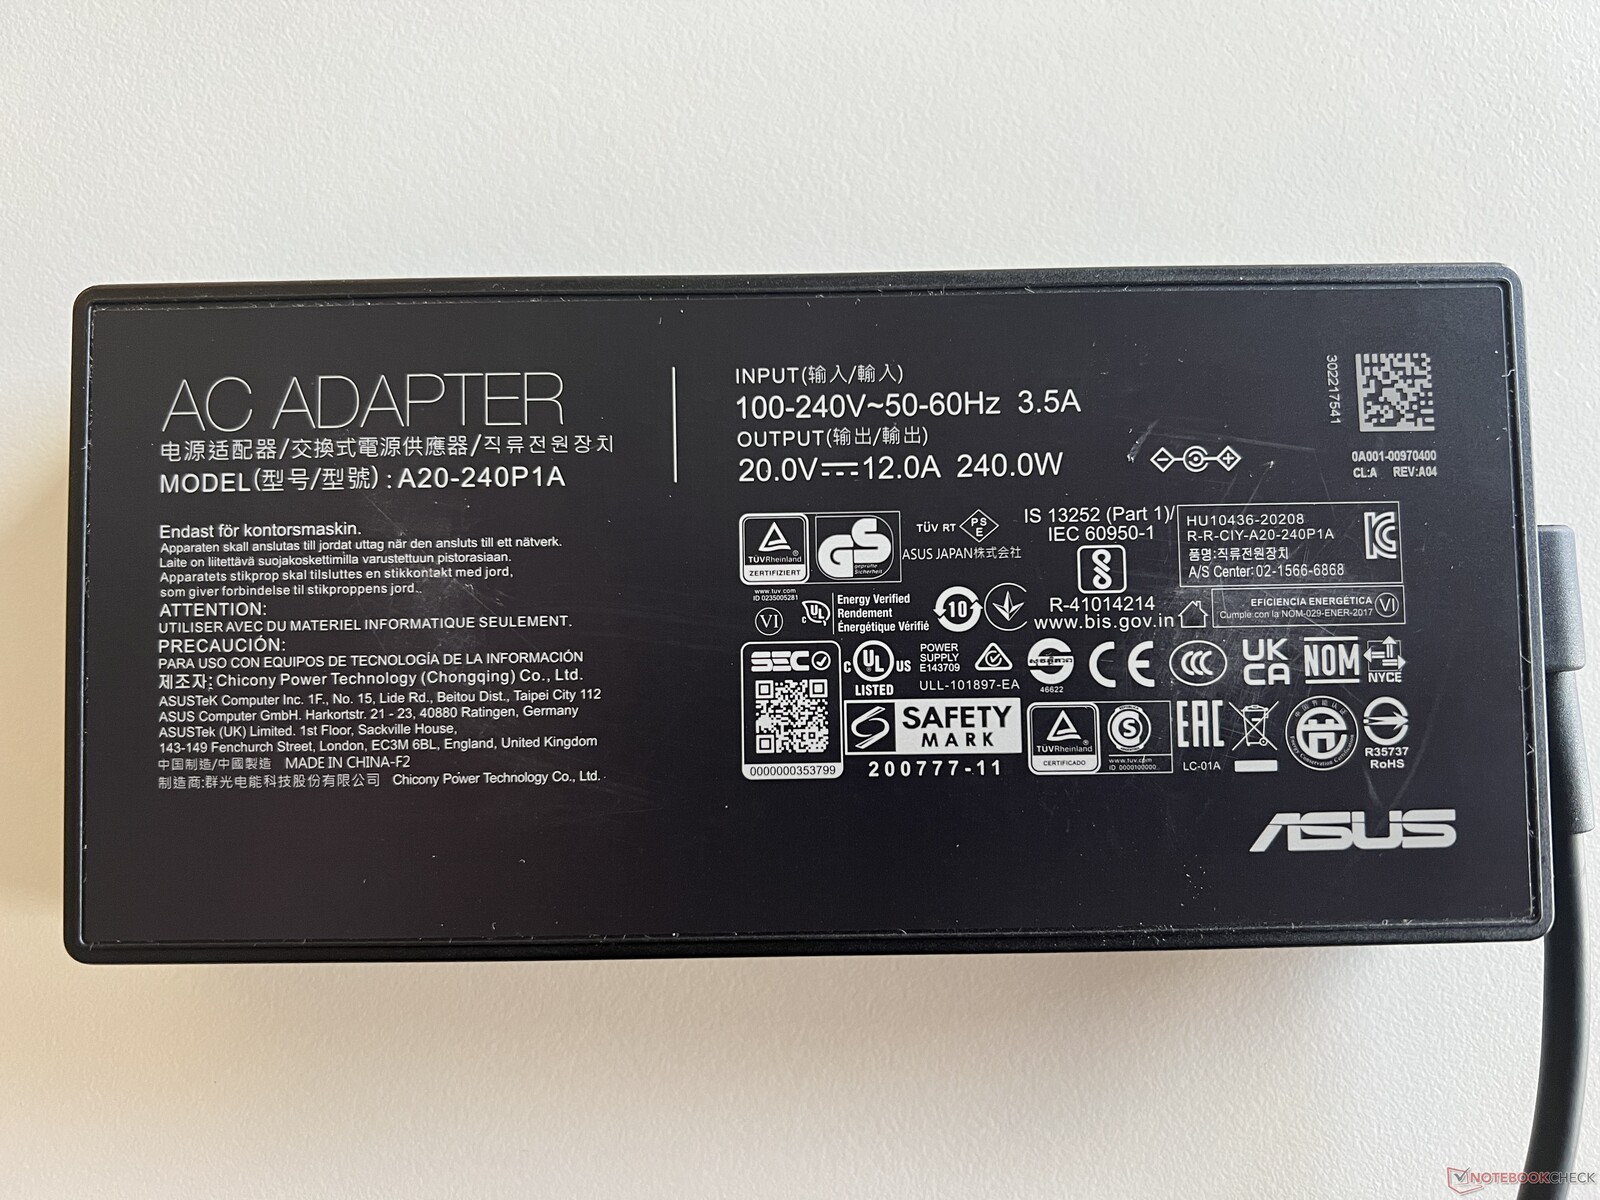
På grund av den stora OLED-panelen och HX-processorn ensam är effektiviteten hos Studiobook 16 inte särskilt bra. Vi uppmätte mellan 12-21 watt i viloläge, beroende på ljusstyrka, även om det ibland når upp till 36 watt i HDR-läge. Under belastning finns det inga överraskningar: det stiger till cirka 200 watt under spel och planar ut på cirka 210 watt efter de första ~ 247 watt i stresstestet. Den medföljande 240-watts strömförsörjningen är därmed tillräckligt stor.
| Av/Standby | |
| Låg belastning | |
| Hög belastning |
|
Förklaring:
min: | |
| Asus ProArt Studiobook 16 OLED H7604 i9-13980HX, GeForce RTX 4070 Laptop GPU, Phison EM2804TBMTCB47, OLED, 3200x2000, 16" | Gigabyte AERO 16 OLED BSF i9-13900H, GeForce RTX 4070 Laptop GPU, Gigabyte AG470S1TB-SI B10, OLED, 3840x2400, 16" | Samsung Galaxy Book3 Ultra 16 i7-13700H, GeForce RTX 4050 Laptop GPU, Samsung PM9A1 MZVL2512HCJQ, AMOLED, 2880x1800, 16" | MSI Stealth 17 Studio A13VH-014 i9-13900H, GeForce RTX 4080 Laptop GPU, Samsung PM9A1 MZVL22T0HBLB, Mini LED, 3840x2160, 17.3" | Apple MacBook Pro 16 2023 M2 Max M2 Max, M2 Max 38-Core GPU, Apple SSD AP2048Z, Mini-LED, 3456x2234, 16.2" | Asus Zephyrus Duo 16 GX650PY-NM006W R9 7945HX, GeForce RTX 4090 Laptop GPU, SK hynix PC801 HFS002TEJ9X101N, MiniLED, 2560x1600, 16" | Genomsnitt NVIDIA GeForce RTX 4070 Laptop GPU | Genomsnitt av klass Multimedia | |
|---|---|---|---|---|---|---|---|---|
| Power Consumption | 18% | 61% | 10% | 34% | -35% | 4% | 49% | |
| Idle Minimum * (Watt) | 12.8 | 11.8 8% | 3 77% | 13.9 -9% | 5.2 59% | 19.2 -50% | 13.2 ? -3% | 5.66 ? 56% |
| Idle Average * (Watt) | 19.9 | 16.1 19% | 5 75% | 20 -1% | 16.5 17% | 29.7 -49% | 18.2 ? 9% | 10.2 ? 49% |
| Idle Maximum * (Watt) | 20.3 | 17 16% | 11 46% | 20.6 -1% | 16.8 17% | 30.8 -52% | 24.6 ? -21% | 12.5 ? 38% |
| Load Average * (Watt) | 131.4 | 100.6 23% | 72 45% | 77 41% | 113 14% | 126 4% | 97 ? 26% | 65.2 ? 50% |
| Witcher 3 ultra * (Watt) | 196.5 | 158 20% | 69.7 65% | 162 18% | 92 53% | 258 -31% | ||
| Load Maximum * (Watt) | 246.8 | 192 22% | 108 56% | 216 12% | 145 41% | 330 -34% | 221 ? 10% | 113.5 ? 54% |
* ... mindre är bättre
Power consumption Witcher 3 / Stress test
Power consumption with an external monitor
Batteritid
Med tanke på förbrukningshastigheten är det knappast förvånande att batteritiden inte är särskilt bra trots 90 Wh-batteriet. Som standard växlar den bärbara datorn till 60Hz-läge så snart du kopplar ur den. Trots detta registrerade vi bara 5,5 timmar i WLAN-testet vid 150 cd/m² (120 Hz: 5 timmar) och cirka 4,5 timmar vid full ljusstyrka (120 Hz: ~3,5 timmar). Videotestet pågår i knappt 6 timmar. En HDR-video med full ljusstyrka tömmer batteriet efter ~2:40 timmar och cirka en timme under belastning trots den minskade prestandan.
| Asus ProArt Studiobook 16 OLED H7604 i9-13980HX, GeForce RTX 4070 Laptop GPU, 90 Wh | Gigabyte AERO 16 OLED BSF i9-13900H, GeForce RTX 4070 Laptop GPU, 88 Wh | Samsung Galaxy Book3 Ultra 16 i7-13700H, GeForce RTX 4050 Laptop GPU, 76 Wh | MSI Stealth 17 Studio A13VH-014 i9-13900H, GeForce RTX 4080 Laptop GPU, 99 Wh | Apple MacBook Pro 16 2023 M2 Max M2 Max, M2 Max 38-Core GPU, 99.6 Wh | Asus Zephyrus Duo 16 GX650PY-NM006W R9 7945HX, GeForce RTX 4090 Laptop GPU, 90 Wh | Genomsnitt av klass Multimedia | |
|---|---|---|---|---|---|---|---|
| Batteridrifttid | 49% | 86% | 13% | 125% | -25% | 118% | |
| H.264 (h) | 6 | 7.4 23% | 13.4 123% | 5.6 -7% | 18.7 212% | 3.8 -37% | 17.1 ? 185% |
| WiFi v1.3 (h) | 5.6 | 7.5 34% | 9.6 71% | 5.6 0% | 14.8 164% | 4 -29% | 12.2 ? 118% |
| Load (h) | 1.1 | 2.1 91% | 1.8 64% | 1.6 45% | 1.1 0% | 1 -9% | 1.664 ? 51% |
| Witcher 3 ultra (h) | 2.6 |
För
Emot
Omdöme - Studiobook 16 med svagheter i detaljerna
Den nya 2023 ProArt Studiobook 16 OLED erbjuder mycket prestanda och är en bra bärbar dator för kreativa användare överlag, även om det finns några svaga punkter i detaljerna. Först och främst är Core i9-13980HX, som Intels snabbaste mobila processor, erbjuder mycket CPU-kraft, men faller fortfarande bakom AMD Ryzen 9 7945HX när det gäller flerkärnig prestanda och effektivitet. Jämfört med Core i9-12900H av den gamla modellen, å andra sidan, erbjuder den betydligt mer prestanda. Detta gäller dock inte grafikkortet, eftersom RTX 4070 bärbar dator är bara något snabbare än RTX 3070 Ti, så uppgraderingen är inte riktigt värt det här. Andra kritikpunkter inkluderar konventionell kylning och fläktljud i synnerhet, eftersom enheten snabbt blir mycket högljudd. Åtminstone förblir temperaturerna inom gränserna.
OLED-skärmen har ändrats från 4K-panelen med 60 Hz till en 120 Hz pekskärm med en något lägre upplösning. Bildkvaliteten är i grunden mycket bra, men som andra OLED-pekskärmar från Asus verkar ljusa områden något korniga. Det finns också små färgavvikelser som vi inte kunde korrigera med vår egen kalibrering. OLED-skärmen har också en negativ inverkan på batteritiden. Mjukvarufunktionen mot PWM-flimmer är bra, men justeringar måste göras via mjukvaran varje gång, vilket är besvärligt.
Massor av kraft, men också högljudda fläktar: ProArt Studiobook 16 är utan tvekan en snabb enhet och DialPad kan ge mervärde för kreativa användare. Men 120 Hz OLED är inte helt övertygande.
Förutom pekskärmen erbjuder Studiobook 16 återigen den extra DialPad, som fungerar särskilt bra med Adobe-apparna och kan också erbjuda mervärde här. HDR-funktionerna är fortfarande begränsade, men det beror på Windows. HDR måste aktiveras manuellt och färgprofiler är då inte längre tillgängliga. Dessutom har mini LED-paneler en fördel när det gäller maximal ljusstyrka. Även om MacBook Pro 16 erbjuder betydligt mindre CPU-prestanda (åtminstone i nätdrift), är det fortfarande ett mycket bra val för kreativa användare och erbjuder betydligt längre batteritid vid daglig användning. Ännu mer prestanda erbjuds av ROG Zephyrus Duo 16, som är listad som en gamer, men som också är intressant för innehållsskapare tack vare den andra skärmen.
Pris och tillgänglighet
En variant av Asus ProArt Studiobook 16 OLED (Intel Core i9-13980HX CPU, Nvidia Geforce RTX 4070 GPU, 32GB DDR5 SO-DIMM RAM, 1TB SSD) är tillgänglig via Amazon USA för $2499,99.
Priserna gäller från 29.06.23 och kan komma att ändras.
Asus ProArt Studiobook 16 OLED H7604
- 06/27/2023 v7 (old)
Andreas Osthoff
Genomskinlighet
Valet av enheter som ska granskas görs av vår redaktion. Testprovet gavs till författaren som ett lån av tillverkaren eller återförsäljaren för denna recension. Långivaren hade inget inflytande på denna recension och inte heller fick tillverkaren en kopia av denna recension innan publiceringen. Det fanns ingen skyldighet att publicera denna recension. Som ett oberoende medieföretag är Notebookcheck inte föremål för auktoritet från tillverkare, återförsäljare eller förlag.
This is how Notebookcheck is testingEvery year, Notebookcheck independently reviews hundreds of laptops and smartphones using standardized procedures to ensure that all results are comparable. We have continuously developed our test methods for around 20 years and set industry standards in the process. In our test labs, high-quality measuring equipment is utilized by experienced technicians and editors. These tests involve a multi-stage validation process. Our complex rating system is based on hundreds of well-founded measurements and benchmarks, which maintains objectivity.
Price comparison

