Recension av Alienware x17 R2 - Högsta GeForce RTX 3080 Ti prestanda på 175 W
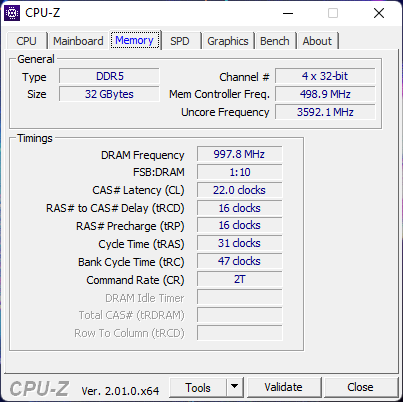
Dell introducerade sin Alienware x17-serie i slutet av förra året med en helt ny chassidesign för att skilja den från den befintliga Alienware m17-serien. I år har tillverkaren uppdaterat serien genom att lansera Alienware x17 R2 med 12:e generationens Intel Alder Lake-P-processorer och GeForce RTX 3070/3080 Ti-grafik som ersätter förra årets 11:e generation Tiger Lake-H respektive RTX 3070/3080-alternativ. Andra uppdateringar finns också, bland annat snabbare RAM-minne (DDR4-3466 till DDR5-4800), nyare skärmalternativ och stöd för MUX och Advanced Optimus.
Förutom de interna uppdateringarna som nämns ovan använder Alienware x17 R2 samma chassi som Alienware x17 R1. Vi rekommenderar att du kollar in vår recension av x17 R1 eftersom våra befintliga kommentarer om chassit, det mekaniska Cherry-tangentbordet och portarna även är relevanta för x17 R2.
Se de officiella tekniska specifikationerna nedan för alla konfigurerbara alternativ. Vår specifika testenhet är en SKU i den högre prisklassen med Core i9-12900HK, 360 Hz 1080p-skärm och 175 W GeForce RTX 3080 Ti-grafik för strax under 4 000 USD. Bland konkurrenterna i detta område finns andra ultratunna bärbara 17,3-tums gamingdatorer som t.ex MSI GS77, Razer Blade 17, och Asus Zephyrus S17.
Fler recensioner av Alienware:
Jämförelse med potentiella konkurrenter
Gradering | Datum | Modell | Vikt | Höjd | Storlek | Upplösning | Pris |
|---|---|---|---|---|---|---|---|
| 89.2 % v7 (old) | 05/2022 | Alienware x17 R2 P48E i9-12900HK, GeForce RTX 3080 Ti Laptop GPU | 3.1 kg | 20.9 mm | 17.30" | 1920x1080 | |
| 89 % v7 (old) | 09/2021 | Alienware x17 RTX 3080 P48E i7-11800H, GeForce RTX 3080 Laptop GPU | 3.2 kg | 21.4 mm | 17.30" | 3840x2160 | |
| 90.1 % v7 (old) | 08/2021 | Asus ROG Zephyrus S17 GX703HSD i9-11900H, GeForce RTX 3080 Laptop GPU | 2.8 kg | 19.9 mm | 17.30" | 2560x1440 | |
| 87.2 % v7 (old) | 04/2022 | MSI Stealth GS77 12UHS-083US i7-12700H, GeForce RTX 3080 Ti Laptop GPU | 2.9 kg | 20.8 mm | 17.30" | 2560x1440 | |
| 87.4 % v7 (old) | MSI GT76 Titan DT 10SGS i9-10900K, GeForce RTX 2080 Super Mobile | 4.2 kg | 42 mm | 17.30" | 3840x2160 | ||
| 83.2 % v7 (old) | 10/2021 | Gigabyte A7 X1 R9 5900HX, GeForce RTX 3070 Laptop GPU | 2.5 kg | 34 mm | 17.30" | 1920x1080 |
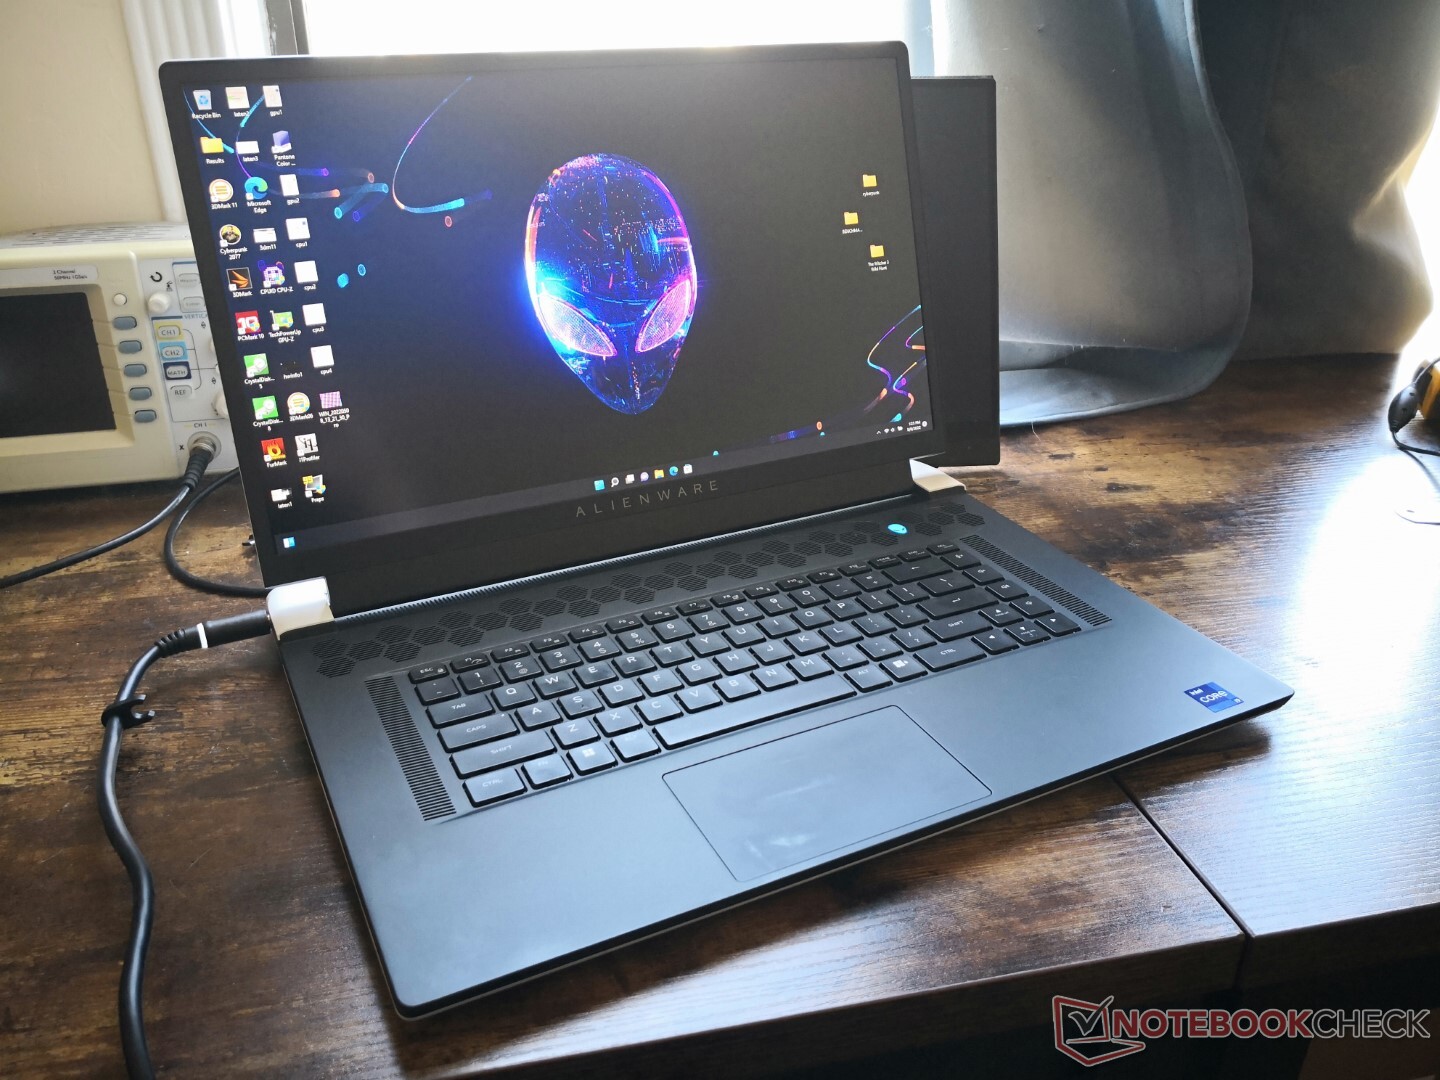
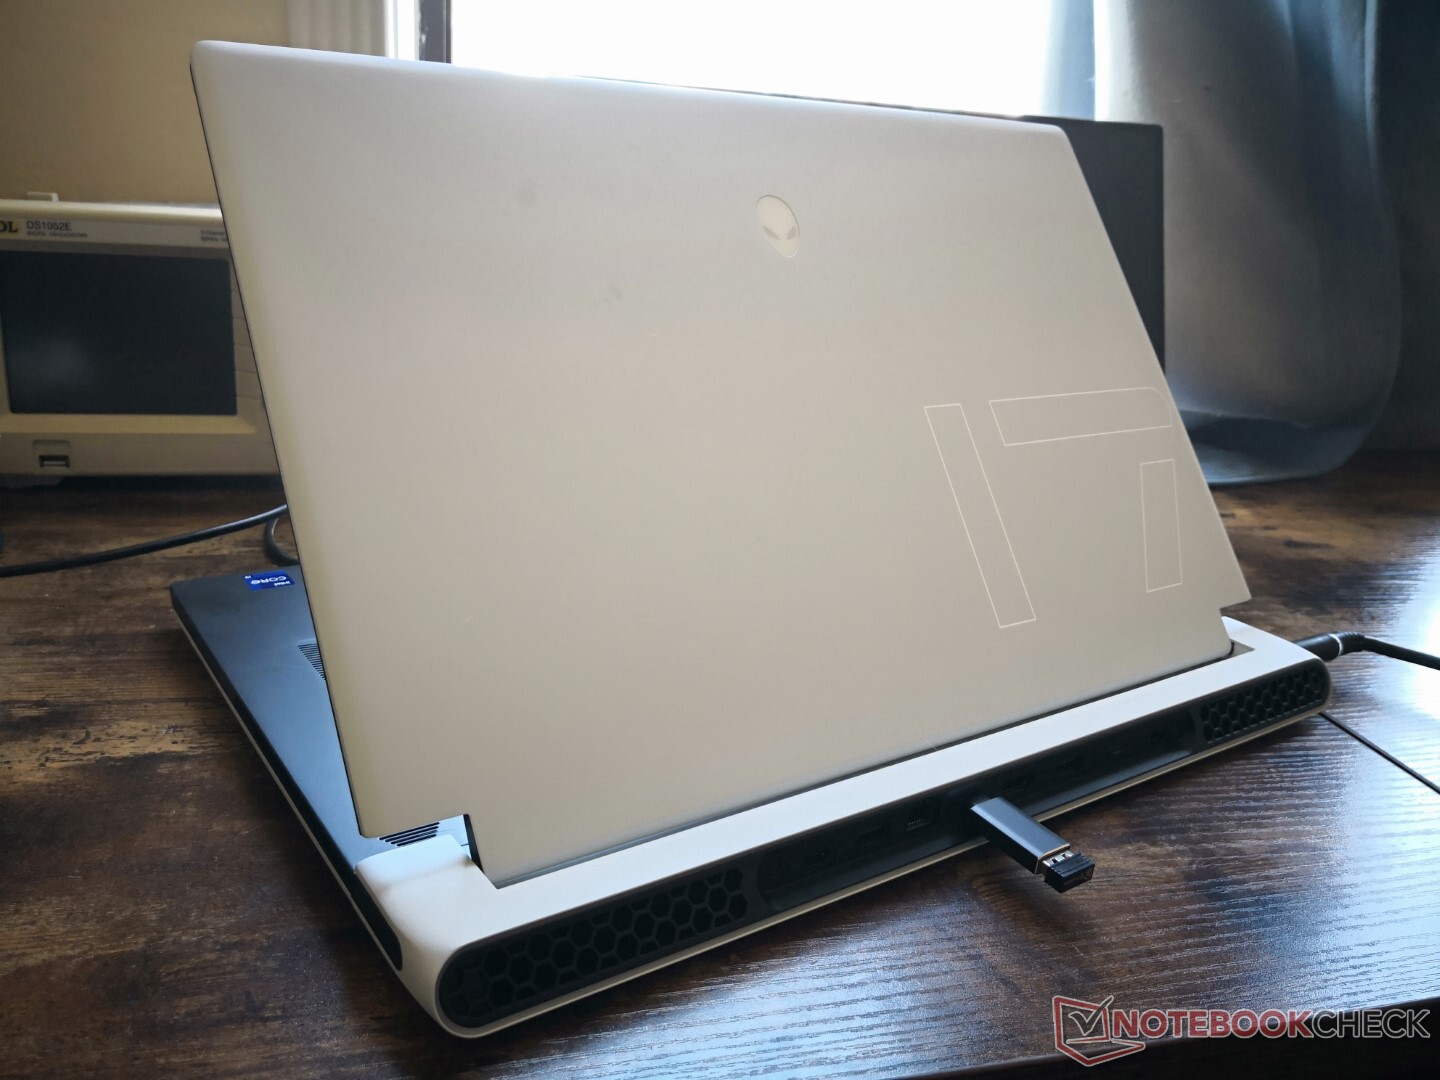
Hölje
Även om Alienware x17 R2 marknadsförs som en ultratunn bärbar dator för spel är chassit fortfarande märkbart tyngre och större än alternativ som Asus Zephyrus S17, MSI GS77 eller Razer Blade 17. I gengäld kan Alienware-systemet bära en kraftfullare GPU på 175 W medan de flesta andra ultratunna bärbara speldatorer är begränsade till 140 W eller mindre.
SD-kortläsare
| SD Card Reader | |
| average JPG Copy Test (av. of 3 runs) | |
| MSI GT76 Titan DT 10SGS (Toshiba Exceria Pro M501 UHS-II) | |
| Asus ROG Zephyrus S17 GX703HSD | |
| Alienware x17 R2 P48E (AV Pro V60) | |
| Alienware x17 RTX 3080 P48E (AV Pro V60) | |
| MSI Stealth GS77 12UHS-083US (AV Pro V60) | |
| maximum AS SSD Seq Read Test (1GB) | |
| Asus ROG Zephyrus S17 GX703HSD | |
| Alienware x17 RTX 3080 P48E (AV Pro V60) | |
| Alienware x17 R2 P48E (AV Pro V60) | |
| MSI GT76 Titan DT 10SGS (Toshiba Exceria Pro M501 UHS-II) | |
| MSI Stealth GS77 12UHS-083US (AV Pro V60) | |
Kommunikation
| Networking | |
| iperf3 transmit AX12 | |
| MSI GT76 Titan DT 10SGS | |
| Alienware x17 RTX 3080 P48E | |
| Alienware x17 R2 P48E | |
| Gigabyte A7 X1 | |
| MSI Stealth GS77 12UHS-083US | |
| Asus ROG Zephyrus S17 GX703HSD | |
| iperf3 receive AX12 | |
| Gigabyte A7 X1 | |
| Alienware x17 R2 P48E | |
| MSI GT76 Titan DT 10SGS | |
| MSI Stealth GS77 12UHS-083US | |
| Alienware x17 RTX 3080 P48E | |
| Asus ROG Zephyrus S17 GX703HSD | |
Webbkamera
Webbkameran är fortfarande 720p utan fysisk sekretesskydd jämfört med 1080p på den senaste Razer Blade 17. Windows Hello stöds.

")
")
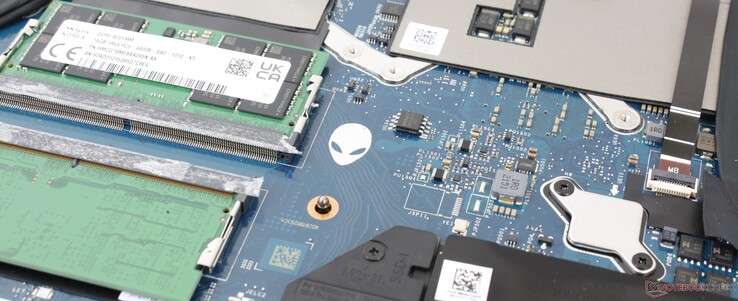
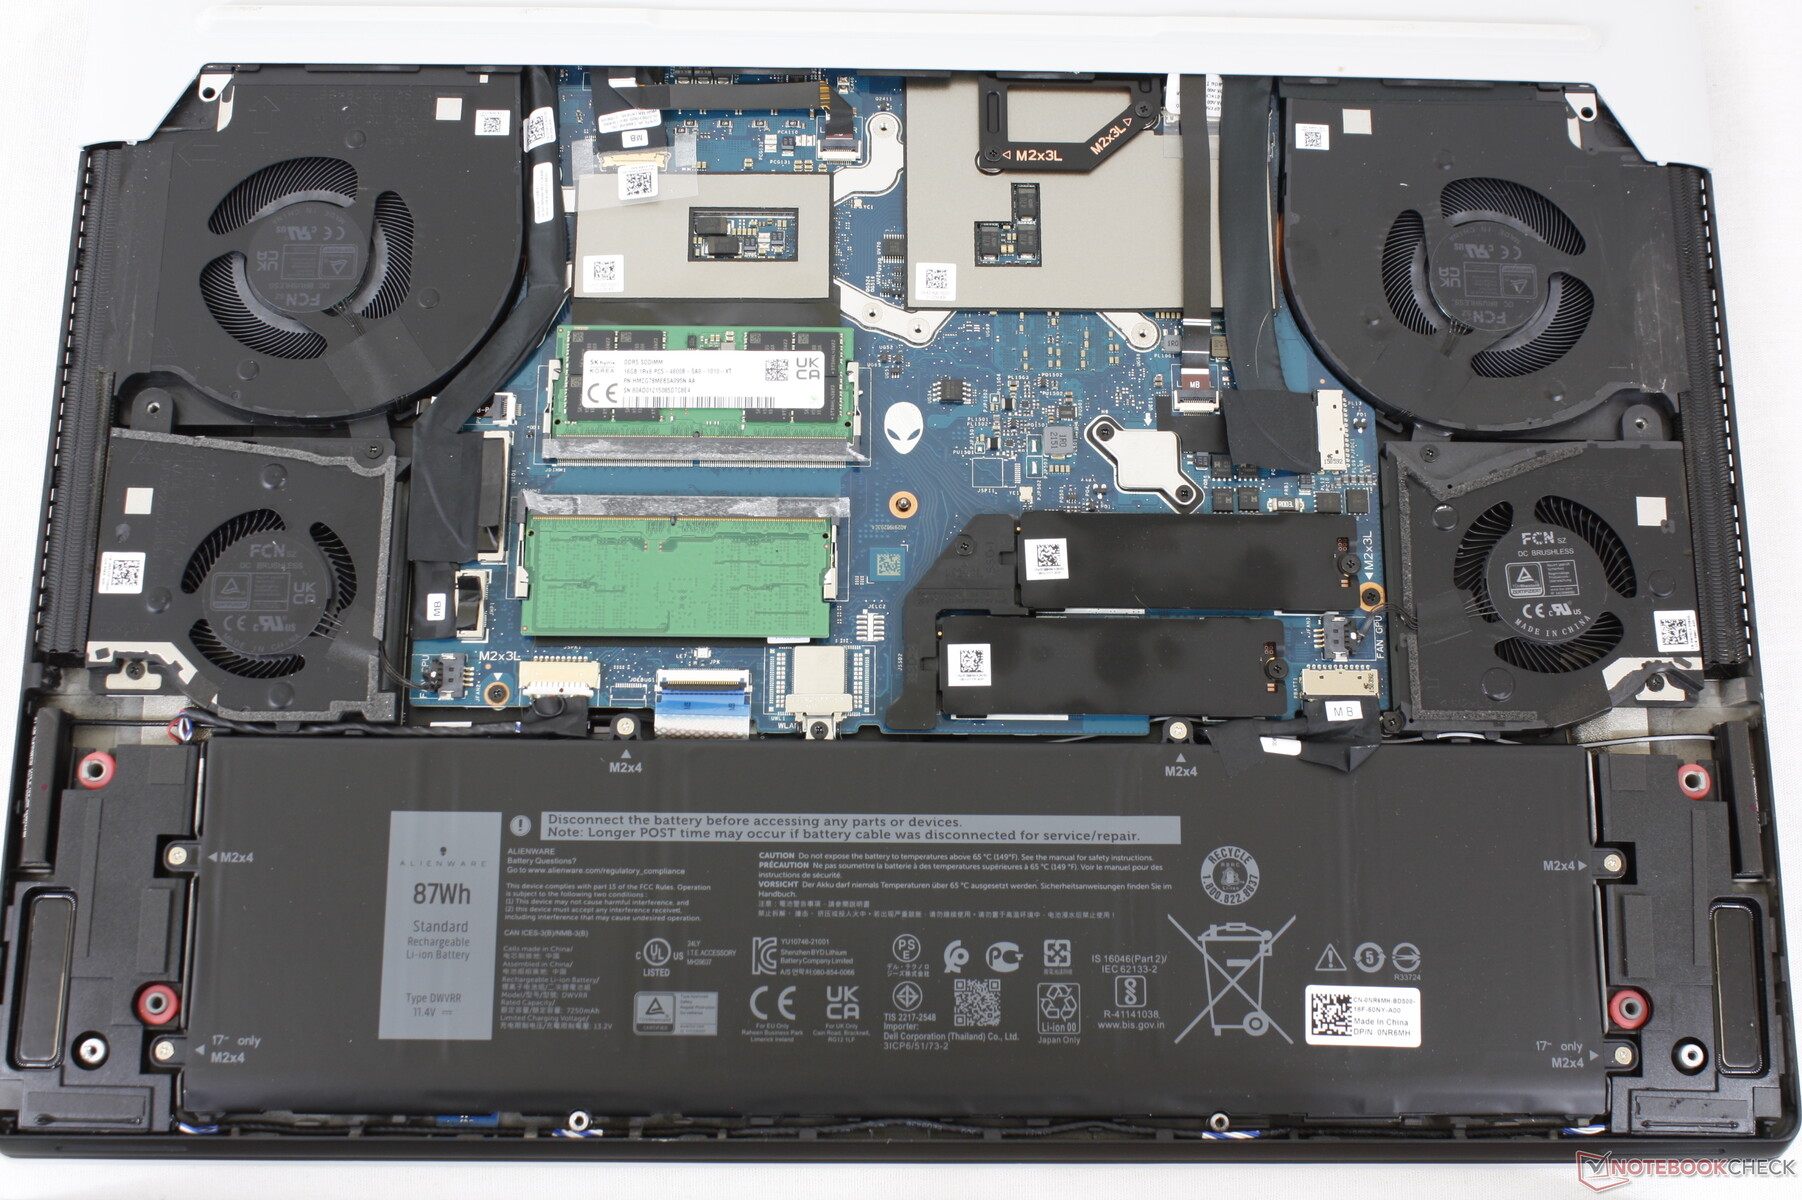
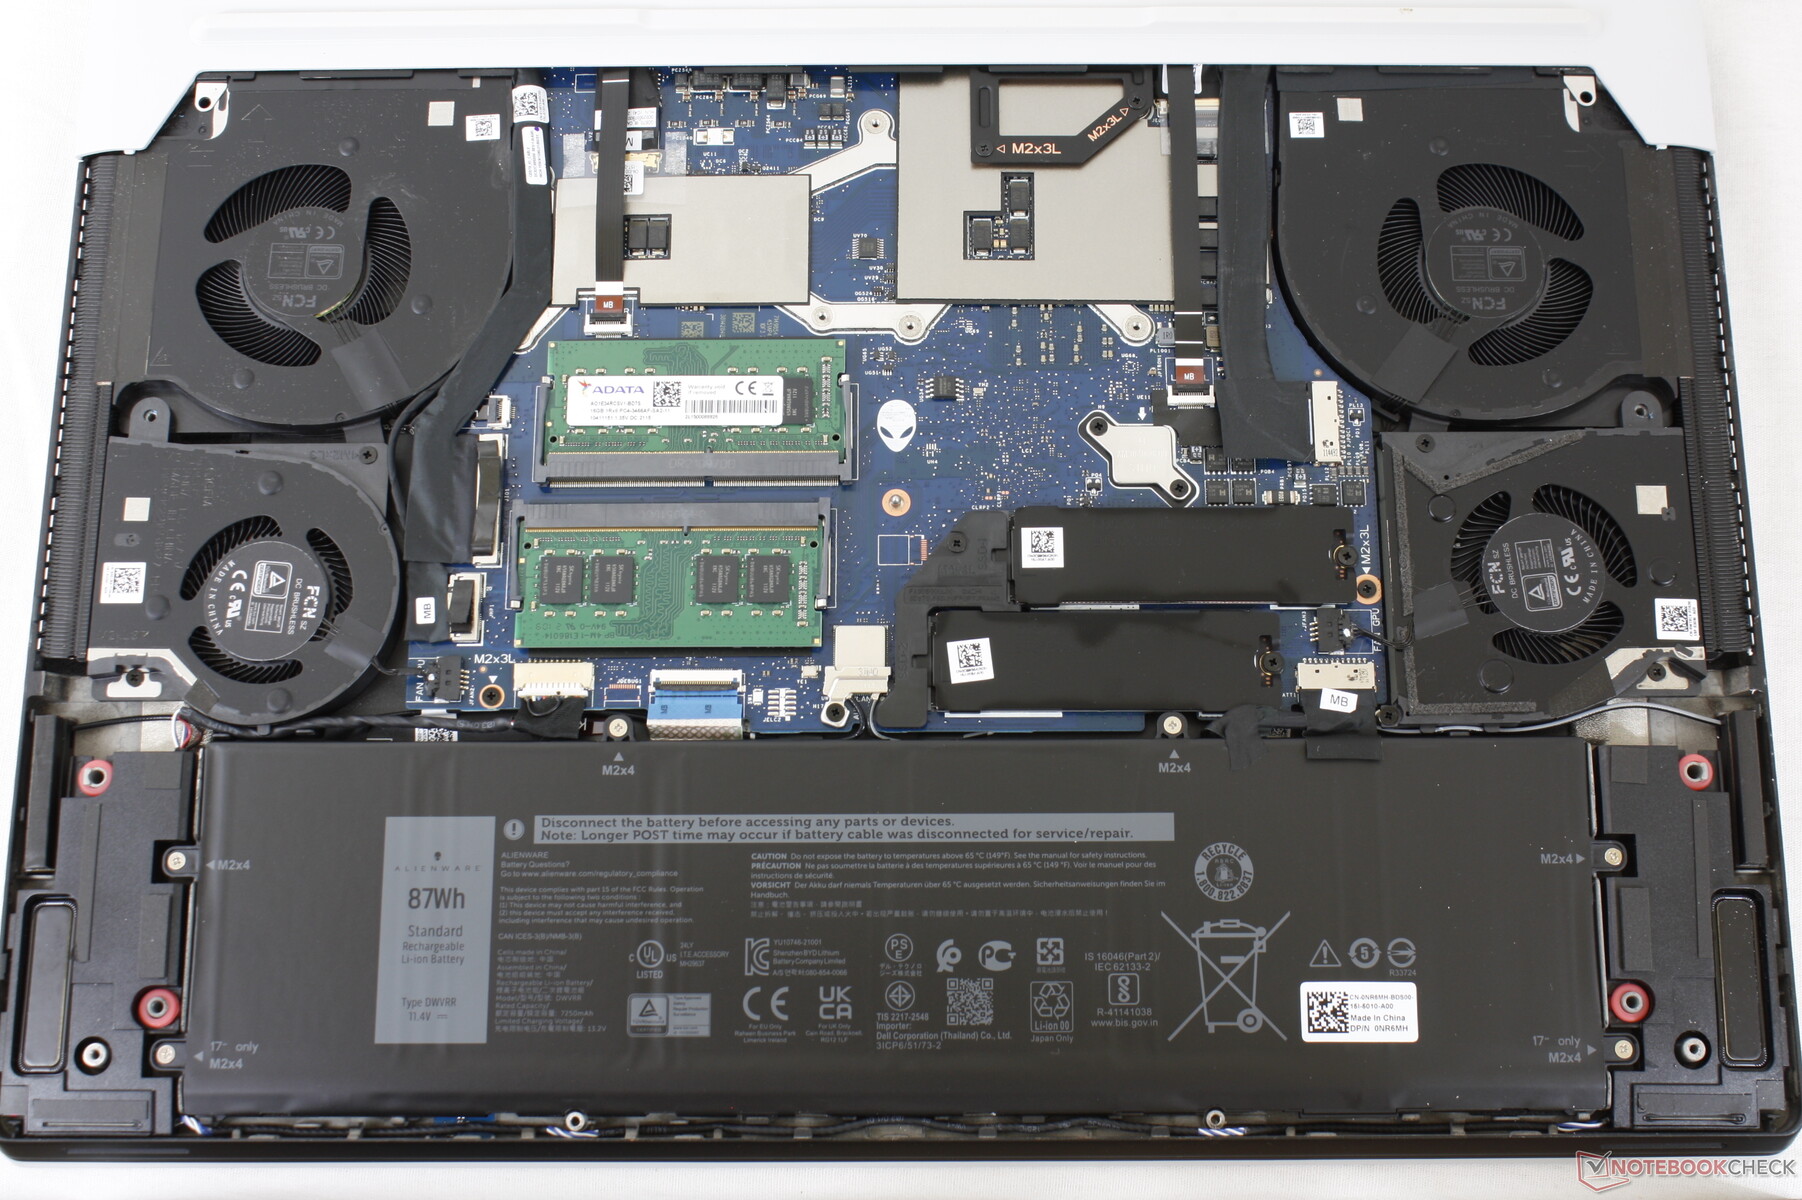
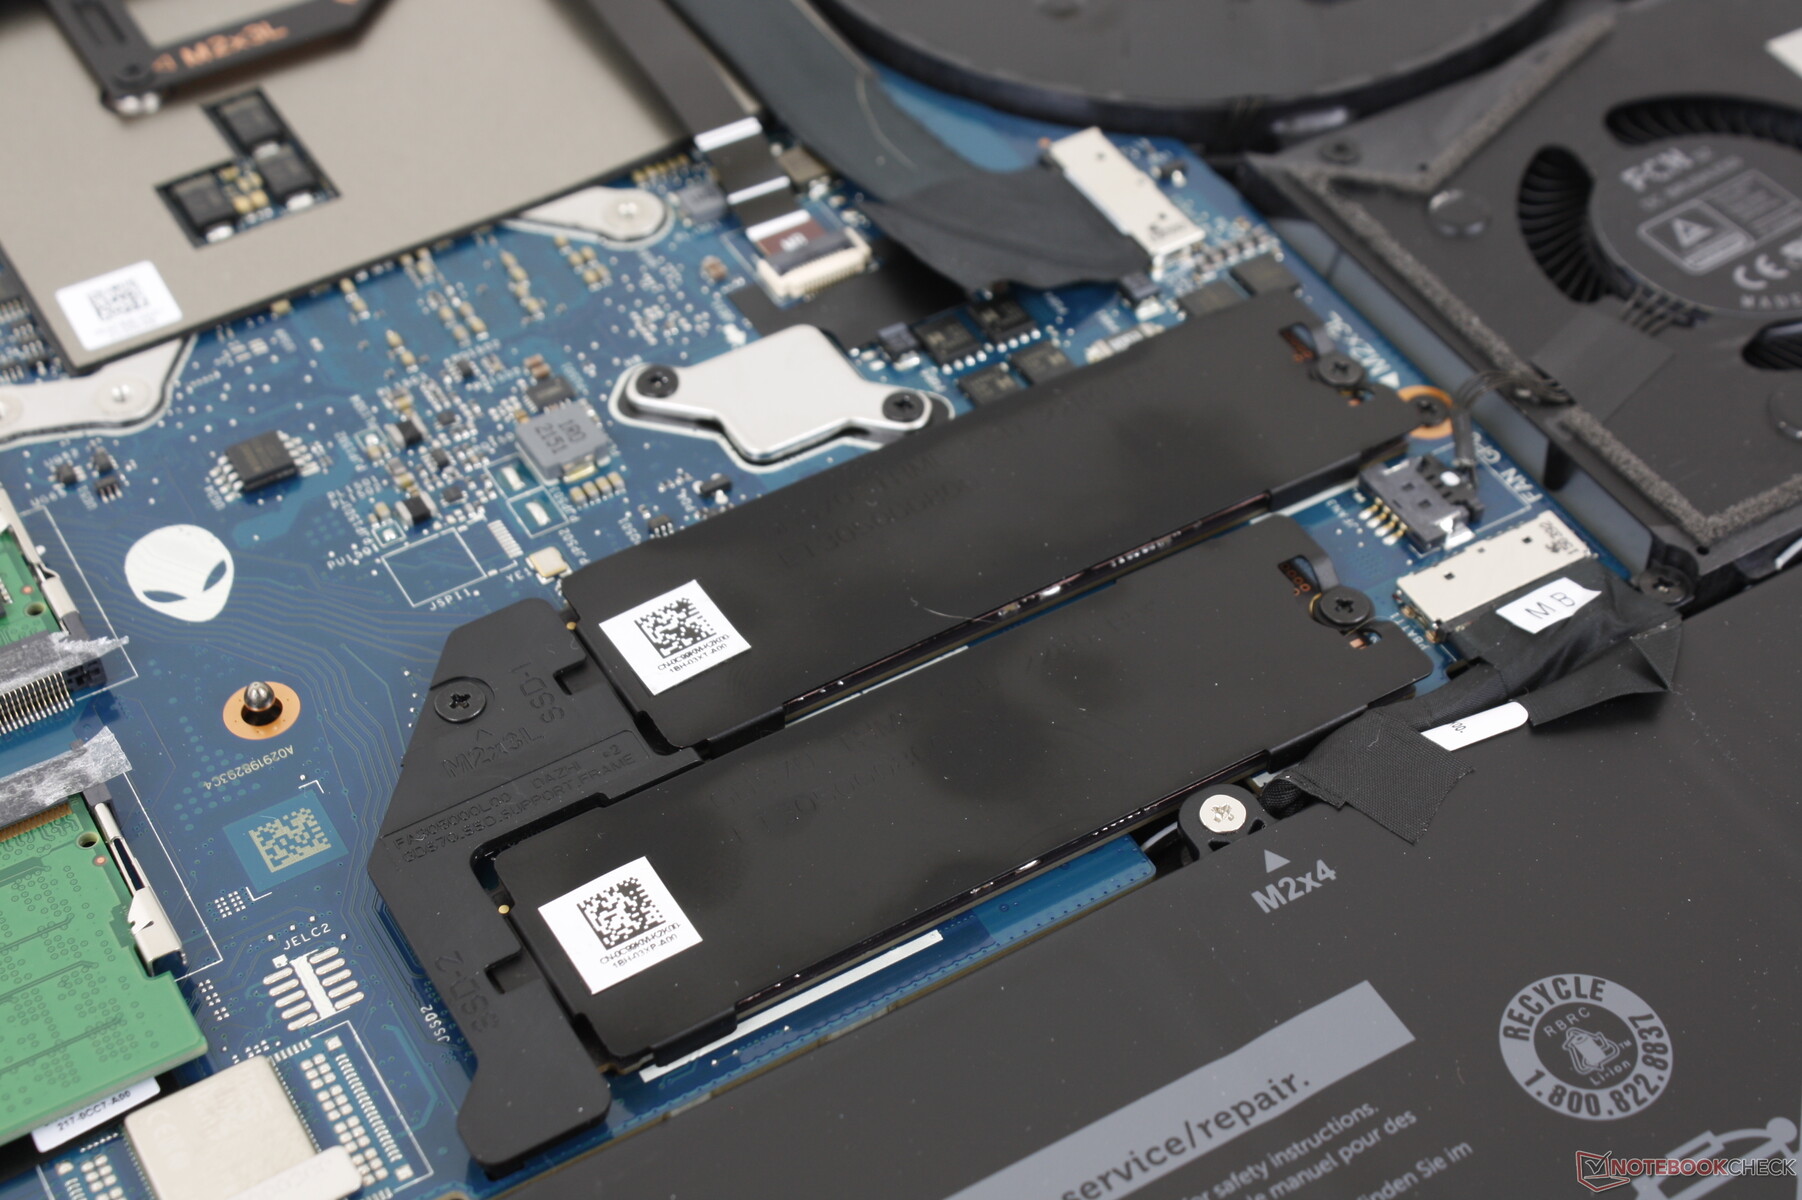
Underhåll
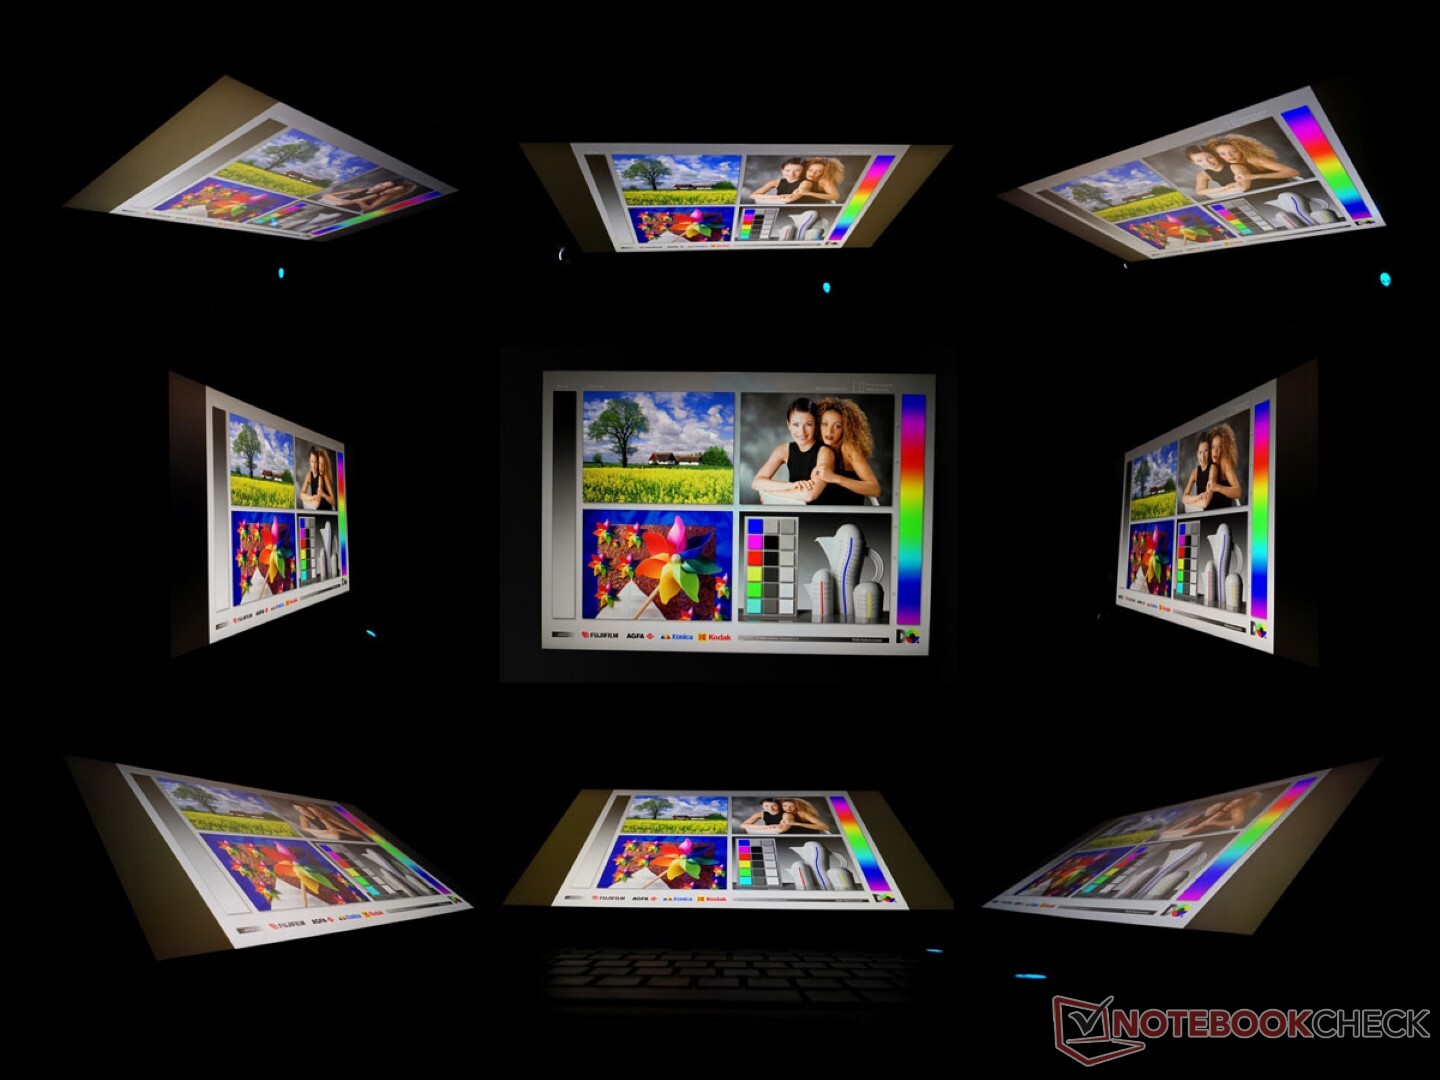
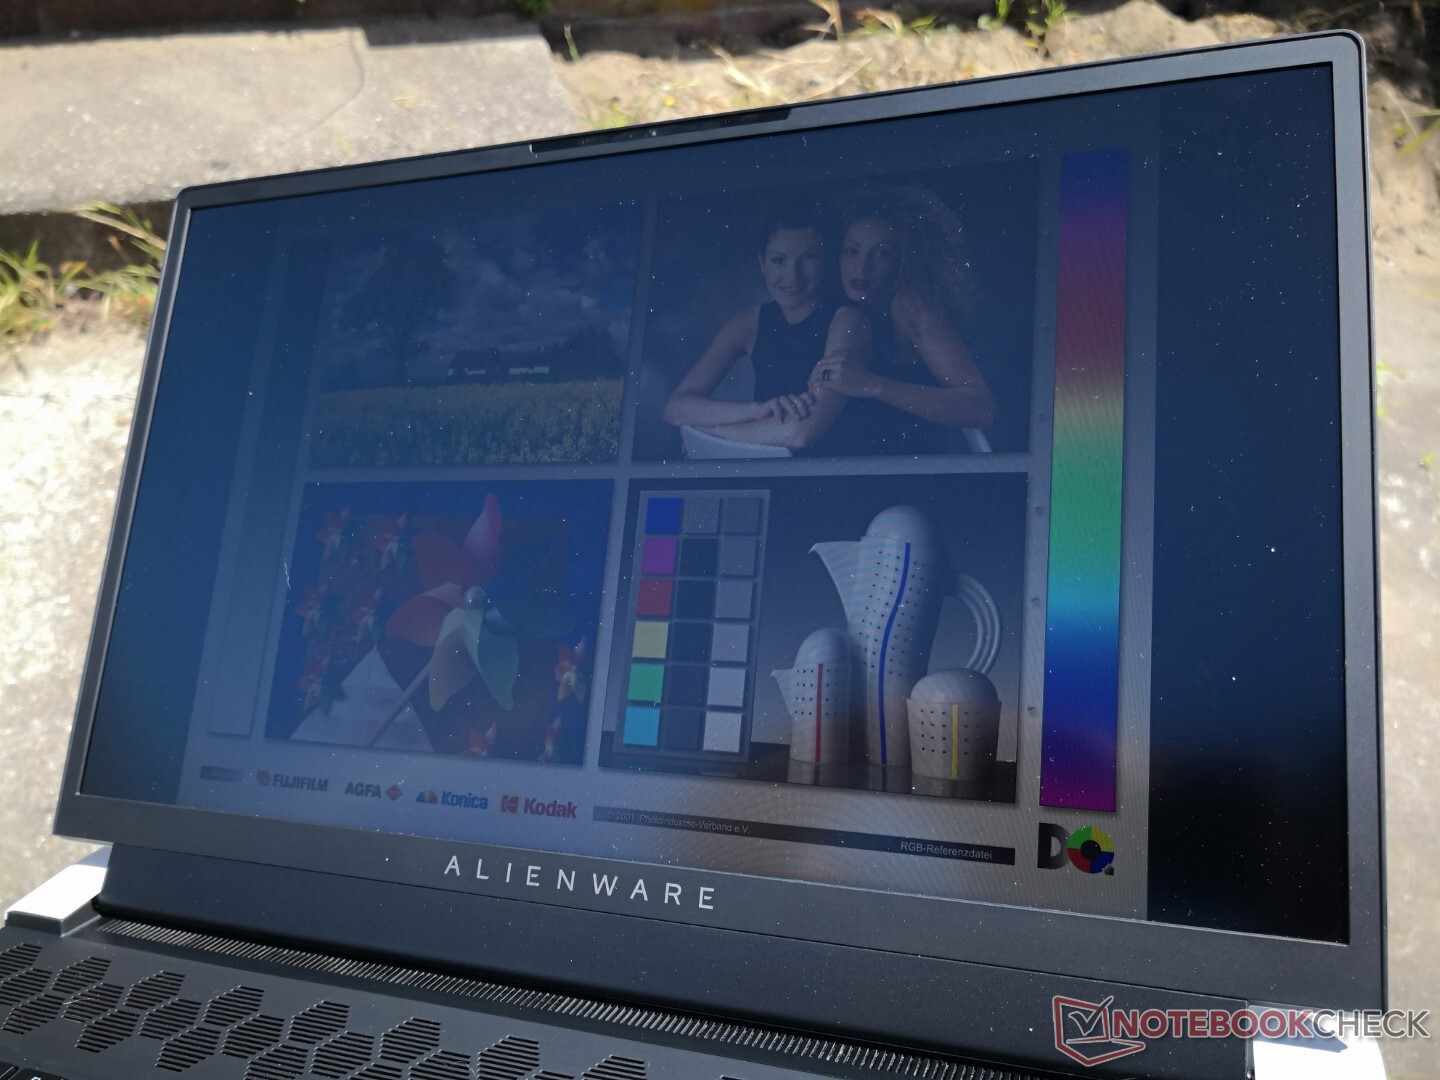
Skärm
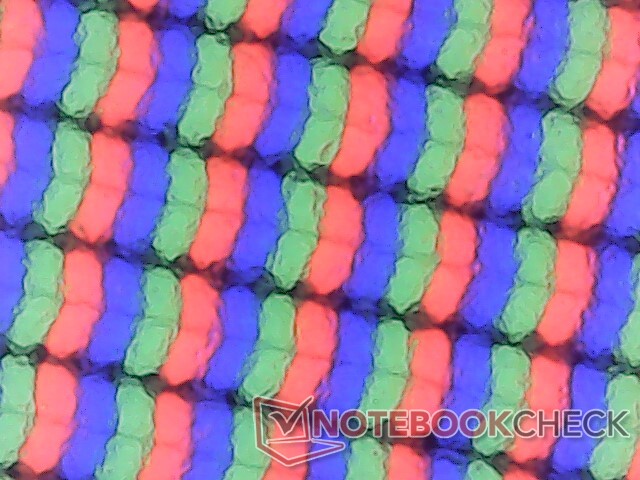
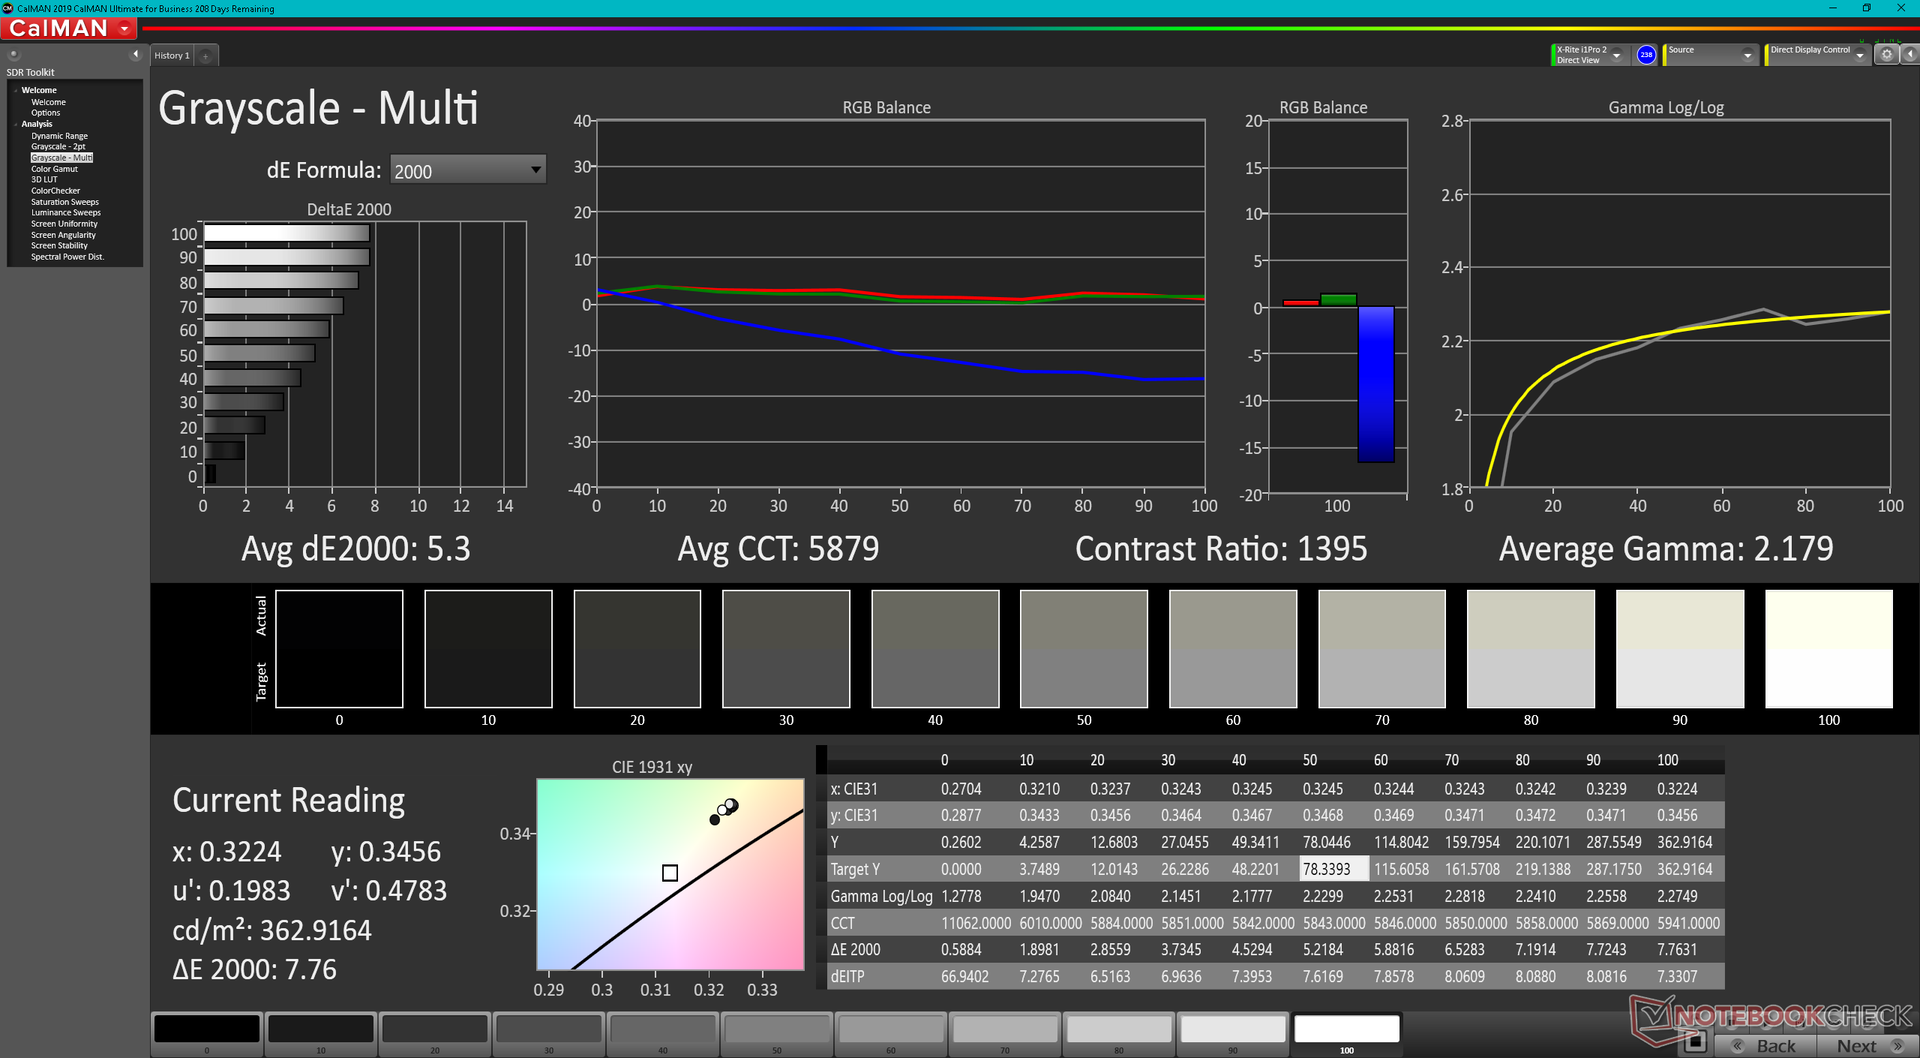
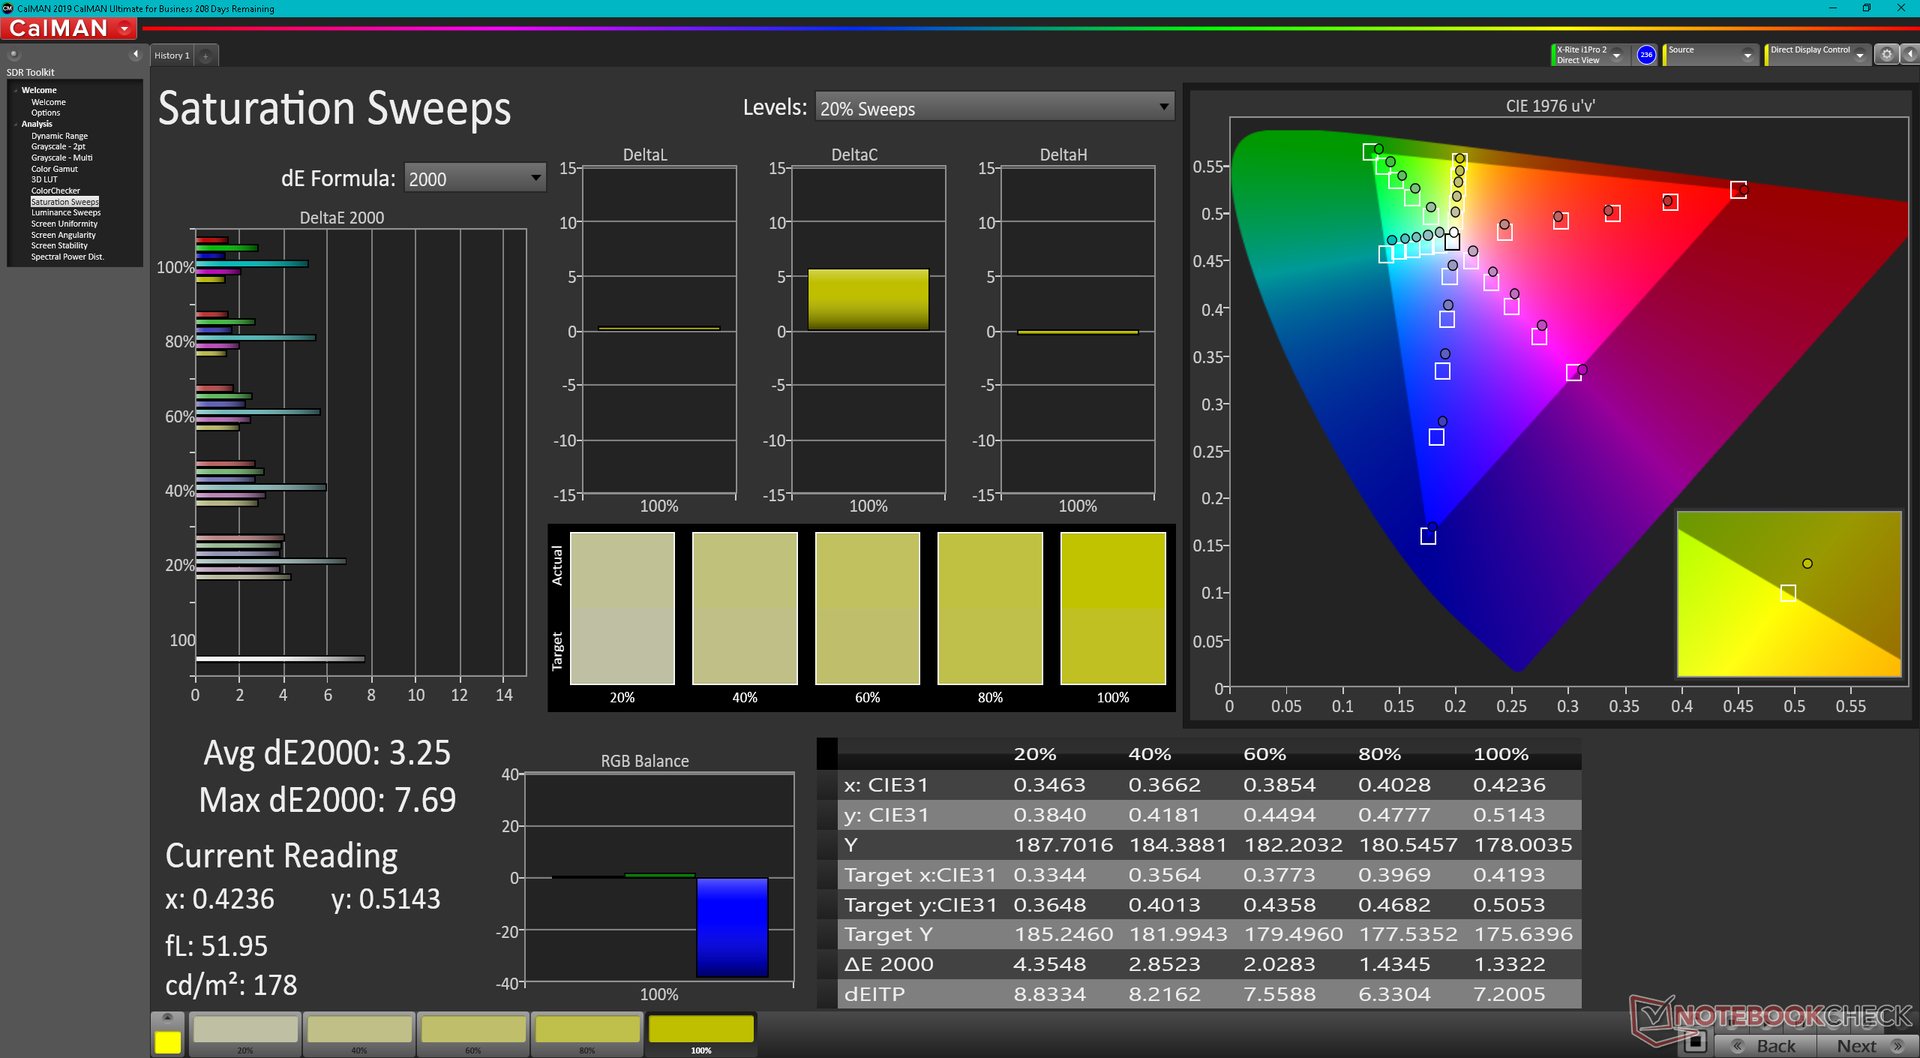
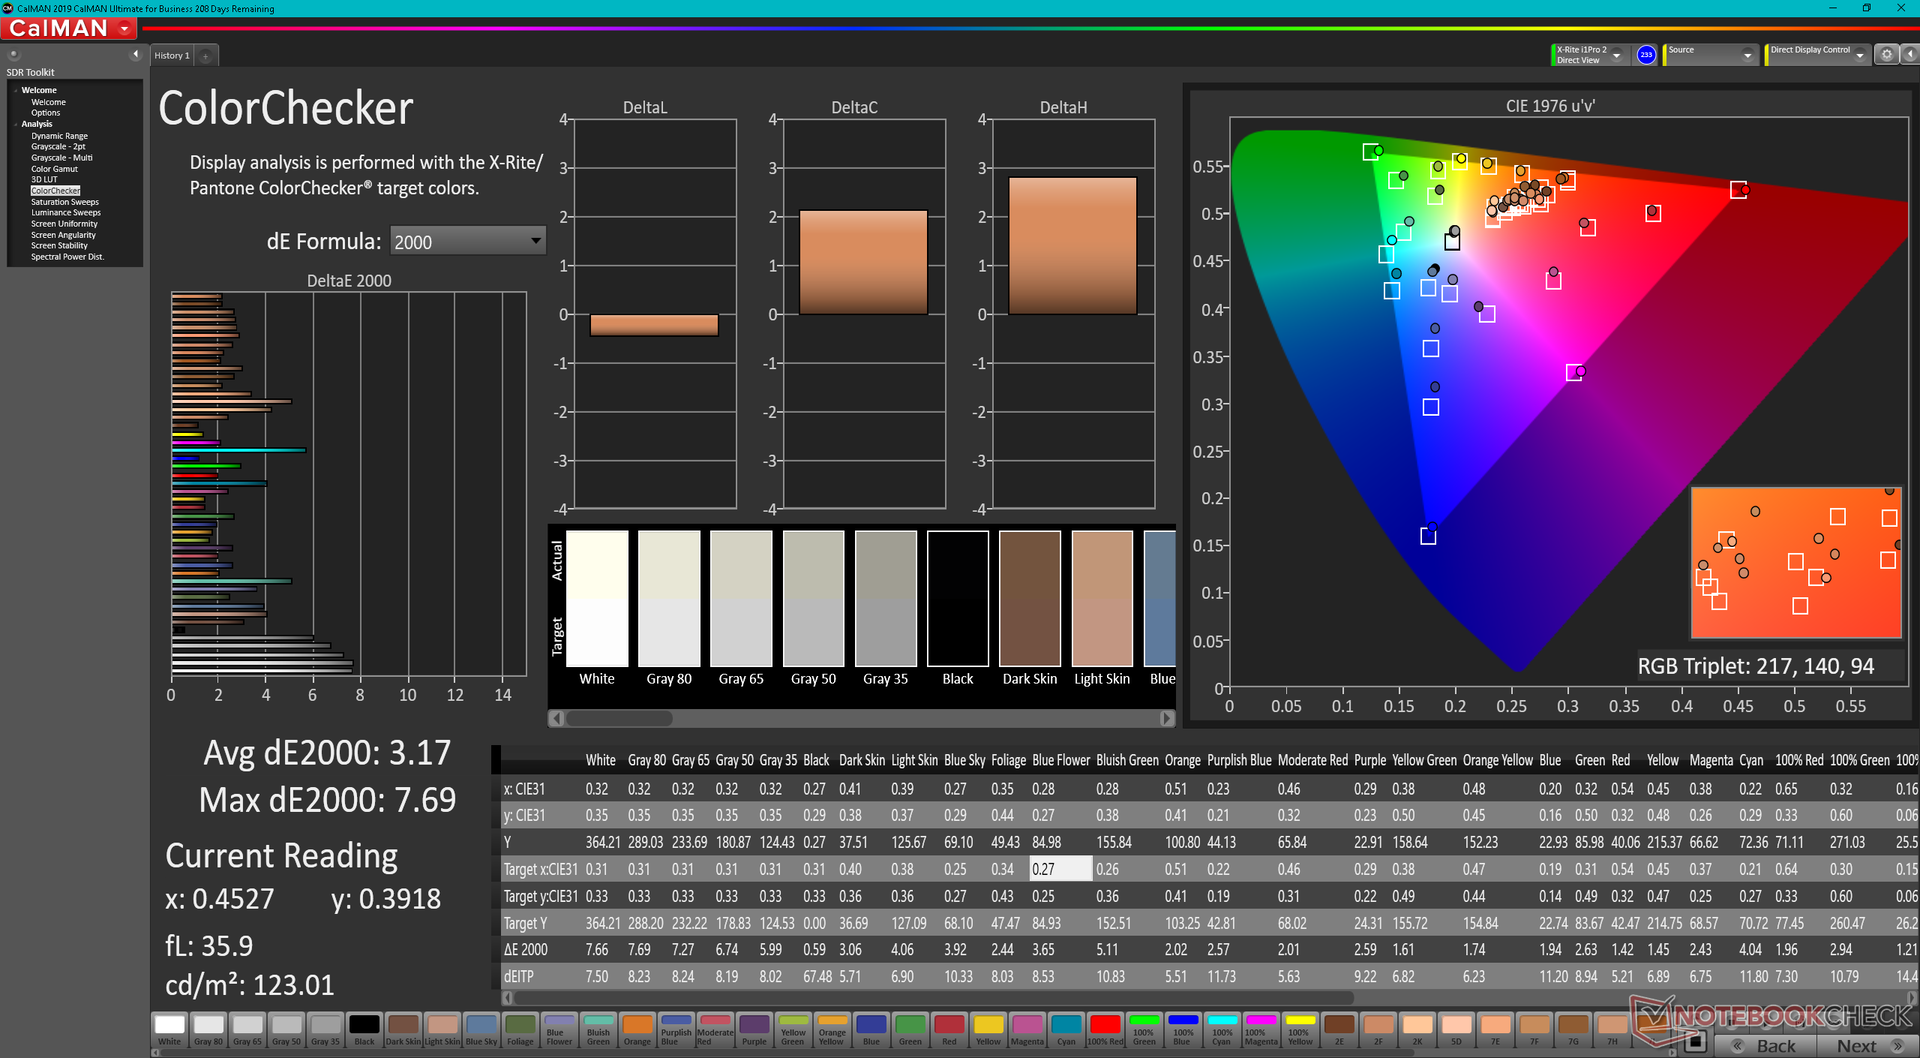
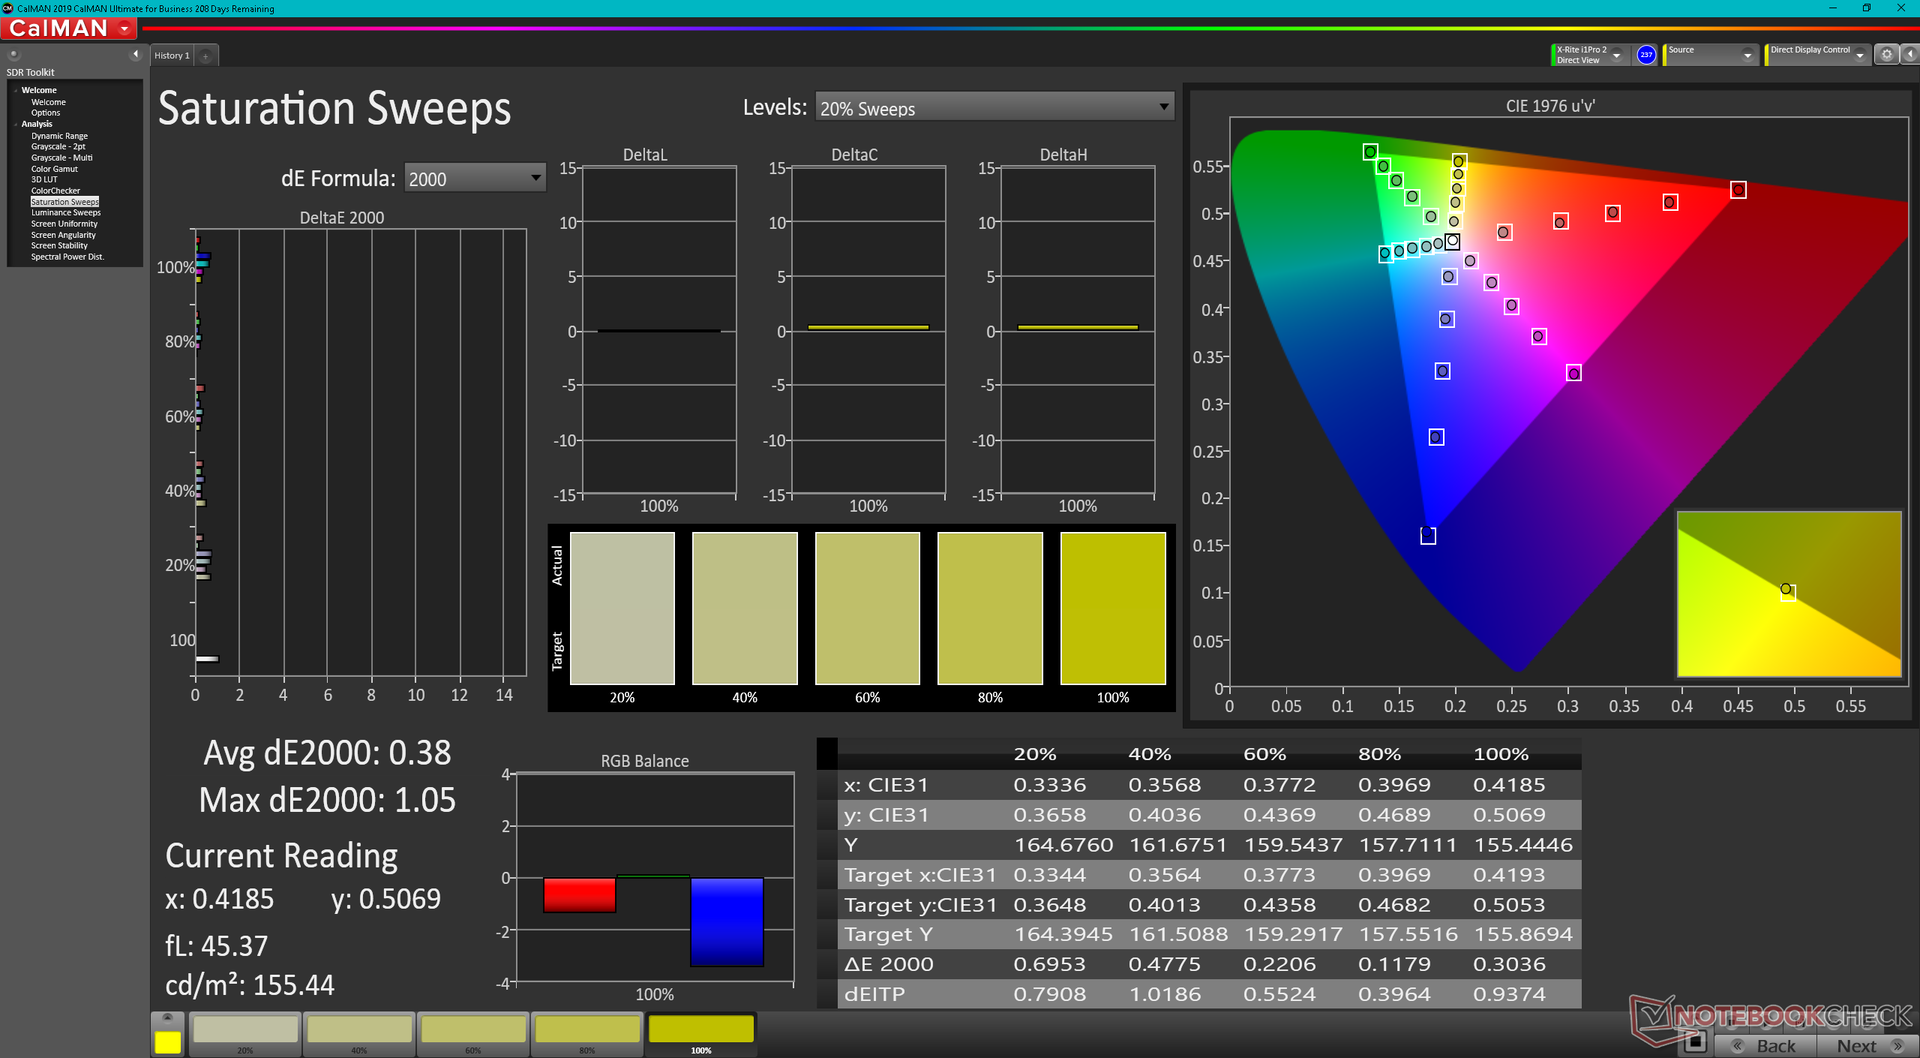
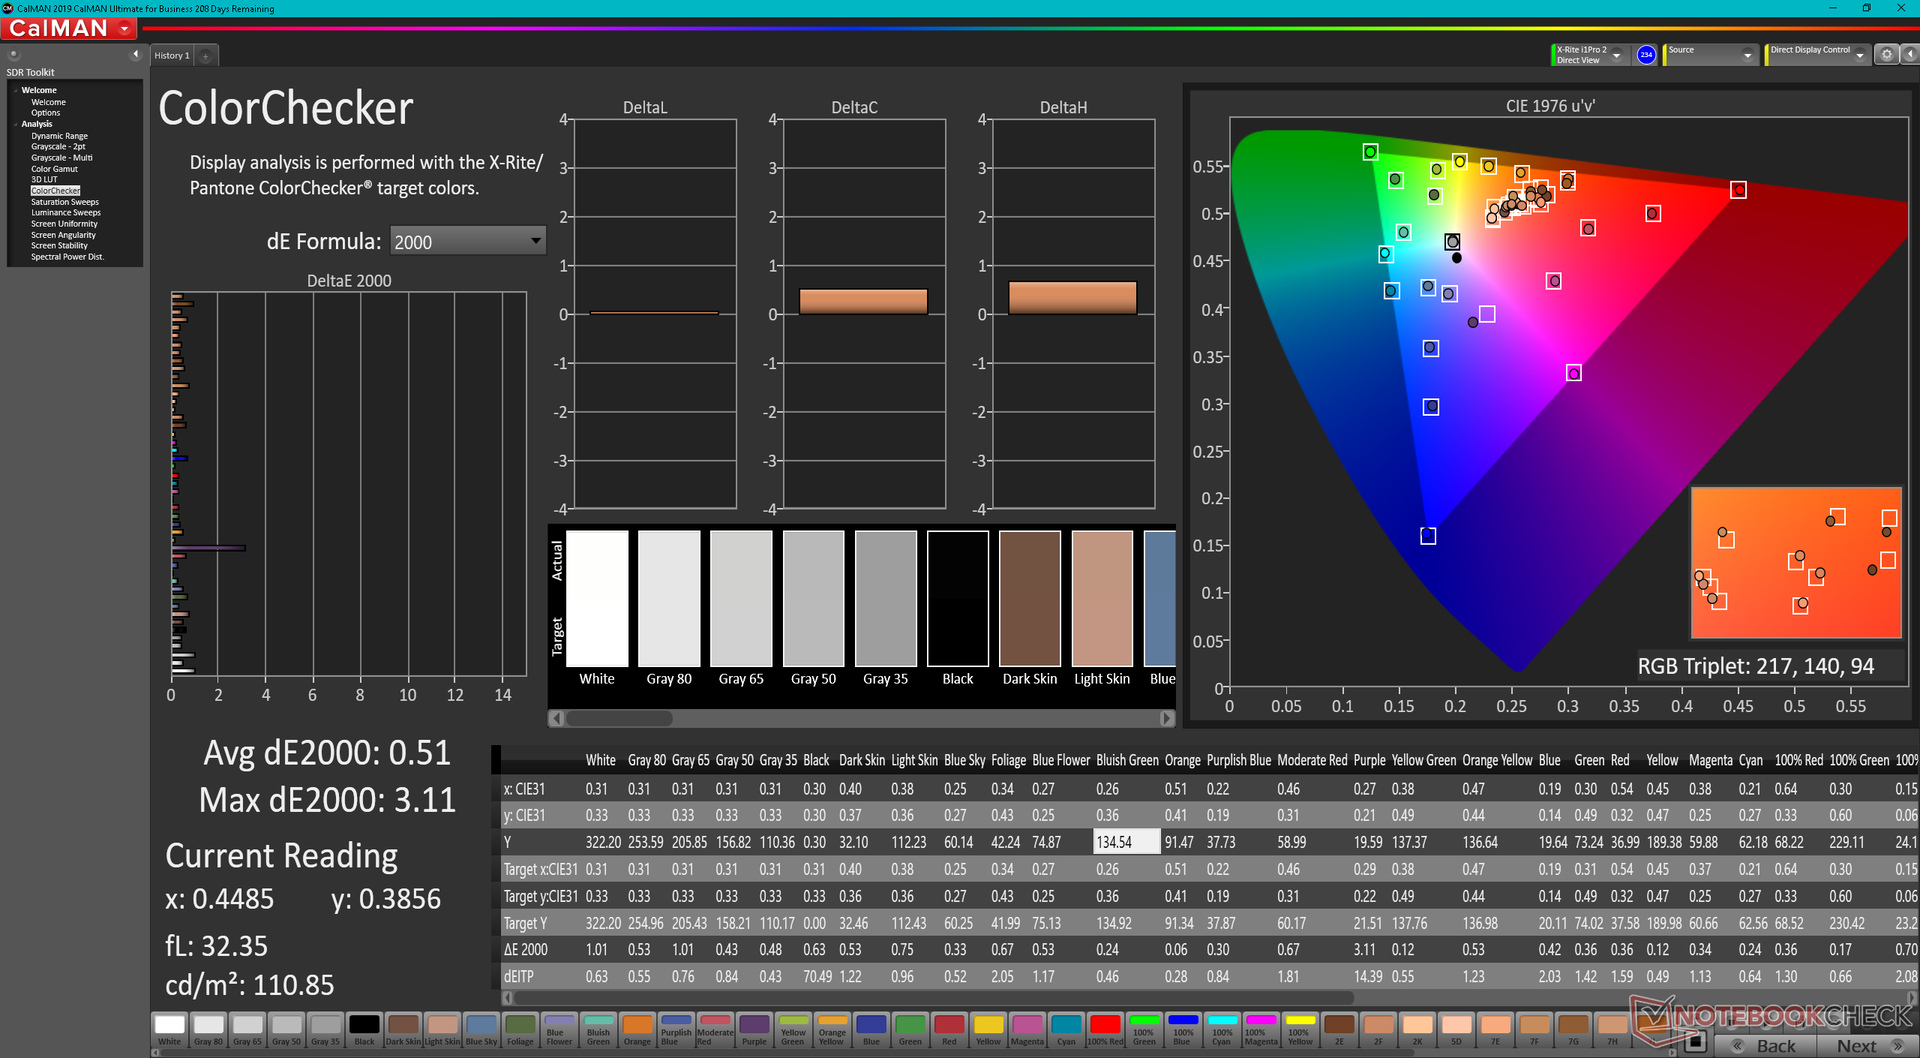
Vår AU Optronics B173HAN IPS-panel kontrollerar nästan alla typiska rutor, inklusive en snabb uppdateringsfrekvens på 360 Hz, snabba svarstider för svartvitt och grått och full sRGB-täckning för att passa för både spel och de flesta grafiska bearbetningar. Andra tillverkare av bärbara datorer med 17,3-tums 1080p 360 Hz-skärmalternativ kommer sannolikt att använda samma AU Optronics-panel som finns på vår Alienware. Det finns även ett högre 4K 120 Hz-alternativ i högre prisklass, alla med G-Sync-stöd.
Det finns för närvarande inga OLED-alternativ som skulle ha erbjudit en bredare DCI-P3-färgtäckning och djupare svartnivåer än den vanliga IPS-lösningen.
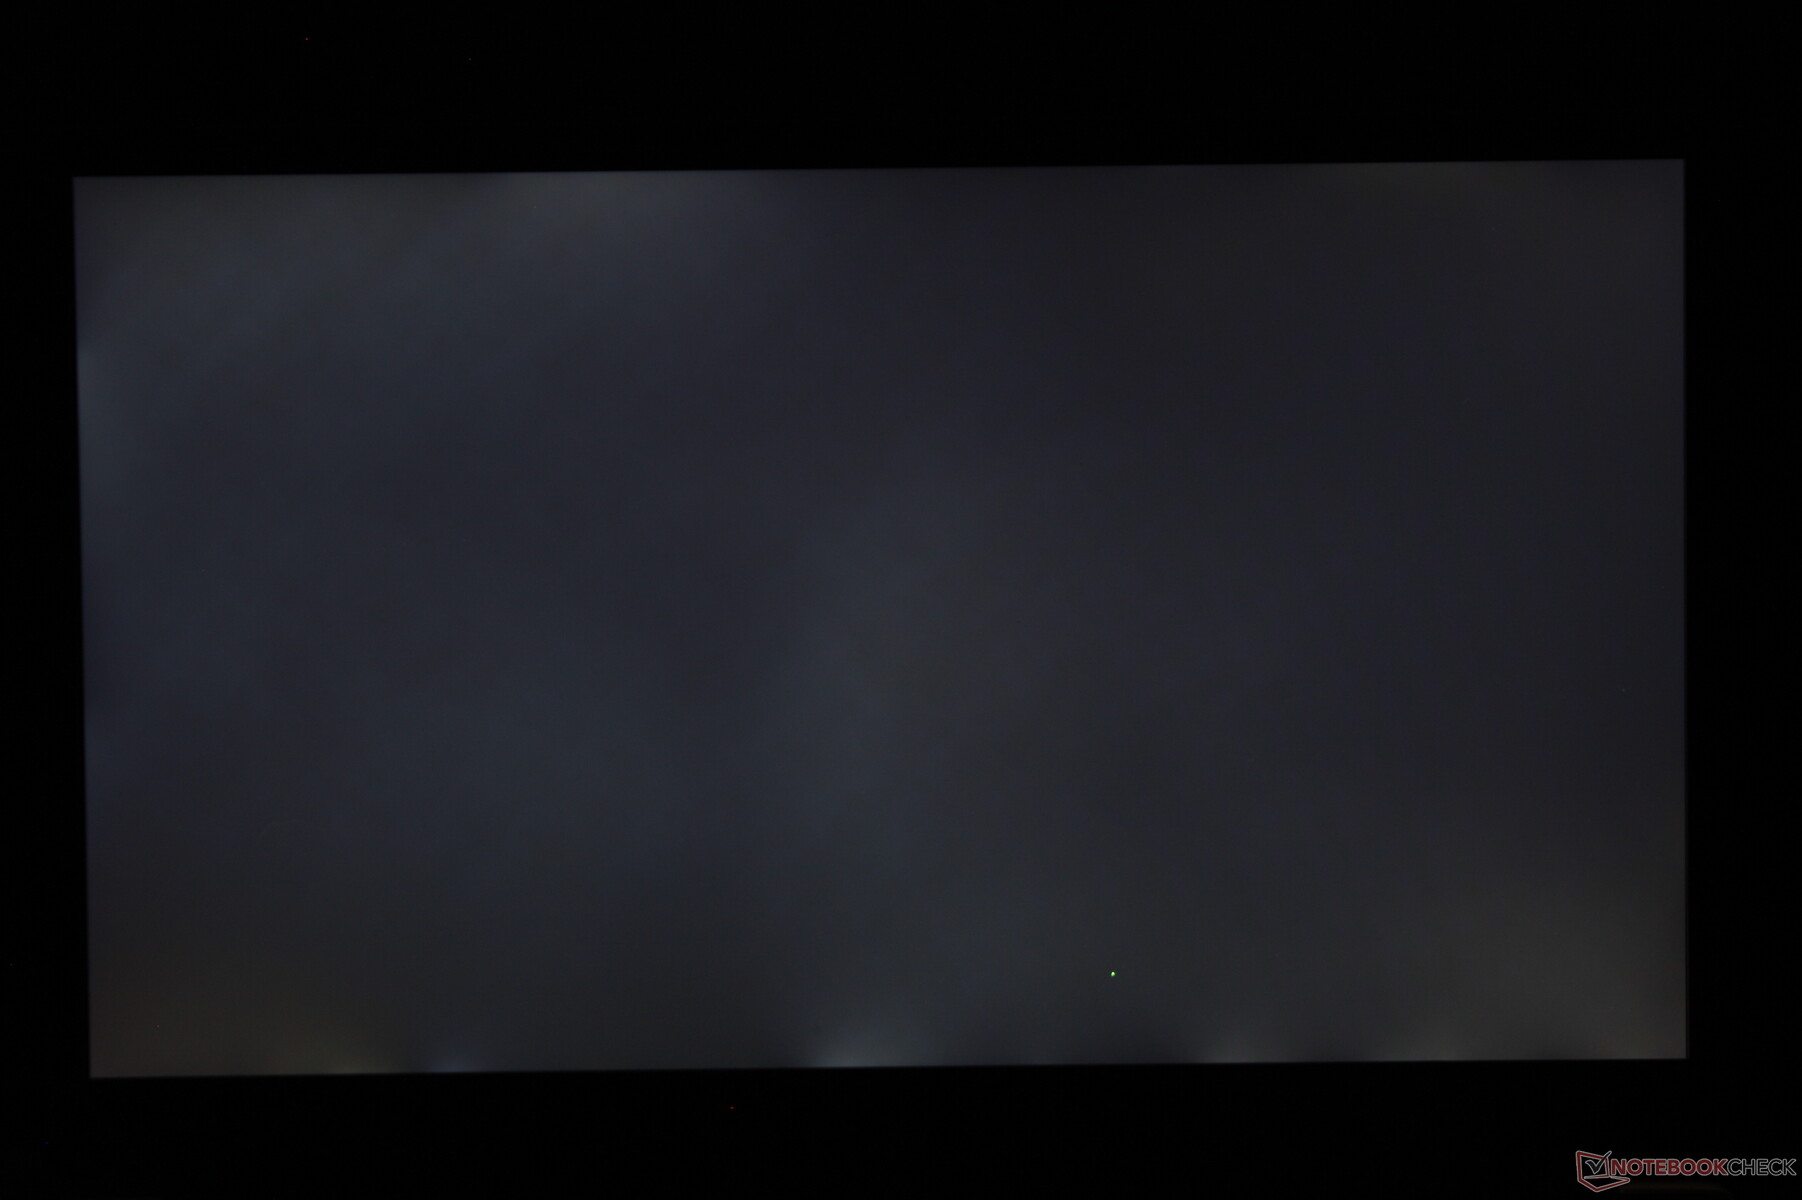
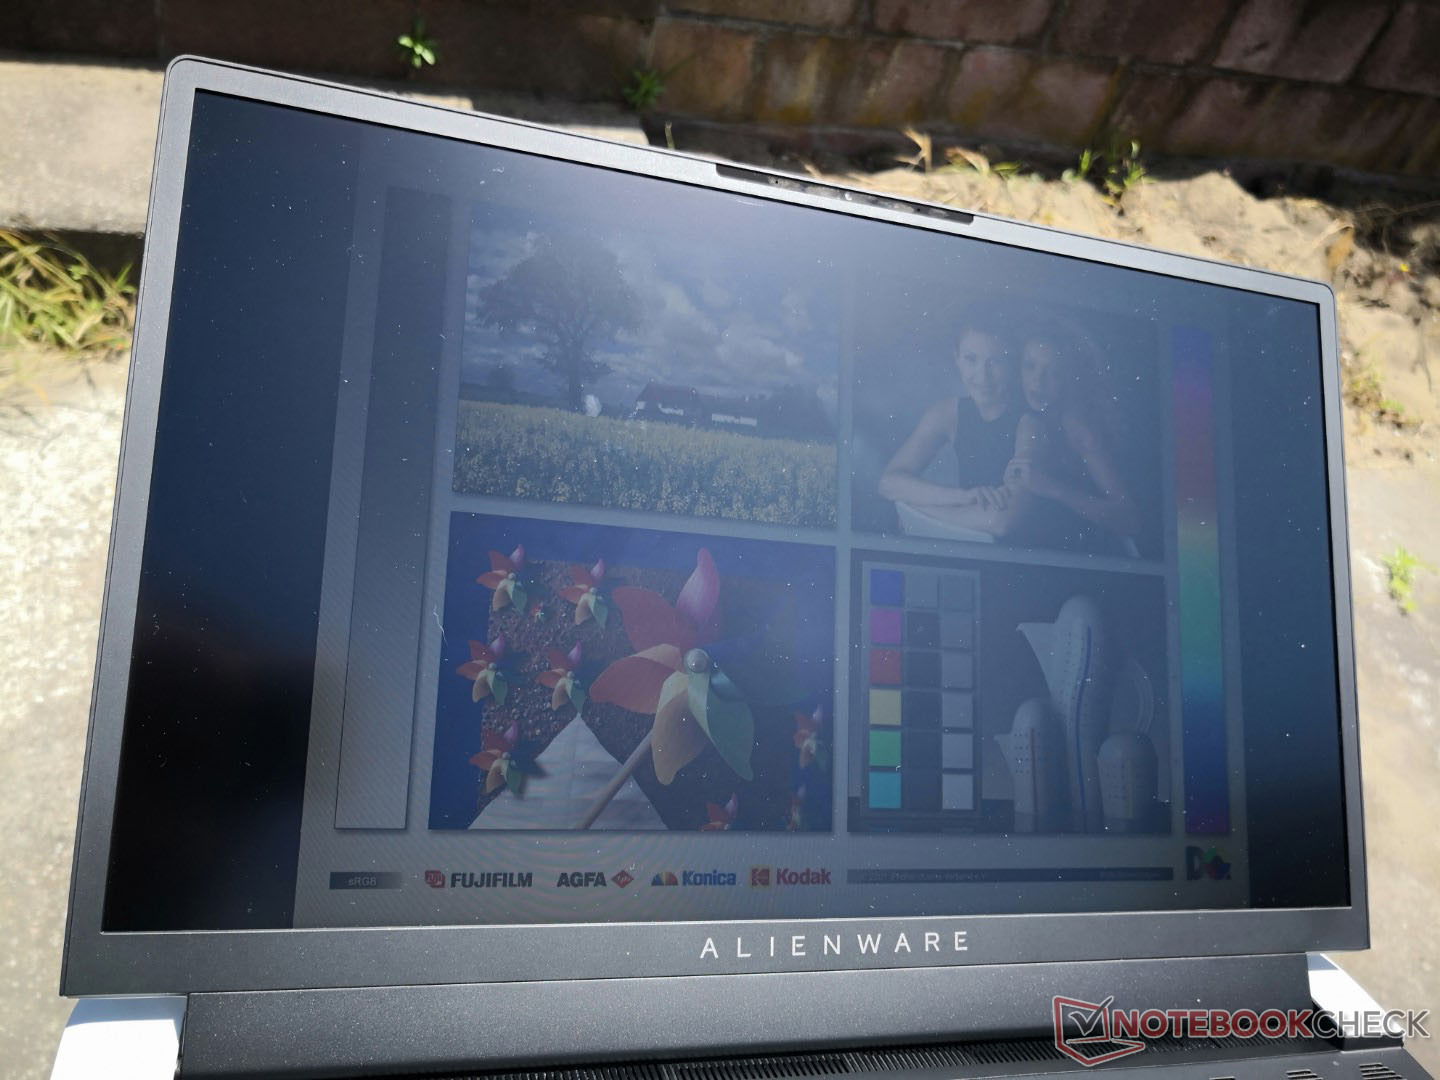
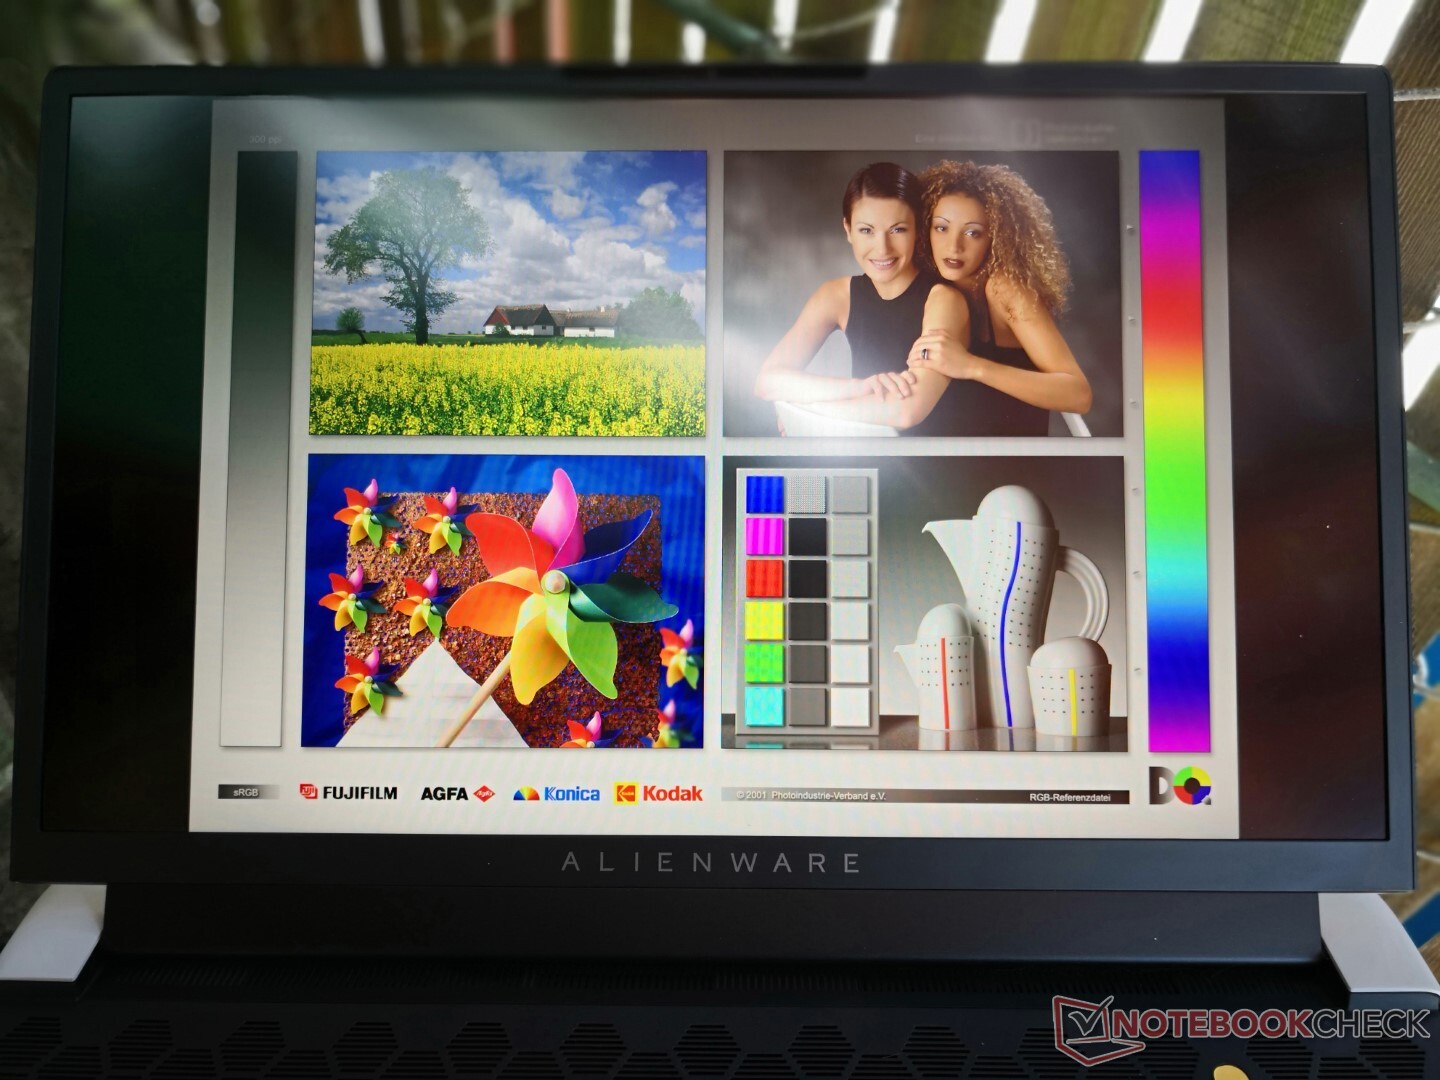
Intressant nog är vår FHD-panel inte lika ljusstark som 4K UHD-panelen på den ursprungliga x17 R1. Vi kan mäta en maximal ljusstyrka på 365 nits här jämfört med 439 nits på 4K x17 R1.
| |||||||||||||||||||||||||
Distribution av ljusstyrkan: 85 %
Mitt på batteriet: 365.4 cd/m²
Kontrast: 1260:1 (Svärta: 0.29 cd/m²)
ΔE ColorChecker Calman: 3.17 | ∀{0.5-29.43 Ø4.75}
calibrated: 0.51
ΔE Greyscale Calman: 5.3 | ∀{0.09-98 Ø5}
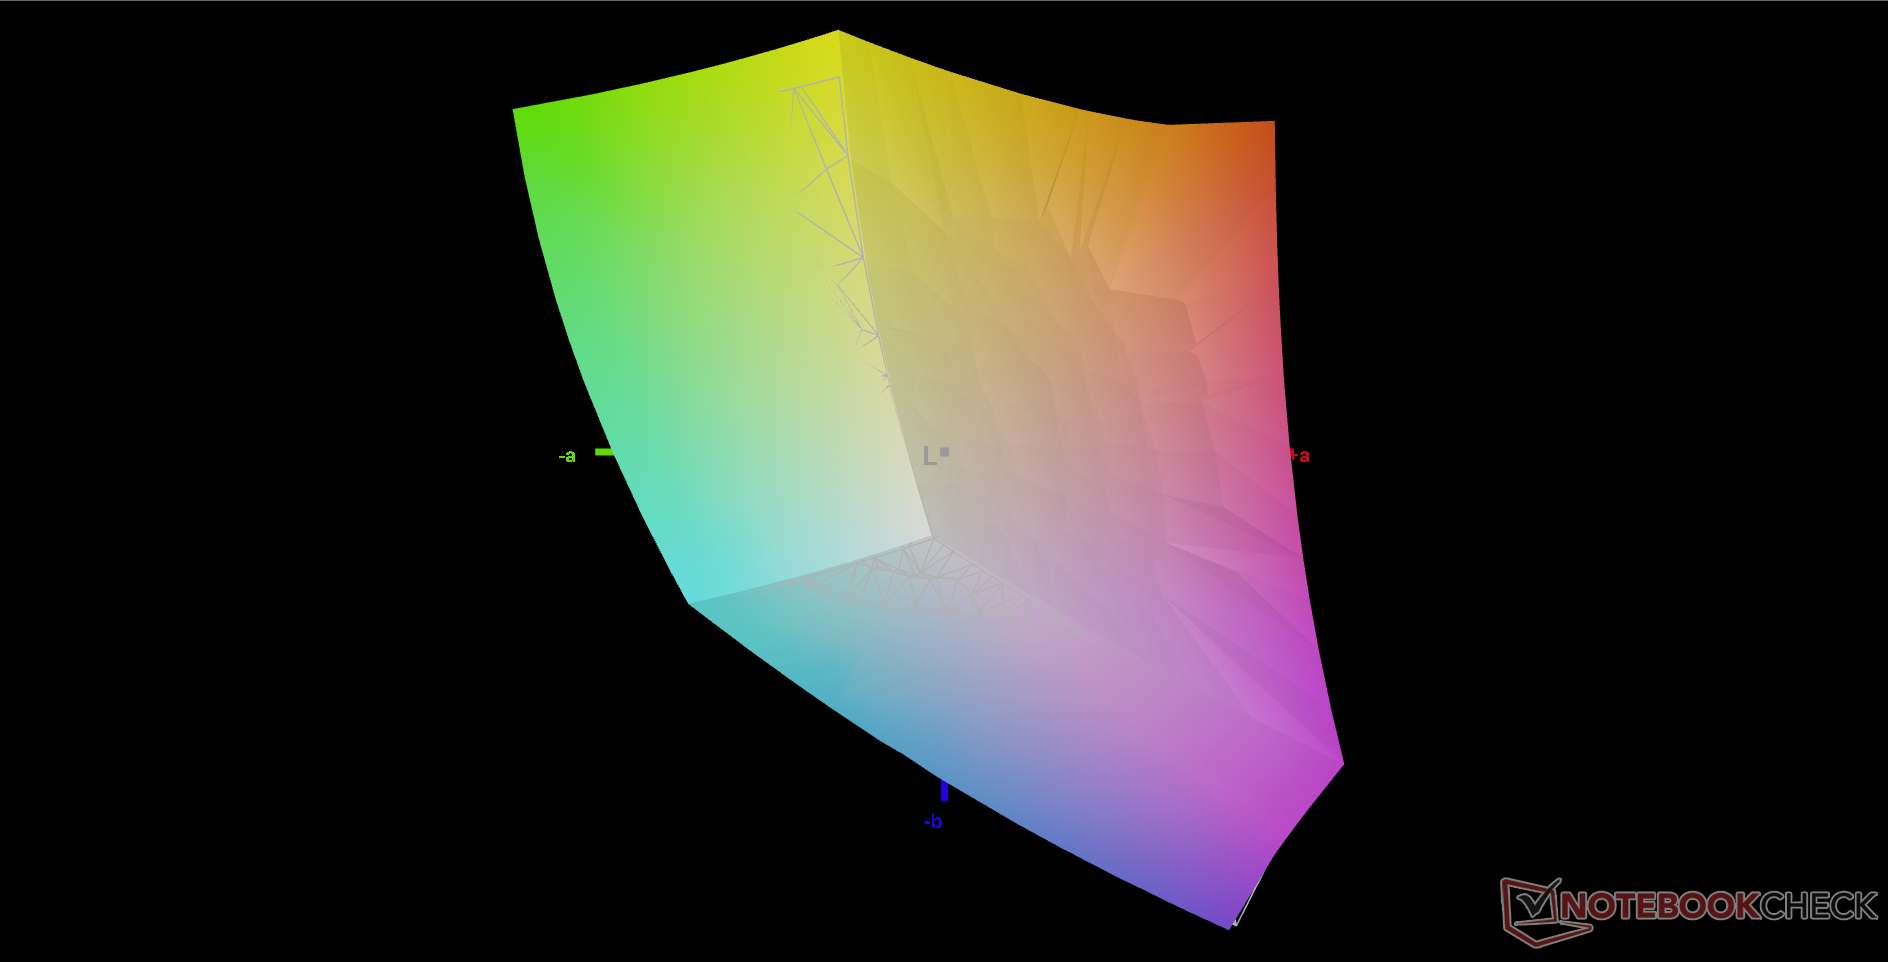
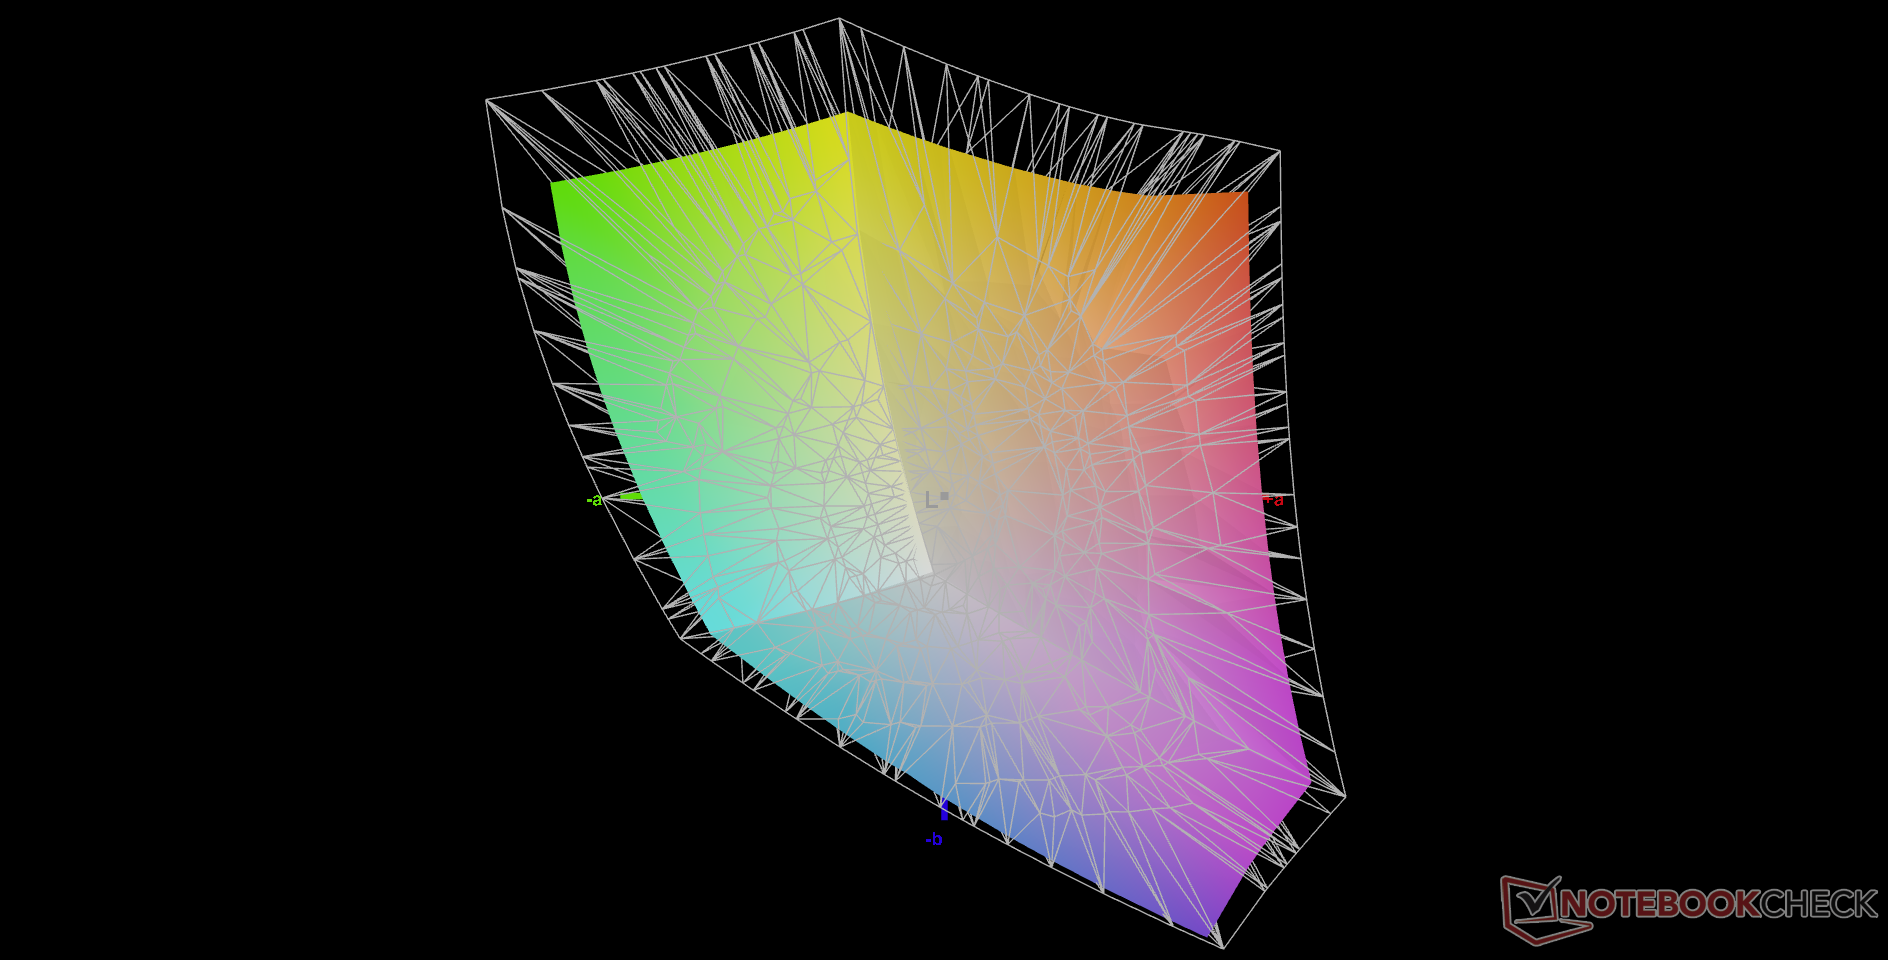
79.6% AdobeRGB 1998 (Argyll 3D)
99.8% sRGB (Argyll 3D)
79.2% Display P3 (Argyll 3D)
Gamma: 2.18
CCT: 5879 K
| Alienware x17 R2 P48E AU Optronics B173HAN, IPS, 1920x1080, 17.3" | Alienware x17 RTX 3080 P48E AU Optronics B173ZAN, IPS, 3840x2160, 17.3" | Asus ROG Zephyrus S17 GX703HSD BOE099D (BOE CQ NE173QHM-NY3), IPS, 2560x1440, 17.3" | MSI Stealth GS77 12UHS-083US BOE NE173QHM-NZ1, IPS, 2560x1440, 17.3" | MSI GT76 Titan DT 10SGS AU Optronics B173ZAN03.3, IPS, 3840x2160, 17.3" | Gigabyte A7 X1 AU Optronics AUO8E8D, IPS, 1920x1080, 17.3" | |
|---|---|---|---|---|---|---|
| Display | 12% | 8% | 10% | 8% | -17% | |
| Display P3 Coverage (%) | 79.2 | 88.3 11% | 94.2 19% | 96.2 21% | 82.5 4% | 61.5 -22% |
| sRGB Coverage (%) | 99.8 | 100 0% | 98.7 -1% | 99.7 0% | 98 -2% | 90.9 -9% |
| AdobeRGB 1998 Coverage (%) | 79.6 | 100 26% | 84.4 6% | 85.8 8% | 96.6 21% | 63.2 -21% |
| Response Times | -15% | 37% | -41% | -57% | -23% | |
| Response Time Grey 50% / Grey 80% * (ms) | 12.4 ? | 14.4 ? -16% | 4.8 61% | 17.6 ? -42% | 23.2 ? -87% | 16 ? -29% |
| Response Time Black / White * (ms) | 9.2 ? | 10.4 ? -13% | 8 13% | 12.8 ? -39% | 11.6 ? -26% | 10.8 ? -17% |
| PWM Frequency (Hz) | ||||||
| Screen | -6% | -29% | -12% | -55% | -39% | |
| Brightness middle (cd/m²) | 365.4 | 438.7 20% | 322 -12% | 334.8 -8% | 419.5 15% | 325 -11% |
| Brightness (cd/m²) | 344 | 435 26% | 288 -16% | 305 -11% | 413 20% | 318 -8% |
| Brightness Distribution (%) | 85 | 91 7% | 72 -15% | 79 -7% | 93 9% | 95 12% |
| Black Level * (cd/m²) | 0.29 | 0.48 -66% | 0.3 -3% | 0.34 -17% | 0.4 -38% | 0.29 -0% |
| Contrast (:1) | 1260 | 914 -27% | 1073 -15% | 985 -22% | 1049 -17% | 1121 -11% |
| Colorchecker dE 2000 * | 3.17 | 4.34 -37% | 3.05 4% | 4.1 -29% | 3.4 -7% | 4.33 -37% |
| Colorchecker dE 2000 max. * | 7.69 | 7.3 5% | 5.23 32% | 7.28 5% | 7.4 4% | 8.6 -12% |
| Colorchecker dE 2000 calibrated * | 0.51 | 0.72 -41% | 1.92 -276% | 3.28 -543% | 1.95 -282% | |
| Greyscale dE 2000 * | 5.3 | 2.4 55% | 3.11 41% | 5.6 -6% | 2 62% | 5.5 -4% |
| Gamma | 2.18 101% | 2.09 105% | 2.13 103% | 2.16 102% | 2.14 103% | 2.142 103% |
| CCT | 5879 111% | 6413 101% | 6553 99% | 6314 103% | 6858 95% | 7893 82% |
| Color Space (Percent of AdobeRGB 1998) (%) | 84 | 84.6 | ||||
| Color Space (Percent of sRGB) (%) | 99 | 97.9 | ||||
| Totalt genomsnitt (program/inställningar) | -3% /
-4% | 5% /
-12% | -14% /
-11% | -35% /
-42% | -26% /
-32% |
* ... mindre är bättre
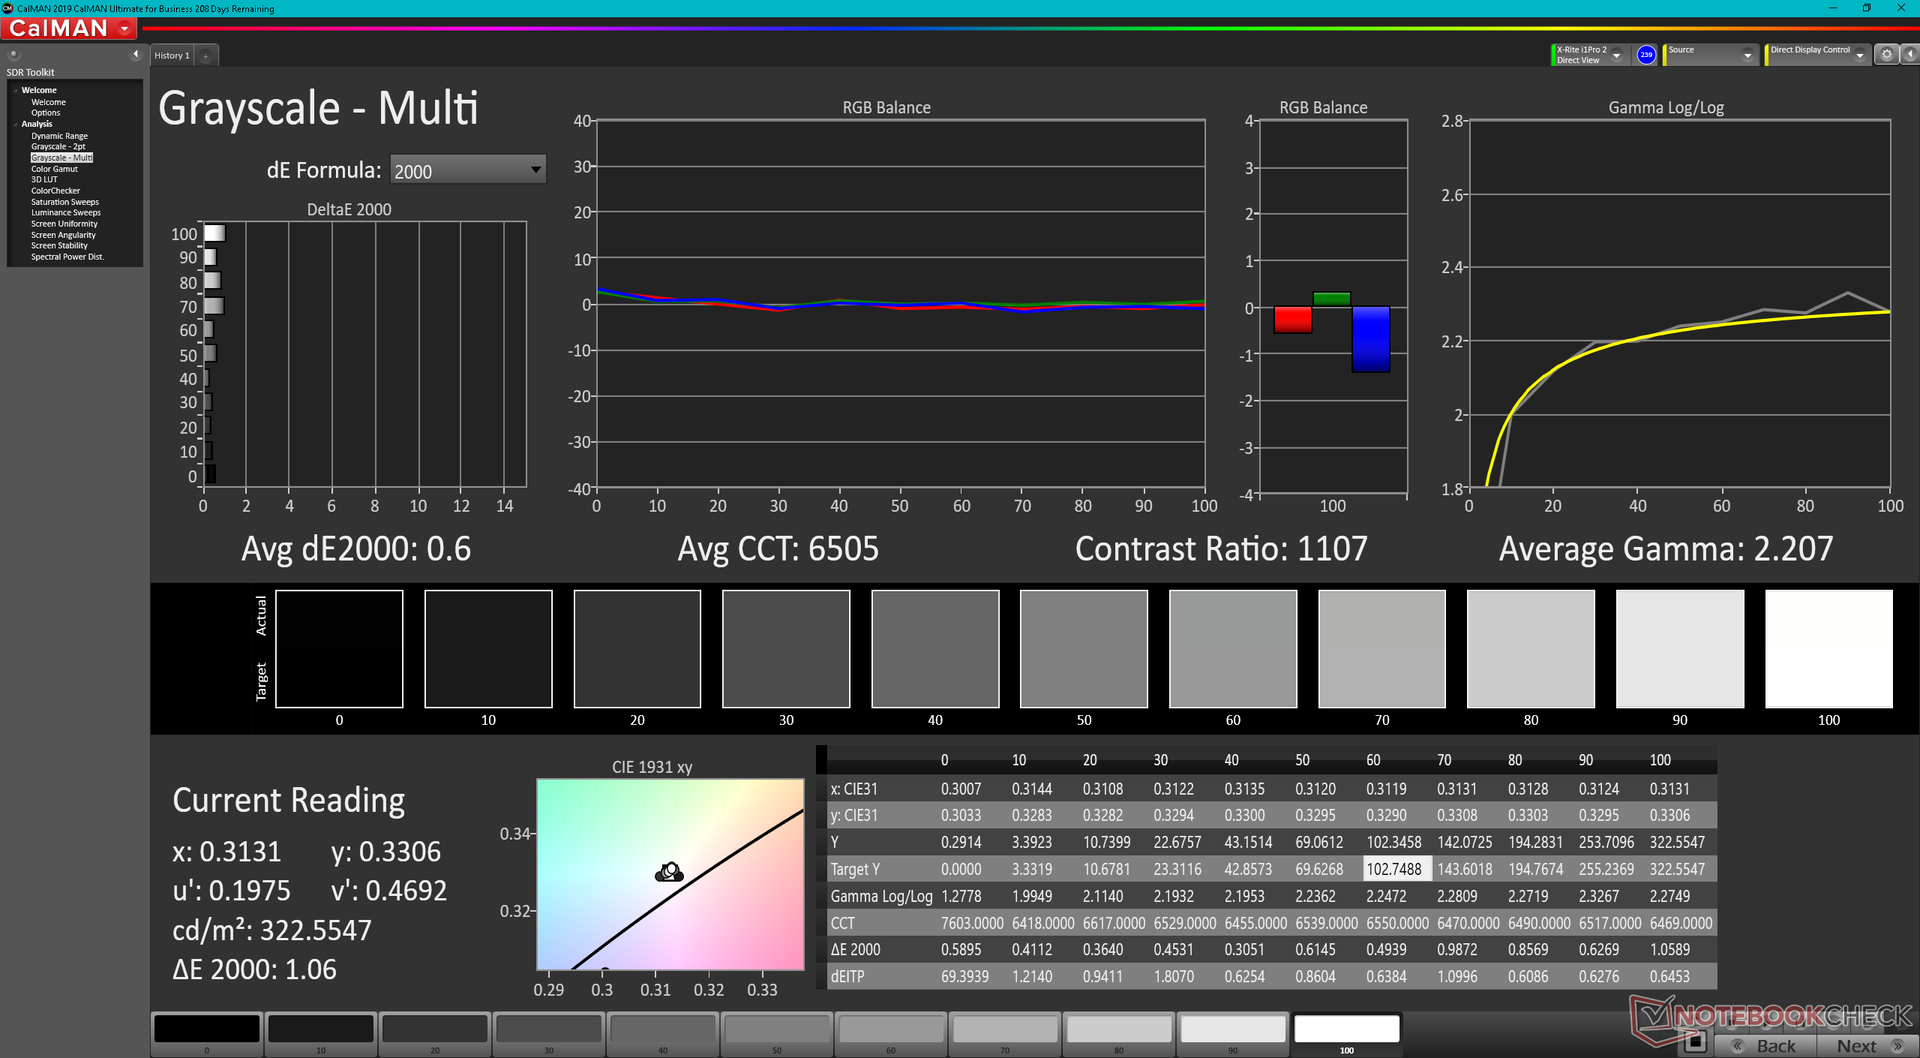
Skärmen är inte kalibrerad särskilt bra när den är installerad, särskilt eftersom färgtemperaturen är för varm. När den väl är korrekt kalibrerad mot sRGB kan vi dock uppnå genomsnittliga värden för gråskala och färgdeltaE ner till bara 0,6 respektive 0,51.
Visa svarstider
| ↔ Svarstid svart till vitt | ||
|---|---|---|
| 9.2 ms ... stiga ↗ och falla ↘ kombinerat | ↗ 5.2 ms stiga | 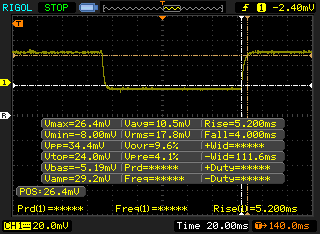 |
| ↘ 4 ms hösten | ||
| Skärmen visar snabba svarsfrekvenser i våra tester och bör passa för spel. I jämförelse sträcker sig alla testade enheter från 0.1 (minst) till 240 (maximalt) ms. » 25 % av alla enheter är bättre. Det betyder att den uppmätta svarstiden är bättre än genomsnittet av alla testade enheter (20.1 ms). | ||
| ↔ Svarstid 50 % grått till 80 % grått | ||
| 12.4 ms ... stiga ↗ och falla ↘ kombinerat | ↗ 6.4 ms stiga | 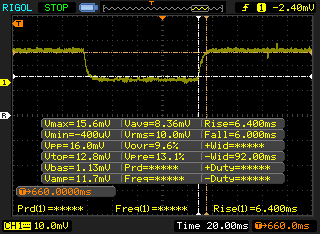 |
| ↘ 6 ms hösten | ||
| Skärmen visar bra svarsfrekvens i våra tester, men kan vara för långsam för konkurrenskraftiga spelare. I jämförelse sträcker sig alla testade enheter från 0.165 (minst) till 636 (maximalt) ms. » 25 % av alla enheter är bättre. Det betyder att den uppmätta svarstiden är bättre än genomsnittet av alla testade enheter (31.4 ms). | ||
Skärmflimmer / PWM (Puls-Width Modulation)
| Skärmflimmer / PWM upptäcktes inte | 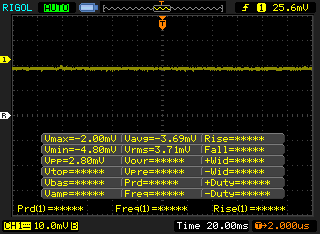 | ||
Som jämförelse: 53 % av alla testade enheter använder inte PWM för att dämpa skärmen. Om PWM upptäcktes mättes ett medelvärde av 7986 (minst: 5 - maximum: 343500) Hz. | |||
Prestanda
Provningsförhållanden
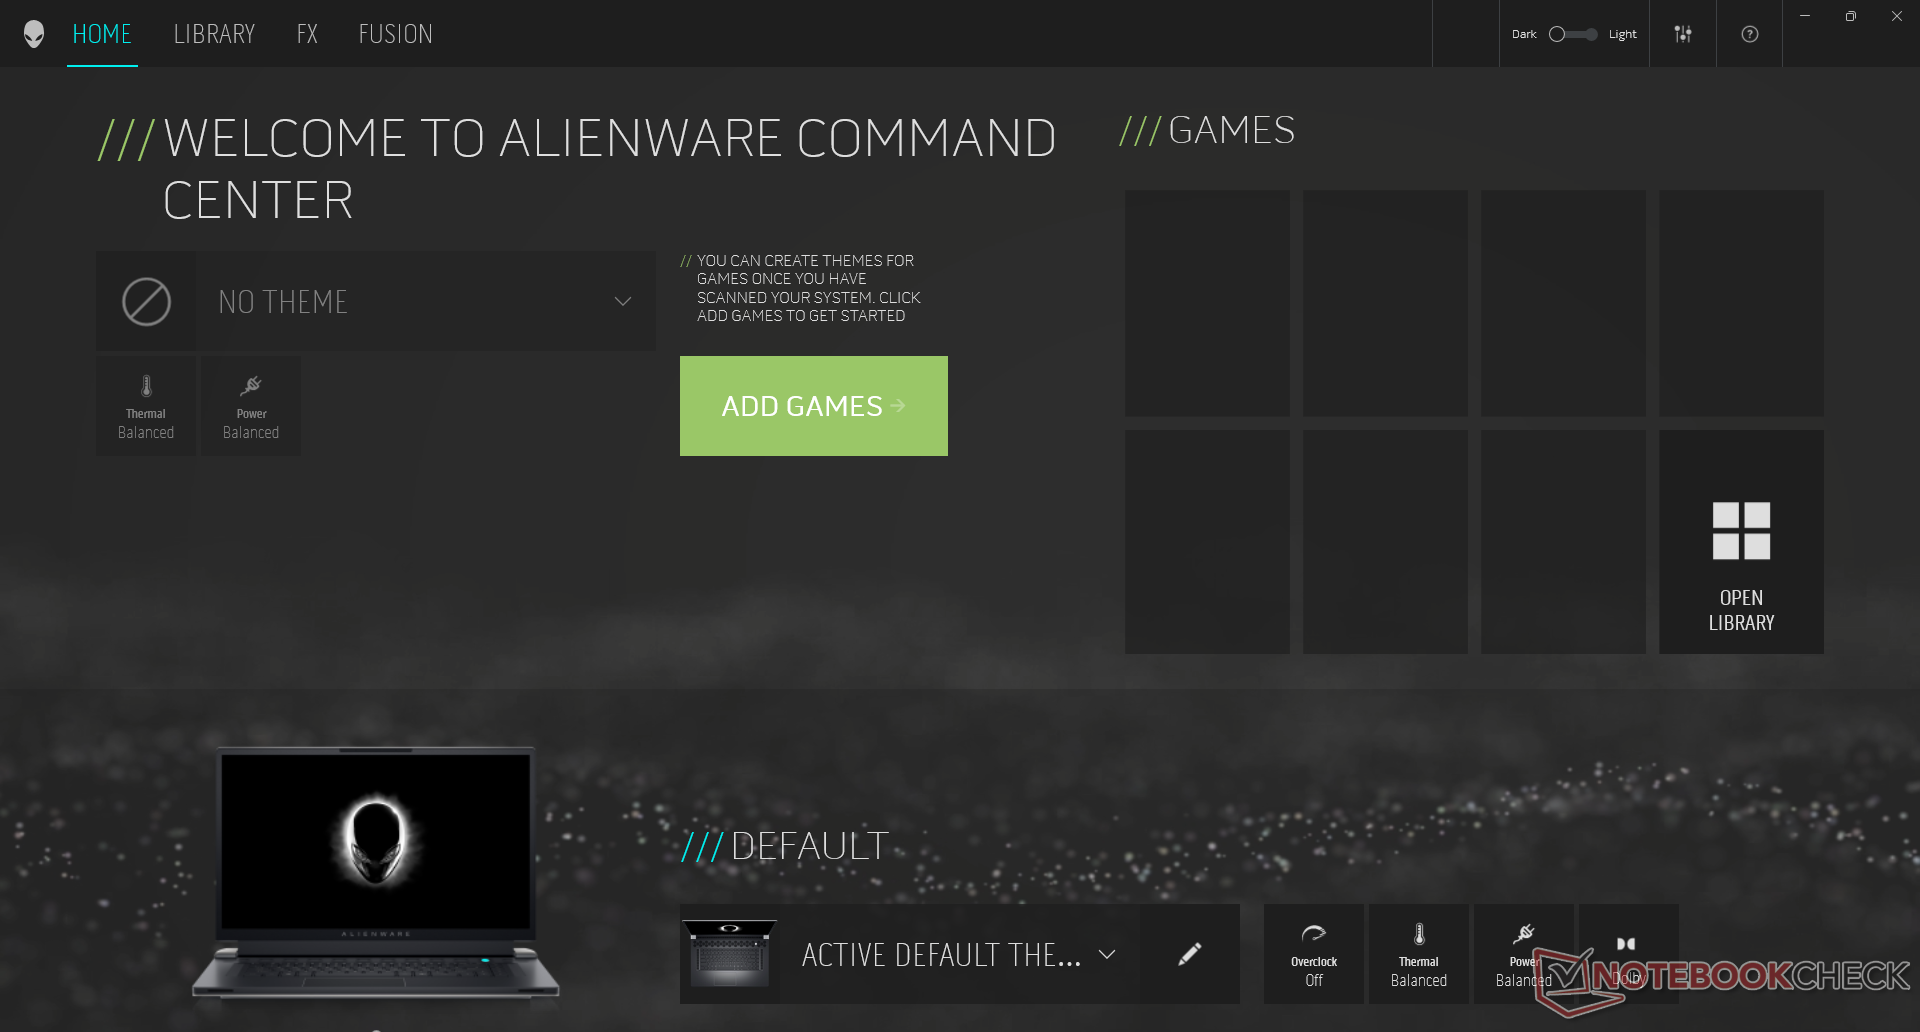
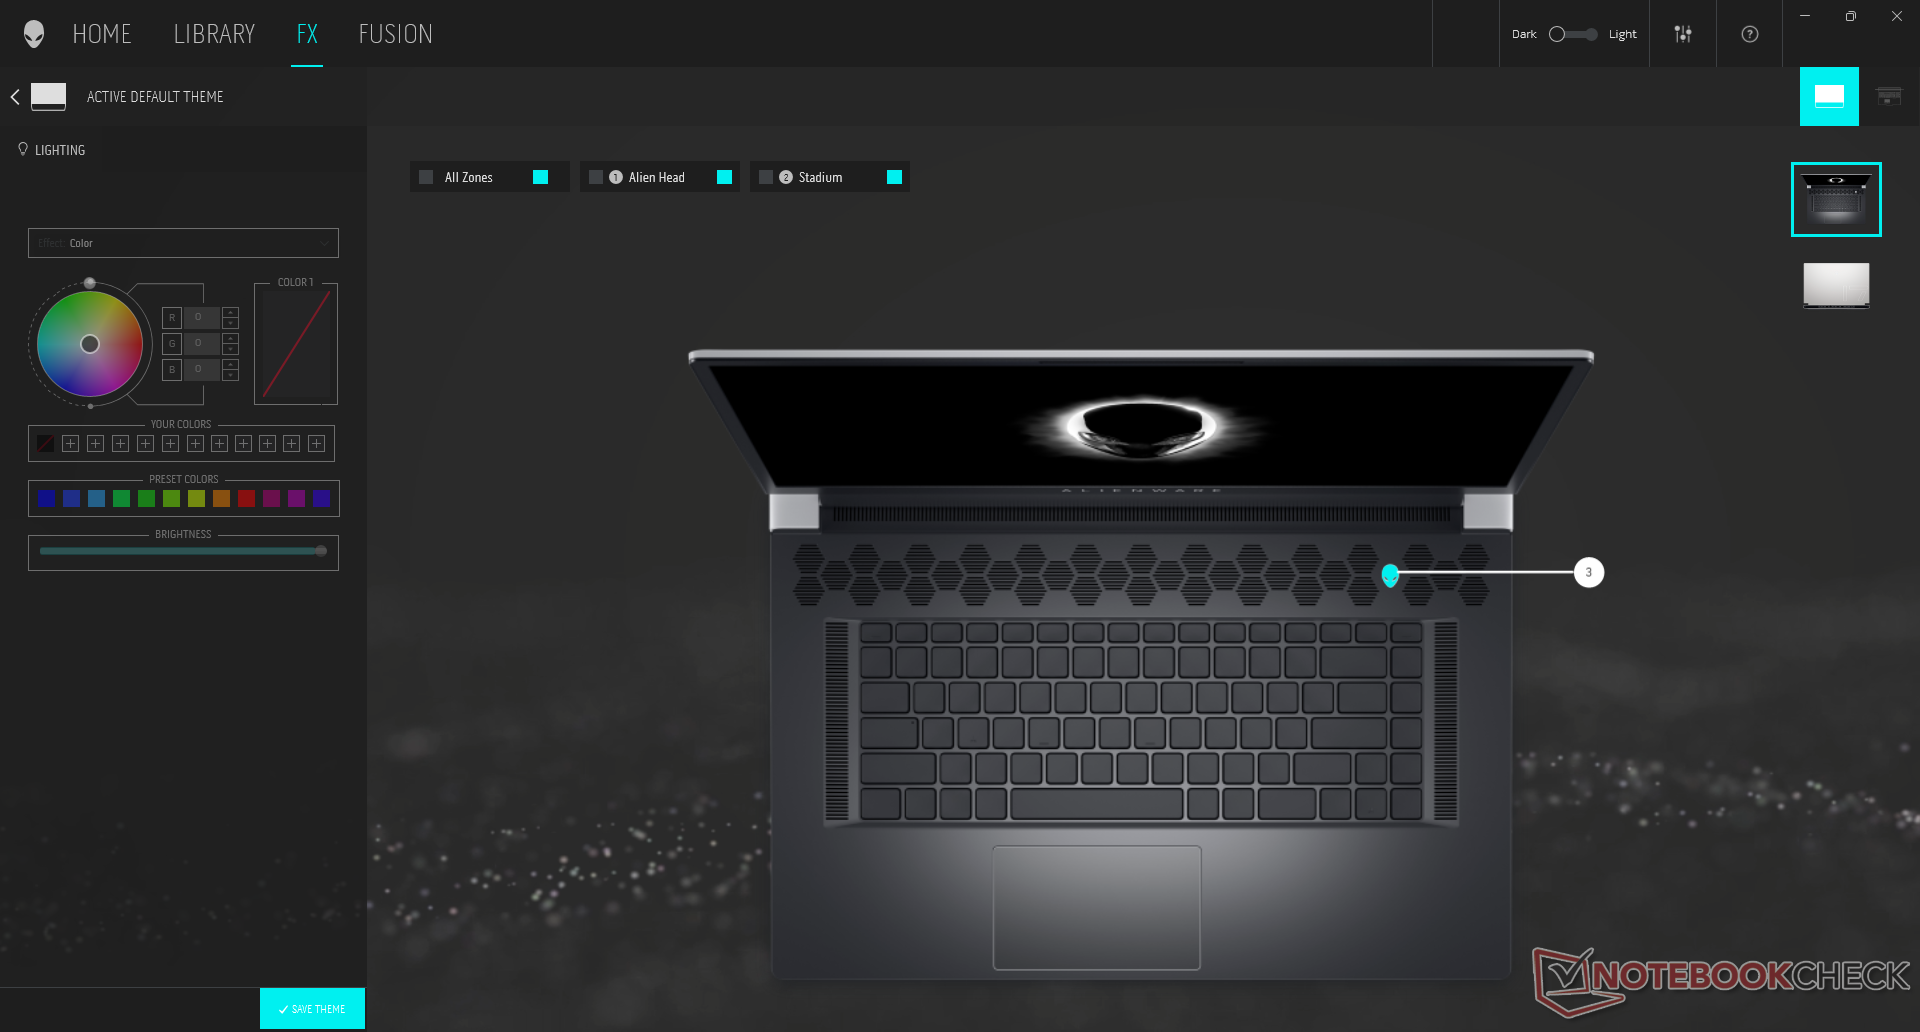
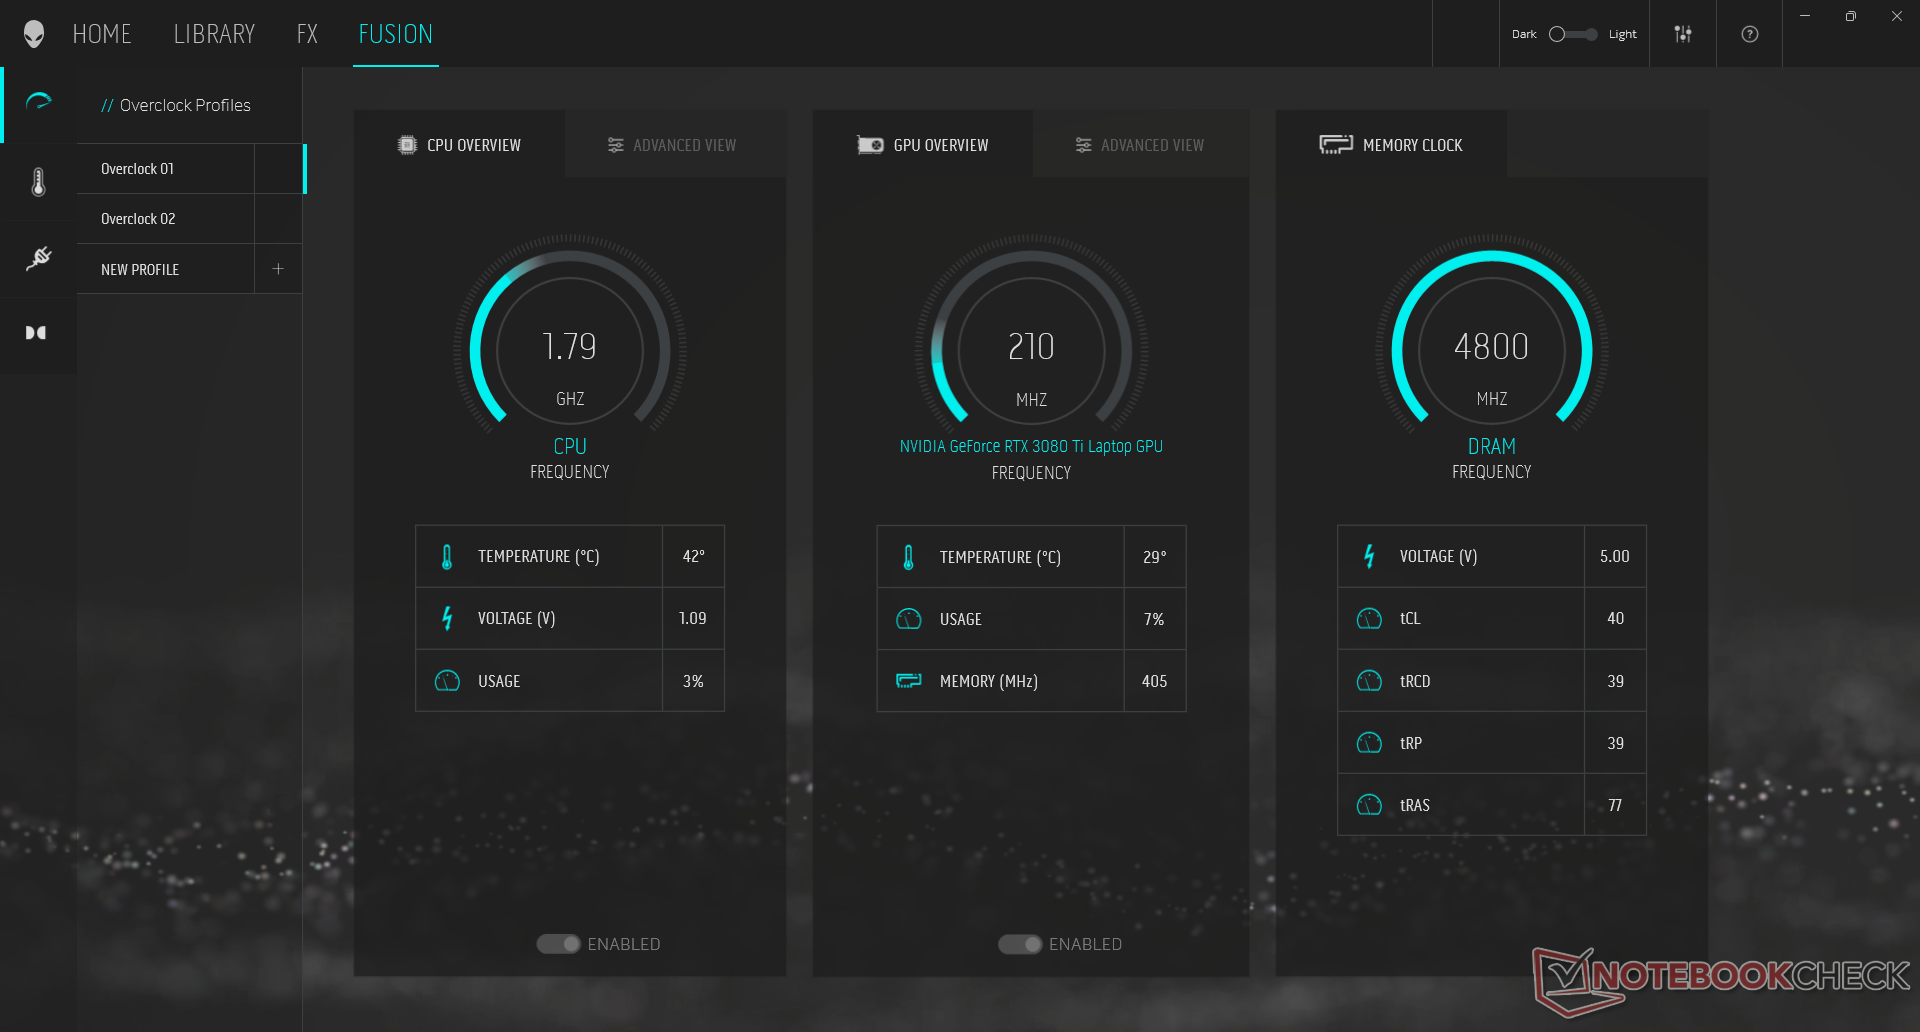
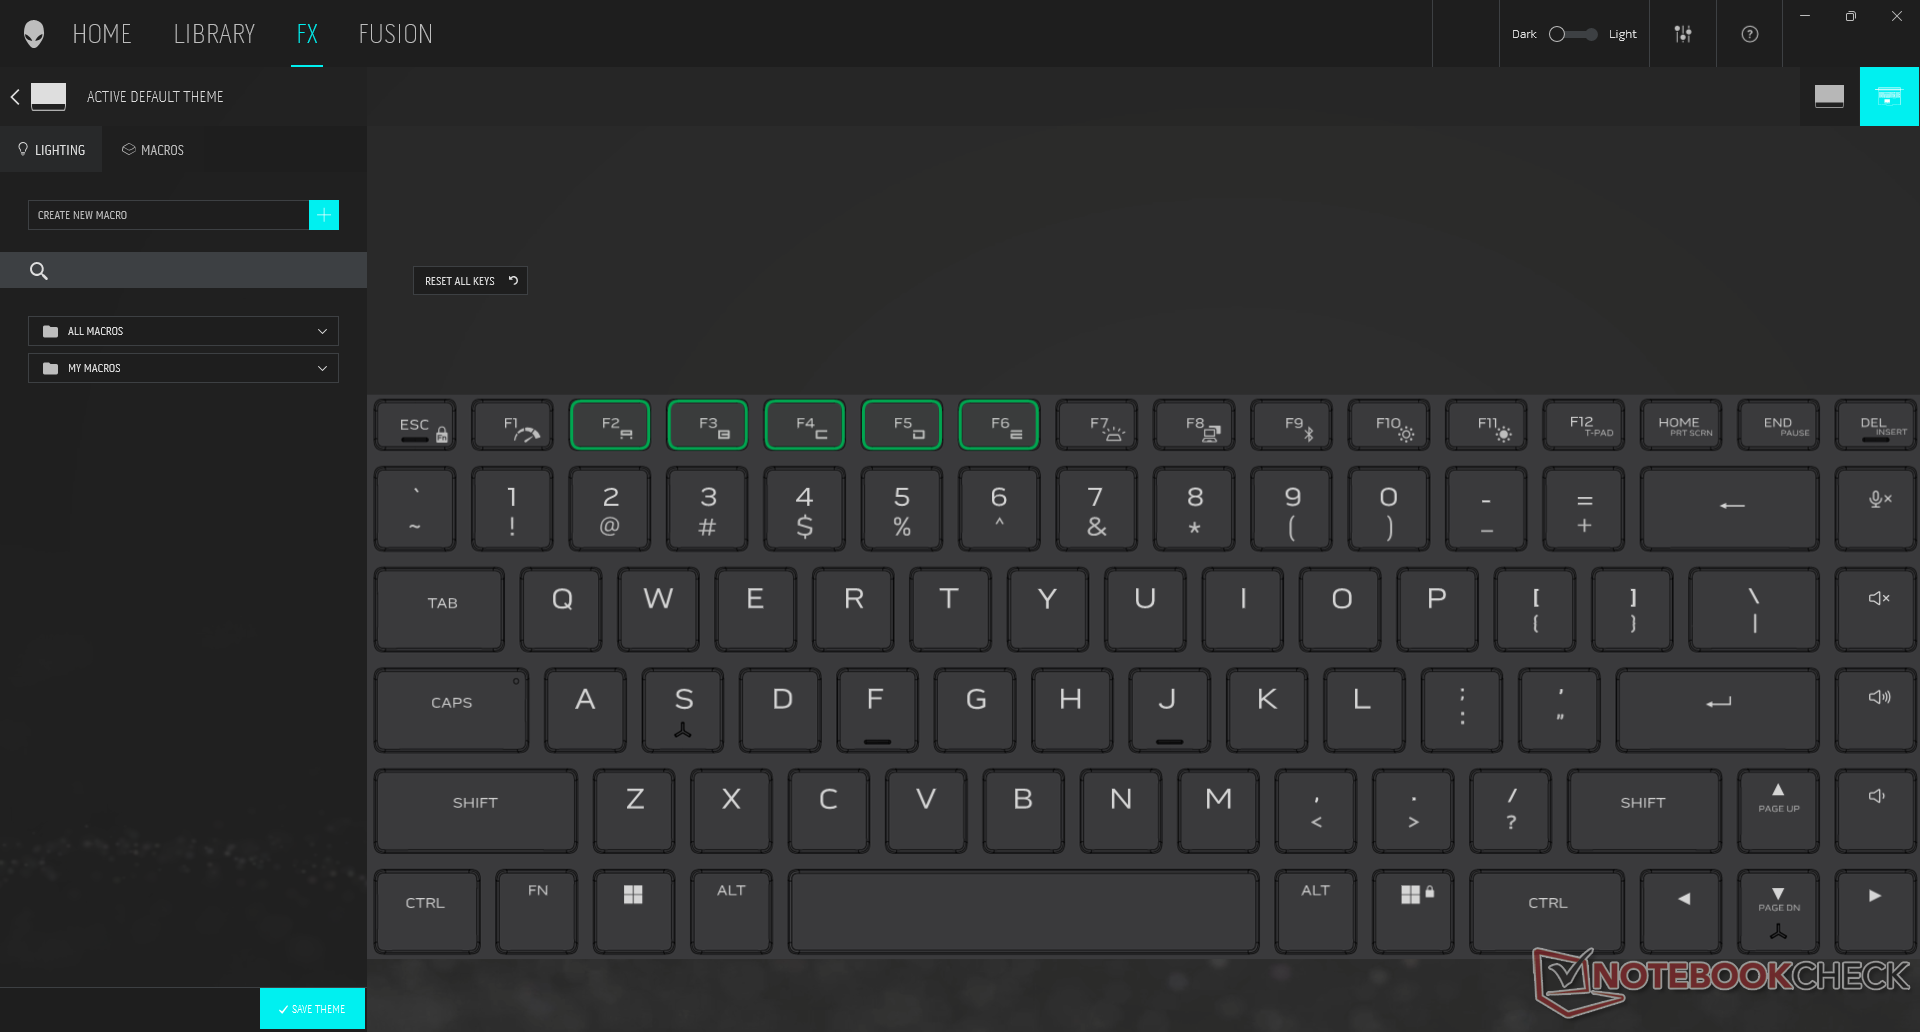
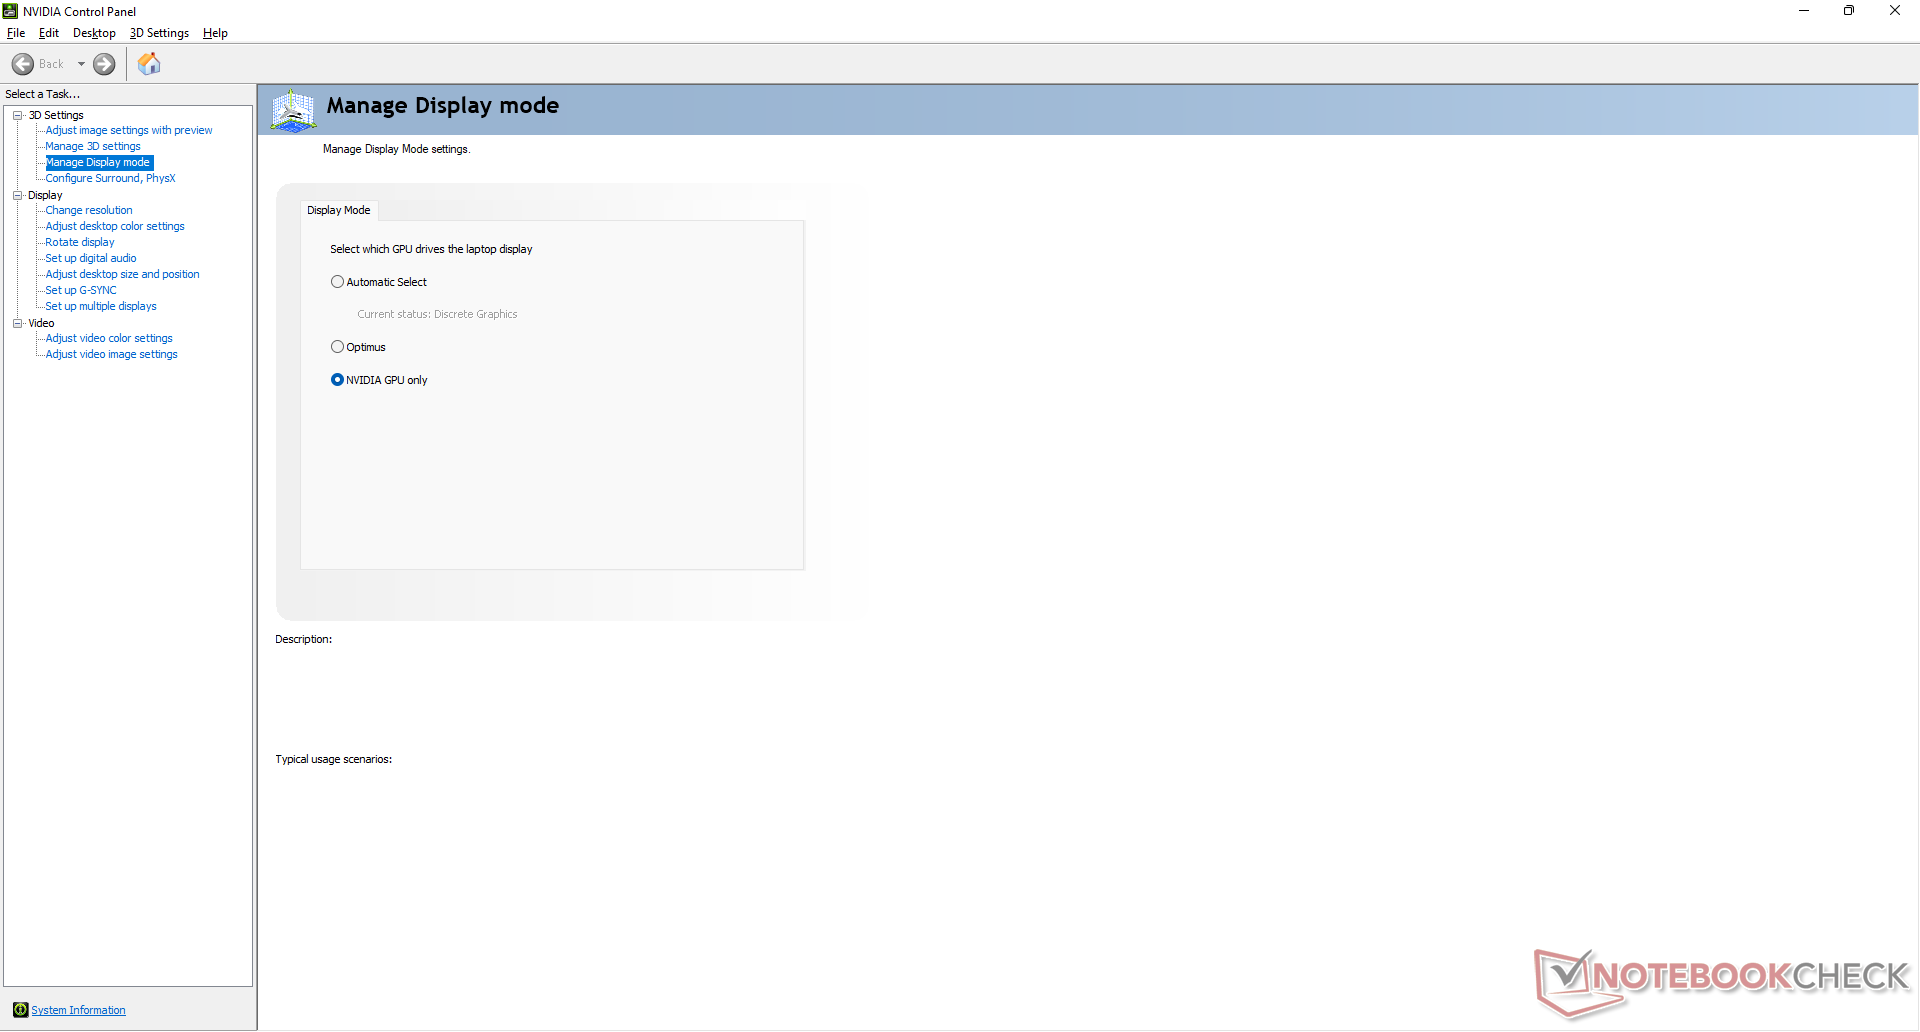
Vi ställde in vår enhet i läget High Performance och med den diskreta GPU:n aktiv innan vi körde de nedanstående prestandanivåerna för att få högsta möjliga poäng. High Performance-läget kan enkelt växlas om via Fn+F1 medan MUX-omkopplaren kan nås via Nvidias kontrollpanel. Vi rekommenderar starkt att användarna bekantar sig med programvaran Alienware Command Center eftersom strömprofiler, RGB-inställningar, realtidsövervakning och andra funktioner finns här.
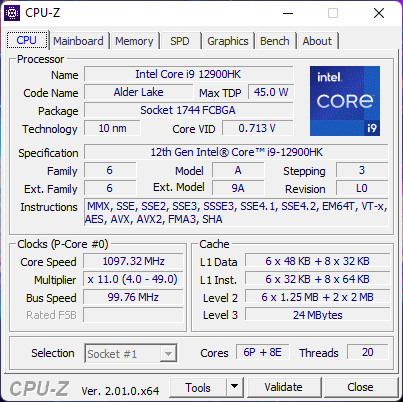
Processor
Den råa CPU-prestandan är cirka 10 till 15 procent snabbare än den genomsnittliga bärbara datorn i vår databas med samma Core i9-12900HK. Det är en hygglig ökning jämfört med Core i7-12800H eller den senaste generationen Core i7-11800H med upp till 30 procent vardera i arbetsbelastningar med flera trådar. AMD:s senaste Zen 3+-processor, den Ryzen 9 6900HXär också konsekvent långsammare i råa CineBench-jämförelser, men den presterar bättre än Core i9-12900HK i vissa AIDA64-jämförelser.
Cinebench R15 Multi Loop
Cinebench R23: Multi Core | Single Core
Cinebench R15: CPU Multi 64Bit | CPU Single 64Bit
Blender: v2.79 BMW27 CPU
7-Zip 18.03: 7z b 4 | 7z b 4 -mmt1
Geekbench 5.5: Multi-Core | Single-Core
HWBOT x265 Benchmark v2.2: 4k Preset
LibreOffice : 20 Documents To PDF
R Benchmark 2.5: Overall mean
| Cinebench R20 / CPU (Multi Core) | |
| AMD Radeon RX 6800 XT | |
| Corsair One i300 | |
| Alienware x17 R2 P48E | |
| Genomsnitt Intel Core i9-12900HK (1828 - 7366, n=14) | |
| Razer Blade 14 Ryzen 9 6900HX | |
| Alienware x17 RTX 3080 P48E | |
| Razer Blade 17 (i7-12800H, RTX 3070 Ti) | |
| Gigabyte A7 X1 | |
| Razer Blade Pro 17 2021 (QHD Touch) | |
| Lenovo Legion Y740-17IRHg-81UJ001VGE | |
| Cinebench R20 / CPU (Single Core) | |
| Corsair One i300 | |
| Alienware x17 R2 P48E | |
| Razer Blade 17 (i7-12800H, RTX 3070 Ti) | |
| Genomsnitt Intel Core i9-12900HK (316 - 739, n=14) | |
| AMD Radeon RX 6800 XT | |
| Razer Blade 14 Ryzen 9 6900HX | |
| Alienware x17 RTX 3080 P48E | |
| Gigabyte A7 X1 | |
| Razer Blade Pro 17 2021 (QHD Touch) | |
| Lenovo Legion Y740-17IRHg-81UJ001VGE | |
| Cinebench R23 / Multi Core | |
| Corsair One i300 | |
| AMD Radeon RX 6800 XT | |
| Alienware x17 R2 P48E | |
| Genomsnitt Intel Core i9-12900HK (4796 - 19282, n=14) | |
| Razer Blade 17 (i7-12800H, RTX 3070 Ti) | |
| Razer Blade 14 Ryzen 9 6900HX | |
| Alienware x17 RTX 3080 P48E | |
| Gigabyte A7 X1 | |
| Razer Blade Pro 17 2021 (QHD Touch) | |
| Cinebench R23 / Single Core | |
| Corsair One i300 | |
| Alienware x17 R2 P48E | |
| Razer Blade 17 (i7-12800H, RTX 3070 Ti) | |
| Genomsnitt Intel Core i9-12900HK (819 - 1940, n=15) | |
| AMD Radeon RX 6800 XT | |
| Razer Blade 14 Ryzen 9 6900HX | |
| Alienware x17 RTX 3080 P48E | |
| Gigabyte A7 X1 | |
| Razer Blade Pro 17 2021 (QHD Touch) | |
| Cinebench R15 / CPU Multi 64Bit | |
| AMD Radeon RX 6800 XT | |
| Corsair One i300 | |
| Alienware x17 R2 P48E | |
| Razer Blade 17 (i7-12800H, RTX 3070 Ti) | |
| Genomsnitt Intel Core i9-12900HK (965 - 2944, n=14) | |
| Razer Blade 14 Ryzen 9 6900HX | |
| Alienware x17 RTX 3080 P48E | |
| Gigabyte A7 X1 | |
| Razer Blade Pro 17 2021 (QHD Touch) | |
| Lenovo Legion Y740-17IRHg-81UJ001VGE | |
| Cinebench R15 / CPU Single 64Bit | |
| Corsair One i300 | |
| Alienware x17 R2 P48E | |
| Razer Blade 17 (i7-12800H, RTX 3070 Ti) | |
| AMD Radeon RX 6800 XT | |
| Razer Blade 14 Ryzen 9 6900HX | |
| Gigabyte A7 X1 | |
| Genomsnitt Intel Core i9-12900HK (119 - 279, n=14) | |
| Alienware x17 RTX 3080 P48E | |
| Razer Blade Pro 17 2021 (QHD Touch) | |
| Lenovo Legion Y740-17IRHg-81UJ001VGE | |
| Blender / v2.79 BMW27 CPU | |
| Lenovo Legion Y740-17IRHg-81UJ001VGE | |
| Razer Blade Pro 17 2021 (QHD Touch) | |
| Gigabyte A7 X1 | |
| Genomsnitt Intel Core i9-12900HK (172.5 - 483, n=13) | |
| Razer Blade 14 Ryzen 9 6900HX | |
| Razer Blade 17 (i7-12800H, RTX 3070 Ti) | |
| Alienware x17 RTX 3080 P48E | |
| Alienware x17 R2 P48E | |
| Corsair One i300 | |
| AMD Radeon RX 6800 XT | |
| 7-Zip 18.03 / 7z b 4 | |
| AMD Radeon RX 6800 XT | |
| Corsair One i300 | |
| Alienware x17 R2 P48E | |
| Razer Blade 17 (i7-12800H, RTX 3070 Ti) | |
| Razer Blade 14 Ryzen 9 6900HX | |
| Genomsnitt Intel Core i9-12900HK (25736 - 75564, n=14) | |
| Gigabyte A7 X1 | |
| Alienware x17 RTX 3080 P48E | |
| Razer Blade Pro 17 2021 (QHD Touch) | |
| Lenovo Legion Y740-17IRHg-81UJ001VGE | |
| 7-Zip 18.03 / 7z b 4 -mmt1 | |
| AMD Radeon RX 6800 XT | |
| Corsair One i300 | |
| Razer Blade 14 Ryzen 9 6900HX | |
| Alienware x17 R2 P48E | |
| Razer Blade 17 (i7-12800H, RTX 3070 Ti) | |
| Gigabyte A7 X1 | |
| Genomsnitt Intel Core i9-12900HK (2898 - 6186, n=14) | |
| Alienware x17 RTX 3080 P48E | |
| Razer Blade Pro 17 2021 (QHD Touch) | |
| Lenovo Legion Y740-17IRHg-81UJ001VGE | |
| Geekbench 5.5 / Multi-Core | |
| Corsair One i300 | |
| AMD Radeon RX 6800 XT | |
| Alienware x17 R2 P48E | |
| Razer Blade 17 (i7-12800H, RTX 3070 Ti) | |
| Genomsnitt Intel Core i9-12900HK (5869 - 14294, n=13) | |
| Razer Blade 14 Ryzen 9 6900HX | |
| Razer Blade Pro 17 2021 (QHD Touch) | |
| Gigabyte A7 X1 | |
| Lenovo Legion Y740-17IRHg-81UJ001VGE | |
| Geekbench 5.5 / Single-Core | |
| Corsair One i300 | |
| Alienware x17 R2 P48E | |
| Razer Blade 17 (i7-12800H, RTX 3070 Ti) | |
| Genomsnitt Intel Core i9-12900HK (843 - 1918, n=13) | |
| AMD Radeon RX 6800 XT | |
| Razer Blade 14 Ryzen 9 6900HX | |
| Gigabyte A7 X1 | |
| Razer Blade Pro 17 2021 (QHD Touch) | |
| Lenovo Legion Y740-17IRHg-81UJ001VGE | |
| HWBOT x265 Benchmark v2.2 / 4k Preset | |
| AMD Radeon RX 6800 XT | |
| Corsair One i300 | |
| Alienware x17 R2 P48E | |
| Razer Blade 14 Ryzen 9 6900HX | |
| Alienware x17 RTX 3080 P48E | |
| Genomsnitt Intel Core i9-12900HK (5.33 - 21.6, n=14) | |
| Razer Blade 17 (i7-12800H, RTX 3070 Ti) | |
| Gigabyte A7 X1 | |
| Razer Blade Pro 17 2021 (QHD Touch) | |
| Lenovo Legion Y740-17IRHg-81UJ001VGE | |
| LibreOffice / 20 Documents To PDF | |
| Gigabyte A7 X1 | |
| AMD Radeon RX 6800 XT | |
| Razer Blade 14 Ryzen 9 6900HX | |
| Genomsnitt Intel Core i9-12900HK (34.8 - 89.1, n=14) | |
| Alienware x17 RTX 3080 P48E | |
| Razer Blade Pro 17 2021 (QHD Touch) | |
| Razer Blade 17 (i7-12800H, RTX 3070 Ti) | |
| Alienware x17 R2 P48E | |
| Corsair One i300 | |
| R Benchmark 2.5 / Overall mean | |
| Lenovo Legion Y740-17IRHg-81UJ001VGE | |
| Razer Blade Pro 17 2021 (QHD Touch) | |
| Alienware x17 RTX 3080 P48E | |
| Genomsnitt Intel Core i9-12900HK (0.4155 - 0.994, n=14) | |
| Gigabyte A7 X1 | |
| Razer Blade 14 Ryzen 9 6900HX | |
| AMD Radeon RX 6800 XT | |
| Razer Blade 17 (i7-12800H, RTX 3070 Ti) | |
| Alienware x17 R2 P48E | |
| Corsair One i300 | |
* ... mindre är bättre
AIDA64: FP32 Ray-Trace | FPU Julia | CPU SHA3 | CPU Queen | FPU SinJulia | FPU Mandel | CPU AES | CPU ZLib | FP64 Ray-Trace | CPU PhotoWorxx
| Performance rating | |
| Razer Blade 14 Ryzen 9 6900HX | |
| Gigabyte A7 X1 | |
| Alienware x17 R2 P48E | |
| MSI Stealth GS77 12UHS-083US | |
| Genomsnitt Intel Core i9-12900HK | |
| AIDA64 / FP32 Ray-Trace | |
| Razer Blade 14 Ryzen 9 6900HX | |
| Gigabyte A7 X1 | |
| Alienware x17 R2 P48E | |
| Genomsnitt Intel Core i9-12900HK (2677 - 13948, n=15) | |
| MSI Stealth GS77 12UHS-083US | |
| AIDA64 / FPU Julia | |
| Razer Blade 14 Ryzen 9 6900HX | |
| Gigabyte A7 X1 | |
| Genomsnitt Intel Core i9-12900HK (12762 - 70764, n=15) | |
| Alienware x17 R2 P48E | |
| MSI Stealth GS77 12UHS-083US | |
| AIDA64 / CPU SHA3 | |
| Alienware x17 R2 P48E | |
| Razer Blade 14 Ryzen 9 6900HX | |
| Gigabyte A7 X1 | |
| MSI Stealth GS77 12UHS-083US | |
| Genomsnitt Intel Core i9-12900HK (841 - 3504, n=15) | |
| AIDA64 / CPU Queen | |
| Alienware x17 R2 P48E | |
| Razer Blade 14 Ryzen 9 6900HX | |
| Gigabyte A7 X1 | |
| MSI Stealth GS77 12UHS-083US | |
| Genomsnitt Intel Core i9-12900HK (60202 - 107161, n=15) | |
| AIDA64 / FPU SinJulia | |
| Razer Blade 14 Ryzen 9 6900HX | |
| Gigabyte A7 X1 | |
| Alienware x17 R2 P48E | |
| MSI Stealth GS77 12UHS-083US | |
| Genomsnitt Intel Core i9-12900HK (3225 - 10402, n=15) | |
| AIDA64 / FPU Mandel | |
| Razer Blade 14 Ryzen 9 6900HX | |
| Gigabyte A7 X1 | |
| Alienware x17 R2 P48E | |
| Genomsnitt Intel Core i9-12900HK (7417 - 34233, n=15) | |
| MSI Stealth GS77 12UHS-083US | |
| AIDA64 / CPU AES | |
| Razer Blade 14 Ryzen 9 6900HX | |
| Gigabyte A7 X1 | |
| Alienware x17 R2 P48E | |
| MSI Stealth GS77 12UHS-083US | |
| Genomsnitt Intel Core i9-12900HK (32382 - 112498, n=15) | |
| AIDA64 / CPU ZLib | |
| Alienware x17 R2 P48E | |
| MSI Stealth GS77 12UHS-083US | |
| Genomsnitt Intel Core i9-12900HK (314 - 1209, n=15) | |
| Razer Blade 14 Ryzen 9 6900HX | |
| Gigabyte A7 X1 | |
| AIDA64 / FP64 Ray-Trace | |
| Razer Blade 14 Ryzen 9 6900HX | |
| Gigabyte A7 X1 | |
| Alienware x17 R2 P48E | |
| Genomsnitt Intel Core i9-12900HK (1501 - 7616, n=15) | |
| MSI Stealth GS77 12UHS-083US | |
| AIDA64 / CPU PhotoWorxx | |
| MSI Stealth GS77 12UHS-083US | |
| Genomsnitt Intel Core i9-12900HK (24446 - 42462, n=15) | |
| Alienware x17 R2 P48E | |
| Razer Blade 14 Ryzen 9 6900HX | |
| Gigabyte A7 X1 | |
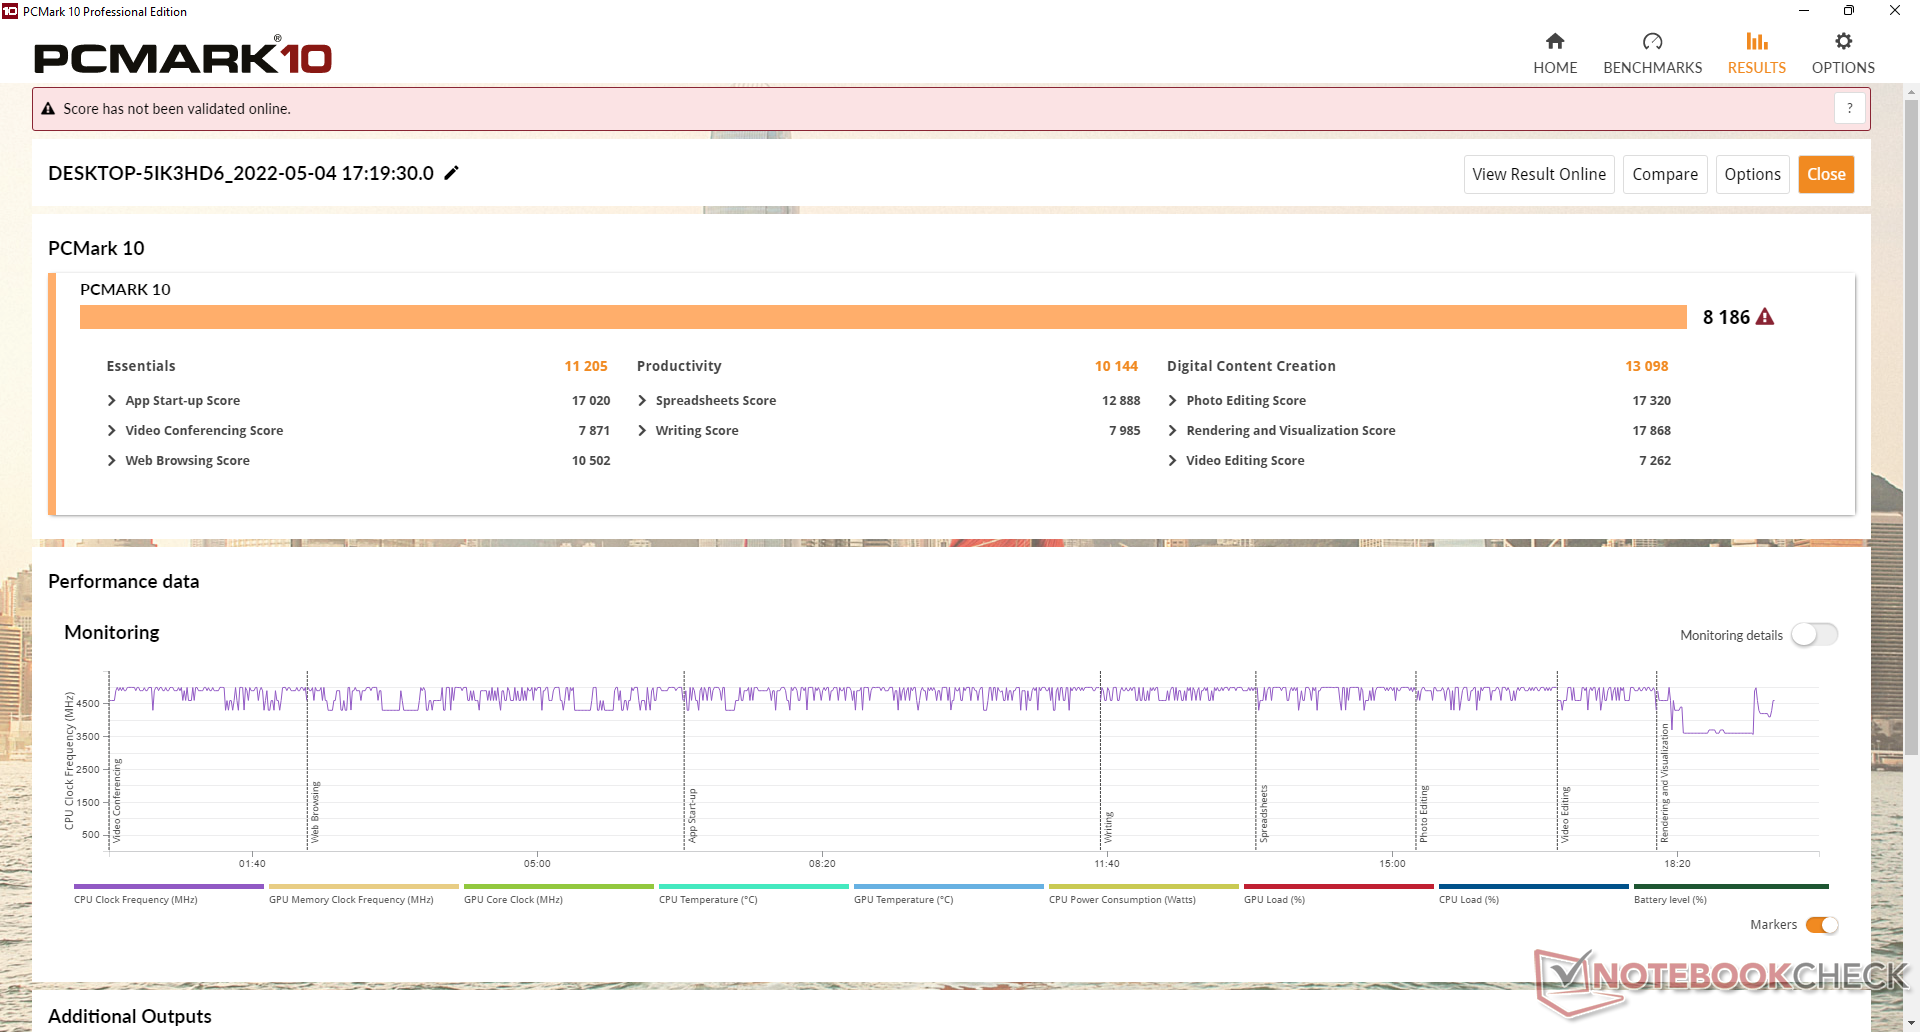
Systemets prestanda
PCMark-resultaten är genomgående högre än vad vi noterade på förra årets x17 R1 med relativt små marginaler.
Det är värt att notera att den bärbara datorn förbrukar en hel del ström även när den är i standby- eller viloläge. Vi kan registrera en förbrukning på nästan 12 W i viloläge jämfört med <2 W på de flesta andra bärbara datorer. Dessutom var fläktarna i vår testenhet ibland aktiva även i viloläge och enheten hade ibland problem med att vakna upp ordentligt också.
CrossMark: Overall | Productivity | Creativity | Responsiveness
| PCMark 10 / Score | |
| Alienware x17 R2 P48E | |
| Genomsnitt Intel Core i9-12900HK, NVIDIA GeForce RTX 3080 Ti Laptop GPU (7149 - 8186, n=5) | |
| Alienware x17 RTX 3080 P48E | |
| MSI Stealth GS77 12UHS-083US | |
| MSI GT76 Titan DT 10SGS | |
| Asus ROG Zephyrus S17 GX703HSD | |
| Gigabyte A7 X1 | |
| PCMark 10 / Essentials | |
| Alienware x17 R2 P48E | |
| Genomsnitt Intel Core i9-12900HK, NVIDIA GeForce RTX 3080 Ti Laptop GPU (9870 - 11205, n=5) | |
| Asus ROG Zephyrus S17 GX703HSD | |
| MSI GT76 Titan DT 10SGS | |
| MSI Stealth GS77 12UHS-083US | |
| Alienware x17 RTX 3080 P48E | |
| Gigabyte A7 X1 | |
| PCMark 10 / Productivity | |
| Alienware x17 R2 P48E | |
| Genomsnitt Intel Core i9-12900HK, NVIDIA GeForce RTX 3080 Ti Laptop GPU (9173 - 10422, n=5) | |
| Alienware x17 RTX 3080 P48E | |
| MSI Stealth GS77 12UHS-083US | |
| Gigabyte A7 X1 | |
| Asus ROG Zephyrus S17 GX703HSD | |
| MSI GT76 Titan DT 10SGS | |
| PCMark 10 / Digital Content Creation | |
| Alienware x17 R2 P48E | |
| Genomsnitt Intel Core i9-12900HK, NVIDIA GeForce RTX 3080 Ti Laptop GPU (10951 - 13098, n=5) | |
| MSI GT76 Titan DT 10SGS | |
| Alienware x17 RTX 3080 P48E | |
| MSI Stealth GS77 12UHS-083US | |
| Asus ROG Zephyrus S17 GX703HSD | |
| Gigabyte A7 X1 | |
| CrossMark / Overall | |
| Alienware x17 R2 P48E | |
| Genomsnitt Intel Core i9-12900HK, NVIDIA GeForce RTX 3080 Ti Laptop GPU (970 - 2138, n=5) | |
| CrossMark / Productivity | |
| Alienware x17 R2 P48E | |
| Genomsnitt Intel Core i9-12900HK, NVIDIA GeForce RTX 3080 Ti Laptop GPU (921 - 2038, n=5) | |
| CrossMark / Creativity | |
| Alienware x17 R2 P48E | |
| Genomsnitt Intel Core i9-12900HK, NVIDIA GeForce RTX 3080 Ti Laptop GPU (1007 - 2210, n=5) | |
| CrossMark / Responsiveness | |
| Genomsnitt Intel Core i9-12900HK, NVIDIA GeForce RTX 3080 Ti Laptop GPU (1012 - 2234, n=5) | |
| Alienware x17 R2 P48E | |
| PCMark 10 Score | 8186 poäng | |
Hjälp | ||
| AIDA64 / Memory Copy | |
| MSI Stealth GS77 12UHS-083US | |
| Genomsnitt Intel Core i9-12900HK (42967 - 62959, n=15) | |
| Alienware x17 R2 P48E | |
| Gigabyte A7 X1 | |
| AIDA64 / Memory Read | |
| MSI Stealth GS77 12UHS-083US | |
| Genomsnitt Intel Core i9-12900HK (44419 - 66989, n=15) | |
| Alienware x17 R2 P48E | |
| Gigabyte A7 X1 | |
| AIDA64 / Memory Write | |
| MSI Stealth GS77 12UHS-083US | |
| Genomsnitt Intel Core i9-12900HK (42144 - 65268, n=15) | |
| Alienware x17 R2 P48E | |
| Gigabyte A7 X1 | |
| AIDA64 / Memory Latency | |
| Alienware x17 R2 P48E | |
| MSI Stealth GS77 12UHS-083US | |
| Gigabyte A7 X1 | |
| Genomsnitt Intel Core i9-12900HK (79.9 - 109, n=15) | |
| Asus ROG Zephyrus S17 GX703HSD | |
| Alienware x17 RTX 3080 P48E | |
* ... mindre är bättre
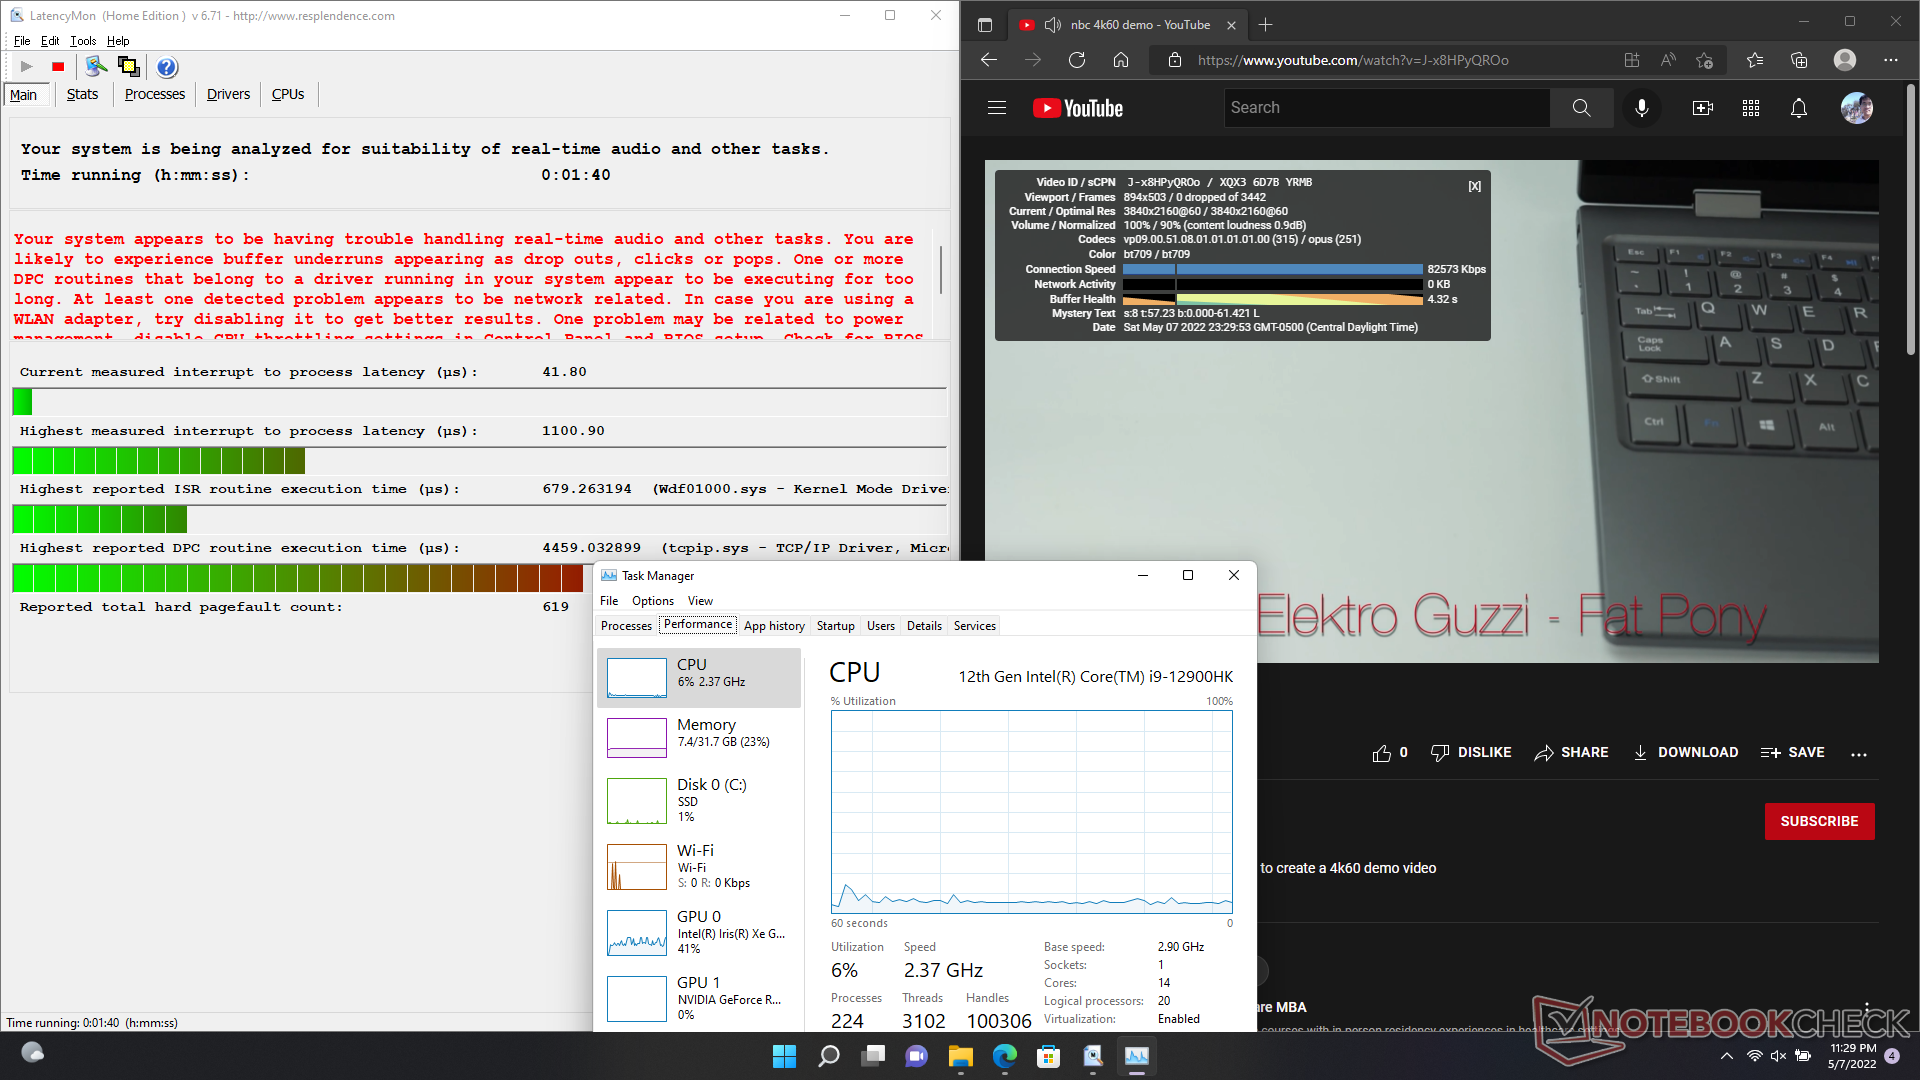
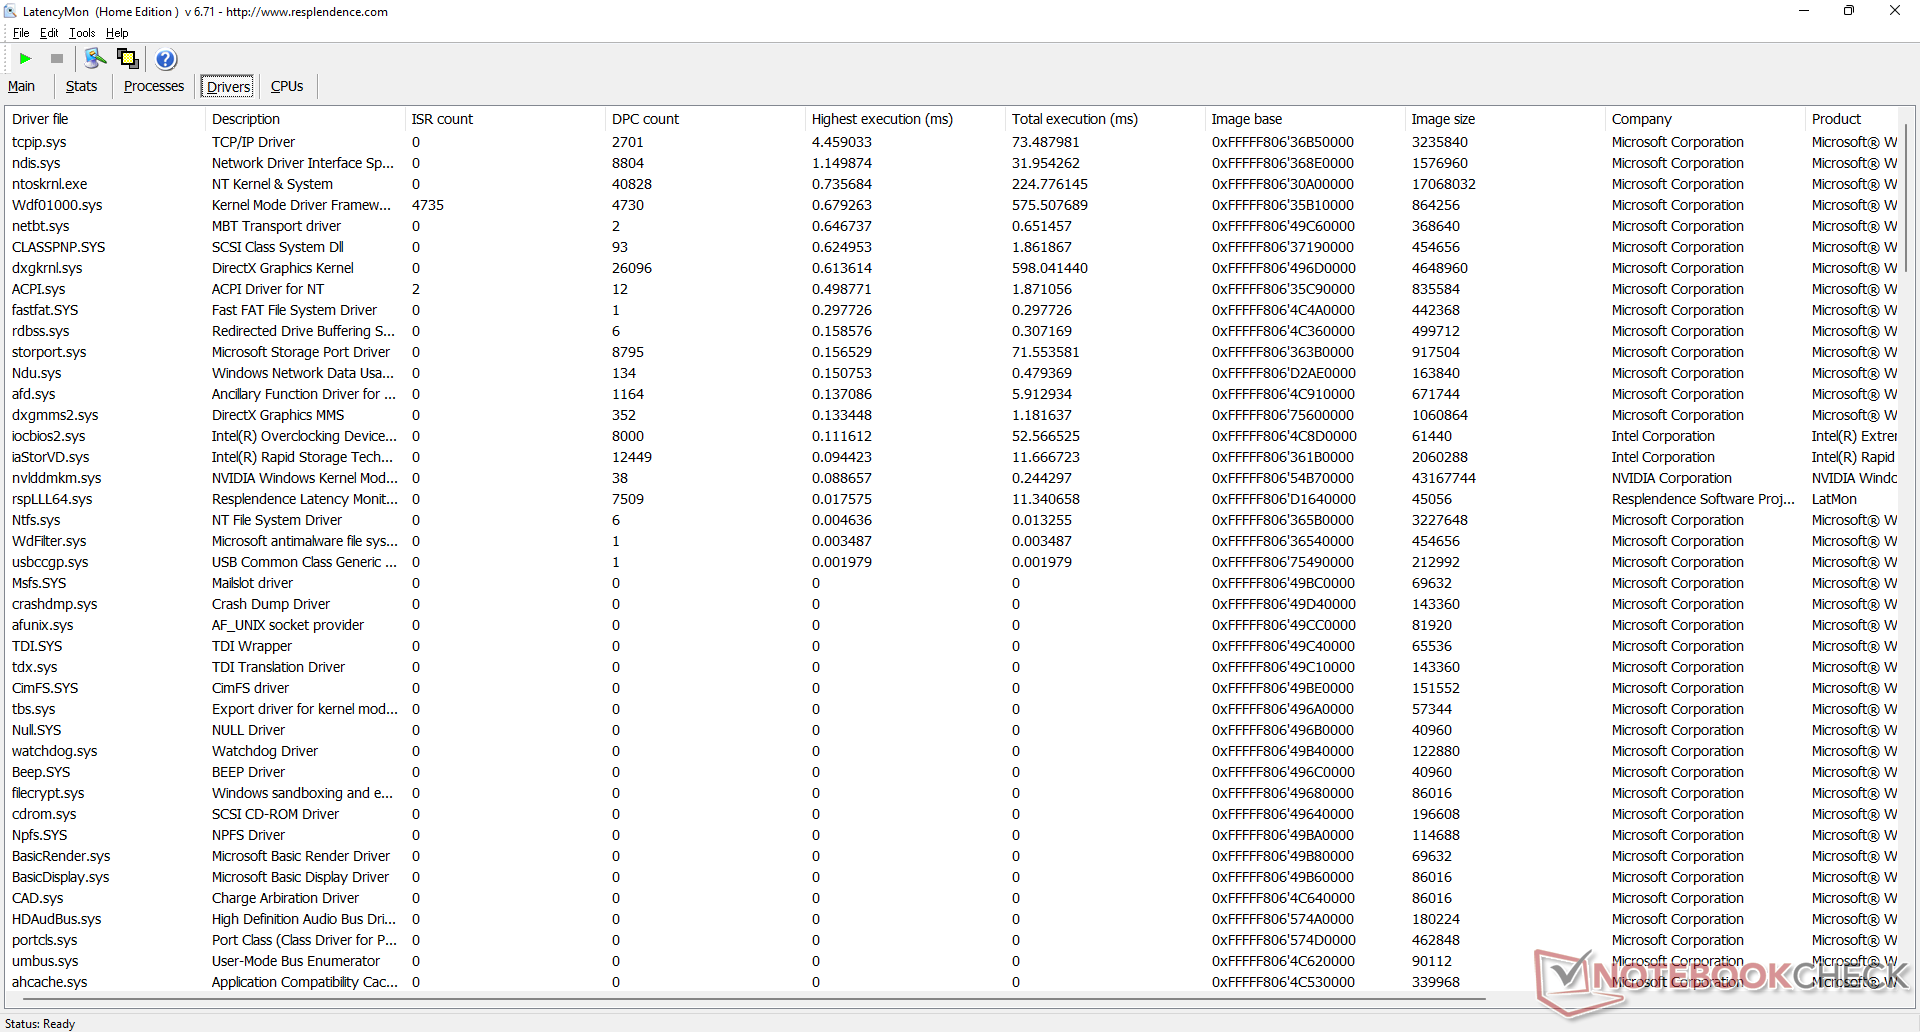
DPC-latenstid
LatencyMon avslöjar DPC-problem när flera webbläsarflikar öppnas på hemsidan. uppspelning av 4K-video vid 60 FPS är annars smidig och utan några tappade bilder.
| DPC Latencies / LatencyMon - interrupt to process latency (max), Web, Youtube, Prime95 | |
| MSI GT76 Titan DT 10SGS | |
| Alienware x17 RTX 3080 P48E | |
| MSI Stealth GS77 12UHS-083US | |
| Asus ROG Zephyrus S17 GX703HSD | |
| Alienware x17 R2 P48E | |
| Gigabyte A7 X1 | |
* ... mindre är bättre
Lagringsenheter
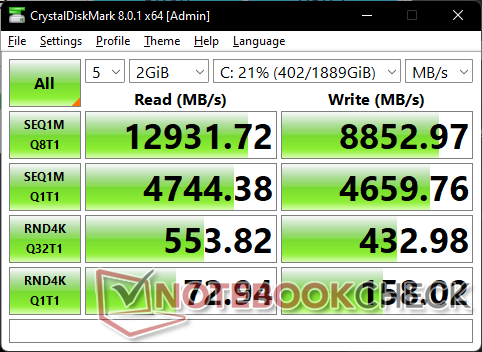
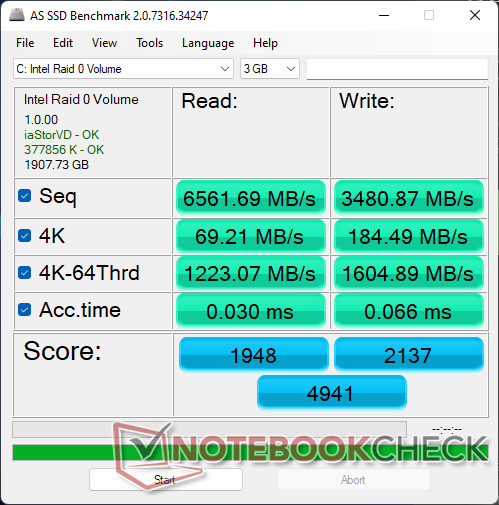

| Drive Performance rating - Percent | |
| Asus ROG Zephyrus S17 GX703HSD | |
| MSI Stealth GS77 12UHS-083US | |
| Alienware x17 R2 P48E | |
| Genomsnitt 2x Samsung PM9A1 1TB (RAID 0) | |
| Alienware x17 RTX 3080 P48E | |
| MSI GT76 Titan DT 10SGS | |
| Gigabyte A7 X1 | |
* ... mindre är bättre
Disk Throttling: DiskSpd Read Loop, Queue Depth 8
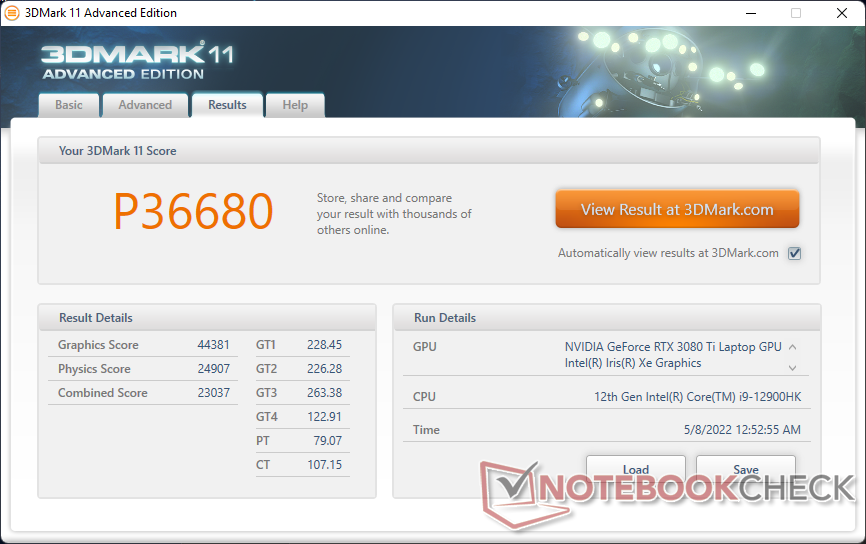
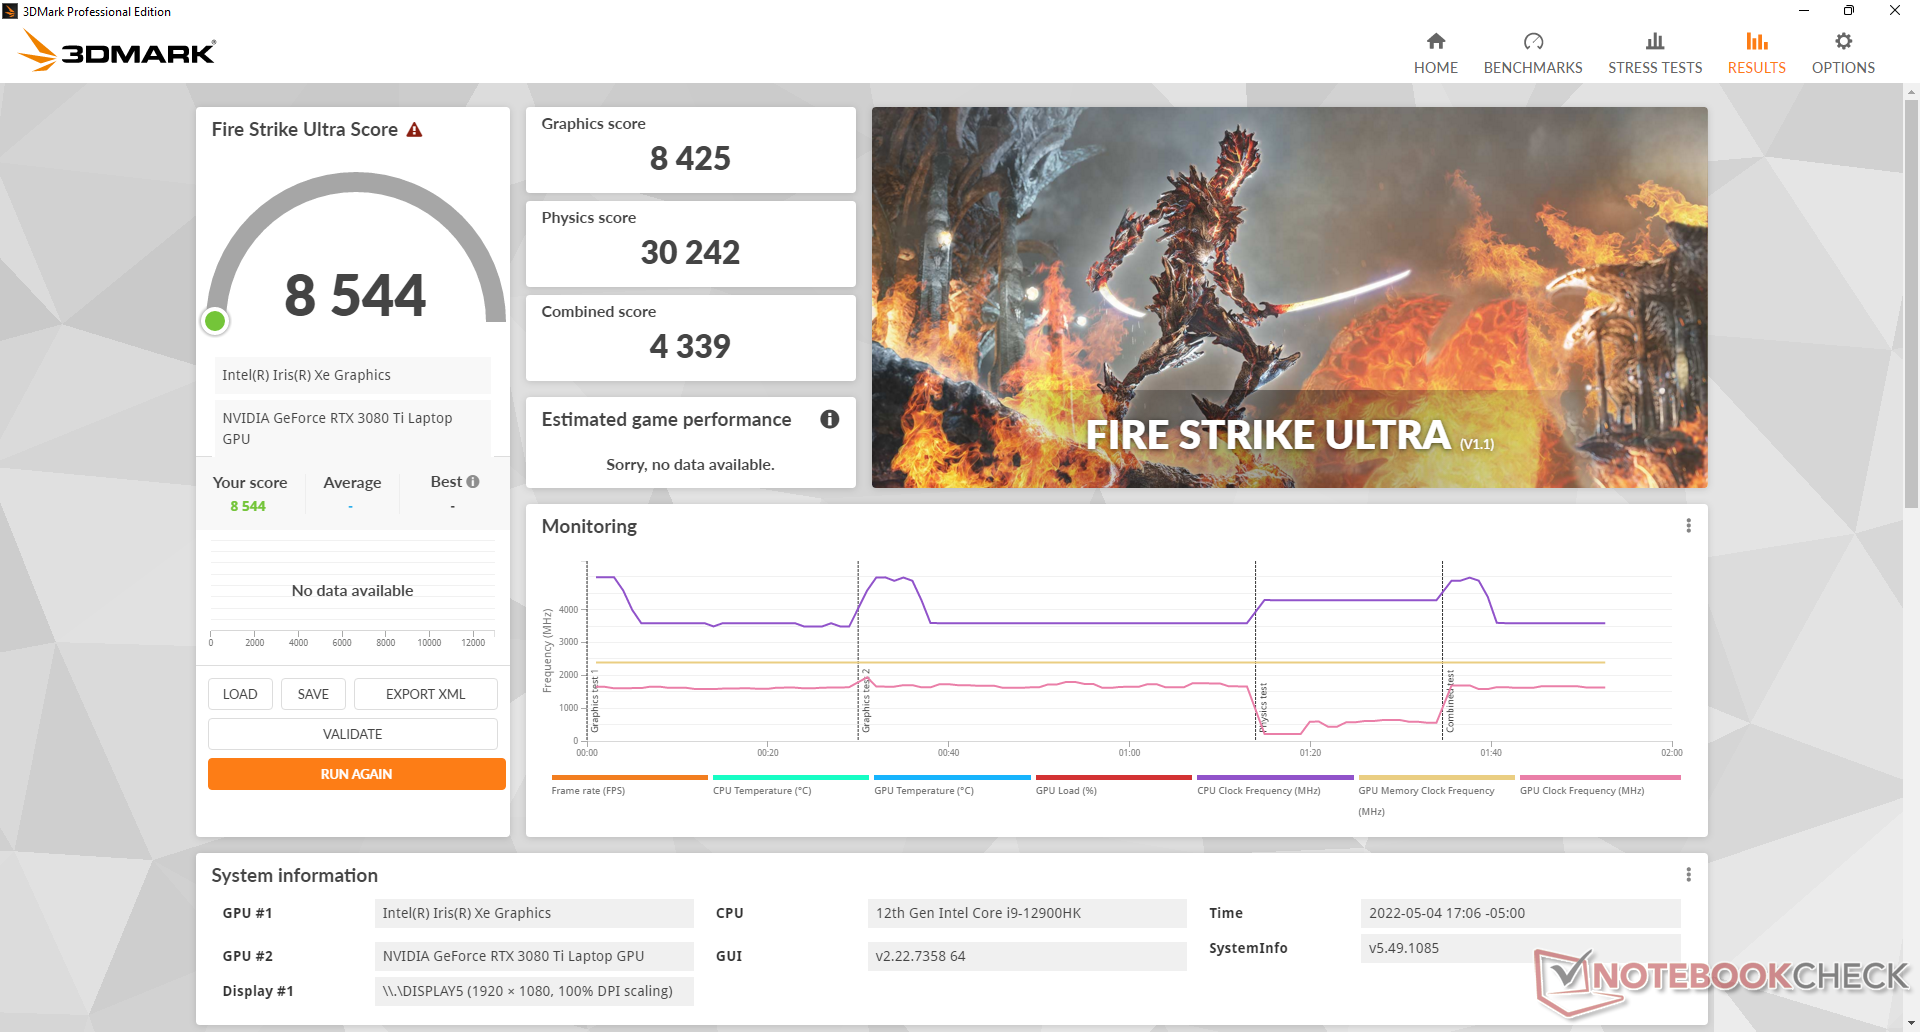
GPU-prestanda
Med sitt mycket höga TGP-mål på 175 W är grafikprestandan en av de snabbaste på en bärbar dator för spel. 2022 Razer Blade 15har till exempel samma GeForce RTX 3080 Ti GPU om än med ett lägre 110 W TGP-mål för 25 till 30 procent långsammare prestanda. Liknande brister kan observeras när man jämför GPU:n i Alienware med samma GPU i MSI GS77 också. I kombination med den snabbare CPU:n än genomsnittet kan användarna förvänta sig att bildfrekvensen är något högre än de flesta andra bärbara datorer för spel som är utrustade med GeForce RTX 3080-grafik.
Den mobila RTX 3080 Ti i vår Alienware x17 R2 liknar mest den mobila RTX 3080 Ti i vår Alienware x17 R2 skrivbordet GeForce RTX 3070. A stationär RTX 3080 Ti kan fortfarande erbjuda nästan 50 procent snabbare prestanda än vår mobila Alienware-version.
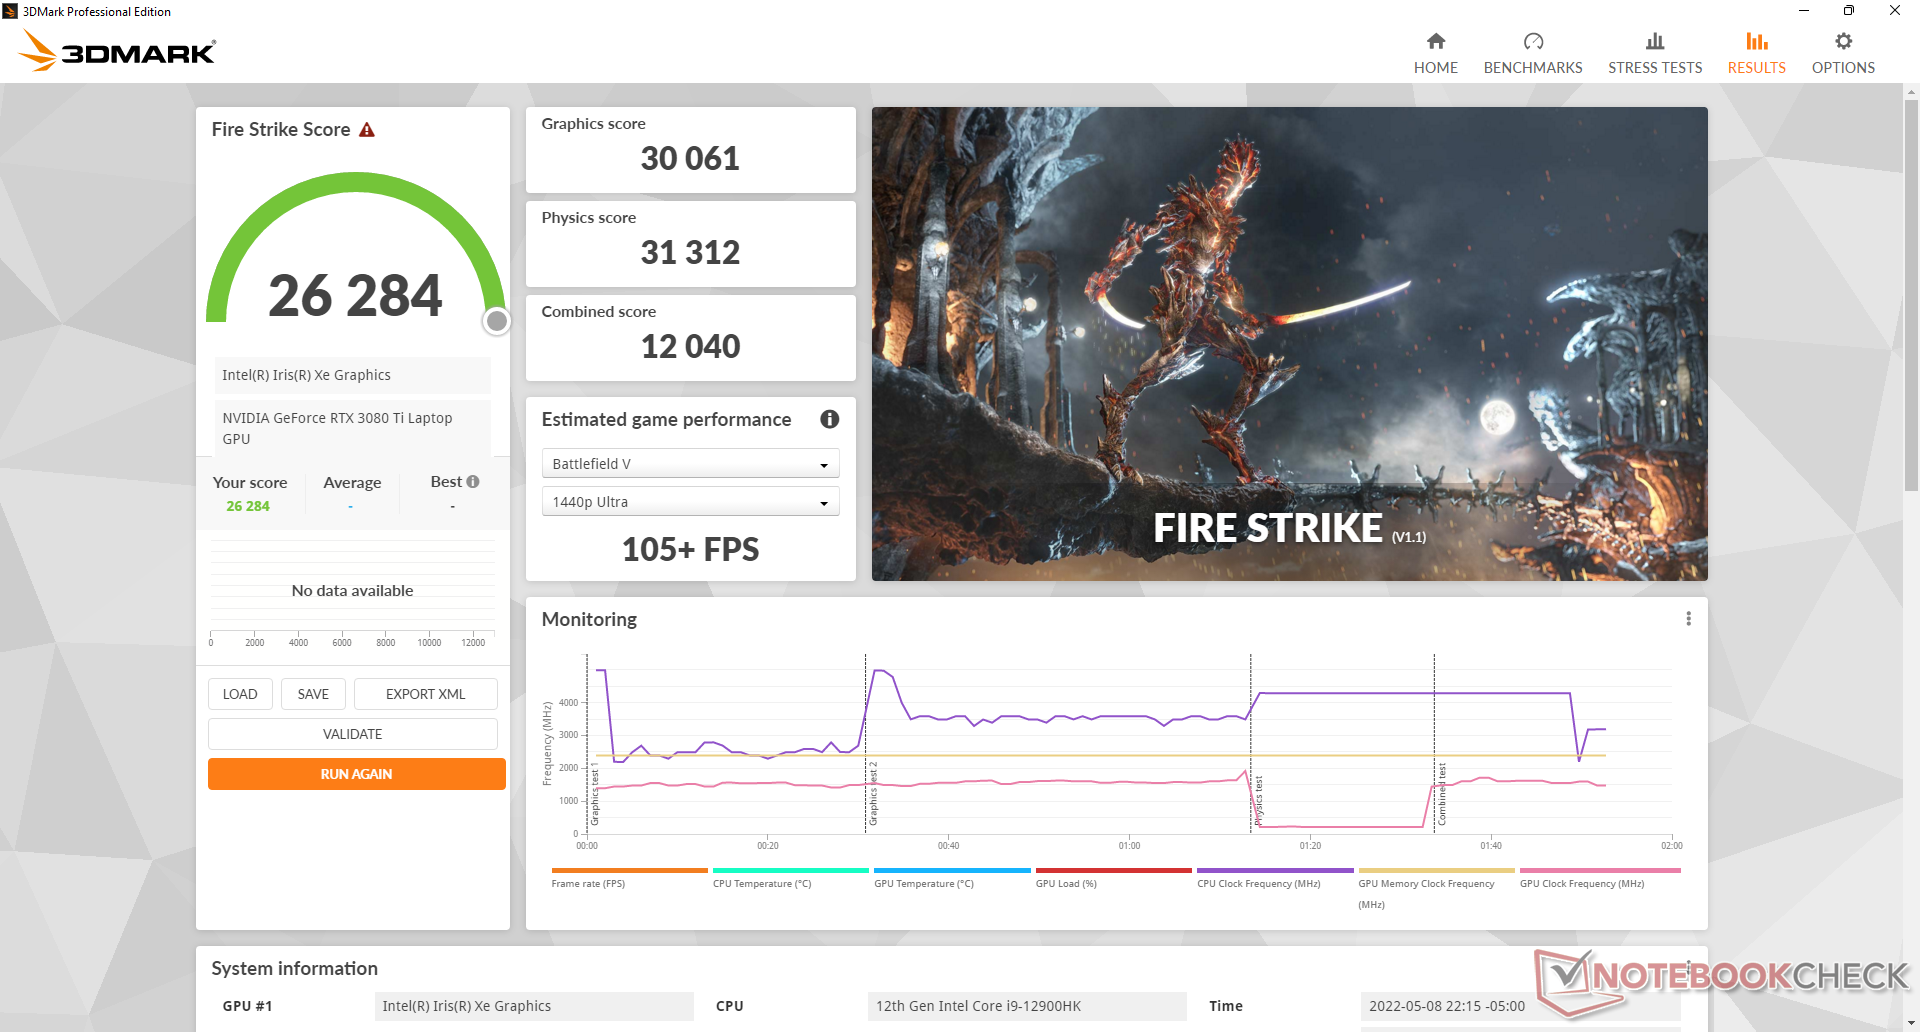
Tänk på att grafikprestandan är långsammare om du kör i balanserat läge istället för läge med maximal fläkt. Fire Strike Grafikresultatet skulle vara cirka 8 till 9 procent lägre när du använder strömprofilen Balanced.
| 3DMark 11 - 1280x720 Performance GPU | |
| Corsair One i300 | |
| Alienware x17 R2 P48E | |
| MSI GeForce RTX 3070 Ventus 3X | |
| Genomsnitt NVIDIA GeForce RTX 3080 Ti Laptop GPU (13920 - 45841, n=45) | |
| Razer Blade 17 (i7-12800H, RTX 3070 Ti) | |
| MSI Stealth GS77 12UHS-083US | |
| Schenker XMG Apex 17 M21 | |
| Alienware m17 R3 P45E | |
| Asus TUF Gaming F17 FX707Z-HX011W | |
| MSI GF75 Thin 10SDR | |
| 3DMark 11 Performance | 36680 poäng | |
| 3DMark Cloud Gate Standard Score | 63911 poäng | |
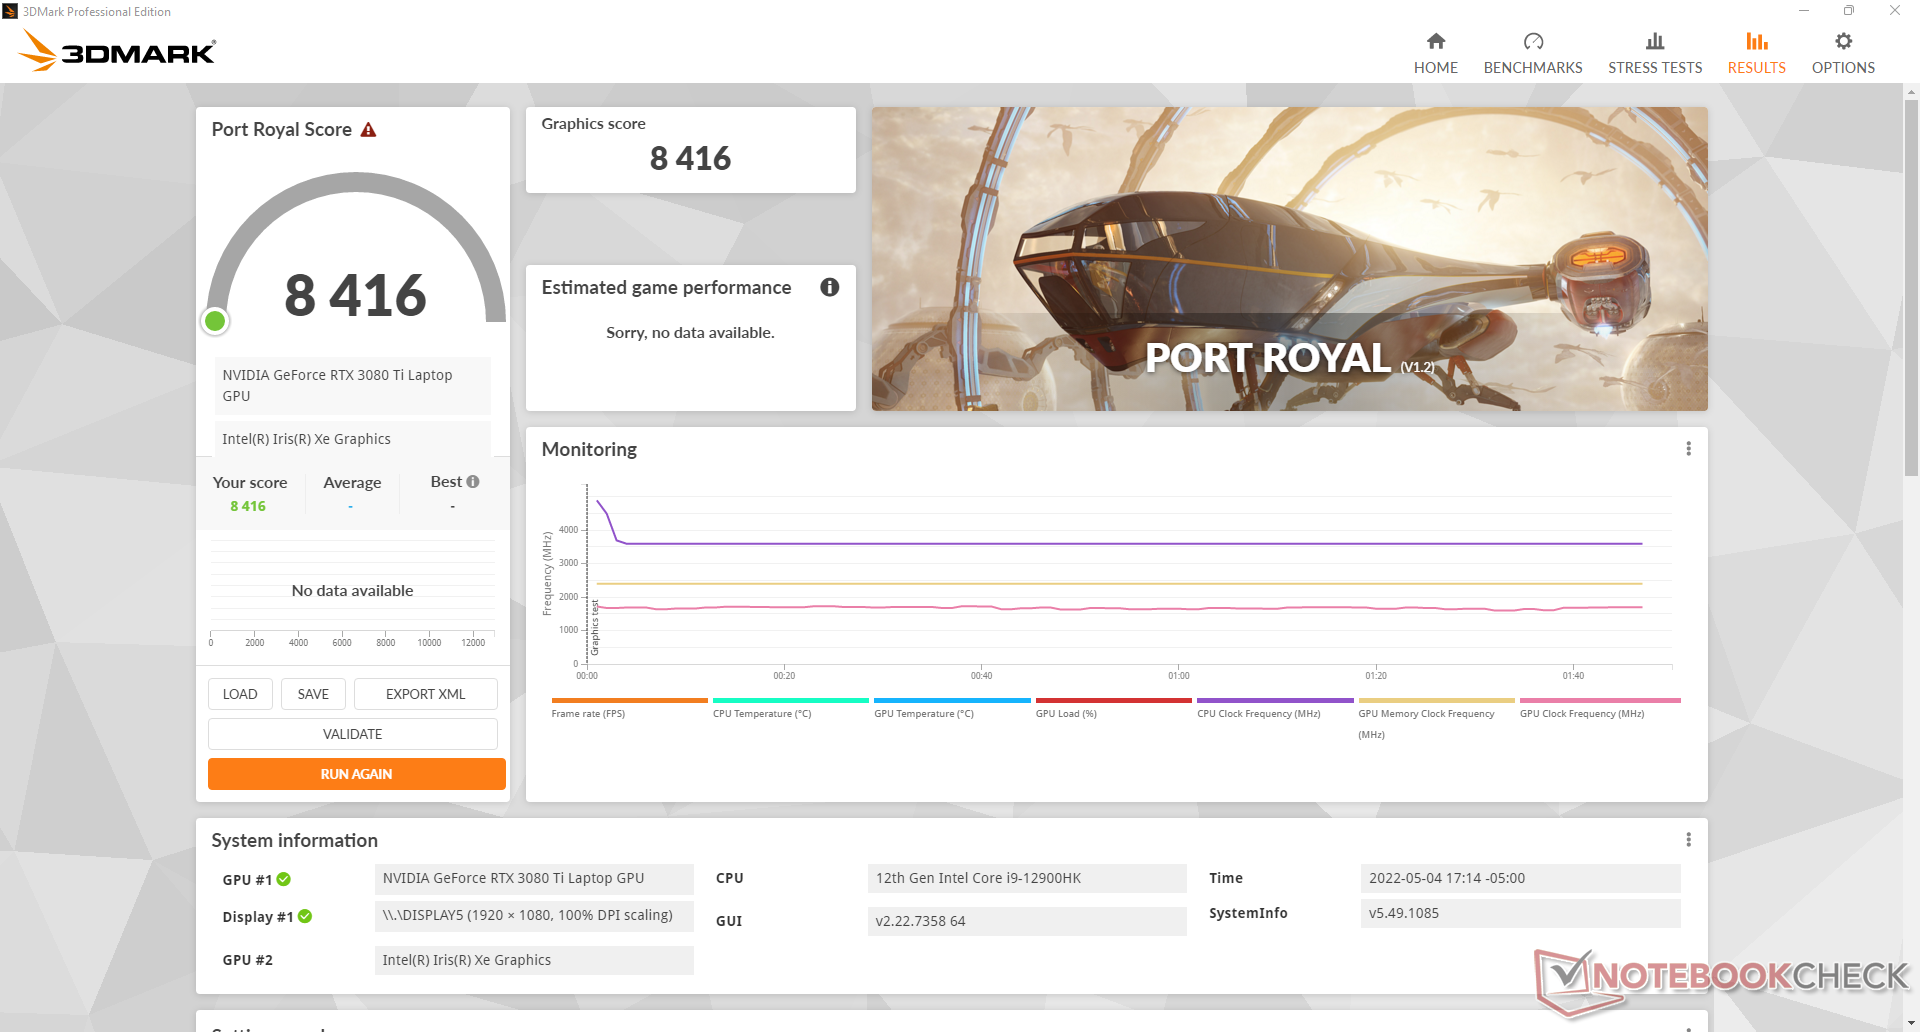
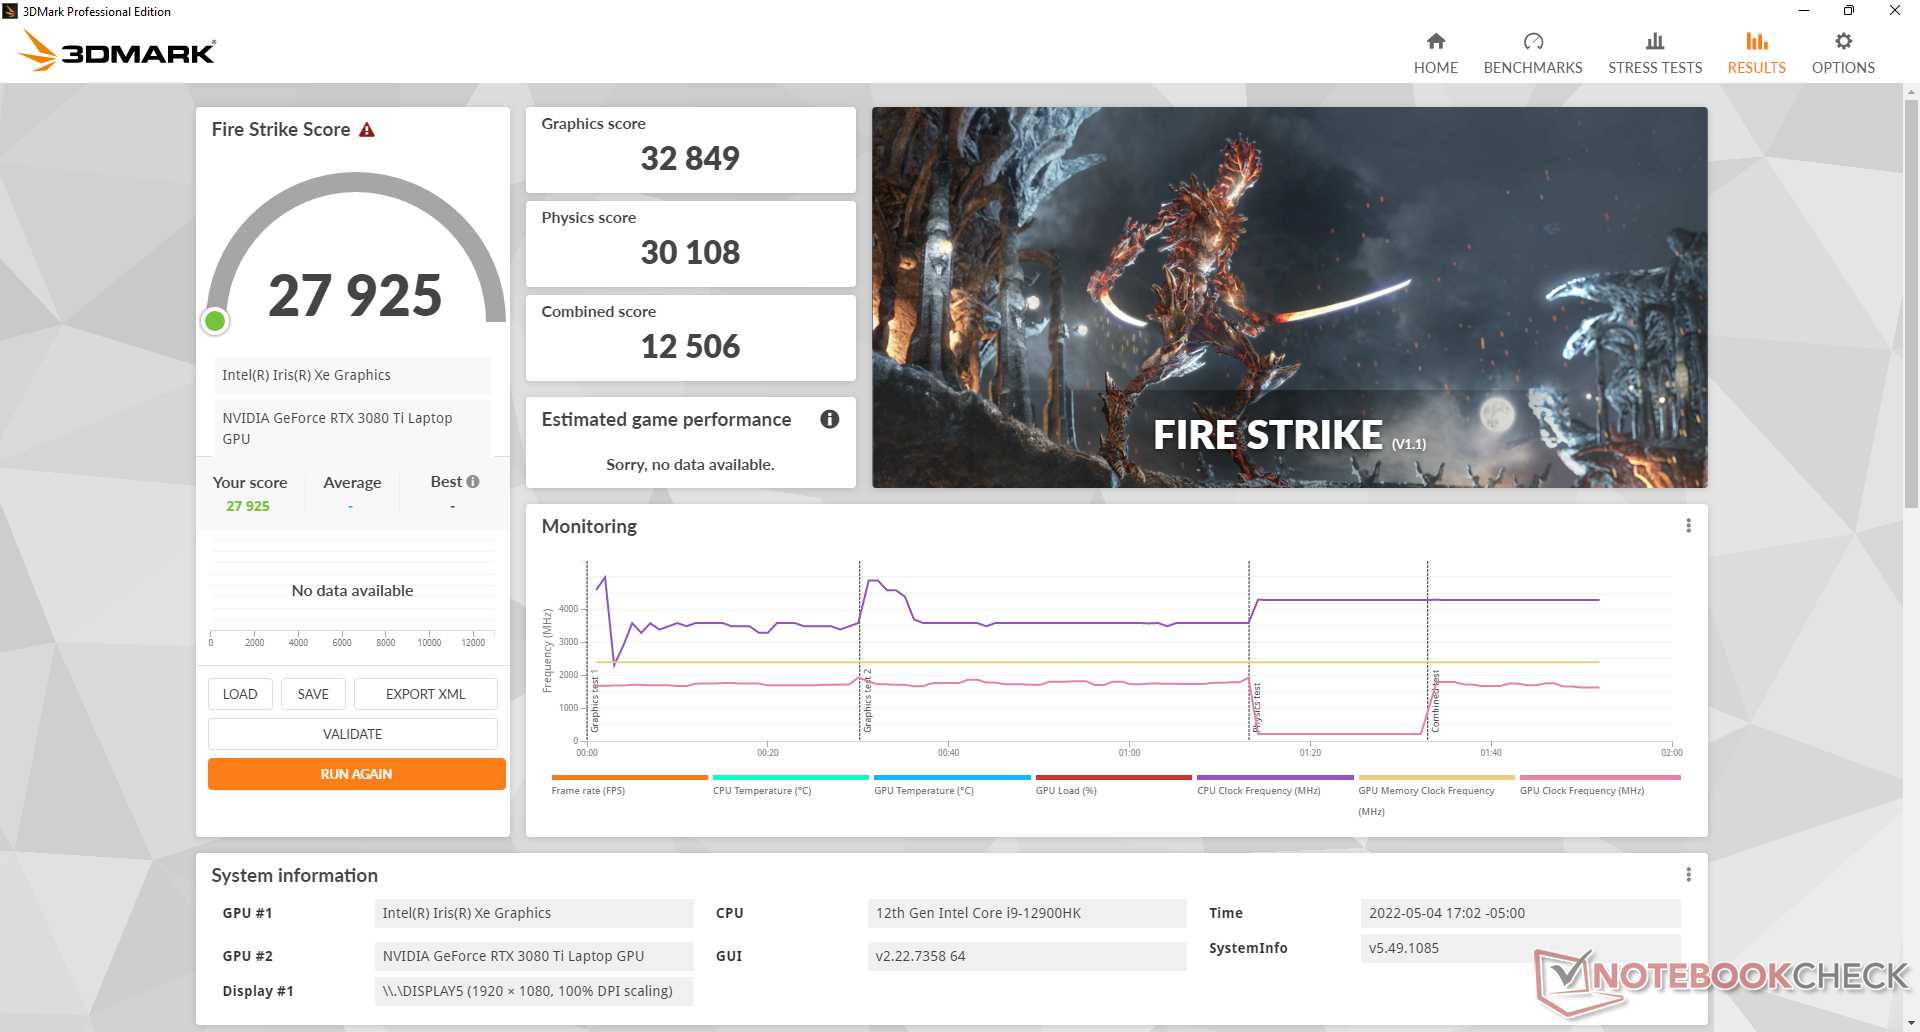
| 3DMark Fire Strike Score | 27925 poäng | |
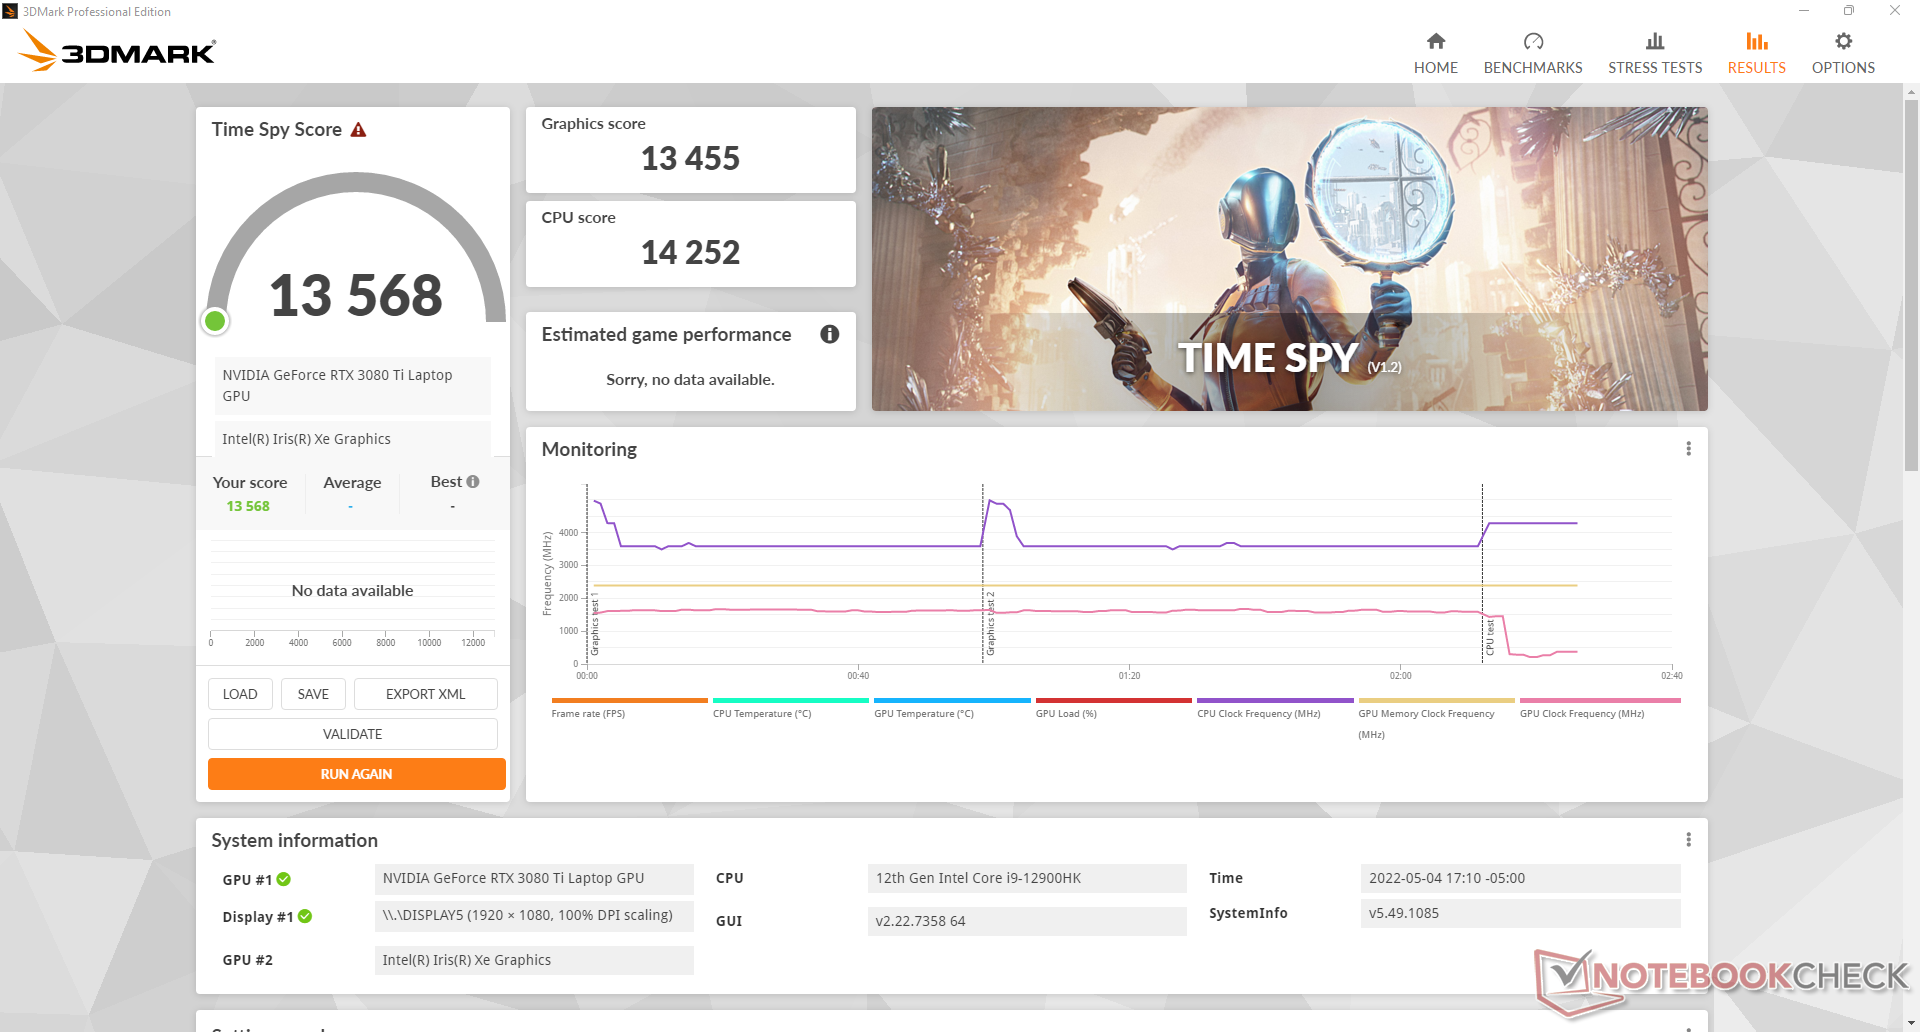
| 3DMark Time Spy Score | 13568 poäng | |
Hjälp | ||
| Final Fantasy XV Benchmark | |
| 1280x720 Lite Quality | |
| Corsair One i300 | |
| Alienware x17 R2 P48E | |
| MSI GeForce RTX 3070 Ventus 3X | |
| MSI Stealth GS77 12UHS-083US | |
| Alienware m17 R3 P45E | |
| Genomsnitt NVIDIA GeForce RTX 3080 Ti Laptop GPU (148.3 - 223, n=24) | |
| Asus TUF Gaming F17 FX707Z-HX011W | |
| Razer Blade 17 (i7-12800H, RTX 3070 Ti) | |
| 1920x1080 Standard Quality | |
| Corsair One i300 | |
| Alienware x17 R2 P48E | |
| MSI GeForce RTX 3070 Ventus 3X | |
| Genomsnitt NVIDIA GeForce RTX 3080 Ti Laptop GPU (110 - 189.3, n=27) | |
| Razer Blade 17 (i7-12800H, RTX 3070 Ti) | |
| Alienware m17 R3 P45E | |
| Schenker XMG Apex 17 M21 | |
| MSI Stealth GS77 12UHS-083US | |
| Asus TUF Gaming F17 FX707Z-HX011W | |
| 1920x1080 High Quality | |
| Corsair One i300 | |
| Alienware x17 R2 P48E | |
| MSI GeForce RTX 3070 Ventus 3X | |
| Genomsnitt NVIDIA GeForce RTX 3080 Ti Laptop GPU (30.7 - 140.6, n=42) | |
| Razer Blade 17 (i7-12800H, RTX 3070 Ti) | |
| Alienware m17 R3 P45E | |
| MSI Stealth GS77 12UHS-083US | |
| Schenker XMG Apex 17 M21 | |
| Asus TUF Gaming F17 FX707Z-HX011W | |
Witcher 3 FPS-tabell
| låg | med. | hög | ultra | |
|---|---|---|---|---|
| GTA V (2015) | 187 | 185.1 | 180.8 | 126.3 |
| The Witcher 3 (2015) | 500.9 | 388.5 | 267.7 | 128 |
| Dota 2 Reborn (2015) | 186.1 | 172.3 | 166.6 | 158.9 |
| Final Fantasy XV Benchmark (2018) | 215 | 167.8 | 127.8 | |
| X-Plane 11.11 (2018) | 161 | 143.9 | 112.9 | |
| Strange Brigade (2018) | 474 | 300 | 243 | 213 |
| Cyberpunk 2077 1.6 (2022) | 167.7 | 142 | 116.2 | 115.7 |
Utsläpp
Systembuller
Fläktljudet beror på inställningarna i Alienware Command Center. Alienwares fläktar tenderar att pulsa ofta när de är i balanserat läge eller högre, så tyst läge rekommenderas när du surfar, skickar e-post eller streamar. Vår enhet skulle sällan gå över 32 dB(A) när den körs med sådana kravlösa belastningar för att vara märkbar men inte störande.
Vid spel i balanserat läge stabiliseras fläktljudet på cirka 43,3 dB(A) jämfört med 52,5 dB(A) i högsta fläktläge. Användare kanske vill spela i balanserat läge för det betydligt tystare fläktljudet trots det tidigare nämnda underskottet i prestanda som det medför.
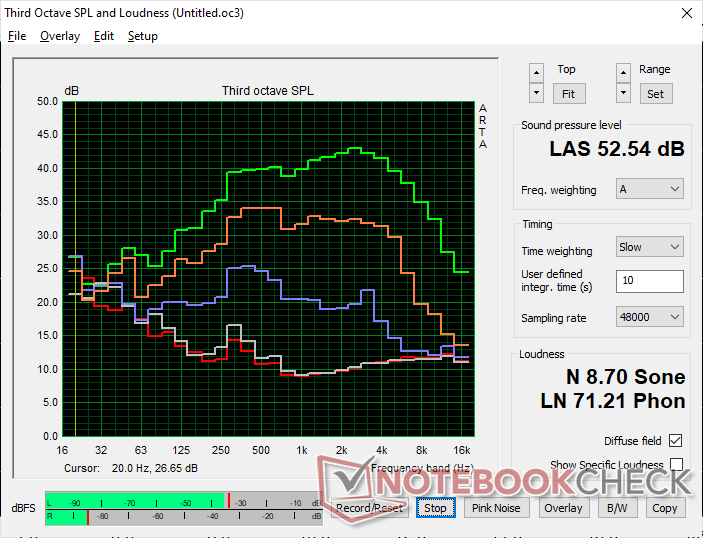
Ljudnivå
| Låg belastning |
| 23.1 / 23.1 / 23.1 dB(A) |
| Hög belastning |
| 31.9 / 52.5 dB(A) |
 | ||
30 dB tyst 40 dB(A) hörbar 50 dB(A) högt ljud |
||
min: | ||
| Alienware x17 R2 P48E GeForce RTX 3080 Ti Laptop GPU, i9-12900HK, 2x Samsung PM9A1 1TB (RAID 0) | Alienware x17 RTX 3080 P48E GeForce RTX 3080 Laptop GPU, i7-11800H, 2x WDC PC SN730 SDBPNTY-1T00 (RAID 0) | Asus ROG Zephyrus S17 GX703HSD GeForce RTX 3080 Laptop GPU, i9-11900H, Samsung PM9A1 MZVL22T0HBLB | MSI Stealth GS77 12UHS-083US GeForce RTX 3080 Ti Laptop GPU, i7-12700H, Micron 3400 1TB MTFDKBA1T0TFH | MSI GT76 Titan DT 10SGS GeForce RTX 2080 Super Mobile, i9-10900K, 2x WDC PC SN730 SDBPNTY-1T00 (RAID 0) | Gigabyte A7 X1 GeForce RTX 3070 Laptop GPU, R9 5900HX, ESR512GTLCG-EAC-4 | |
|---|---|---|---|---|---|---|
| Noise | -7% | -2% | -8% | -18% | -28% | |
| av / miljö * (dB) | 22.7 | 24.9 -10% | 23 -1% | 24.5 -8% | 26.4 -16% | 24 -6% |
| Idle Minimum * (dB) | 23.1 | 24.9 -8% | 23 -0% | 24.5 -6% | 27.5 -19% | 25 -8% |
| Idle Average * (dB) | 23.1 | 24.9 -8% | 23 -0% | 24.5 -6% | 27.5 -19% | 29 -26% |
| Idle Maximum * (dB) | 23.1 | 29.6 -28% | 23 -0% | 30.8 -33% | 29.8 -29% | 35 -52% |
| Load Average * (dB) | 31.9 | 31.1 3% | 41 -29% | 34.6 -8% | 30.9 3% | 58 -82% |
| Witcher 3 ultra * (dB) | 52.5 | 49.7 5% | 45 14% | 46.2 12% | 60.7 -16% | 57 -9% |
| Load Maximum * (dB) | 52.5 | 54.8 -4% | 52 1% | 56.8 -8% | 66.6 -27% | 59 -12% |
* ... mindre är bättre
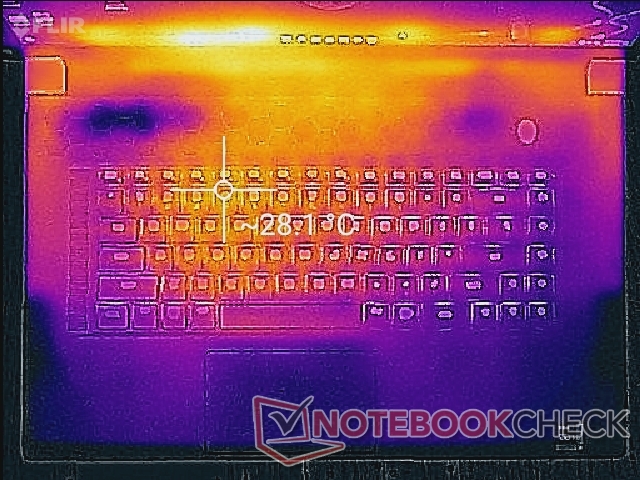
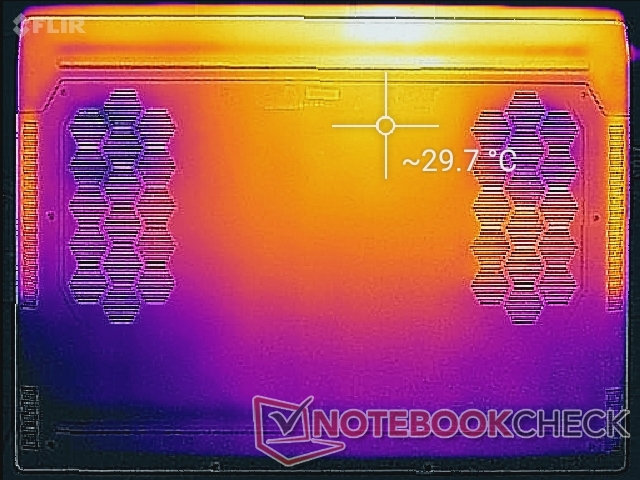
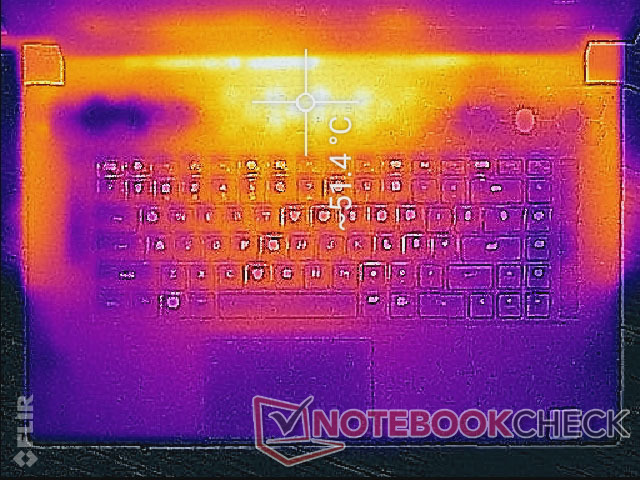
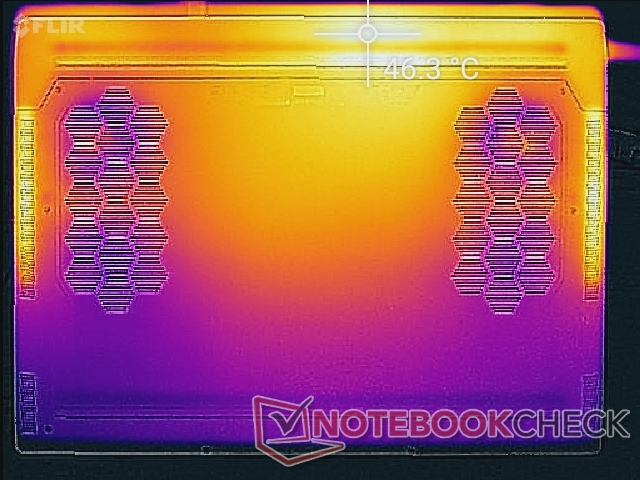
Temperatur
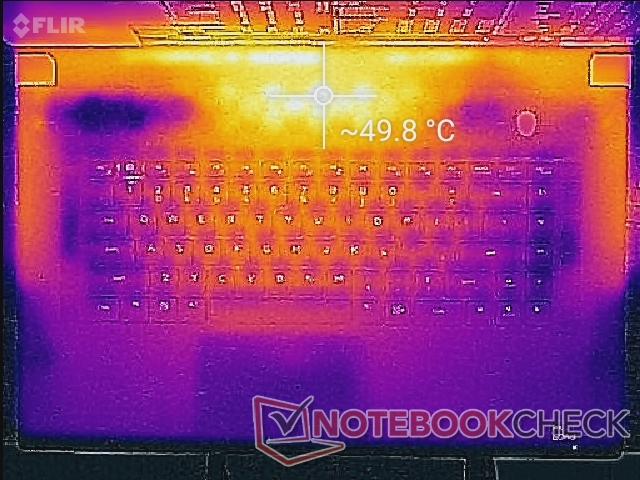
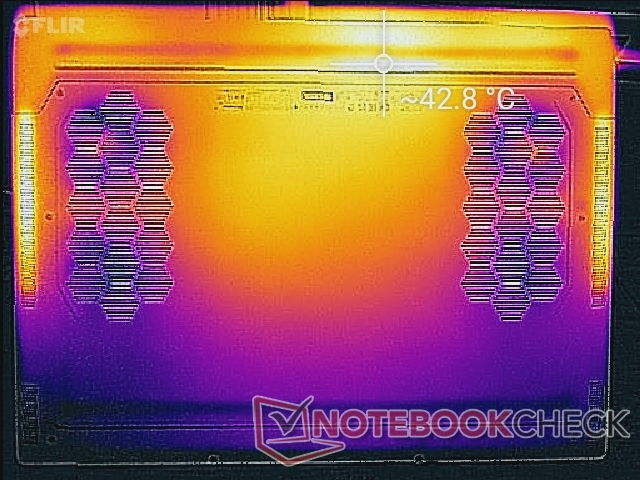
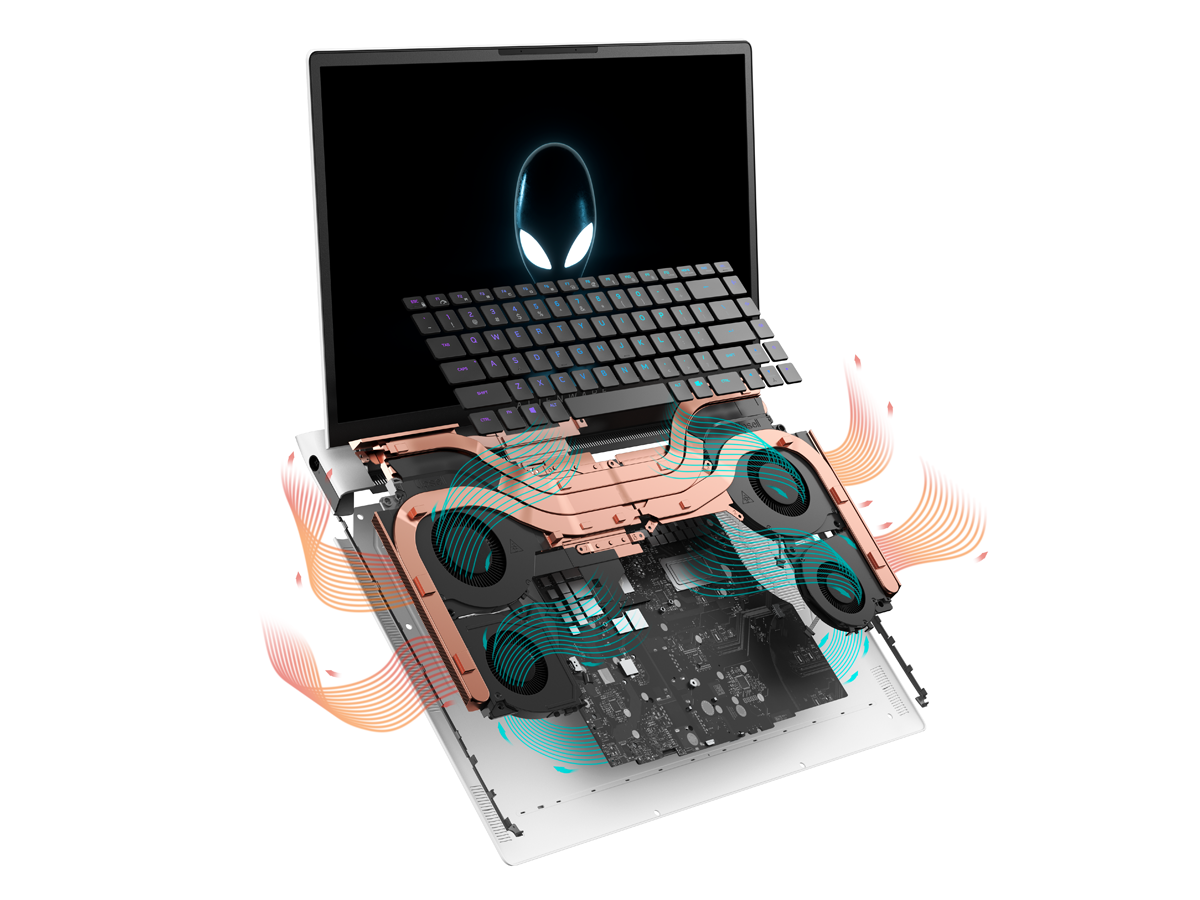
Yttemperaturerna är generellt sett svalare än vad vi förväntade oss med tanke på de extrema prestandanivåer som Dell siktar på med en så tunn design. Varma punkter kan nå över 45 C eller 50 C vid hög belastning, men dessa områden ligger på baksidan av chassit och bort från tangentbordstangenterna och handflatsstödet. Systemet är varmt men aldrig obehagligt varmt när man spelar.
Tänk på att det finns massor av ventilationsgaller på nästan alla sidor av systemet. Med CPU-temperaturer som når så högt som de gör under belastning blir det viktigt att inte blockera några öppningar när det är möjligt.
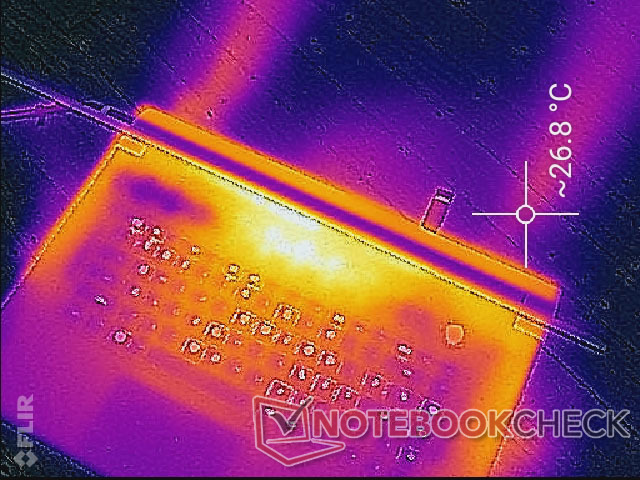
(-) Den maximala temperaturen på ovansidan är 49.6 °C / 121 F, jämfört med genomsnittet av 40.4 °C / 105 F , allt från 21.2 till 68.8 °C för klassen Gaming.
(±) Botten värms upp till maximalt 42.4 °C / 108 F, jämfört med genomsnittet av 43.3 °C / 110 F
(+) Vid tomgångsbruk är medeltemperaturen för ovansidan 26.1 °C / 79 F, jämfört med enhetsgenomsnittet på 33.9 °C / ### class_avg_f### F.
(±) När du spelar The Witcher 3 är medeltemperaturen för ovansidan 34.7 °C / 94 F, jämfört med enhetsgenomsnittet på 33.9 °C / ## #class_avg_f### F.
(+) Handledsstöden och pekplattan är kallare än hudtemperaturen med maximalt 29.2 °C / 84.6 F och är därför svala att ta på.
(±) Medeltemperaturen för handledsstödsområdet på liknande enheter var 28.8 °C / 83.8 F (-0.4 °C / -0.8 F).
| Alienware x17 R2 P48E Intel Core i9-12900HK, NVIDIA GeForce RTX 3080 Ti Laptop GPU | Alienware x17 RTX 3080 P48E Intel Core i7-11800H, NVIDIA GeForce RTX 3080 Laptop GPU | Asus ROG Zephyrus S17 GX703HSD Intel Core i9-11900H, NVIDIA GeForce RTX 3080 Laptop GPU | MSI Stealth GS77 12UHS-083US Intel Core i7-12700H, NVIDIA GeForce RTX 3080 Ti Laptop GPU | MSI GT76 Titan DT 10SGS Intel Core i9-10900K, NVIDIA GeForce RTX 2080 Super Mobile | Gigabyte A7 X1 AMD Ryzen 9 5900HX, NVIDIA GeForce RTX 3070 Laptop GPU | |
|---|---|---|---|---|---|---|
| Heat | -14% | -18% | -16% | 7% | 2% | |
| Maximum Upper Side * (°C) | 49.6 | 58.4 -18% | 59 -19% | 50.6 -2% | 36.4 27% | 44 11% |
| Maximum Bottom * (°C) | 42.4 | 49 -16% | 53 -25% | 59.6 -41% | 43 -1% | 49 -16% |
| Idle Upper Side * (°C) | 29.2 | 33.6 -15% | 35 -20% | 30 -3% | 28 4% | 27 8% |
| Idle Bottom * (°C) | 32 | 34.6 -8% | 35 -9% | 37.4 -17% | 33.4 -4% | 30 6% |
* ... mindre är bättre
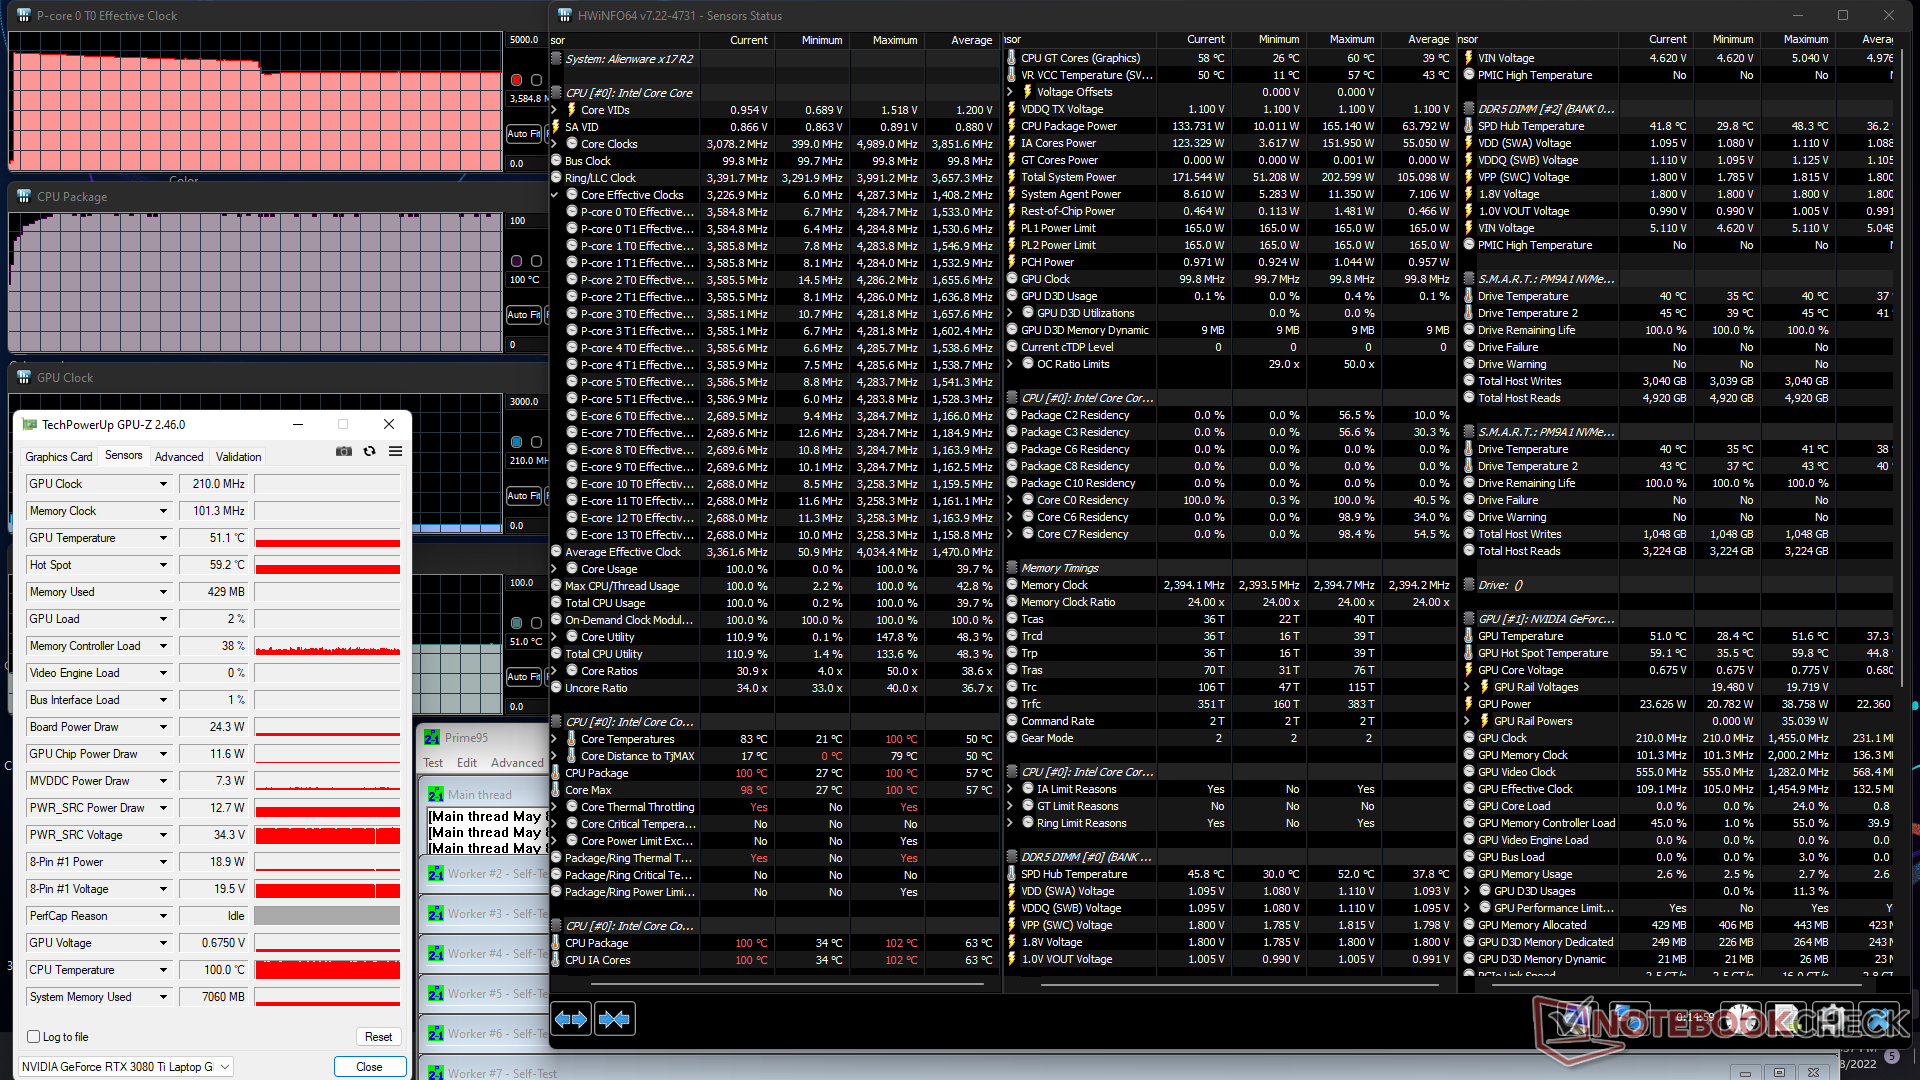
Stresstest
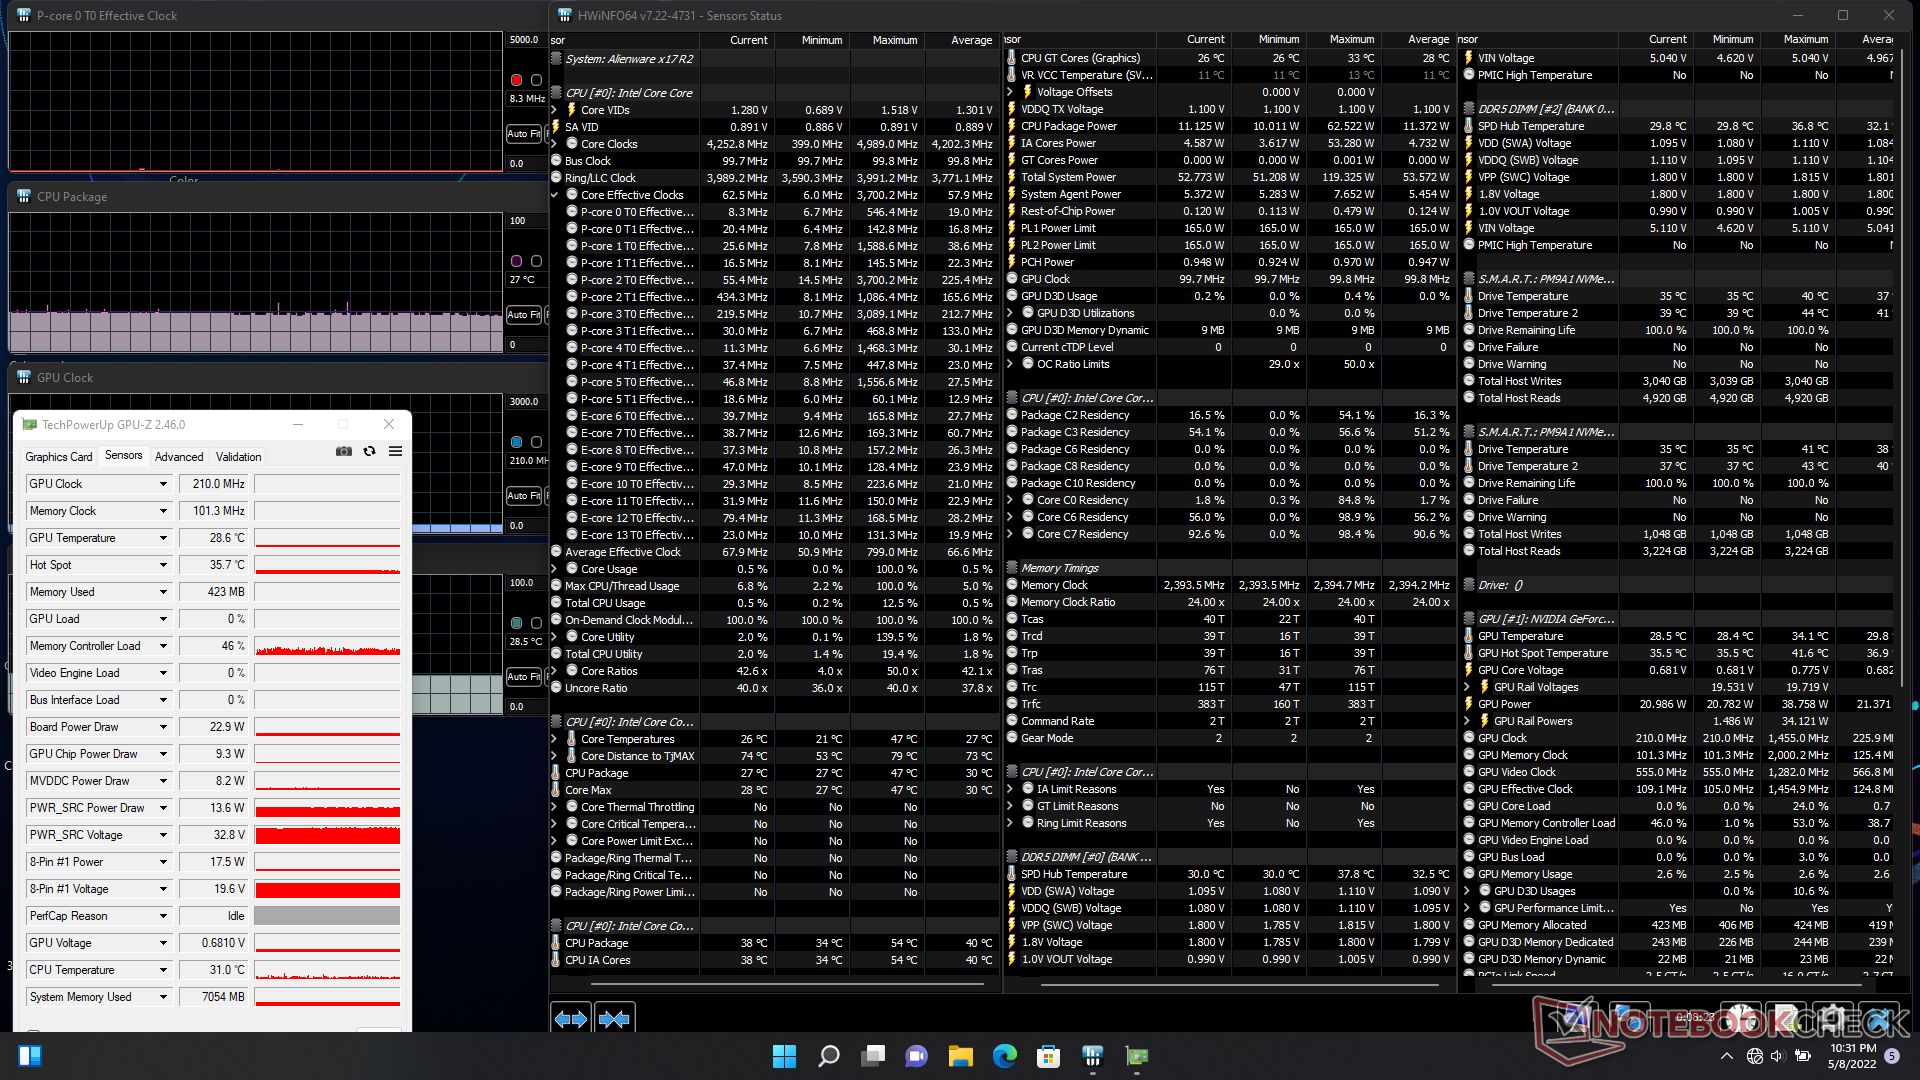
När Prime95 kördes ökade CPU-klockfrekvensen till 4,3 GHz i bara några sekunder innan den nådde en kärntemperatur på 100 C. Klockfrekvensen stabiliserades så småningom på 3,6 GHz och kärntemperaturen låg strax under 100 C. Samtidigt var CPU-paketets strömförbrukning så hög som 165 W i början av testet innan den stabiliserades på 134 W på grund av termiska begränsningar. Det är tydligt att CPU:n körs så snabbt och så mycket den kan med tanke på begränsningarna i Alienwares kylningslösning. Som jämförelse skulle Core i7-12700H i MSI GS77 stabilisera sig vid ett långsammare intervall på 2,7-3 GHz när den är under liknande förhållanden.
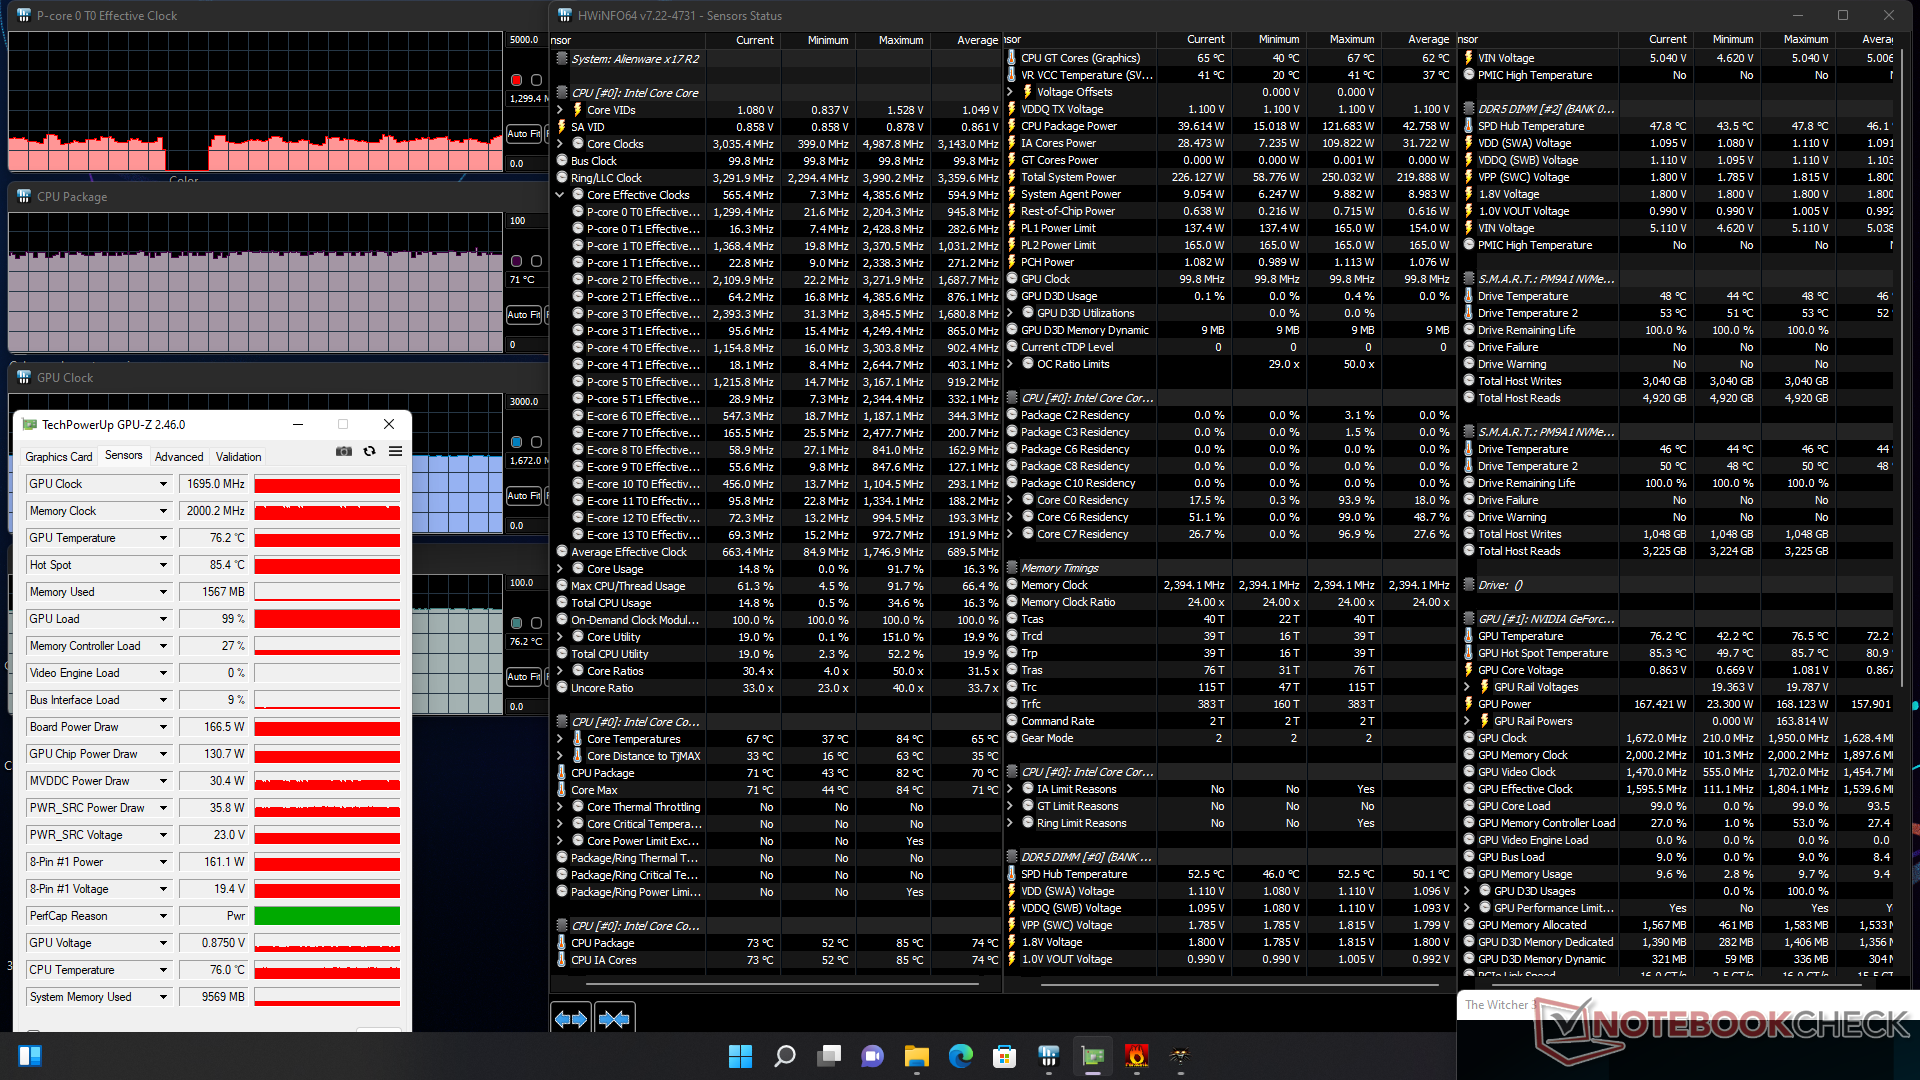
GPU-klockfrekvensen, minnesklockan och kortets strömförbrukning skulle stabiliseras vid 1695 MHz, 2000 MHz respektive 167 W när man kör Witcher 3 i högsta fläktläge. I balanserat läge skulle GPU-klockan och kortets strömförbrukning sjunka till 1477 MHz respektive 141 W. Användarna måste alltså uthärda läget för maximalt fläktljud om de vill ha den fulla prestandapotentialen hos x17 R2. Att köra samma test på MSI GS77 skulle resultera i en långsammare GPU-klocka och minnesklocka på 1432 MHz respektive 1750 MHz.
Att köra på batteri kommer att begränsa prestandan avsevärt. Ett Fire Strike -test på batterier skulle ge fysik- och grafikpoäng på 27369 respektive 12095 poäng, jämfört med 30108 och 32849 poäng vid nätanslutning.
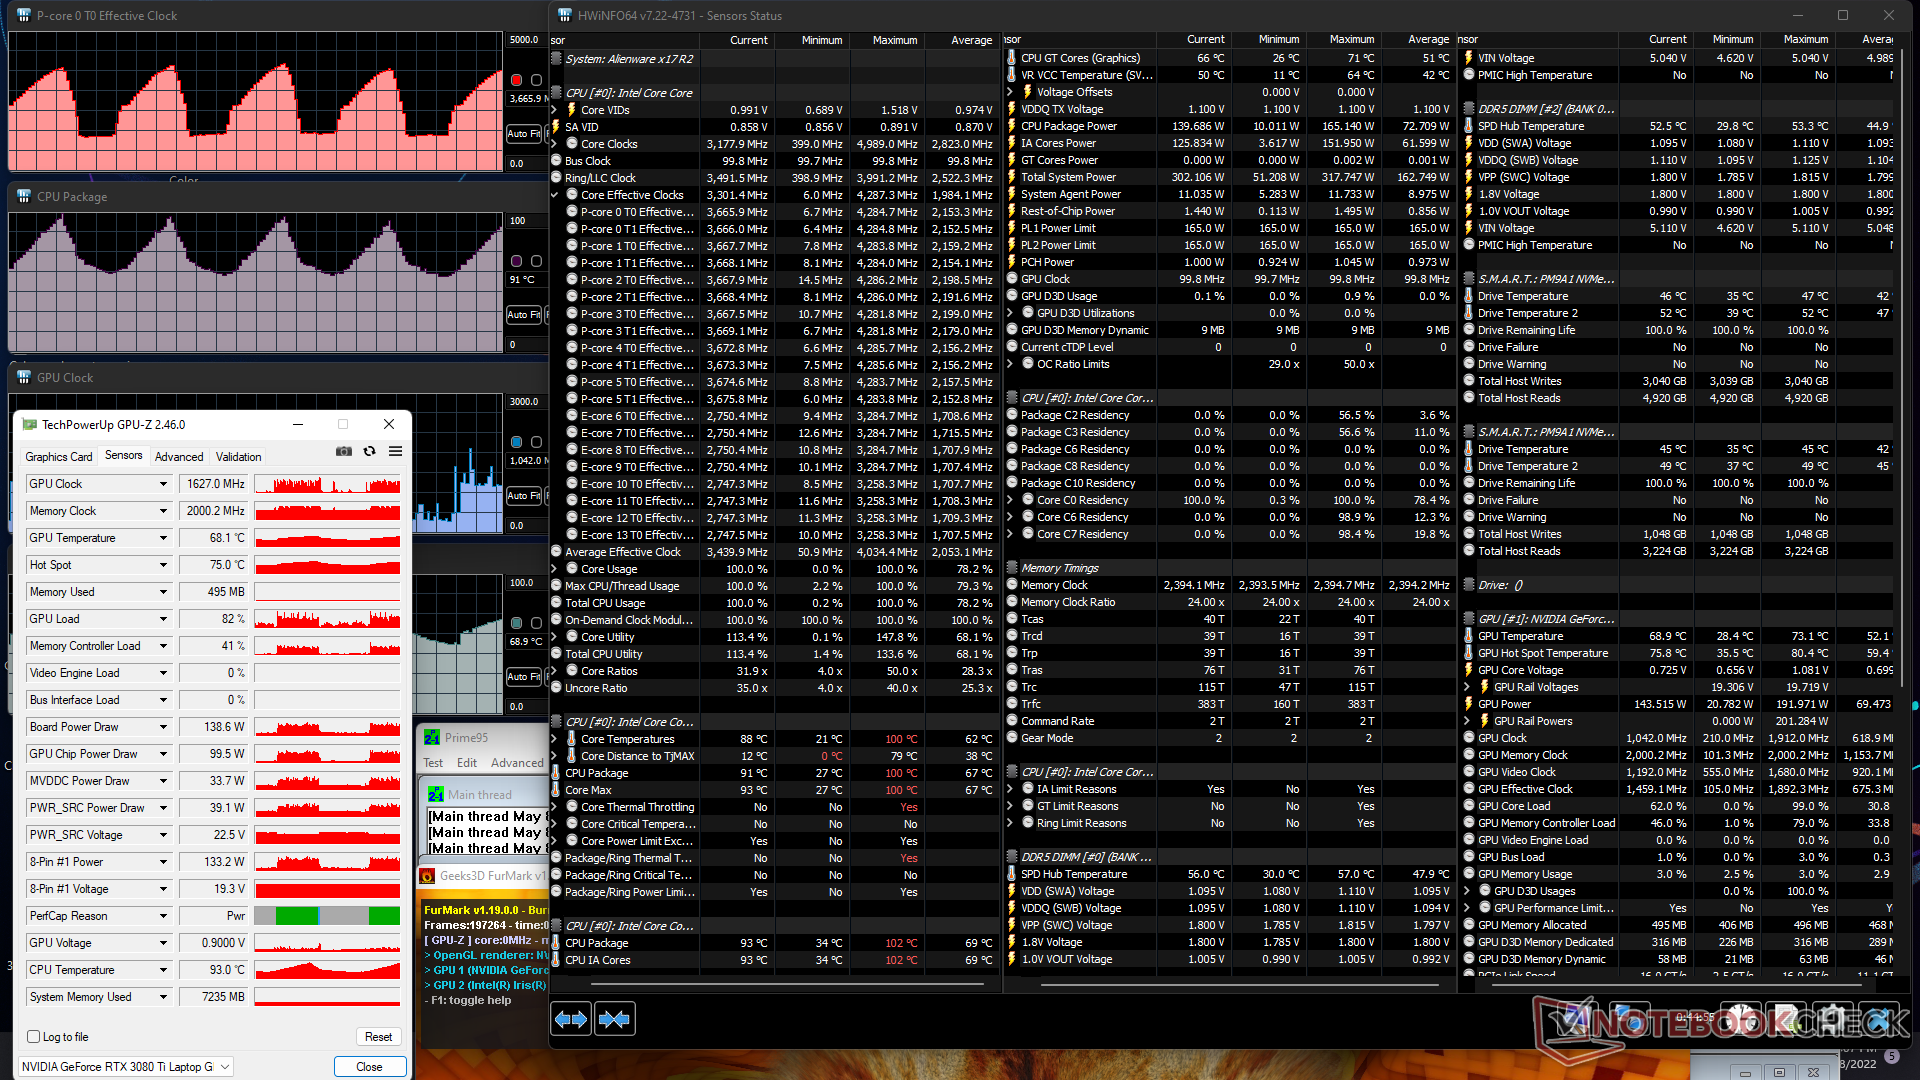
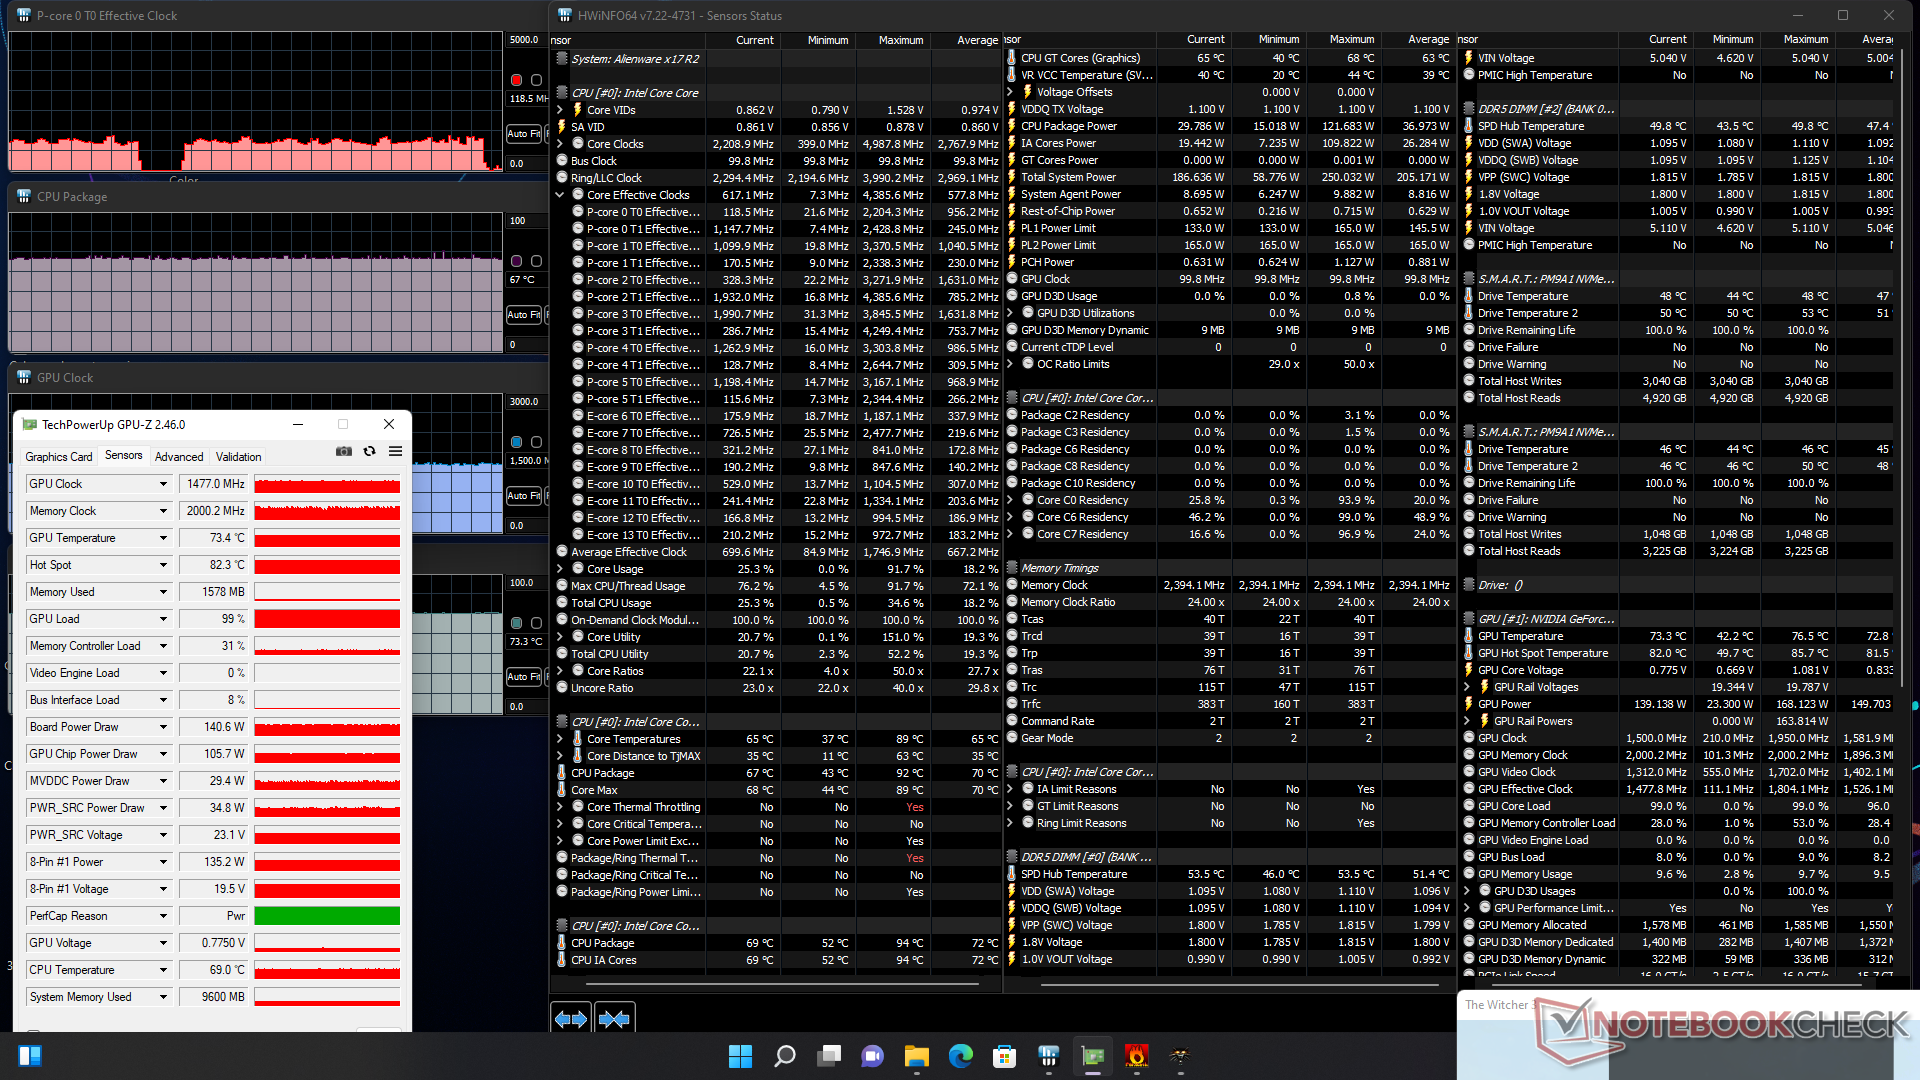
| CPU-klocka (GHz) | GPU-klocka (MHz) | Genomsnittlig CPU-temperatur (°C) | Genomsnittlig GPU-temperatur (°C) | |
| Systemets tomgång (högsta fläktläge) | -- | -- | 27 | 29 |
| Prime95 Stress (högsta fläktläge) | 3,6 | -- | -- | 100 |
| Prime95 + FurMark Stress (högsta fläktläge) | 1,4 - 3,7 | 337 - 1770 | 53 - 100 | 49 - 71 |
| Witcher 3 Stress (balanserat läge) | ~0,6 | 1477 | 67 | 73 |
| Witcher 3 Spänning (maximalt fläktläge) | ~1,3 | 1695 | 71 | 76 |
Högtalare
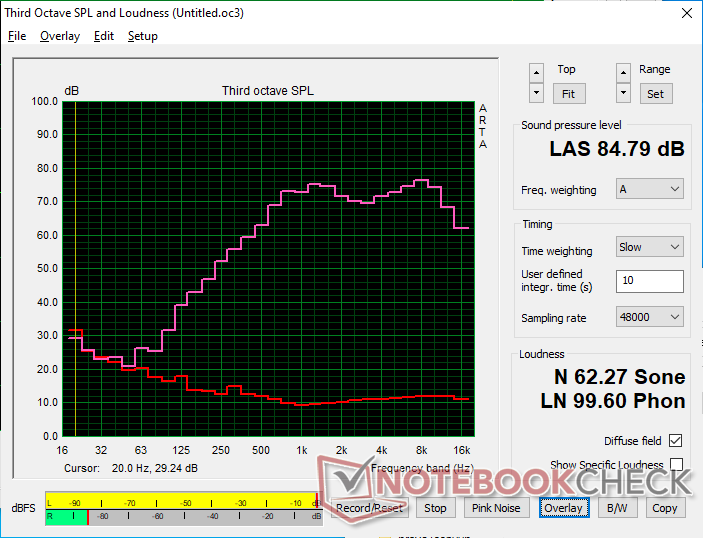
Alienware x17 R2 P48E ljudanalys
(+) | högtalare kan spela relativt högt (84.3 dB)
Bas 100 - 315 Hz
(±) | reducerad bas - i genomsnitt 9.7% lägre än medianen
(+) | basen är linjär (5.5% delta till föregående frekvens)
Mellan 400 - 2000 Hz
(+) | balanserad mellan - endast 1.6% från medianen
(+) | mids är linjära (3% delta till föregående frekvens)
Högsta 2 - 16 kHz
(±) | högre toppar - i genomsnitt 5% högre än medianen
(±) | linjäriteten för toppar är genomsnittlig (7.6% delta till föregående frekvens)
Totalt 100 - 16 000 Hz
(+) | det totala ljudet är linjärt (9.3% skillnad mot median)
Jämfört med samma klass
» 3% av alla testade enheter i den här klassen var bättre, 2% liknande, 95% sämre
» Den bästa hade ett delta på 6%, genomsnittet var 18%, sämst var 132%
Jämfört med alla testade enheter
» 3% av alla testade enheter var bättre, 1% liknande, 96% sämre
» Den bästa hade ett delta på 4%, genomsnittet var 24%, sämst var 134%
Apple MacBook Pro 16 2021 M1 Pro ljudanalys
(+) | högtalare kan spela relativt högt (84.7 dB)
Bas 100 - 315 Hz
(+) | bra bas - bara 3.8% från medianen
(+) | basen är linjär (5.2% delta till föregående frekvens)
Mellan 400 - 2000 Hz
(+) | balanserad mellan - endast 1.3% från medianen
(+) | mids är linjära (2.1% delta till föregående frekvens)
Högsta 2 - 16 kHz
(+) | balanserade toppar - endast 1.9% från medianen
(+) | toppar är linjära (2.7% delta till föregående frekvens)
Totalt 100 - 16 000 Hz
(+) | det totala ljudet är linjärt (4.6% skillnad mot median)
Jämfört med samma klass
» 0% av alla testade enheter i den här klassen var bättre, 0% liknande, 100% sämre
» Den bästa hade ett delta på 5%, genomsnittet var 17%, sämst var 45%
Jämfört med alla testade enheter
» 0% av alla testade enheter var bättre, 0% liknande, 100% sämre
» Den bästa hade ett delta på 4%, genomsnittet var 24%, sämst var 134%
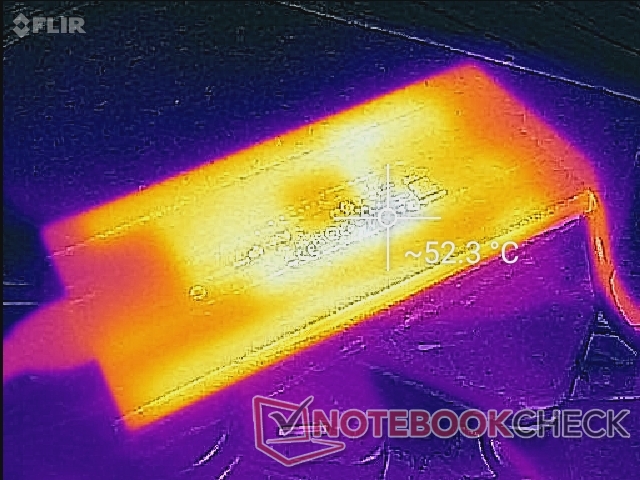
Energiförvaltning
Effektförbrukning
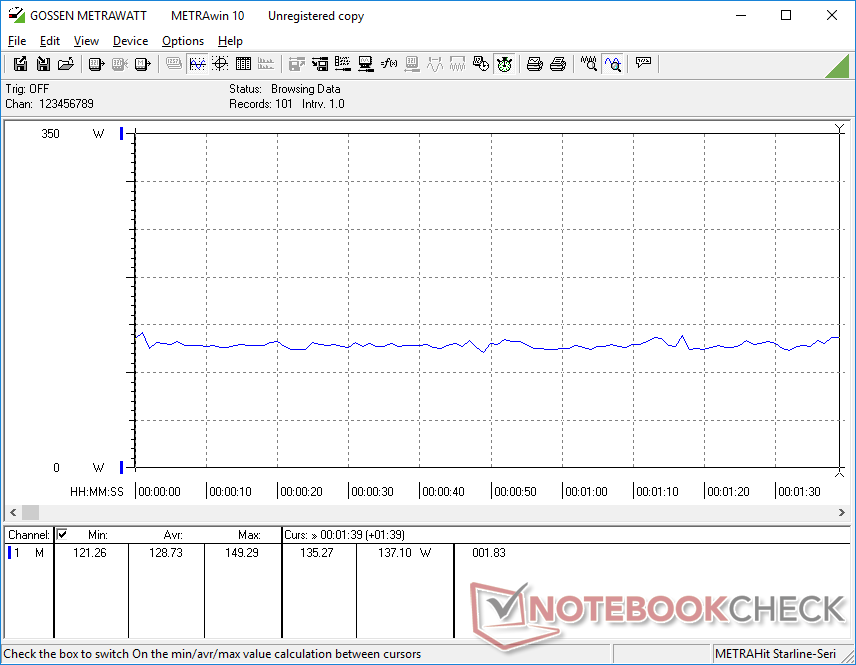
Alienwares bärbara datorer har alltid varit mer energikrävande än konkurrerande alternativ och x17 R2 är inte annorlunda. Bara tomgång på skrivbordet kan kräva upp till 60 W när den är inställd på High Performance-läget, vilket är mer än de flesta Ultrabook-drivna datorer i U-serien när den är belastad. Den mycket höga förbrukningen är sannolikt ansvarig för den dåliga batteritid som registreras i nästa avsnitt.
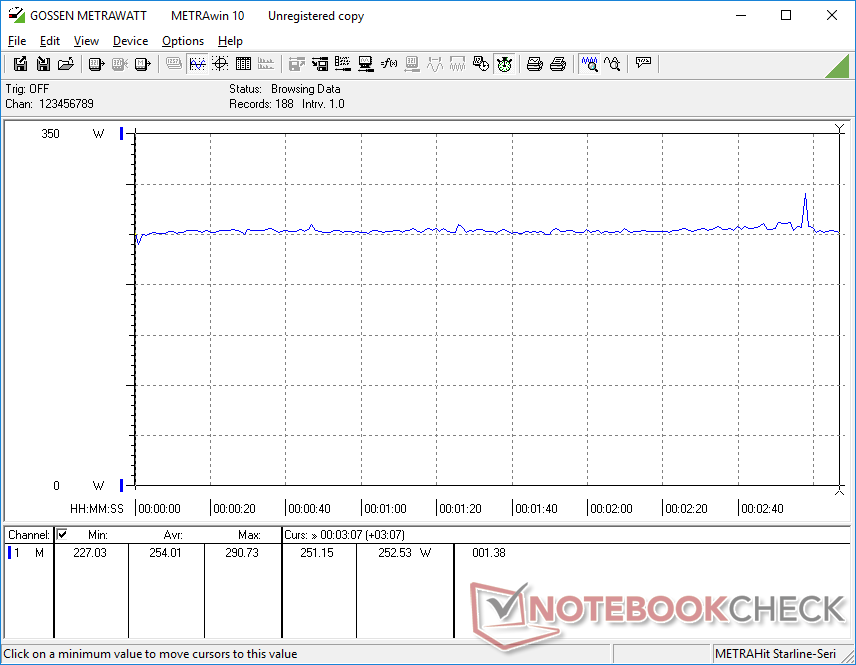
Körning av Witcher 3 förbrukar 54 procent mer ström än på MSI GS77 trots att båda är utrustade med 12:e generationens Core-H CPU:er och samma GeForce RTX 3080 Ti GPU. I gengäld kan Alienware-systemet erbjuda upp till 15 procent och 25 procent snabbare CPU-prestanda respektive grafikprestanda än det konkurrerande MSI.
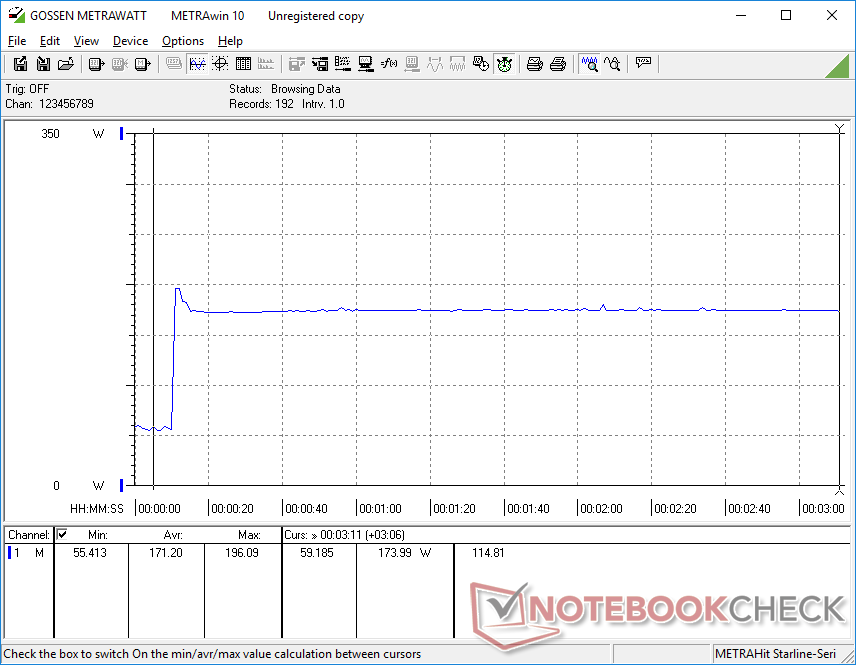
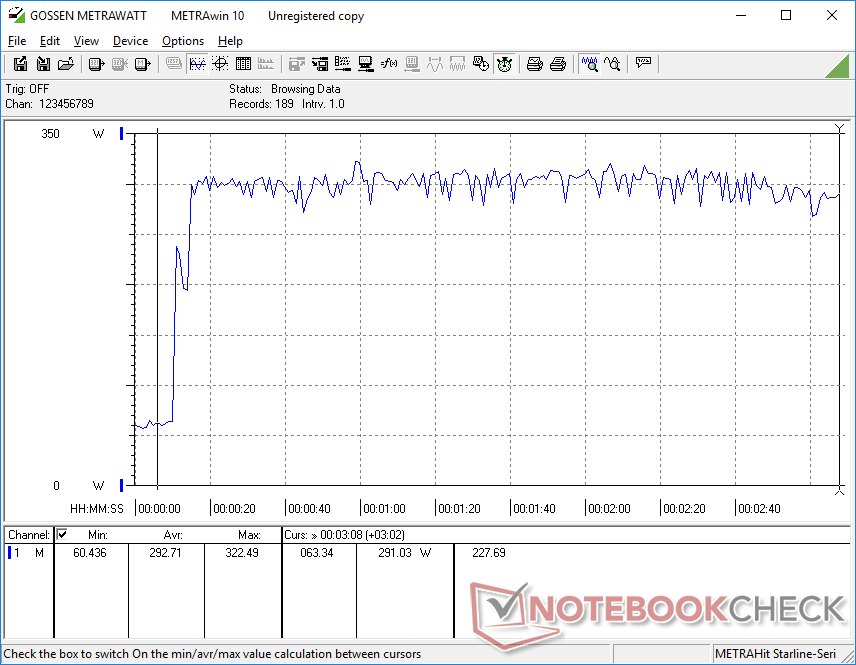
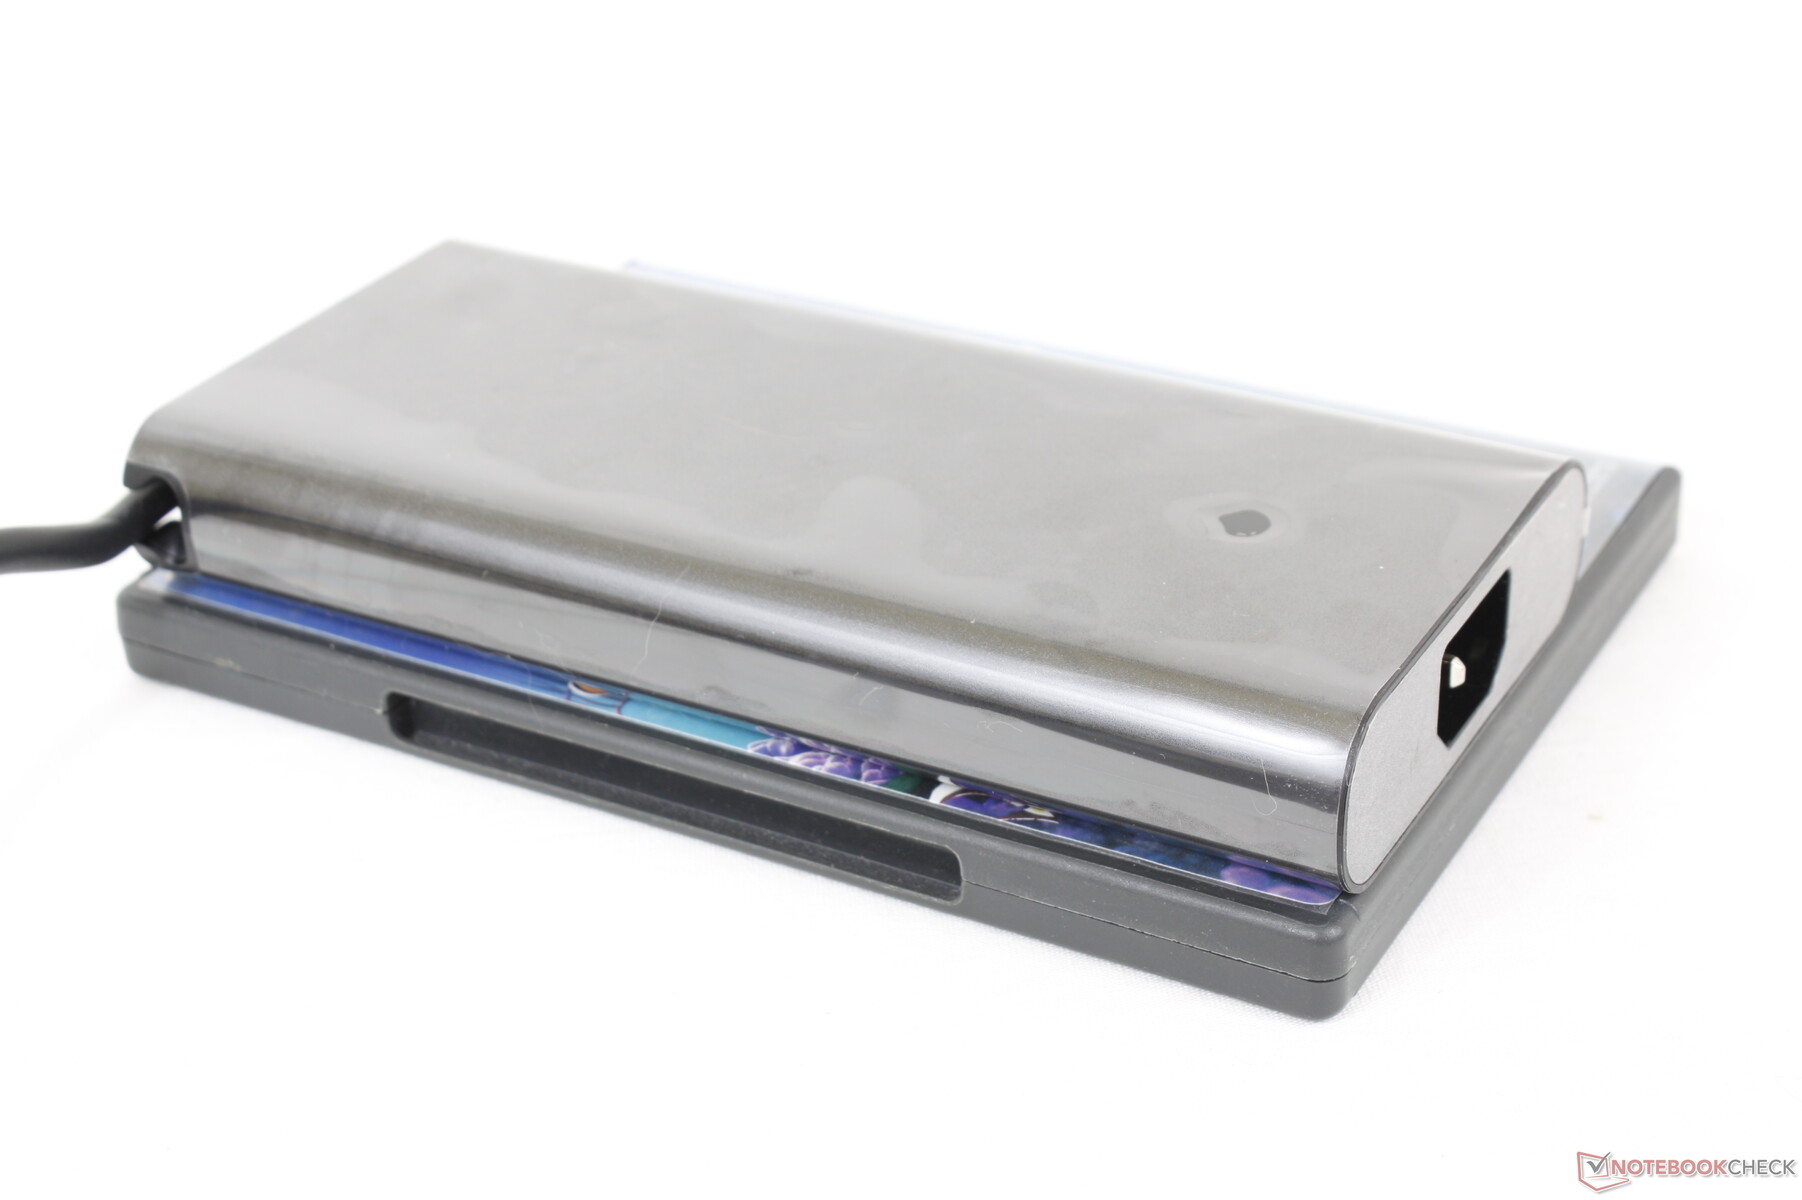
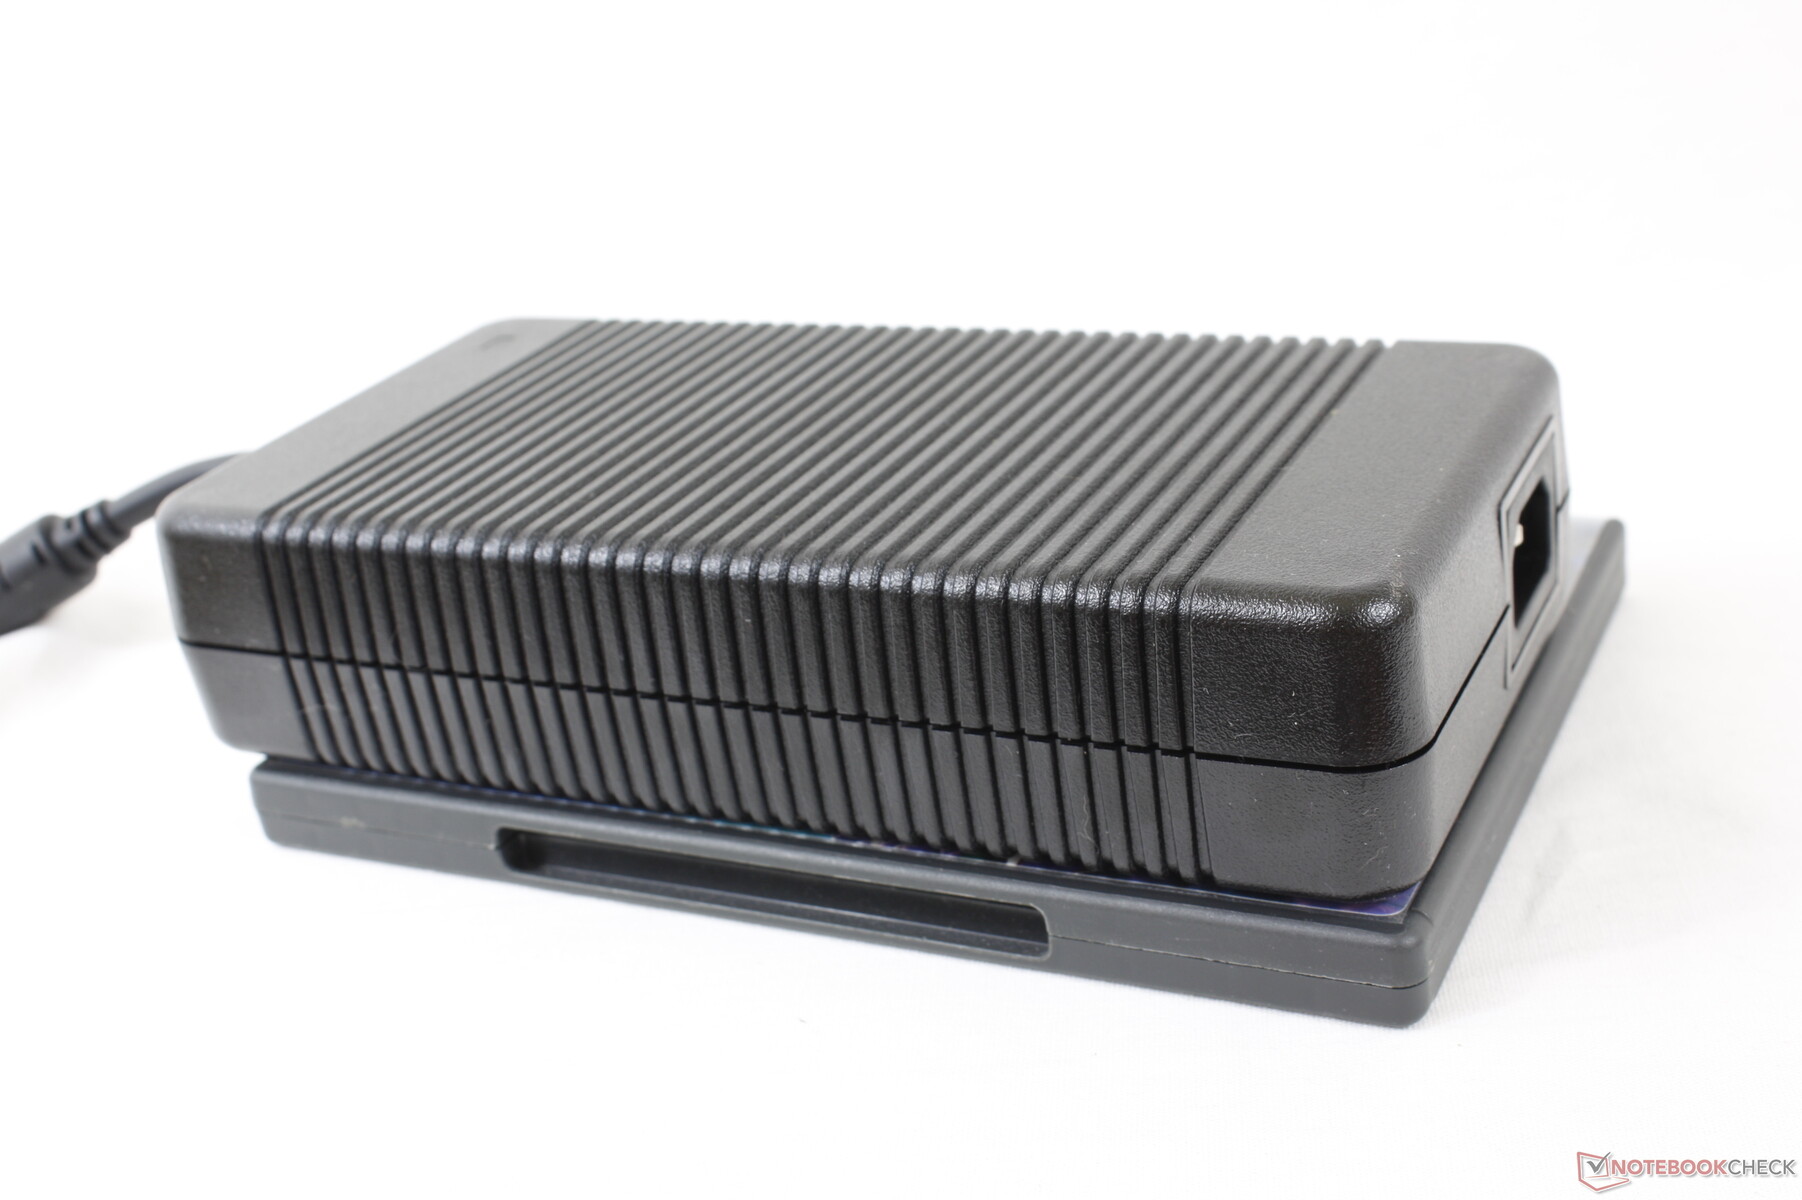
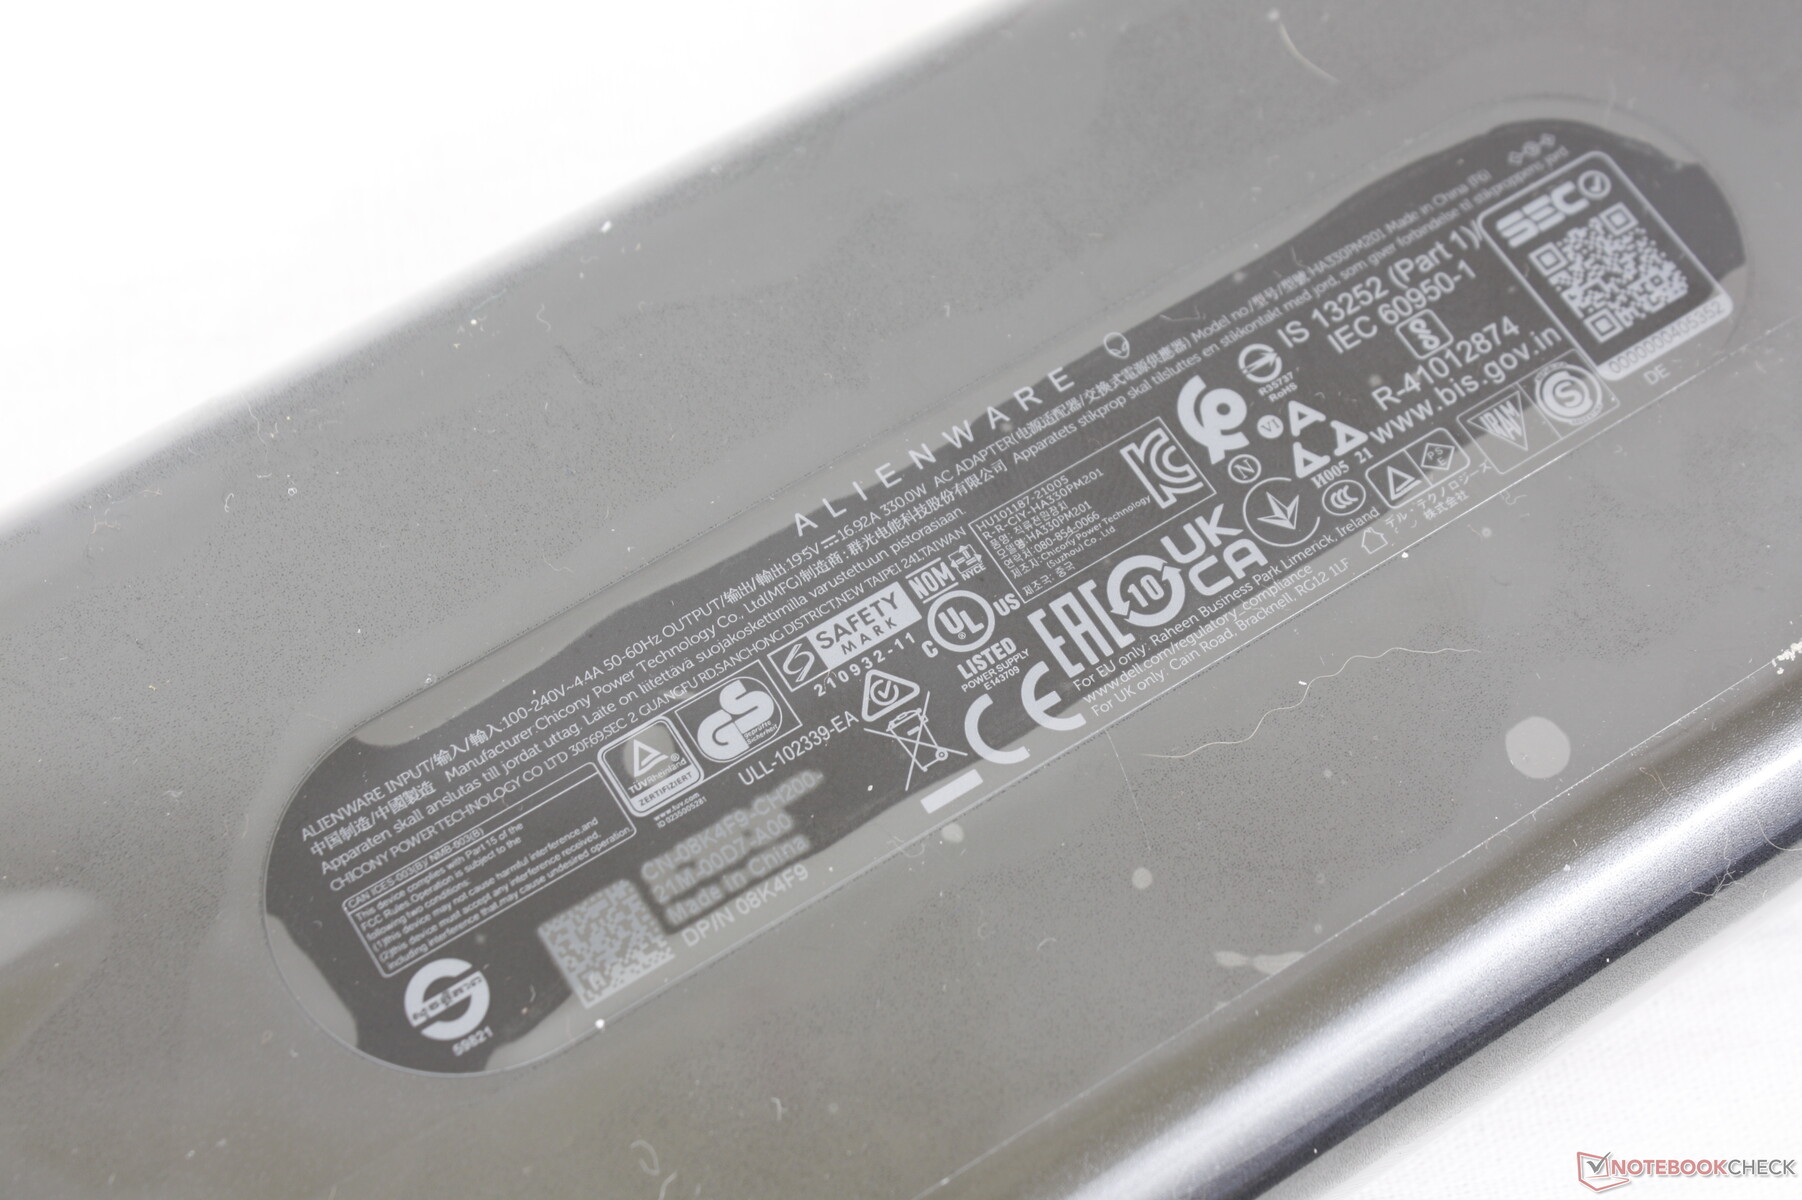
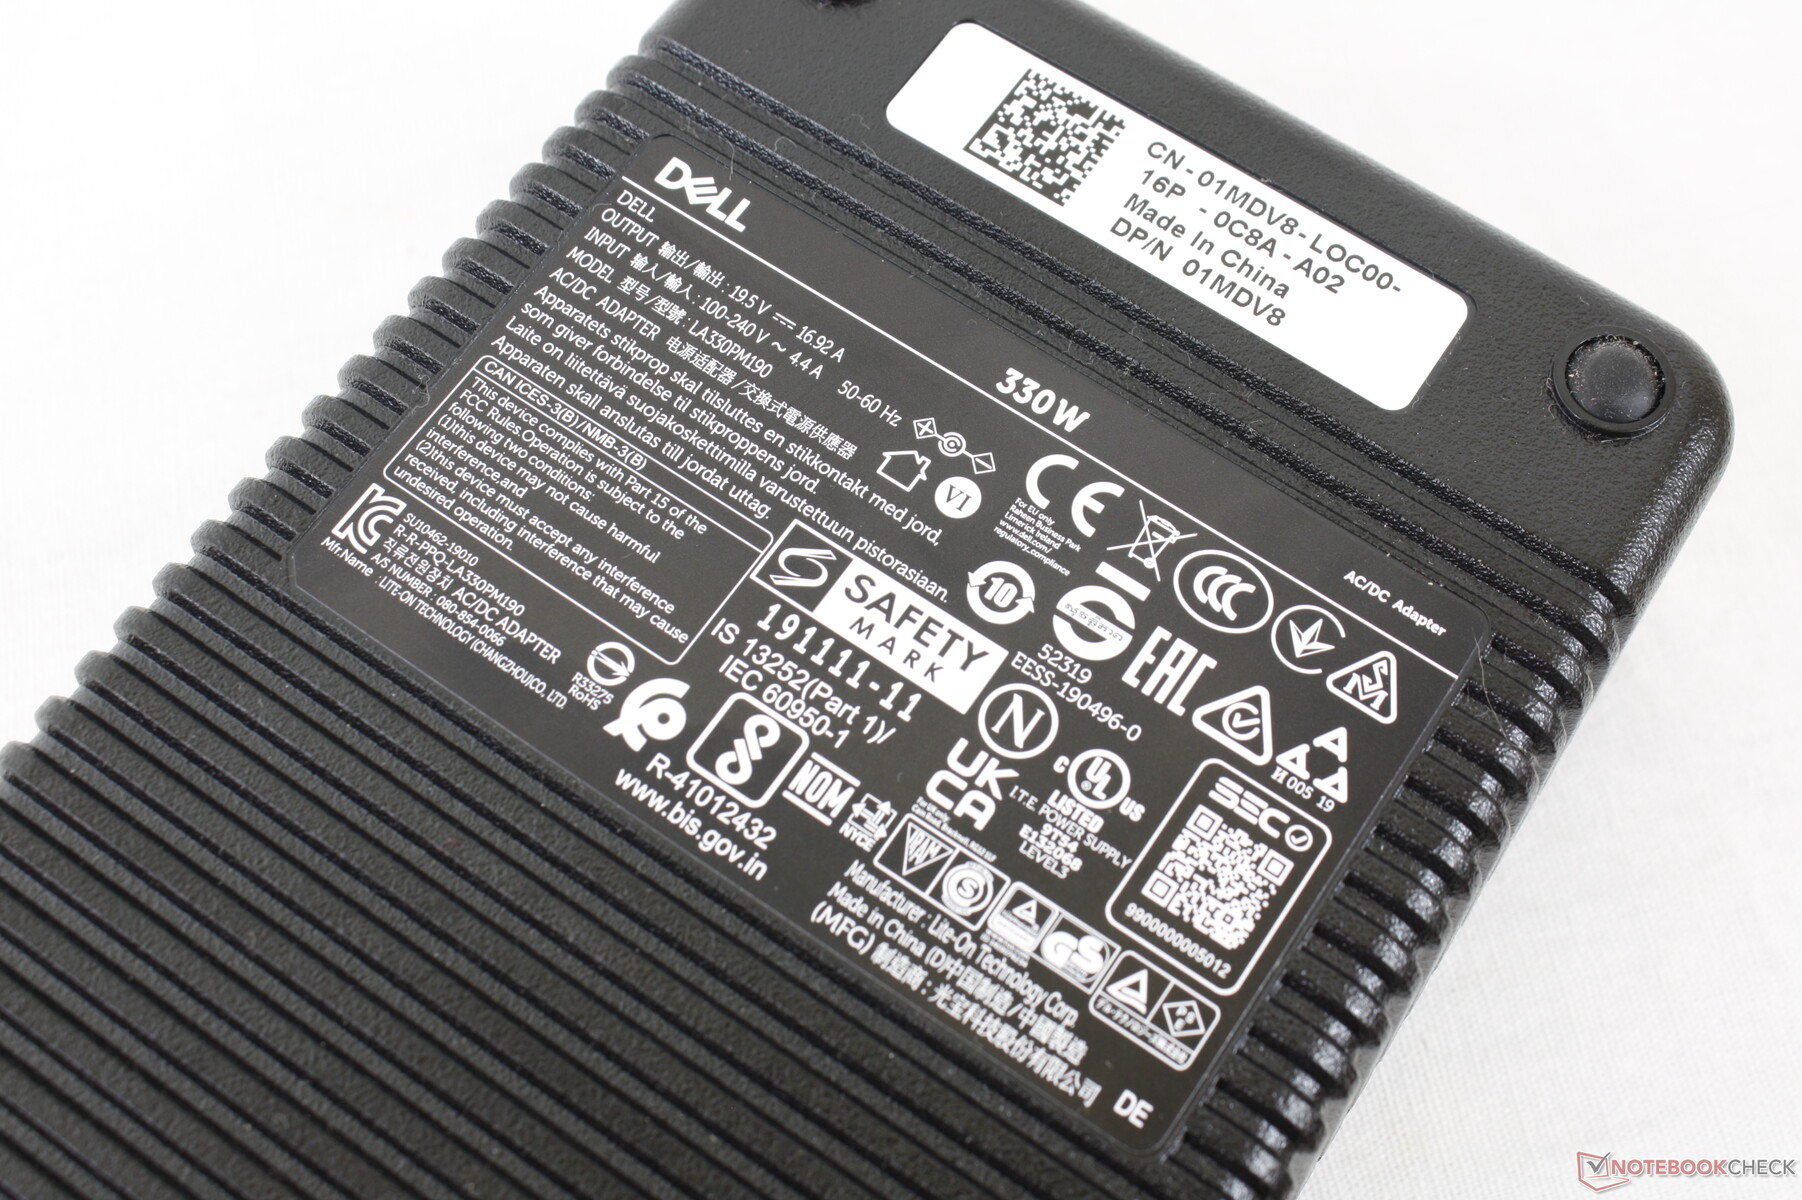
Vi kan registrera en maximal förbrukning på 323 W från AC-adaptern på 330 W när både CPU och GPU är 100 procent utnyttjade. Växelströmsadaptern är mindre den här gången jämfört med den som levererades med förra årets x17 R1 (~18,3 x 8,7 x 2,5 cm jämfört med ~20 x 9,9 x 4,3 cm). Observera att de flesta andra bärbara speldatorer levereras med mindre AC-adaptrar på långt under 280 W. Mindre Alienware x17 R2-konfigurationer kan komma med ännu mindre AC-adaptrar.
| Av/Standby | |
| Låg belastning | |
| Hög belastning |
|
Förklaring:
min: | |
| Alienware x17 R2 P48E i9-12900HK, GeForce RTX 3080 Ti Laptop GPU, 2x Samsung PM9A1 1TB (RAID 0), IPS, 1920x1080, 17.3" | Alienware x17 RTX 3080 P48E i7-11800H, GeForce RTX 3080 Laptop GPU, 2x WDC PC SN730 SDBPNTY-1T00 (RAID 0), IPS, 3840x2160, 17.3" | Asus ROG Zephyrus S17 GX703HSD i9-11900H, GeForce RTX 3080 Laptop GPU, Samsung PM9A1 MZVL22T0HBLB, IPS, 2560x1440, 17.3" | MSI Stealth GS77 12UHS-083US i7-12700H, GeForce RTX 3080 Ti Laptop GPU, Micron 3400 1TB MTFDKBA1T0TFH, IPS, 2560x1440, 17.3" | MSI GT76 Titan DT 10SGS i9-10900K, GeForce RTX 2080 Super Mobile, 2x WDC PC SN730 SDBPNTY-1T00 (RAID 0), IPS, 3840x2160, 17.3" | Gigabyte A7 X1 R9 5900HX, GeForce RTX 3070 Laptop GPU, ESR512GTLCG-EAC-4, IPS, 1920x1080, 17.3" | |
|---|---|---|---|---|---|---|
| Power Consumption | 22% | 22% | 30% | -15% | 38% | |
| Idle Minimum * (Watt) | 24.1 | 10.2 58% | 21.7 10% | 20 17% | 25.9 -7% | 12 50% |
| Idle Average * (Watt) | 28.5 | 21.2 26% | 27 5% | 21.4 25% | 38 -33% | 14 51% |
| Idle Maximum * (Watt) | 60 | 48.4 19% | 33 45% | 27 55% | 53.2 11% | 19 68% |
| Load Average * (Watt) | 128.7 | 118.7 8% | 108 16% | 100.5 22% | 123.8 4% | 118 8% |
| Witcher 3 ultra * (Watt) | 254 | 249 2% | 195 23% | 165 35% | 312.5 -23% | 205 19% |
| Load Maximum * (Watt) | 323 | 262 19% | 210 35% | 247.1 23% | 459.8 -42% | 229 29% |
* ... mindre är bättre
Energiförbrukning: Witcher 3 / Stress-test
Energiförbrukning med extern skärm
Batteritid
Batteritiderna är några av de sämsta vi har sett på en bärbar dator för spel. Till och med när den går på tomgång på skrivbordet med den lägsta ljusstyrkan, den lägsta strömprofilen och Optimus-grafiken aktiv räcker den bara i knappt 4 timmar. Förvänta dig bara 2 timmars surfning på WLAN i den verkliga världen jämfört med över 7 timmar från Asus ROG Zephyrus S17.
Laddning från tom till full kapacitet tar cirka 100 minuter. Användare kan även ladda med USB-C-adaptrar från tredje part.
| Alienware x17 R2 P48E i9-12900HK, GeForce RTX 3080 Ti Laptop GPU, 87 Wh | Alienware x17 RTX 3080 P48E i7-11800H, GeForce RTX 3080 Laptop GPU, 87 Wh | Asus ROG Zephyrus S17 GX703HSD i9-11900H, GeForce RTX 3080 Laptop GPU, 90 Wh | MSI Stealth GS77 12UHS-083US i7-12700H, GeForce RTX 3080 Ti Laptop GPU, 99 Wh | MSI GT76 Titan DT 10SGS i9-10900K, GeForce RTX 2080 Super Mobile, 90 Wh | Gigabyte A7 X1 R9 5900HX, GeForce RTX 3070 Laptop GPU, 48.96 Wh | |
|---|---|---|---|---|---|---|
| Batteridrifttid | 91% | 257% | 154% | 20% | 93% | |
| Reader / Idle (h) | 3.9 | 7 79% | 10.8 177% | |||
| WiFi v1.3 (h) | 2 | 5.9 195% | 7.5 275% | 6.2 210% | 2.4 20% | 4.7 135% |
| Load (h) | 0.8 | 0.8 0% | 2.7 238% | 1.4 75% | 1.2 50% | |
| H.264 (h) | 7.2 | |||||
| Witcher 3 ultra (h) | 1 |
För
Emot
Slutsats - Högre TGP innebär högre prestanda
När Nvidia tillkännagav GeForce RTX 3080 Ti för bärbara datorer blev vi besvikna över att vissa modeller skulle sikta på mycket låga TGP-värden på endast cirka 100 W. Ett sådant tillvägagångssätt skulle visserligen möjliggöra supertunna konstruktioner, men det innebar också att prestandan offrades på vägen, eftersom GPU:n i praktiken skulle vara underklockad. Alienware x17 R2 inser denna kompromiss och siktar istället på en betydligt högre TGP på 175 W för en prestandaökning på cirka 30 procent jämfört med bärbara datorer som körs på ~100 W GeForce RTX 3080 Ti som t.ex Razer Blade 15 eller Gigabyte Aero YE5. Liknande resultat kan också hittas genom processorn. Denna enda aspekt av Alienware är kanske den största särskiljande faktorn mellan den och andra ultratunna bärbara speldatorer.
Naturligtvis har denna strategi med "prestanda till varje pris" nackdelar. Strömförbrukningen är särskilt hög och batteritiden blir lidande på grund av detta, även på de lägsta prestandainställningarna. Systemet är också märkbart tyngre respektive större än andra ultratunna bärbara gamingdatorer även om chassit fortfarande anses vara ultratunt. Portplaceringen kräver också en viss tillvänjning.
om du vill maximera prestandan utan att nöja dig med enorma bärbara speldatorer som t.ex MSI GT-serien, Asus ROG Chimera-serien, eller Alienware Area-51m serien, då är Alienware x17 R2 och dess överraskande tillfredsställande mekaniska tangentbord värt att överväga.
Pris och tillgänglighet
Alienware x17 R2 skickas nu till på Amazon i flera SKU:er, även om ingen av dem är vår exakta konfiguration. Alternativt kan användare köpa direkt från Dell.
Alienware x17 R2 P48E
- 05/11/2022 v7 (old)
Allen Ngo
Price comparison

