Test: MSI GF75 Thin 10SDR - För budgetgamers (Sammanfattning)
Gradering | Datum | Modell | Vikt | Höjd | Storlek | Upplösning | Pris |
|---|---|---|---|---|---|---|---|
| 79.8 % v7 (old) | 10/2020 | MSI GF75 Thin 10SDR i7-10750H, GeForce GTX 1660 Ti Mobile | 2.2 kg | 23 mm | 17.30" | 1920x1080 | |
| 78.5 % v7 (old) | 12/2021 | MSI GF75 Thin 10SCXR i5-10300H, GeForce GTX 1650 Mobile | 2.2 kg | 23.1 mm | 17.30" | 1920x1080 | |
| 82.9 % v7 (old) | 05/2020 | Asus TUF A17 FA706IU-AS76 R7 4800H, GeForce GTX 1660 Ti Mobile | 2.6 kg | 26 mm | 17.30" | 1920x1080 | |
| 80.6 % v7 (old) | 06/2020 | Acer Nitro 5 AN517-52-77DS i7-10750H, GeForce RTX 2060 Mobile | 2.2 kg | 24.9 mm | 17.30" | 1920x1080 | |
| 85.1 % v7 (old) | MSI GE75 Raider 10SE-008US i7-10750H, GeForce RTX 2060 Mobile | 2.6 kg | 27.5 mm | 17.30" | 1920x1080 |
| Networking | |
| iperf3 transmit AX12 | |
| MSI GE75 Raider 10SE-008US | |
| Genomsnitt Intel Wi-Fi 6 AX201 (49.8 - 1775, n=324) | |
| MSI GF75 Thin 10SDR | |
| MSI GF75 Thin 10SCXR | |
| Acer Nitro 5 AN517-52-77DS | |
| Asus TUF A17 FA706IU-AS76 | |
| iperf3 receive AX12 | |
| MSI GE75 Raider 10SE-008US | |
| MSI GF75 Thin 10SCXR | |
| Genomsnitt Intel Wi-Fi 6 AX201 (136 - 1743, n=324) | |
| MSI GF75 Thin 10SDR | |
| Acer Nitro 5 AN517-52-77DS | |
| Asus TUF A17 FA706IU-AS76 | |


| |||||||||||||||||||||||||
Distribution av ljusstyrkan: 92 %
Mitt på batteriet: 252 cd/m²
Kontrast: 1096:1 (Svärta: 0.23 cd/m²)
ΔE ColorChecker Calman: 4.24 | ∀{0.5-29.43 Ø4.71}
calibrated: 3.64
ΔE Greyscale Calman: 2.8 | ∀{0.09-98 Ø4.96}
59% sRGB (Argyll 1.6.3 3D)
41% AdobeRGB 1998 (Argyll 1.6.3 3D)
41.31% AdobeRGB 1998 (Argyll 3D)
59.9% sRGB (Argyll 3D)
39.98% Display P3 (Argyll 3D)
Gamma: 2.196
CCT: 7027 K
| MSI GF75 Thin 10SDR B173HAN04.9 (AUO978F), IPS, 1920x1080, 17.3" | MSI GF75 Thin 10SCXR AU Optronics B173HAN04.7, IPS, 1920x1080, 17.3" | Asus TUF A17 FA706IU-AS76 BOE NV173FHM-NX1, IPS, 1920x1080, 17.3" | Acer Nitro 5 AN517-52-77DS AU Optronics B173HAN04.7, IPS, 1920x1080, 17.3" | MSI GE75 Raider 10SE-008US Chi Mei N173HCE-G33, IPS, 1920x1080, 17.3" | |
|---|---|---|---|---|---|
| Display | -2% | 1% | -1% | 64% | |
| Display P3 Coverage (%) | 39.98 | 39.46 -1% | 40.55 1% | 39.47 -1% | 65.6 64% |
| sRGB Coverage (%) | 59.9 | 58.4 -3% | 59.7 0% | 58.9 -2% | 98.1 64% |
| AdobeRGB 1998 Coverage (%) | 41.31 | 40.77 -1% | 41.89 1% | 40.77 -1% | 67.8 64% |
| Response Times | 8% | 36% | 8% | 75% | |
| Response Time Grey 50% / Grey 80% * (ms) | 38.4 ? | 34 ? 11% | 22.4 ? 42% | 35 ? 9% | 6.8 ? 82% |
| Response Time Black / White * (ms) | 27.6 ? | 26.4 ? 4% | 19.2 ? 30% | 26 ? 6% | 8.8 ? 68% |
| PWM Frequency (Hz) | 25000 ? | ||||
| Screen | -13% | -3% | -19% | 31% | |
| Brightness middle (cd/m²) | 252 | 251.2 0% | 264.8 5% | 263 4% | 337.9 34% |
| Brightness (cd/m²) | 253 | 242 -4% | 253 0% | 246 -3% | 305 21% |
| Brightness Distribution (%) | 92 | 92 0% | 90 -2% | 85 -8% | 81 -12% |
| Black Level * (cd/m²) | 0.23 | 0.34 -48% | 0.31 -35% | 0.47 -104% | 0.29 -26% |
| Contrast (:1) | 1096 | 739 -33% | 854 -22% | 560 -49% | 1165 6% |
| Colorchecker dE 2000 * | 4.24 | 4.5 -6% | 4.73 -12% | 5.07 -20% | 2.18 49% |
| Colorchecker dE 2000 max. * | 21.4 | 20 7% | 18.89 12% | 20.5 4% | 3.9 82% |
| Colorchecker dE 2000 calibrated * | 3.64 | 3.91 -7% | 4.64 -27% | 4.9 -35% | 0.69 81% |
| Greyscale dE 2000 * | 2.8 | 4 -43% | 1.4 50% | 2.55 9% | 3.1 -11% |
| Gamma | 2.196 100% | 2.25 98% | 2.16 102% | 2.37 93% | 2.07 106% |
| CCT | 7027 93% | 5882 111% | 6641 98% | 6446 101% | 6882 94% |
| Color Space (Percent of AdobeRGB 1998) (%) | 41 | 37.3 -9% | 38.4 -6% | 37 -10% | 62 51% |
| Color Space (Percent of sRGB) (%) | 59 | 58.1 -2% | 59.3 1% | 59 0% | 98.2 66% |
| Totalt genomsnitt (program/inställningar) | -2% /
-8% | 11% /
2% | -4% /
-13% | 57% /
43% |
* ... mindre är bättre
Visa svarstider
| ↔ Svarstid svart till vitt | ||
|---|---|---|
| 27.6 ms ... stiga ↗ och falla ↘ kombinerat | ↗ 14.8 ms stiga | 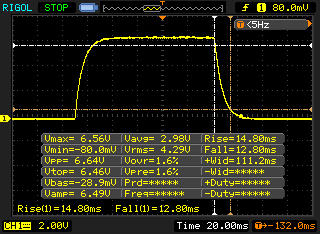 |
| ↘ 12.8 ms hösten | ||
| Skärmen visar relativt långsamma svarsfrekvenser i våra tester och kan vara för långsam för spelare. I jämförelse sträcker sig alla testade enheter från 0.1 (minst) till 240 (maximalt) ms. » 70 % av alla enheter är bättre. Detta innebär att den uppmätta svarstiden är sämre än genomsnittet av alla testade enheter (19.8 ms). | ||
| ↔ Svarstid 50 % grått till 80 % grått | ||
| 38.4 ms ... stiga ↗ och falla ↘ kombinerat | ↗ 18 ms stiga | 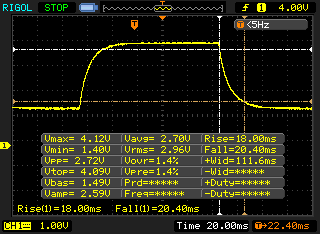 |
| ↘ 20.4 ms hösten | ||
| Skärmen visar långsamma svarsfrekvenser i våra tester och kommer att vara otillfredsställande för spelare. I jämförelse sträcker sig alla testade enheter från 0.165 (minst) till 636 (maximalt) ms. » 58 % av alla enheter är bättre. Detta innebär att den uppmätta svarstiden är sämre än genomsnittet av alla testade enheter (31 ms). | ||
Skärmflimmer / PWM (Puls-Width Modulation)
| Skärmflimmer / PWM upptäcktes inte | 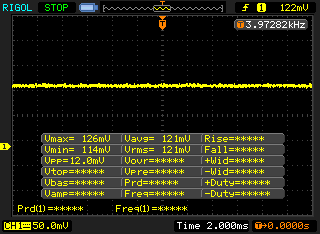 | ||
Som jämförelse: 52 % av alla testade enheter använder inte PWM för att dämpa skärmen. Om PWM upptäcktes mättes ett medelvärde av 7754 (minst: 5 - maximum: 343500) Hz. | |||
| Cinebench R15 | |
| CPU Single 64Bit | |
| Genomsnitt av klass Gaming (188.8 - 350, n=106, senaste 2 åren) | |
| MSI GF75 Thin 10SDR | |
| Genomsnitt Intel Core i7-10750H (184 - 213, n=45) | |
| Acer Nitro 5 AN517-52-77DS | |
| Asus TUF A17 FA706IU-AS76 | |
| MSI GE75 Raider 10SE-008US | |
| MSI GF75 Thin 10SCXR | |
| CPU Multi 64Bit | |
| Genomsnitt av klass Gaming (1578 - 6330, n=105, senaste 2 åren) | |
| Asus TUF A17 FA706IU-AS76 | |
| MSI GE75 Raider 10SE-008US | |
| Acer Nitro 5 AN517-52-77DS | |
| Genomsnitt Intel Core i7-10750H (804 - 1418, n=50) | |
| MSI GF75 Thin 10SDR | |
| MSI GF75 Thin 10SCXR | |
| Blender - v2.79 BMW27 CPU | |
| MSI GF75 Thin 10SCXR | |
| Genomsnitt Intel Core i7-10750H (322 - 587, n=43) | |
| MSI GF75 Thin 10SDR | |
| Acer Nitro 5 AN517-52-77DS | |
| MSI GE75 Raider 10SE-008US | |
| Asus TUF A17 FA706IU-AS76 | |
| Genomsnitt av klass Gaming (79 - 330, n=104, senaste 2 åren) | |
| Cinebench R20 | |
| CPU (Single Core) | |
| Genomsnitt av klass Gaming (442 - 913, n=106, senaste 2 åren) | |
| Acer Nitro 5 AN517-52-77DS | |
| Asus TUF A17 FA706IU-AS76 | |
| Genomsnitt Intel Core i7-10750H (431 - 504, n=43) | |
| MSI GF75 Thin 10SDR | |
| MSI GE75 Raider 10SE-008US | |
| MSI GF75 Thin 10SCXR | |
| CPU (Multi Core) | |
| Genomsnitt av klass Gaming (4029 - 16433, n=106, senaste 2 åren) | |
| Asus TUF A17 FA706IU-AS76 | |
| MSI GE75 Raider 10SE-008US | |
| Acer Nitro 5 AN517-52-77DS | |
| Genomsnitt Intel Core i7-10750H (1749 - 3325, n=43) | |
| MSI GF75 Thin 10SDR | |
| MSI GF75 Thin 10SCXR | |
| Geekbench 5.5 | |
| Single-Core | |
| Genomsnitt av klass Gaming (986 - 2474, n=105, senaste 2 åren) | |
| MSI GF75 Thin 10SDR | |
| Genomsnitt Intel Core i7-10750H (1114 - 1333, n=43) | |
| Acer Nitro 5 AN517-52-77DS | |
| MSI GE75 Raider 10SE-008US | |
| Asus TUF A17 FA706IU-AS76 | |
| MSI GF75 Thin 10SCXR | |
| Multi-Core | |
| Genomsnitt av klass Gaming (6460 - 28263, n=105, senaste 2 åren) | |
| Asus TUF A17 FA706IU-AS76 | |
| MSI GF75 Thin 10SDR | |
| Acer Nitro 5 AN517-52-77DS | |
| MSI GE75 Raider 10SE-008US | |
| Genomsnitt Intel Core i7-10750H (4443 - 6674, n=43) | |
| MSI GF75 Thin 10SCXR | |
| HWBOT x265 Benchmark v2.2 - 4k Preset | |
| Genomsnitt av klass Gaming (11.5 - 44.4, n=105, senaste 2 åren) | |
| Asus TUF A17 FA706IU-AS76 | |
| MSI GE75 Raider 10SE-008US | |
| Genomsnitt Intel Core i7-10750H (5.54 - 11.6, n=43) | |
| MSI GF75 Thin 10SDR | |
| Acer Nitro 5 AN517-52-77DS | |
| MSI GF75 Thin 10SCXR | |
| LibreOffice - 20 Documents To PDF | |
| Asus TUF A17 FA706IU-AS76 | |
| MSI GF75 Thin 10SCXR | |
| MSI GE75 Raider 10SE-008US | |
| MSI GF75 Thin 10SDR | |
| Genomsnitt Intel Core i7-10750H (43.1 - 99.2, n=43) | |
| Acer Nitro 5 AN517-52-77DS | |
| Genomsnitt av klass Gaming (33.2 - 88.8, n=105, senaste 2 åren) | |
| R Benchmark 2.5 - Overall mean | |
| MSI GF75 Thin 10SCXR | |
| Acer Nitro 5 AN517-52-77DS | |
| MSI GE75 Raider 10SE-008US | |
| MSI GF75 Thin 10SDR | |
| Genomsnitt Intel Core i7-10750H (0.578 - 0.708, n=42) | |
| Asus TUF A17 FA706IU-AS76 | |
| Genomsnitt av klass Gaming (0.3439 - 0.759, n=106, senaste 2 åren) | |
* ... mindre är bättre
| DPC Latencies / LatencyMon - interrupt to process latency (max), Web, Youtube, Prime95 | |
| Asus TUF A17 FA706IU-AS76 | |
| MSI GF75 Thin 10SCXR | |
| MSI GE75 Raider 10SE-008US | |
| MSI GF75 Thin 10SDR | |
| Acer Nitro 5 AN517-52-77DS | |
* ... mindre är bättre
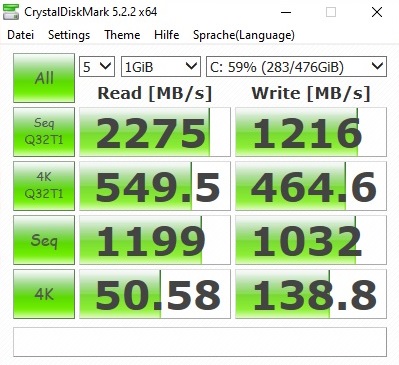
| MSI GF75 Thin 10SDR Samsung PM991 MZVLQ512HALU | MSI GF75 Thin 10SCXR WDC PC SN530 SDBPNPZ-512G | Asus TUF A17 FA706IU-AS76 Intel SSD 660p 1TB SSDPEKNW010T8 | Acer Nitro 5 AN517-52-77DS WDC PC SN530 SDBPNPZ-1T00 | MSI GE75 Raider 10SE-008US Samsung SSD PM981 MZVLB512HAJQ | |
|---|---|---|---|---|---|
| CrystalDiskMark 5.2 / 6 | 9% | 23% | 16% | 36% | |
| Write 4K (MB/s) | 138.8 | 140.7 1% | 189.7 37% | 140 1% | 139.2 0% |
| Read 4K (MB/s) | 50.6 | 43.18 -15% | 62.3 23% | 49.04 -3% | 53 5% |
| Write Seq (MB/s) | 1032 | 1829 77% | 1681 63% | 1963 90% | 1950 89% |
| Read Seq (MB/s) | 1199 | 1095 -9% | 1608 34% | 1455 21% | 2328 94% |
| Write 4K Q32T1 (MB/s) | 464.6 | 431.7 -7% | 468.6 1% | 398.2 -14% | 408.9 -12% |
| Read 4K Q32T1 (MB/s) | 550 | 527 -4% | 541 -2% | 461.9 -16% | 551 0% |
| Write Seq Q32T1 (MB/s) | 1216 | 1831 51% | 1770 46% | 1969 62% | 1938 59% |
| Read Seq Q32T1 (MB/s) | 2275 | 1708 -25% | 1898 -17% | 1927 -15% | 3467 52% |

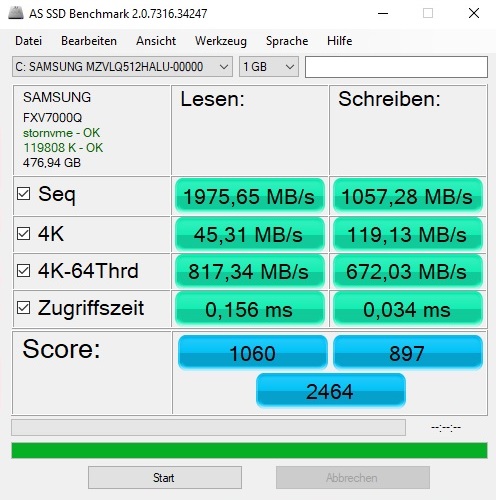
Kontinuerlig inläsning: DiskSpd Read Loop, Queue Depth 8
| 3DMark 11 - 1280x720 Performance GPU | |
| Genomsnitt av klass Gaming (21841 - 80022, n=104, senaste 2 åren) | |
| MSI GE75 Raider 10SE-008US | |
| Asus TUF A17 FA706IU-AS76 | |
| Acer Nitro 5 AN517-52-77DS | |
| Genomsnitt NVIDIA GeForce GTX 1660 Ti Mobile (18610 - 22670, n=24) | |
| MSI GF75 Thin 10SDR | |
| MSI GF75 Thin 10SCXR | |
| 3DMark | |
| 1920x1080 Fire Strike Graphics | |
| Genomsnitt av klass Gaming (12242 - 62849, n=115, senaste 2 åren) | |
| MSI GE75 Raider 10SE-008US | |
| Acer Nitro 5 AN517-52-77DS | |
| Asus TUF A17 FA706IU-AS76 | |
| MSI GF75 Thin 10SDR | |
| Genomsnitt NVIDIA GeForce GTX 1660 Ti Mobile (14186 - 16488, n=24) | |
| MSI GF75 Thin 10SCXR | |
| 2560x1440 Time Spy Graphics | |
| Genomsnitt av klass Gaming (5012 - 26212, n=115, senaste 2 åren) | |
| MSI GE75 Raider 10SE-008US | |
| Asus TUF A17 FA706IU-AS76 | |
| Acer Nitro 5 AN517-52-77DS | |
| Genomsnitt NVIDIA GeForce GTX 1660 Ti Mobile (5335 - 6123, n=22) | |
| MSI GF75 Thin 10SDR | |
| MSI GF75 Thin 10SCXR | |
| 2560x1440 Port Royal Graphics | |
| Genomsnitt av klass Gaming (4395 - 17286, n=71, senaste 2 åren) | |
| MSI GE75 Raider 10SE-008US | |
| Acer Nitro 5 AN517-52-77DS | |
| MSI GF75 Thin 10SDR | |
| Genomsnitt NVIDIA GeForce GTX 1660 Ti Mobile (1097 - 1540, n=7) | |
| 3DMark 11 Performance | 17704 poäng | |
| 3DMark Fire Strike Score | 13396 poäng | |
| 3DMark Time Spy Score | 5677 poäng | |
Hjälp | ||
| The Witcher 3 | |
| 1920x1080 High Graphics & Postprocessing (Nvidia HairWorks Off) | |
| Genomsnitt av klass Gaming (341 - 404, n=2, senaste 2 åren) | |
| MSI GE75 Raider 10SE-008US | |
| Acer Nitro 5 AN517-52-77DS | |
| MSI GF75 Thin 10SDR | |
| Genomsnitt NVIDIA GeForce GTX 1660 Ti Mobile (93 - 120.4, n=17) | |
| Asus TUF A17 FA706IU-AS76 | |
| MSI GF75 Thin 10SCXR | |
| 1920x1080 Ultra Graphics & Postprocessing (HBAO+) | |
| Genomsnitt av klass Gaming (104.7 - 240, n=7, senaste 2 åren) | |
| MSI GE75 Raider 10SE-008US | |
| Acer Nitro 5 AN517-52-77DS | |
| MSI GF75 Thin 10SDR | |
| Genomsnitt NVIDIA GeForce GTX 1660 Ti Mobile (51.6 - 65.1, n=21) | |
| Asus TUF A17 FA706IU-AS76 | |
| MSI GF75 Thin 10SCXR | |
| låg | med. | hög | ultra | |
|---|---|---|---|---|
| GTA V (2015) | 178 | 170 | 139 | 73.8 |
| The Witcher 3 (2015) | 106 | 56.6 | ||
| Dota 2 Reborn (2015) | 146 | 133 | 124 | 116 |
| X-Plane 11.11 (2018) | 108 | 92.1 | 78.4 | |
| Shadow of the Tomb Raider (2018) | 83 | 73 | ||
| Battlefield V (2018) | 104 | 95.7 | ||
| Hunt Showdown (2020) | 69.1 | |||
| Gears Tactics (2020) | 90.2 | 63.6 | ||
| F1 2020 (2020) | 122 | 87 | ||
| Death Stranding (2020) | 88.3 | 85.5 | ||
| Horizon Zero Dawn (2020) | 75 | 58 | ||
| Flight Simulator 2020 (2020) | 39.4 | 26.8 | ||
| Serious Sam 4 (2020) | 67.1 | 52.3 | ||
| Mafia Definitive Edition (2020) | 66.8 | |||
| Star Wars Squadrons (2020) | 159 | 156 |
Ljudnivå
| Låg belastning |
| 35 / 37 / 39 dB(A) |
| Hög belastning |
| 45 / 46 dB(A) |
 | ||
30 dB tyst 40 dB(A) hörbar 50 dB(A) högt ljud |
||
min: | ||
| MSI GF75 Thin 10SDR i7-10750H, GeForce GTX 1660 Ti Mobile | MSI GF75 Thin 10SCXR i5-10300H, GeForce GTX 1650 Mobile | Asus TUF A17 FA706IU-AS76 R7 4800H, GeForce GTX 1660 Ti Mobile | Acer Nitro 5 AN517-52-77DS i7-10750H, GeForce RTX 2060 Mobile | MSI GE75 Raider 10SE-008US i7-10750H, GeForce RTX 2060 Mobile | Genomsnitt av klass Gaming | |
|---|---|---|---|---|---|---|
| Noise | 6% | 2% | 6% | 2% | 11% | |
| av / miljö * (dB) | 25 | 28.4 -14% | 28.7 -15% | 30.2 -21% | 28.4 -14% | 24.1 ? 4% |
| Idle Minimum * (dB) | 35 | 33 6% | 28.7 18% | 30.2 14% | 30.2 14% | 26 ? 26% |
| Idle Average * (dB) | 37 | 33 11% | 30.5 18% | 30.2 18% | 30.2 18% | 27.4 ? 26% |
| Idle Maximum * (dB) | 39 | 33.1 15% | 32.5 17% | 30.2 23% | 32 18% | 30.1 ? 23% |
| Load Average * (dB) | 45 | 37.7 16% | 42.5 6% | 41.5 8% | 33.2 26% | 43.6 ? 3% |
| Witcher 3 ultra * (dB) | 44 | 39.2 11% | 50.1 -14% | 44.5 -1% | 55 -25% | |
| Load Maximum * (dB) | 46 | 46 -0% | 53.4 -16% | 44.6 3% | 55 -20% | 54.2 ? -18% |
* ... mindre är bättre
(-) Den maximala temperaturen på ovansidan är 51 °C / 124 F, jämfört med genomsnittet av 40.4 °C / 105 F , allt från 21.2 till 68.8 °C för klassen Gaming.
(-) Botten värms upp till maximalt 53 °C / 127 F, jämfört med genomsnittet av 43.2 °C / 110 F
(+) Vid tomgångsbruk är medeltemperaturen för ovansidan 24.7 °C / 76 F, jämfört med enhetsgenomsnittet på 33.9 °C / ### class_avg_f### F.
(-) När du spelar The Witcher 3 är medeltemperaturen för ovansidan 40.2 °C / 104 F, jämfört med enhetsgenomsnittet på 33.9 °C / ## #class_avg_f### F.
(+) Handledsstöden och pekplattan når maximal hudtemperatur (35 °C / 95 F) och är därför inte varma.
(-) Medeltemperaturen för handledsstödsområdet på liknande enheter var 28.8 °C / 83.8 F (-6.2 °C / -11.2 F).
| MSI GF75 Thin 10SDR i7-10750H, GeForce GTX 1660 Ti Mobile | MSI GF75 Thin 10SCXR i5-10300H, GeForce GTX 1650 Mobile | Asus TUF A17 FA706IU-AS76 R7 4800H, GeForce GTX 1660 Ti Mobile | Acer Nitro 5 AN517-52-77DS i7-10750H, GeForce RTX 2060 Mobile | MSI GE75 Raider 10SE-008US i7-10750H, GeForce RTX 2060 Mobile | Genomsnitt av klass Gaming | |
|---|---|---|---|---|---|---|
| Heat | -18% | -9% | -5% | -18% | -10% | |
| Maximum Upper Side * (°C) | 51 | 42 18% | 47.6 7% | 50.6 1% | 44.2 13% | 45.2 ? 11% |
| Maximum Bottom * (°C) | 53 | 53.4 -1% | 50.8 4% | 53.8 -2% | 49 8% | 48.1 ? 9% |
| Idle Upper Side * (°C) | 25 | 34.2 -37% | 33 -32% | 26.6 -6% | 33.6 -34% | 31 ? -24% |
| Idle Bottom * (°C) | 25 | 37.4 -50% | 29 -16% | 27.8 -11% | 39.6 -58% | 34.2 ? -37% |
* ... mindre är bättre
MSI GF75 Thin 10SDR ljudanalys
(±) | högtalarljudstyrkan är genomsnittlig men bra (81 dB)
Bas 100 - 315 Hz
(-) | nästan ingen bas - i genomsnitt 16.6% lägre än medianen
(-) | basen är inte linjär (15.4% delta till föregående frekvens)
Mellan 400 - 2000 Hz
(+) | balanserad mellan - endast 2.6% från medianen
(+) | mids är linjära (5.5% delta till föregående frekvens)
Högsta 2 - 16 kHz
(+) | balanserade toppar - endast 2.2% från medianen
(+) | toppar är linjära (6% delta till föregående frekvens)
Totalt 100 - 16 000 Hz
(+) | det totala ljudet är linjärt (12.5% skillnad mot median)
Jämfört med samma klass
» 15% av alla testade enheter i den här klassen var bättre, 3% liknande, 81% sämre
» Den bästa hade ett delta på 6%, genomsnittet var 18%, sämst var 132%
Jämfört med alla testade enheter
» 11% av alla testade enheter var bättre, 2% liknande, 87% sämre
» Den bästa hade ett delta på 4%, genomsnittet var 23%, sämst var 134%
Asus TUF A17 FA706IU-AS76 ljudanalys
(±) | högtalarljudstyrkan är genomsnittlig men bra (74 dB)
Bas 100 - 315 Hz
(±) | reducerad bas - i genomsnitt 12.7% lägre än medianen
(±) | linjäriteten för basen är genomsnittlig (11.5% delta till föregående frekvens)
Mellan 400 - 2000 Hz
(+) | balanserad mellan - endast 4.8% från medianen
(±) | linjäriteten för mids är genomsnittlig (9.1% delta till föregående frekvens)
Högsta 2 - 16 kHz
(+) | balanserade toppar - endast 3.1% från medianen
(±) | linjäriteten för toppar är genomsnittlig (8.7% delta till föregående frekvens)
Totalt 100 - 16 000 Hz
(±) | linjäriteten för det totala ljudet är genomsnittlig (23.5% skillnad mot median)
Jämfört med samma klass
» 85% av alla testade enheter i den här klassen var bättre, 5% liknande, 10% sämre
» Den bästa hade ett delta på 6%, genomsnittet var 18%, sämst var 132%
Jämfört med alla testade enheter
» 70% av alla testade enheter var bättre, 6% liknande, 24% sämre
» Den bästa hade ett delta på 4%, genomsnittet var 23%, sämst var 134%
| Av/Standby | |
| Låg belastning | |
| Hög belastning |
|
Förklaring:
min: | |
| MSI GF75 Thin 10SDR i7-10750H, GeForce GTX 1660 Ti Mobile | MSI GF75 Thin 10SCXR i5-10300H, GeForce GTX 1650 Mobile | Asus TUF A17 FA706IU-AS76 R7 4800H, GeForce GTX 1660 Ti Mobile | Acer Nitro 5 AN517-52-77DS i7-10750H, GeForce RTX 2060 Mobile | MSI GE75 Raider 10SE-008US i7-10750H, GeForce RTX 2060 Mobile | Genomsnitt av klass Gaming | |
|---|---|---|---|---|---|---|
| Power Consumption | -17% | -2% | 9% | -55% | -54% | |
| Idle Minimum * (Watt) | 8 | 13 -63% | 7.4 7% | 5.4 32% | 14.7 -84% | 13 ? -63% |
| Idle Average * (Watt) | 10 | 15.7 -57% | 10.5 -5% | 9.8 2% | 20.4 -104% | 19 ? -90% |
| Idle Maximum * (Watt) | 15 | 21 -40% | 17 -13% | 10.9 27% | 26.9 -79% | 24.6 ? -64% |
| Load Average * (Watt) | 95 | 87 8% | 103.7 -9% | 104 -9% | 93.2 2% | 110.7 ? -17% |
| Witcher 3 ultra * (Watt) | 133 | 96.4 28% | 128.1 4% | 134.3 -1% | 185.4 -39% | |
| Load Maximum * (Watt) | 193 | 145.8 24% | 183.2 5% | 193 -0% | 237.8 -23% | 259 ? -34% |
* ... mindre är bättre
| MSI GF75 Thin 10SDR i7-10750H, GeForce GTX 1660 Ti Mobile, 51 Wh | MSI GF75 Thin 10SCXR i5-10300H, GeForce GTX 1650 Mobile, 51 Wh | Asus TUF A17 FA706IU-AS76 R7 4800H, GeForce GTX 1660 Ti Mobile, 90 Wh | Acer Nitro 5 AN517-52-77DS i7-10750H, GeForce RTX 2060 Mobile, 57.48 Wh | MSI GE75 Raider 10SE-008US i7-10750H, GeForce RTX 2060 Mobile, 65 Wh | Genomsnitt av klass Gaming | |
|---|---|---|---|---|---|---|
| Batteridrifttid | 11% | 123% | 72% | -7% | 47% | |
| Reader / Idle (h) | 7.3 | 7.7 5% | 9.1 25% | 11 51% | 8.27 ? 13% | |
| WiFi v1.3 (h) | 4 | 4.7 18% | 8.5 113% | 6.6 65% | 3.7 -7% | 7.11 ? 78% |
| Load (h) | 1 | 1.1 10% | 3.3 230% | 2 100% | 1.502 ? 50% | |
| H.264 (h) | 7.3 | 8.32 ? |
För
Emot
Läs den fullständiga versionen av den här recensionen på engelska här.
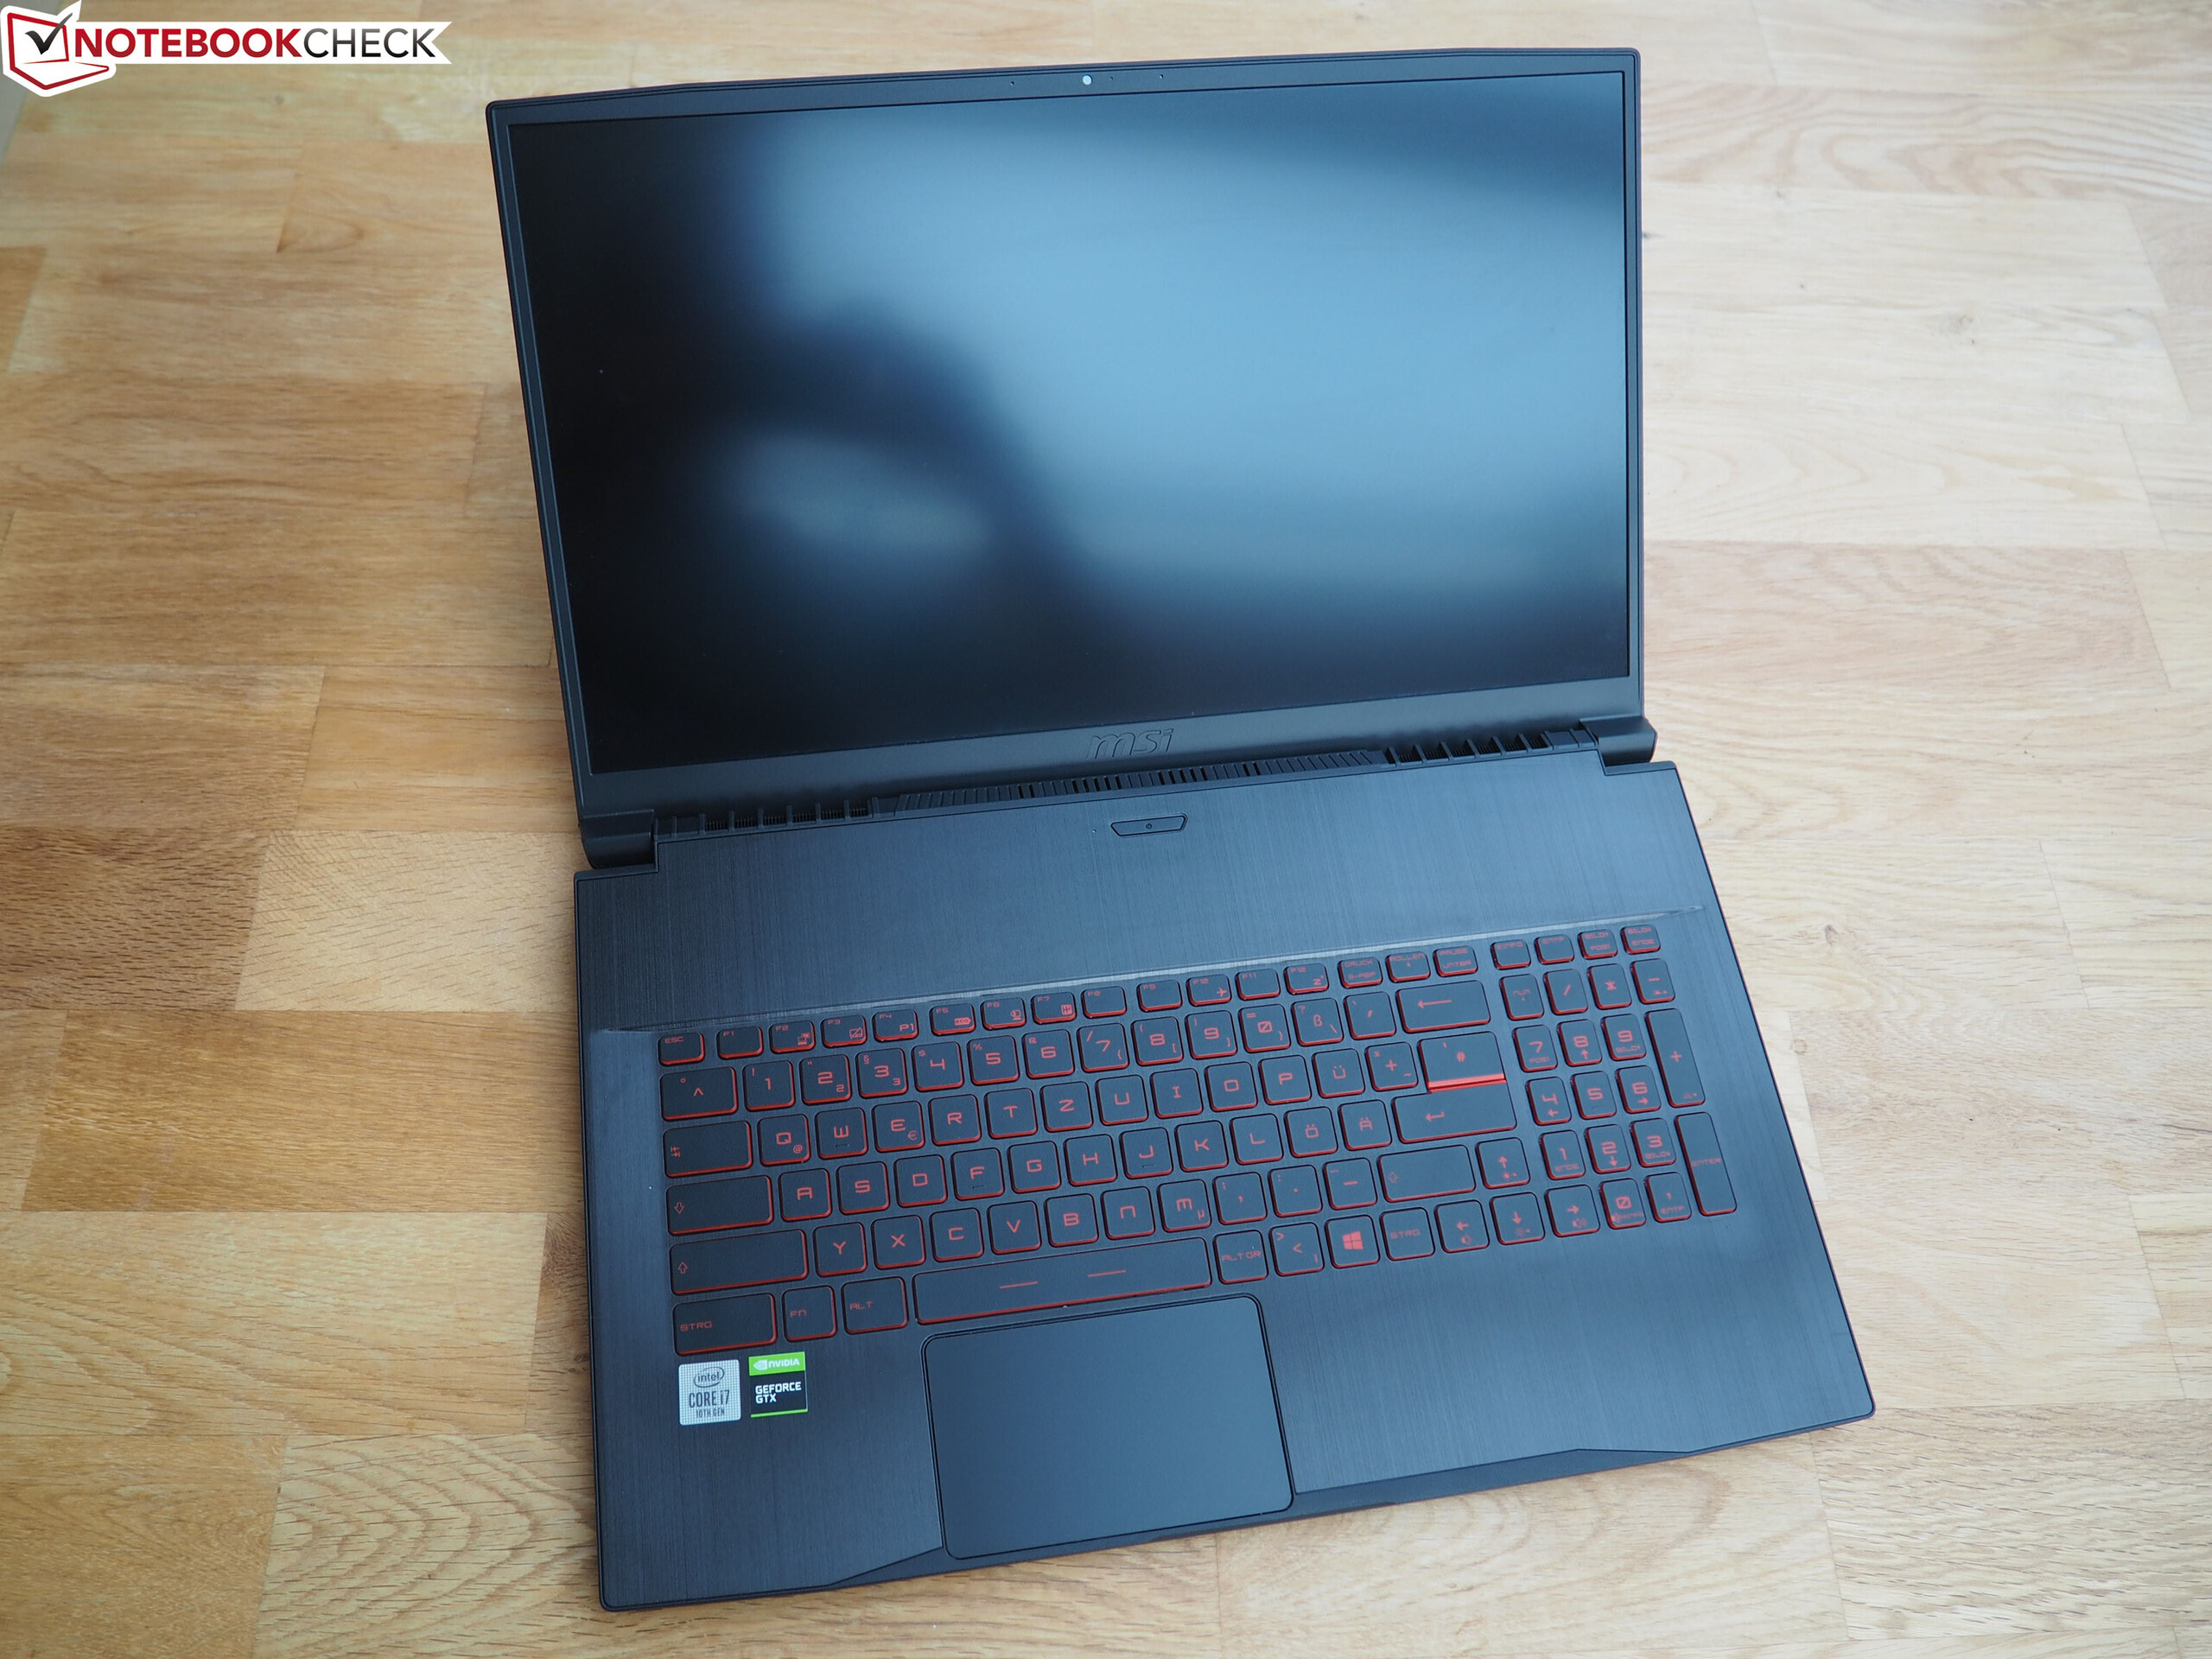
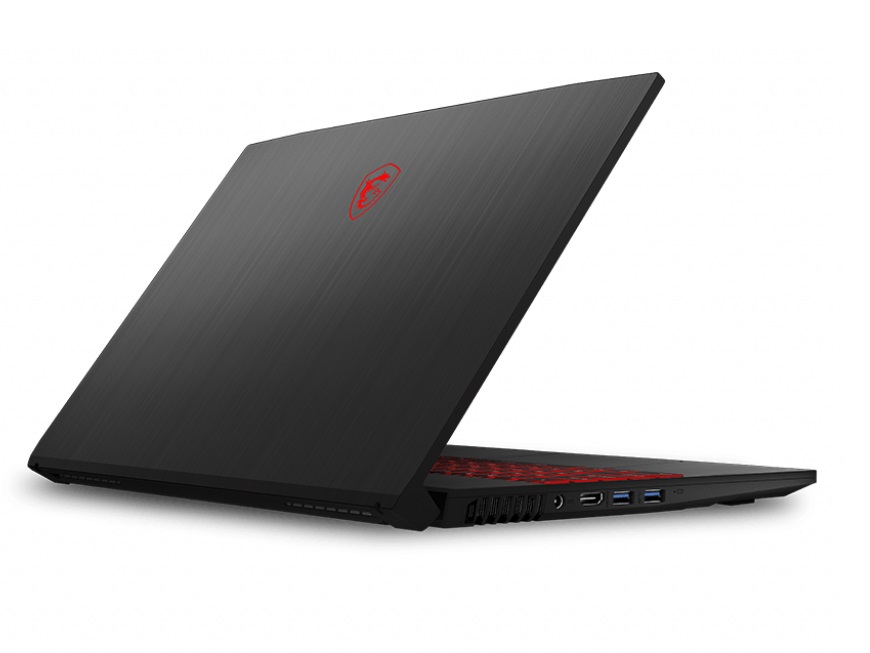
GF75 10SDR-253 är gjord för gamers som vill ha ultimat prestanda för under 12.000 kronor.
GeForce GTX 1660 Ti är mycket snabbare än GTX 1650 (Ti), som man oftast hittar på bärbara datorer med det här priset. CPU-prestandan imponerar också, även om vi hellre hade sett en Ryzen 5 4600H snarare än en Core i7-10750H. Den hade inte bara varit potentiellt sett snabbare utan också effektivare, svalare och därmed även tystare tack vare sin 7 nm-tillverkningsprocess (jämfört med 14 nm). Resten av hårdvaran är godkänd. 16 GB RAM, en M.2 PCIe SSD och en 144 Hz-skärm känns uppdaterat.
Den hade kunnat få högre betyg för bättre anslutbarhet (saknar Thunderbolt 3, kortläsare och DisplayPort), bättre fläkthantering och ett batteri med högre kapacitet. Alla som känner sig lite som Joakim von Anka kommer fortfarande finna den svår att motstå. Med tanke på att en Windows 10-licens endast kostar runt 500 kronor känns det märkligt att datorn levereras utan en i en del länder, något som kan krångla till saker för ovana nybörjare.
MSI GF75 Thin 10SDR
- 10/06/2020 v7 (old)
Florian Glaser
Price comparison