Recension av Gigabyte Aero 16 YE5 - Kompakt bärbar dator för 4K-multimedia

Gigabytes Aero 16 är en blandning av en kompakt bärbar dator för spel, en bärbar arbetsstation och en bärbar dator för kreatörer. Den drivs av enCore i9-12900HK (Alder Lake) och en NVIDIA GeForce RTX 3080 Ti Laptop GPU GPU - Benchmarks and Specs GeForce RTX 3080 Ti. Dess främsta konkurrenter är enheter som Lenovo ThinkPad X1 Extreme G4, Schenker XMG Pro 15 (Late 2021), HP ZBook Studio 15 G8, Apple MacBook Pro 16 2021 M1 Max Laptop Review: Full prestanda utan strypning Apple MacBook Pro 16 2021 M1 Max och Razer Blade 15 2022
Jämförelse av potentiella konkurrenter
Gradering | Datum | Modell | Vikt | Höjd | Storlek | Upplösning | Pris |
|---|---|---|---|---|---|---|---|
| 84.7 % v7 (old) | 03/2022 | Gigabyte Aero 16 YE5 i9-12900HK, GeForce RTX 3080 Ti Laptop GPU | 2.3 kg | 22.4 mm | 16.00" | 3840x2400 | |
| 88.3 % v7 (old) | 12/2021 | Lenovo ThinkPad X1 Extreme G4-20Y50040GE i9-11950H, GeForce RTX 3080 Laptop GPU | 1.9 kg | 18.2 mm | 16.00" | 3840x2400 | |
| 92.5 % v7 (old) | 11/2021 | Apple MacBook Pro 16 2021 M1 Max M1 Max, M1 Max 32-Core GPU | 2.2 kg | 16.8 mm | 16.20" | 3456x2234 | |
| 87.8 % v7 (old) | 09/2021 | HP ZBook Studio 15 G8 i9-11950H, GeForce RTX 3070 Laptop GPU | 1.9 kg | 18 mm | 15.60" | 3840x2160 | |
| 84.6 % v7 (old) | 01/2022 | Schenker XMG Pro 15 (Late 2021) i7-11800H, GeForce RTX 3080 Laptop GPU | 2 kg | 19.8 mm | 15.60" | 3840x2160 | |
| 89.1 % v7 (old) | 03/2022 | Razer Blade 15 2022 i7-12800H, GeForce RTX 3080 Ti Laptop GPU | 2.1 kg | 16.99 mm | 15.60" | 2560x1440 |
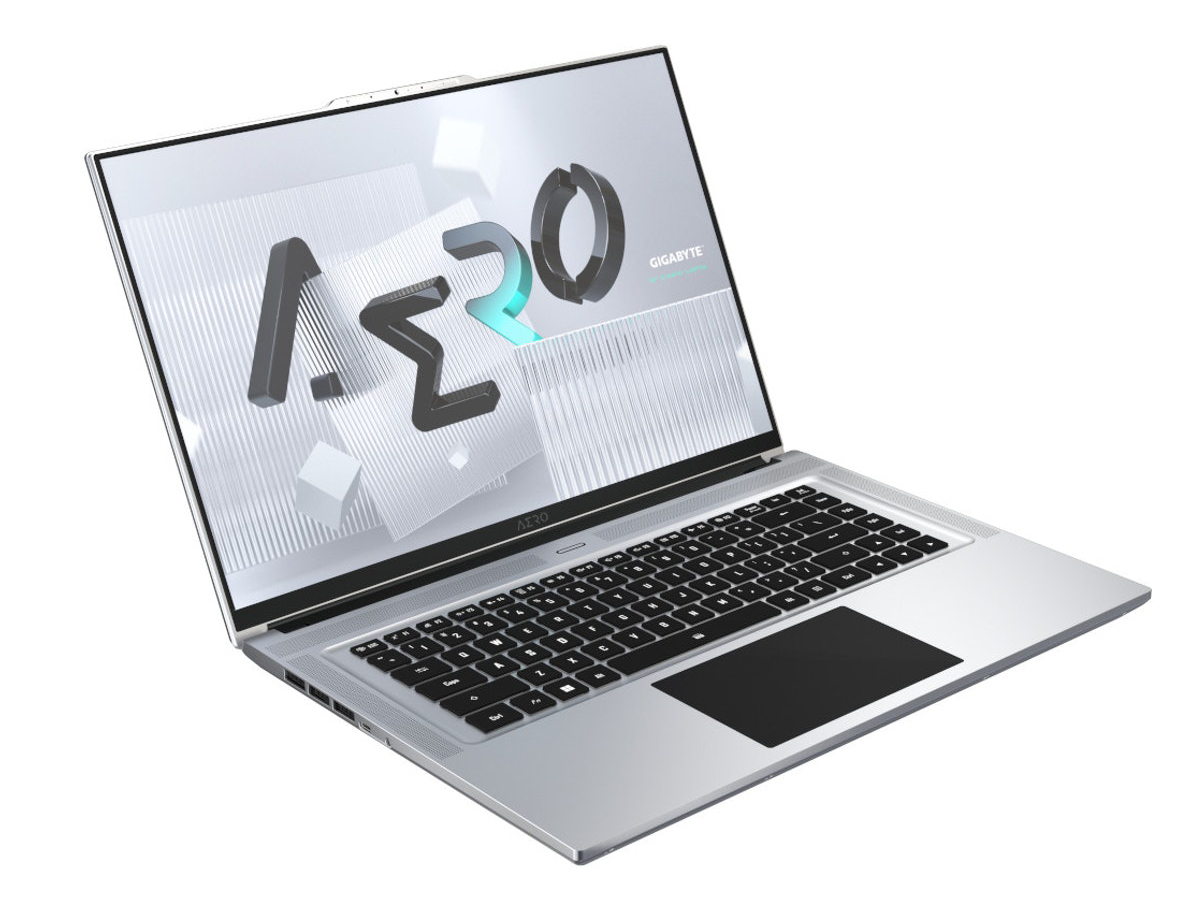
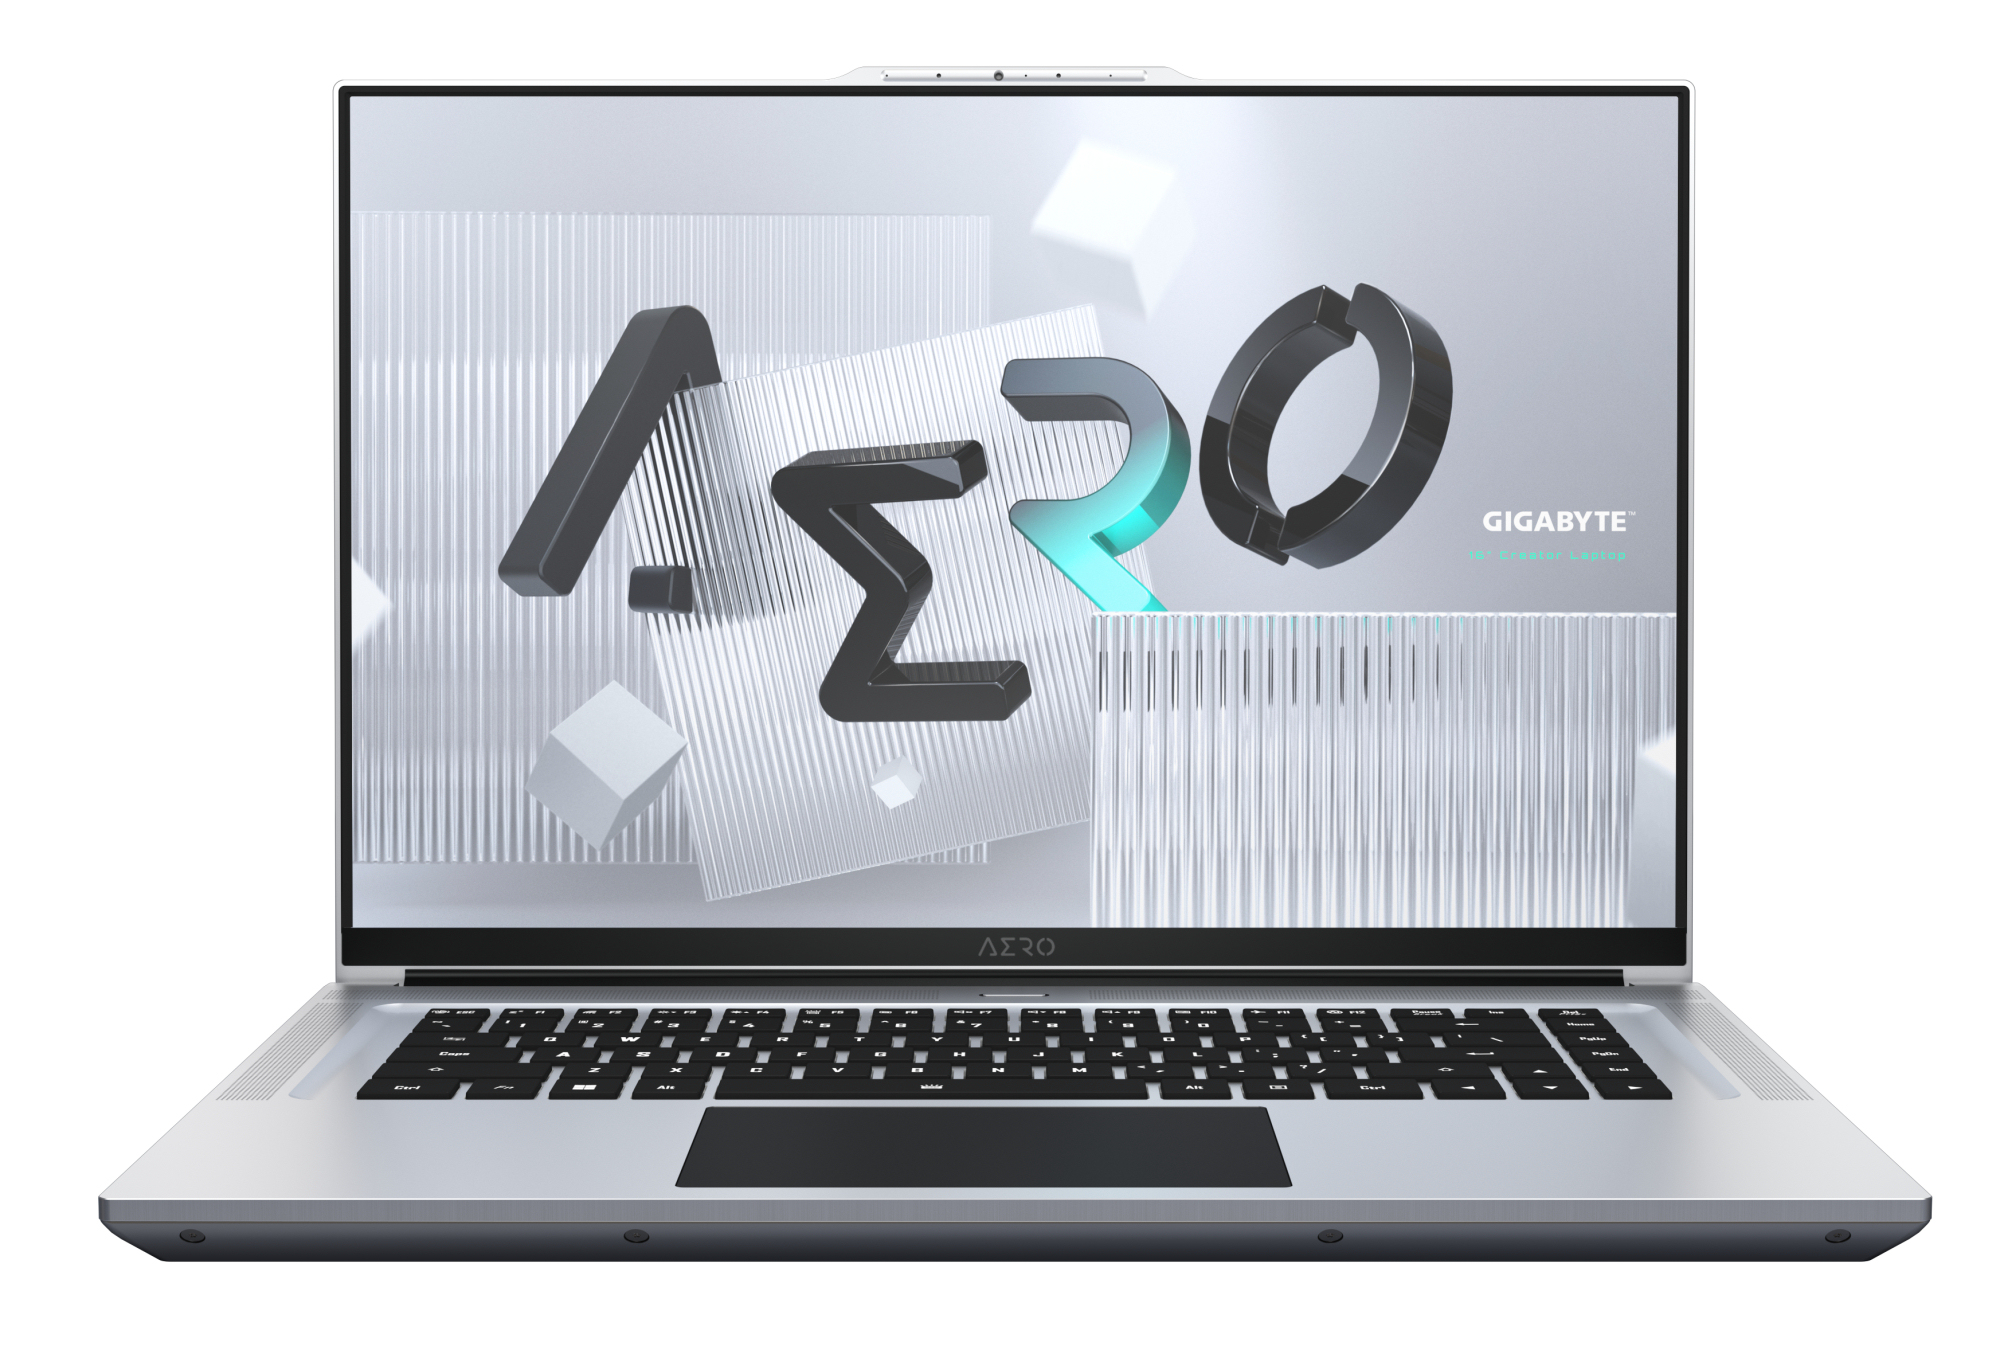
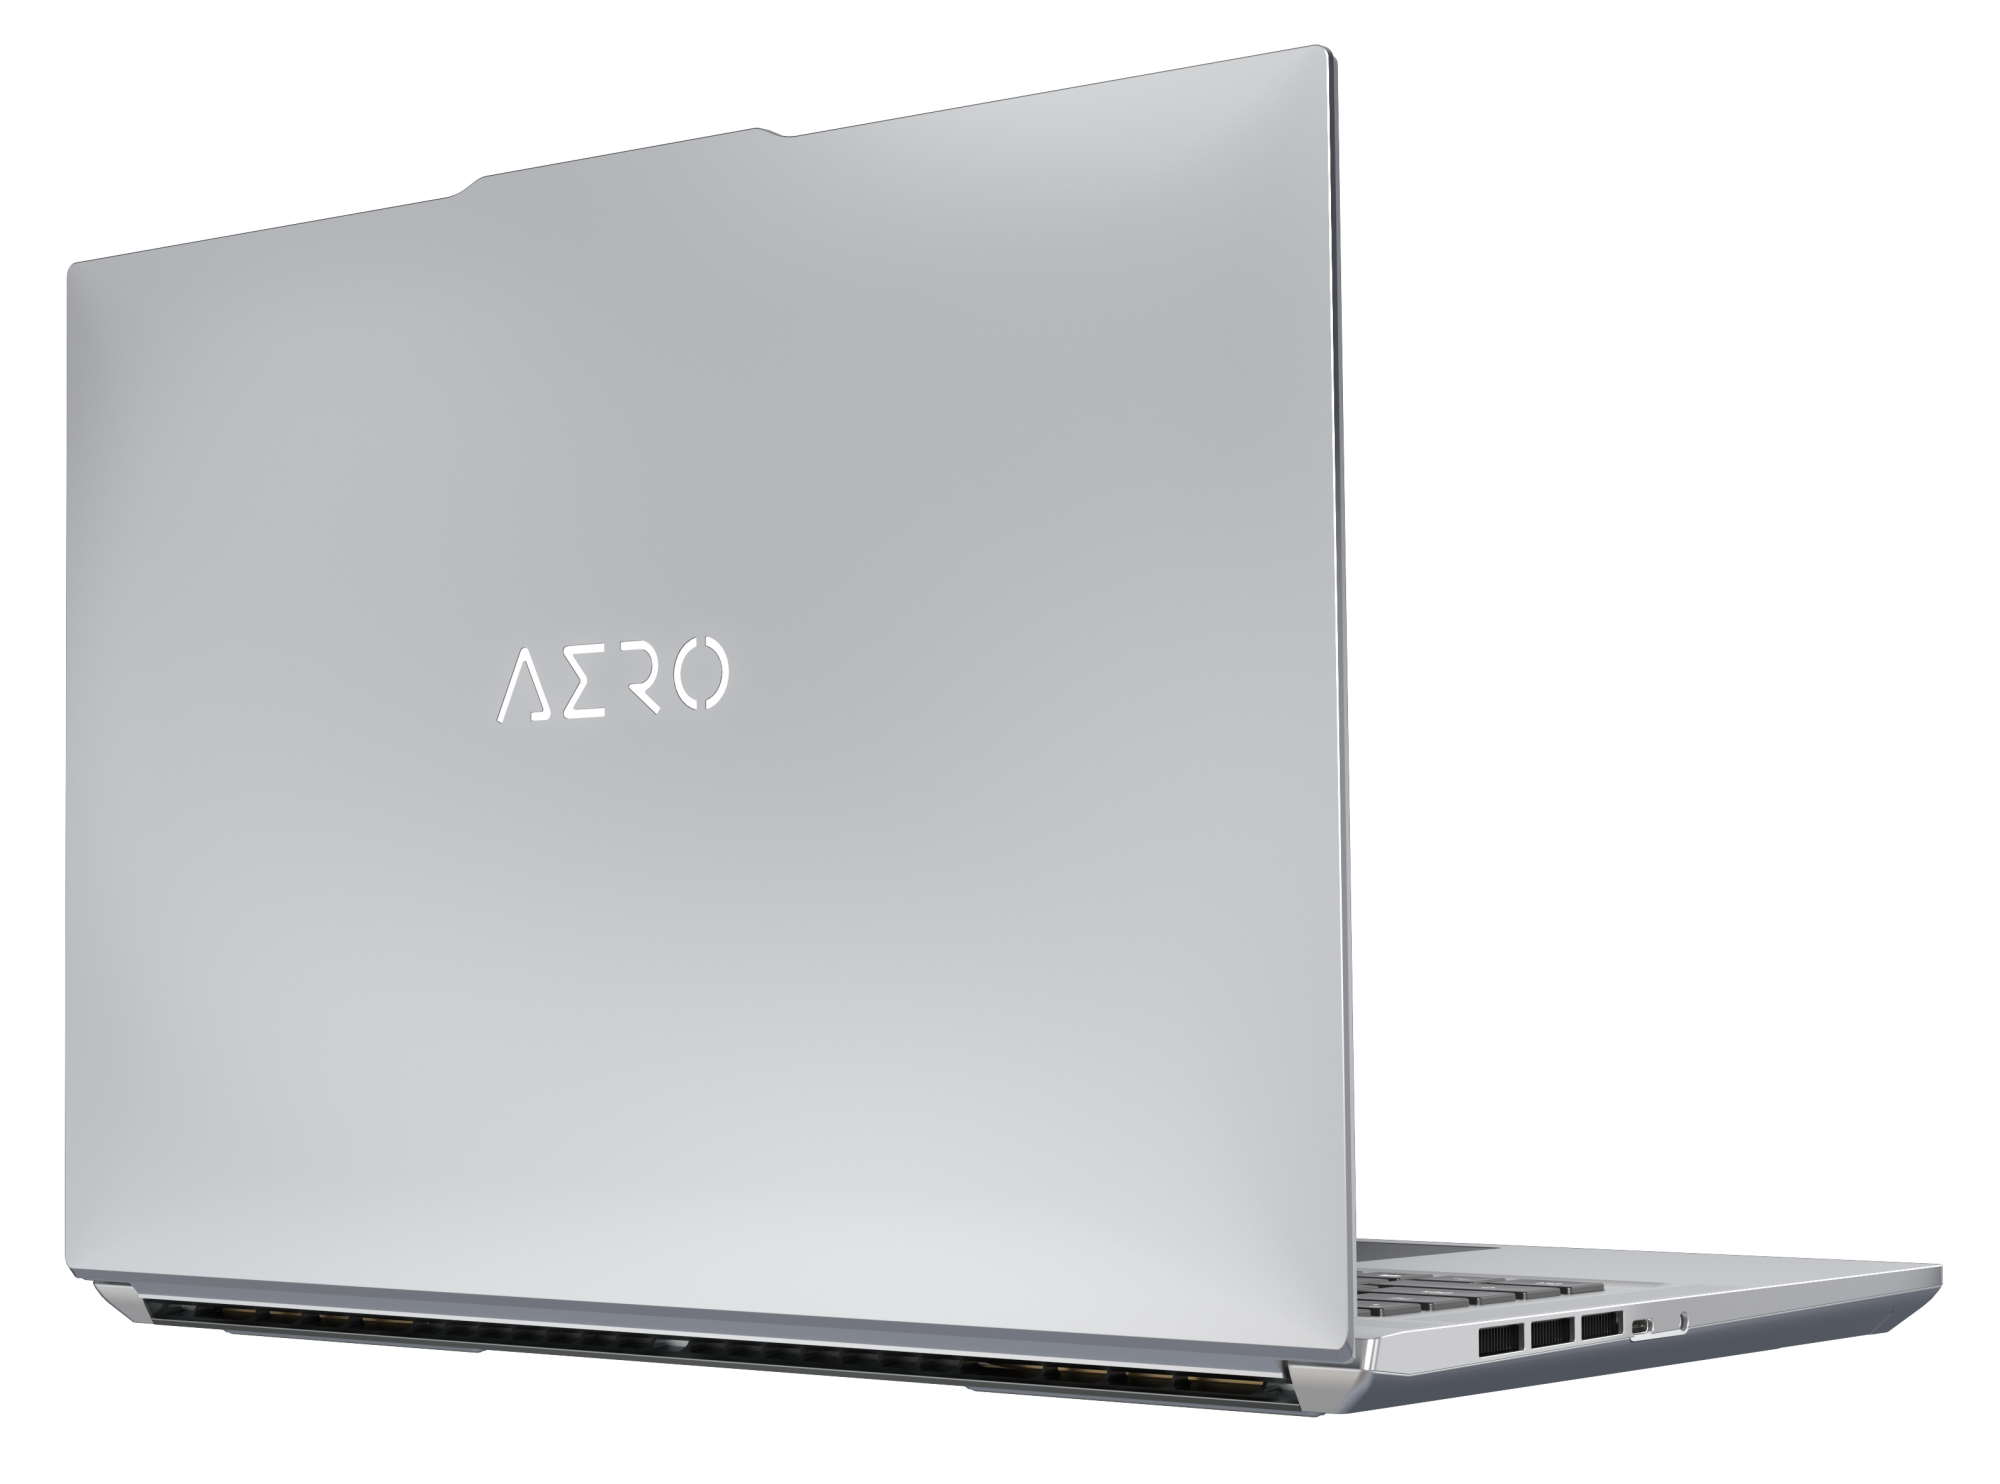
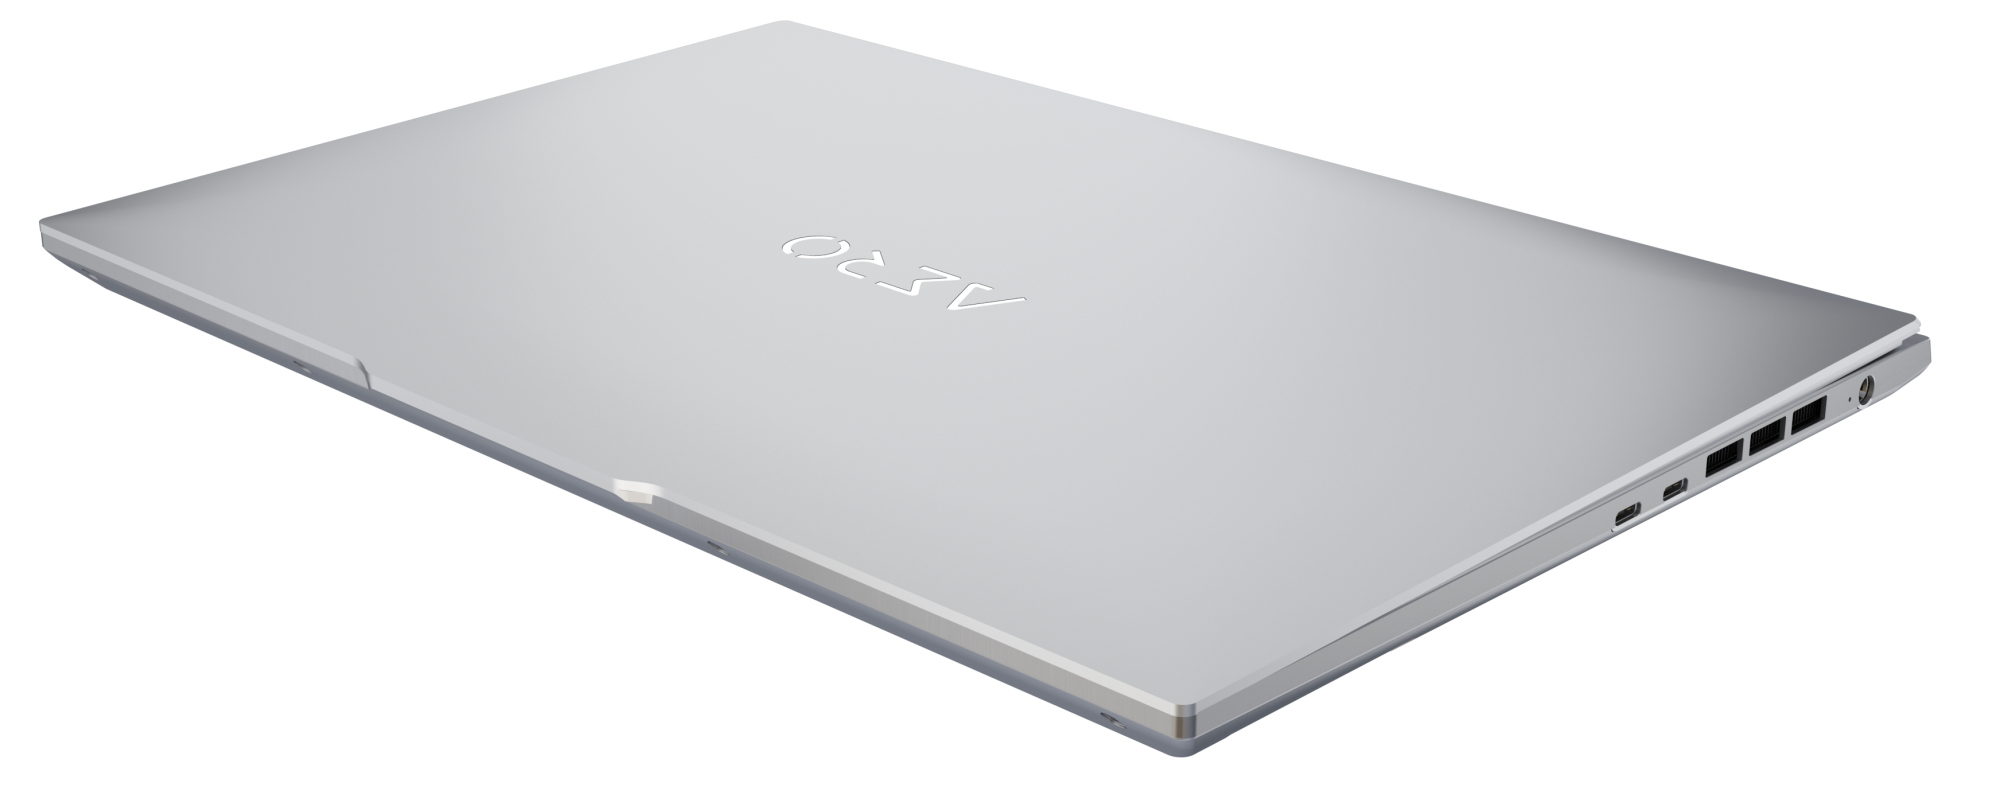
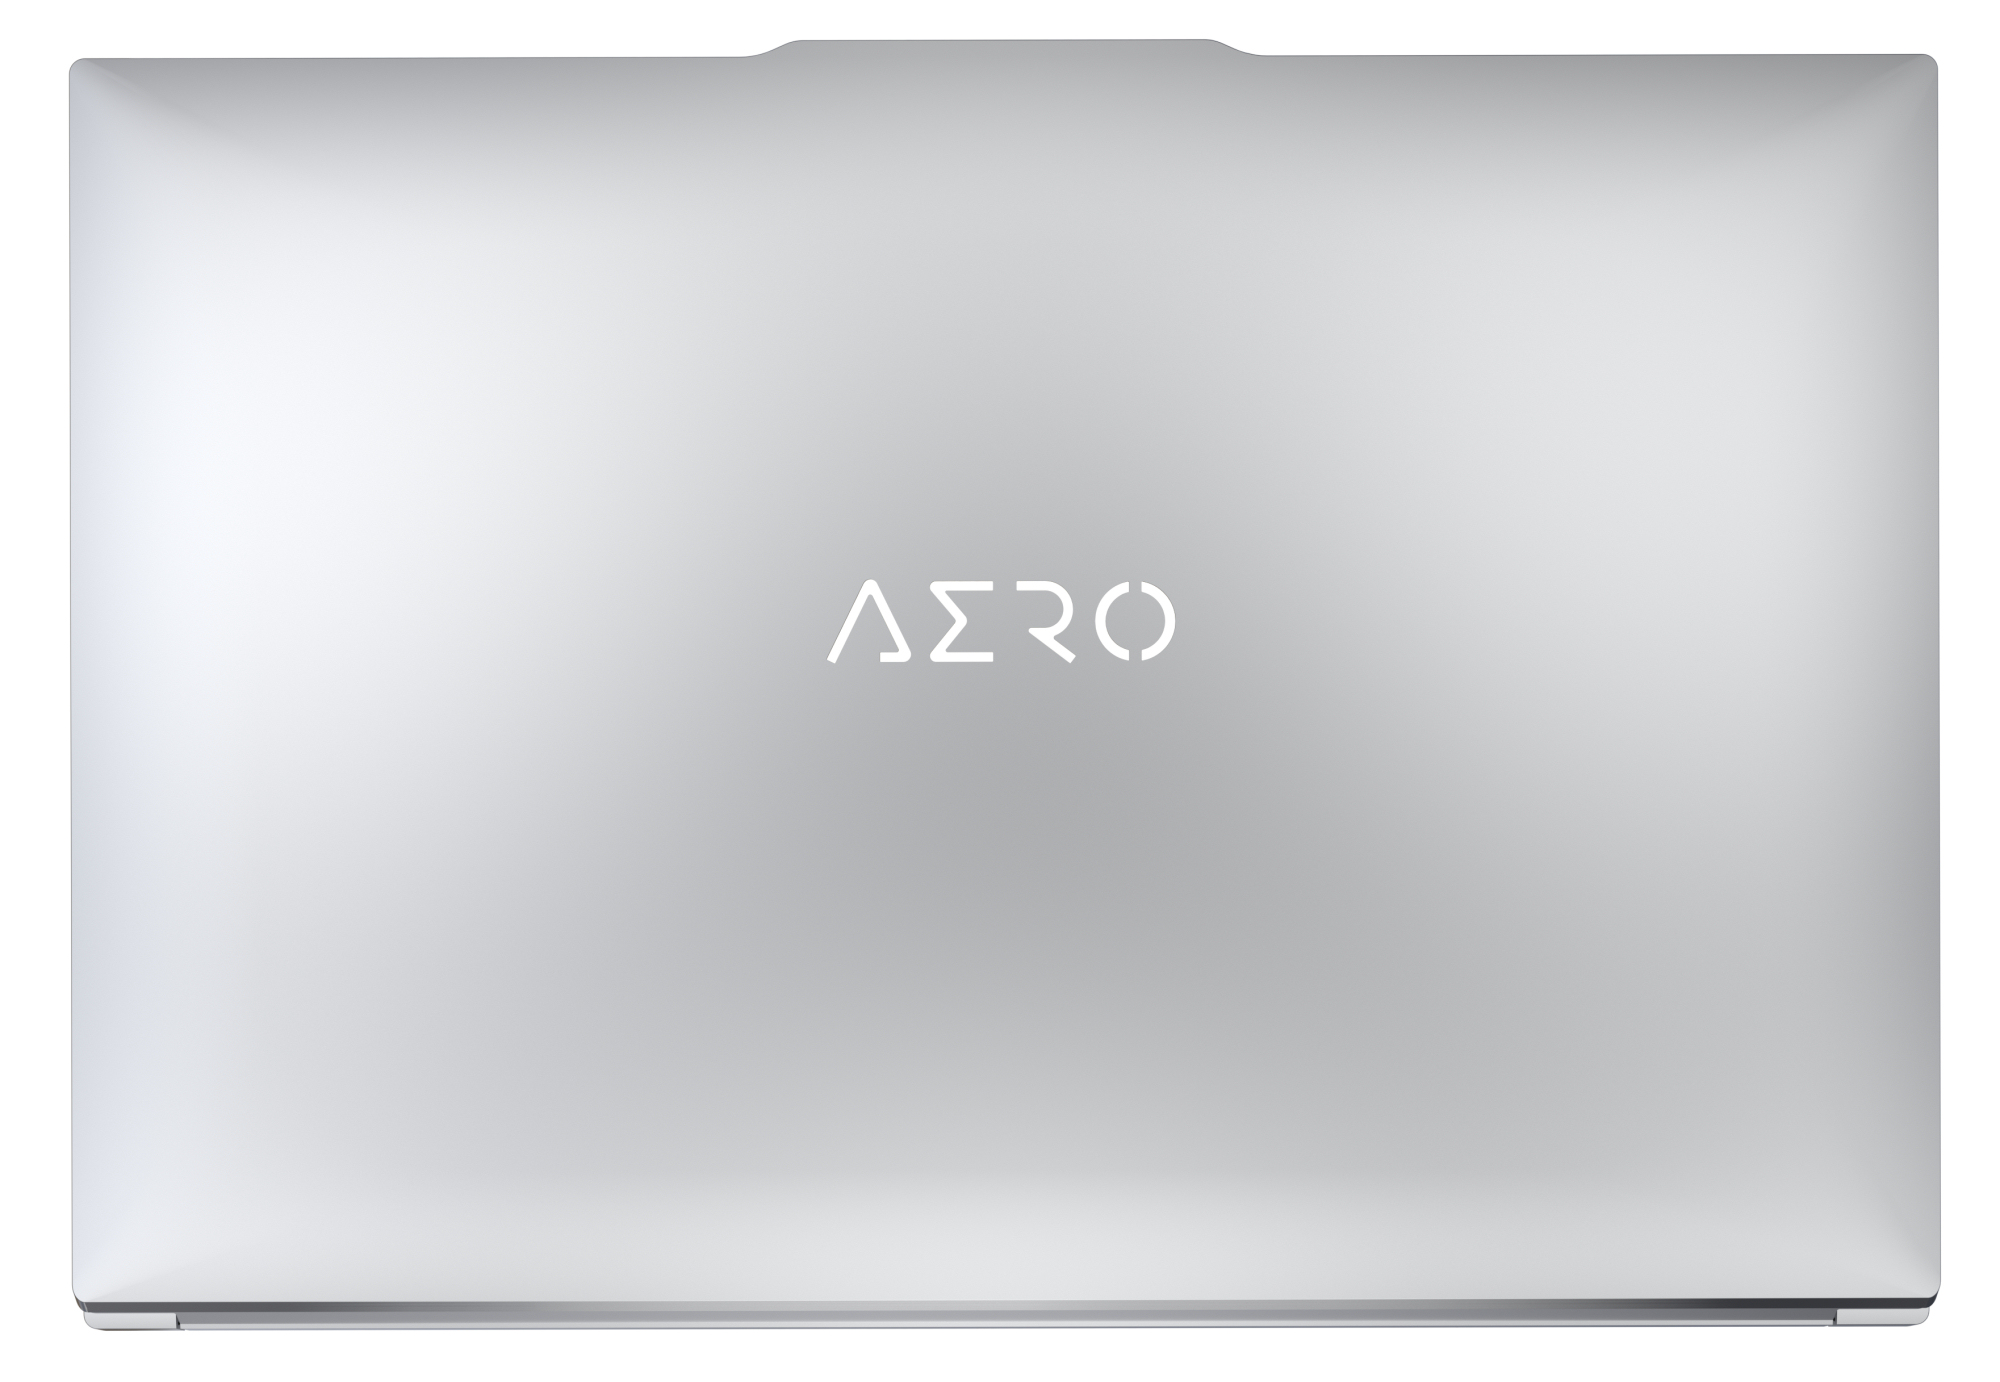
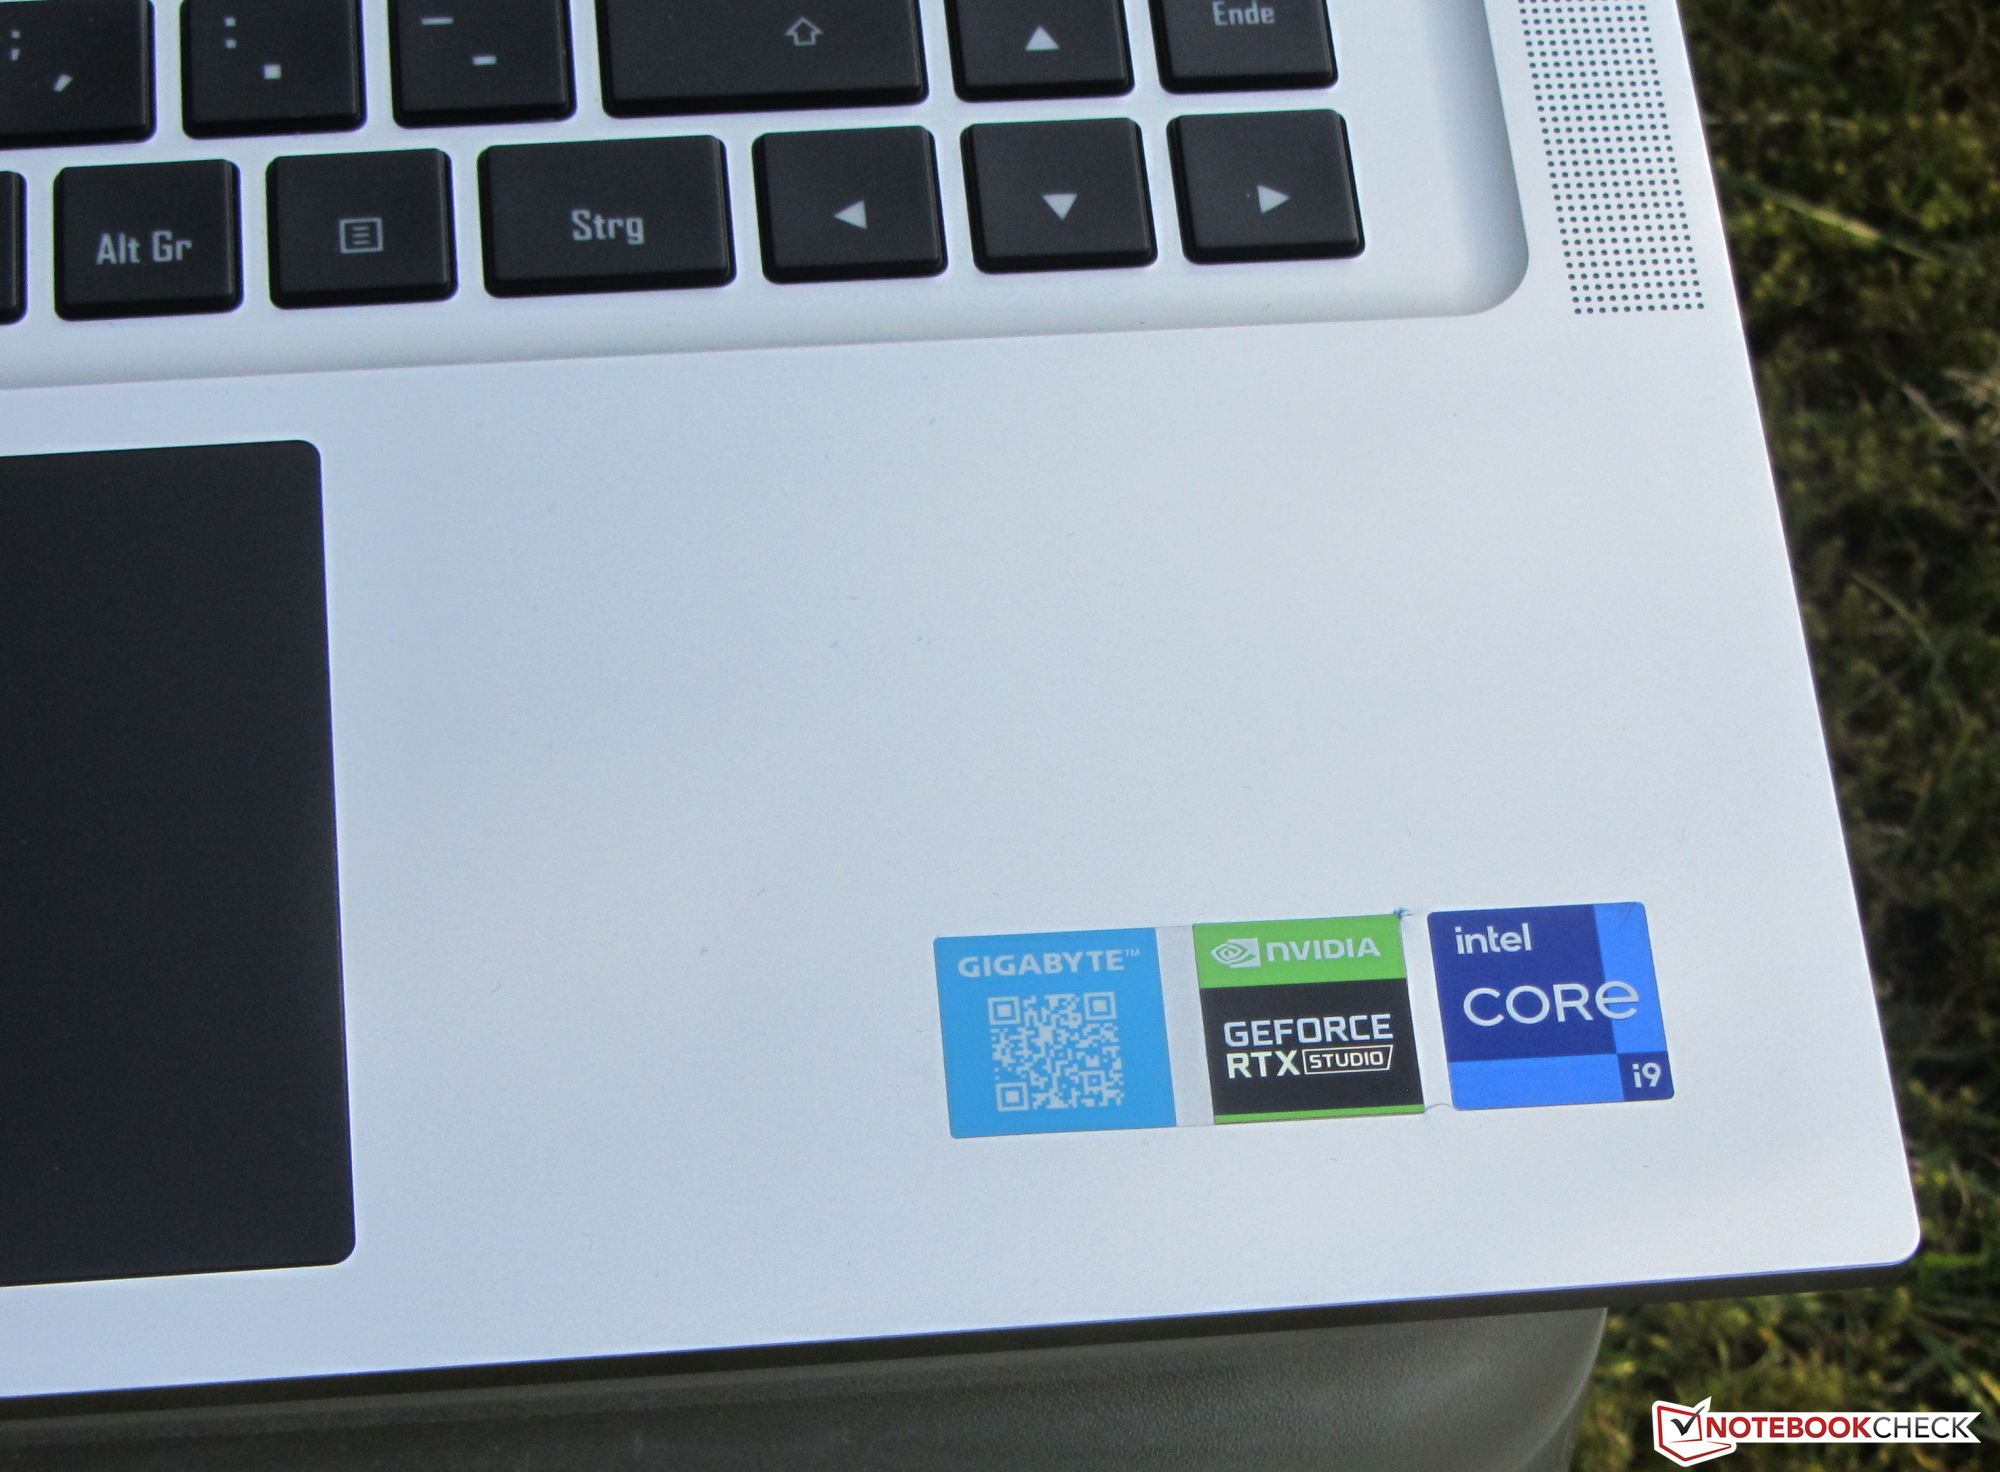
Hölje - Aero har ett robust metallhölje
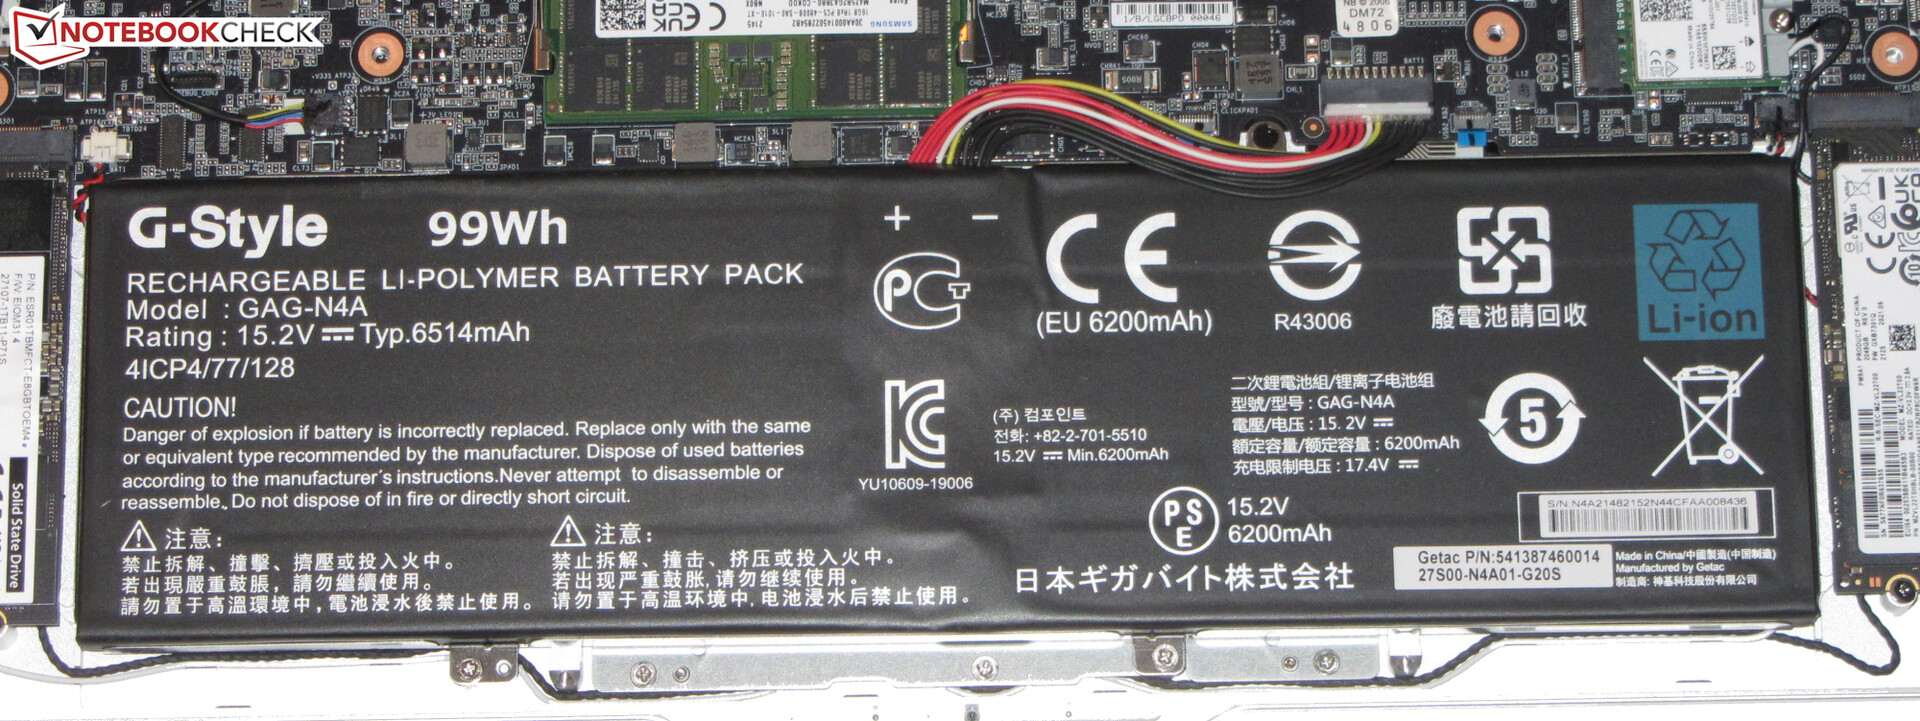
Aero 16 har ett snyggt kompakt silverfärgat metallhölje med en matt och slät yta. Olika svarta element, som tangentbordet, styrplattan, skärmkanten och gångjärnslocket, fungerar som designförskönande detaljer, liksom den bakgrundsbelysta Aero logotypen på baksidan av displaylocket. Insidan är lätt åtkomlig genom att ta bort det nedre locket. Batteriet är inte utbytbart.
Den övergripande byggkvaliteten är god. Panelens mellanrum är konsekventa, och vi hittade inte heller några utskjutande mellanrum. Styvheten är hyfsad med en bas som knappt vrider sig och ett lock som vrider sig och böjer sig endast något. Gångjärnet är stadigt och lyckas hålla skärmen stadigt på plats utan alltför mycket vacklande. Den maximala öppningsvinkeln är cirka 125-130° och den kan öppnas och justeras med en hand.
I vår testgrupp är Aero en av de större enheterna, och den tyngsta med liten marginal. Med sina 2,3 kg är den drygt 400 g tyngre än Lenovo ThinkPad X1 Extreme G4
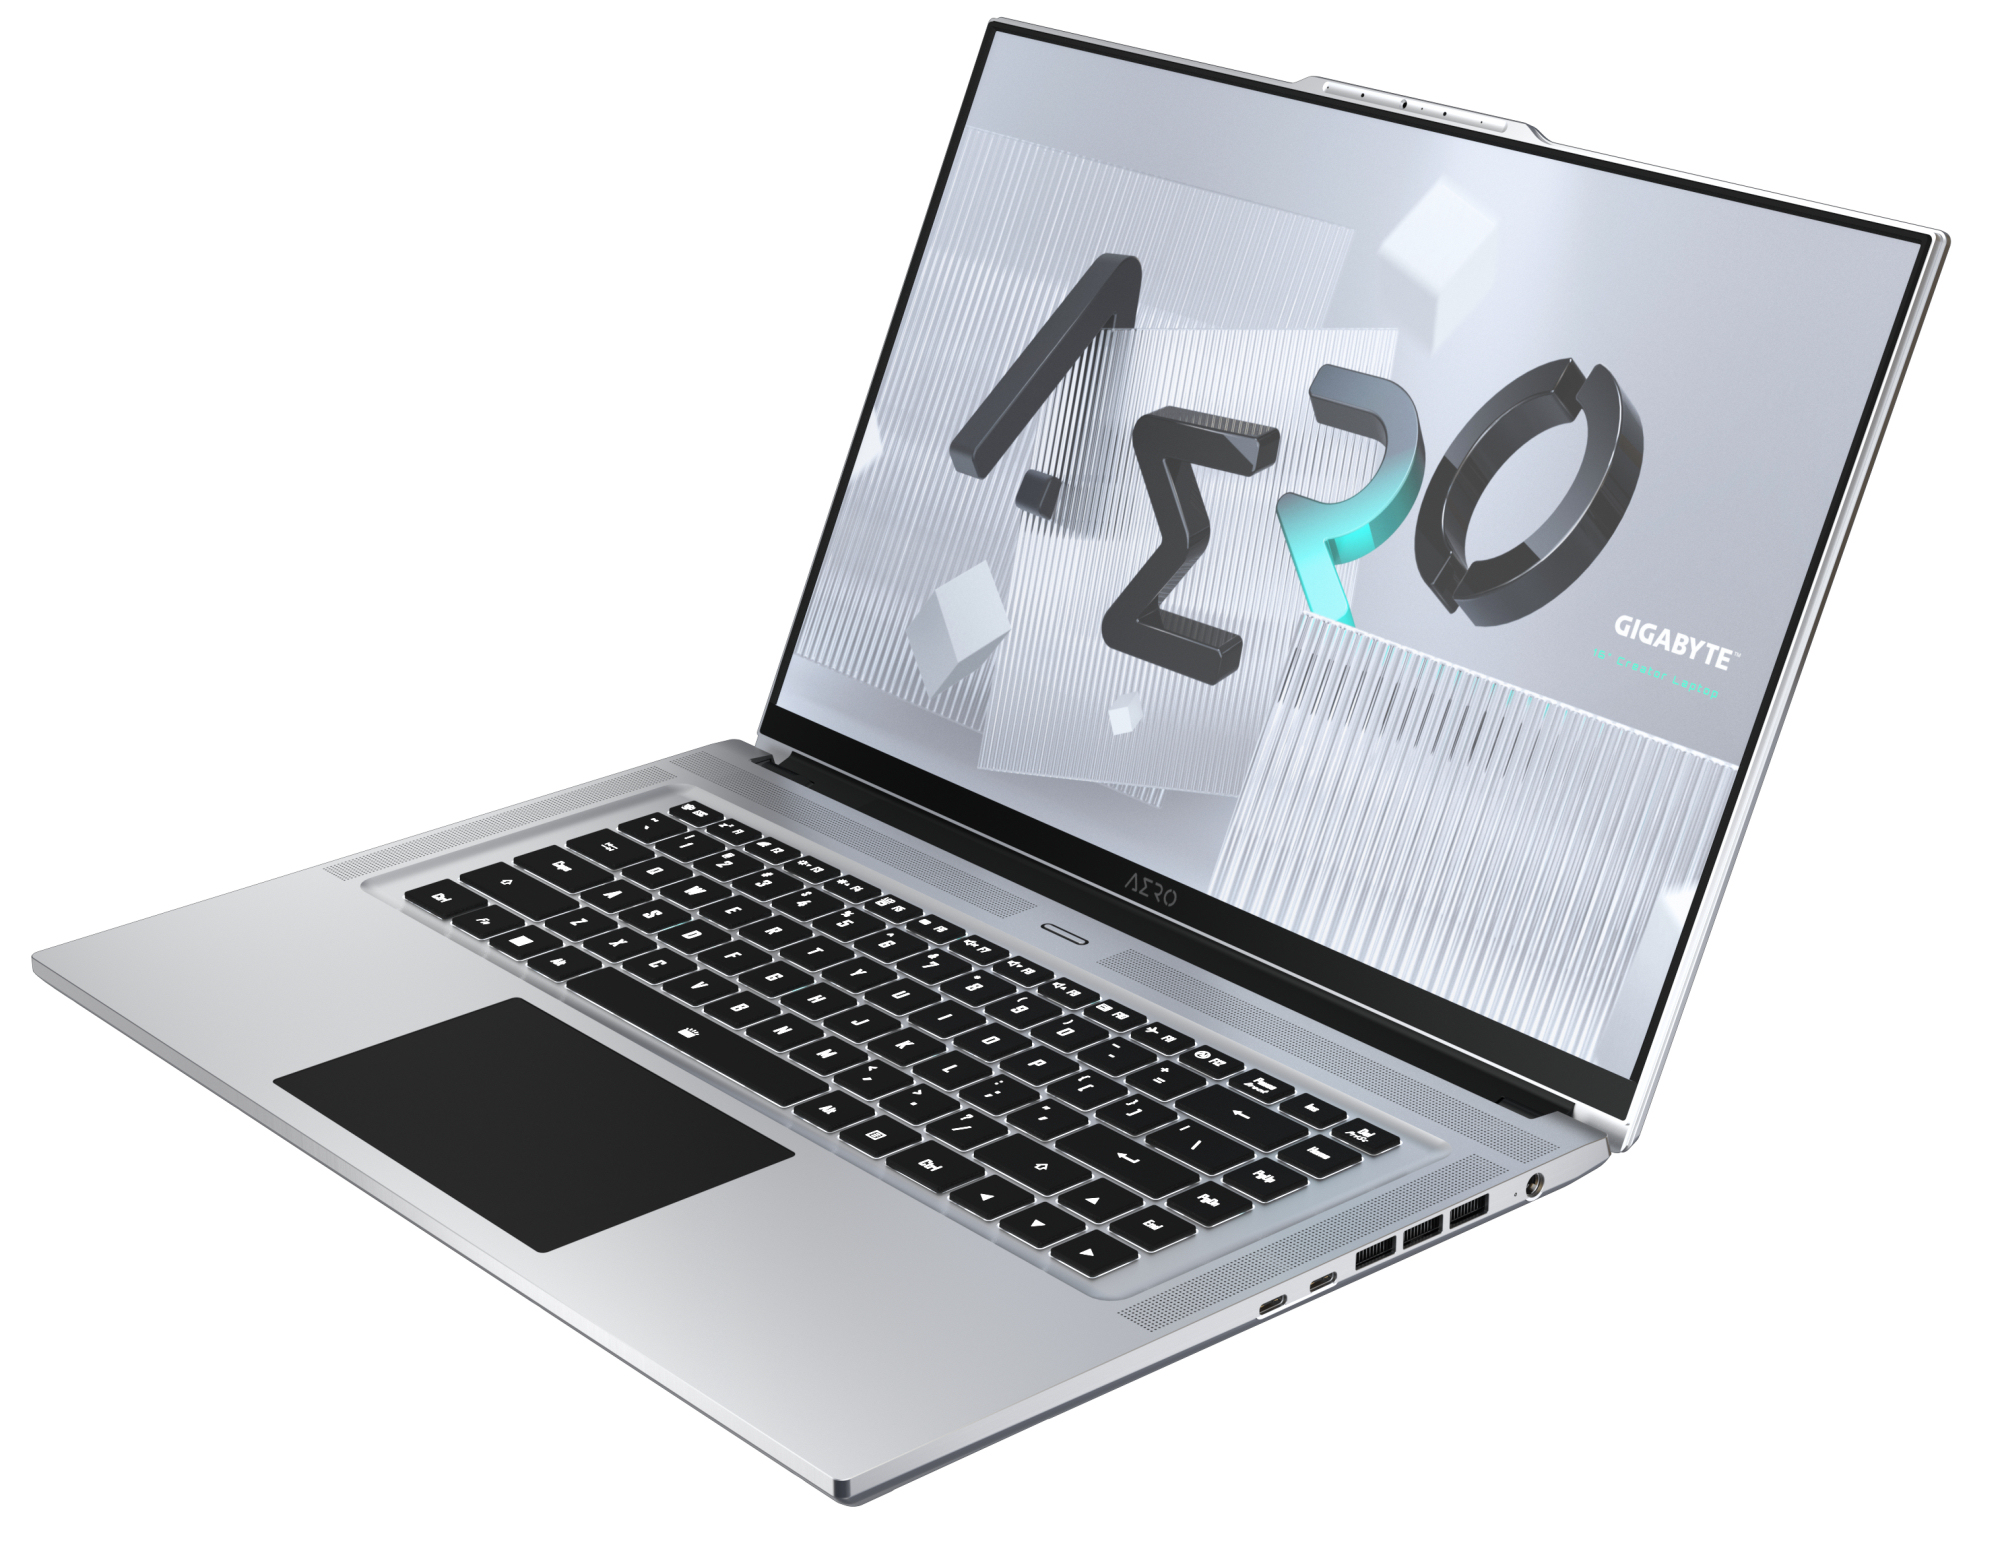
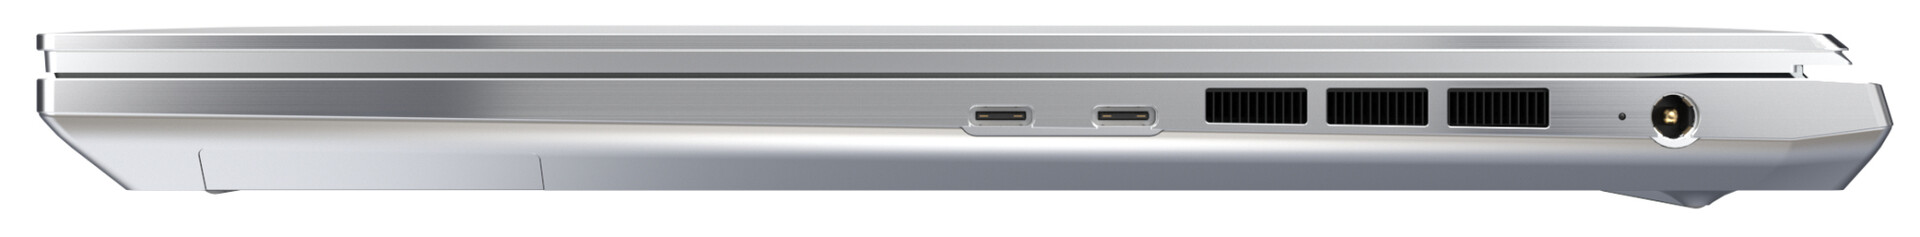
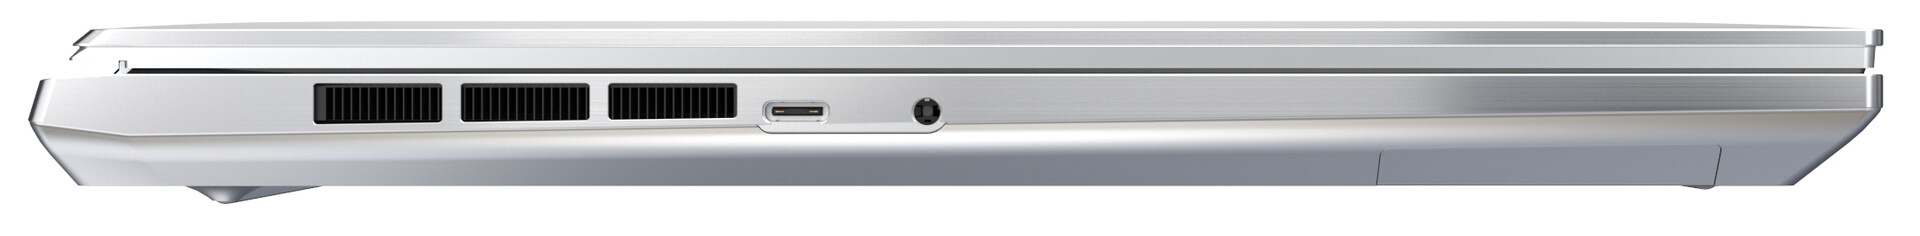
Anslutningar - Gigabytes laptop har USB-C
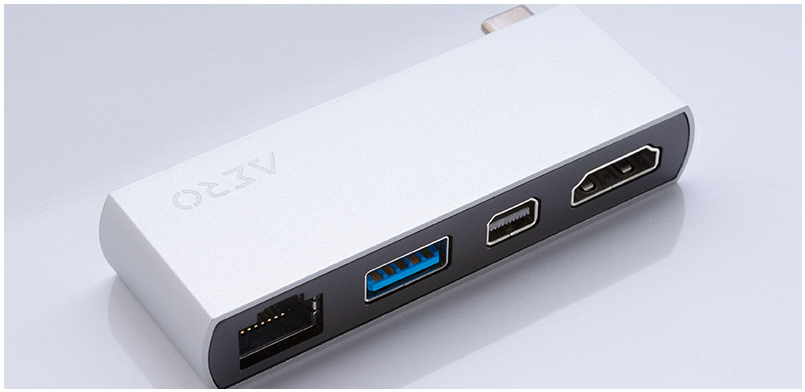
Förutom en laddningsport och ett hörlursuttag hittar vi totalt tre USB-C-portar på enheten, varav två stöder Thunderbolt 4 och en är begränsad till USB 3.2 Gen 2. Alla portar bär en DisplayPort-signal, och den bakre Thunderbolt 4-porten har även stöd för Power Delivery för att ladda batteriet med en USB-C-strömförsörjning, som måste ha en effekt på 45 W eller mer. Den medföljande Aerohubben lägger till ytterligare mer vanliga portar, till exempel HDMI, Mini DisplayPort, USB-A och Ethernet.
Kommunikation
Det inbyggda AX210 Wi-Fi-modemet är tillverkat av Intel och stöder 802.11a/b/g/n/n/ac/ax. Dataöverföringshastigheten var överlag mycket bra under idealiska förhållanden (inga andra Wi-Fi-enheter i närheten, nära avstånd mellan bärbar dator och server).
| Networking | |
| iperf3 receive AXE11000 | |
| Genomsnitt av klass Multimedia (682 - 1818, n=54, senaste 2 åren) | |
| Gigabyte Aero 16 YE5 | |
| iperf3 transmit AXE11000 | |
| Gigabyte Aero 16 YE5 | |
| Genomsnitt av klass Multimedia (606 - 1978, n=54, senaste 2 åren) | |
Webbkamera
Webbkameran på 0,9 MP har en upplösning på 1280 x 720 och är inte särskilt färgprecis med en DeltaE-avvikelse på 9. Helst skulle vi vilja se mindre än 3.


Tillbehör
Förutom det vanliga pappersarbetet (snabbstartguide, garantiinformation) levereras enheten även med en USB-C-hubb.
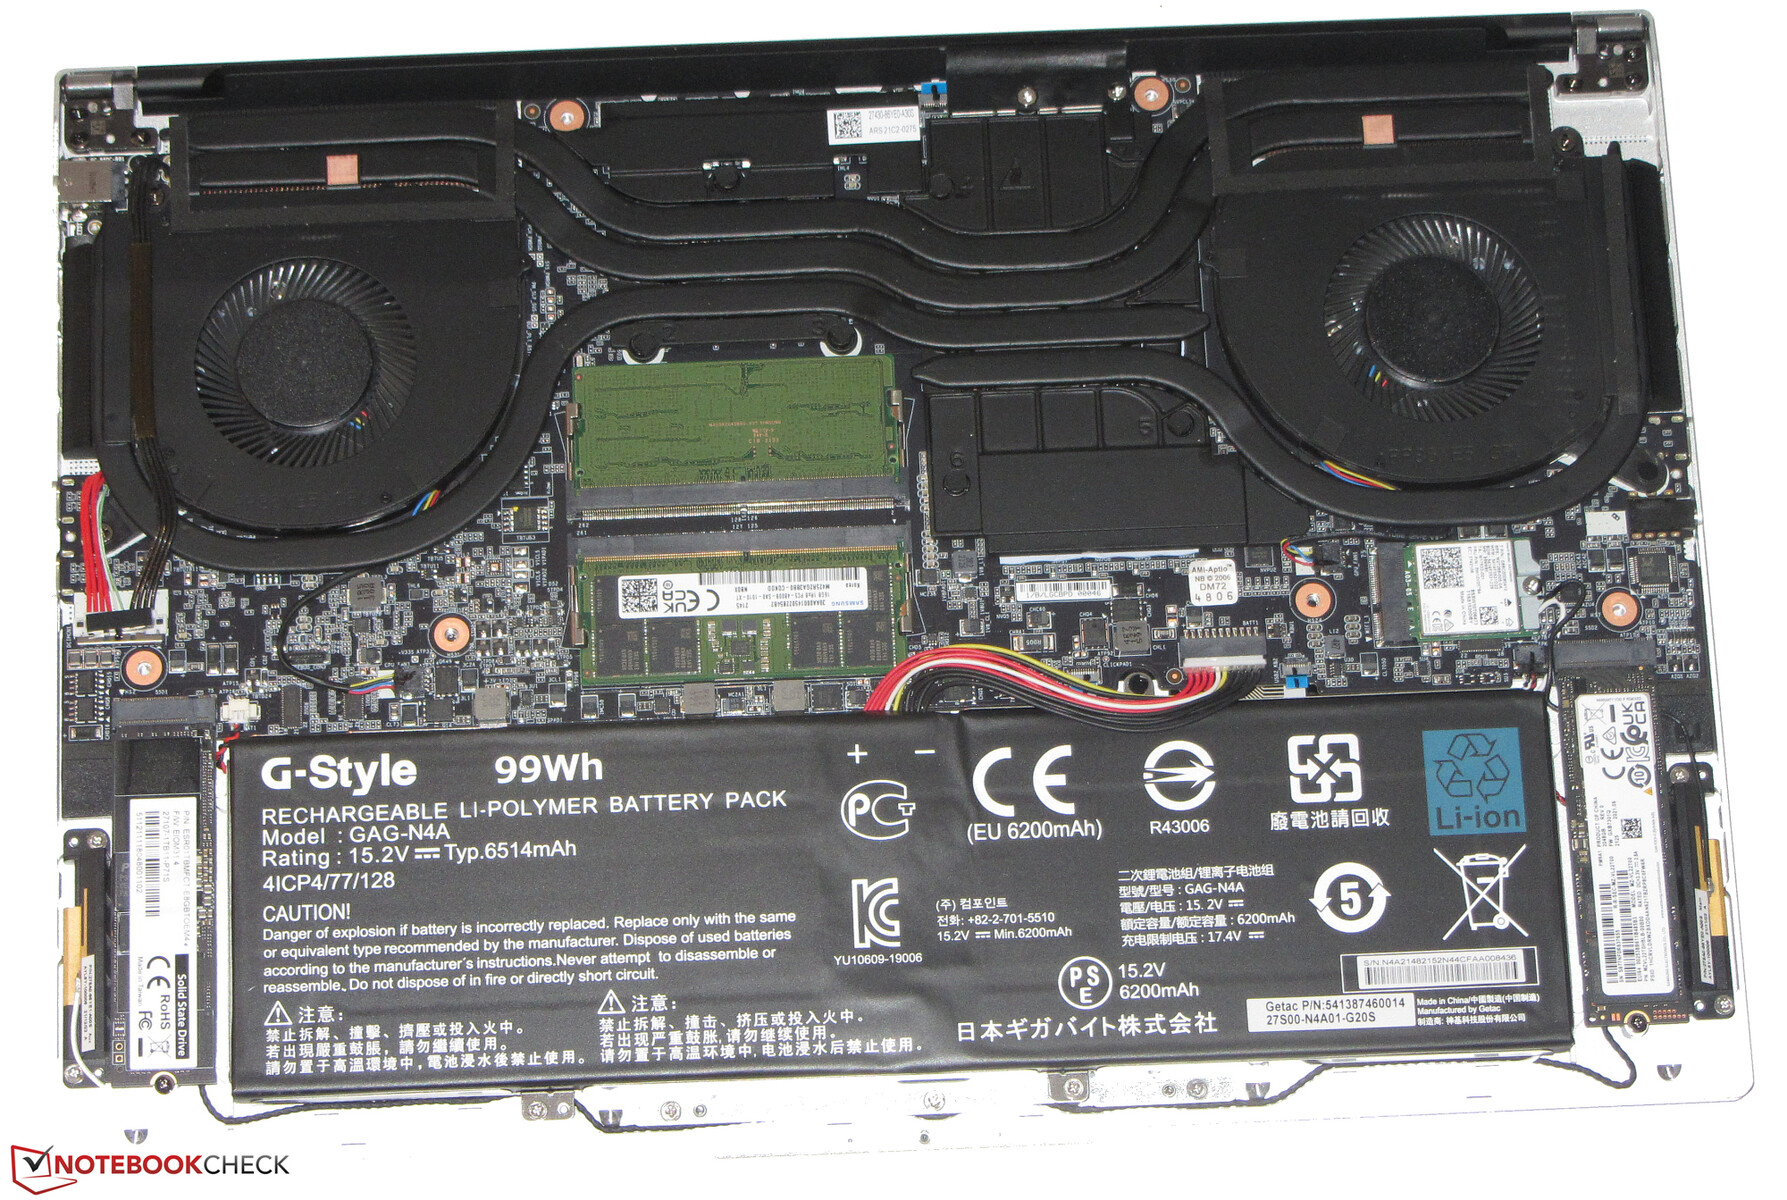
Underhåll
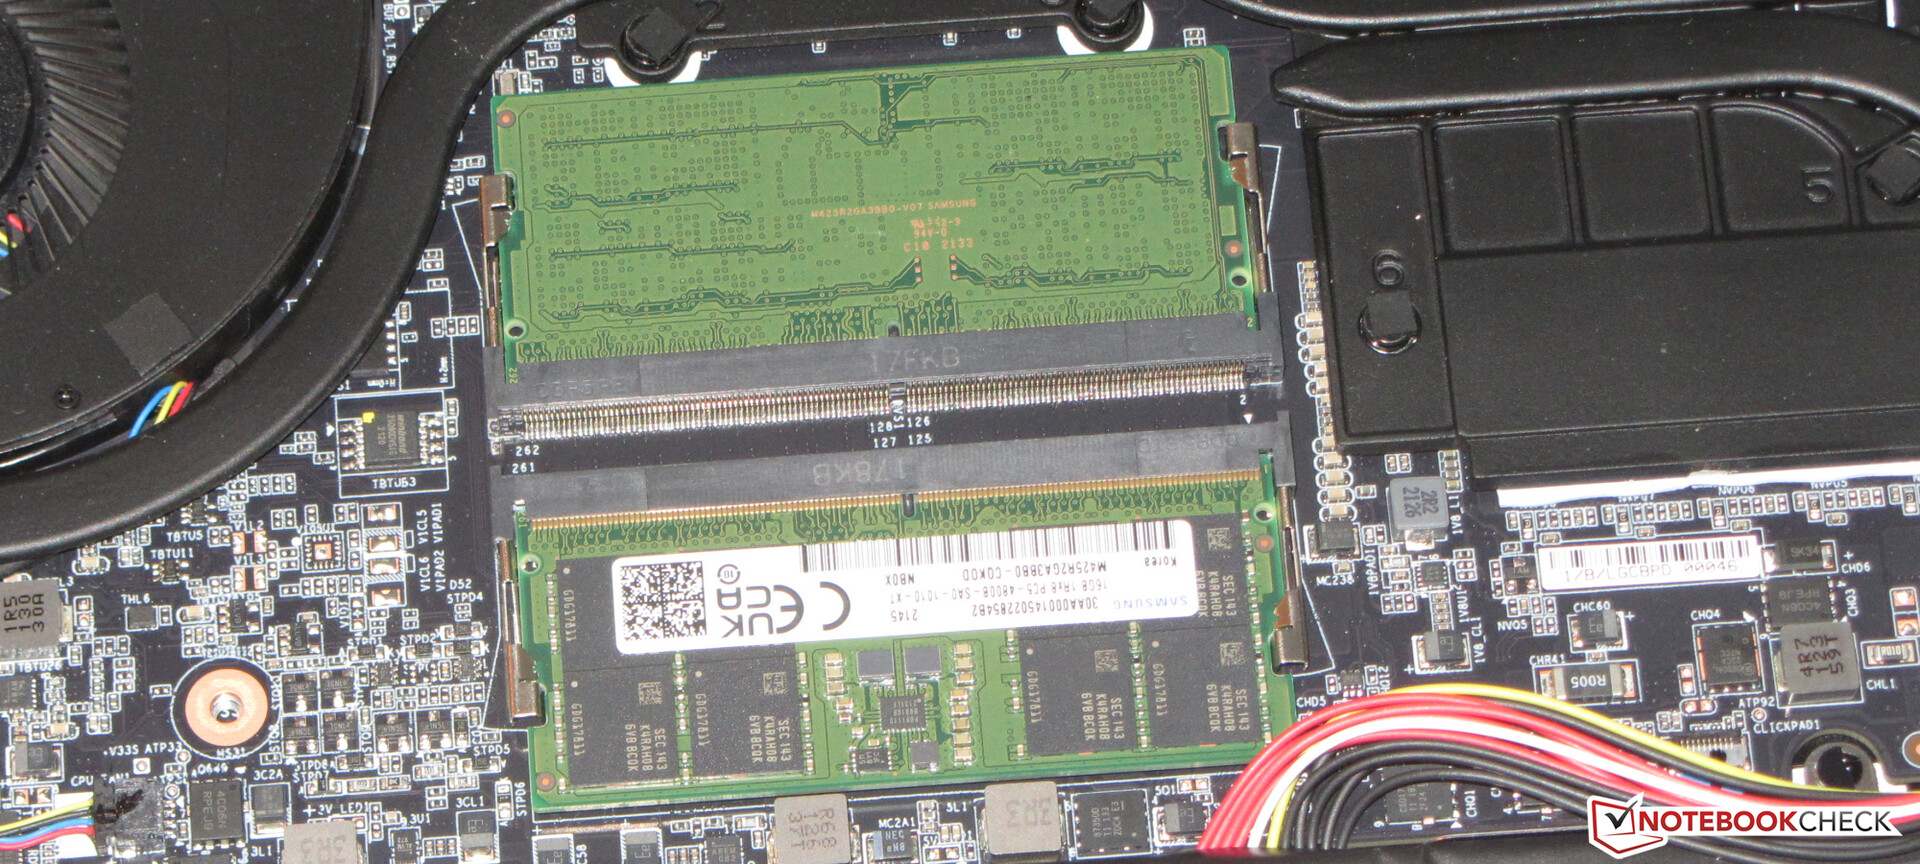
Underhåll och uppgraderingar är relativt enkla att utföra. Efter att ha lossat alla skruvar i botten kan locket lätt tas bort med en liten spruta. När du har tagit bort det har du tillgång till båda SSD-enheterna, Wi-Fi-modemet, RAM-minnet och fläktarna.
Garanti
Som vanligt får europeiska kunder två års begränsad garanti, medan amerikanska kunder återigen får endast 12 månader. Gigabyte erbjuder inga garantiförlängningar.
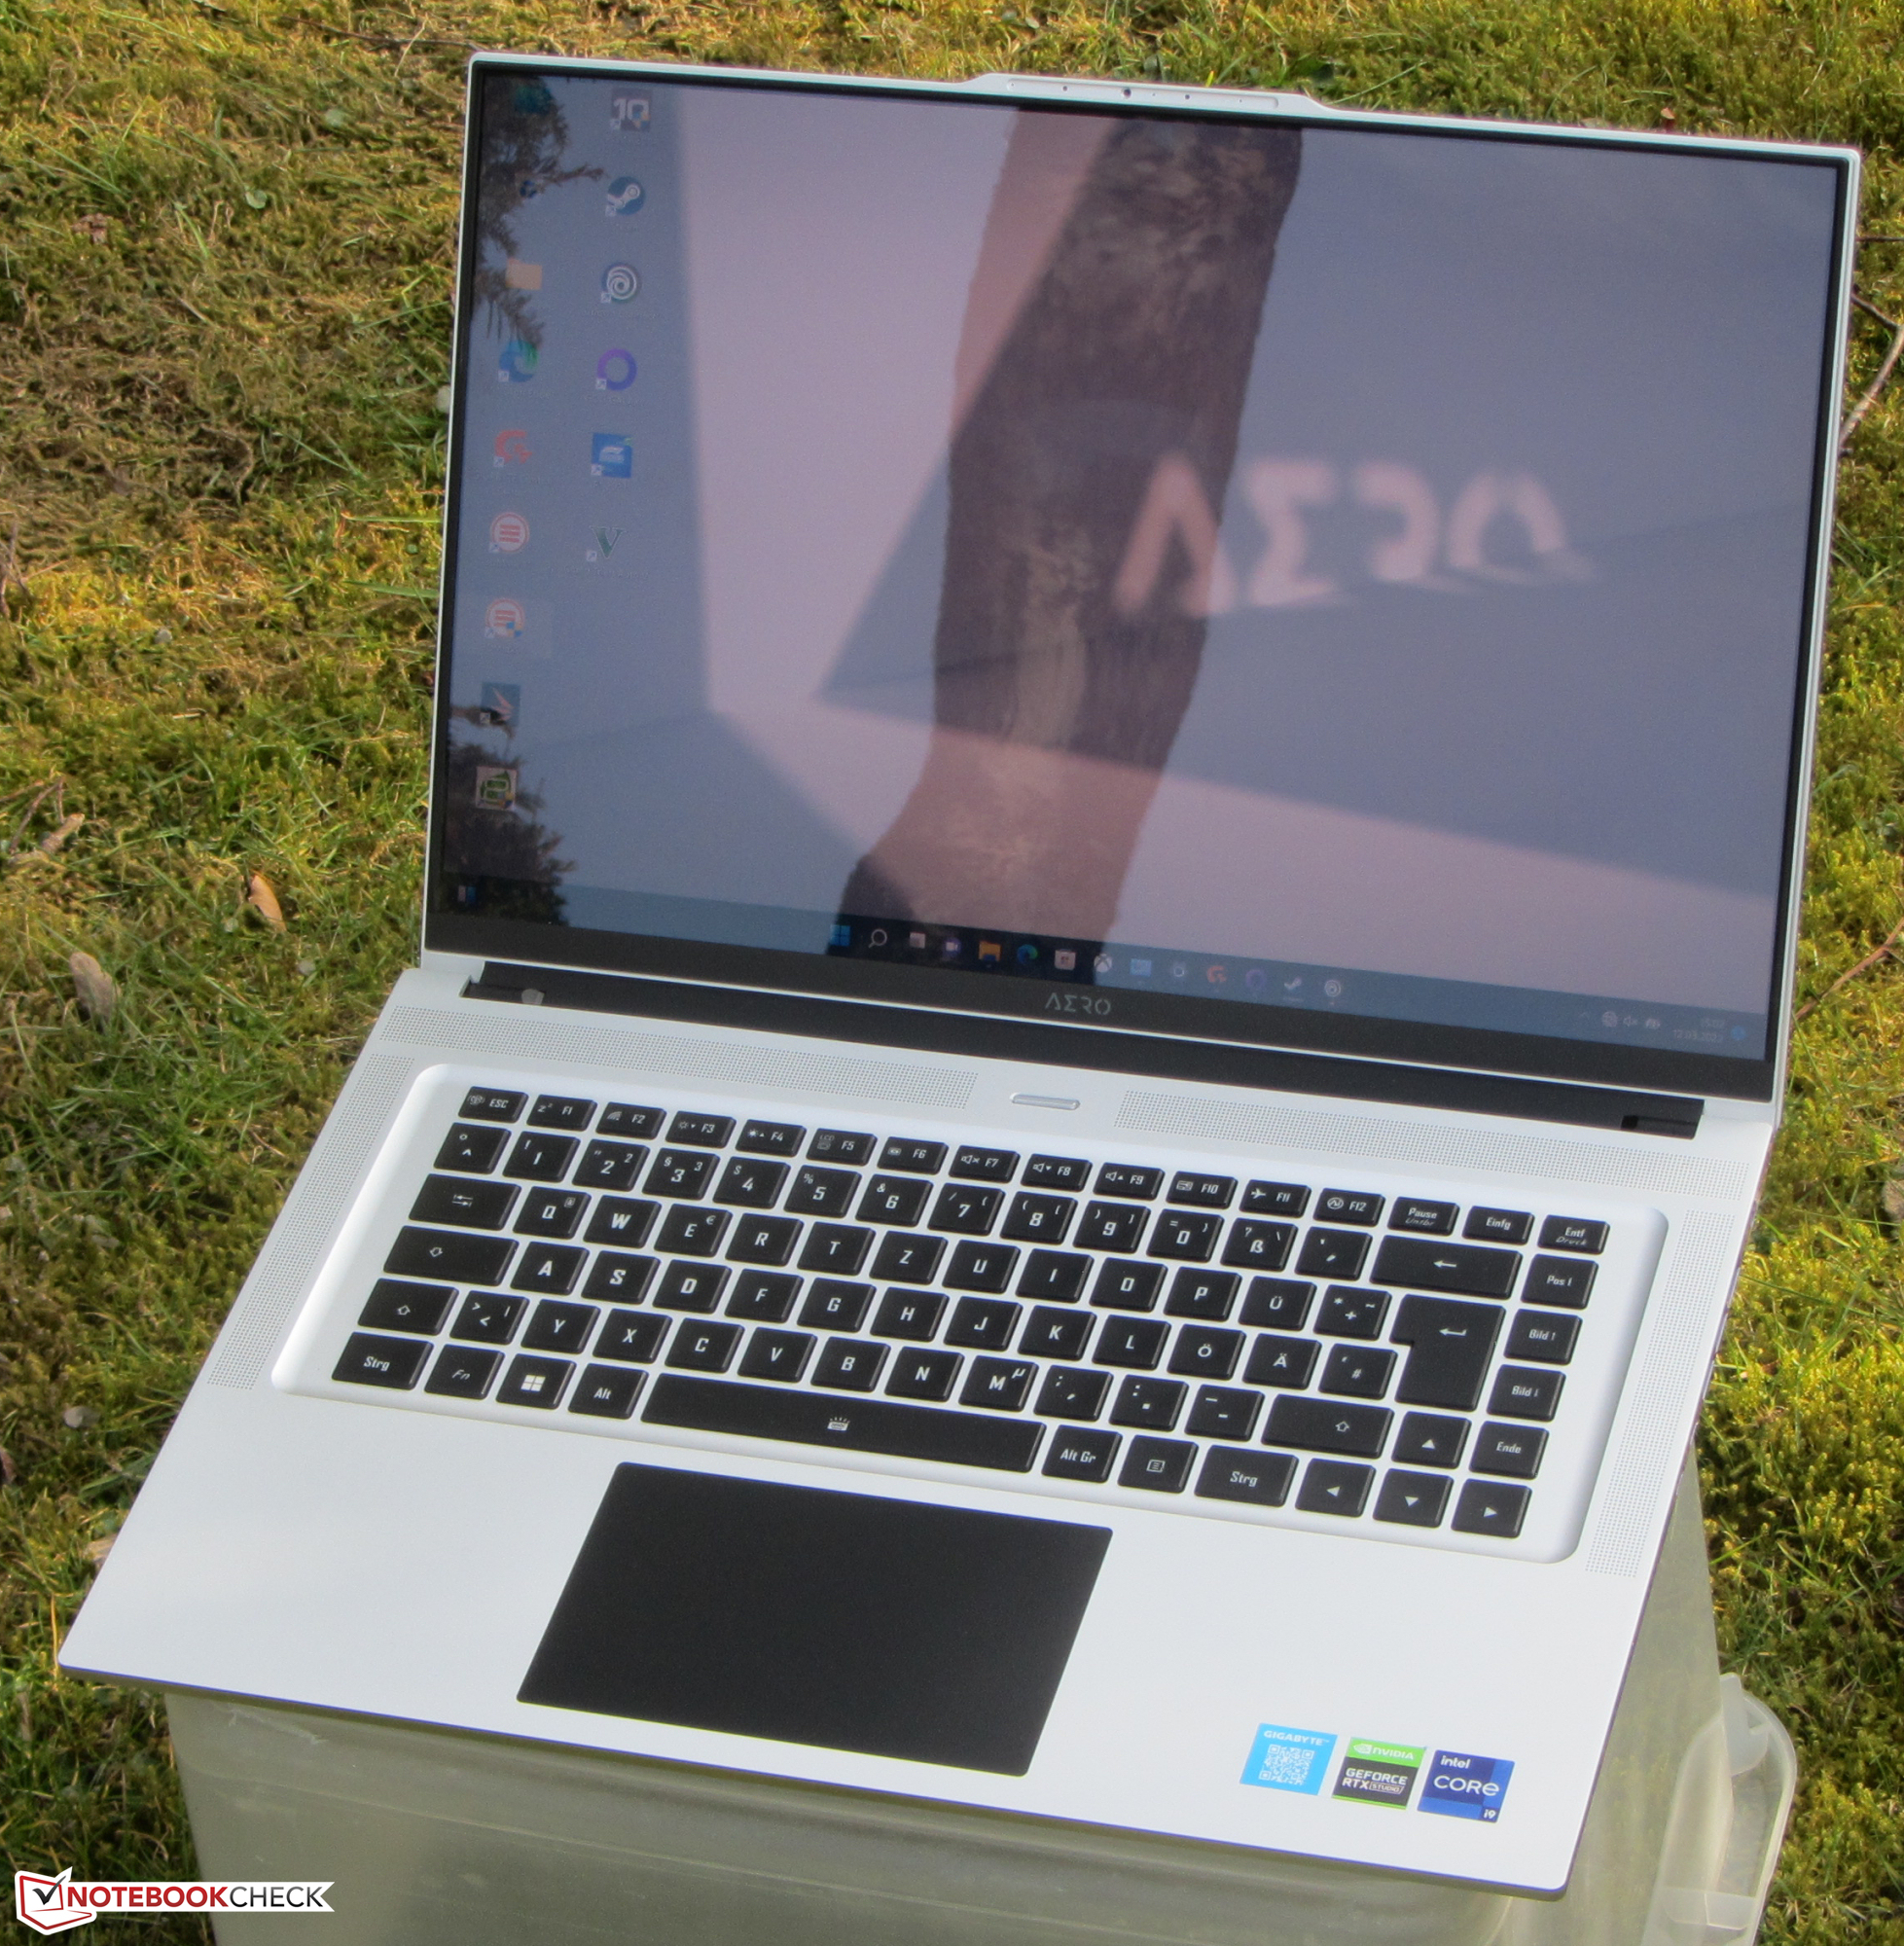
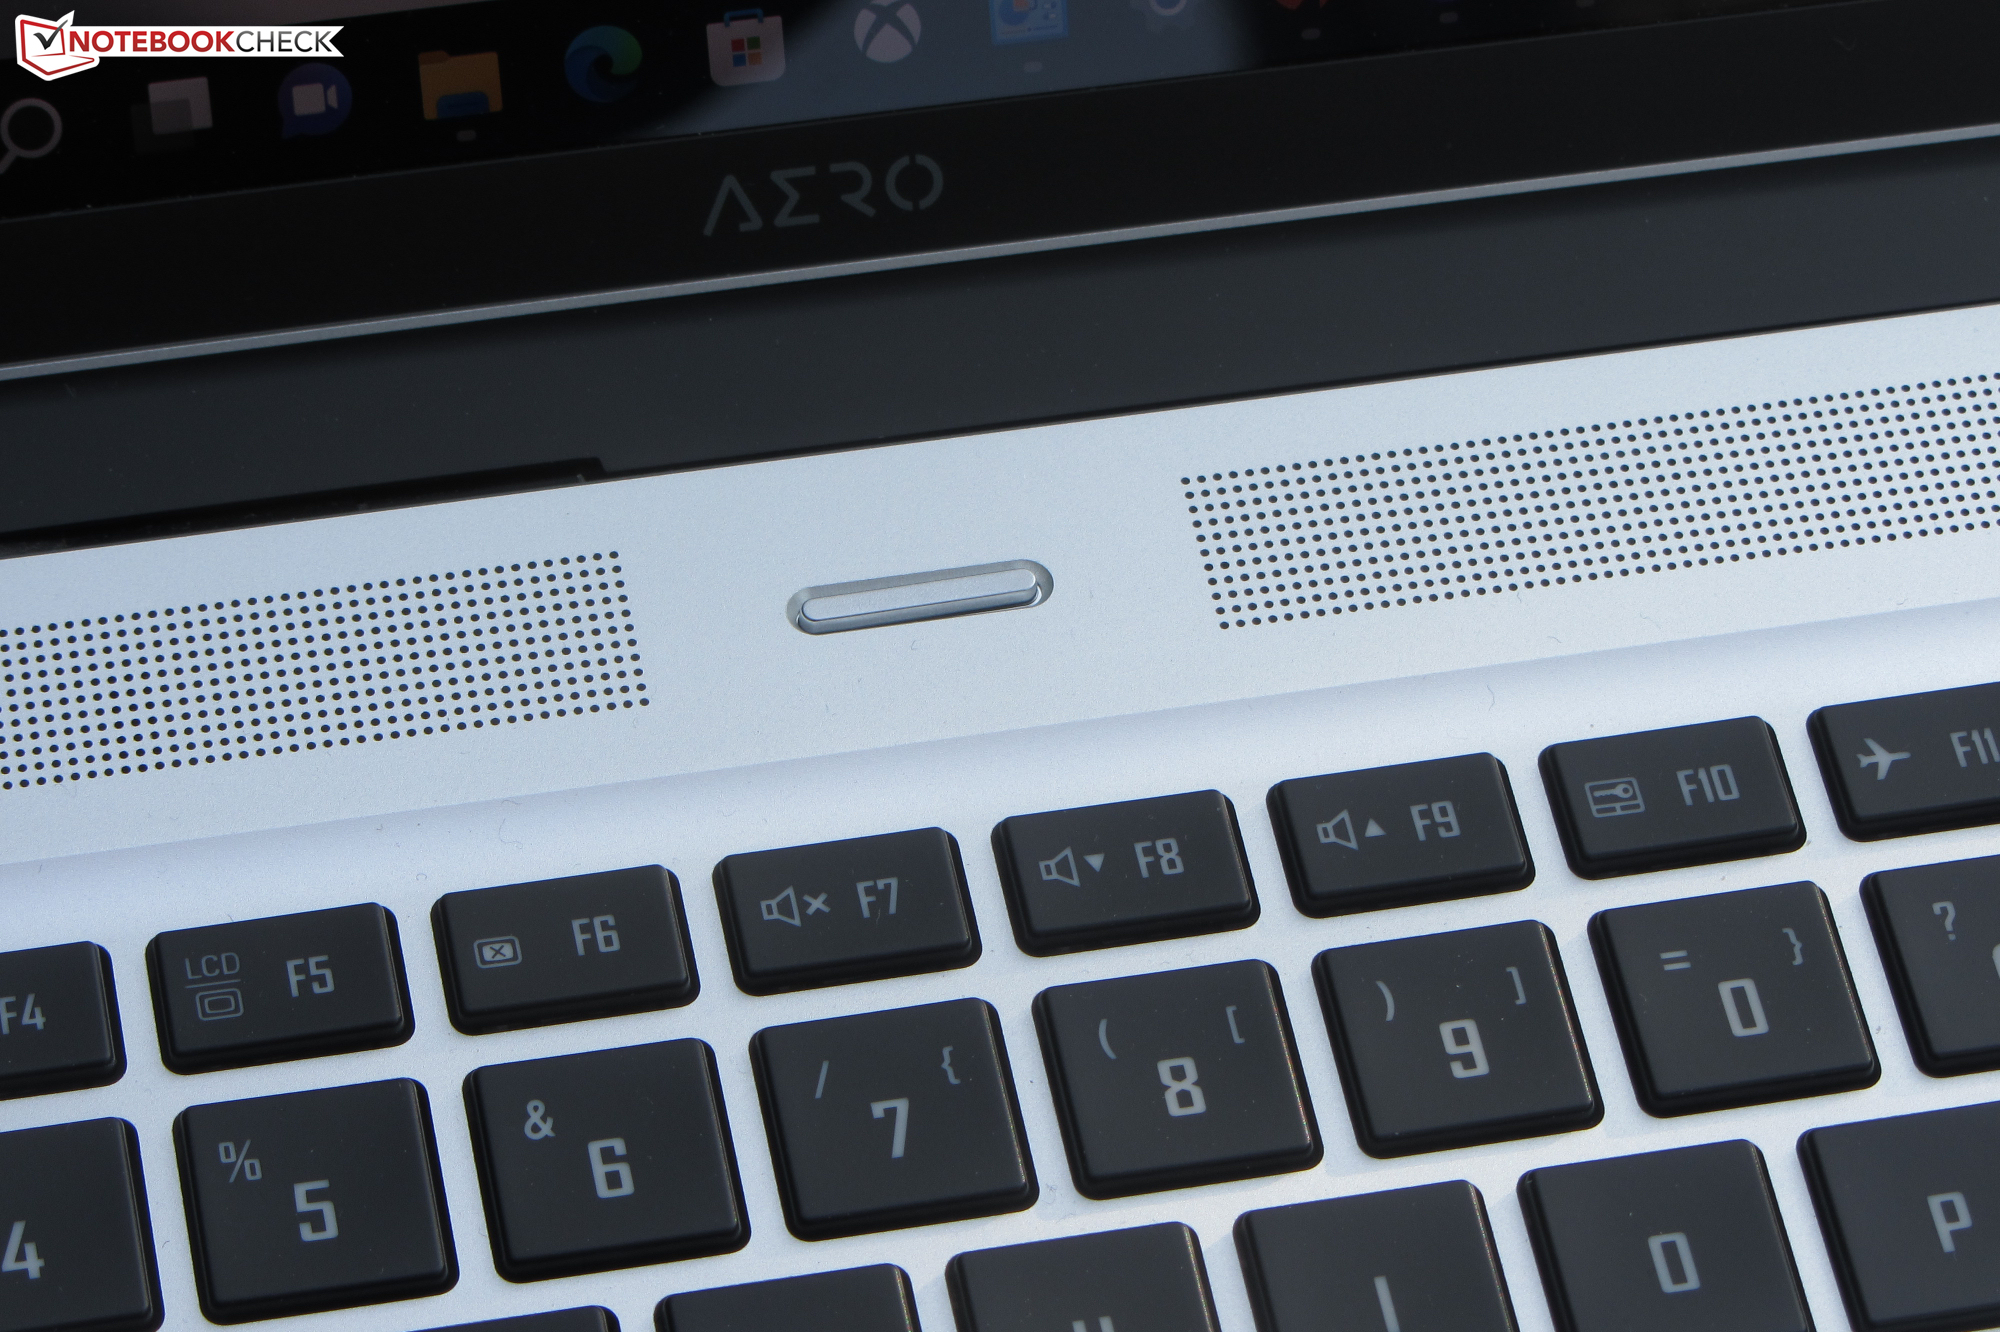
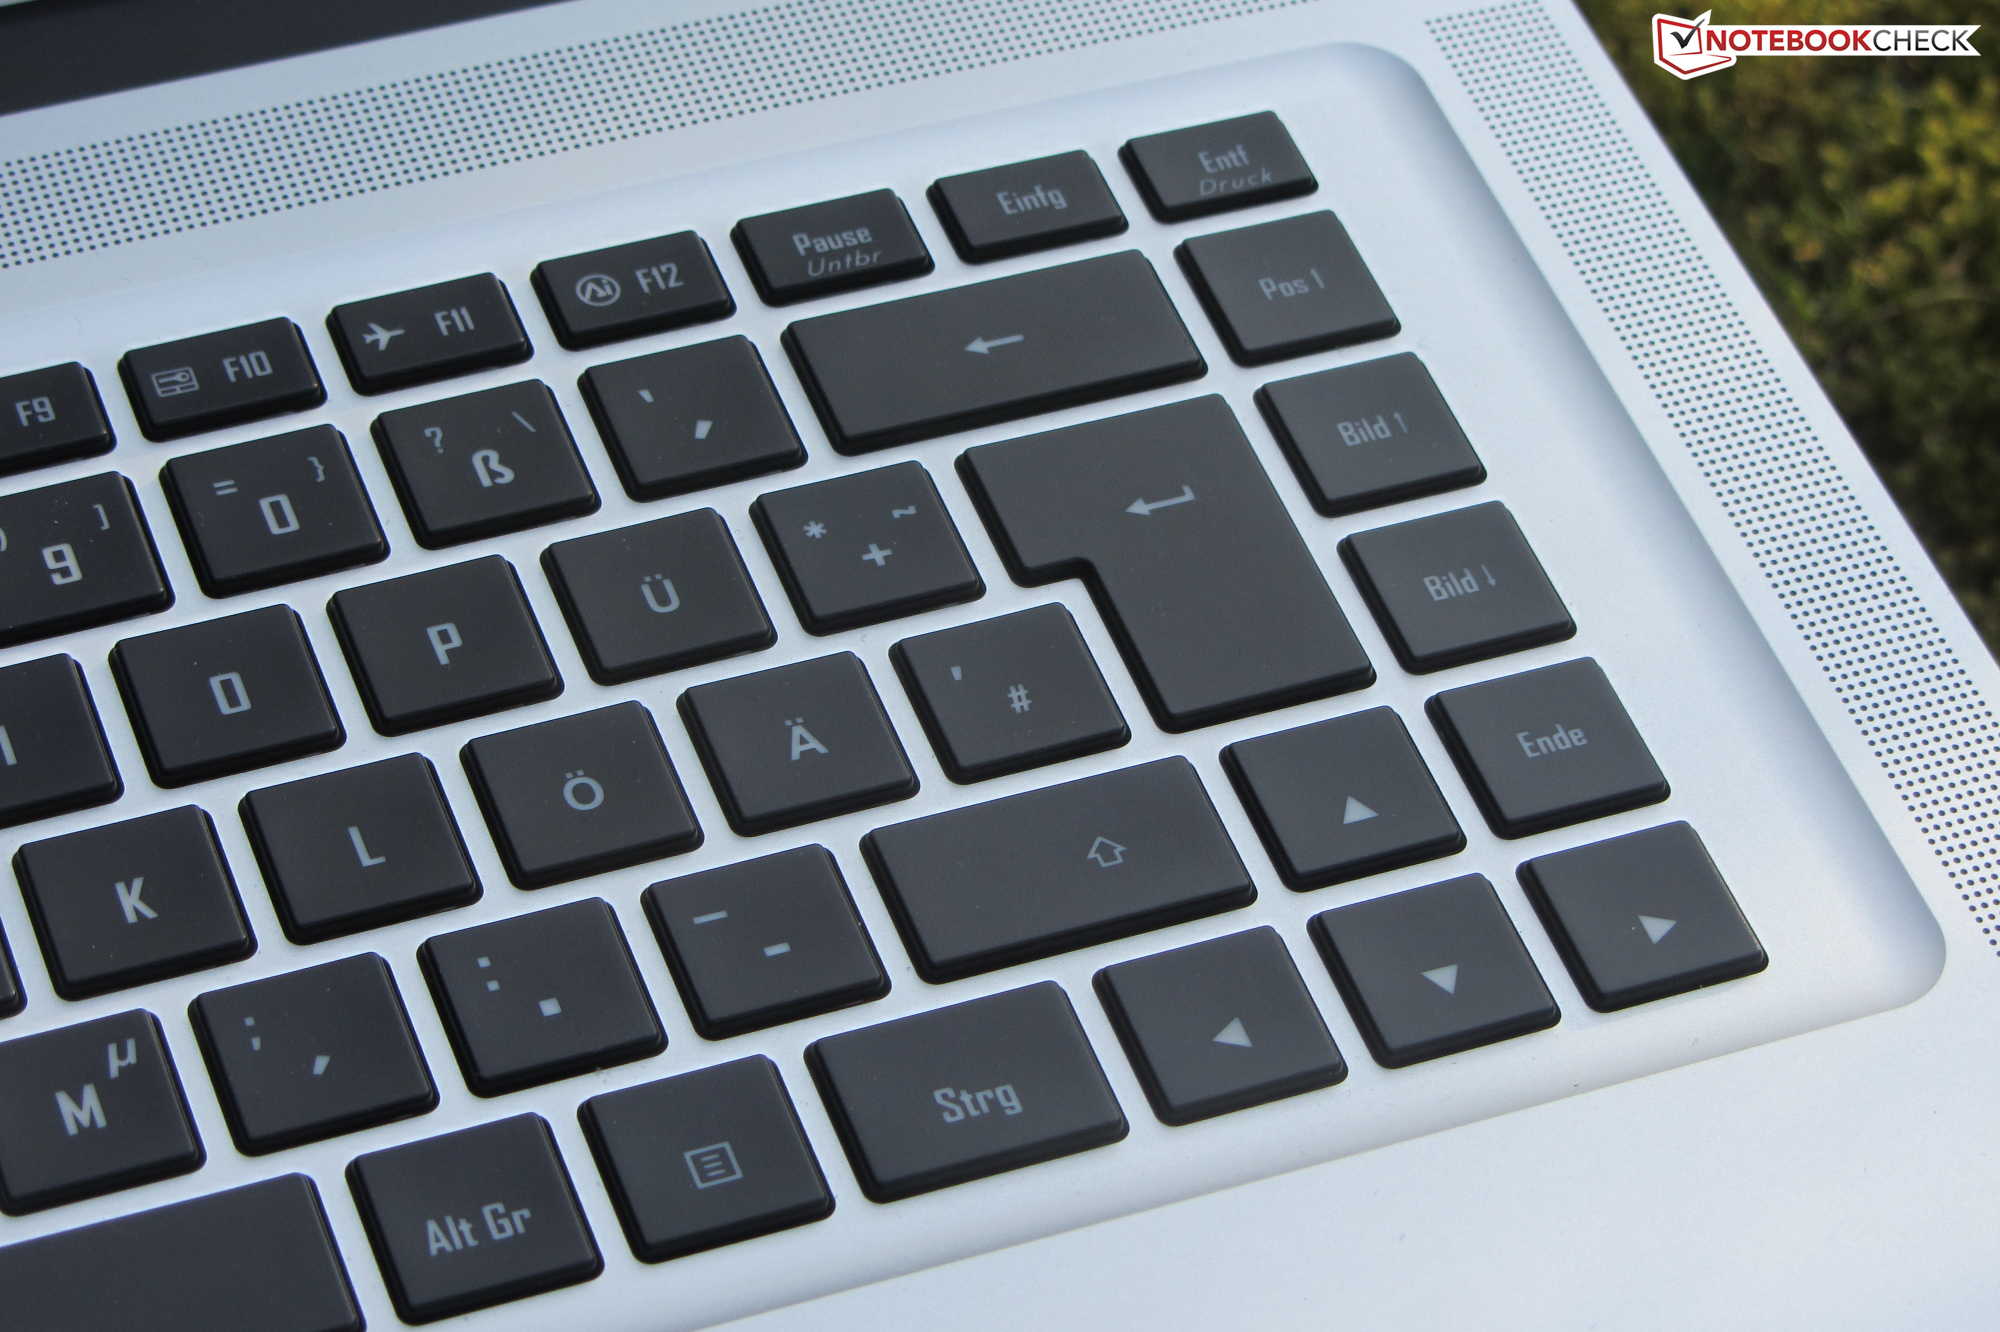
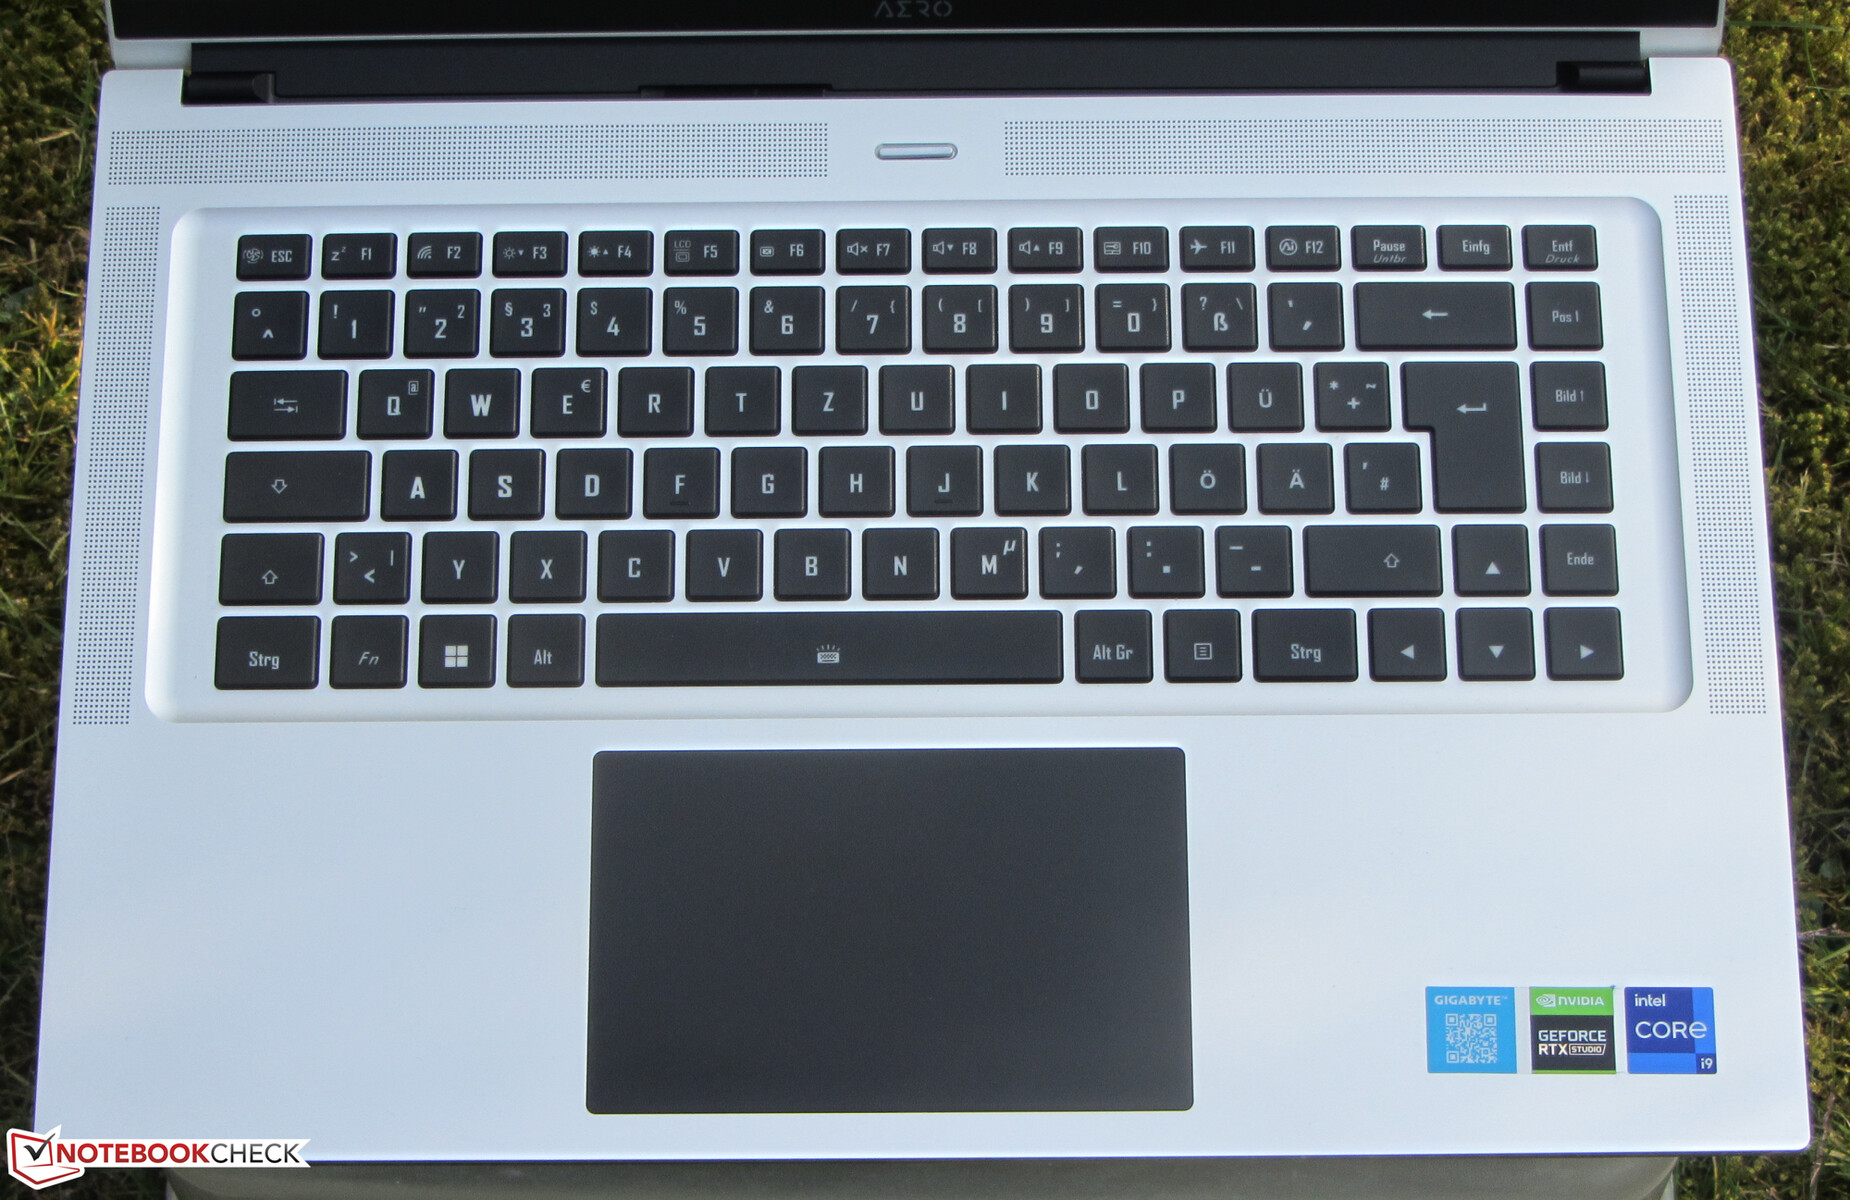
Inmatningsenheter - Gigabyte Laptop med bakgrundsbelyst tangentbord
Tangentbord
Det bakgrundsbelysta chiclet-tangentbordet är ganska smidigt med måttlig tangentrörelse och tydliga accentueringspunkter med hyfsad återkoppling och motstånd. Tangentbordet böjs inte när du skriver. Bakgrundsbelysningen i två steg styrs av en funktionstangent. Allt som allt är det här Gigabyte-tangentbordet hyfsat för vardagligt bruk.
Pekplatta
Multi-touch-touchplattan (12,1 x 7,6 cm/4,8 x 3 tum) är mycket smidig och ger en bra användarvänlighet. Den känner av användarinmatning ända in i kanterna och de integrerade knapparna har en ganska grunt läge med en tydlig accentueringspunkt.
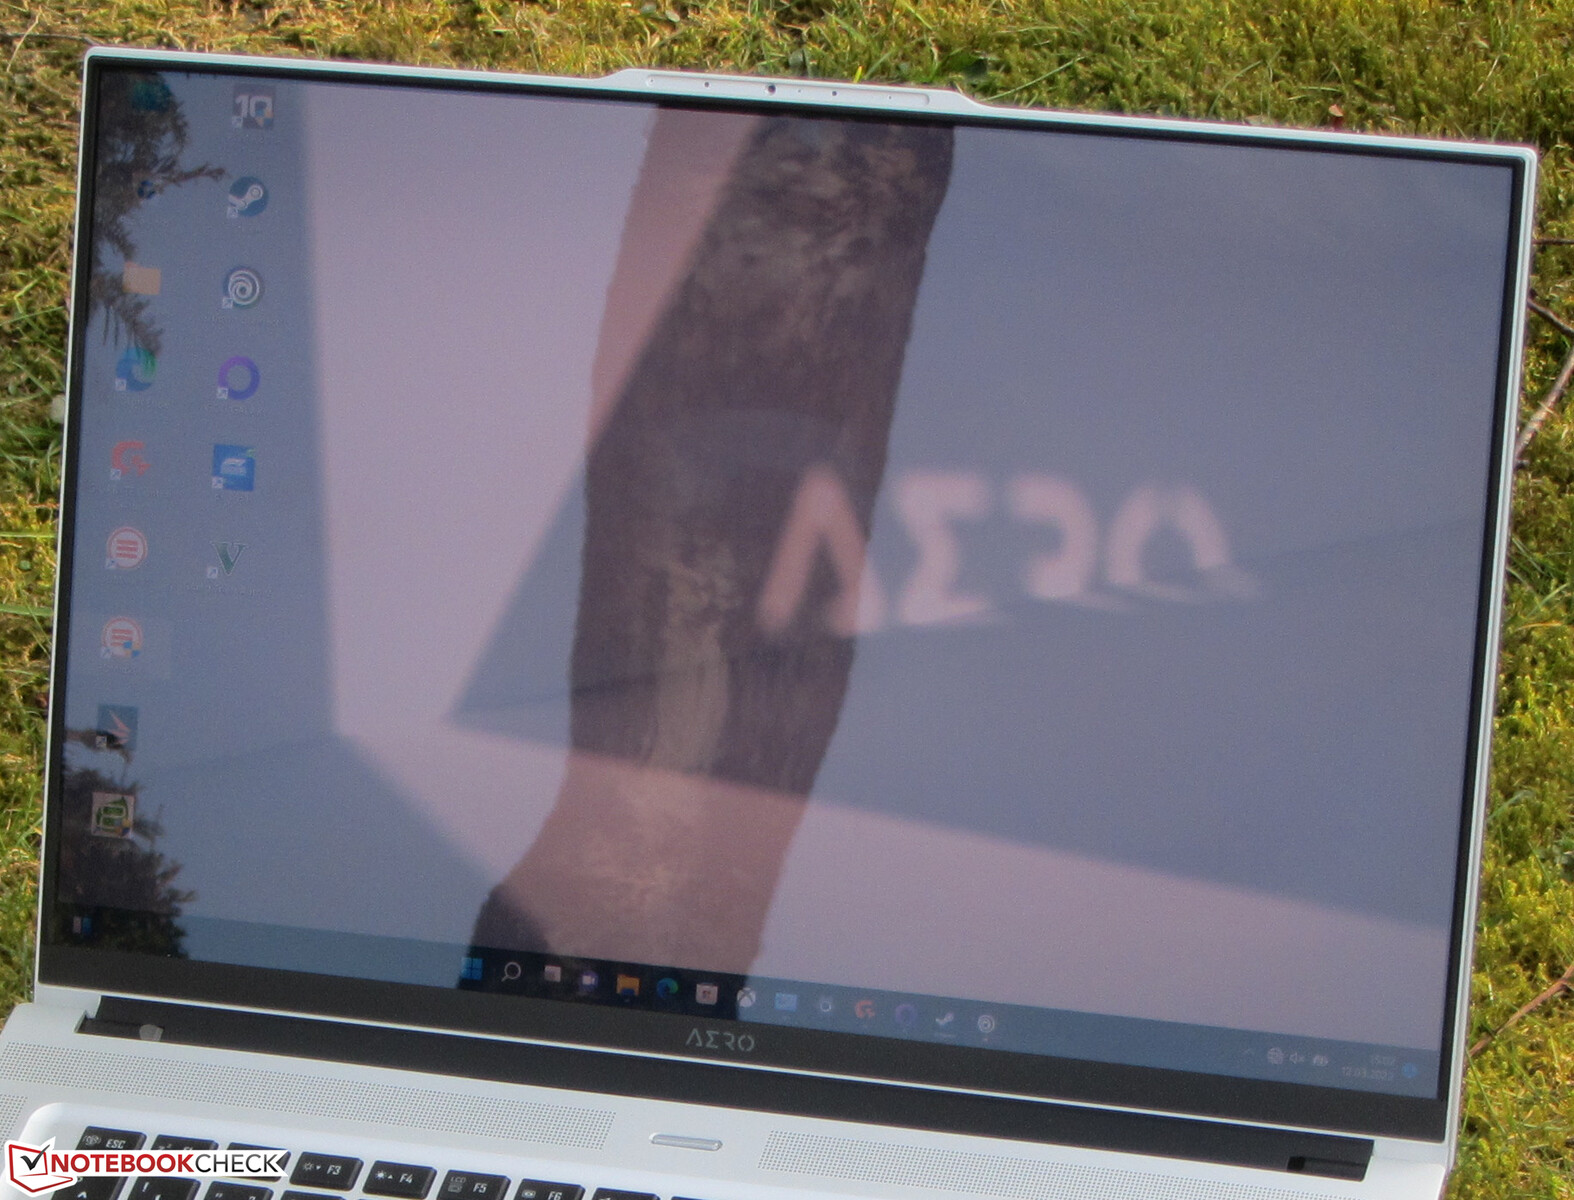
Skärm - Djupa svarta färger tack vare OLED
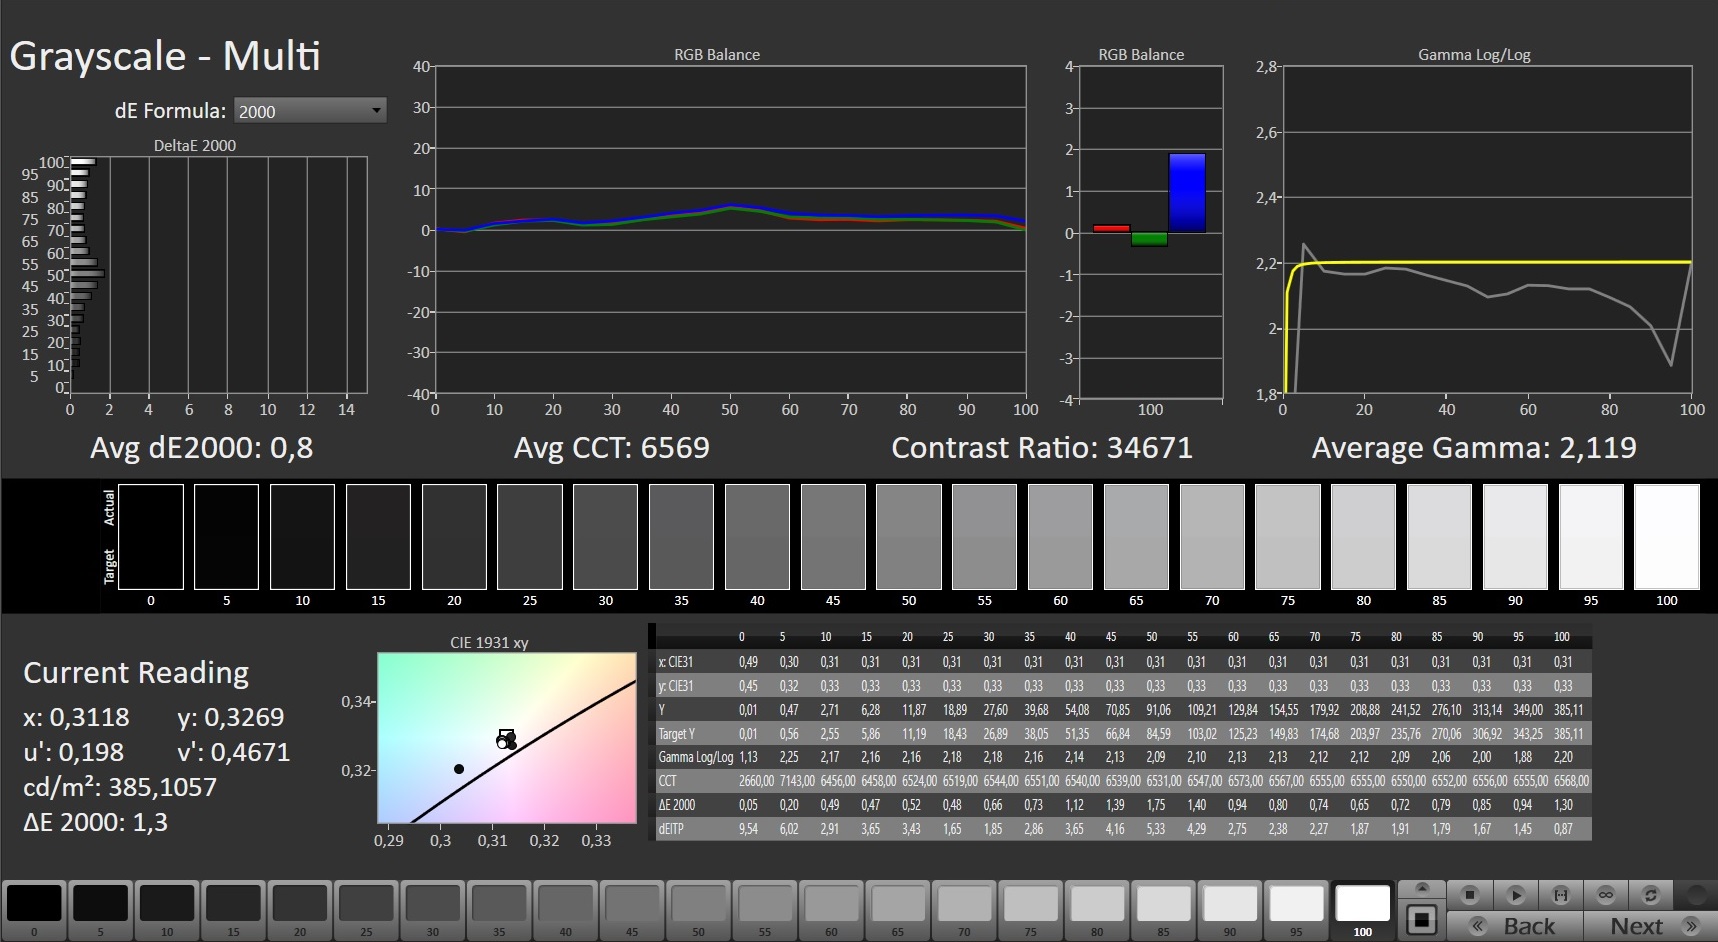
Aero 16 har en reflekterande 16:10 16-tums 4K OLED-skärm (3840 x 2400) med ett utmärkt kontrastförhållande på 36 000:1, en svartnivå på 0,01 och korta svarstider. Dess toppljusstyrka på 367,6 nits är okej men inte alls i närheten av några av konkurrenterna, till exempel Macbook Pro 16.
Vid ljusstyrkor på 58 % och lägre fann vi PWM-flimmer vid 60 Hz, vilket ökade till 240 Hz vid ljusstyrkor på mindre än 26 %. Känsliga användare kan drabbas av huvudvärk och ögonstress på grund av denna låga frekvens.
| |||||||||||||||||||||||||
Distribution av ljusstyrkan: 93 %
Mitt på batteriet: 368 cd/m²
Kontrast: 36800:1 (Svärta: 0.01 cd/m²)
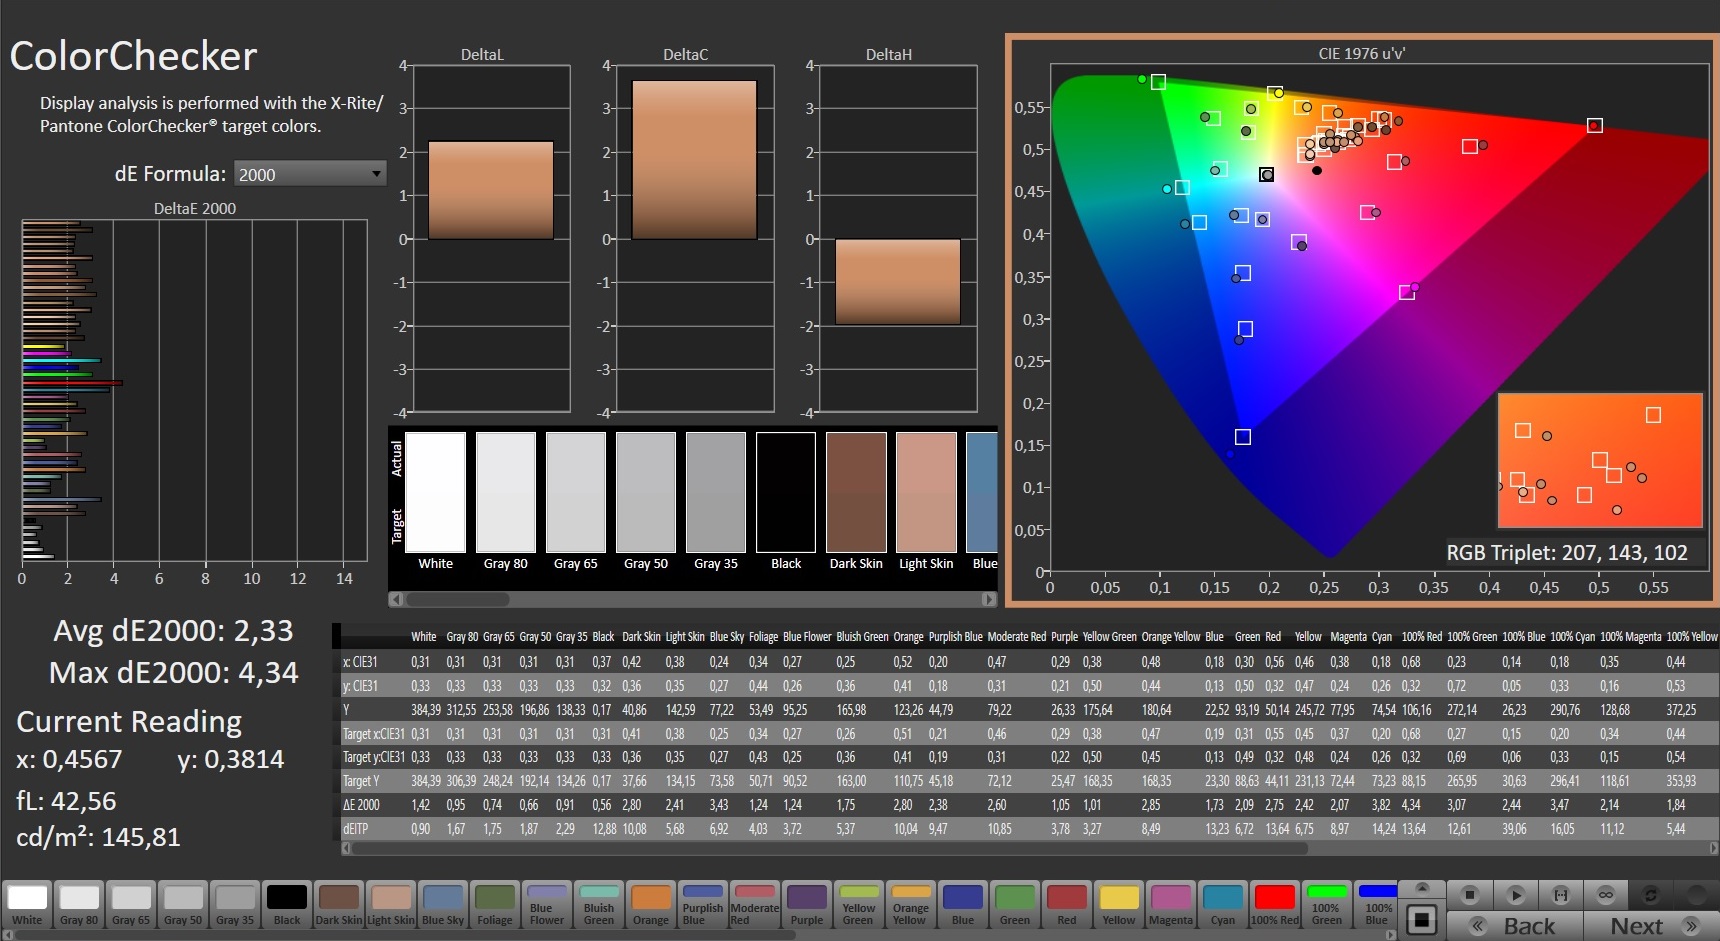
ΔE ColorChecker Calman: 2.33 | ∀{0.5-29.43 Ø4.71}
ΔE Greyscale Calman: 0.8 | ∀{0.09-98 Ø4.96}
Gamma: 2.119
CCT: 6569 K
| Gigabyte Aero 16 YE5 Samsung SDC416B, AMOLED, 3840x2400, 16" | Apple MacBook Pro 16 2021 M1 Max Mini-LED, 3456x2234, 16.2" | HP ZBook Studio 15 G8 SDC4145, OLED, 3840x2160, 15.6" | Schenker XMG Pro 15 (Late 2021) Samsung ATNA56WR14-0, OLED, 3840x2160, 15.6" | Razer Blade 15 2022 Sharp LQ156T1JW03, IPS, 2560x1440, 15.6" | Lenovo ThinkPad X1 Extreme G4-20Y5CTO1WW (3050 Ti) LP160UQ1-SPB1, IPS LED, 3840x2400, 16" | |
|---|---|---|---|---|---|---|
| Display | ||||||
| Display P3 Coverage (%) | 99.9 | 81.2 | 99.1 | 84.3 | ||
| sRGB Coverage (%) | 100 | 97.7 | 99.9 | 98.3 | ||
| AdobeRGB 1998 Coverage (%) | 95.3 | 89.1 | 86.8 | 97.8 | ||
| Response Times | -10% | -7% | -490% | -2200% | ||
| Response Time Grey 50% / Grey 80% * (ms) | 2.4 ? | 2.4 ? -0% | 3.2 ? -33% | 14.4 ? -500% | 60 ? -2400% | |
| Response Time Black / White * (ms) | 2 ? | 2.4 ? -20% | 1.6 ? 20% | 11.6 ? -480% | 42 ? -2000% | |
| PWM Frequency (Hz) | 60 ? | 240.4 ? | 60 ? | |||
| Screen | -21% | -70% | -58% | -328% | -587% | |
| Brightness middle (cd/m²) | 368 | 507 38% | 379.6 3% | 443 20% | 286 -22% | 639 74% |
| Brightness (cd/m²) | 368 | 494 34% | 380 3% | 434 18% | 271 -26% | 612 66% |
| Brightness Distribution (%) | 93 | 96 3% | 95 2% | 94 1% | 89 -4% | 84 -10% |
| Black Level * (cd/m²) | 0.01 | 0.02 -100% | 0.02 -100% | 0.25 -2400% | 0.47 -4600% | |
| Contrast (:1) | 36800 | 25350 -31% | 22150 -40% | 1144 -97% | 1360 -96% | |
| Colorchecker dE 2000 * | 2.33 | 1.4 40% | 5.15 -121% | 3.73 -60% | 2.74 -18% | 2.2 6% |
| Colorchecker dE 2000 max. * | 4.34 | 2.8 35% | 7.79 -79% | 8.12 -87% | 5.21 -20% | 5.3 -22% |
| Greyscale dE 2000 * | 0.8 | 2.3 -187% | 2.6 -225% | 2.5 -213% | 1.1 -38% | 1.7 -113% |
| Gamma | 2.119 104% | 2.27 97% | 1.99 111% | 2.001 110% | 2.2 100% | 2.31 95% |
| CCT | 6569 99% | 6792 96% | 6166 105% | 6522 100% | 6408 101% | 6390 102% |
| Colorchecker dE 2000 calibrated * | 3.1 | 2.52 | 1.4 | |||
| Totalt genomsnitt (program/inställningar) | -21% /
-21% | -40% /
-55% | -33% /
-47% | -409% /
-361% | -1394% /
-910% |
* ... mindre är bättre
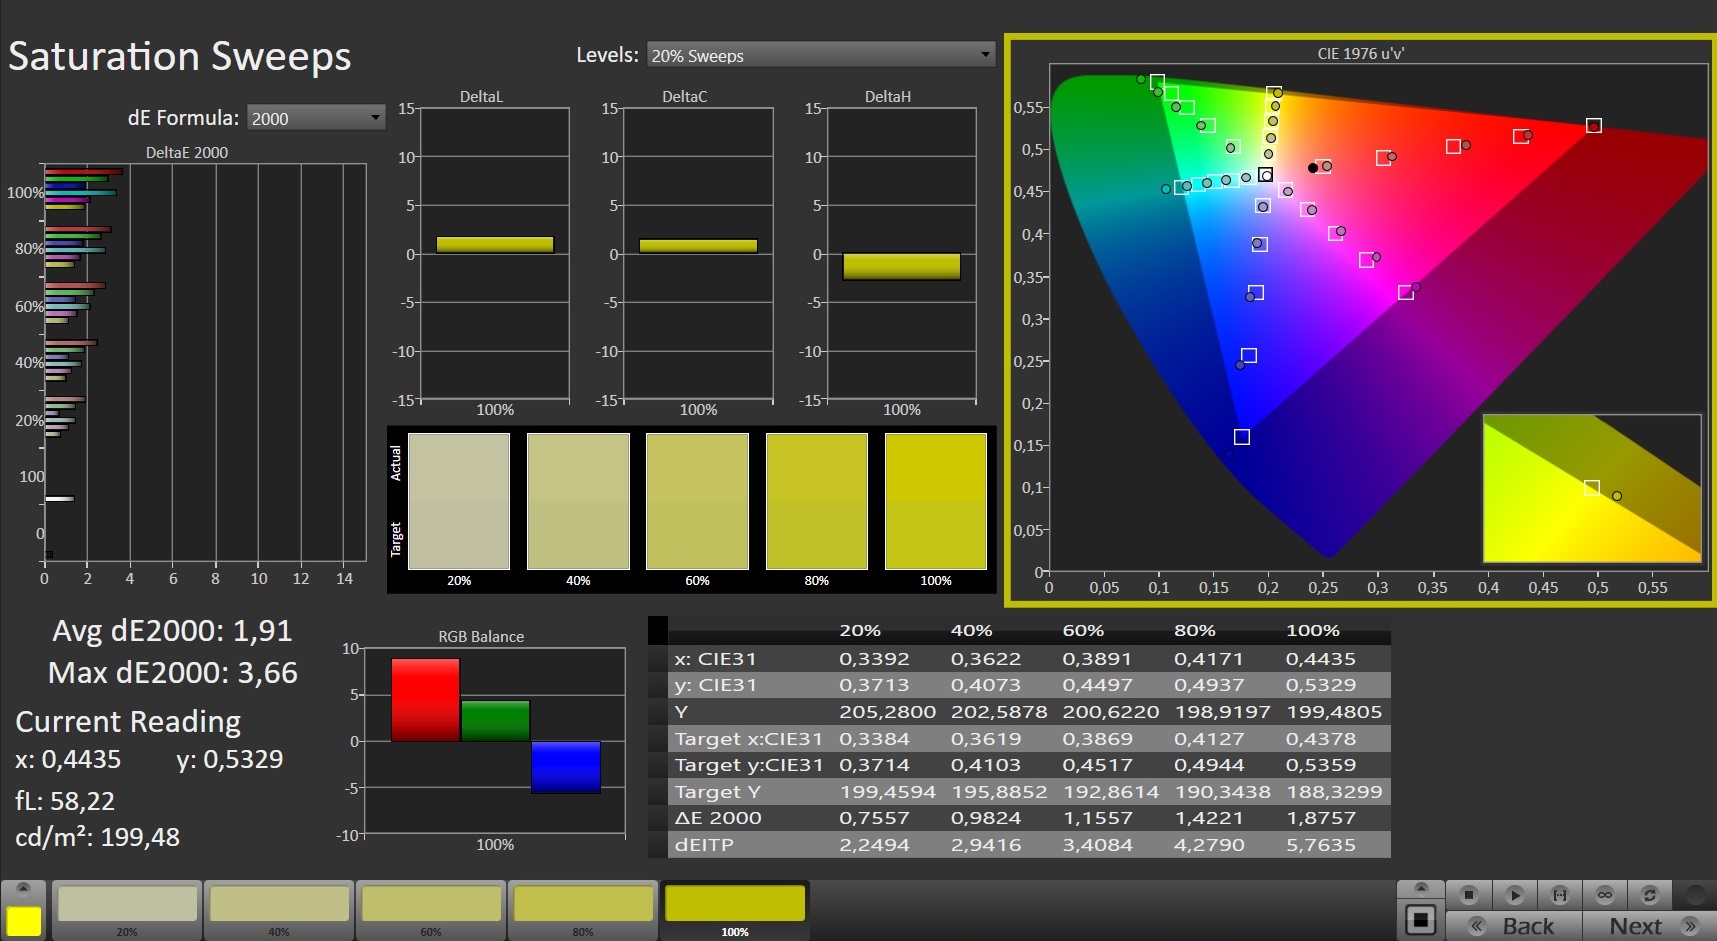
Skärmen är X-Rite Pantone-certifierad för att säkerställa en naturlig färgrepresentation, och som väntat var färgavvikelserna mycket små och omärkliga efter att den tagits i bruk. Vi hittade inte heller några tecken på en blå nyans. Vid den här tidpunkten under granskningen brukar vi presentera och kommentera våra avläsningar av färgrymdstäckningen. Vi har dock bestämt oss för att hålla tillbaka dessa för tillfället eftersom de skiljde sig oerhört mycket från Gigabytes officiella specifikationer och vi kan inte utesluta problem med vår testutrustning i nuläget.
Visa svarstider
| ↔ Svarstid svart till vitt | ||
|---|---|---|
| 2 ms ... stiga ↗ och falla ↘ kombinerat | ↗ 1 ms stiga | 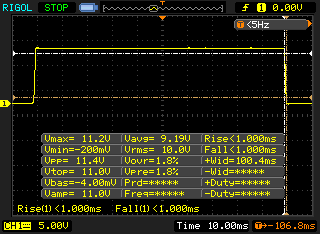 |
| ↘ 1 ms hösten | ||
| Skärmen visar väldigt snabba svarsfrekvenser i våra tester och borde vara mycket väl lämpad för fartfyllt spel. I jämförelse sträcker sig alla testade enheter från 0.1 (minst) till 240 (maximalt) ms. » 11 % av alla enheter är bättre. Det betyder att den uppmätta svarstiden är bättre än genomsnittet av alla testade enheter (19.8 ms). | ||
| ↔ Svarstid 50 % grått till 80 % grått | ||
| 2.4 ms ... stiga ↗ och falla ↘ kombinerat | ↗ 1.2 ms stiga | 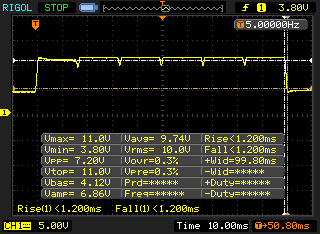 |
| ↘ 1.2 ms hösten | ||
| Skärmen visar väldigt snabba svarsfrekvenser i våra tester och borde vara mycket väl lämpad för fartfyllt spel. I jämförelse sträcker sig alla testade enheter från 0.165 (minst) till 636 (maximalt) ms. » 11 % av alla enheter är bättre. Det betyder att den uppmätta svarstiden är bättre än genomsnittet av alla testade enheter (31 ms). | ||
Skärmflimmer / PWM (Puls-Width Modulation)
| Skärmflimmer / PWM upptäckt | 60 Hz | ≤ 58 % ljusstyrka inställning | 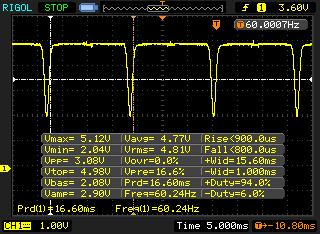 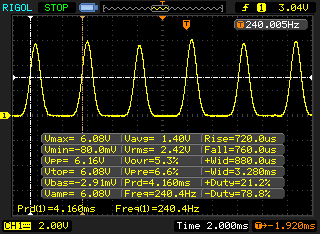 |
Displayens bakgrundsbelysning flimrar vid 60 Hz (i värsta fall, t.ex. med PWM) Flimrande upptäckt vid en ljusstyrkeinställning på 58 % och lägre. Det ska inte finnas något flimmer eller PWM över denna ljusstyrkeinställning. Frekvensen för 60 Hz är mycket låg, så flimmer kan orsaka ögon- och huvudvärk efter långvarig användning. Som jämförelse: 52 % av alla testade enheter använder inte PWM för att dämpa skärmen. Om PWM upptäcktes mättes ett medelvärde av 7757 (minst: 5 - maximum: 343500) Hz. | |||
Panelen har mycket breda betraktningsvinklar och är lätt att läsa från alla positioner. Utomhus fann vi att den reflekterande beläggningen försämrade användbarheten drastiskt.

Prestanda - En Gigabyte bärbar dator med topprestanda
Gigabyte Aero 16 är en kraftfull kompakt 16-tums bärbar dator med mycket mångsidig användbarhet på alla områden. Dess GeForce RTX Studio-certifiering garanterar hög prestanda, optimerade drivrutiner, god programvarukompatibilitet och en hög färgrymdstäckning.
Testvillkor
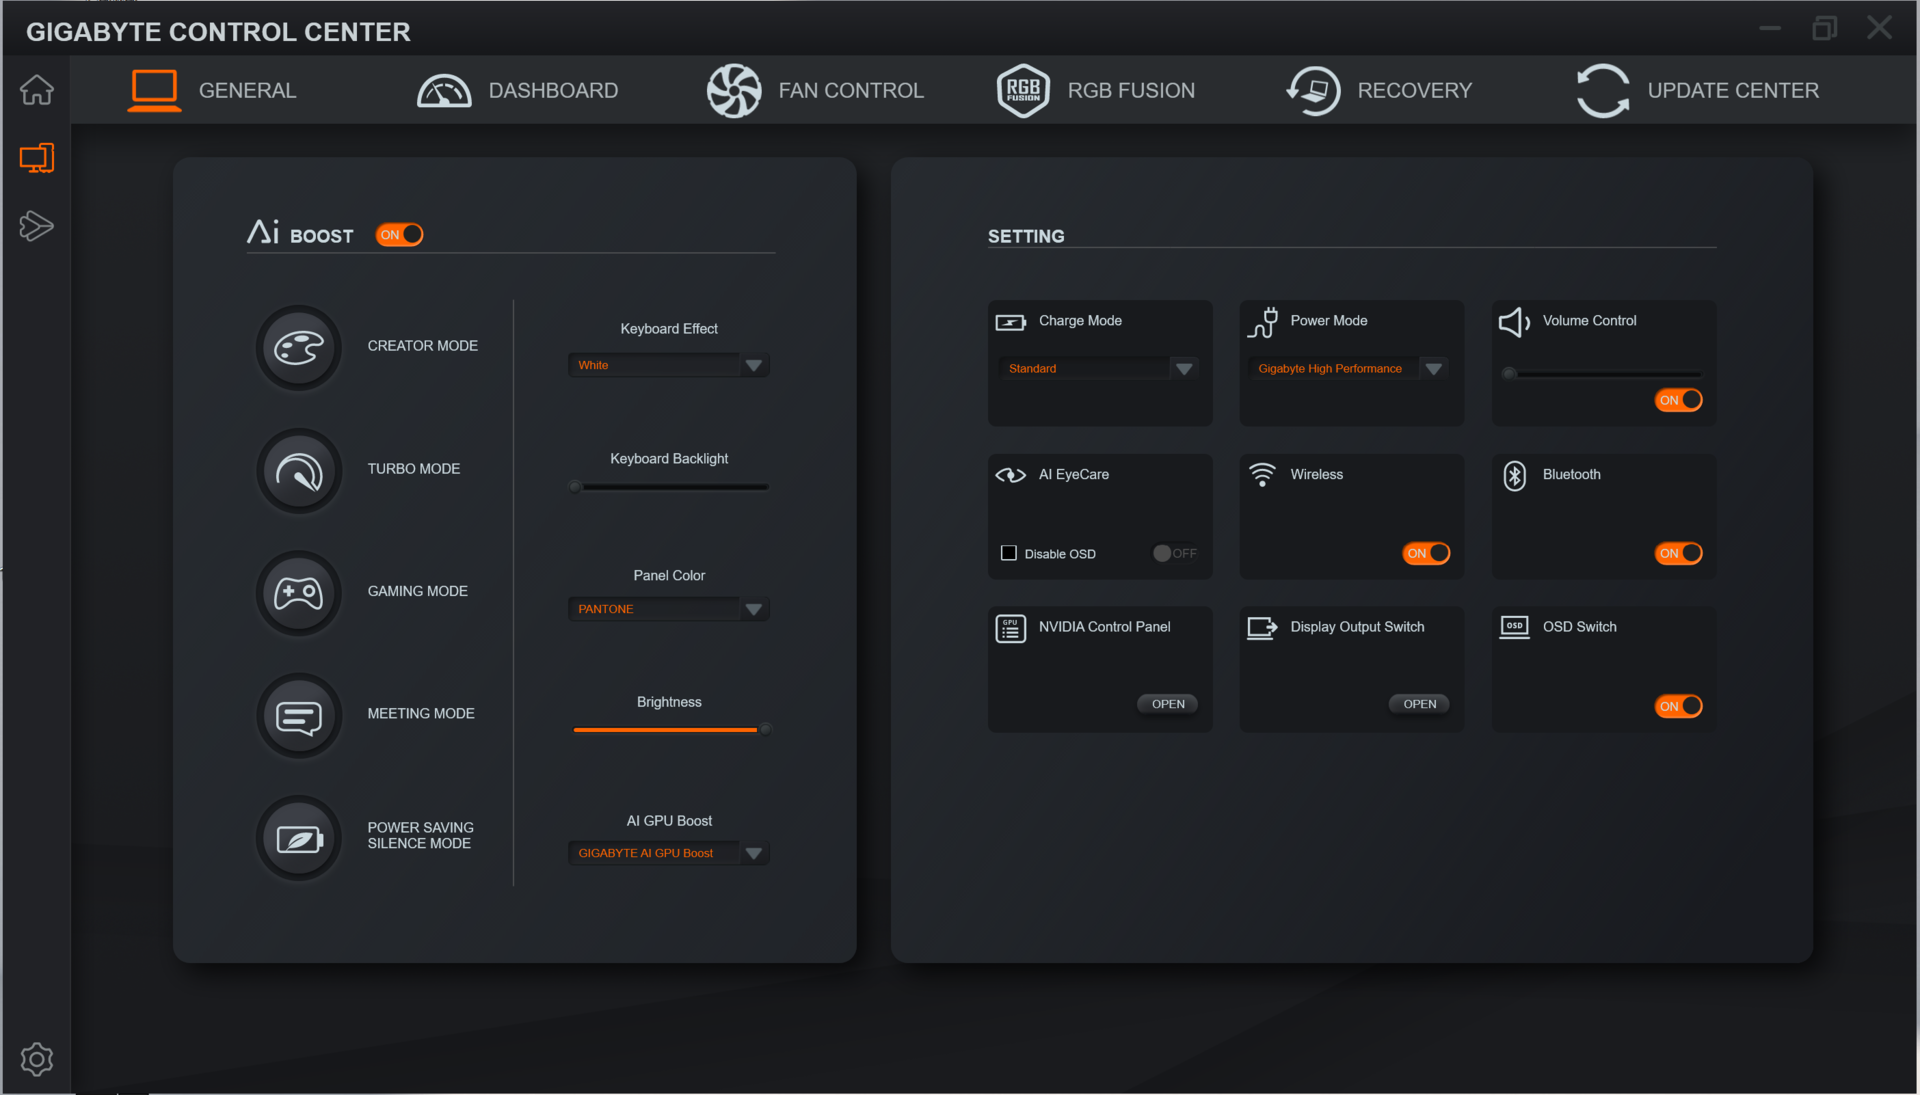
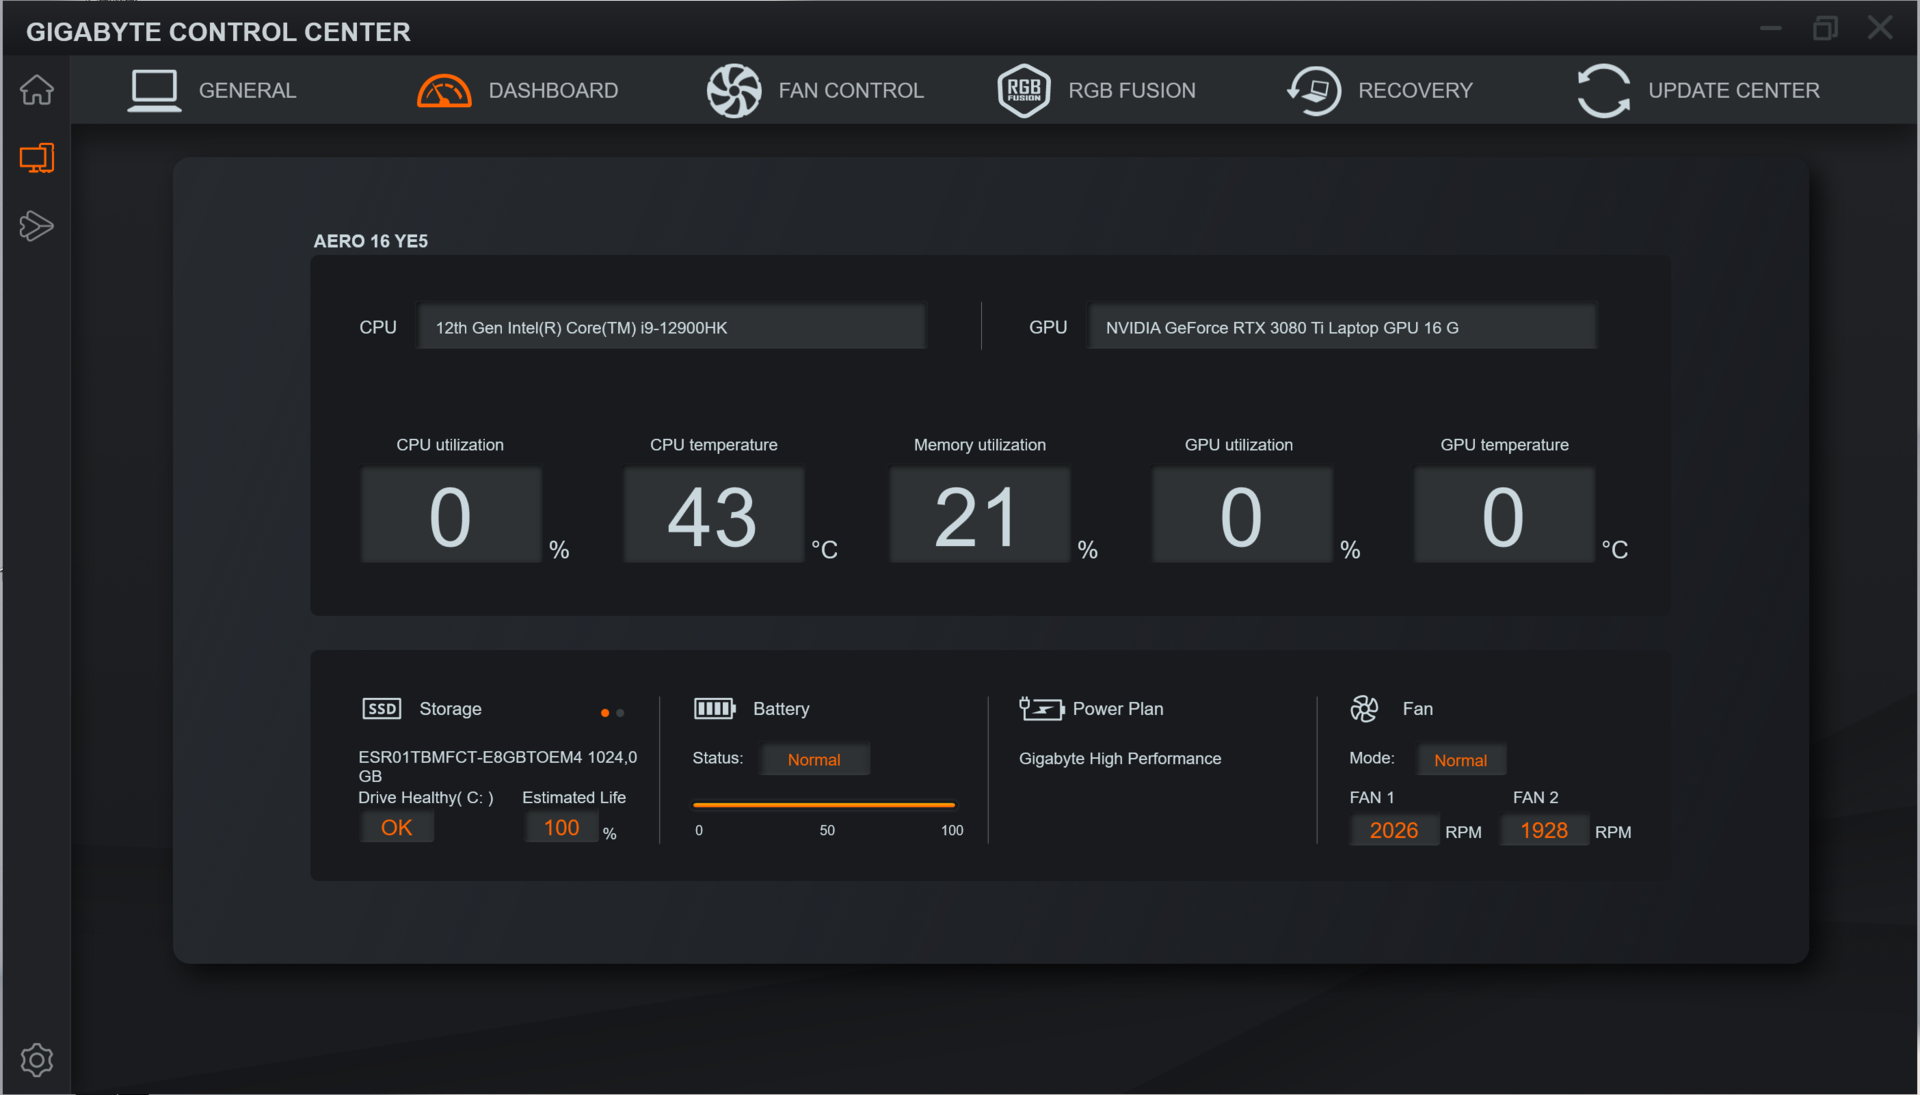
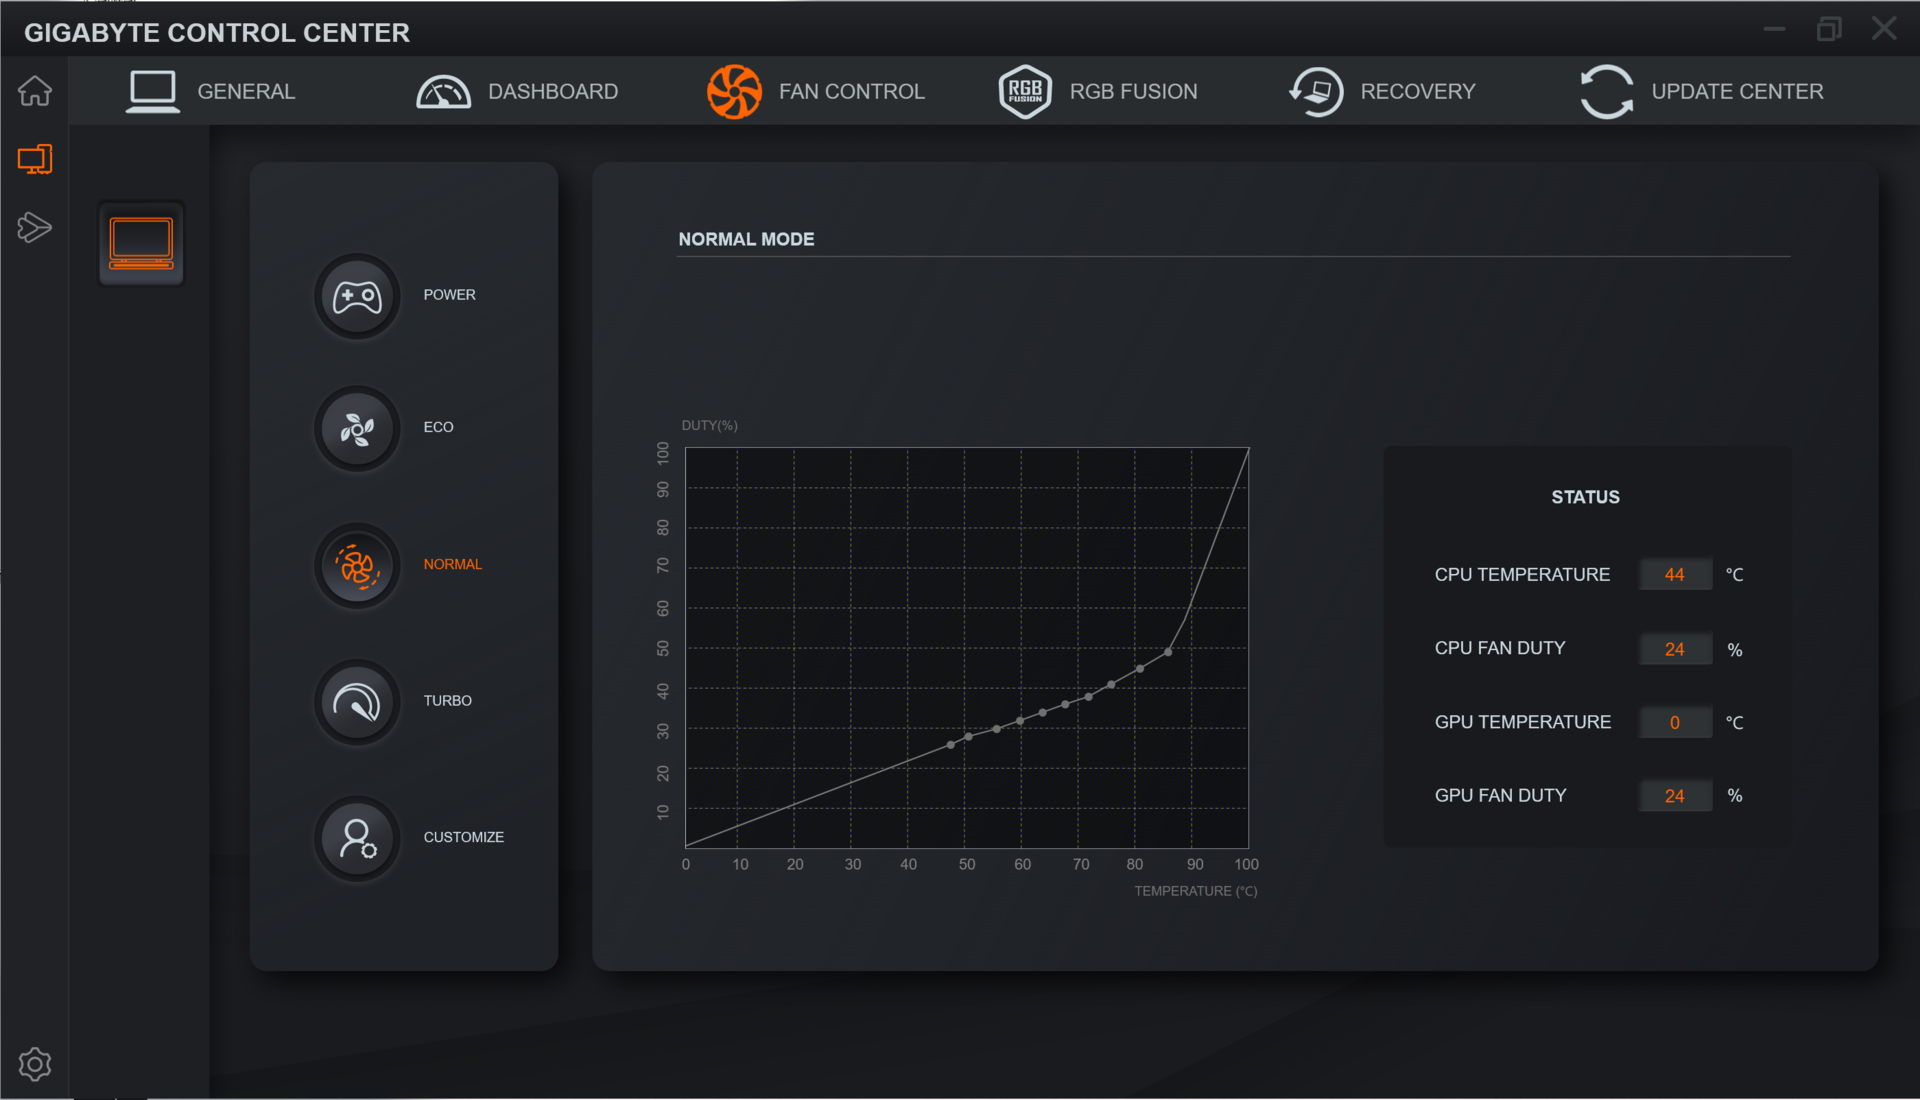
Enheten levereras med Gigabyte Control Center förinstallerat, som erbjuder olika prestandaprofiler. Dessa påverkar inte bara CPU- och GPU-prestanda utan även ljusstyrka och skärmens färgtemperatur. Vi bestämde oss för att anförtro vårt öde åt det medföljande AI-läget som låter Control Center fatta det beslutet och välja den bästa profilen för oss.
Dessutom körde vi några benchmarks med "Power Saving Silence Mode" och "Turbo Mode" aktiverade manuellt. Det sistnämnda är inte särskilt väl lämpat för långa perioder eftersom det rampar upp fläktarna till sin maximala hastighet omedelbart och permanent.
| Creator Mode | Turbo Mode | Gaming Mode | Meeting Mode | Power Saving Silence Mode | |
|---|---|---|---|---|---|
| Effektbegränsning 1 | 86 Watt | 86 Watt | 62 Watt | 15 Watt | 15 Watt |
| Effektbegränsning 2 | 115 Watt | 115 Watt | 115 Watt | 30 Watt | 30 Watt |
Processor
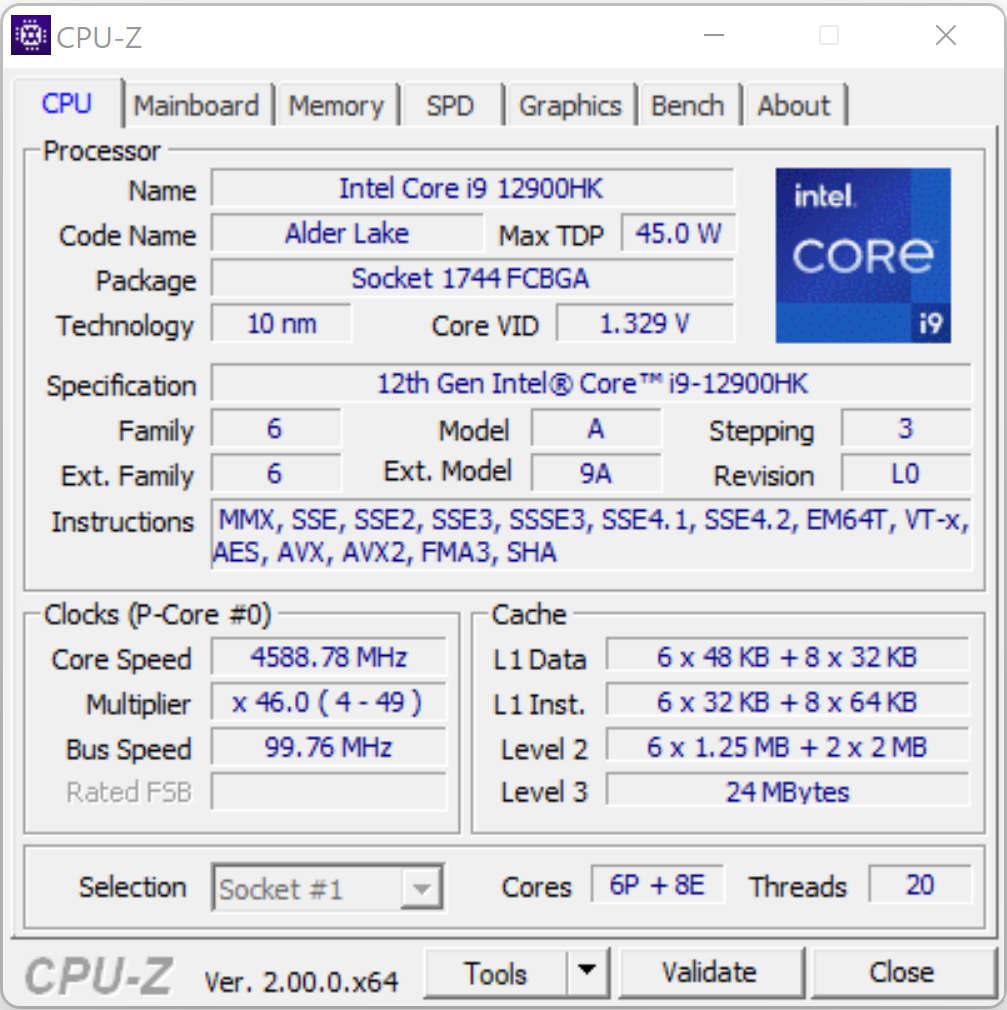
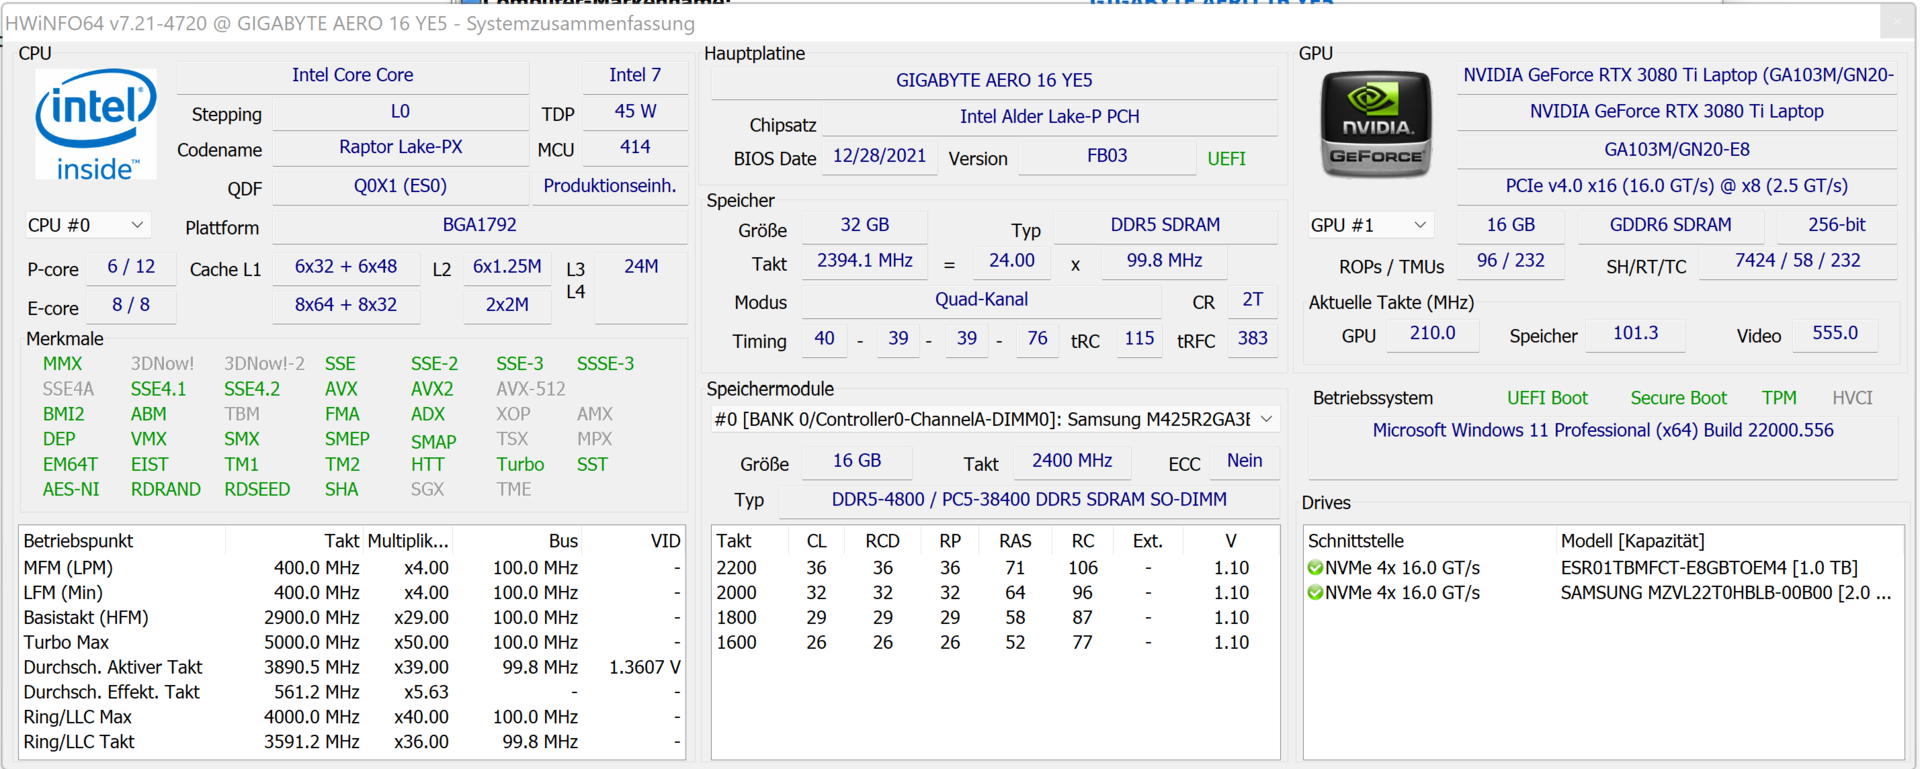
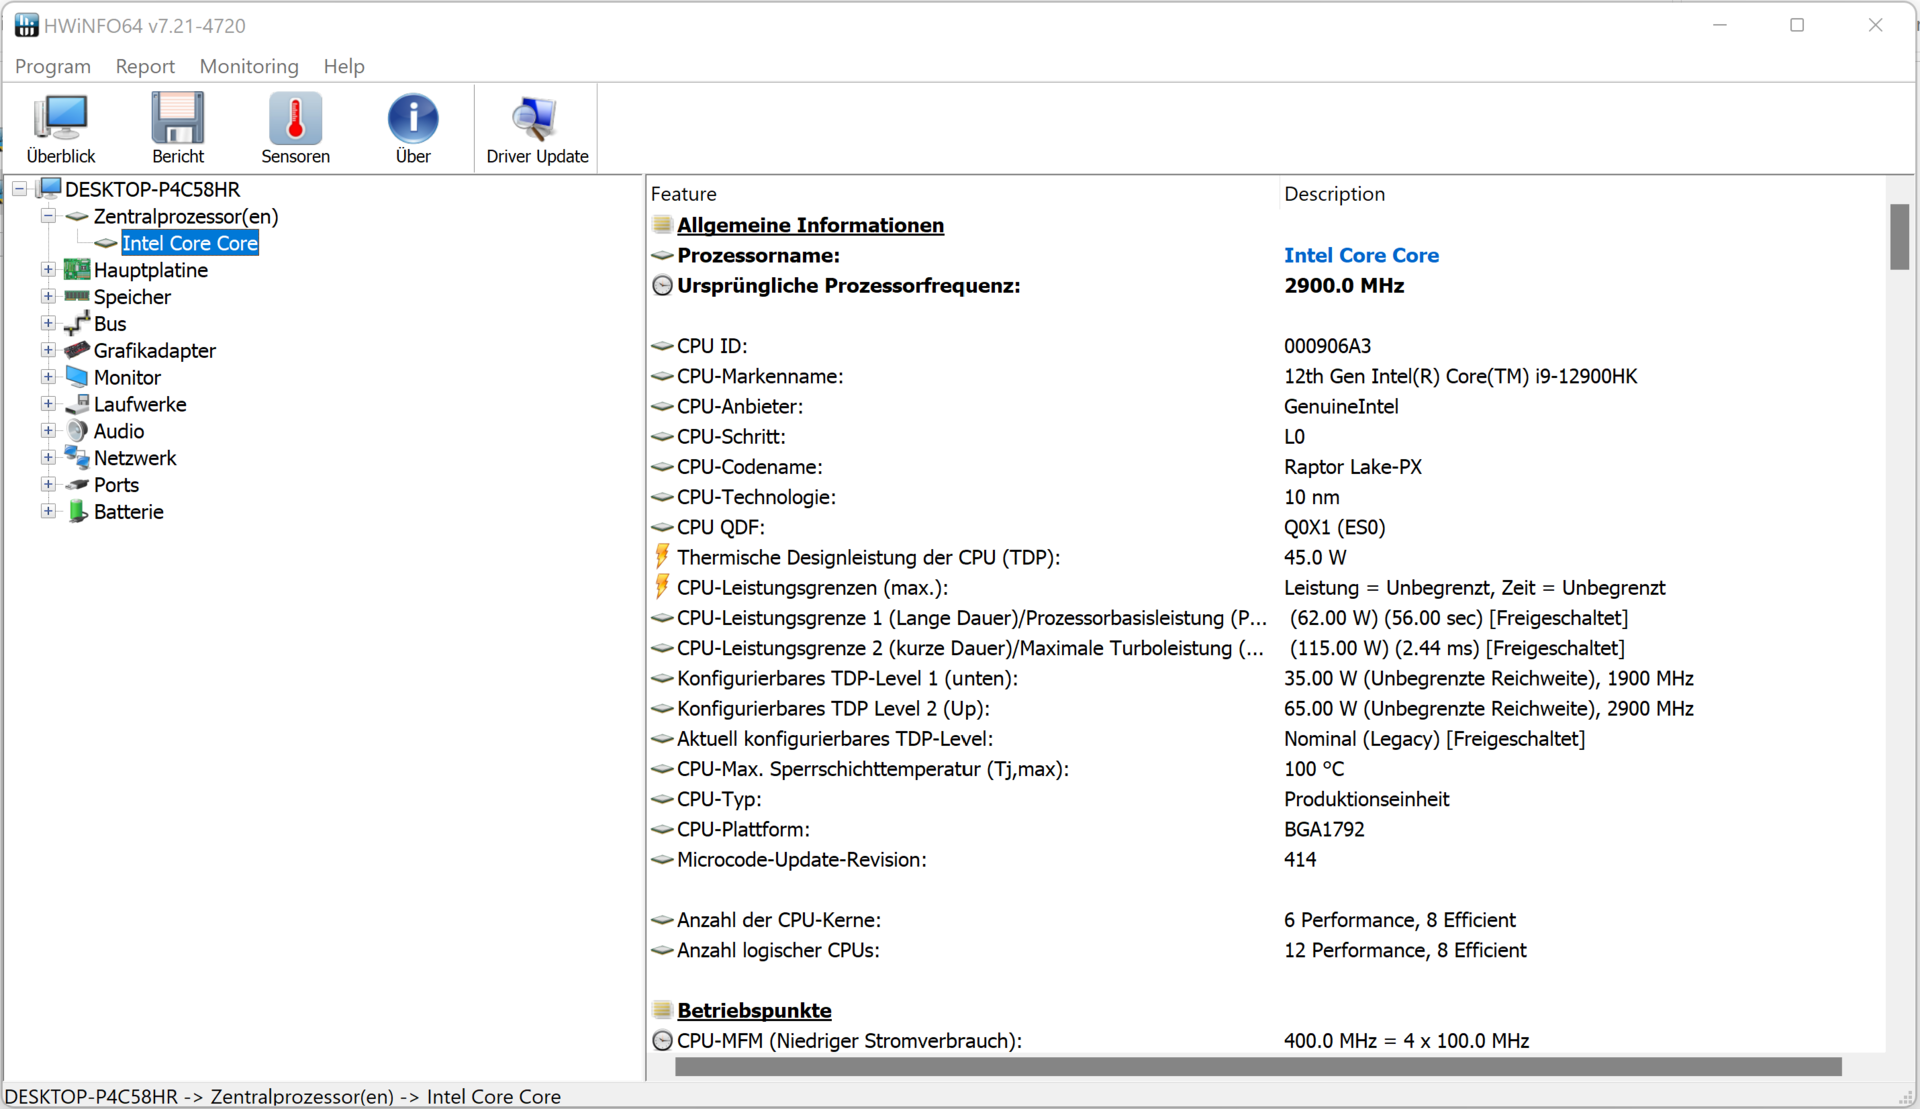
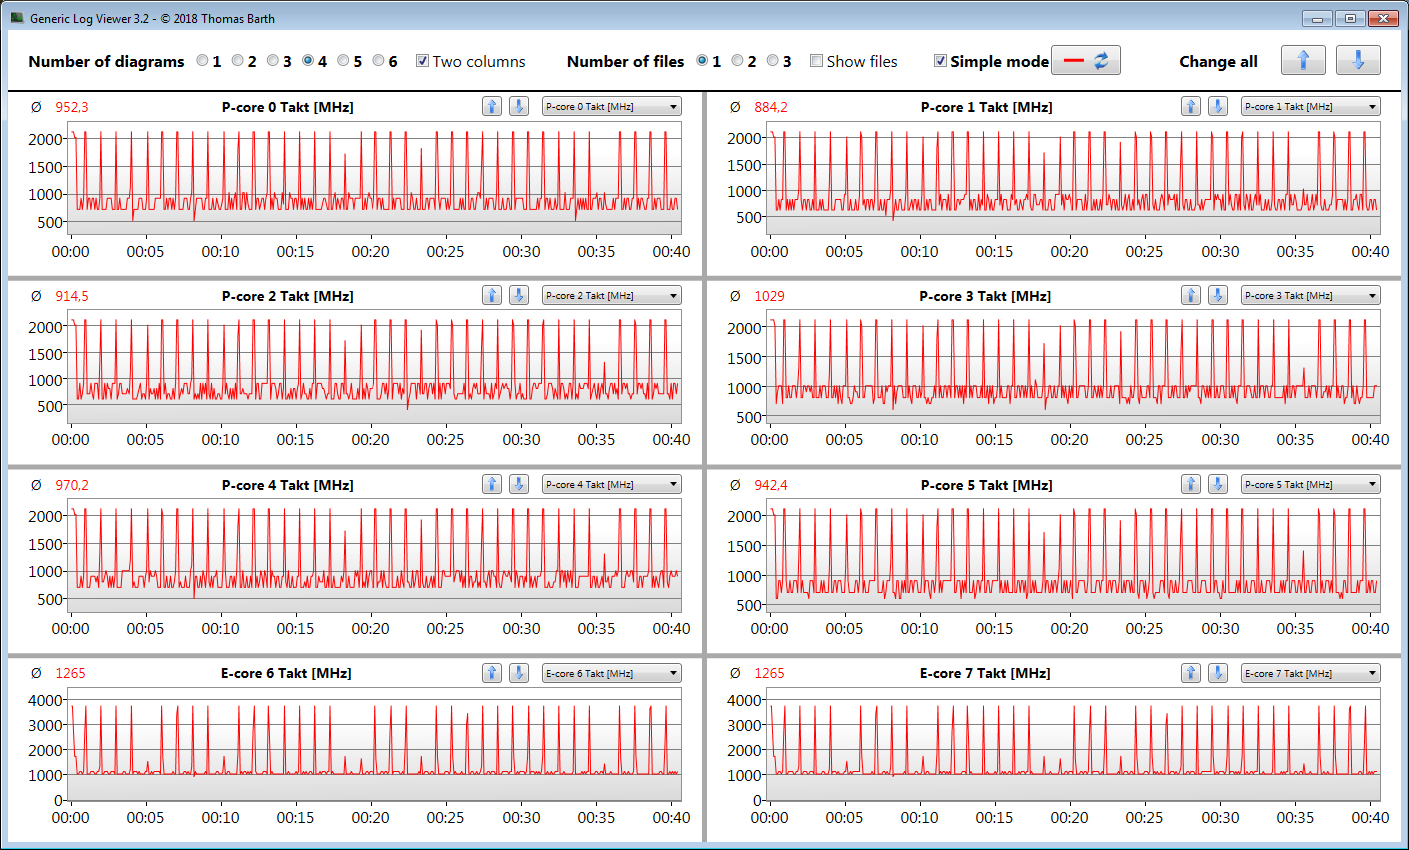
Intels Alder LakeCore i9-12900HK har sex prestandakärnor med Hyperthreading som körs på mellan 2,5 och 5 GHz samt åtta effektivitetskärnor utan Hyperthreading som körs på 1,8-3,8 GHz. Tillsammans ger detta totalt 20 tillgängliga CPU-kärnor. Tack vare en olåst multiplikator kan processorn också överklockas ganska enkelt.
När vi körde vårt riktmärke CineBench R15 körde CPU:n med mycket höga (multitråd: P-kärnor 4-4,1 GHz, E-kärnor: 3-3,1 GHz) eller till och med maximala (single-thread: P-kärnor 4,3-5 GHz, E-kärnor: 3,8 GHz) klockfrekvenser. På batteriet sänktes dessa betydligt.
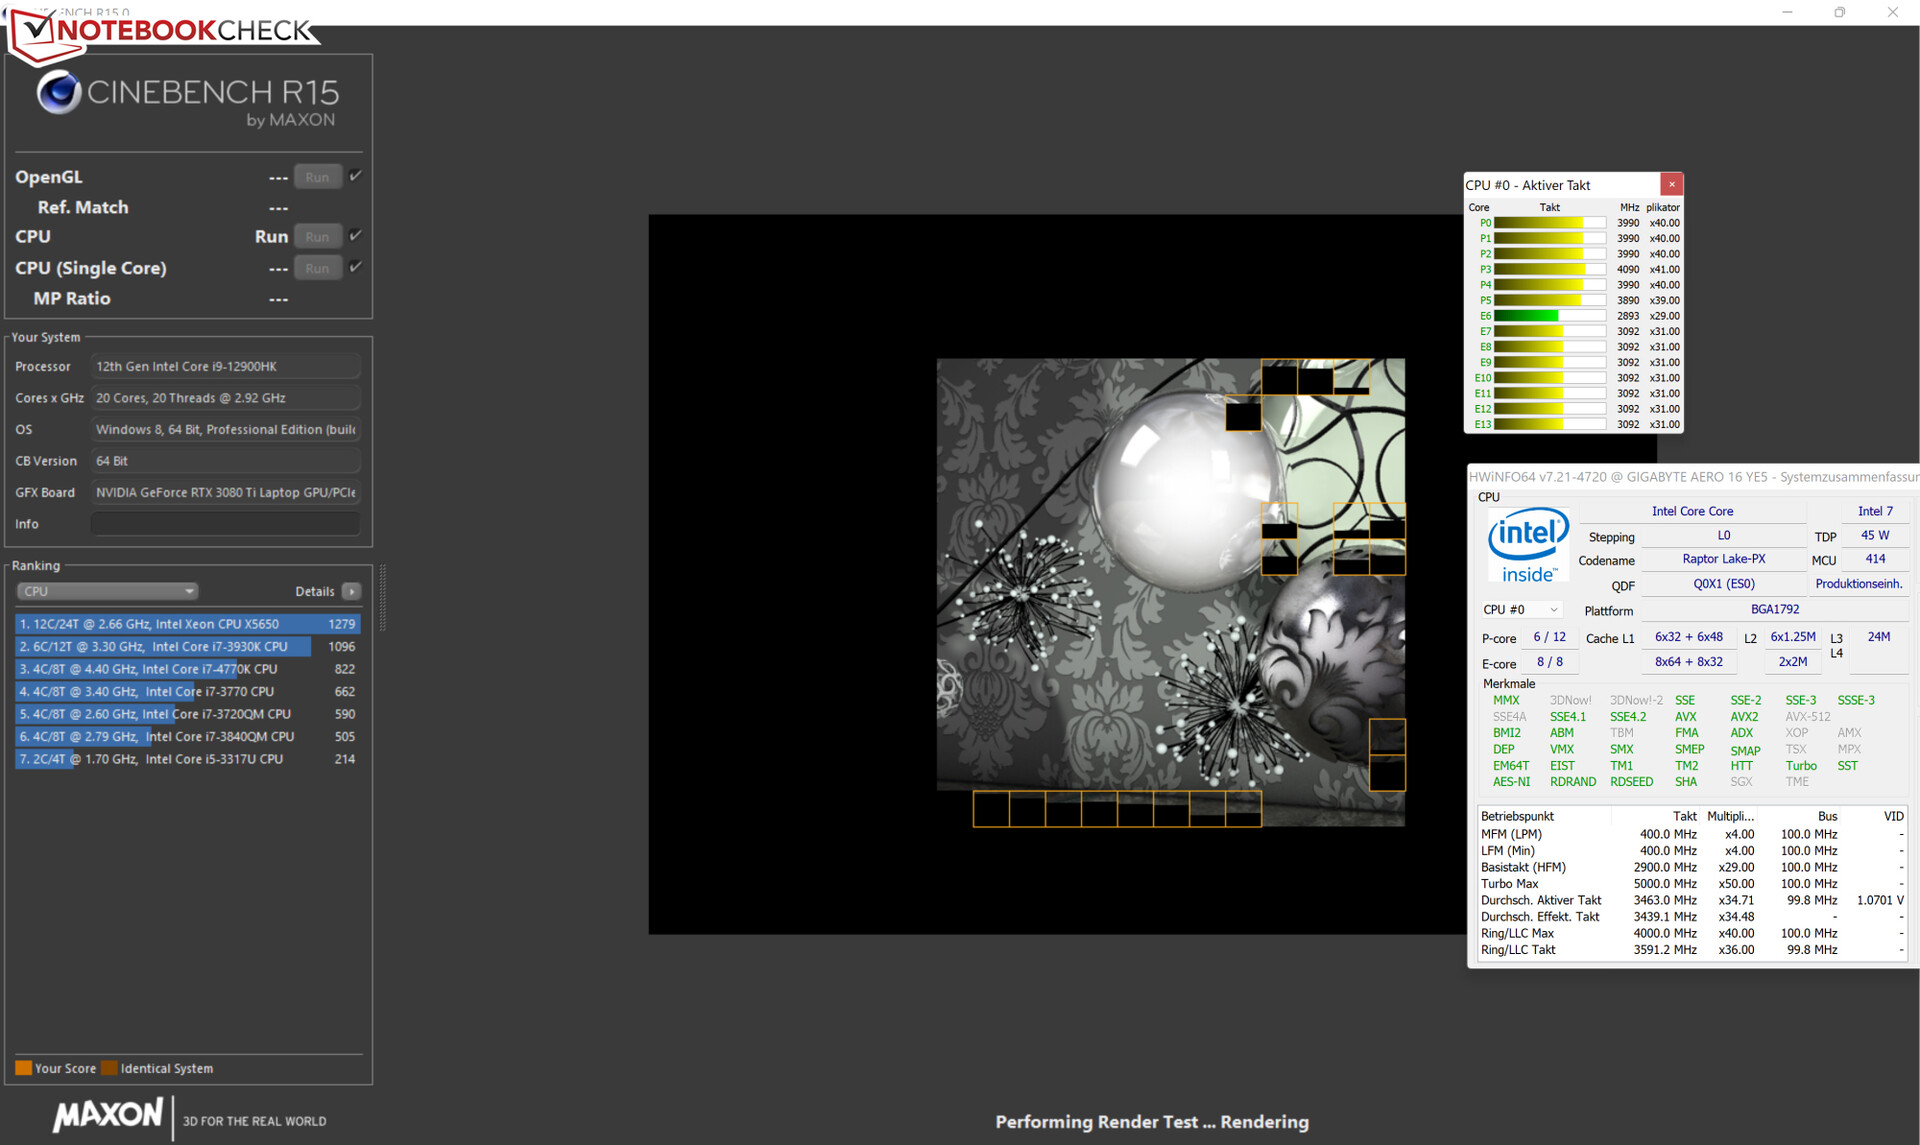
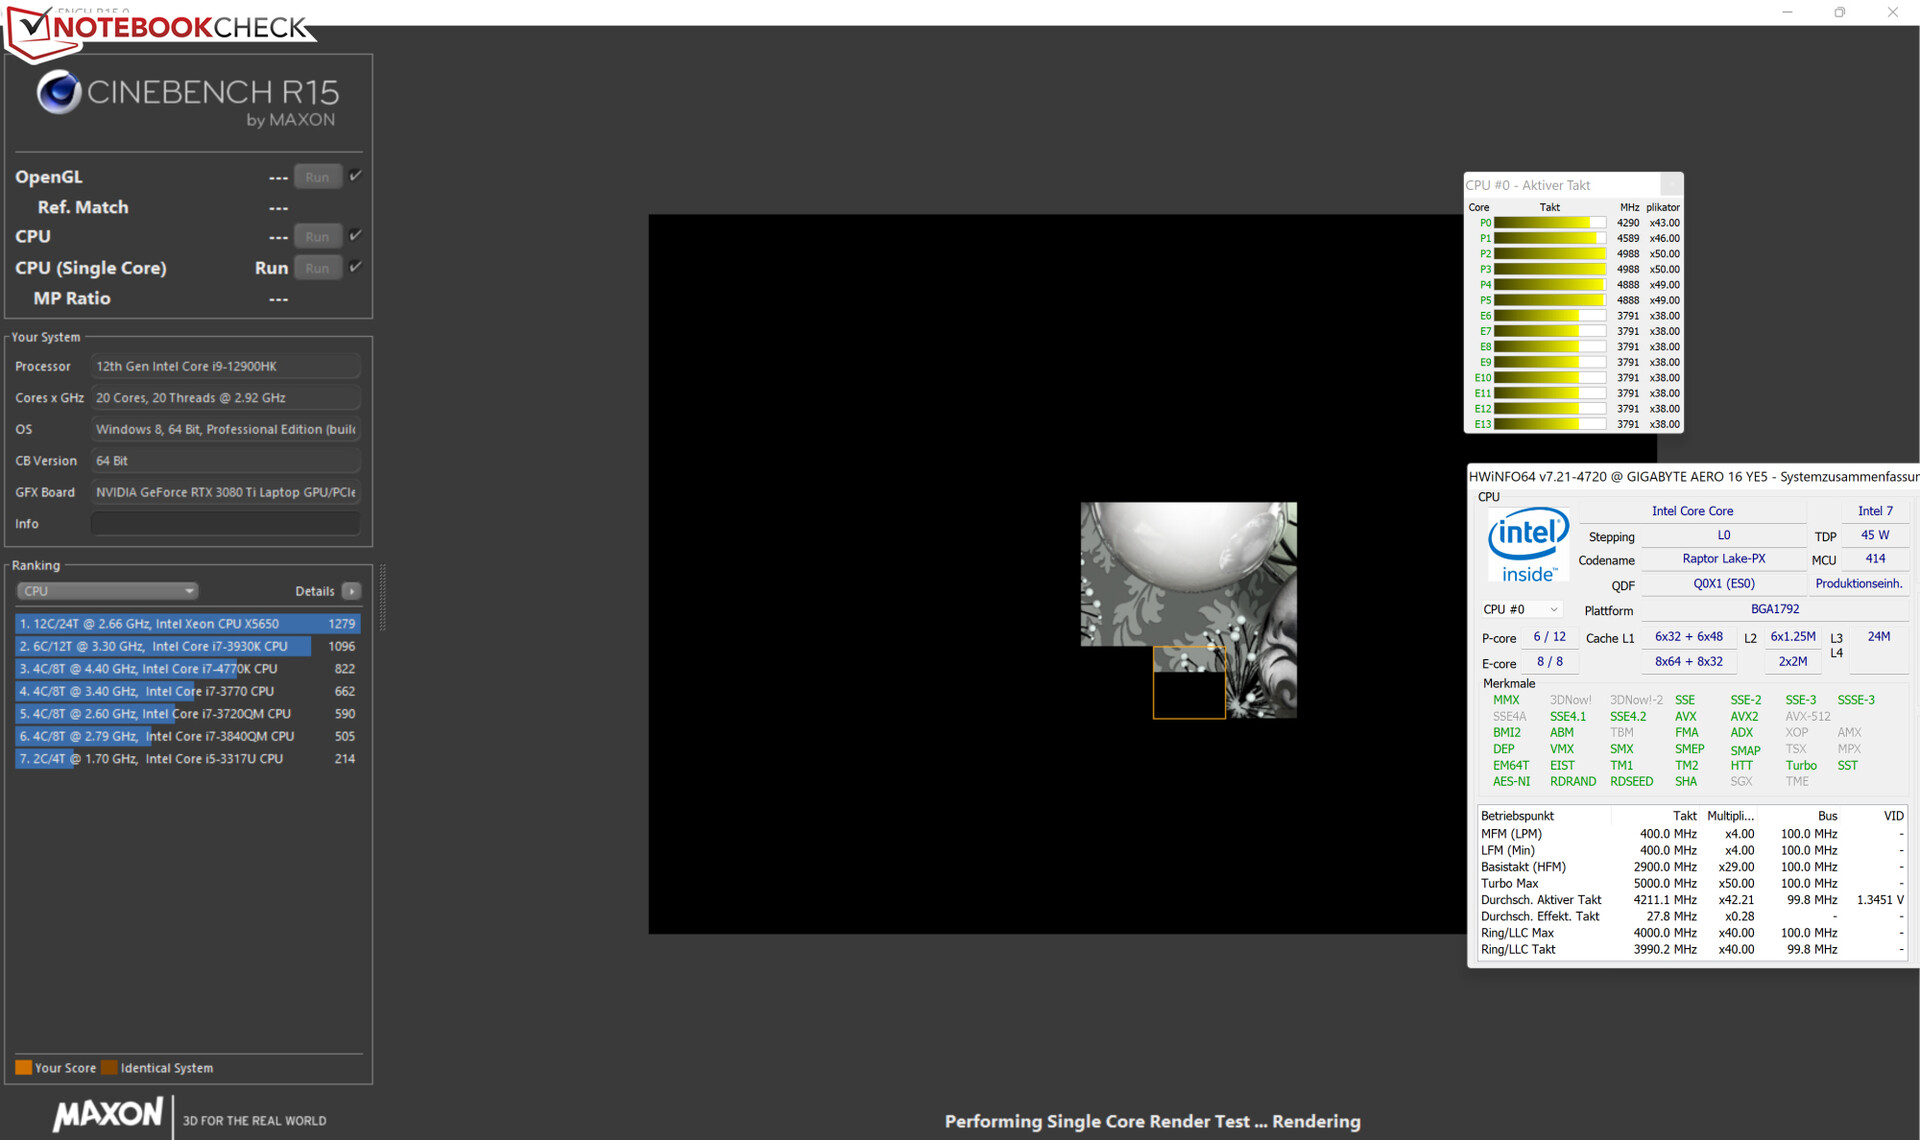
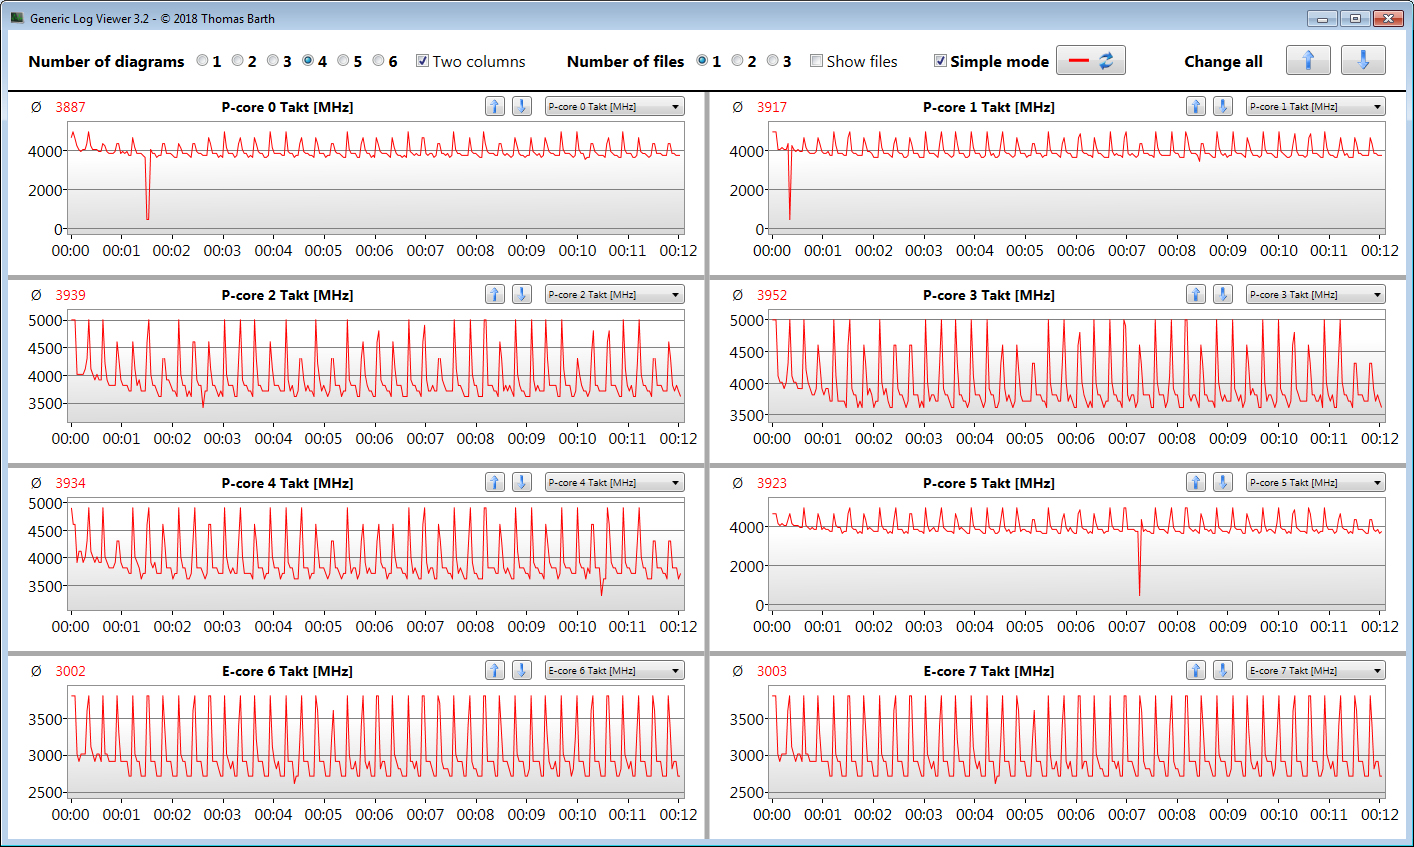
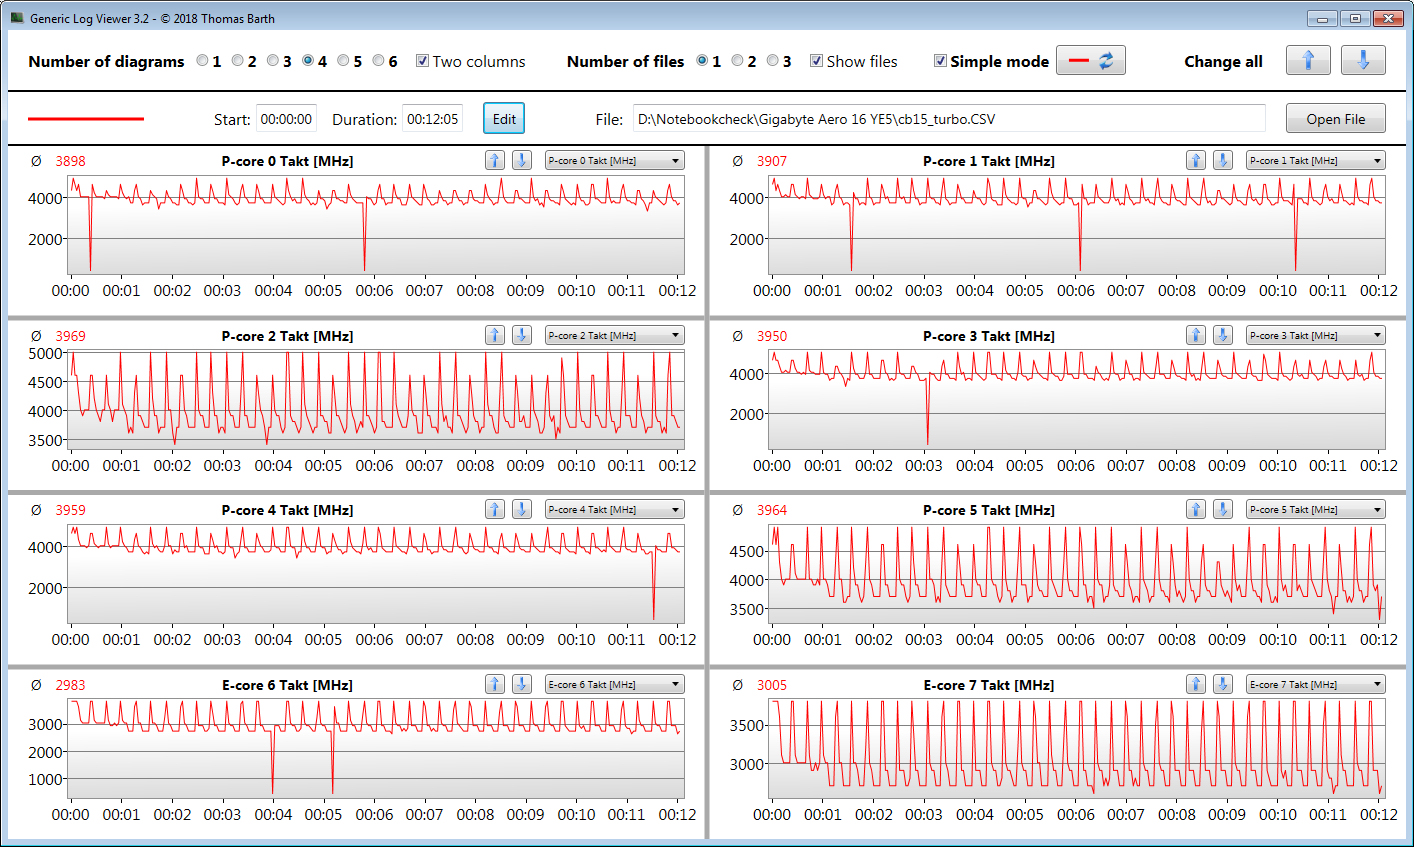
Vi kör CineBench R15 multitrådstestet i minst 30 minuter i en slinga för att avgöra om en processor kan utnyttja höga turbo-boost-klockfrekvenser under långvarig belastning. Aero 16 lyckades bibehålla sin höga ursprungliga prestandanivå på både prestanda- och effektivitetskärnor. Att manuellt aktivera "Turbo Mode" hade ingen som helst positiv effekt.
Cinebench R15 Multi Loop
| Cinebench R23 | |
| Multi Core | |
| Gigabyte Aero 16 YE5 (Turbo Mode) | |
| Gigabyte Aero 16 YE5 | |
| Genomsnitt av klass Multimedia (4861 - 33362, n=74, senaste 2 åren) | |
| Genomsnitt Intel Core i9-12900HK (4796 - 19282, n=14) | |
| Razer Blade 15 2022 | |
| Schenker XMG Pro 15 (Late 2021) | |
| Apple MacBook Pro 16 2021 M1 Max | |
| HP ZBook Studio 15 G8 | |
| Lenovo ThinkPad X1 Extreme G4-20Y50040GE | |
| Gigabyte Aero 16 YE5 (Silence Mode) | |
| Single Core | |
| Genomsnitt av klass Multimedia (1128 - 2459, n=66, senaste 2 åren) | |
| Gigabyte Aero 16 YE5 | |
| Gigabyte Aero 16 YE5 (Turbo Mode) | |
| Razer Blade 15 2022 | |
| Genomsnitt Intel Core i9-12900HK (819 - 1940, n=15) | |
| Lenovo ThinkPad X1 Extreme G4-20Y50040GE | |
| HP ZBook Studio 15 G8 | |
| Apple MacBook Pro 16 2021 M1 Max | |
| Schenker XMG Pro 15 (Late 2021) | |
| Gigabyte Aero 16 YE5 (Silence Mode) | |
| Cinebench R20 | |
| CPU (Multi Core) | |
| Gigabyte Aero 16 YE5 (Turbo Mode) | |
| Gigabyte Aero 16 YE5 | |
| Genomsnitt av klass Multimedia (1887 - 12912, n=57, senaste 2 åren) | |
| Genomsnitt Intel Core i9-12900HK (1828 - 7366, n=14) | |
| Razer Blade 15 2022 | |
| Schenker XMG Pro 15 (Late 2021) | |
| HP ZBook Studio 15 G8 | |
| Lenovo ThinkPad X1 Extreme G4-20Y50040GE | |
| Apple MacBook Pro 16 2021 M1 Max | |
| Gigabyte Aero 16 YE5 (Silence Mode) | |
| CPU (Single Core) | |
| Gigabyte Aero 16 YE5 (Turbo Mode) | |
| Genomsnitt av klass Multimedia (425 - 853, n=57, senaste 2 åren) | |
| Razer Blade 15 2022 | |
| Gigabyte Aero 16 YE5 | |
| Genomsnitt Intel Core i9-12900HK (316 - 739, n=14) | |
| Lenovo ThinkPad X1 Extreme G4-20Y50040GE | |
| HP ZBook Studio 15 G8 | |
| Schenker XMG Pro 15 (Late 2021) | |
| Apple MacBook Pro 16 2021 M1 Max | |
| Gigabyte Aero 16 YE5 (Silence Mode) | |
| Cinebench R15 | |
| CPU Multi 64Bit | |
| Gigabyte Aero 16 YE5 (Turbo Mode) | |
| Gigabyte Aero 16 YE5 | |
| Genomsnitt av klass Multimedia (856 - 5224, n=61, senaste 2 åren) | |
| Genomsnitt Intel Core i9-12900HK (965 - 2944, n=14) | |
| Razer Blade 15 2022 | |
| Lenovo ThinkPad X1 Extreme G4-20Y50040GE (BIOS 1.13) | |
| Lenovo ThinkPad X1 Extreme G4-20Y50040GE (BIOS 1.10) | |
| Schenker XMG Pro 15 (Late 2021) | |
| HP ZBook Studio 15 G8 | |
| Apple MacBook Pro 16 2021 M1 Max (Rosetta 2) | |
| Gigabyte Aero 16 YE5 (Silence Mode) | |
| CPU Single 64Bit | |
| Genomsnitt av klass Multimedia (184.8 - 326, n=59, senaste 2 åren) | |
| Gigabyte Aero 16 YE5 | |
| Gigabyte Aero 16 YE5 (Turbo Mode) | |
| Razer Blade 15 2022 | |
| Lenovo ThinkPad X1 Extreme G4-20Y50040GE | |
| Genomsnitt Intel Core i9-12900HK (119 - 279, n=14) | |
| HP ZBook Studio 15 G8 | |
| Schenker XMG Pro 15 (Late 2021) | |
| Apple MacBook Pro 16 2021 M1 Max (Rosetta 2) | |
| Gigabyte Aero 16 YE5 (Silence Mode) | |
| Blender - v2.79 BMW27 CPU | |
| HP ZBook Studio 15 G8 | |
| Genomsnitt av klass Multimedia (100 - 557, n=58, senaste 2 åren) | |
| Schenker XMG Pro 15 (Late 2021) | |
| Razer Blade 15 2022 | |
| Genomsnitt Intel Core i9-12900HK (172.5 - 483, n=13) | |
| Gigabyte Aero 16 YE5 | |
| Apple MacBook Pro 16 2021 M1 Max (Blender 3.0 beta for mac) | |
| Gigabyte Aero 16 YE5 (Turbo Mode) | |
| 7-Zip 18.03 | |
| 7z b 4 | |
| Gigabyte Aero 16 YE5 (Turbo Mode) | |
| Gigabyte Aero 16 YE5 | |
| Genomsnitt Intel Core i9-12900HK (25736 - 75564, n=14) | |
| Razer Blade 15 2022 | |
| Genomsnitt av klass Multimedia (26062 - 130368, n=55, senaste 2 åren) | |
| Schenker XMG Pro 15 (Late 2021) | |
| HP ZBook Studio 15 G8 | |
| Gigabyte Aero 16 YE5 (Silence Mode) | |
| 7z b 4 -mmt1 | |
| Gigabyte Aero 16 YE5 | |
| Gigabyte Aero 16 YE5 (Turbo Mode) | |
| Genomsnitt av klass Multimedia (3666 - 7545, n=56, senaste 2 åren) | |
| HP ZBook Studio 15 G8 | |
| Razer Blade 15 2022 | |
| Schenker XMG Pro 15 (Late 2021) | |
| Genomsnitt Intel Core i9-12900HK (2898 - 6186, n=14) | |
| Gigabyte Aero 16 YE5 (Silence Mode) | |
| Geekbench 5.5 | |
| Multi-Core | |
| Gigabyte Aero 16 YE5 (Turbo Mode) | |
| Gigabyte Aero 16 YE5 | |
| Genomsnitt av klass Multimedia (4652 - 20422, n=56, senaste 2 åren) | |
| Apple MacBook Pro 16 2021 M1 Max | |
| Razer Blade 15 2022 | |
| Genomsnitt Intel Core i9-12900HK (5869 - 14294, n=13) | |
| Schenker XMG Pro 15 (Late 2021) | |
| Lenovo ThinkPad X1 Extreme G4-20Y50040GE | |
| HP ZBook Studio 15 G8 | |
| Gigabyte Aero 16 YE5 (Silence Mode) | |
| Single-Core | |
| Genomsnitt av klass Multimedia (805 - 2974, n=56, senaste 2 åren) | |
| Gigabyte Aero 16 YE5 (Turbo Mode) | |
| Gigabyte Aero 16 YE5 | |
| Apple MacBook Pro 16 2021 M1 Max | |
| Razer Blade 15 2022 | |
| HP ZBook Studio 15 G8 | |
| Genomsnitt Intel Core i9-12900HK (843 - 1918, n=13) | |
| Lenovo ThinkPad X1 Extreme G4-20Y50040GE | |
| Schenker XMG Pro 15 (Late 2021) | |
| Gigabyte Aero 16 YE5 (Silence Mode) | |
| HWBOT x265 Benchmark v2.2 - 4k Preset | |
| Gigabyte Aero 16 YE5 (Turbo Mode) | |
| Genomsnitt av klass Multimedia (5.26 - 36.1, n=56, senaste 2 åren) | |
| Gigabyte Aero 16 YE5 | |
| Razer Blade 15 2022 | |
| Genomsnitt Intel Core i9-12900HK (5.33 - 21.6, n=14) | |
| Schenker XMG Pro 15 (Late 2021) | |
| HP ZBook Studio 15 G8 | |
| Lenovo ThinkPad X1 Extreme G4-20Y50040GE | |
| Gigabyte Aero 16 YE5 (Silence Mode) | |
| LibreOffice - 20 Documents To PDF | |
| Gigabyte Aero 16 YE5 (Silence Mode) | |
| Razer Blade 15 2022 | |
| Genomsnitt av klass Multimedia (23.9 - 146.7, n=57, senaste 2 åren) | |
| Schenker XMG Pro 15 (Late 2021) | |
| HP ZBook Studio 15 G8 | |
| Genomsnitt Intel Core i9-12900HK (34.8 - 89.1, n=14) | |
| Gigabyte Aero 16 YE5 | |
| Lenovo ThinkPad X1 Extreme G4-20Y50040GE | |
| Gigabyte Aero 16 YE5 (Turbo Mode) | |
| R Benchmark 2.5 - Overall mean | |
| Gigabyte Aero 16 YE5 (Silence Mode) | |
| HP ZBook Studio 15 G8 | |
| Schenker XMG Pro 15 (Late 2021) | |
| Lenovo ThinkPad X1 Extreme G4-20Y50040GE | |
| Genomsnitt Intel Core i9-12900HK (0.4155 - 0.994, n=14) | |
| Razer Blade 15 2022 | |
| Genomsnitt av klass Multimedia (0.3604 - 0.947, n=56, senaste 2 åren) | |
| Gigabyte Aero 16 YE5 (Turbo Mode) | |
| Gigabyte Aero 16 YE5 | |
* ... mindre är bättre
AIDA64: FP32 Ray-Trace | FPU Julia | CPU SHA3 | CPU Queen | FPU SinJulia | FPU Mandel | CPU AES | CPU ZLib | FP64 Ray-Trace | CPU PhotoWorxx
| Performance rating | |
| Genomsnitt av klass Multimedia | |
| Schenker XMG Pro 15 (Late 2021) | |
| Lenovo ThinkPad X1 Extreme G4-20Y50040GE | |
| HP ZBook Studio 15 G8 | |
| Gigabyte Aero 16 YE5 | |
| Gigabyte Aero 16 YE5 | |
| Genomsnitt Intel Core i9-12900HK | |
| Razer Blade 15 2022 | |
| Gigabyte Aero 16 YE5 | |
| AIDA64 / FP32 Ray-Trace | |
| Genomsnitt av klass Multimedia (2214 - 50388, n=53, senaste 2 åren) | |
| Schenker XMG Pro 15 (Late 2021) (v6.50.5800) | |
| Lenovo ThinkPad X1 Extreme G4-20Y50040GE (v6.50.5800) | |
| HP ZBook Studio 15 G8 (v6.33.5700) | |
| Genomsnitt Intel Core i9-12900HK (2677 - 13948, n=15) | |
| Gigabyte Aero 16 YE5 (v6.50.5800, Turbo Mode) | |
| Gigabyte Aero 16 YE5 (v6.50.5800) | |
| Razer Blade 15 2022 (v6.50.5800) | |
| Gigabyte Aero 16 YE5 (v6.50.5800, Silence Mode) | |
| AIDA64 / FPU Julia | |
| Genomsnitt av klass Multimedia (12867 - 201874, n=54, senaste 2 åren) | |
| Schenker XMG Pro 15 (Late 2021) (v6.50.5800) | |
| Lenovo ThinkPad X1 Extreme G4-20Y50040GE (v6.50.5800) | |
| HP ZBook Studio 15 G8 (v6.33.5700) | |
| Genomsnitt Intel Core i9-12900HK (12762 - 70764, n=15) | |
| Gigabyte Aero 16 YE5 (v6.50.5800, Turbo Mode) | |
| Gigabyte Aero 16 YE5 (v6.50.5800) | |
| Razer Blade 15 2022 (v6.50.5800) | |
| Gigabyte Aero 16 YE5 (v6.50.5800, Silence Mode) | |
| AIDA64 / CPU SHA3 | |
| Schenker XMG Pro 15 (Late 2021) (v6.50.5800) | |
| Lenovo ThinkPad X1 Extreme G4-20Y50040GE (v6.50.5800) | |
| HP ZBook Studio 15 G8 (v6.33.5700) | |
| Genomsnitt av klass Multimedia (626 - 8623, n=54, senaste 2 åren) | |
| Gigabyte Aero 16 YE5 (v6.50.5800, Turbo Mode) | |
| Gigabyte Aero 16 YE5 (v6.50.5800) | |
| Genomsnitt Intel Core i9-12900HK (841 - 3504, n=15) | |
| Razer Blade 15 2022 (v6.50.5800) | |
| Gigabyte Aero 16 YE5 (v6.50.5800, Silence Mode) | |
| AIDA64 / CPU Queen | |
| Gigabyte Aero 16 YE5 (v6.50.5800, Turbo Mode) | |
| Gigabyte Aero 16 YE5 (v6.50.5800) | |
| HP ZBook Studio 15 G8 (v6.33.5700) | |
| Lenovo ThinkPad X1 Extreme G4-20Y50040GE (v6.50.5800) | |
| Genomsnitt Intel Core i9-12900HK (60202 - 107161, n=15) | |
| Razer Blade 15 2022 (v6.50.5800) | |
| Schenker XMG Pro 15 (Late 2021) (v6.50.5800) | |
| Genomsnitt av klass Multimedia (13483 - 181505, n=41, senaste 2 åren) | |
| Gigabyte Aero 16 YE5 (v6.50.5800, Silence Mode) | |
| AIDA64 / FPU SinJulia | |
| Lenovo ThinkPad X1 Extreme G4-20Y50040GE (v6.50.5800) | |
| Gigabyte Aero 16 YE5 (v6.50.5800, Turbo Mode) | |
| HP ZBook Studio 15 G8 (v6.33.5700) | |
| Schenker XMG Pro 15 (Late 2021) (v6.50.5800) | |
| Gigabyte Aero 16 YE5 (v6.50.5800) | |
| Razer Blade 15 2022 (v6.50.5800) | |
| Genomsnitt Intel Core i9-12900HK (3225 - 10402, n=15) | |
| Genomsnitt av klass Multimedia (886 - 28794, n=54, senaste 2 åren) | |
| Gigabyte Aero 16 YE5 (v6.50.5800, Silence Mode) | |
| AIDA64 / FPU Mandel | |
| Genomsnitt av klass Multimedia (6395 - 105740, n=53, senaste 2 åren) | |
| Schenker XMG Pro 15 (Late 2021) (v6.50.5800) | |
| Lenovo ThinkPad X1 Extreme G4-20Y50040GE (v6.50.5800) | |
| HP ZBook Studio 15 G8 (v6.33.5700) | |
| Genomsnitt Intel Core i9-12900HK (7417 - 34233, n=15) | |
| Gigabyte Aero 16 YE5 (v6.50.5800, Turbo Mode) | |
| Gigabyte Aero 16 YE5 (v6.50.5800) | |
| Razer Blade 15 2022 (v6.50.5800) | |
| Gigabyte Aero 16 YE5 (v6.50.5800, Silence Mode) | |
| AIDA64 / CPU AES | |
| Lenovo ThinkPad X1 Extreme G4-20Y50040GE (v6.50.5800) | |
| Schenker XMG Pro 15 (Late 2021) (v6.50.5800) | |
| Gigabyte Aero 16 YE5 (v6.50.5800, Turbo Mode) | |
| Gigabyte Aero 16 YE5 (v6.50.5800) | |
| HP ZBook Studio 15 G8 (v6.33.5700) | |
| Genomsnitt Intel Core i9-12900HK (32382 - 112498, n=15) | |
| Genomsnitt av klass Multimedia (8171 - 126790, n=54, senaste 2 åren) | |
| Razer Blade 15 2022 (v6.50.5800) | |
| Gigabyte Aero 16 YE5 (v6.50.5800, Silence Mode) | |
| AIDA64 / CPU ZLib | |
| Gigabyte Aero 16 YE5 (v6.50.5800, Turbo Mode) | |
| Gigabyte Aero 16 YE5 (v6.50.5800) | |
| Genomsnitt av klass Multimedia (143.8 - 2022, n=54, senaste 2 åren) | |
| Genomsnitt Intel Core i9-12900HK (314 - 1209, n=15) | |
| Razer Blade 15 2022 (v6.50.5800) | |
| Lenovo ThinkPad X1 Extreme G4-20Y50040GE (v6.50.5800) | |
| Schenker XMG Pro 15 (Late 2021) (v6.50.5800) | |
| HP ZBook Studio 15 G8 (v6.33.5700) | |
| Gigabyte Aero 16 YE5 (v6.50.5800, Silence Mode) | |
| AIDA64 / FP64 Ray-Trace | |
| Genomsnitt av klass Multimedia (1014 - 26875, n=54, senaste 2 åren) | |
| Schenker XMG Pro 15 (Late 2021) (v6.50.5800) | |
| Lenovo ThinkPad X1 Extreme G4-20Y50040GE (v6.50.5800) | |
| HP ZBook Studio 15 G8 (v6.33.5700) | |
| Genomsnitt Intel Core i9-12900HK (1501 - 7616, n=15) | |
| Gigabyte Aero 16 YE5 (v6.50.5800, Turbo Mode) | |
| Gigabyte Aero 16 YE5 (v6.50.5800) | |
| Razer Blade 15 2022 (v6.50.5800) | |
| Gigabyte Aero 16 YE5 (v6.50.5800, Silence Mode) | |
| AIDA64 / CPU PhotoWorxx | |
| Genomsnitt av klass Multimedia (8187 - 88154, n=54, senaste 2 åren) | |
| Razer Blade 15 2022 (v6.50.5800) | |
| Gigabyte Aero 16 YE5 (v6.50.5800) | |
| Gigabyte Aero 16 YE5 (v6.50.5800, Turbo Mode) | |
| Genomsnitt Intel Core i9-12900HK (24446 - 42462, n=15) | |
| Schenker XMG Pro 15 (Late 2021) (v6.50.5800) | |
| Gigabyte Aero 16 YE5 (v6.50.5800, Silence Mode) | |
| HP ZBook Studio 15 G8 (v6.33.5700) | |
| Lenovo ThinkPad X1 Extreme G4-20Y50040GE (v6.50.5800) | |
Systemets prestanda
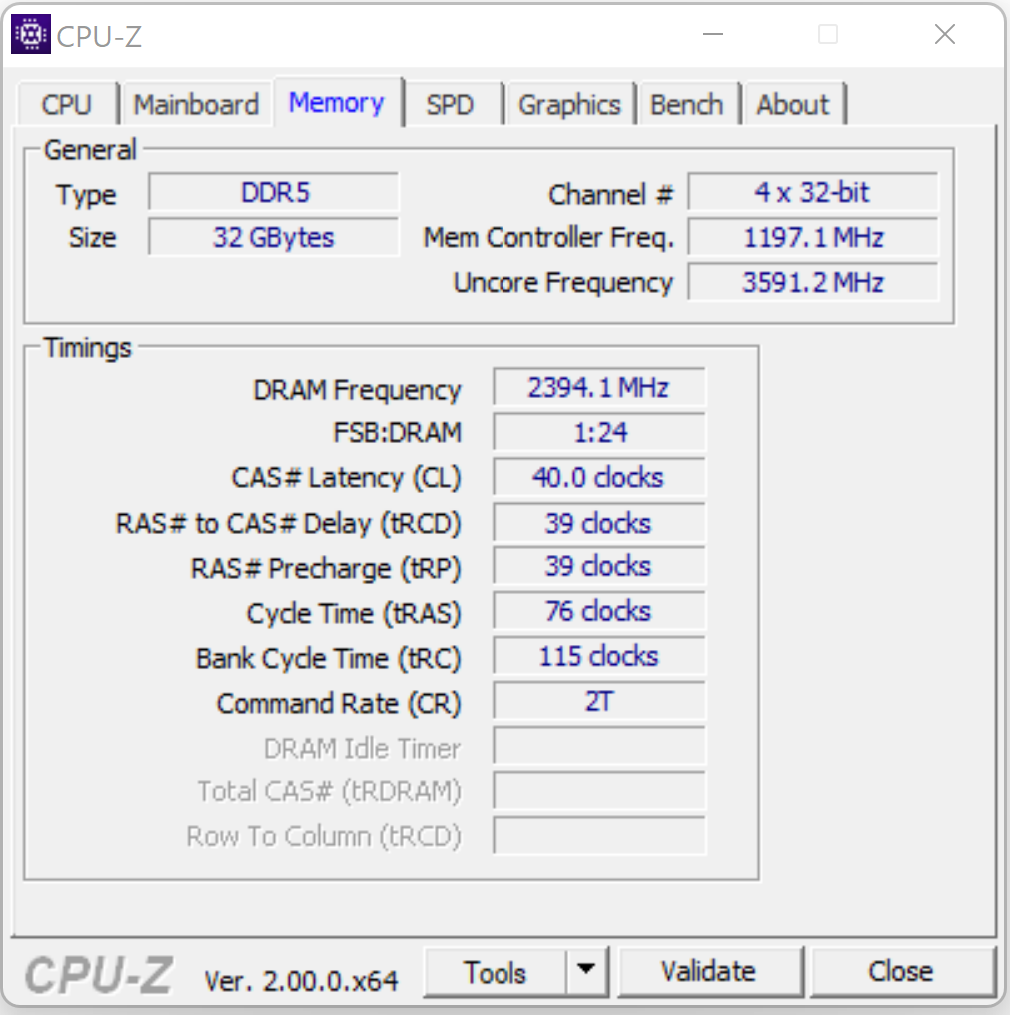
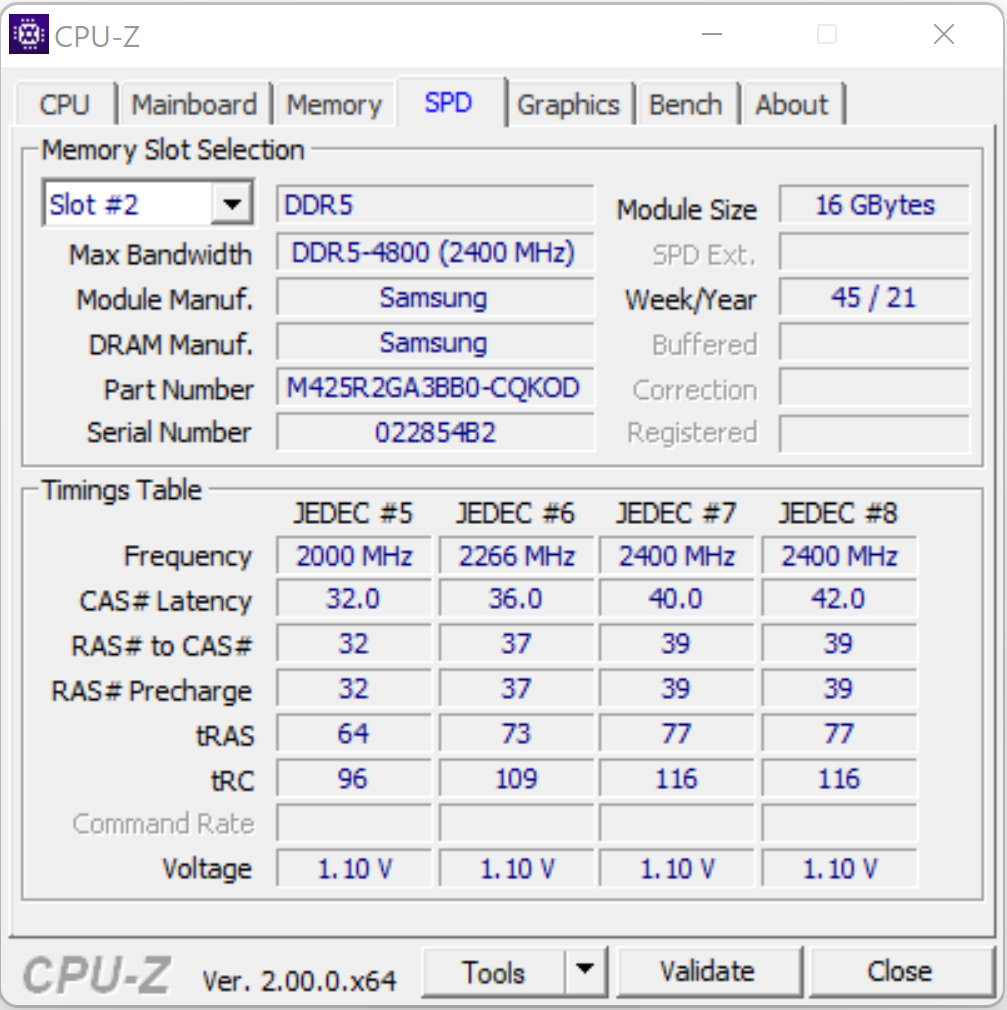
Utan överraskning var den övergripande systemprestandan mycket snabb och smidig tack vare den kraftfulla interna hårdvaran. Datorn gjorde ett fantastiskt jobb i alla applikationstester. Den totala prestandan ökas ytterligare av DDR5-minnesgränssnittet med dubbla kanaler, vilket de utmärkta PCMark-benchmarksresultaten vittnar om.
| PCMark 8 Home Score Accelerated v2 | 4775 poäng | |
| PCMark 8 Creative Score Accelerated v2 | 6920 poäng | |
| PCMark 8 Work Score Accelerated v2 | 5343 poäng | |
| PCMark 10 Score | 7816 poäng | |
Hjälp | ||
CrossMark: Overall | Productivity | Creativity | Responsiveness
| PCMark 10 / Score | |
| Genomsnitt Intel Core i9-12900HK, NVIDIA GeForce RTX 3080 Ti Laptop GPU (7149 - 8186, n=5) | |
| Gigabyte Aero 16 YE5 | |
| Genomsnitt av klass Multimedia (4325 - 10386, n=52, senaste 2 åren) | |
| Razer Blade 15 2022 | |
| Lenovo ThinkPad X1 Extreme G4-20Y50040GE | |
| PCMark 10 / Essentials | |
| Gigabyte Aero 16 YE5 | |
| Genomsnitt Intel Core i9-12900HK, NVIDIA GeForce RTX 3080 Ti Laptop GPU (9870 - 11205, n=5) | |
| Razer Blade 15 2022 | |
| Lenovo ThinkPad X1 Extreme G4-20Y50040GE | |
| Genomsnitt av klass Multimedia (8025 - 11664, n=51, senaste 2 åren) | |
| PCMark 10 / Productivity | |
| Genomsnitt av klass Multimedia (7323 - 18233, n=51, senaste 2 åren) | |
| Gigabyte Aero 16 YE5 | |
| Genomsnitt Intel Core i9-12900HK, NVIDIA GeForce RTX 3080 Ti Laptop GPU (9173 - 10422, n=5) | |
| Razer Blade 15 2022 | |
| Lenovo ThinkPad X1 Extreme G4-20Y50040GE | |
| PCMark 10 / Digital Content Creation | |
| Genomsnitt Intel Core i9-12900HK, NVIDIA GeForce RTX 3080 Ti Laptop GPU (10951 - 13098, n=5) | |
| Razer Blade 15 2022 | |
| Gigabyte Aero 16 YE5 | |
| Genomsnitt av klass Multimedia (3651 - 16240, n=51, senaste 2 åren) | |
| Lenovo ThinkPad X1 Extreme G4-20Y50040GE | |
| CrossMark / Overall | |
| Gigabyte Aero 16 YE5 | |
| Genomsnitt av klass Multimedia (866 - 2728, n=60, senaste 2 åren) | |
| Genomsnitt Intel Core i9-12900HK, NVIDIA GeForce RTX 3080 Ti Laptop GPU (970 - 2138, n=5) | |
| Lenovo ThinkPad X1 Extreme G4-20Y50040GE | |
| Apple MacBook Pro 16 2021 M1 Max | |
| CrossMark / Productivity | |
| Gigabyte Aero 16 YE5 | |
| Genomsnitt av klass Multimedia (931 - 2489, n=60, senaste 2 åren) | |
| Genomsnitt Intel Core i9-12900HK, NVIDIA GeForce RTX 3080 Ti Laptop GPU (921 - 2038, n=5) | |
| Lenovo ThinkPad X1 Extreme G4-20Y50040GE | |
| Apple MacBook Pro 16 2021 M1 Max | |
| CrossMark / Creativity | |
| Gigabyte Aero 16 YE5 | |
| Genomsnitt av klass Multimedia (907 - 3465, n=60, senaste 2 åren) | |
| Apple MacBook Pro 16 2021 M1 Max | |
| Genomsnitt Intel Core i9-12900HK, NVIDIA GeForce RTX 3080 Ti Laptop GPU (1007 - 2210, n=5) | |
| Lenovo ThinkPad X1 Extreme G4-20Y50040GE | |
| CrossMark / Responsiveness | |
| Gigabyte Aero 16 YE5 | |
| Genomsnitt Intel Core i9-12900HK, NVIDIA GeForce RTX 3080 Ti Laptop GPU (1012 - 2234, n=5) | |
| Lenovo ThinkPad X1 Extreme G4-20Y50040GE | |
| Genomsnitt av klass Multimedia (605 - 2024, n=60, senaste 2 åren) | |
| Apple MacBook Pro 16 2021 M1 Max | |
| AIDA64 / Memory Copy | |
| Genomsnitt av klass Multimedia (11299 - 132135, n=54, senaste 2 åren) | |
| Razer Blade 15 2022 | |
| Gigabyte Aero 16 YE5 | |
| Genomsnitt Intel Core i9-12900HK (42967 - 62959, n=15) | |
| Lenovo ThinkPad X1 Extreme G4-20Y50040GE | |
| AIDA64 / Memory Read | |
| Genomsnitt av klass Multimedia (11624 - 174586, n=54, senaste 2 åren) | |
| Razer Blade 15 2022 | |
| Gigabyte Aero 16 YE5 | |
| Genomsnitt Intel Core i9-12900HK (44419 - 66989, n=15) | |
| Lenovo ThinkPad X1 Extreme G4-20Y50040GE | |
| AIDA64 / Memory Write | |
| Genomsnitt av klass Multimedia (11755 - 134998, n=54, senaste 2 åren) | |
| Razer Blade 15 2022 | |
| Gigabyte Aero 16 YE5 | |
| Genomsnitt Intel Core i9-12900HK (42144 - 65268, n=15) | |
| Lenovo ThinkPad X1 Extreme G4-20Y50040GE | |
| AIDA64 / Memory Latency | |
| Genomsnitt av klass Multimedia (7 - 535, n=53, senaste 2 åren) | |
| Gigabyte Aero 16 YE5 | |
| Lenovo ThinkPad X1 Extreme G4-20Y50040GE | |
| Genomsnitt Intel Core i9-12900HK (79.9 - 109, n=15) | |
| Razer Blade 15 2022 | |
* ... mindre är bättre
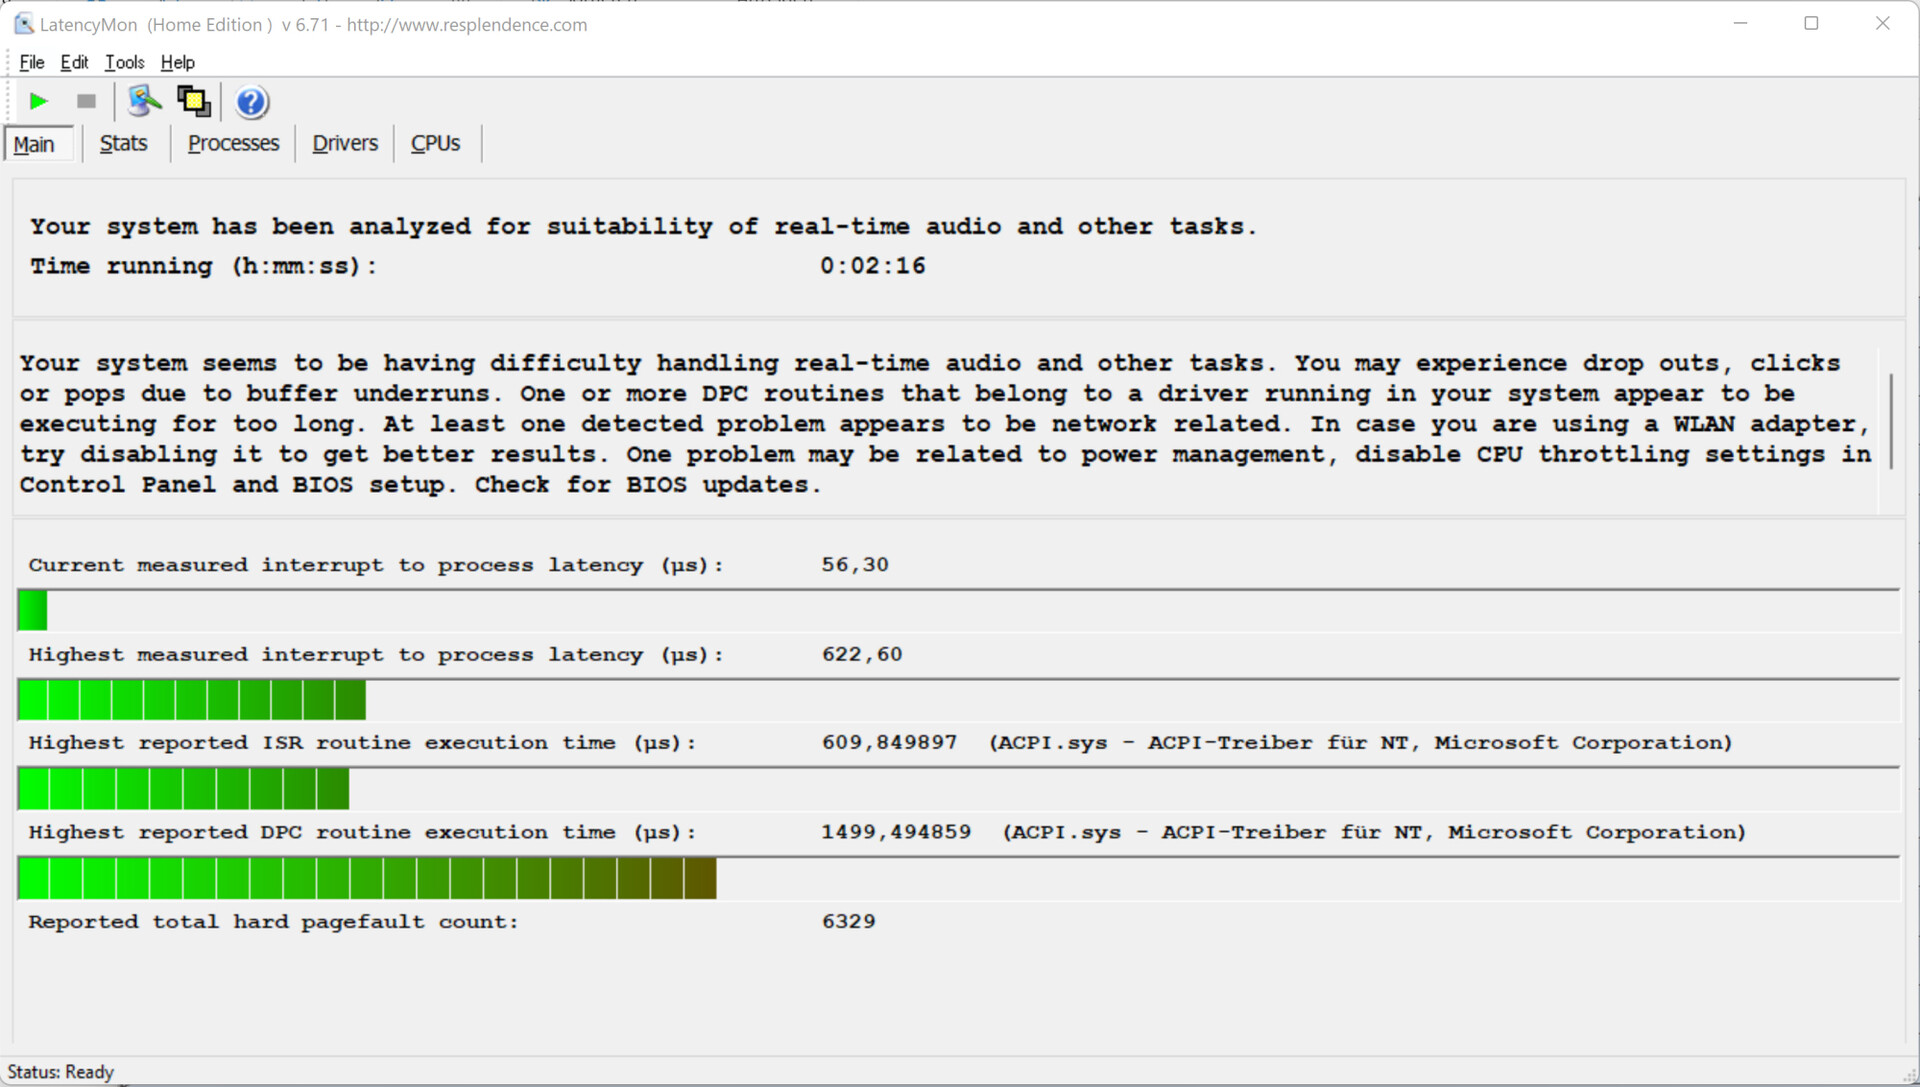
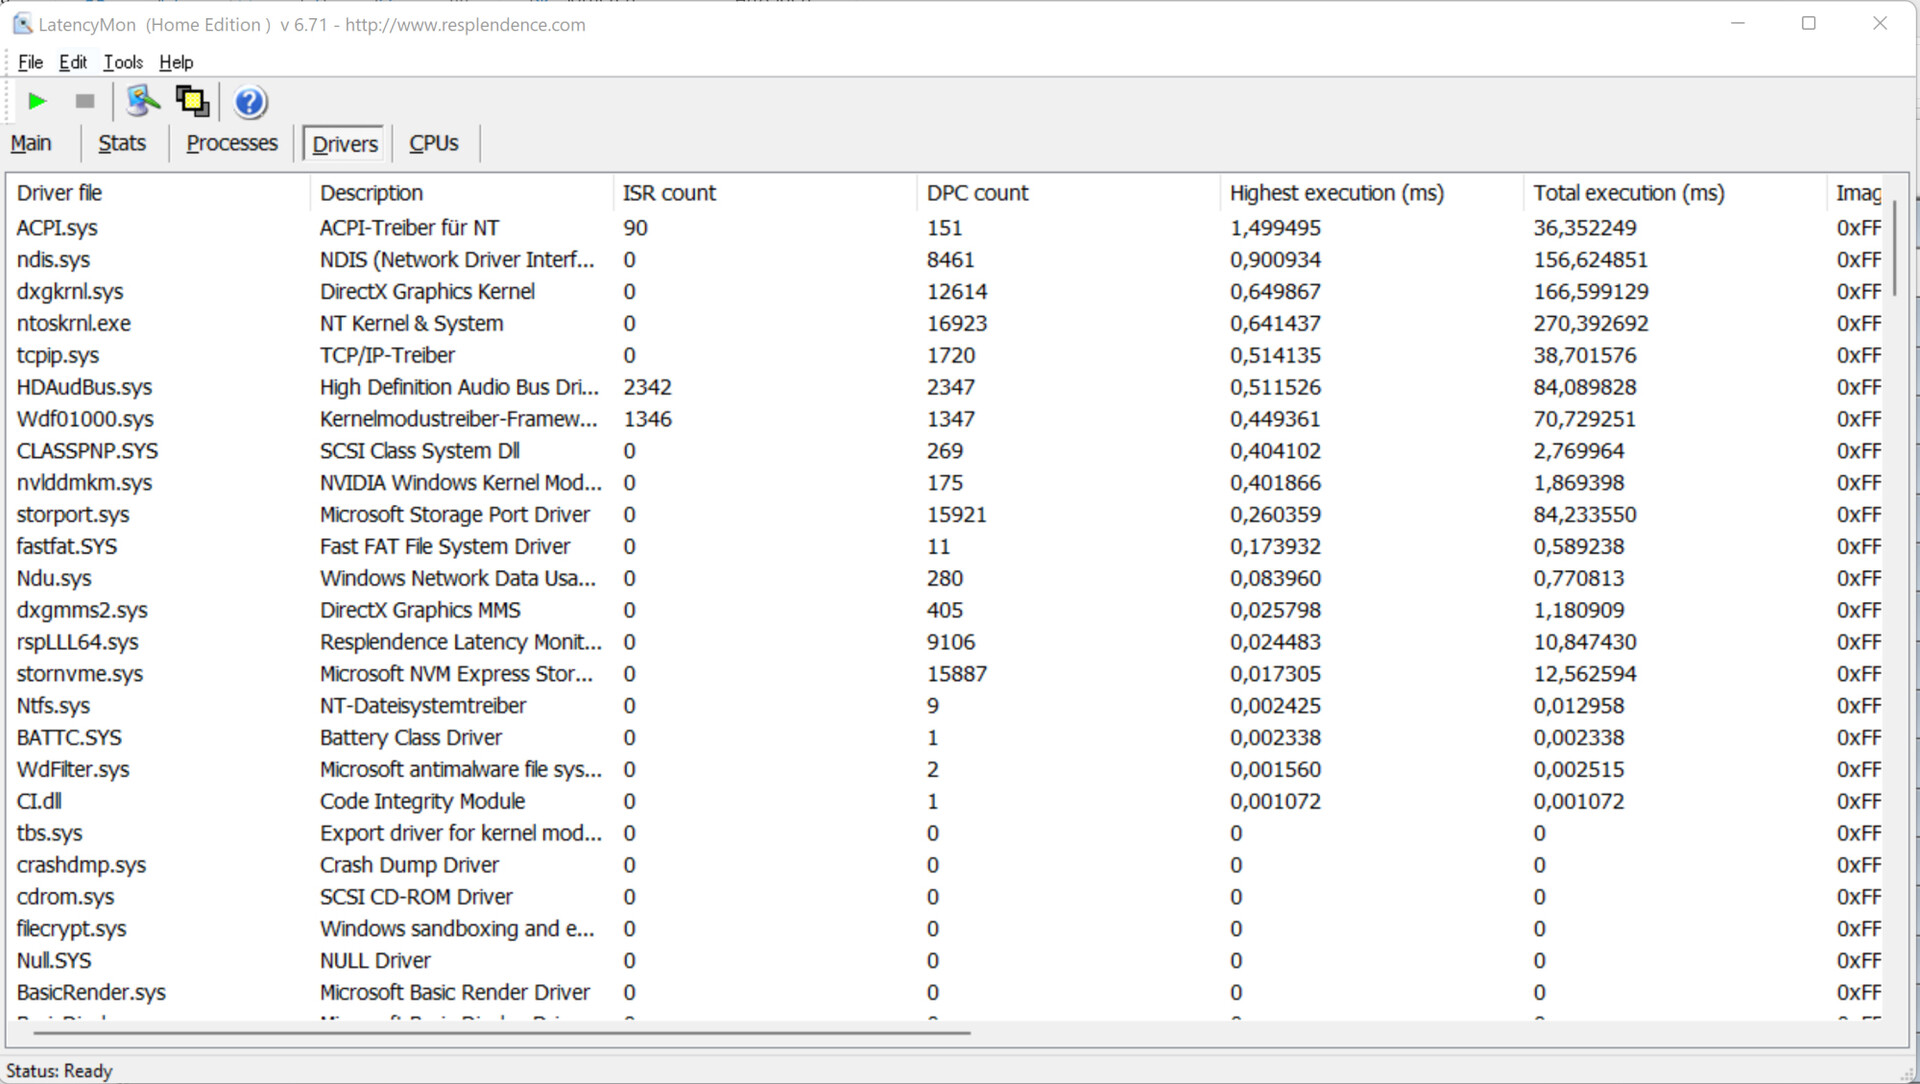
DPC-latenstider
I vårt standardiserade latensövervakningstest (surfning på webben, uppspelning av 4K-video, Prime95 hög belastning) kunde vi upptäcka några få inkonsekvenser i DPC-latenserna. Aero 16 verkar inte vara särskilt lämpad för video- och ljudredigering. Med det sagt lider vissa av dess konkurrenter av ännu högre DPC-latens. Tidigare har vi funnit att DPC-retarderna kan förbättras genom programuppdateringar med tiden. Tyvärr är det motsatta också möjligt.
| DPC Latencies / LatencyMon - interrupt to process latency (max), Web, Youtube, Prime95 | |
| Lenovo ThinkPad X1 Extreme G4-20Y50040GE | |
| HP ZBook Studio 15 G8 | |
| Razer Blade 15 2022 | |
| Schenker XMG Pro 15 (Late 2021) | |
| Gigabyte Aero 16 YE5 | |
* ... mindre är bättre
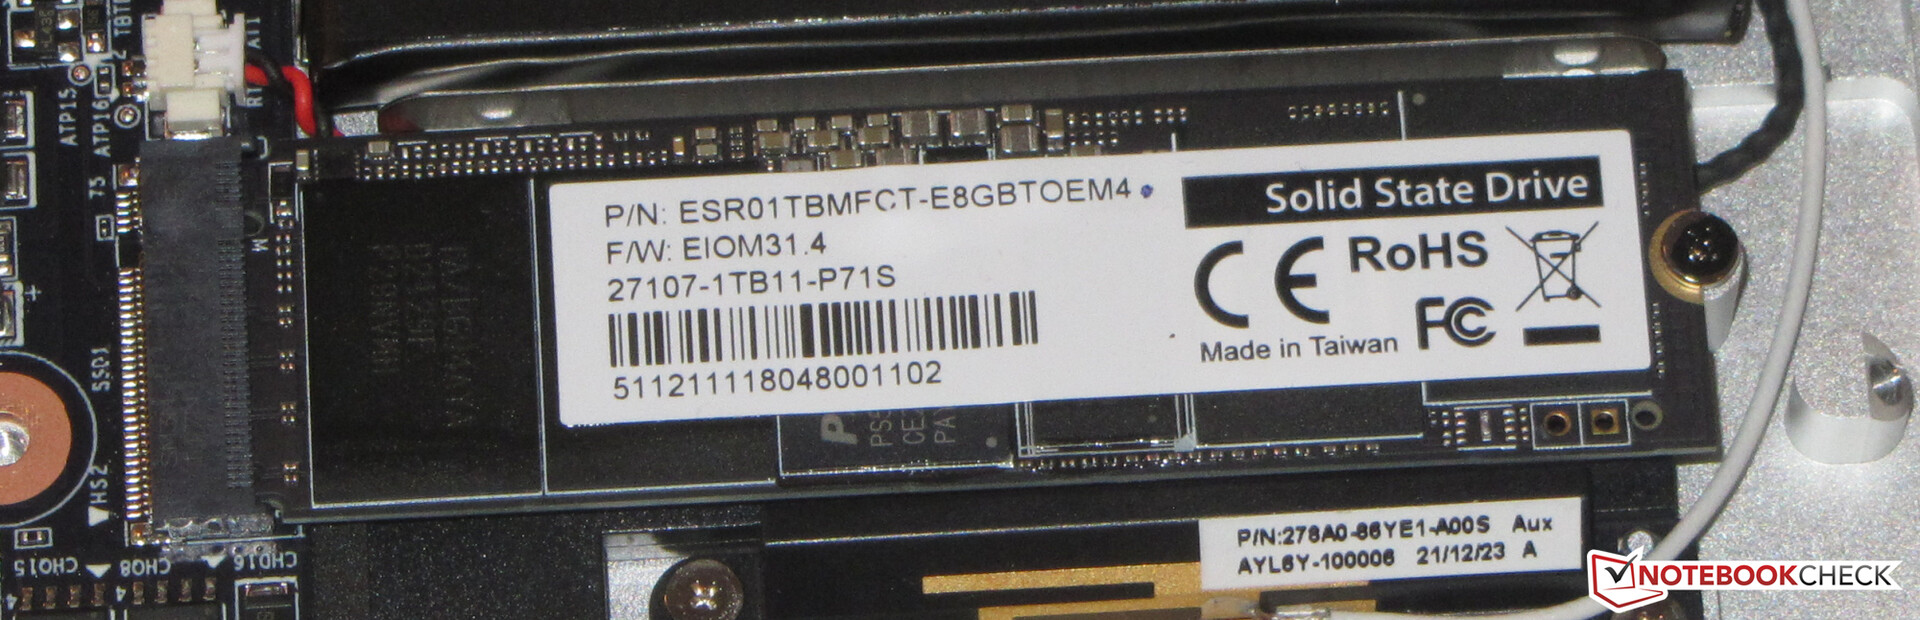
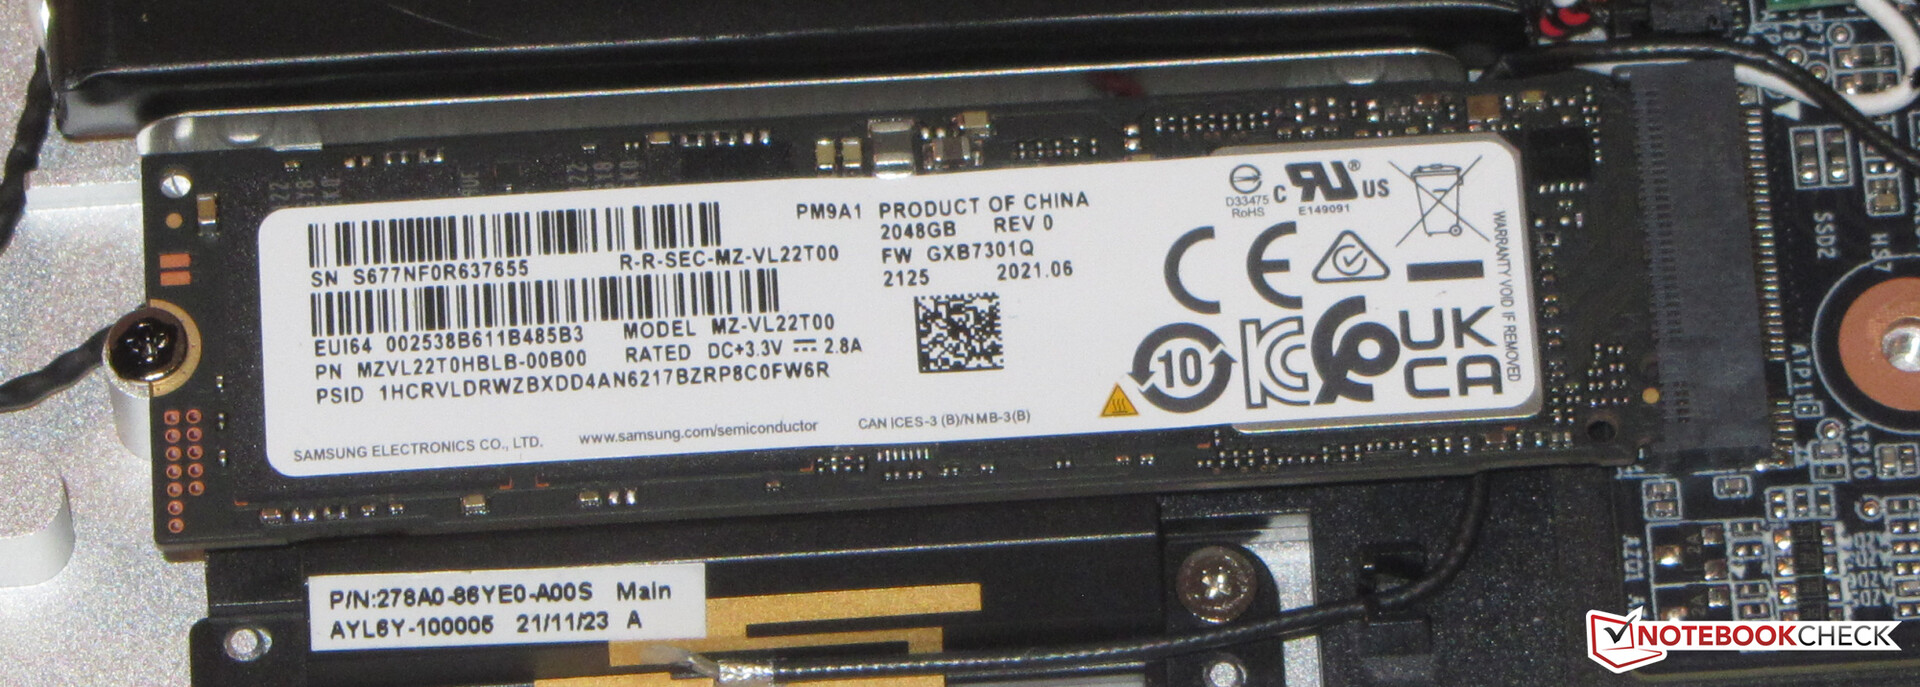
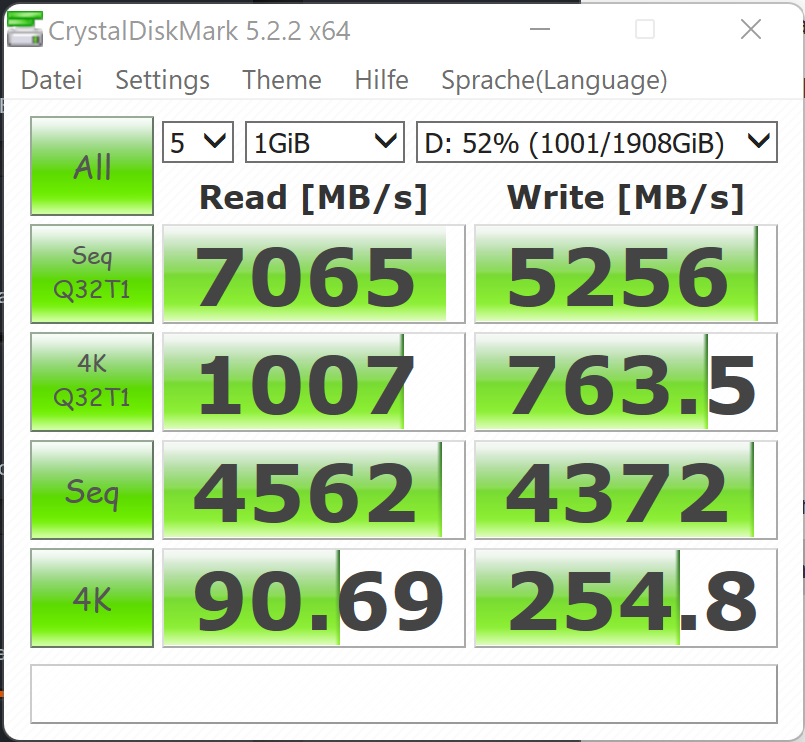
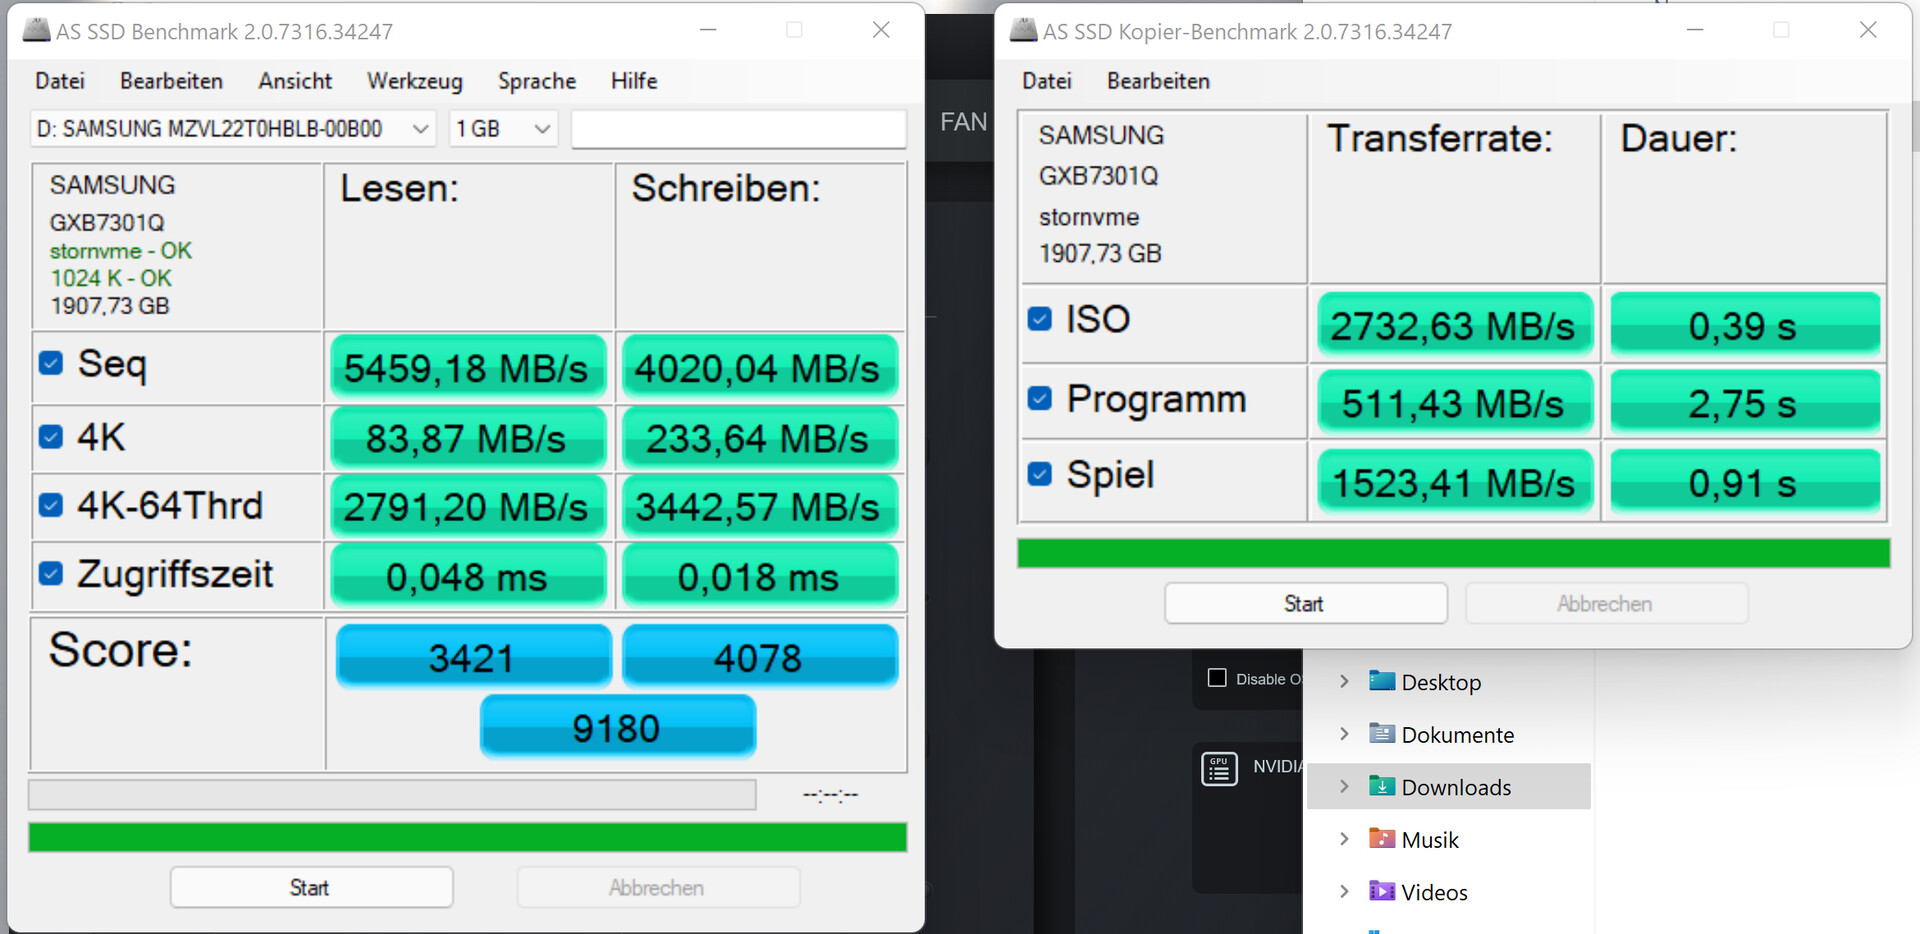
Lagringsenheter
Vår recensionsenhet hade två SSD-enheter installerade, en Samsung M.2-2280 på 2 TB och en Phison M.2-2280 på 1 TB, varav den sistnämnda användes för operativsystemet. Tack vare deras PCIe 4.0-gränssnitt presterade båda SSD-enheterna beundransvärt och mycket snabbt.

* ... mindre är bättre
Sustained Read: DiskSpd Read Loop, Queue Depth 8
Grafisk prestanda
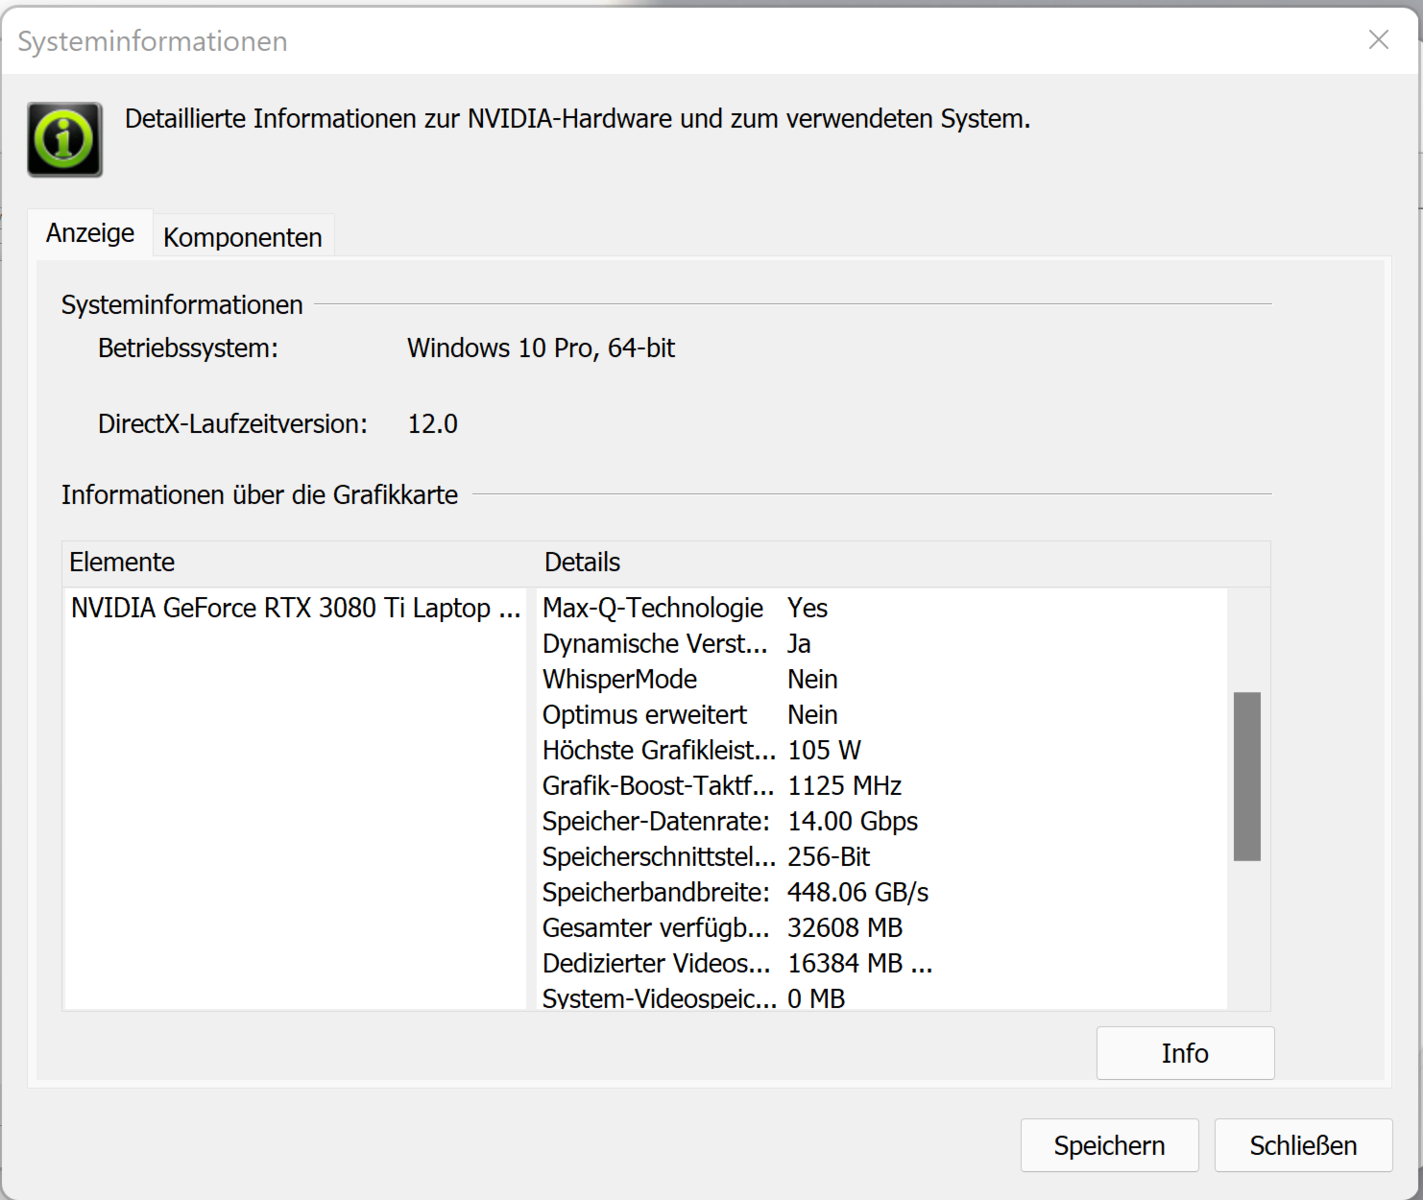
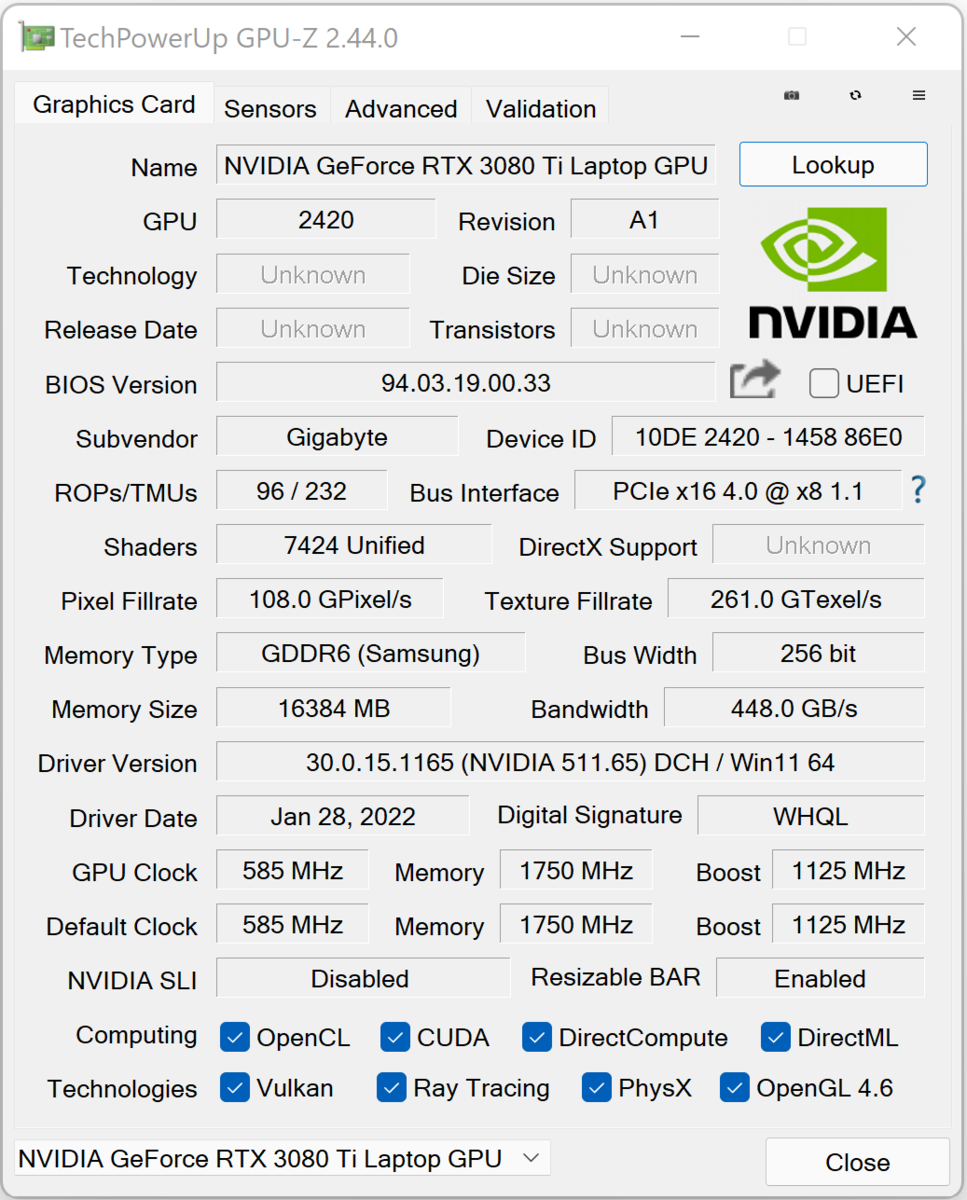
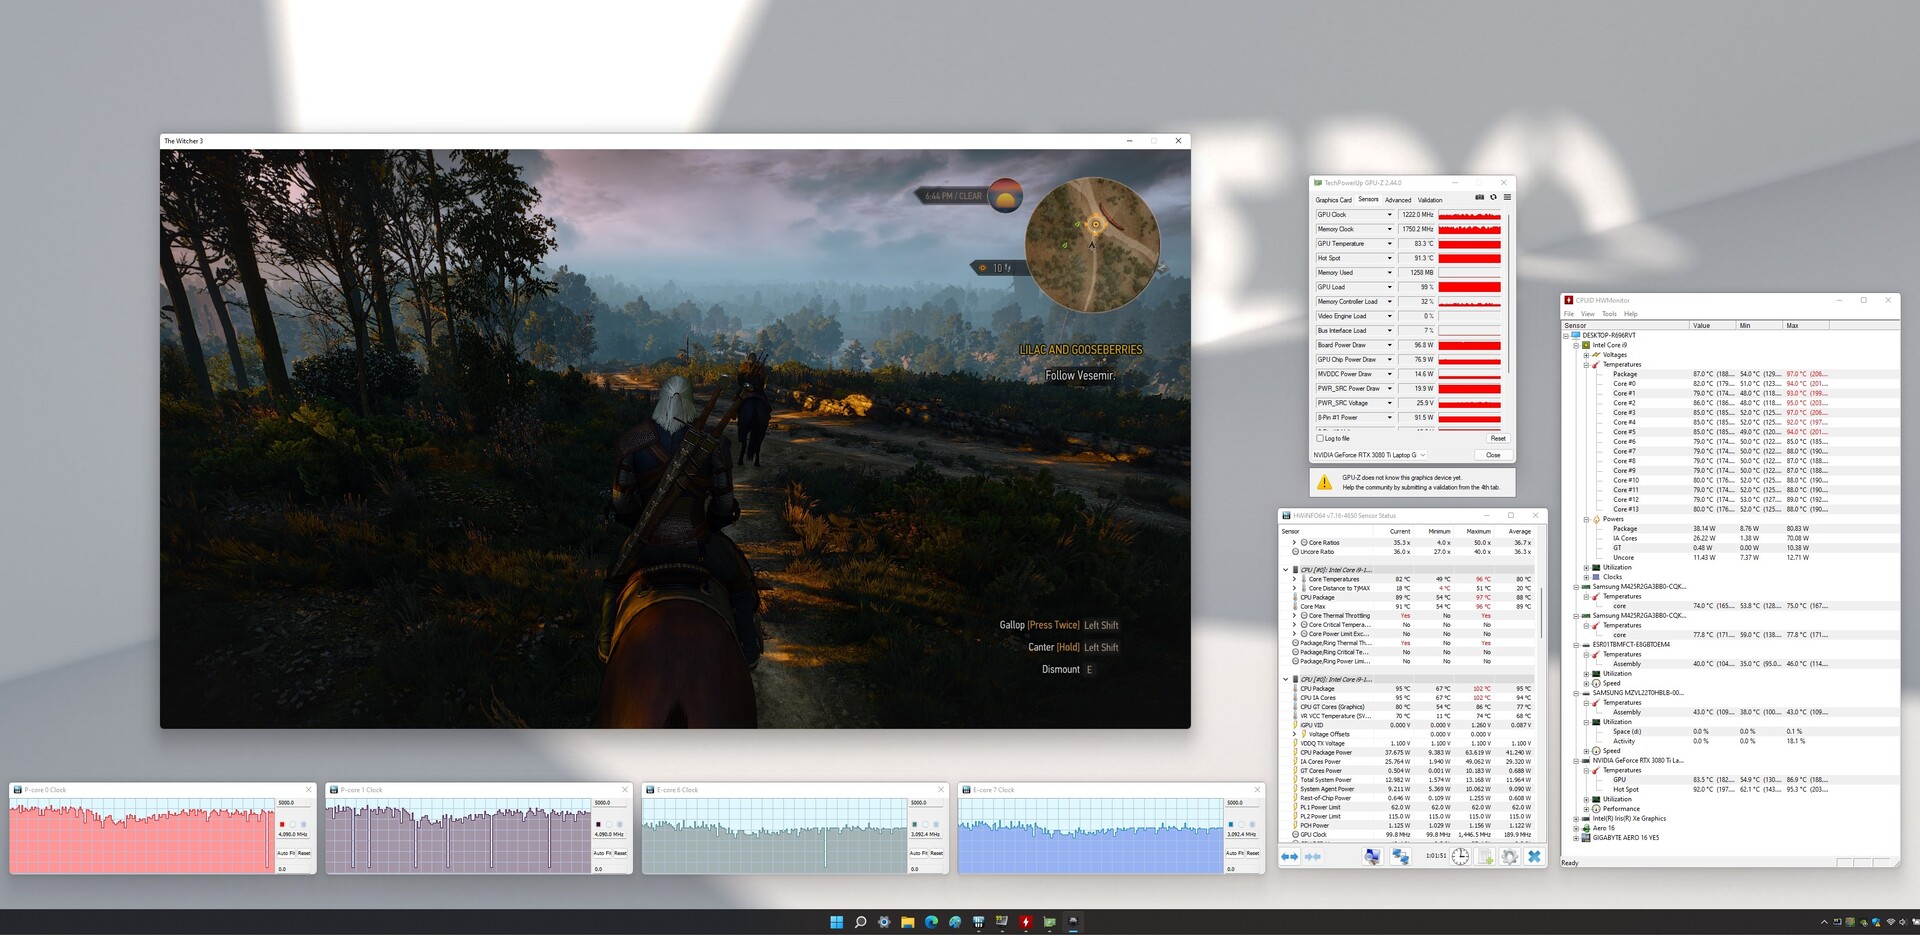
Som vi vet beror RTX 3000:s verkliga prestanda på ett antal faktorer, till exempel kylning, minneskonfiguration och maximal TGP som fastställts av OEM:n inom Nvidias fördefinierade gränser. I Aero 16 valde Gigabyte enNVIDIA GeForce RTX 3080 Ti Laptop GPU GPU - Benchmarks and SpecsGeForce RTX 3080 Ti Laptop GPU med maximal TGP på 105 W (90 W + 15 W Dynamic Boost).
I våra riktmärken presterade enheten långsammare än genomsnittet för alla tidigare testade RTX 3080 Ti utrustade enheter, tack vare dess jämförelsevis låga TGP. Dessutom visade vårt test på Witcher 3 att denna maximala TGP inte kan upprätthållas under långa perioder. Razer Blade 15, som är utrustad med exakt samma GPU, presterade märkbart bättre, bland annat tack vare dess ytterligare 5 W TGP-utrymme.
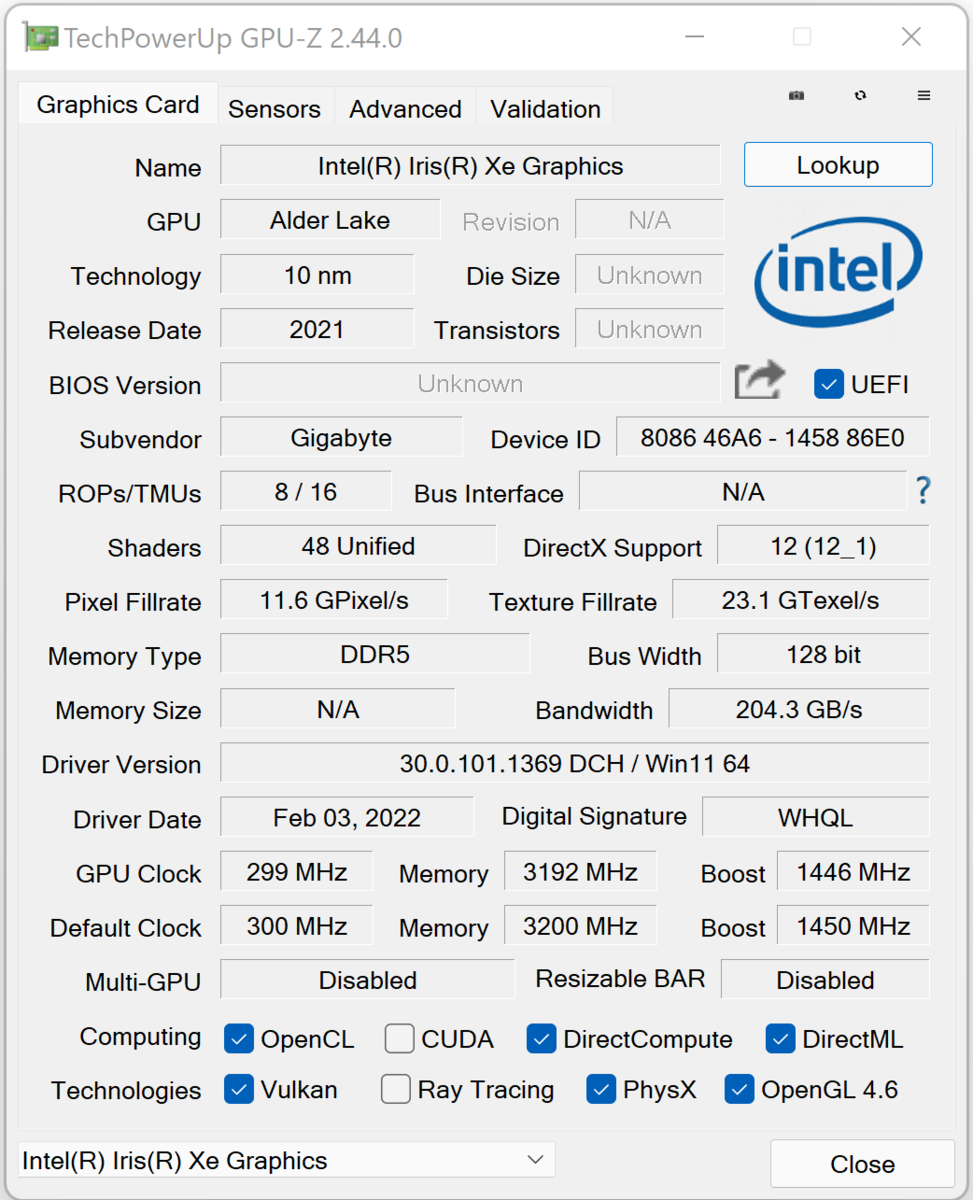
GPU:n har tillgång till totalt 16 GB GDDR6 VRAM, och den bärbara datorn stöder dynamisk GPU-omkoppling på begäran mellan den dedikerade GPU:n och den integreradeIris Xe Graphics G7 (Nvidia Optimus).
| 3DMark 06 Standard Score | 55891 poäng | |
| 3DMark 11 Performance | 30249 poäng | |
| 3DMark Cloud Gate Standard Score | 45491 poäng | |
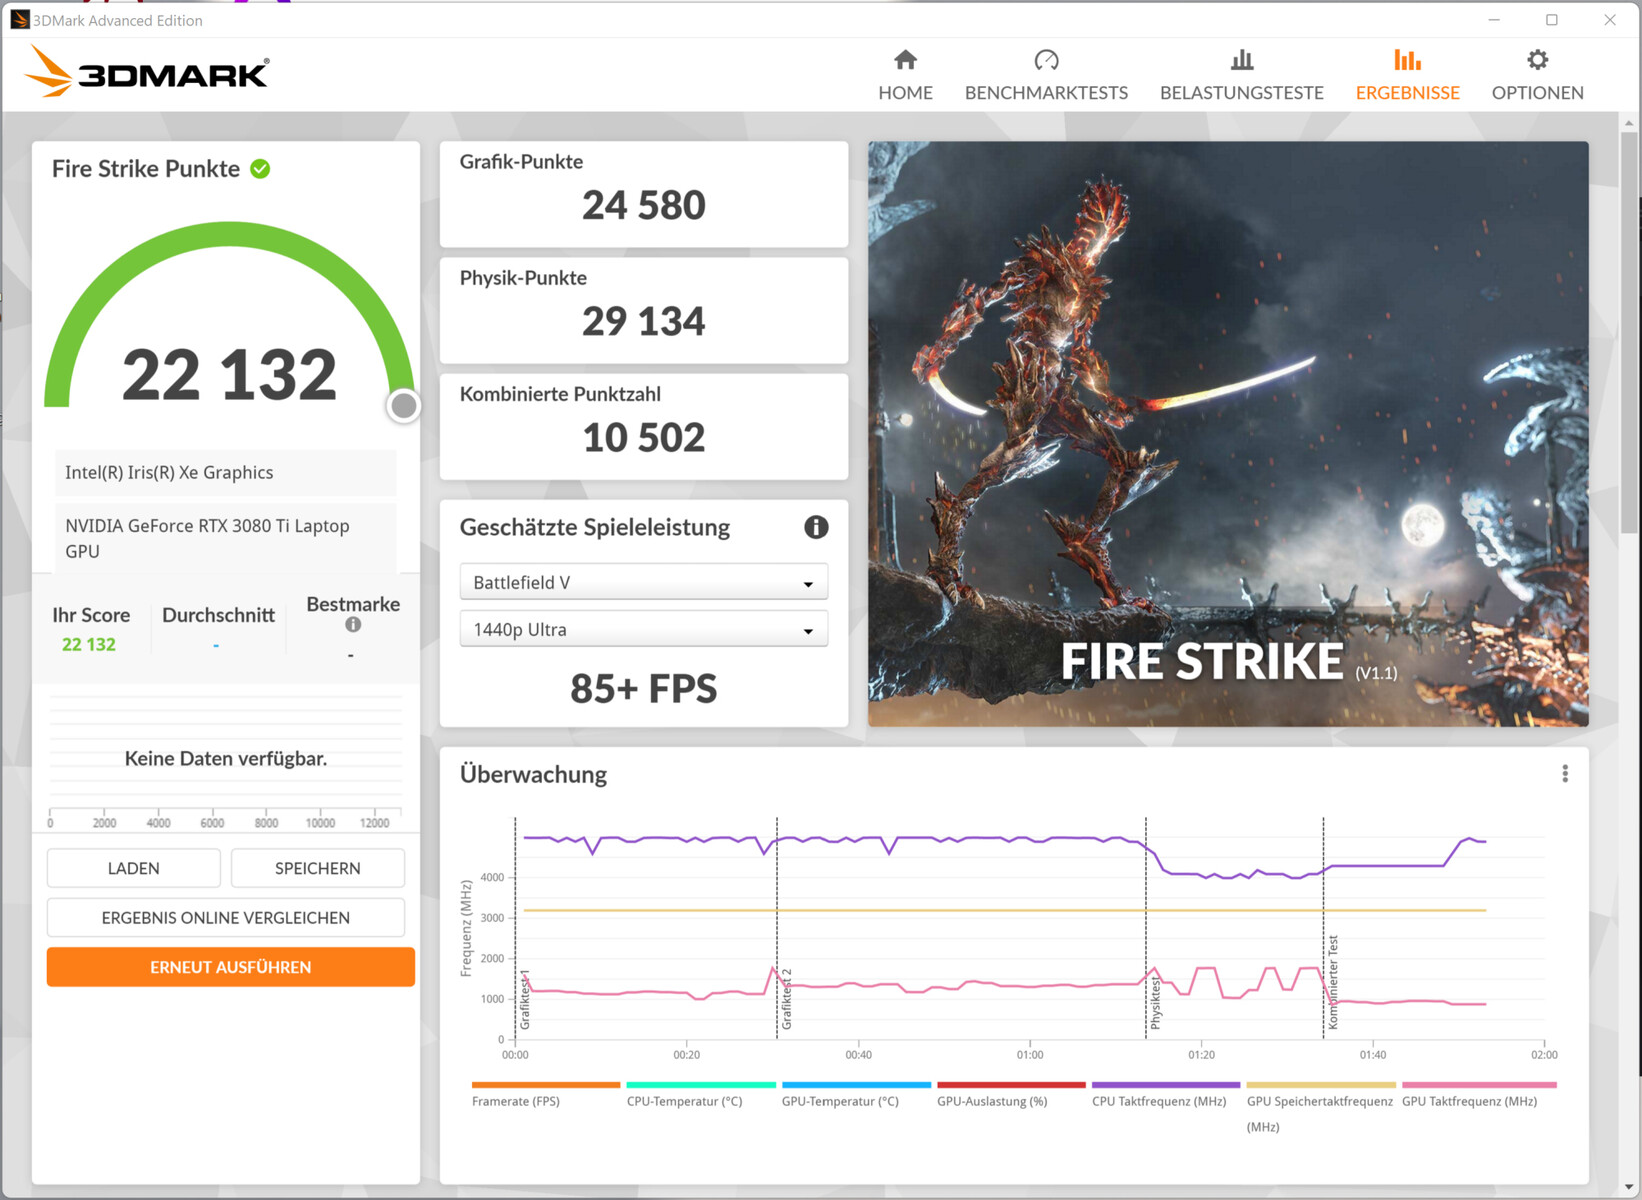
| 3DMark Fire Strike Score | 22132 poäng | |
| 3DMark Time Spy Score | 9875 poäng | |
Hjälp | ||
| 3DMark 11 - 1280x720 Performance GPU | |
| Genomsnitt NVIDIA GeForce RTX 3080 Ti Laptop GPU (13920 - 45841, n=45) | |
| Razer Blade 15 2022 | |
| Schenker XMG Pro 15 (Late 2021) | |
| Gigabyte Aero 16 YE5 (Turbo Mode) | |
| Lenovo ThinkPad X1 Extreme G4-20Y50040GE | |
| Gigabyte Aero 16 YE5 | |
| Gigabyte Aero 16 YE5 (Silence Mode) | |
| HP ZBook Studio 15 G8 | |
| Genomsnitt av klass Multimedia (3749 - 60002, n=55, senaste 2 åren) | |
| Geekbench 5.5 - OpenCL Score | |
| Genomsnitt NVIDIA GeForce RTX 3080 Ti Laptop GPU (88580 - 151633, n=41) | |
| Gigabyte Aero 16 YE5 (Turbo Mode) | |
| Gigabyte Aero 16 YE5 | |
| Razer Blade 15 2022 | |
| Lenovo ThinkPad X1 Extreme G4-20Y50040GE | |
| Gigabyte Aero 16 YE5 (Silence Mode) | |
| Schenker XMG Pro 15 (Late 2021) | |
| Genomsnitt av klass Multimedia (11562 - 217159, n=56, senaste 2 åren) | |
| Apple MacBook Pro 16 2021 M1 Max | |
| GFXBench | |
| on screen Aztec Ruins High Tier Onscreen | |
| Apple MacBook Pro 16 2021 M1 Max | |
| Gigabyte Aero 16 YE5 (DX11) | |
| Genomsnitt NVIDIA GeForce RTX 3080 Ti Laptop GPU (n=1) | |
| Genomsnitt av klass Multimedia (36.8 - 133.5, n=10, senaste 2 åren) | |
| 2560x1440 Aztec Ruins High Tier Offscreen | |
| Apple MacBook Pro 16 2021 M1 Max | |
| Genomsnitt NVIDIA GeForce RTX 3080 Ti Laptop GPU (262 - 328, n=2) | |
| Gigabyte Aero 16 YE5 (DX11) | |
| Genomsnitt av klass Multimedia (73.3 - 516, n=11, senaste 2 åren) | |
| on screen Aztec Ruins Normal Tier Onscreen | |
| Gigabyte Aero 16 YE5 (DX11) | |
| Genomsnitt NVIDIA GeForce RTX 3080 Ti Laptop GPU (n=1) | |
| Apple MacBook Pro 16 2021 M1 Max | |
| Genomsnitt av klass Multimedia (52 - 177.1, n=9, senaste 2 åren) | |
| 1920x1080 Aztec Ruins Normal Tier Offscreen | |
| Apple MacBook Pro 16 2021 M1 Max | |
| Gigabyte Aero 16 YE5 (DX11) | |
| Genomsnitt NVIDIA GeForce RTX 3080 Ti Laptop GPU (n=1) | |
| Genomsnitt av klass Multimedia (178.3 - 1302, n=11, senaste 2 åren) | |
| V-Ray Benchmark Next 4.10 | |
| GPU | |
| Genomsnitt NVIDIA GeForce RTX 3080 Ti Laptop GPU (311 - 552, n=35) | |
| Gigabyte Aero 16 YE5 (v4.10.07 ) | |
| Gigabyte Aero 16 YE5 (v4.10.07, Turbo Mode) | |
| Schenker XMG Pro 15 (Late 2021) (v4.10.07 ) | |
| Gigabyte Aero 16 YE5 (v4.10.07, Silence Mode) | |
| Genomsnitt av klass Multimedia (32 - 1191, n=53, senaste 2 åren) | |
| CPU | |
| Gigabyte Aero 16 YE5 (v4.10.07, Turbo Mode) | |
| Genomsnitt NVIDIA GeForce RTX 3080 Ti Laptop GPU (5564 - 23947, n=35) | |
| Genomsnitt av klass Multimedia (4772 - 35165, n=53, senaste 2 åren) | |
| Gigabyte Aero 16 YE5 (v4.10.07 ) | |
| Schenker XMG Pro 15 (Late 2021) (v4.10.07 ) | |
| Gigabyte Aero 16 YE5 (v4.10.07, Silence Mode) | |
Spelprestanda
Tack vare den kraftfulla hårdvaran kör Aero 16 alla aktuella spel smidigt i FHD-upplösning och med maximal detaljrikedom. Detta gäller även för högre upplösningar om än ibland med minskade detaljer. På det stora hela presterade den bärbara datorn något långsammare än den genomsnittliga RTX 3080 Ti-utrustade enheten.
| The Witcher 3 | |
| 1920x1080 Ultra Graphics & Postprocessing (HBAO+) | |
| Genomsnitt NVIDIA GeForce RTX 3080 Ti Laptop GPU (30 - 130.6, n=43) | |
| Razer Blade 15 2022 | |
| Schenker XMG Pro 15 (Late 2021) | |
| Gigabyte Aero 16 YE5 (Turbo Mode) | |
| Gigabyte Aero 16 YE5 | |
| Lenovo ThinkPad X1 Extreme G4-20Y50040GE | |
| HP ZBook Studio 15 G8 | |
| Gigabyte Aero 16 YE5 (SIlence Mode) | |
| Genomsnitt av klass Multimedia (11 - 121, n=7, senaste 2 åren) | |
| 3840x2160 High Graphics & Postprocessing (Nvidia HairWorks Off) | |
| Genomsnitt NVIDIA GeForce RTX 3080 Ti Laptop GPU (62.1 - 94.3, n=8) | |
| Schenker XMG Pro 15 (Late 2021) | |
| Genomsnitt av klass Multimedia (61 - 71, n=2, senaste 2 åren) | |
| Gigabyte Aero 16 YE5 | |
| HP ZBook Studio 15 G8 | |
| Dota 2 Reborn | |
| 1920x1080 ultra (3/3) best looking | |
| Gigabyte Aero 16 YE5 | |
| Gigabyte Aero 16 YE5 (Turbo Mode) | |
| Razer Blade 15 2022 | |
| Genomsnitt NVIDIA GeForce RTX 3080 Ti Laptop GPU (29.9 - 170.5, n=45) | |
| Schenker XMG Pro 15 (Late 2021) | |
| HP ZBook Studio 15 G8 | |
| Lenovo ThinkPad X1 Extreme G4-20Y50040GE | |
| Genomsnitt av klass Multimedia (29 - 179.9, n=59, senaste 2 åren) | |
| Gigabyte Aero 16 YE5 (Silence Mode) | |
| 3840x2160 ultra (3/3) best looking | |
| Genomsnitt av klass Multimedia (106.4 - 139.3, n=4, senaste 2 åren) | |
| Genomsnitt NVIDIA GeForce RTX 3080 Ti Laptop GPU (70.8 - 155.6, n=19) | |
| Gigabyte Aero 16 YE5 (Turbo Mode) | |
| Schenker XMG Pro 15 (Late 2021) | |
| Gigabyte Aero 16 YE5 | |
| HP ZBook Studio 15 G8 | |
| Gigabyte Aero 16 YE5 (Silence Mode) | |
| Lenovo ThinkPad X1 Extreme G4-20Y50040GE | |
| X-Plane 11.11 | |
| 1920x1080 high (fps_test=3) | |
| Razer Blade 15 2022 | |
| Gigabyte Aero 16 YE5 | |
| Gigabyte Aero 16 YE5 (Turbo Mode) | |
| Genomsnitt NVIDIA GeForce RTX 3080 Ti Laptop GPU (32.6 - 127, n=45) | |
| Schenker XMG Pro 15 (Late 2021) | |
| HP ZBook Studio 15 G8 | |
| Lenovo ThinkPad X1 Extreme G4-20Y50040GE | |
| Gigabyte Aero 16 YE5 (Silence Mode) | |
| Genomsnitt av klass Multimedia (16.9 - 141.1, n=54, senaste 2 åren) | |
| 3840x2160 high (fps_test=3) | |
| Genomsnitt NVIDIA GeForce RTX 3080 Ti Laptop GPU (32.9 - 109.5, n=20) | |
| Gigabyte Aero 16 YE5 (Turbo Mode) | |
| Gigabyte Aero 16 YE5 | |
| Genomsnitt av klass Multimedia (63.4 - 114.7, n=4, senaste 2 åren) | |
| Schenker XMG Pro 15 (Late 2021) | |
| HP ZBook Studio 15 G8 | |
| Gigabyte Aero 16 YE5 (Silence Mode) | |
| Lenovo ThinkPad X1 Extreme G4-20Y50040GE | |
| Final Fantasy XV Benchmark | |
| 1920x1080 High Quality | |
| Genomsnitt NVIDIA GeForce RTX 3080 Ti Laptop GPU (30.7 - 140.6, n=42) | |
| Razer Blade 15 2022 (1.3) | |
| Schenker XMG Pro 15 (Late 2021) (1.3) | |
| Gigabyte Aero 16 YE5 (1.3, Turbo Mode) | |
| Gigabyte Aero 16 YE5 (1.3) | |
| HP ZBook Studio 15 G8 (1.3) | |
| Lenovo ThinkPad X1 Extreme G4-20Y50040GE (1.3) | |
| Genomsnitt av klass Multimedia (7.61 - 144.4, n=57, senaste 2 åren) | |
| 3840x2160 High Quality | |
| Genomsnitt av klass Multimedia (42 - 83.4, n=4, senaste 2 åren) | |
| Genomsnitt NVIDIA GeForce RTX 3080 Ti Laptop GPU (35.1 - 61.2, n=18) | |
| Schenker XMG Pro 15 (Late 2021) (1.3) | |
| Gigabyte Aero 16 YE5 (1.3, Turbo Mode) | |
| Gigabyte Aero 16 YE5 (1.3) | |
| Lenovo ThinkPad X1 Extreme G4-20Y50040GE (1.3) | |
| HP ZBook Studio 15 G8 (1.3) | |
| Gigabyte Aero 16 YE5 (1.3, Silence Mode) | |
| GTA V | |
| 1920x1080 Highest AA:4xMSAA + FX AF:16x | |
| Razer Blade 15 2022 | |
| Gigabyte Aero 16 YE5 (Turbo Mode) | |
| Gigabyte Aero 16 YE5 | |
| Genomsnitt NVIDIA GeForce RTX 3080 Ti Laptop GPU (30 - 139.2, n=42) | |
| Schenker XMG Pro 15 (Late 2021) | |
| Genomsnitt av klass Multimedia (7.92 - 141.6, n=55, senaste 2 åren) | |
| Gigabyte Aero 16 YE5 (Silence Mode) | |
| 3840x2160 Highest AA:4xMSAA + FX AF:16x | |
| Genomsnitt av klass Multimedia (39.3 - 90.1, n=2, senaste 2 åren) | |
| Genomsnitt NVIDIA GeForce RTX 3080 Ti Laptop GPU (37.7 - 67.2, n=14) | |
| Schenker XMG Pro 15 (Late 2021) | |
| Gigabyte Aero 16 YE5 (Turbo Mode) | |
| Gigabyte Aero 16 YE5 | |
| Gigabyte Aero 16 YE5 (Silence Mode) | |
| Strange Brigade | |
| 1920x1080 ultra AA:ultra AF:16 | |
| Genomsnitt NVIDIA GeForce RTX 3080 Ti Laptop GPU (42.3 - 224, n=41) | |
| Razer Blade 15 2022 (1.47.22.14 D3D12) | |
| Schenker XMG Pro 15 (Late 2021) (1.47.22.14 D3D12) | |
| Gigabyte Aero 16 YE5 (1.47.22.14 D3D12, Turbo Mode) | |
| Gigabyte Aero 16 YE5 (1.47.22.14 D3D12) | |
| Gigabyte Aero 16 YE5 (1.47.22.14 D3D12, Silence Mode) | |
| Genomsnitt av klass Multimedia (13.3 - 303, n=57, senaste 2 åren) | |
| 3840x2160 ultra AA:ultra AF:16 | |
| Genomsnitt av klass Multimedia (68.4 - 151.4, n=2, senaste 2 åren) | |
| Genomsnitt NVIDIA GeForce RTX 3080 Ti Laptop GPU (61.7 - 100.7, n=15) | |
| Schenker XMG Pro 15 (Late 2021) (1.47.22.14 D3D12) | |
| Gigabyte Aero 16 YE5 (1.47.22.14 D3D12, Turbo Mode) | |
| Gigabyte Aero 16 YE5 (1.47.22.14 D3D12) | |
| Gigabyte Aero 16 YE5 (1.47.22.14 D3D12, Silence Mode) | |
| F1 2021 | |
| 1920x1080 Ultra High Preset + Raytracing AA:T AF:16x | |
| Genomsnitt NVIDIA GeForce RTX 3080 Ti Laptop GPU (30.2 - 160.6, n=30) | |
| Schenker XMG Pro 15 (Late 2021) (831795) | |
| Gigabyte Aero 16 YE5 (852849, Turbo Mode) | |
| Gigabyte Aero 16 YE5 (852849) | |
| Gigabyte Aero 16 YE5 (852849, Silence Mode) | |
| 3840x2160 Ultra High Preset + Raytracing AA:T AF:16x | |
| Genomsnitt NVIDIA GeForce RTX 3080 Ti Laptop GPU (41.1 - 70.2, n=18) | |
| Gigabyte Aero 16 YE5 (852849, Turbo Mode) | |
| Schenker XMG Pro 15 (Late 2021) (831795) | |
| Gigabyte Aero 16 YE5 (852849) | |
| Gigabyte Aero 16 YE5 (852849, Silence Mode) | |
| Riders Republic | |
| 1920x1080 Ultra Preset | |
| Genomsnitt NVIDIA GeForce RTX 3080 Ti Laptop GPU (92 - 129, n=3) | |
| Schenker XMG Pro 15 (Late 2021) | |
| Gigabyte Aero 16 YE5 | |
| 3840x2160 Ultra Preset | |
| Genomsnitt NVIDIA GeForce RTX 3080 Ti Laptop GPU (39 - 56, n=2) | |
| Schenker XMG Pro 15 (Late 2021) | |
| Gigabyte Aero 16 YE5 | |
| Forza Horizon 5 | |
| 1920x1080 Extreme Preset | |
| Schenker XMG Pro 15 (Late 2021) | |
| Genomsnitt NVIDIA GeForce RTX 3080 Ti Laptop GPU (48 - 95, n=5) | |
| Gigabyte Aero 16 YE5 | |
| 3840x2160 Extreme Preset | |
| Genomsnitt NVIDIA GeForce RTX 3080 Ti Laptop GPU (38 - 61, n=2) | |
| Schenker XMG Pro 15 (Late 2021) | |
| Gigabyte Aero 16 YE5 | |
| Rainbow Six Extraction | |
| 1920x1080 Ultra Preset (with Fixed Resolution Quality) | |
| Genomsnitt NVIDIA GeForce RTX 3080 Ti Laptop GPU (128 - 169, n=3) | |
| Gigabyte Aero 16 YE5 | |
| 3840x2160 Ultra Preset (with Fixed Resolution Quality) | |
| Genomsnitt NVIDIA GeForce RTX 3080 Ti Laptop GPU (44 - 57, n=2) | |
| Gigabyte Aero 16 YE5 | |
| GRID Legends | |
| 1920x1080 Ultra Preset | |
| Genomsnitt NVIDIA GeForce RTX 3080 Ti Laptop GPU (100.4 - 102.6, n=2) | |
| Gigabyte Aero 16 YE5 | |
| 3840x2160 Ultra Preset | |
| Gigabyte Aero 16 YE5 | |
| Genomsnitt NVIDIA GeForce RTX 3080 Ti Laptop GPU (n=1) | |
| Cyberpunk 2077 1.6 | |
| 1920x1080 Ultra Preset | |
| Genomsnitt NVIDIA GeForce RTX 3080 Ti Laptop GPU (54 - 144.1, n=16) | |
| Gigabyte Aero 16 YE5 | |
| 3840x2160 Ultra Preset | |
| Genomsnitt NVIDIA GeForce RTX 3080 Ti Laptop GPU (19.6 - 32.4, n=6) | |
| Gigabyte Aero 16 YE5 | |
| 1920x1080 Ray Tracing Ultra Preset (DLSS off) | |
| Gigabyte Aero 16 YE5 | |
| Genomsnitt NVIDIA GeForce RTX 3080 Ti Laptop GPU (39.2 - 49.9, n=7) | |
| 3840x2160 Ray Tracing Ultra Preset (DLSS off) | |
| Genomsnitt NVIDIA GeForce RTX 3080 Ti Laptop GPU (9.22 - 12.3, n=3) | |
| Gigabyte Aero 16 YE5 | |
| Elex 2 | |
| 1920x1080 Ultra / On AA:SM AF:16x | |
| Gigabyte Aero 16 YE5 | |
| Genomsnitt NVIDIA GeForce RTX 3080 Ti Laptop GPU (31 - 91, n=3) | |
| 3840x2160 Ultra / On AA:SM AF:16x | |
| Gigabyte Aero 16 YE5 | |
| Genomsnitt NVIDIA GeForce RTX 3080 Ti Laptop GPU (n=1) | |
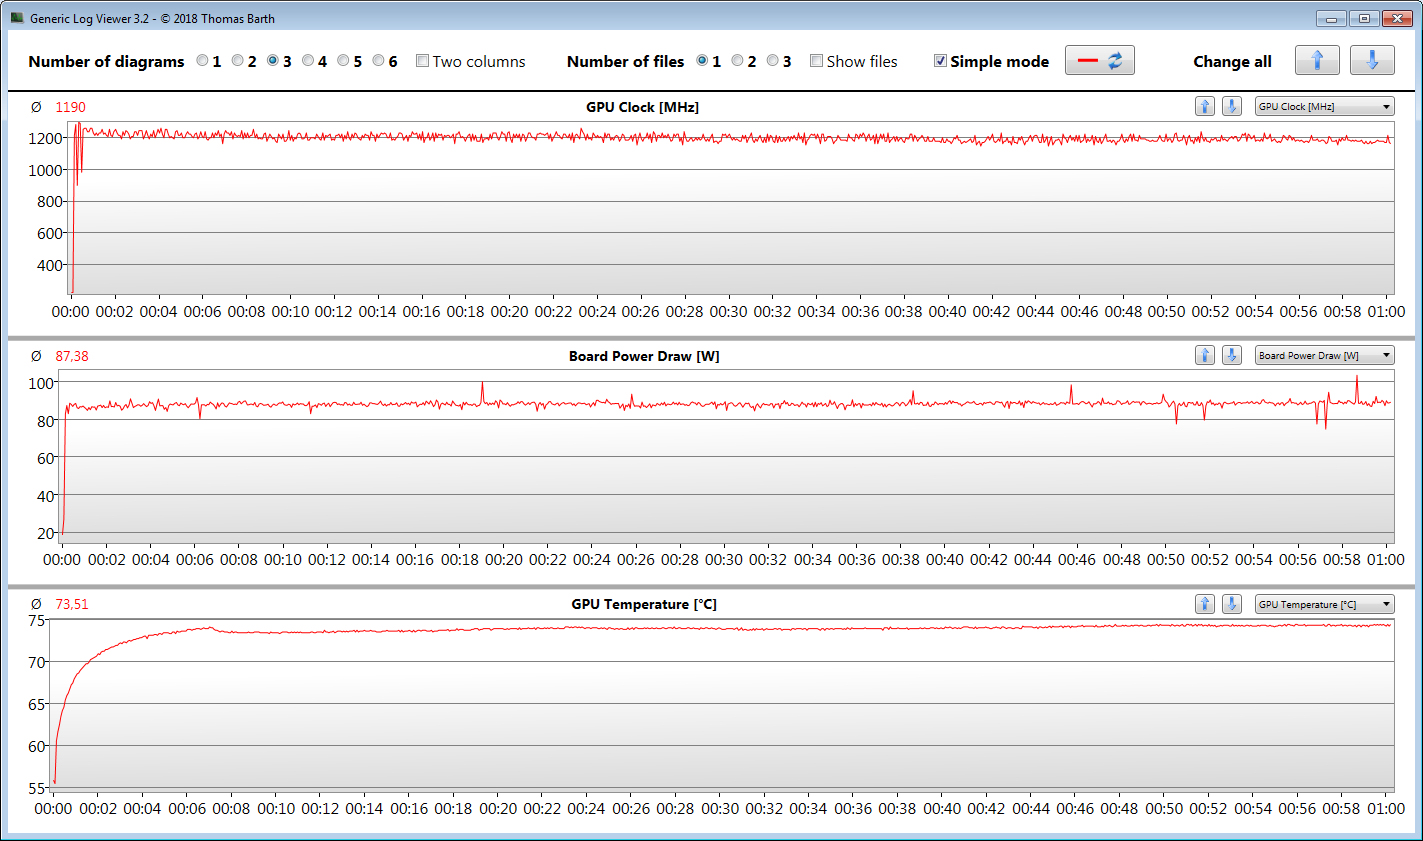
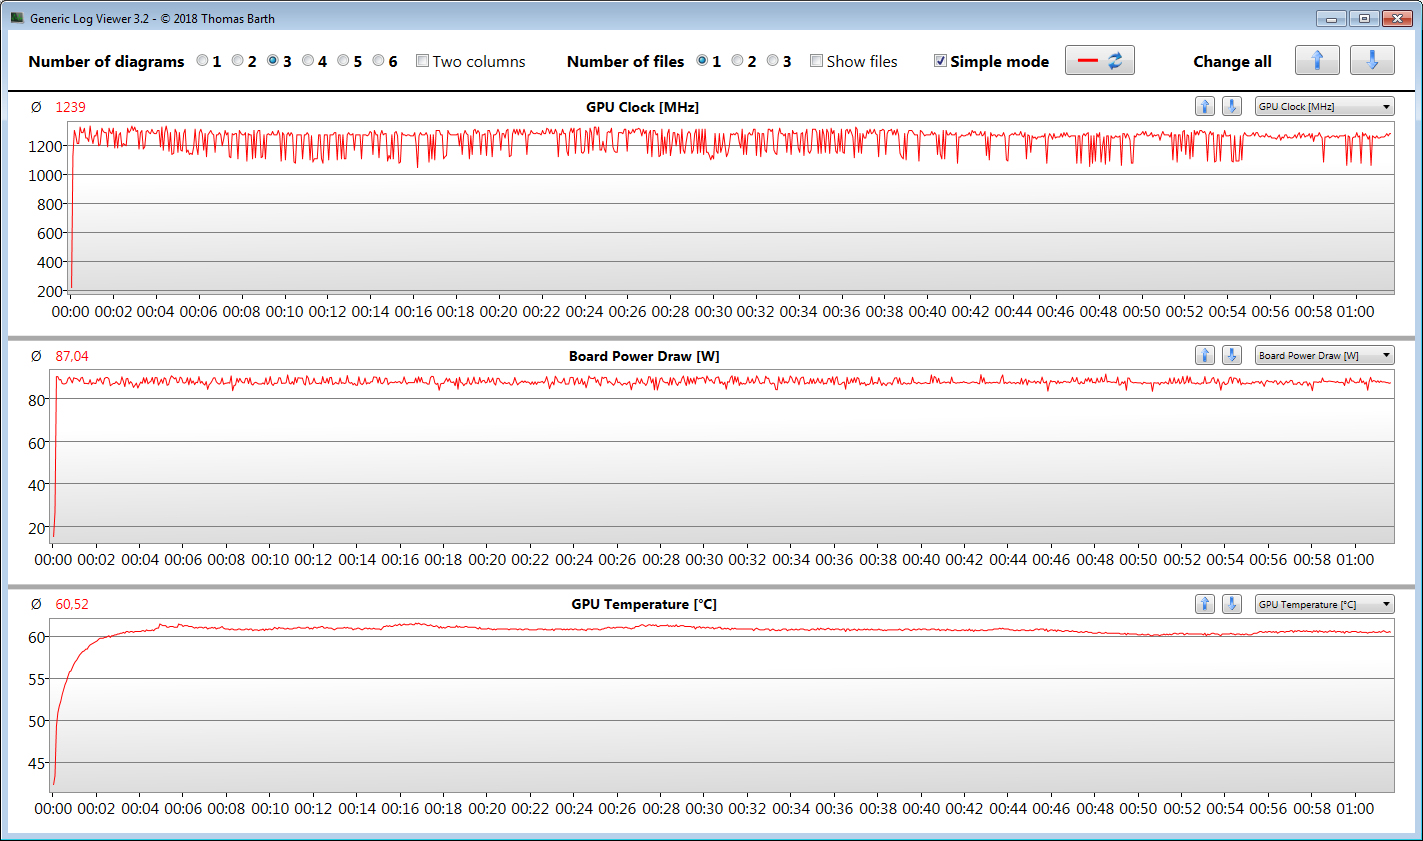
Vi kör Witcher 3 i 60 minuter i FHD och maximal detaljering för att avgöra om en enhet kan upprätthålla en konstant hög prestanda under långa perioder eller inte. Avataren är stationär under hela testet för att säkerställa jämförbarhet. I det här fallet hittade vi inga tecken på minskad bildfrekvens under hela testet.
Witcher 3 FPS Graph
| låg | med. | hög | ultra | QHD | 4K | |
|---|---|---|---|---|---|---|
| GTA V (2015) | 187 | 185 | 179 | 113 | 82.7 | 78.2 |
| The Witcher 3 (2015) | 408 | 278 | 144 | 92.2 | 64 | |
| Dota 2 Reborn (2015) | 191 | 176 | 168 | 160 | 112 | |
| Final Fantasy XV Benchmark (2018) | 195 | 110 | 85.8 | 64.8 | 40.1 | |
| X-Plane 11.11 (2018) | 154 | 134 | 108 | 78.6 | ||
| Far Cry 5 (2018) | 189 | 141 | 130 | 122 | 86 | 45 |
| Strange Brigade (2018) | 424 | 200 | 168 | 151 | 113 | 68.4 |
| F1 2021 (2021) | 383 | 236 | 196 | 103 | 84 | 47.3 |
| Riders Republic (2021) | 202 | 126 | 101 | 92 | 65 | 39 |
| Forza Horizon 5 (2021) | 221 | 131 | 116 | 72 | 61 | 38 |
| Rainbow Six Extraction (2022) | 185 | 160 | 157 | 128 | 87 | 44 |
| Dying Light 2 (2022) | 97.1 | 79 | 69.2 | 49.6 | 27.3 | |
| GRID Legends (2022) | 206.6 | 159.5 | 139.2 | 100.4 | 81 | 54.4 |
| Cyberpunk 2077 1.6 (2022) | 121.7 | 96.4 | 72.4 | 73.2 | 39.7 | 19.6 |
| Elex 2 (2022) | 93.5 | 89.5 | 76.5 | 70.3 | 48.1 | 28.2 |
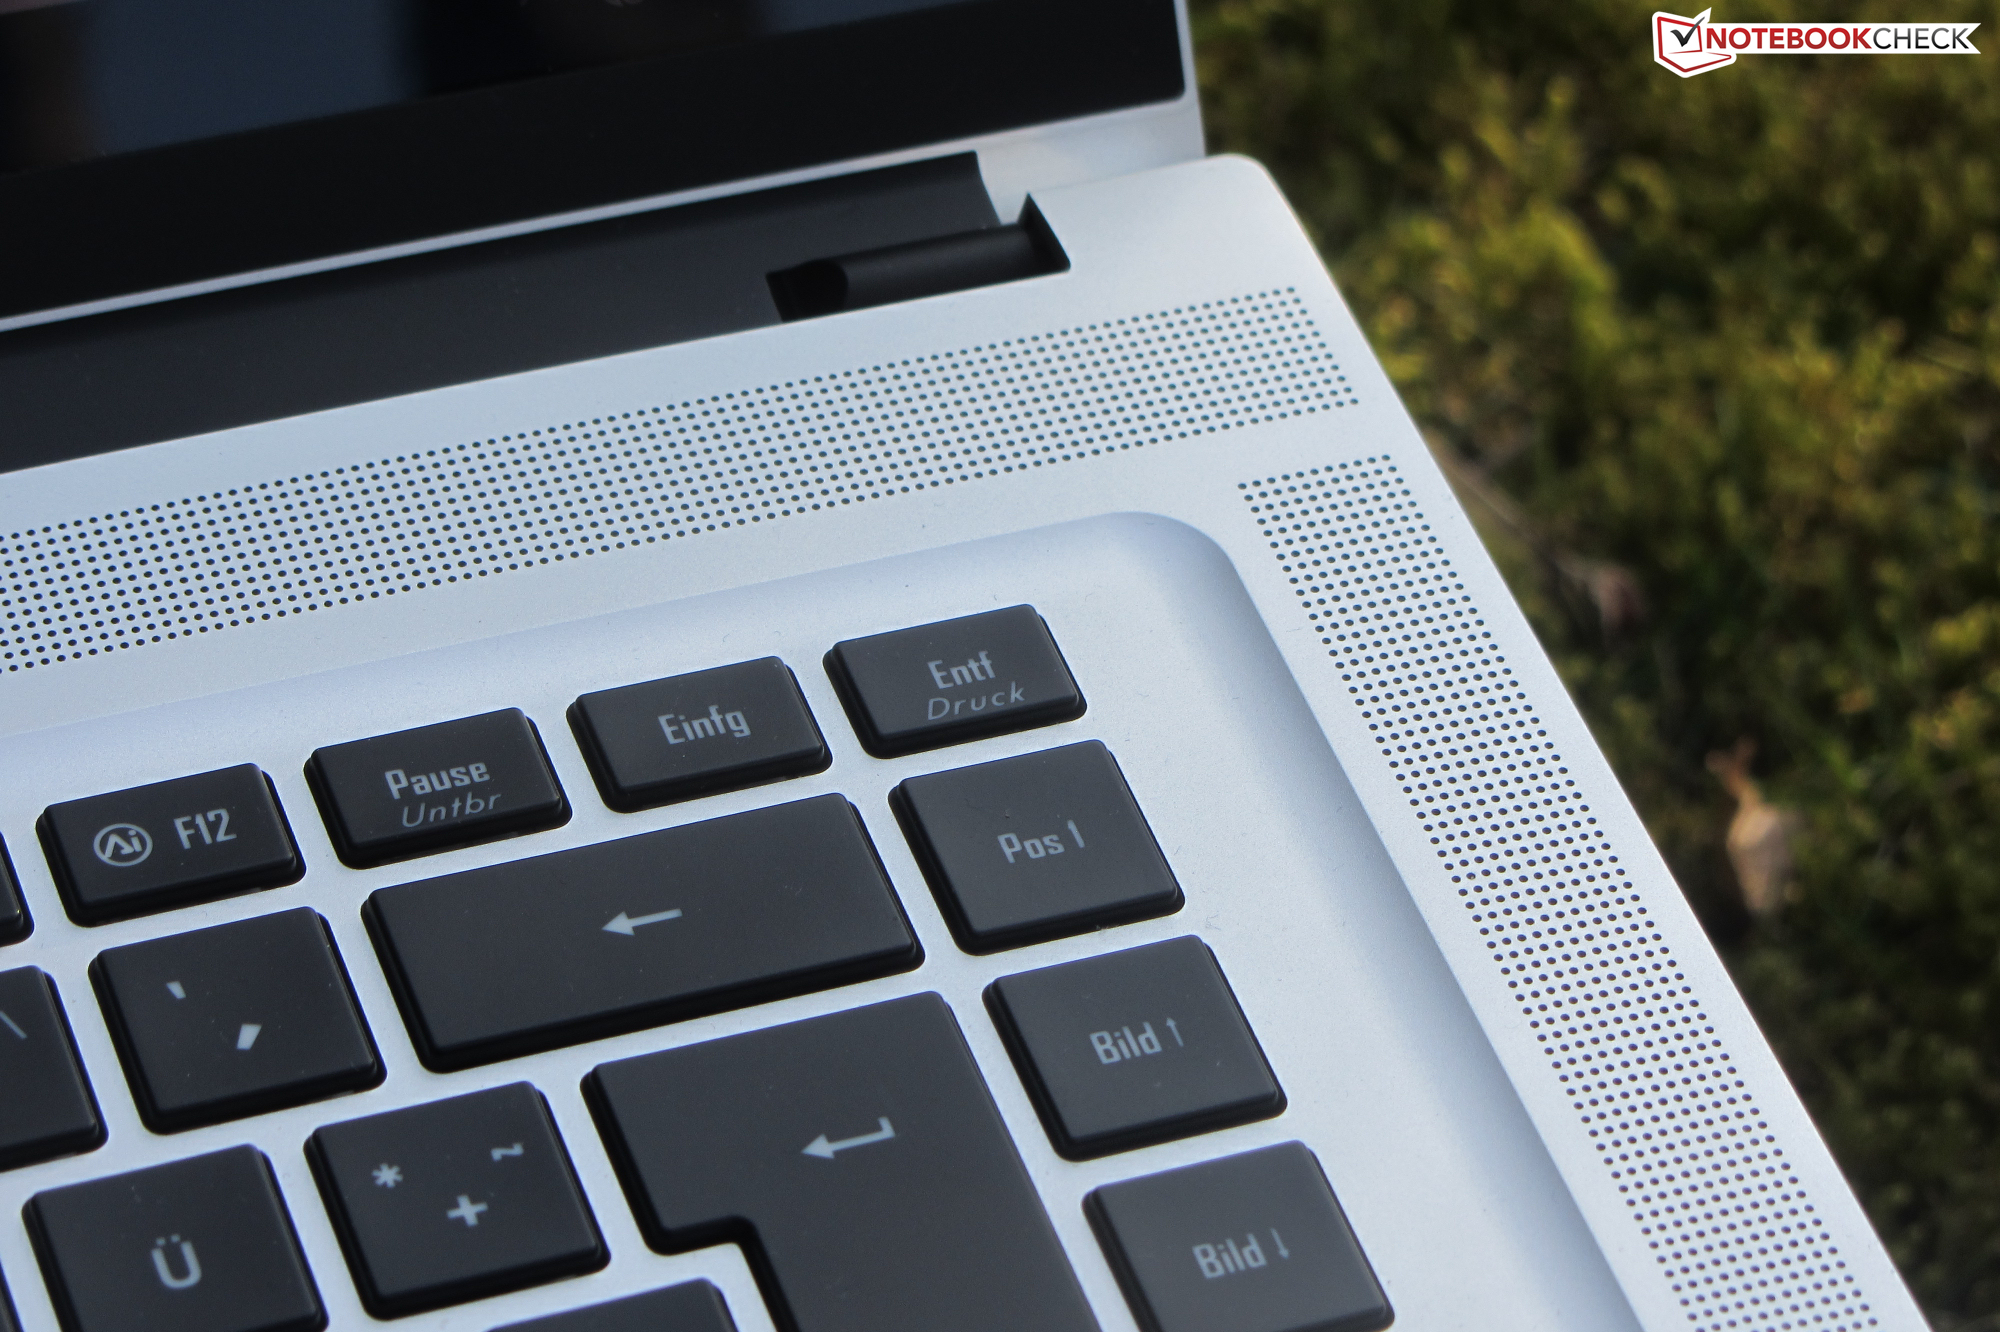
Utsläpp - Aero bullrar mycket
Bullerutsläpp
Vid daglig användning (kontor, internet) är båda fläktarna diskreta och jämförelsevis tysta. Vid belastning ökar de dock och blir mycket snabbt hörbara. Tyvärr ger de också upphov till ett märkbart gnissel vid höga varvtal. Bullerutsläppen kan minskas avsevärt genom att välja profilen "Power Saving Silence Mode", även om det sker på bekostnad av prestandan.
Ljudnivå
| Låg belastning |
| 30 / 32 / 33 dB(A) |
| Hög belastning |
| 45 / 52 dB(A) |
 | ||
30 dB tyst 40 dB(A) hörbar 50 dB(A) högt ljud |
||
min: | ||
| Gigabyte Aero 16 YE5 GeForce RTX 3080 Ti Laptop GPU, i9-12900HK | Lenovo ThinkPad X1 Extreme G4-20Y50040GE GeForce RTX 3080 Laptop GPU, i9-11950H | Apple MacBook Pro 16 2021 M1 Max M1 Max 32-Core GPU, M1 Max | HP ZBook Studio 15 G8 GeForce RTX 3070 Laptop GPU, i9-11950H | Schenker XMG Pro 15 (Late 2021) GeForce RTX 3080 Laptop GPU, i7-11800H | Razer Blade 15 2022 GeForce RTX 3080 Ti Laptop GPU, i7-12800H | |
|---|---|---|---|---|---|---|
| Noise | 10% | 17% | 11% | -12% | 8% | |
| av / miljö * (dB) | 25 | 24.7 1% | 24.2 3% | 23.5 6% | 24 4% | 25.4 -2% |
| Idle Minimum * (dB) | 30 | 24.7 18% | 24.2 19% | 25.3 16% | 31 -3% | 26.2 13% |
| Idle Average * (dB) | 32 | 24.7 23% | 24.2 24% | 25.3 21% | 37 -16% | 26.2 18% |
| Idle Maximum * (dB) | 33 | 28.1 15% | 24.2 27% | 25.3 23% | 41 -24% | 28.4 14% |
| Load Average * (dB) | 45 | 42.5 6% | 42.9 5% | 41.2 8% | 56 -24% | 44.7 1% |
| Witcher 3 ultra * (dB) | 50 | 46.4 7% | 39.5 21% | 49.4 1% | 53 -6% | 44.7 11% |
| Load Maximum * (dB) | 52 | 52.1 -0% | 42.9 17% | 49.4 5% | 58 -12% | 51.9 -0% |
* ... mindre är bättre
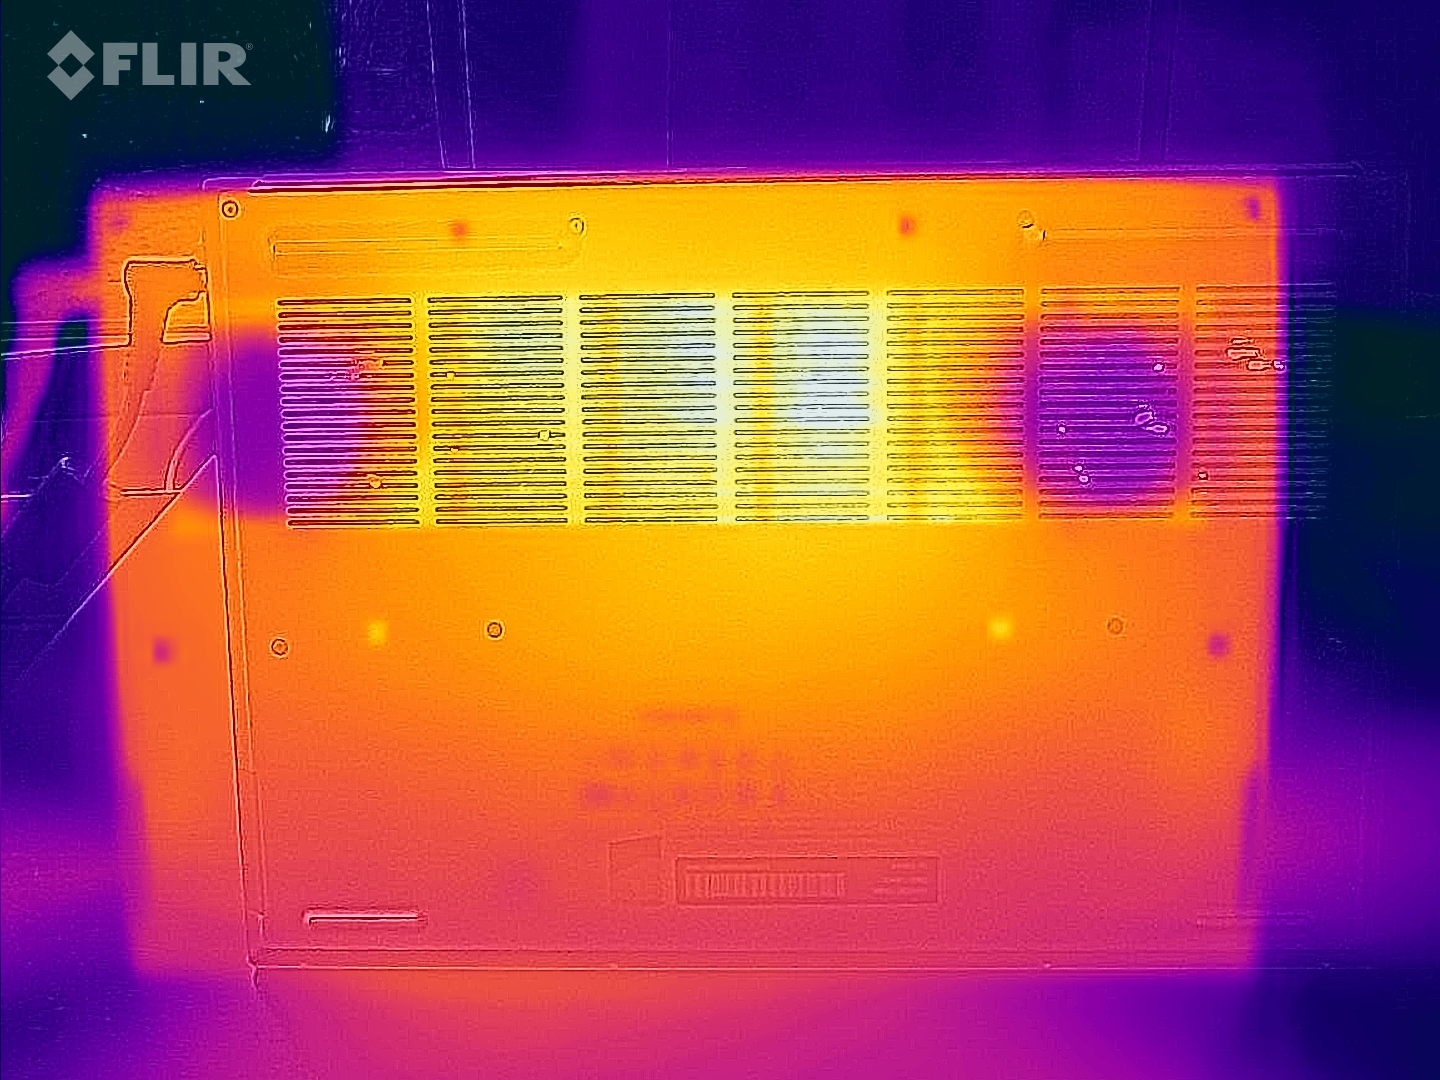
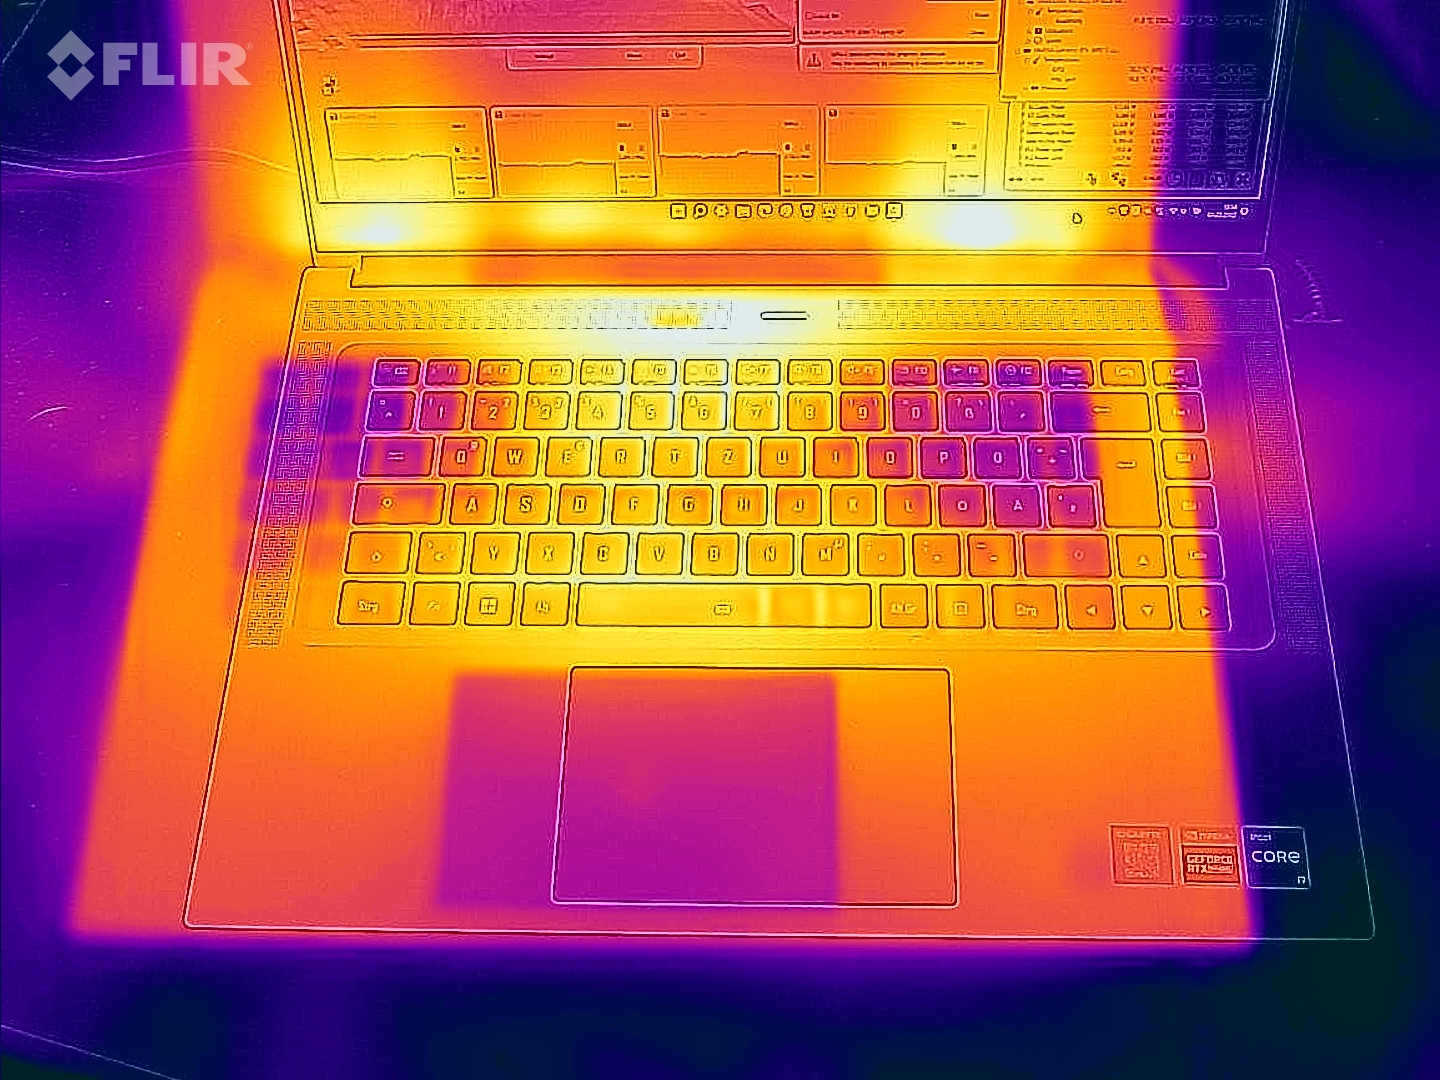
Temperatur
Vid vardaglig användning (kontor, internet) förblir temperaturen i lådan ganska låg. Vid belastning (stresstest, Witcher 3) värms den upp dramatiskt med värmepunkter på upp till 60 °C.
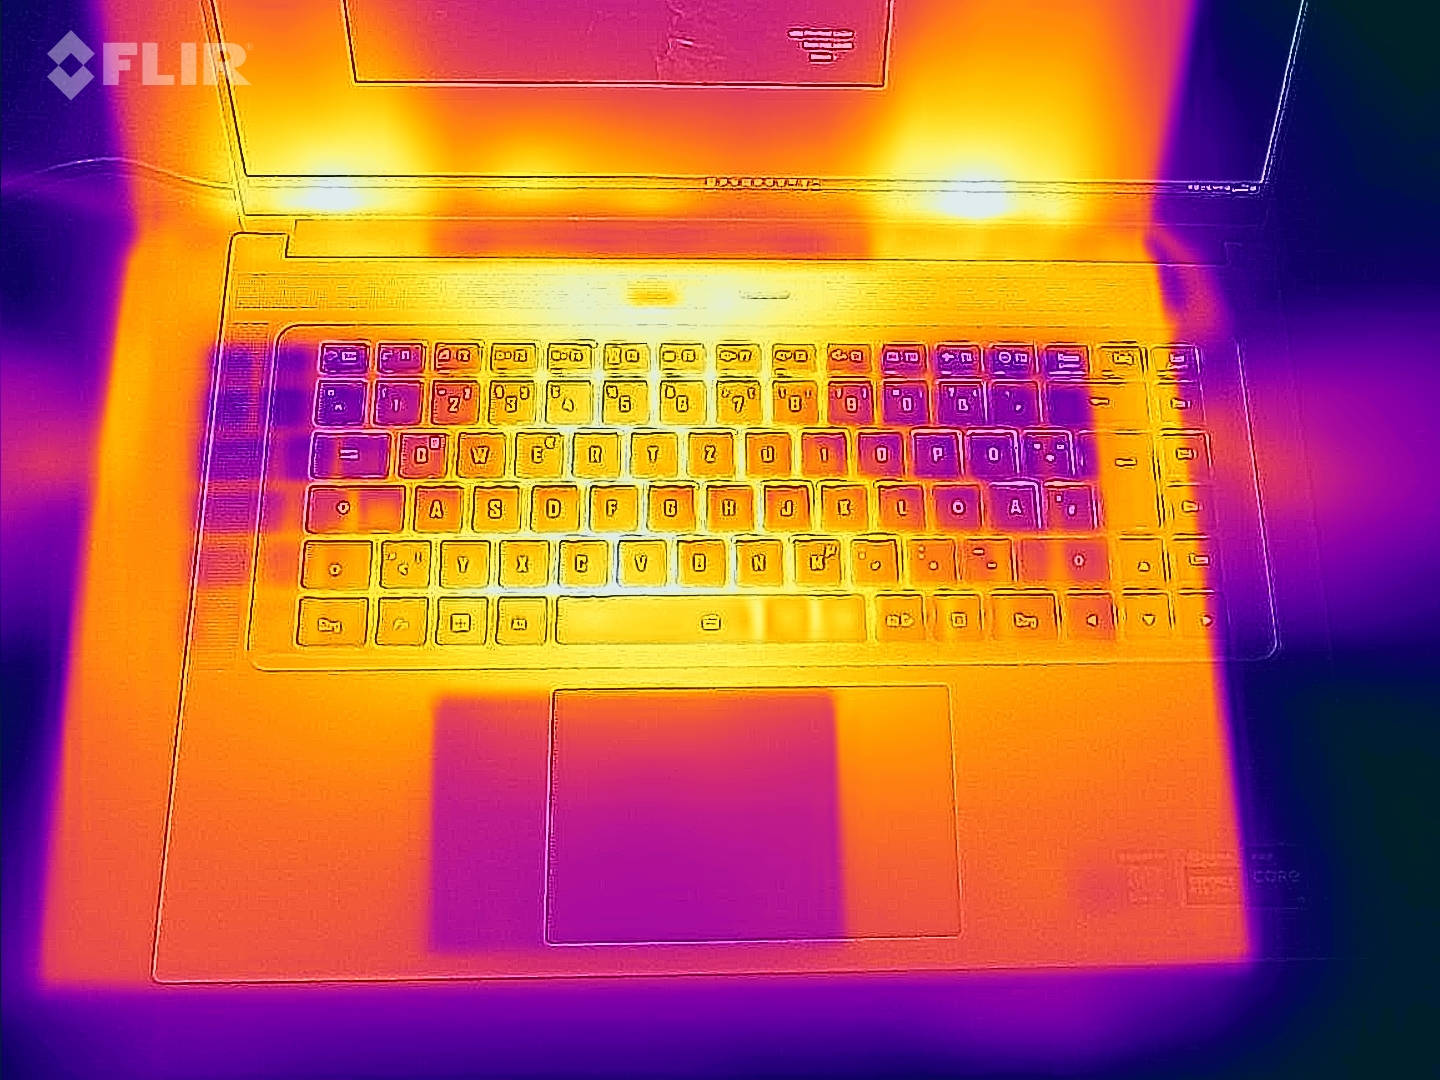
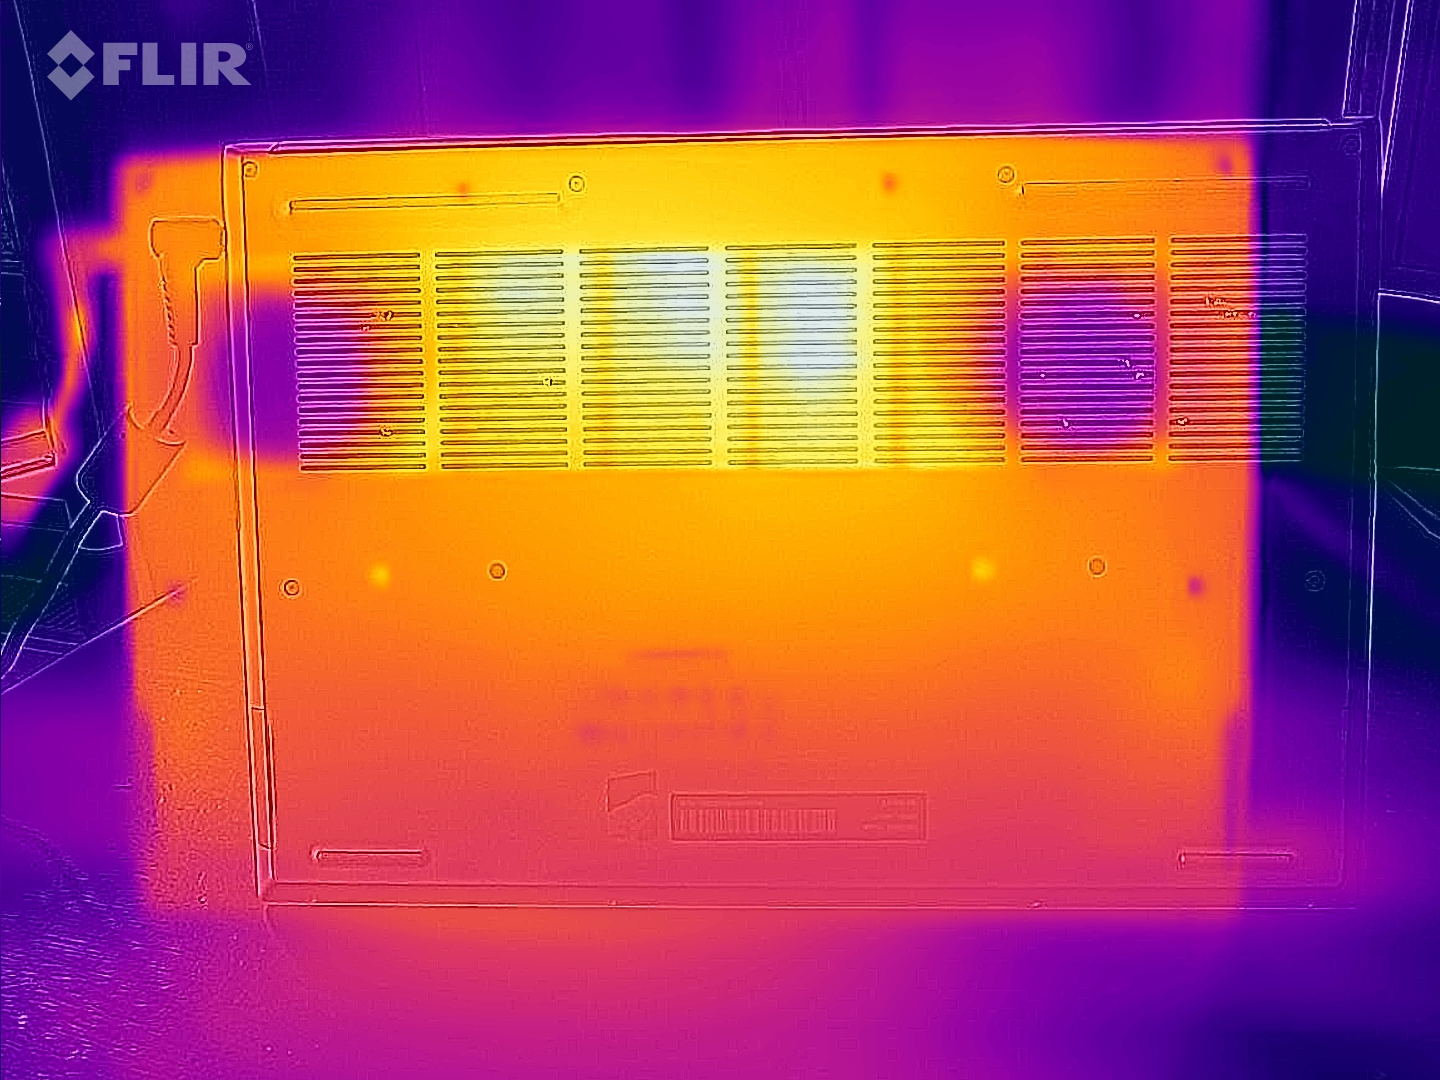
(-) Den maximala temperaturen på ovansidan är 49 °C / 120 F, jämfört med genomsnittet av 36.8 °C / 98 F , allt från 21 till 71 °C för klassen Multimedia.
(-) Botten värms upp till maximalt 55 °C / 131 F, jämfört med genomsnittet av 39.1 °C / 102 F
(+) Vid tomgångsbruk är medeltemperaturen för ovansidan 31.1 °C / 88 F, jämfört med enhetsgenomsnittet på 31.3 °C / ### class_avg_f### F.
(-) När du spelar The Witcher 3 är medeltemperaturen för ovansidan 48.3 °C / 119 F, jämfört med enhetsgenomsnittet på 31.3 °C / ## #class_avg_f### F.
(-) Handledsstöden och pekplattan kan bli väldigt varma vid beröring med maximalt 45 °C / 113 F.
(-) Medeltemperaturen för handledsstödsområdet på liknande enheter var 28.7 °C / 83.7 F (-16.3 °C / -29.3 F).
| Gigabyte Aero 16 YE5 Intel Core i9-12900HK, NVIDIA GeForce RTX 3080 Ti Laptop GPU | Lenovo ThinkPad X1 Extreme G4-20Y50040GE Intel Core i9-11950H, NVIDIA GeForce RTX 3080 Laptop GPU | Apple MacBook Pro 16 2021 M1 Max Apple M1 Max, Apple M1 Max 32-Core GPU | HP ZBook Studio 15 G8 Intel Core i9-11950H, NVIDIA GeForce RTX 3070 Laptop GPU | Schenker XMG Pro 15 (Late 2021) Intel Core i7-11800H, NVIDIA GeForce RTX 3080 Laptop GPU | Razer Blade 15 2022 Intel Core i7-12800H, NVIDIA GeForce RTX 3080 Ti Laptop GPU | |
|---|---|---|---|---|---|---|
| Heat | 6% | 24% | 8% | 2% | -4% | |
| Maximum Upper Side * (°C) | 49 | 51.4 -5% | 42.3 14% | 49 -0% | 44 10% | 50 -2% |
| Maximum Bottom * (°C) | 55 | 55.9 -2% | 41.7 24% | 54.2 1% | 60 -9% | 47 15% |
| Idle Upper Side * (°C) | 33 | 27.2 18% | 23.9 28% | 26.2 21% | 30 9% | 37.4 -13% |
| Idle Bottom * (°C) | 33 | 28.8 13% | 23.9 28% | 30.2 8% | 34 -3% | 38.4 -16% |
* ... mindre är bättre
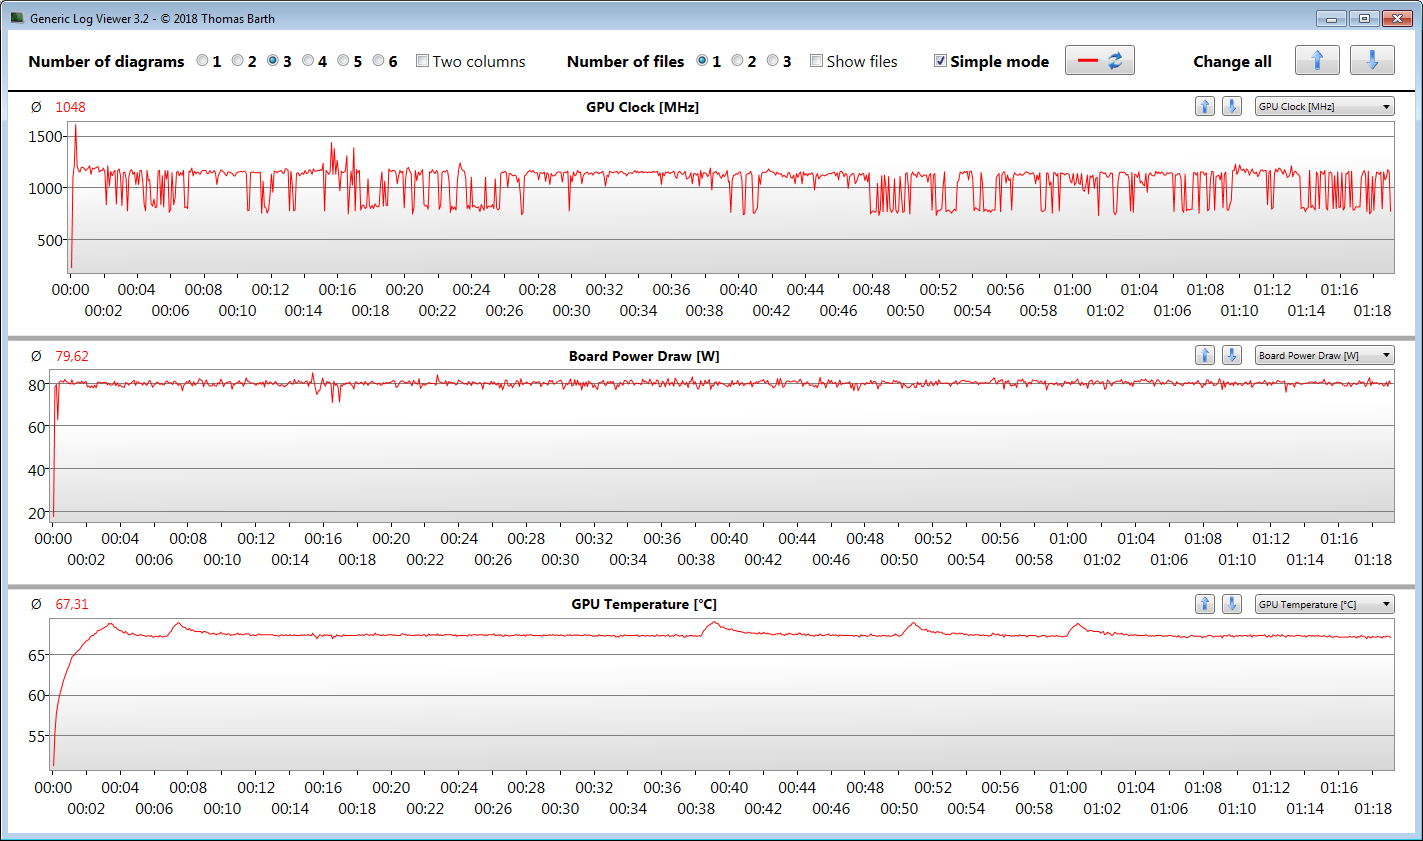
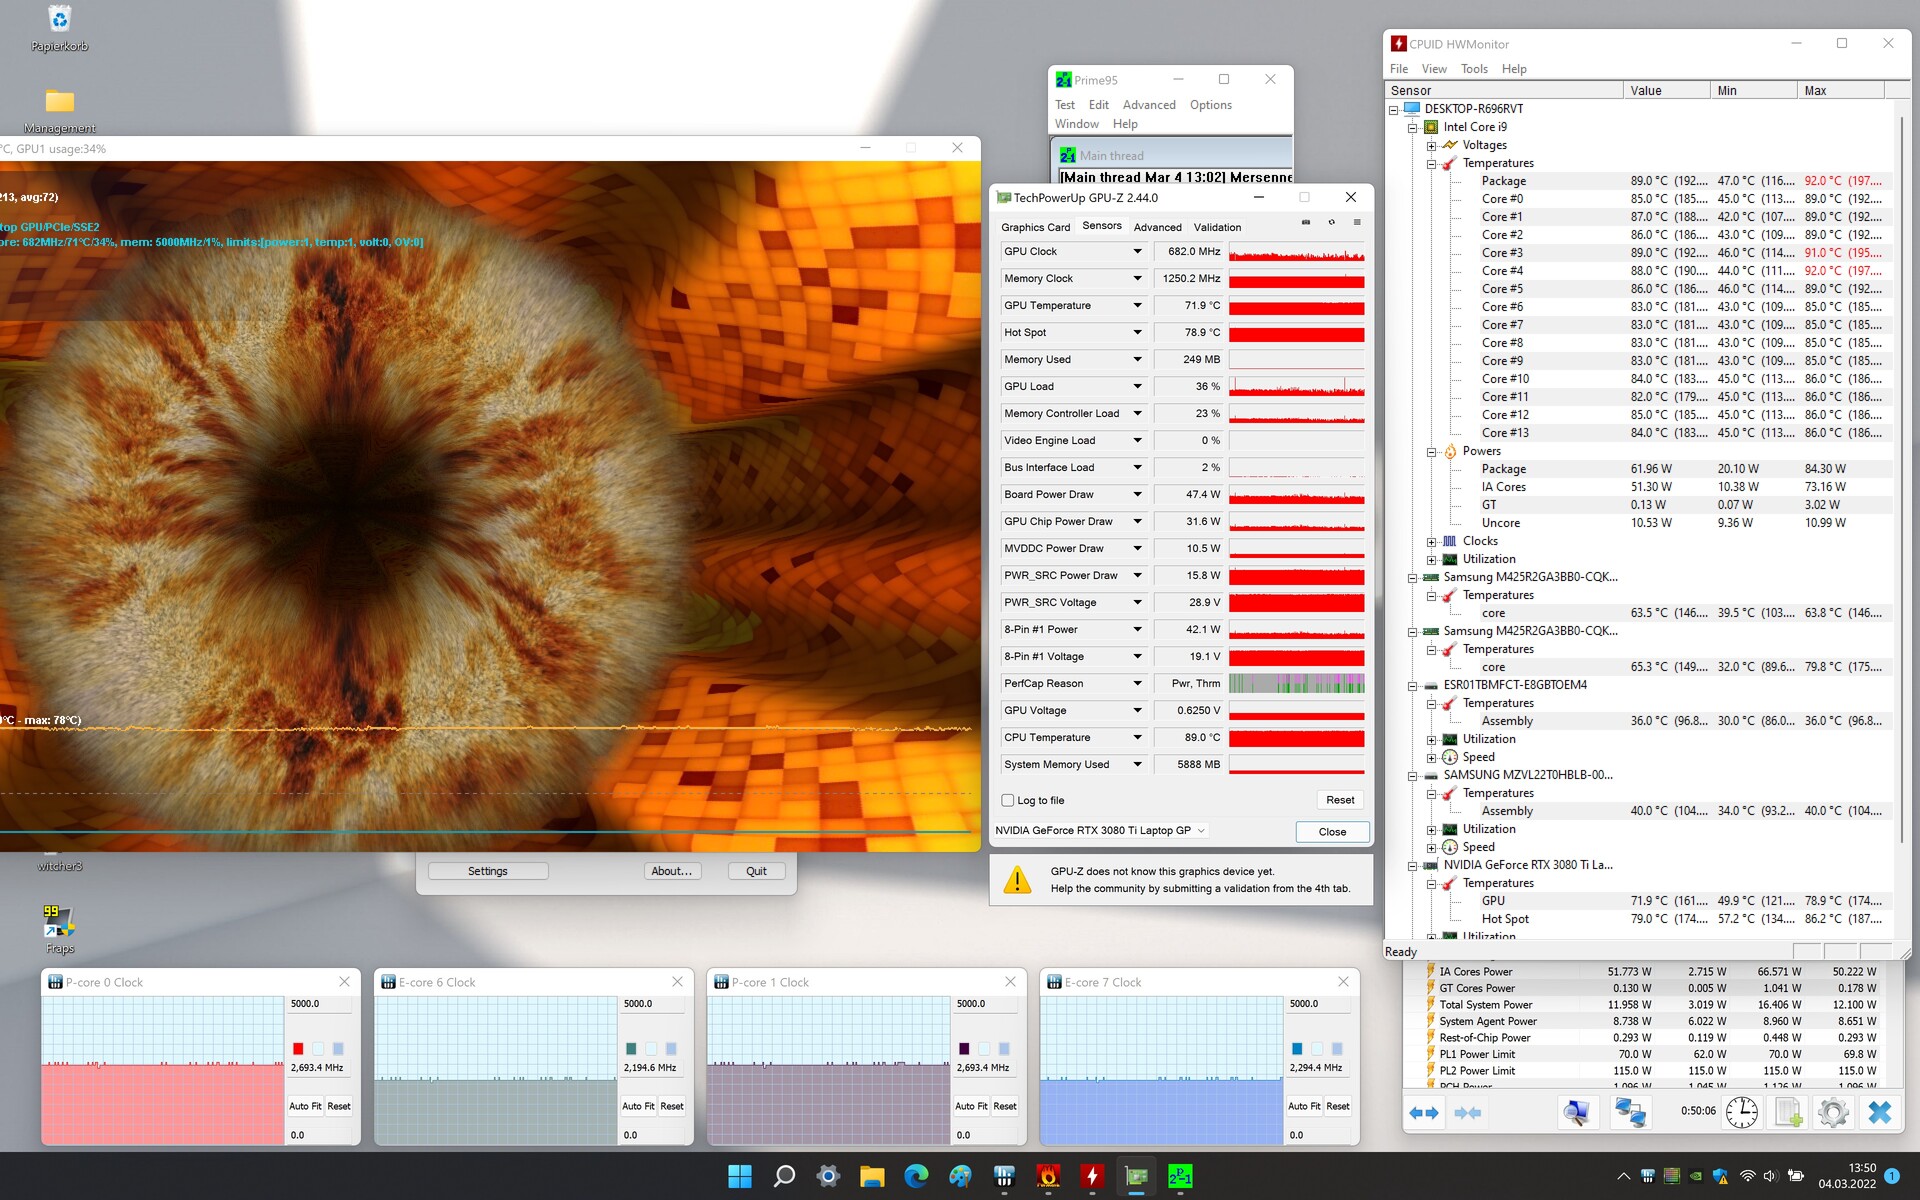
Stresstest
Vårt stresstest avslutas med en CPU som körs på 2,7 GHz (P-kärnor) och 2,2-2,3 GHz (E-kärnor) och en GPU som körs på mellan 600 och 700 MHz. Tänk på att vårt stresstest är ett extremt belastningsscenario som inte förekommer vid daglig användning. Vi använder det här testet för att fastställa eventuella strypningsproblem och stabilitetsproblem.
Högtalare
Enhetens stereohögtalare ger ett hyfsat ljud med bristande bas och en relativt hög maxvolym. Vi föreslår att du använder hörlurar eller externa högtalare för en mycket bättre ljudupplevelse.
Gigabyte Aero 16 YE5 ljudanalys
(+) | högtalare kan spela relativt högt (85 dB)
Bas 100 - 315 Hz
(-) | nästan ingen bas - i genomsnitt 25.6% lägre än medianen
(-) | basen är inte linjär (15.5% delta till föregående frekvens)
Mellan 400 - 2000 Hz
(+) | balanserad mellan - endast 4.8% från medianen
(+) | mids är linjära (5.8% delta till föregående frekvens)
Högsta 2 - 16 kHz
(+) | balanserade toppar - endast 2% från medianen
(+) | toppar är linjära (3.1% delta till föregående frekvens)
Totalt 100 - 16 000 Hz
(±) | linjäriteten för det totala ljudet är genomsnittlig (16.6% skillnad mot median)
Jämfört med samma klass
» 44% av alla testade enheter i den här klassen var bättre, 7% liknande, 50% sämre
» Den bästa hade ett delta på 5%, genomsnittet var 17%, sämst var 45%
Jämfört med alla testade enheter
» 29% av alla testade enheter var bättre, 6% liknande, 65% sämre
» Den bästa hade ett delta på 4%, genomsnittet var 23%, sämst var 134%
Razer Blade 15 2022 ljudanalys
(+) | högtalare kan spela relativt högt (90.9 dB)
Bas 100 - 315 Hz
(-) | nästan ingen bas - i genomsnitt 21% lägre än medianen
(±) | linjäriteten för basen är genomsnittlig (9.7% delta till föregående frekvens)
Mellan 400 - 2000 Hz
(+) | balanserad mellan - endast 3.9% från medianen
(+) | mids är linjära (3.9% delta till föregående frekvens)
Högsta 2 - 16 kHz
(+) | balanserade toppar - endast 4.2% från medianen
(±) | linjäriteten för toppar är genomsnittlig (7.8% delta till föregående frekvens)
Totalt 100 - 16 000 Hz
(±) | linjäriteten för det totala ljudet är genomsnittlig (15.7% skillnad mot median)
Jämfört med samma klass
» 37% av alla testade enheter i den här klassen var bättre, 7% liknande, 57% sämre
» Den bästa hade ett delta på 6%, genomsnittet var 18%, sämst var 132%
Jämfört med alla testade enheter
» 24% av alla testade enheter var bättre, 5% liknande, 71% sämre
» Den bästa hade ett delta på 4%, genomsnittet var 23%, sämst var 134%
Energihantering - hyfsad total batteritid
Effektförbrukning
Vi hittade inga inkonsekvenser med Aero 16:s strömförbrukning, som var på den nivå som förväntas för just denna maskinvara. Tidigt i vårt stresstest upptäckte vi en kort topp på upp till 236 W, som snabbt sjönk till mer rimliga 180 W. Vårt Witcher 3 -test avslutas med en genomsnittlig strömförbrukning på 184 W. Följaktligen är det medföljande 230 W-aggregatet mer än tillräckligt dimensionerat.
| Av/Standby | |
| Låg belastning | |
| Hög belastning |
|
Förklaring:
min: | |
| Gigabyte Aero 16 YE5 i9-12900HK, GeForce RTX 3080 Ti Laptop GPU | Lenovo ThinkPad X1 Extreme G4-20Y50040GE i9-11950H, GeForce RTX 3080 Laptop GPU | Apple MacBook Pro 16 2021 M1 Max M1 Max, M1 Max 32-Core GPU | HP ZBook Studio 15 G8 i9-11950H, GeForce RTX 3070 Laptop GPU | Schenker XMG Pro 15 (Late 2021) i7-11800H, GeForce RTX 3080 Laptop GPU | Razer Blade 15 2022 i7-12800H, GeForce RTX 3080 Ti Laptop GPU | Genomsnitt av klass Multimedia | |
|---|---|---|---|---|---|---|---|
| Power Consumption | 34% | 48% | 28% | 17% | -6% | 62% | |
| Idle Minimum * (Watt) | 26 | 12.3 53% | 5.4 79% | 11 58% | 20 23% | 33.2 -28% | 5.66 ? 78% |
| Idle Average * (Watt) | 30 | 22.8 24% | 16.4 45% | 18.8 37% | 22 27% | 36.4 -21% | 10.2 ? 66% |
| Idle Maximum * (Watt) | 37 | 13.9 62% | 16.7 55% | 31.7 14% | 26 30% | 37.6 -2% | 12.5 ? 66% |
| Load Average * (Watt) | 127 | 95.4 25% | 94 26% | 105.2 17% | 103 19% | 116.7 8% | 65.2 ? 49% |
| Witcher 3 ultra * (Watt) | 176 | 154 12% | 104 41% | 148 16% | 186 -6% | 172 2% | |
| Load Maximum * (Watt) | 236 | 170.7 28% | 135 43% | 171.8 27% | 218 8% | 228.6 3% | 113.5 ? 52% |
* ... mindre är bättre
Power Consumption Witcher 3 / stress test
Power Consumption with External Monitor
Batteritid
I vårt Wi-Fi-test (laddning av webbplatser via skript) och vårt videouppspelningstest (uppspelning av den H.264-kodade kortfilmen Big Buck Bunny i FHD i en slinga) klarade Aero 16 en batteritid på 6:21 respektive 7:32 timmar. Alla energisparfunktioner är inaktiverade under båda testerna och skärmens ljusstyrka är normaliserad till 150 nits. Dessutom inaktiverar vi även alla kommunikationsmoduler under videouppspelningstestet.
| Gigabyte Aero 16 YE5 i9-12900HK, GeForce RTX 3080 Ti Laptop GPU, 99 Wh | Lenovo ThinkPad X1 Extreme G4-20Y50040GE i9-11950H, GeForce RTX 3080 Laptop GPU, 90 Wh | Apple MacBook Pro 16 2021 M1 Max M1 Max, M1 Max 32-Core GPU, 99.6 Wh | HP ZBook Studio 15 G8 i9-11950H, GeForce RTX 3070 Laptop GPU, 83 Wh | Schenker XMG Pro 15 (Late 2021) i7-11800H, GeForce RTX 3080 Laptop GPU, 73 Wh | Razer Blade 15 2022 i7-12800H, GeForce RTX 3080 Ti Laptop GPU, 80 Wh | Genomsnitt av klass Multimedia | |
|---|---|---|---|---|---|---|---|
| Batteridrifttid | -11% | 76% | 18% | -8% | -23% | 101% | |
| Reader / Idle (h) | 8.9 | 12.9 45% | 10.6 19% | 24.9 ? 180% | |||
| H.264 (h) | 7.5 | 6.9 -8% | 17 127% | 6.5 -13% | 17.1 ? 128% | ||
| WiFi v1.3 (h) | 6.4 | 6.8 6% | 14.9 133% | 6.2 -3% | 5.2 -19% | 4.9 -23% | 12.2 ? 91% |
| Load (h) | 1.6 | 1.1 -31% | 1.1 -31% | 1.8 13% | 1.3 -19% | 1.664 ? 4% |
För
Emot
Omdöme Aero 16: En bärbar dator för gamers och kreatörer
Video- och fotoredigering, rendering och spelande är de främsta bland Aero 16:s tänkta användningsområden. Den möjliggör FHD-spel i maximal detaljrikedom och spel i högre upplösningar med reducerade detaljer. Dess Core i9-12900HK CPU ochNVIDIA GeForce RTX 3080 Ti Laptop GPU GPU - Benchmarks and SpecsGeForce RTX 3080 Ti GPU med en TGP på 105 W säkerställer höga prestandanivåer
Enheten värms upp ganska rejält under belastning och den gör mycket ljud som tyvärr inkluderar ett märkbart fläktviftande. Bullerutsläppen kan minskas avsevärt genom att välja profilen "Power Saving Silence Mode", dock på bekostnad av prestanda.
Gigabytes Aero 16 YE5 är en välgjord laptop för gamers och kreatörer. Den är dock inte helt fri från brister.
Batteritiden är hyfsad för en så kraftfull bärbar dator som den här med en 4K-skärm. Batteriet kan laddas med antingen det medföljande nätaggregatet eller en universell USB-C-laddare, så länge den är dimensionerad för minst 45 W strömförsörjning. Den bakre av de två Thunderbolt 4-portarna har stöd för Power Delivery. Dessutom möjliggör dess två Thunderbolt 4-portar omfattande anslutning av externa kringutrustning, som till exempel dockningsstationer eller till och med externa GPU:er.
Den inbyggda 16:10 OLED-skärmen som körs med en hög upplösning på 3840 x 2400 är utan tvekan Aero 16:s pièce de resistance. Den erbjuder bra ljusstyrka, ett utmärkt kontrastförhållande, breda betraktningsvinklar, korta svarstider och stor färgomfångstäckning. Å andra sidan är den glansig och lider av PWM-flimmer under en viss ljusstyrketröskel.
Ett bra alternativ till Aero 16 är Razer Blade 15 med mer GPU-prestanda och inget behov av att bära runt på en hubb eller ytterligare donglar. I gengäld är dess batteritid kortare. Om du letar efter en bra blandning mellan hög prestanda och utmärkt batteritid kan Apple MacBook Pro 16 2021 M1 Max vara det bästa valet. Med det sagt måste du också komma ihåg att den största bristen med Apples laptop är oförmågan att kunna uppgradera SSD och RAM.
Pris och tillgänglighet
I skrivande stund var Gigabyte Aero 16 redan listad på Gigabytes hemsida men ännu inte tillgänglig för köp någonstans.
Gigabyte Aero 16 YE5
- 03/28/2022 v7 (old)
Sascha Mölck
Price comparison

