Test: Gigabyte A7 X1 - Spellaptop med stabil och uthållig prestanda (Sammanfattning)
Testgrupp
Gradering | Datum | Modell | Vikt | Höjd | Storlek | Upplösning | Pris |
|---|---|---|---|---|---|---|---|
| 83.2 % v7 (old) | 10/2021 | Gigabyte A7 X1 R9 5900HX, GeForce RTX 3070 Laptop GPU | 2.5 kg | 34 mm | 17.30" | 1920x1080 | |
| 85 % v7 (old) | Medion Erazer Beast X25 R9 5900HX, GeForce RTX 3080 Laptop GPU | 2.3 kg | 23 mm | 17.30" | 1920x1080 | ||
| 85.5 % v7 (old) | Medion Erazer Beast X20 i7-10870H, GeForce RTX 3070 Laptop GPU | 2.2 kg | 23 mm | 17.30" | 2560x1440 | ||
| 82.8 % v7 (old) | 10/2021 | Asus TUF Gaming F17 FX706HM i9-11900H, GeForce RTX 3060 Laptop GPU | 2.7 kg | 26 mm | 17.30" | 1920x1080 | |
| 85.1 % v7 (old) | Schenker XMG Neo 17 (Early 2021, RTX 3070, 5800H) R7 5800H, GeForce RTX 3070 Laptop GPU | 2.5 kg | 27 mm | 17.30" | 2560x1440 |
| Networking | |
| iperf3 transmit AX12 | |
| Medion Erazer Beast X25 | |
| Medion Erazer Beast X20 | |
| Schenker XMG Neo 17 (Early 2021, RTX 3070, 5800H) | |
| Genomsnitt Intel Wi-Fi 6 AX200 (447 - 1645, n=127) | |
| Gigabyte A7 X1 | |
| Asus TUF Gaming F17 FX706HM | |
| iperf3 receive AX12 | |
| Gigabyte A7 X1 | |
| Medion Erazer Beast X25 | |
| Schenker XMG Neo 17 (Early 2021, RTX 3070, 5800H) | |
| Genomsnitt Intel Wi-Fi 6 AX200 (523 - 1684, n=128) | |
| Medion Erazer Beast X20 | |
| Asus TUF Gaming F17 FX706HM | |


| |||||||||||||||||||||||||
Distribution av ljusstyrkan: 95 %
Mitt på batteriet: 325 cd/m²
Kontrast: 1121:1 (Svärta: 0.29 cd/m²)
ΔE ColorChecker Calman: 4.33 | ∀{0.5-29.43 Ø4.72}
calibrated: 1.95
ΔE Greyscale Calman: 5.5 | ∀{0.09-98 Ø4.97}
63.2% AdobeRGB 1998 (Argyll 3D)
90.9% sRGB (Argyll 3D)
61.5% Display P3 (Argyll 3D)
Gamma: 2.142
CCT: 7893 K
| Gigabyte A7 X1 AU Optronics AUO8E8D, IPS, 1920x1080, 17.3" | Medion Erazer Beast X25 BOE NE173FHM-NZ1 (BOE0884), IPS, 1920x1080, 17.3" | Medion Erazer Beast X20 BOE CQ NE173QHM-NY2, IPS, 2560x1440, 17.3" | Asus TUF Gaming F17 FX706HM AU Optronics AUI8294 (B173HAN04.9), IPS, 1920x1080, 17.3" | Schenker XMG Neo 17 (Early 2021, RTX 3070, 5800H) BOE NE173QHM-NY2 (BOE0977), IPS, 2560x1440, 17.3" | |
|---|---|---|---|---|---|
| Display | 12% | 12% | -34% | 13% | |
| Display P3 Coverage (%) | 61.5 | 70.4 14% | 70.1 14% | 40.1 -35% | 70.5 15% |
| sRGB Coverage (%) | 90.9 | 99.8 10% | 99 9% | 60 -34% | 99.5 9% |
| AdobeRGB 1998 Coverage (%) | 63.2 | 71.6 13% | 71.3 13% | 41.4 -34% | 71.8 14% |
| Response Times | 46% | 6% | -105% | 1% | |
| Response Time Grey 50% / Grey 80% * (ms) | 16 ? | 9.2 ? 43% | 16 ? -0% | 32.4 -103% | 16.8 ? -5% |
| Response Time Black / White * (ms) | 10.8 ? | 5.6 ? 48% | 9.6 ? 11% | 22.4 -107% | 10 ? 7% |
| PWM Frequency (Hz) | |||||
| Screen | 17% | 19% | -11% | 19% | |
| Brightness middle (cd/m²) | 325 | 329 1% | 370 14% | 266 -18% | 410 26% |
| Brightness (cd/m²) | 318 | 315 -1% | 341 7% | 264 -17% | 381 20% |
| Brightness Distribution (%) | 95 | 88 -7% | 82 -14% | 79 -17% | 88 -7% |
| Black Level * (cd/m²) | 0.29 | 0.33 -14% | 0.42 -45% | 0.32 -10% | 0.37 -28% |
| Contrast (:1) | 1121 | 997 -11% | 881 -21% | 831 -26% | 1108 -1% |
| Colorchecker dE 2000 * | 4.33 | 2.03 53% | 1.76 59% | 3.97 8% | 2.55 41% |
| Colorchecker dE 2000 max. * | 8.6 | 5.5 36% | 2.88 67% | 8.93 -4% | 4.33 50% |
| Colorchecker dE 2000 calibrated * | 1.95 | 0.82 58% | 1.3 33% | 3.5 -79% | 1.28 34% |
| Greyscale dE 2000 * | 5.5 | 3.5 36% | 1.8 67% | 1.8 67% | 3.4 38% |
| Gamma | 2.142 103% | 2.223 99% | 2.176 101% | 2.31 95% | 2.275 97% |
| CCT | 7893 82% | 6526 100% | 6543 99% | 6754 96% | 6637 98% |
| Color Space (Percent of AdobeRGB 1998) (%) | 41.4 | 72 | |||
| Color Space (Percent of sRGB) (%) | 60 | 95 | |||
| Totalt genomsnitt (program/inställningar) | 25% /
20% | 12% /
15% | -50% /
-29% | 11% /
15% |
* ... mindre är bättre
Visa svarstider
| ↔ Svarstid svart till vitt | ||
|---|---|---|
| 10.8 ms ... stiga ↗ och falla ↘ kombinerat | ↗ 6.4 ms stiga | 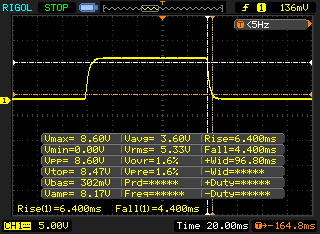 |
| ↘ 4.4 ms hösten | ||
| Skärmen visar bra svarsfrekvens i våra tester, men kan vara för långsam för konkurrenskraftiga spelare. I jämförelse sträcker sig alla testade enheter från 0.1 (minst) till 240 (maximalt) ms. » 29 % av alla enheter är bättre. Det betyder att den uppmätta svarstiden är bättre än genomsnittet av alla testade enheter (19.8 ms). | ||
| ↔ Svarstid 50 % grått till 80 % grått | ||
| 16 ms ... stiga ↗ och falla ↘ kombinerat | ↗ 7.6 ms stiga | 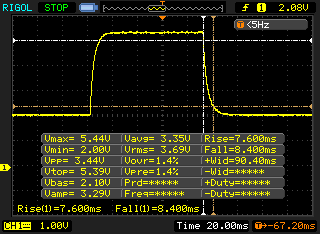 |
| ↘ 8.4 ms hösten | ||
| Skärmen visar bra svarsfrekvens i våra tester, men kan vara för långsam för konkurrenskraftiga spelare. I jämförelse sträcker sig alla testade enheter från 0.165 (minst) till 636 (maximalt) ms. » 30 % av alla enheter är bättre. Det betyder att den uppmätta svarstiden är bättre än genomsnittet av alla testade enheter (31 ms). | ||
Skärmflimmer / PWM (Puls-Width Modulation)
| Skärmflimmer / PWM upptäcktes inte | 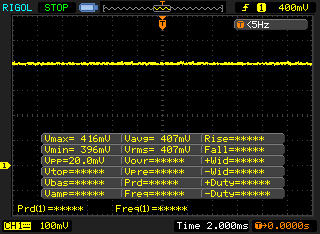 | ||
Som jämförelse: 52 % av alla testade enheter använder inte PWM för att dämpa skärmen. Om PWM upptäcktes mättes ett medelvärde av 7775 (minst: 5 - maximum: 343500) Hz. | |||
Cinebench R15 Multi Uthållighetstest
| Cinebench R23 | |
| Multi Core | |
| Genomsnitt av klass Gaming (10488 - 40970, n=111, senaste 2 åren) | |
| Genomsnitt AMD Ryzen 9 5900HX (6622 - 14363, n=30) | |
| Gigabyte A7 X1 | |
| Medion Erazer Beast X25 | |
| Schenker XMG Neo 17 (Early 2021, RTX 3070, 5800H) | |
| Asus TUF Gaming F17 FX706HM | |
| Medion Erazer Beast X20 | |
| Single Core | |
| Genomsnitt av klass Gaming (1166 - 2356, n=111, senaste 2 åren) | |
| Asus TUF Gaming F17 FX706HM | |
| Medion Erazer Beast X25 | |
| Gigabyte A7 X1 | |
| Genomsnitt AMD Ryzen 9 5900HX (1218 - 1499, n=29) | |
| Schenker XMG Neo 17 (Early 2021, RTX 3070, 5800H) | |
| Medion Erazer Beast X20 | |
| Cinebench R20 | |
| CPU (Multi Core) | |
| Genomsnitt av klass Gaming (4029 - 16108, n=110, senaste 2 åren) | |
| Gigabyte A7 X1 | |
| Genomsnitt AMD Ryzen 9 5900HX (2242 - 5476, n=30) | |
| Medion Erazer Beast X25 | |
| Schenker XMG Neo 17 (Early 2021, RTX 3070, 5800H) | |
| Asus TUF Gaming F17 FX706HM | |
| Medion Erazer Beast X20 | |
| CPU (Single Core) | |
| Genomsnitt av klass Gaming (442 - 895, n=110, senaste 2 åren) | |
| Asus TUF Gaming F17 FX706HM | |
| Medion Erazer Beast X25 | |
| Gigabyte A7 X1 | |
| Genomsnitt AMD Ryzen 9 5900HX (471 - 584, n=29) | |
| Schenker XMG Neo 17 (Early 2021, RTX 3070, 5800H) | |
| Medion Erazer Beast X20 | |
| Cinebench R15 | |
| CPU Multi 64Bit | |
| Genomsnitt av klass Gaming (1578 - 6271, n=109, senaste 2 åren) | |
| Schenker XMG Neo 17 (Early 2021, RTX 3070, 5800H) | |
| Gigabyte A7 X1 | |
| Genomsnitt AMD Ryzen 9 5900HX (1076 - 2267, n=29) | |
| Medion Erazer Beast X25 | |
| Asus TUF Gaming F17 FX706HM | |
| Medion Erazer Beast X20 | |
| CPU Single 64Bit | |
| Genomsnitt av klass Gaming (188.8 - 343, n=110, senaste 2 åren) | |
| Asus TUF Gaming F17 FX706HM | |
| Gigabyte A7 X1 | |
| Medion Erazer Beast X25 | |
| Genomsnitt AMD Ryzen 9 5900HX (197 - 243, n=25) | |
| Schenker XMG Neo 17 (Early 2021, RTX 3070, 5800H) | |
| Medion Erazer Beast X20 | |
| Blender - v2.79 BMW27 CPU | |
| Medion Erazer Beast X20 | |
| Medion Erazer Beast X25 | |
| Genomsnitt AMD Ryzen 9 5900HX (219 - 442, n=29) | |
| Gigabyte A7 X1 | |
| Schenker XMG Neo 17 (Early 2021, RTX 3070, 5800H) | |
| Asus TUF Gaming F17 FX706HM | |
| Genomsnitt av klass Gaming (80 - 330, n=108, senaste 2 åren) | |
| 7-Zip 18.03 | |
| 7z b 4 | |
| Genomsnitt av klass Gaming (33491 - 148086, n=109, senaste 2 åren) | |
| Medion Erazer Beast X25 | |
| Schenker XMG Neo 17 (Early 2021, RTX 3070, 5800H) | |
| Genomsnitt AMD Ryzen 9 5900HX (36011 - 62503, n=29) | |
| Gigabyte A7 X1 | |
| Asus TUF Gaming F17 FX706HM | |
| Medion Erazer Beast X20 | |
| 7z b 4 -mmt1 | |
| Genomsnitt av klass Gaming (4199 - 7436, n=109, senaste 2 åren) | |
| Asus TUF Gaming F17 FX706HM | |
| Genomsnitt AMD Ryzen 9 5900HX (4791 - 5905, n=29) | |
| Gigabyte A7 X1 | |
| Medion Erazer Beast X25 | |
| Schenker XMG Neo 17 (Early 2021, RTX 3070, 5800H) | |
| Medion Erazer Beast X20 | |
| Geekbench 5.5 | |
| Multi-Core | |
| Genomsnitt av klass Gaming (6460 - 27010, n=109, senaste 2 åren) | |
| Medion Erazer Beast X25 | |
| Genomsnitt AMD Ryzen 9 5900HX (5057 - 9294, n=27) | |
| Schenker XMG Neo 17 (Early 2021, RTX 3070, 5800H) | |
| Asus TUF Gaming F17 FX706HM | |
| Gigabyte A7 X1 | |
| Medion Erazer Beast X20 | |
| Single-Core | |
| Genomsnitt av klass Gaming (986 - 2474, n=109, senaste 2 åren) | |
| Asus TUF Gaming F17 FX706HM | |
| Gigabyte A7 X1 | |
| Medion Erazer Beast X25 | |
| Genomsnitt AMD Ryzen 9 5900HX (1271 - 1574, n=27) | |
| Schenker XMG Neo 17 (Early 2021, RTX 3070, 5800H) | |
| Medion Erazer Beast X20 | |
| HWBOT x265 Benchmark v2.2 - 4k Preset | |
| Genomsnitt av klass Gaming (11.5 - 44.3, n=109, senaste 2 åren) | |
| Medion Erazer Beast X25 | |
| Schenker XMG Neo 17 (Early 2021, RTX 3070, 5800H) | |
| Genomsnitt AMD Ryzen 9 5900HX (8.26 - 17.1, n=29) | |
| Asus TUF Gaming F17 FX706HM | |
| Gigabyte A7 X1 | |
| Medion Erazer Beast X20 | |
| LibreOffice - 20 Documents To PDF | |
| Gigabyte A7 X1 | |
| Genomsnitt AMD Ryzen 9 5900HX (44.1 - 87.4, n=29) | |
| Medion Erazer Beast X20 | |
| Schenker XMG Neo 17 (Early 2021, RTX 3070, 5800H) | |
| Genomsnitt av klass Gaming (19 - 88.8, n=109, senaste 2 åren) | |
| Medion Erazer Beast X25 | |
| Asus TUF Gaming F17 FX706HM | |
| R Benchmark 2.5 - Overall mean | |
| Medion Erazer Beast X20 | |
| Asus TUF Gaming F17 FX706HM | |
| Schenker XMG Neo 17 (Early 2021, RTX 3070, 5800H) | |
| Genomsnitt AMD Ryzen 9 5900HX (0.48 - 0.599, n=29) | |
| Gigabyte A7 X1 | |
| Medion Erazer Beast X25 | |
| Genomsnitt av klass Gaming (0.3439 - 0.759, n=110, senaste 2 åren) | |
* ... mindre är bättre
| PCMark 10 / Score | |
| Genomsnitt av klass Gaming (5828 - 11574, n=96, senaste 2 åren) | |
| Schenker XMG Neo 17 (Early 2021, RTX 3070, 5800H) | |
| Genomsnitt AMD Ryzen 9 5900HX, NVIDIA GeForce RTX 3070 Laptop GPU (6875 - 6967, n=4) | |
| Asus TUF Gaming F17 FX706HM | |
| Gigabyte A7 X1 | |
| Medion Erazer Beast X25 | |
| Medion Erazer Beast X20 | |
| PCMark 10 / Essentials | |
| Genomsnitt av klass Gaming (8810 - 12600, n=100, senaste 2 åren) | |
| Asus TUF Gaming F17 FX706HM | |
| Genomsnitt AMD Ryzen 9 5900HX, NVIDIA GeForce RTX 3070 Laptop GPU (9991 - 10413, n=3) | |
| Schenker XMG Neo 17 (Early 2021, RTX 3070, 5800H) | |
| Medion Erazer Beast X25 | |
| Gigabyte A7 X1 | |
| Medion Erazer Beast X20 | |
| PCMark 10 / Productivity | |
| Genomsnitt av klass Gaming (6845 - 21327, n=98, senaste 2 åren) | |
| Genomsnitt AMD Ryzen 9 5900HX, NVIDIA GeForce RTX 3070 Laptop GPU (9301 - 9381, n=3) | |
| Gigabyte A7 X1 | |
| Medion Erazer Beast X25 | |
| Asus TUF Gaming F17 FX706HM | |
| Schenker XMG Neo 17 (Early 2021, RTX 3070, 5800H) | |
| Medion Erazer Beast X20 | |
| PCMark 10 / Digital Content Creation | |
| Genomsnitt av klass Gaming (7602 - 19657, n=98, senaste 2 åren) | |
| Schenker XMG Neo 17 (Early 2021, RTX 3070, 5800H) | |
| Gigabyte A7 X1 | |
| Genomsnitt AMD Ryzen 9 5900HX, NVIDIA GeForce RTX 3070 Laptop GPU (9383 - 9561, n=3) | |
| Medion Erazer Beast X25 | |
| Asus TUF Gaming F17 FX706HM | |
| Medion Erazer Beast X20 | |
| PCMark 10 Score | 6898 poäng | |
Hjälp | ||
| DPC Latencies / LatencyMon - interrupt to process latency (max), Web, Youtube, Prime95 | |
| Schenker XMG Neo 17 (Early 2021, RTX 3070, 5800H) | |
| Asus TUF Gaming F17 FX706HM | |
| Medion Erazer Beast X25 | |
| Medion Erazer Beast X20 | |
| Gigabyte A7 X1 | |
* ... mindre är bättre
| Gigabyte A7 X1 ESR512GTLCG-EAC-4 | Medion Erazer Beast X25 Samsung PM9A1 MZVL22T0HBLB | Medion Erazer Beast X20 Phison E12S-2TB-Phison-SSD-BICS4 | Asus TUF Gaming F17 FX706HM SK Hynix HFM001TD3JX013N | Schenker XMG Neo 17 (Early 2021, RTX 3070, 5800H) Samsung SSD 970 EVO Plus 500GB | Genomsnitt ESR512GTLCG-EAC-4 | |
|---|---|---|---|---|---|---|
| CrystalDiskMark 5.2 / 6 | 14% | 3% | 18% | 27% | 3% | |
| Write 4K (MB/s) | 125.1 | 129.7 4% | 155.5 24% | 168.8 35% | 206.1 65% | 131.6 ? 5% |
| Read 4K (MB/s) | 43.51 | 62.4 43% | 47.96 10% | 72 65% | 53 22% | 45.4 ? 4% |
| Write Seq (MB/s) | 2128 | 2436 14% | 1591 -25% | 3018 42% | 2303 ? 8% | |
| Read Seq (MB/s) | 1958 | 2354 20% | 1371 -30% | 2575 32% | 1716 ? -12% | |
| Write 4K Q32T1 (MB/s) | 579 | 512 -12% | 532 -8% | 459.5 -21% | 535 -8% | 525 ? -9% |
| Read 4K Q32T1 (MB/s) | 464.4 | 436.2 -6% | 627 35% | 473.1 2% | 608 31% | 581 ? 25% |
| Write Seq Q32T1 (MB/s) | 2501 | 3541 42% | 3017 21% | 3129 25% | 3242 30% | 2515 ? 1% |
| Read Seq Q32T1 (MB/s) | 3473 | 3568 3% | 3440 -1% | 3529 2% | 3617 4% | 3417 ? -2% |
| AS SSD | 16% | 15% | 10% | 26% | 6% | |
| Seq Read (MB/s) | 2859 | 2591 -9% | 2849 0% | 2837 -1% | 3020 6% | 2643 ? -8% |
| Seq Write (MB/s) | 1530 | 1900 24% | 2831 85% | 1565 2% | 2631 72% | 2134 ? 39% |
| 4K Read (MB/s) | 41.47 | 53.9 30% | 51.3 24% | 55.4 34% | 60.3 45% | 48.3 ? 16% |
| 4K Write (MB/s) | 133.9 | 112.6 -16% | 106.3 -21% | 152.9 14% | 171.6 28% | 116.4 ? -13% |
| 4K-64 Read (MB/s) | 1218 | 1335 10% | 1763 45% | 1327 9% | 1410 16% | 1586 ? 30% |
| 4K-64 Write (MB/s) | 2108 | 2966 41% | 2010 -5% | 1922 -9% | 2324 10% | 1975 ? -6% |
| Access Time Read * (ms) | 0.098 | 0.038 61% | 0.093 5% | 0.035 64% | 0.045 54% | 0.09975 ? -2% |
| Access Time Write * (ms) | 0.028 | 0.036 -29% | 0.035 -25% | 0.028 -0% | 0.024 14% | 0.03325 ? -19% |
| Score Read (Points) | 1545 | 1648 7% | 2099 36% | 1666 8% | 1773 15% | 1899 ? 23% |
| Score Write (Points) | 2395 | 3269 36% | 2399 0% | 2232 -7% | 2759 15% | 2305 ? -4% |
| Score Total (Points) | 4666 | 5733 23% | 5573 19% | 4695 1% | 5429 16% | 5151 ? 10% |
| Totalt genomsnitt (program/inställningar) | 15% /
15% | 9% /
10% | 14% /
13% | 27% /
27% | 5% /
5% |
* ... mindre är bättre

DiskSpd Read Loop, Queue Depth 8
| 3DMark 11 - 1280x720 Performance GPU | |
| Genomsnitt av klass Gaming (21841 - 80022, n=107, senaste 2 åren) | |
| Gigabyte A7 X1 | |
| Medion Erazer Beast X25 | |
| Medion Erazer Beast X20 | |
| Genomsnitt NVIDIA GeForce RTX 3070 Laptop GPU (12535 - 38275, n=54) | |
| Asus TUF Gaming F17 FX706HM | |
| 3DMark | |
| 1280x720 Cloud Gate Standard Graphics | |
| Schenker XMG Neo 17 (Early 2021, RTX 3070, 5800H) | |
| Genomsnitt av klass Gaming (86886 - 223650, n=63, senaste 2 åren) | |
| Gigabyte A7 X1 | |
| Genomsnitt NVIDIA GeForce RTX 3070 Laptop GPU (45531 - 179716, n=33) | |
| Asus TUF Gaming F17 FX706HM | |
| Medion Erazer Beast X20 | |
| Medion Erazer Beast X25 | |
| 1920x1080 Fire Strike Graphics | |
| Genomsnitt av klass Gaming (12242 - 62849, n=119, senaste 2 åren) | |
| Schenker XMG Neo 17 (Early 2021, RTX 3070, 5800H) | |
| Medion Erazer Beast X25 | |
| Medion Erazer Beast X20 | |
| Gigabyte A7 X1 | |
| Genomsnitt NVIDIA GeForce RTX 3070 Laptop GPU (7178 - 29128, n=52) | |
| Asus TUF Gaming F17 FX706HM | |
| 2560x1440 Time Spy Graphics | |
| Genomsnitt av klass Gaming (5012 - 26212, n=118, senaste 2 åren) | |
| Schenker XMG Neo 17 (Early 2021, RTX 3070, 5800H) | |
| Medion Erazer Beast X25 | |
| Gigabyte A7 X1 | |
| Medion Erazer Beast X20 | |
| Genomsnitt NVIDIA GeForce RTX 3070 Laptop GPU (2644 - 11019, n=53) | |
| Asus TUF Gaming F17 FX706HM | |
| 3DMark 11 Performance | 26404 poäng | |
| 3DMark Cloud Gate Standard Score | 54931 poäng | |
| 3DMark Fire Strike Score | 23233 poäng | |
| 3DMark Time Spy Score | 10315 poäng | |
Hjälp | ||
| The Witcher 3 - 1920x1080 Ultra Graphics & Postprocessing (HBAO+) | |
| Genomsnitt av klass Gaming (95 - 240, n=8, senaste 2 åren) | |
| Medion Erazer Beast X20 | |
| Schenker XMG Neo 17 (Early 2021, RTX 3070, 5800H) | |
| Medion Erazer Beast X25 | |
| Gigabyte A7 X1 | |
| Genomsnitt NVIDIA GeForce RTX 3070 Laptop GPU (34.9 - 109, n=52) | |
| Asus TUF Gaming F17 FX706HM | |
| Dota 2 Reborn - 1920x1080 ultra (3/3) best looking | |
| Genomsnitt av klass Gaming (84.8 - 248, n=111, senaste 2 åren) | |
| Schenker XMG Neo 17 (Early 2021, RTX 3070, 5800H) | |
| Asus TUF Gaming F17 FX706HM | |
| Genomsnitt NVIDIA GeForce RTX 3070 Laptop GPU (26.9 - 163.9, n=58) | |
| Medion Erazer Beast X25 | |
| Medion Erazer Beast X20 | |
| Gigabyte A7 X1 | |
| Final Fantasy XV Benchmark - 1920x1080 High Quality | |
| Genomsnitt av klass Gaming (41 - 215, n=100, senaste 2 åren) | |
| Medion Erazer Beast X25 | |
| Medion Erazer Beast X20 | |
| Genomsnitt NVIDIA GeForce RTX 3070 Laptop GPU (27.9 - 107, n=49) | |
| Asus TUF Gaming F17 FX706HM | |
| GTA V - 1920x1080 Highest AA:4xMSAA + FX AF:16x | |
| Genomsnitt av klass Gaming (48.3 - 186.9, n=99, senaste 2 åren) | |
| Schenker XMG Neo 17 (Early 2021, RTX 3070, 5800H) | |
| Medion Erazer Beast X25 | |
| Genomsnitt NVIDIA GeForce RTX 3070 Laptop GPU (21.7 - 125.8, n=50) | |
| Medion Erazer Beast X20 | |
| Gigabyte A7 X1 | |
| Asus TUF Gaming F17 FX706HM | |
| Strange Brigade - 1920x1080 ultra AA:ultra AF:16 | |
| Genomsnitt av klass Gaming (76.3 - 456, n=90, senaste 2 åren) | |
| Gigabyte A7 X1 | |
| Medion Erazer Beast X20 | |
| Medion Erazer Beast X25 | |
| Genomsnitt NVIDIA GeForce RTX 3070 Laptop GPU (36.2 - 194, n=46) | |
| Asus TUF Gaming F17 FX706HM | |
| X-Plane 11.11 - 1920x1080 high (fps_test=3) | |
| Genomsnitt av klass Gaming (52.1 - 143.5, n=114, senaste 2 åren) | |
| Genomsnitt NVIDIA GeForce RTX 3070 Laptop GPU (12.4 - 118.8, n=61) | |
| Asus TUF Gaming F17 FX706HM | |
| Schenker XMG Neo 17 (Early 2021, RTX 3070, 5800H) | |
| Gigabyte A7 X1 | |
| Medion Erazer Beast X25 | |
| Medion Erazer Beast X20 | |
The Witcher 3 - FPS-diagram
| låg | med. | hög | ultra | |
|---|---|---|---|---|
| GTA V (2015) | 174 | 164 | 139 | 83.6 |
| The Witcher 3 (2015) | 95.9 | |||
| Dota 2 Reborn (2015) | 139 | 125 | 119 | 113 |
| X-Plane 11.11 (2018) | 98.9 | 86.8 | 72.2 | |
| Strange Brigade (2018) | 311 | 232 | 208 | 185 |
| Cyberpunk 2077 1.0 (2020) | 104.5 | 89.6 | 77.1 | 66.3 |
Ljudnivå
| Låg belastning |
| 25 / 29 / 35 dB(A) |
| Hög belastning |
| 58 / 59 dB(A) |
 | ||
30 dB tyst 40 dB(A) hörbar 50 dB(A) högt ljud |
||
min: | ||
(±) Den maximala temperaturen på ovansidan är 44 °C / 111 F, jämfört med genomsnittet av 40.4 °C / 105 F , allt från 21.2 till 68.8 °C för klassen Gaming.
(-) Botten värms upp till maximalt 49 °C / 120 F, jämfört med genomsnittet av 43.2 °C / 110 F
(+) Vid tomgångsbruk är medeltemperaturen för ovansidan 26.1 °C / 79 F, jämfört med enhetsgenomsnittet på 33.9 °C / ### class_avg_f### F.
(-) När du spelar The Witcher 3 är medeltemperaturen för ovansidan 40.6 °C / 105 F, jämfört med enhetsgenomsnittet på 33.9 °C / ## #class_avg_f### F.
(-) Handledsstöden och pekplattan kan bli väldigt varma vid beröring med maximalt 41 °C / 105.8 F.
(-) Medeltemperaturen för handledsstödsområdet på liknande enheter var 28.8 °C / 83.8 F (-12.2 °C / -22 F).
Gigabyte A7 X1 ljudanalys
(+) | högtalare kan spela relativt högt (85 dB)
Bas 100 - 315 Hz
(-) | nästan ingen bas - i genomsnitt 30.3% lägre än medianen
(±) | linjäriteten för basen är genomsnittlig (13.4% delta till föregående frekvens)
Mellan 400 - 2000 Hz
(±) | högre mellan - i genomsnitt 6.8% högre än median
(±) | linjäriteten för mids är genomsnittlig (11.3% delta till föregående frekvens)
Högsta 2 - 16 kHz
(+) | balanserade toppar - endast 4.4% från medianen
(+) | toppar är linjära (5.4% delta till föregående frekvens)
Totalt 100 - 16 000 Hz
(±) | linjäriteten för det totala ljudet är genomsnittlig (23.5% skillnad mot median)
Jämfört med samma klass
» 85% av alla testade enheter i den här klassen var bättre, 5% liknande, 10% sämre
» Den bästa hade ett delta på 6%, genomsnittet var 18%, sämst var 132%
Jämfört med alla testade enheter
» 70% av alla testade enheter var bättre, 6% liknande, 24% sämre
» Den bästa hade ett delta på 4%, genomsnittet var 24%, sämst var 134%
Schenker XMG Neo 17 (Early 2021, RTX 3070, 5800H) ljudanalys
(+) | högtalare kan spela relativt högt (84 dB)
Bas 100 - 315 Hz
(-) | nästan ingen bas - i genomsnitt 20.8% lägre än medianen
(±) | linjäriteten för basen är genomsnittlig (12.3% delta till föregående frekvens)
Mellan 400 - 2000 Hz
(+) | balanserad mellan - endast 2.9% från medianen
(+) | mids är linjära (5.1% delta till föregående frekvens)
Högsta 2 - 16 kHz
(+) | balanserade toppar - endast 2.7% från medianen
(±) | linjäriteten för toppar är genomsnittlig (7.6% delta till föregående frekvens)
Totalt 100 - 16 000 Hz
(+) | det totala ljudet är linjärt (14.5% skillnad mot median)
Jämfört med samma klass
» 27% av alla testade enheter i den här klassen var bättre, 7% liknande, 66% sämre
» Den bästa hade ett delta på 6%, genomsnittet var 18%, sämst var 132%
Jämfört med alla testade enheter
» 18% av alla testade enheter var bättre, 4% liknande, 78% sämre
» Den bästa hade ett delta på 4%, genomsnittet var 24%, sämst var 134%
| Av/Standby | |
| Låg belastning | |
| Hög belastning |
|
Förklaring:
min: | |
| Gigabyte A7 X1 R9 5900HX, GeForce RTX 3070 Laptop GPU | Medion Erazer Beast X25 R9 5900HX, GeForce RTX 3080 Laptop GPU | Medion Erazer Beast X20 i7-10870H, GeForce RTX 3070 Laptop GPU | Asus TUF Gaming F17 FX706HM i9-11900H, GeForce RTX 3060 Laptop GPU | Schenker XMG Neo 17 (Early 2021, RTX 3070, 5800H) R7 5800H, GeForce RTX 3070 Laptop GPU | Genomsnitt av klass Gaming | |
|---|---|---|---|---|---|---|
| Power Consumption | -41% | -15% | 17% | -12% | -15% | |
| Idle Minimum * (Watt) | 12 | 22 -83% | 13 -8% | 10.3 14% | 13 -8% | 13.1 ? -9% |
| Idle Average * (Watt) | 14 | 26 -86% | 18 -29% | 13.1 6% | 16 -14% | 18.8 ? -34% |
| Idle Maximum * (Watt) | 19 | 34 -79% | 32 -68% | 14.1 26% | 26 -37% | 24.4 ? -28% |
| Load Average * (Watt) | 118 | 120 -2% | 106 10% | 110 7% | 125 -6% | 108.5 ? 8% |
| Witcher 3 ultra * (Watt) | 205 | 189 8% | 192 6% | 138 33% | 187 9% | |
| Load Maximum * (Watt) | 229 | 231 -1% | 232 -1% | 190 17% | 259 -13% | 254 ? -11% |
* ... mindre är bättre
Energiförbrukning: The Witcher 3 - stress-test
| Gigabyte A7 X1 R9 5900HX, GeForce RTX 3070 Laptop GPU, 48.96 Wh | Medion Erazer Beast X25 R9 5900HX, GeForce RTX 3080 Laptop GPU, 91 Wh | Medion Erazer Beast X20 i7-10870H, GeForce RTX 3070 Laptop GPU, 91 Wh | Asus TUF Gaming F17 FX706HM i9-11900H, GeForce RTX 3060 Laptop GPU, 90 Wh | Schenker XMG Neo 17 (Early 2021, RTX 3070, 5800H) R7 5800H, GeForce RTX 3070 Laptop GPU, 62 Wh | Genomsnitt av klass Gaming | |
|---|---|---|---|---|---|---|
| Batteridrifttid | 31% | 62% | 85% | -34% | 36% | |
| WiFi v1.3 (h) | 4.7 | 6.8 45% | 6.2 32% | 7.6 62% | 3.5 -26% | 6.98 ? 49% |
| Load (h) | 1.2 | 1.4 17% | 2.3 92% | 2.5 108% | 0.7 -42% | 1.47 ? 23% |
För
Emot
Omdöme - Kraftfull och uppgraderingsbar
Läs den fullständiga versionen av den här recensionen på engelska här.
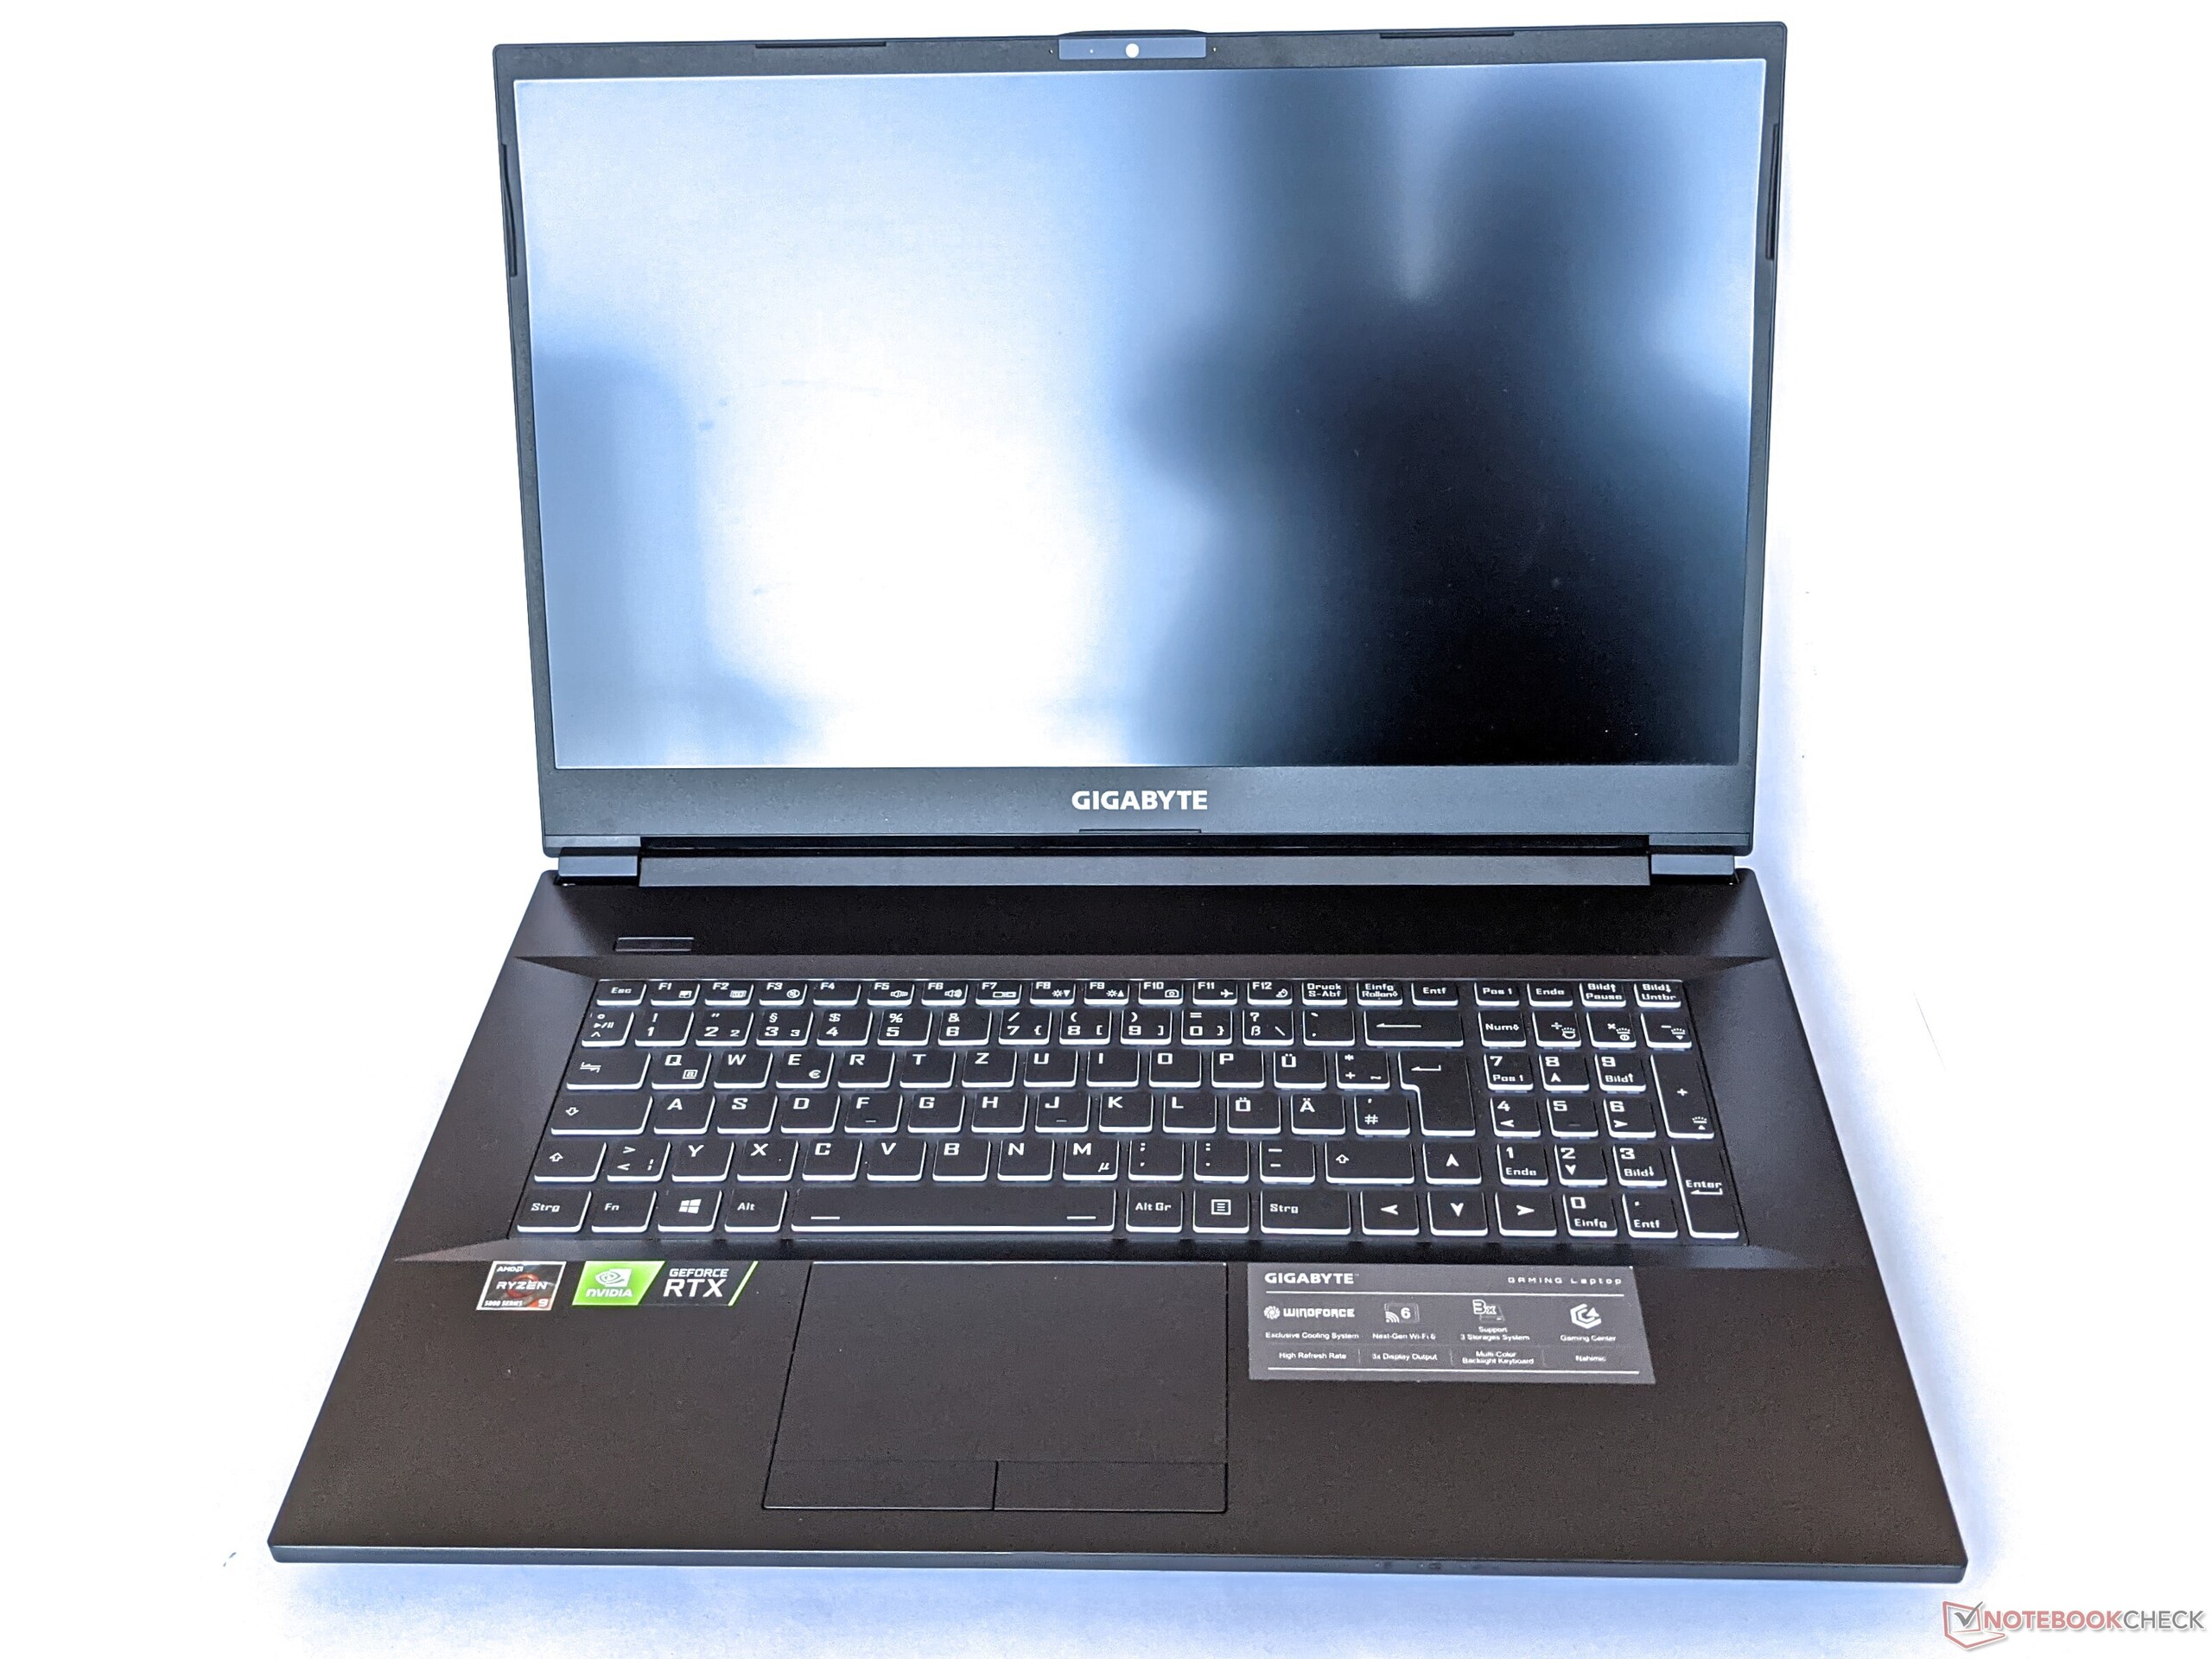
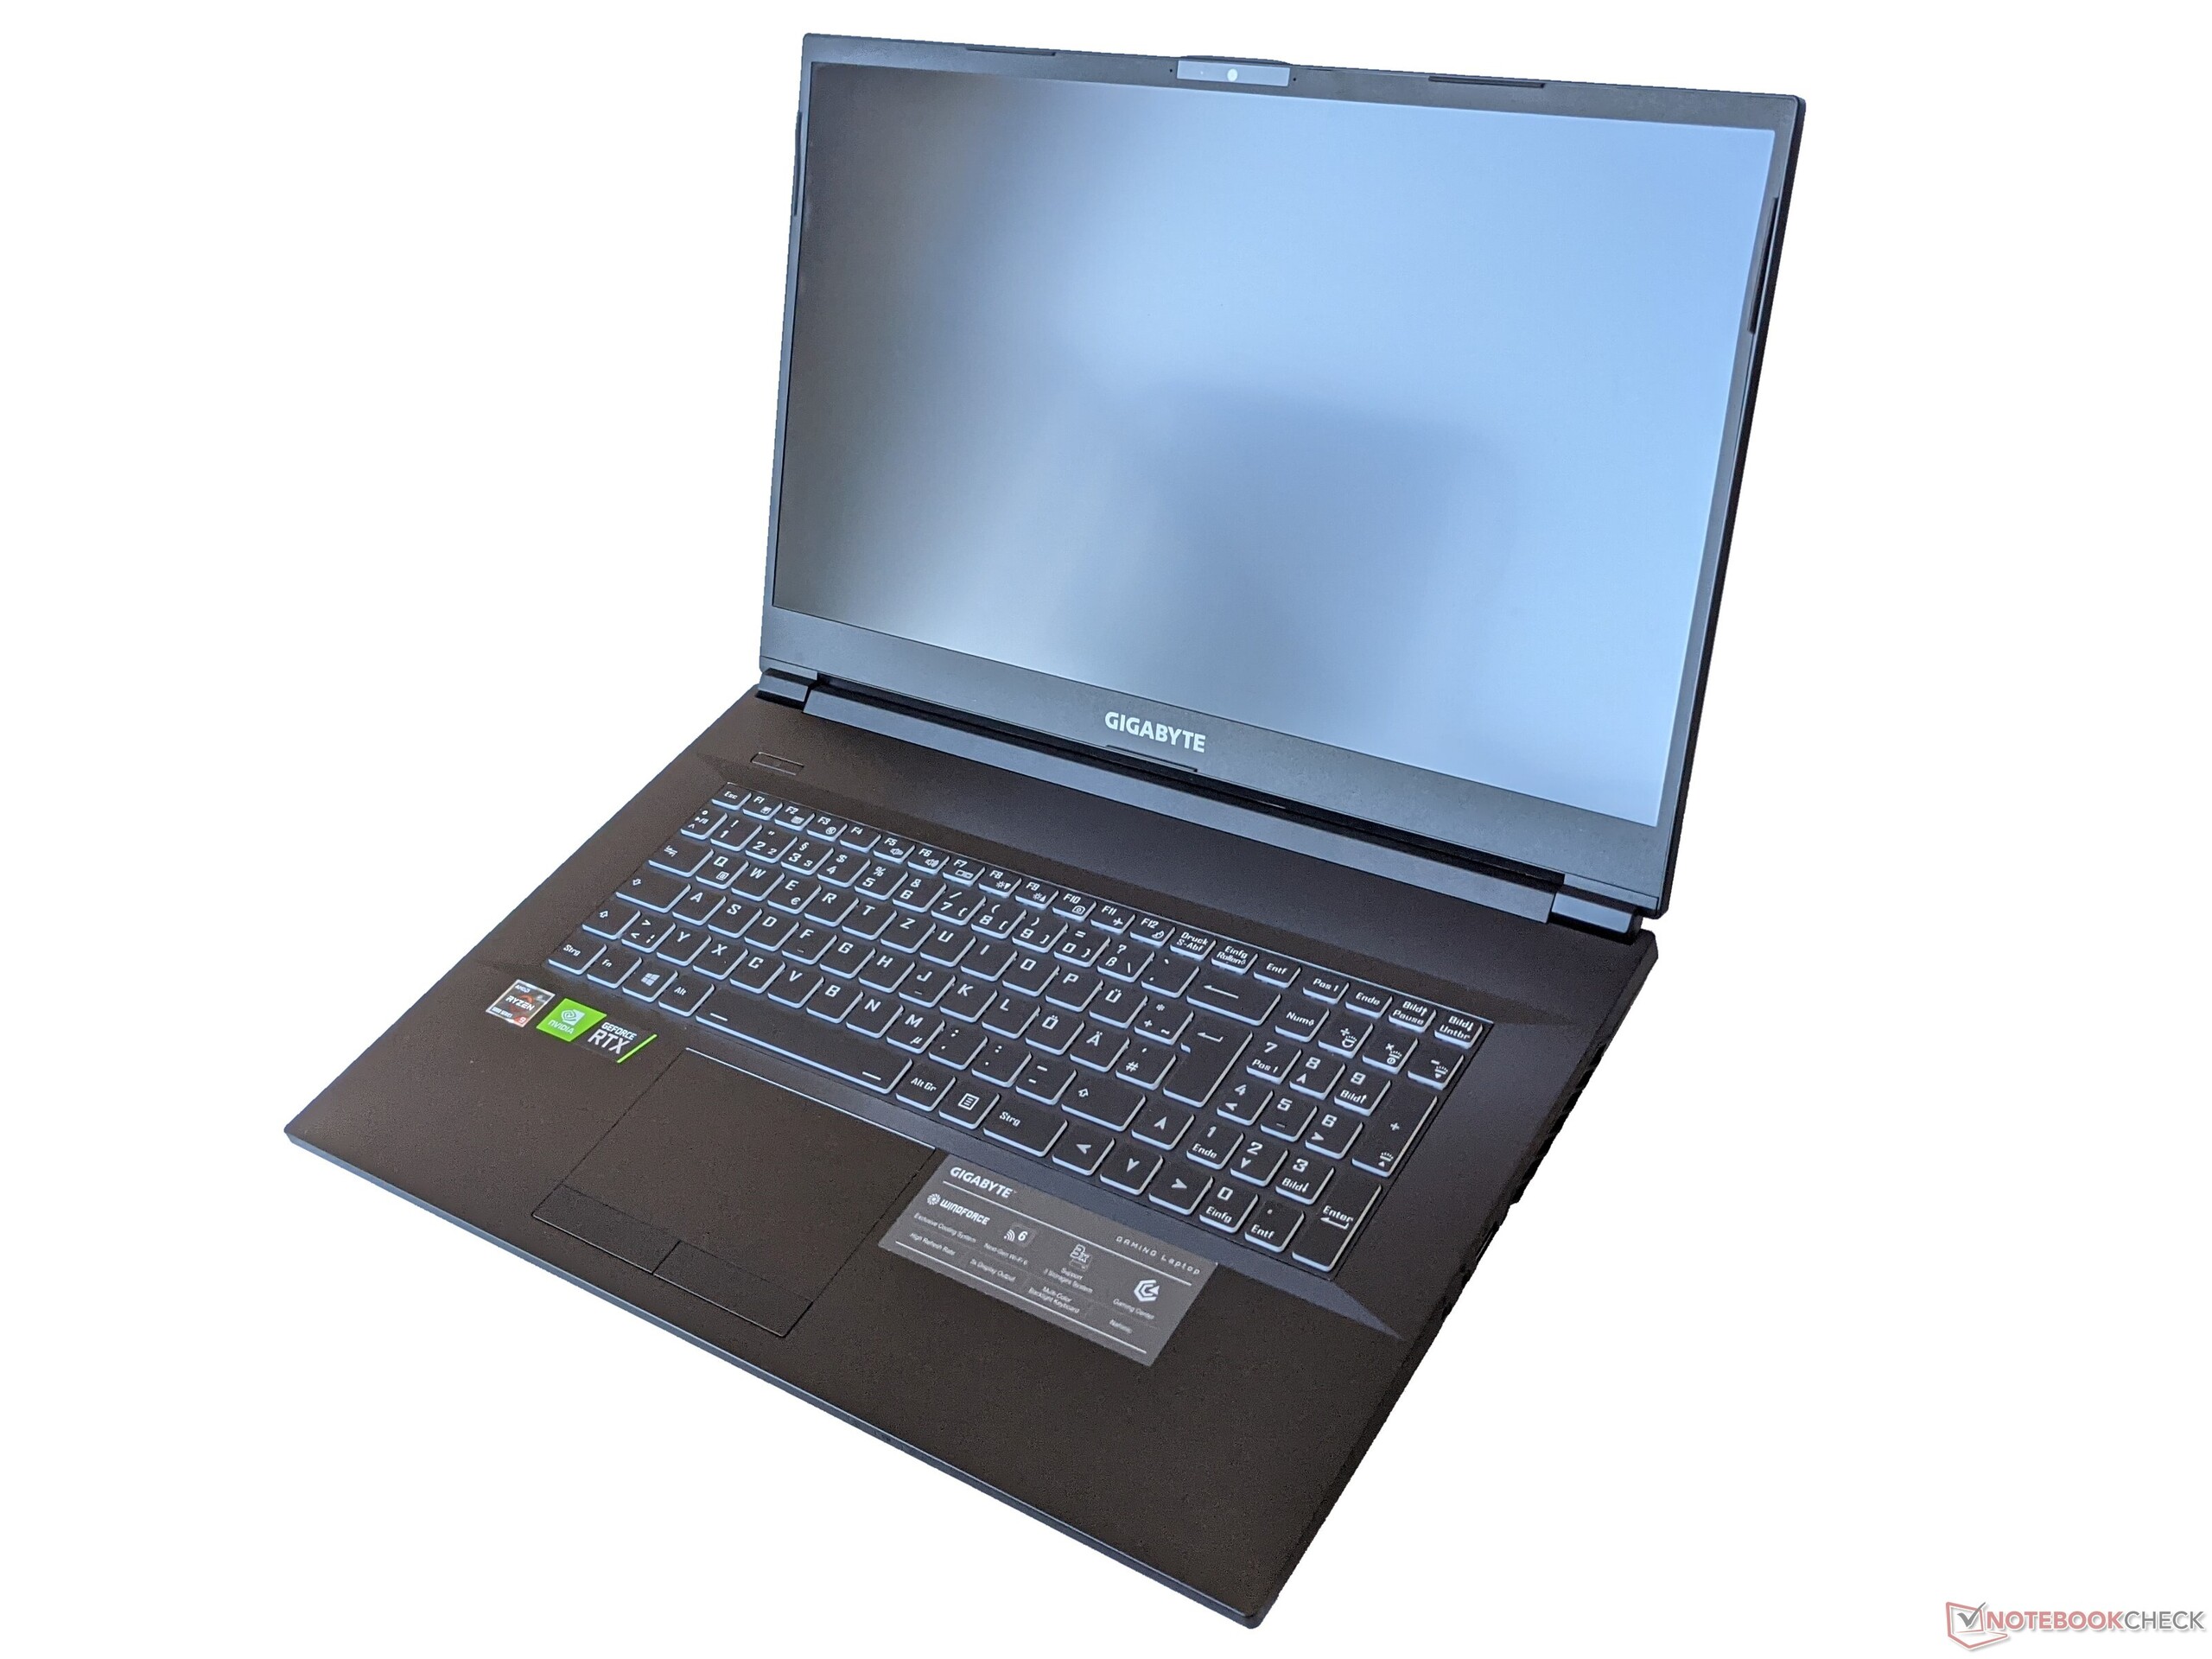
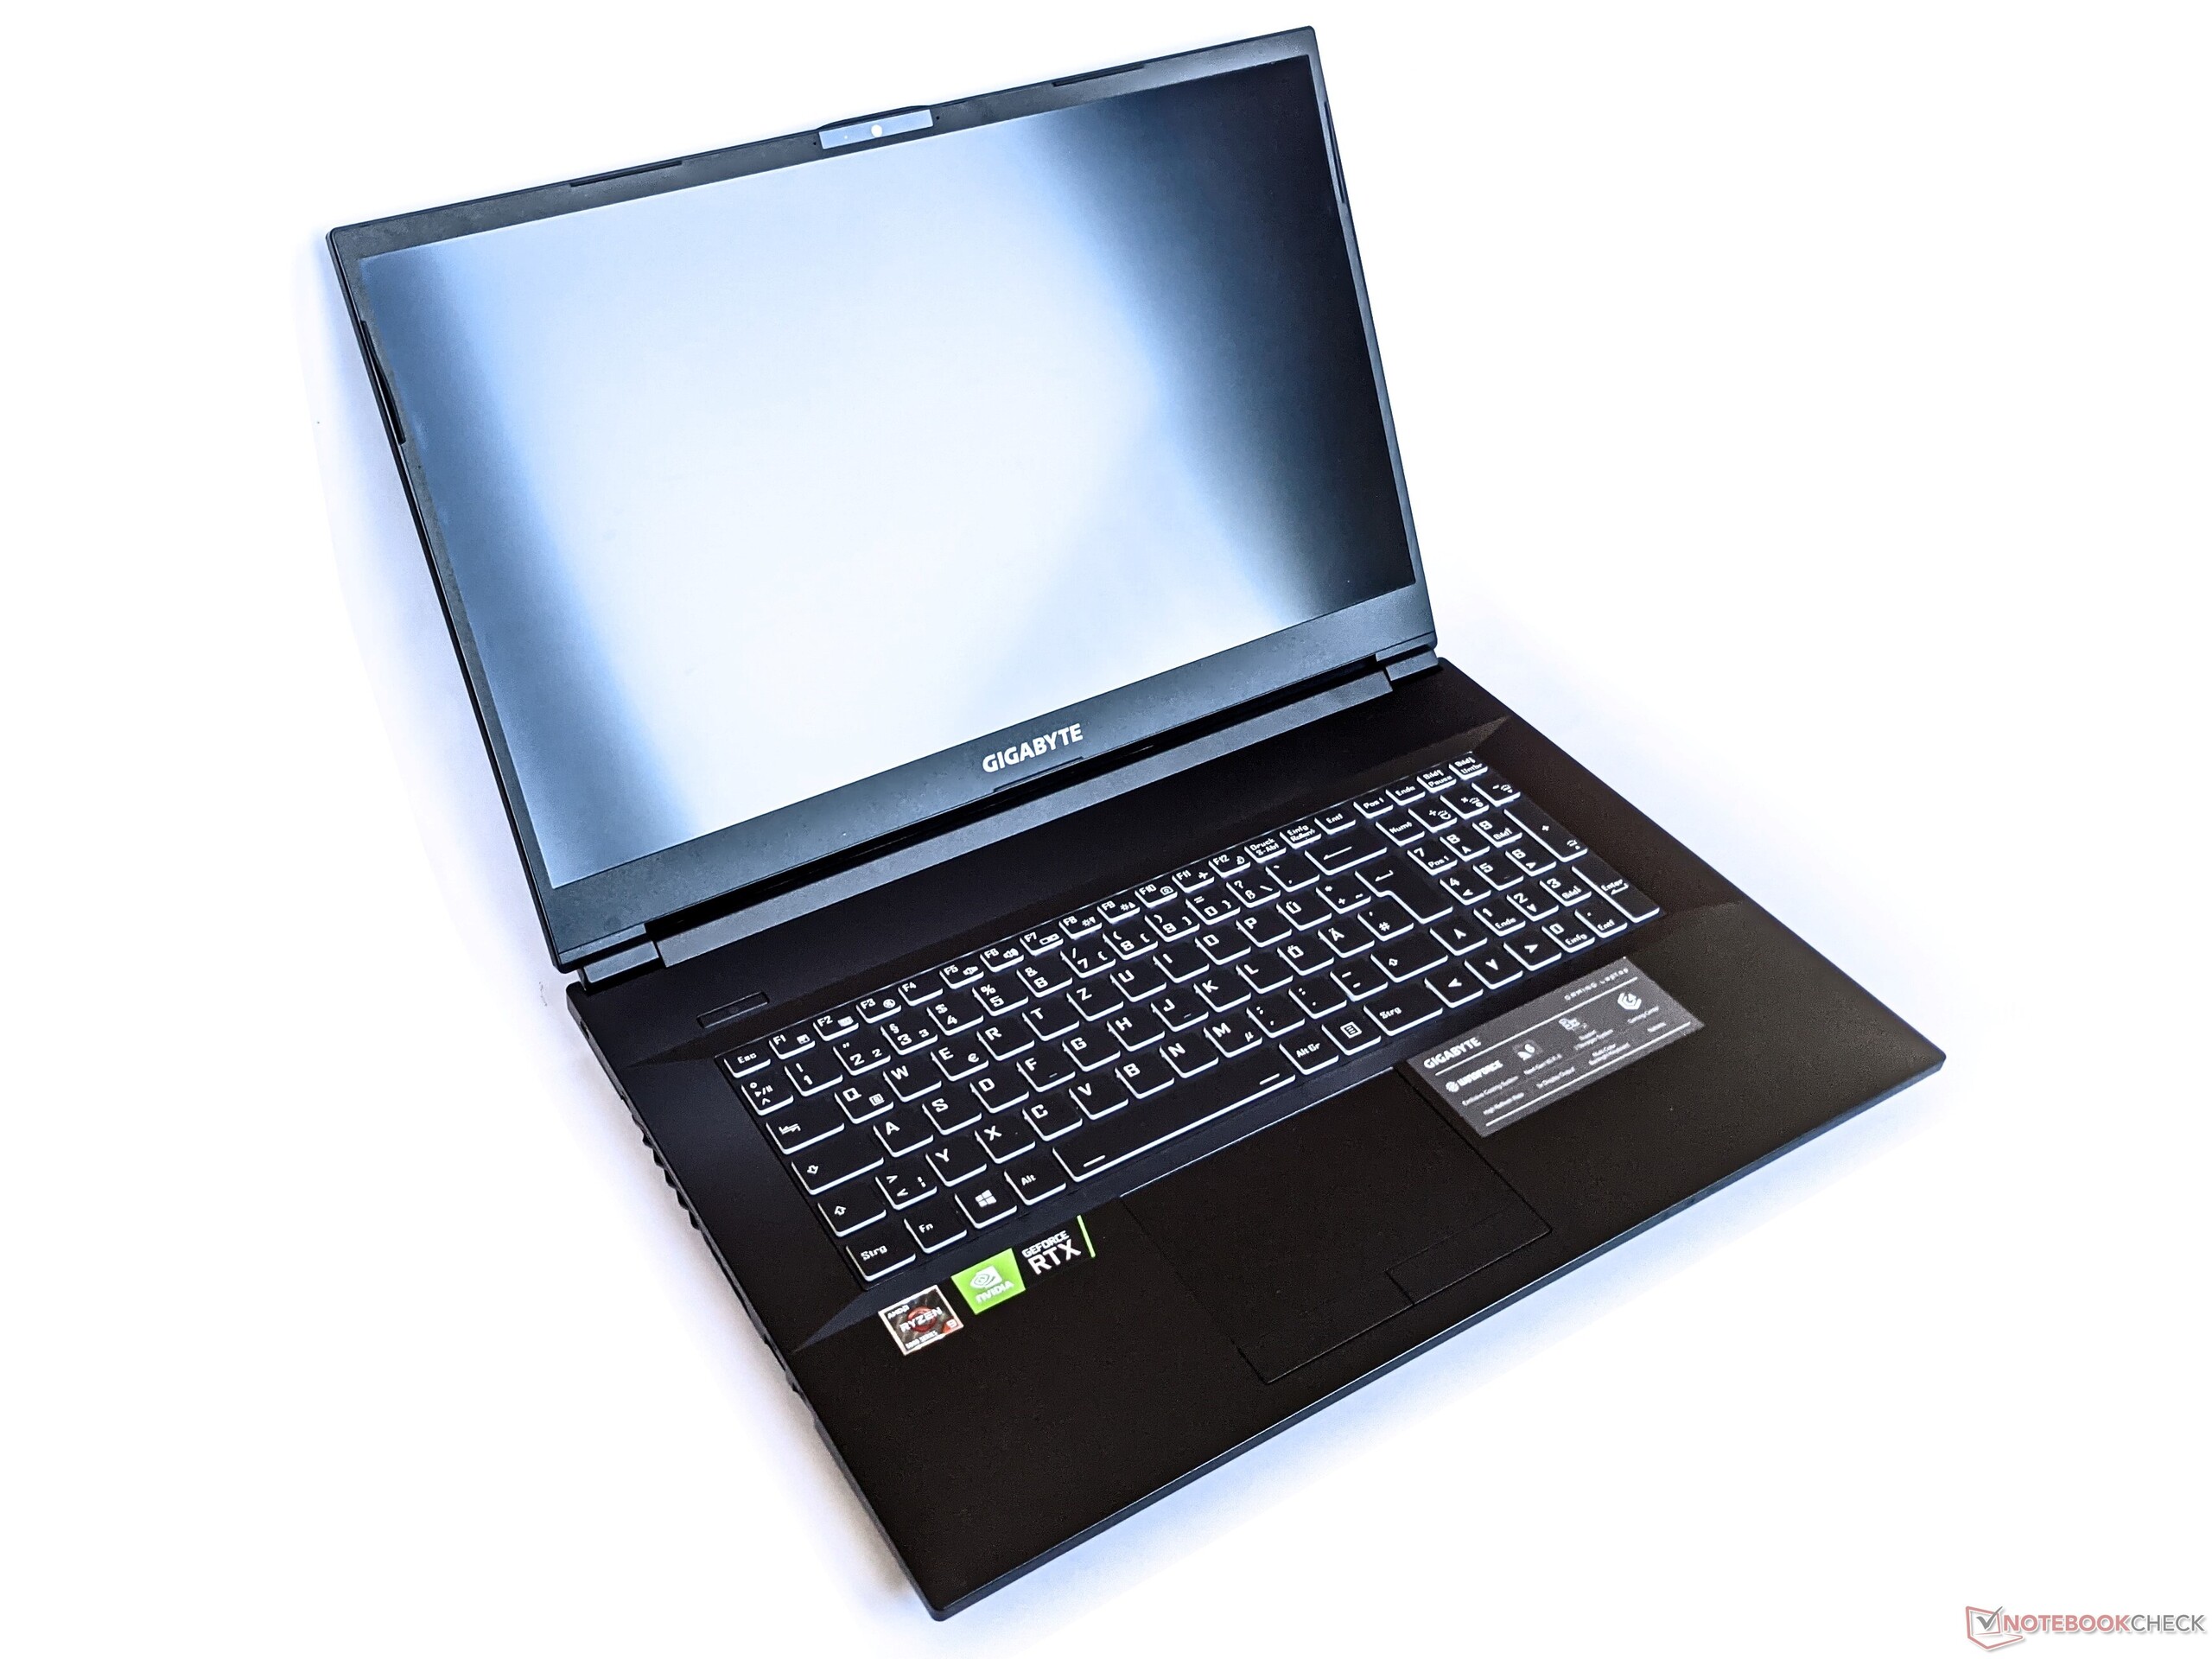
I fråga om utseende är Gigabyte A7 X1 verkligen inte en trendig, tunn och ultramobil spellaptop. Men den gör vad den ska riktigt bra, nämligen att visa upp spel smidigt på sin skärm. Tack vare ett välventilerat hölje kan både processorn och dess GeForce RTX 3070 släppa lös sin fulla prestanda utan begränsningar.
Gigabyte A7 X1 tar moderna spel och visar dem smidigt på sin skärm samtidigt som den erbjuder utmärkta servicemöjligheter.
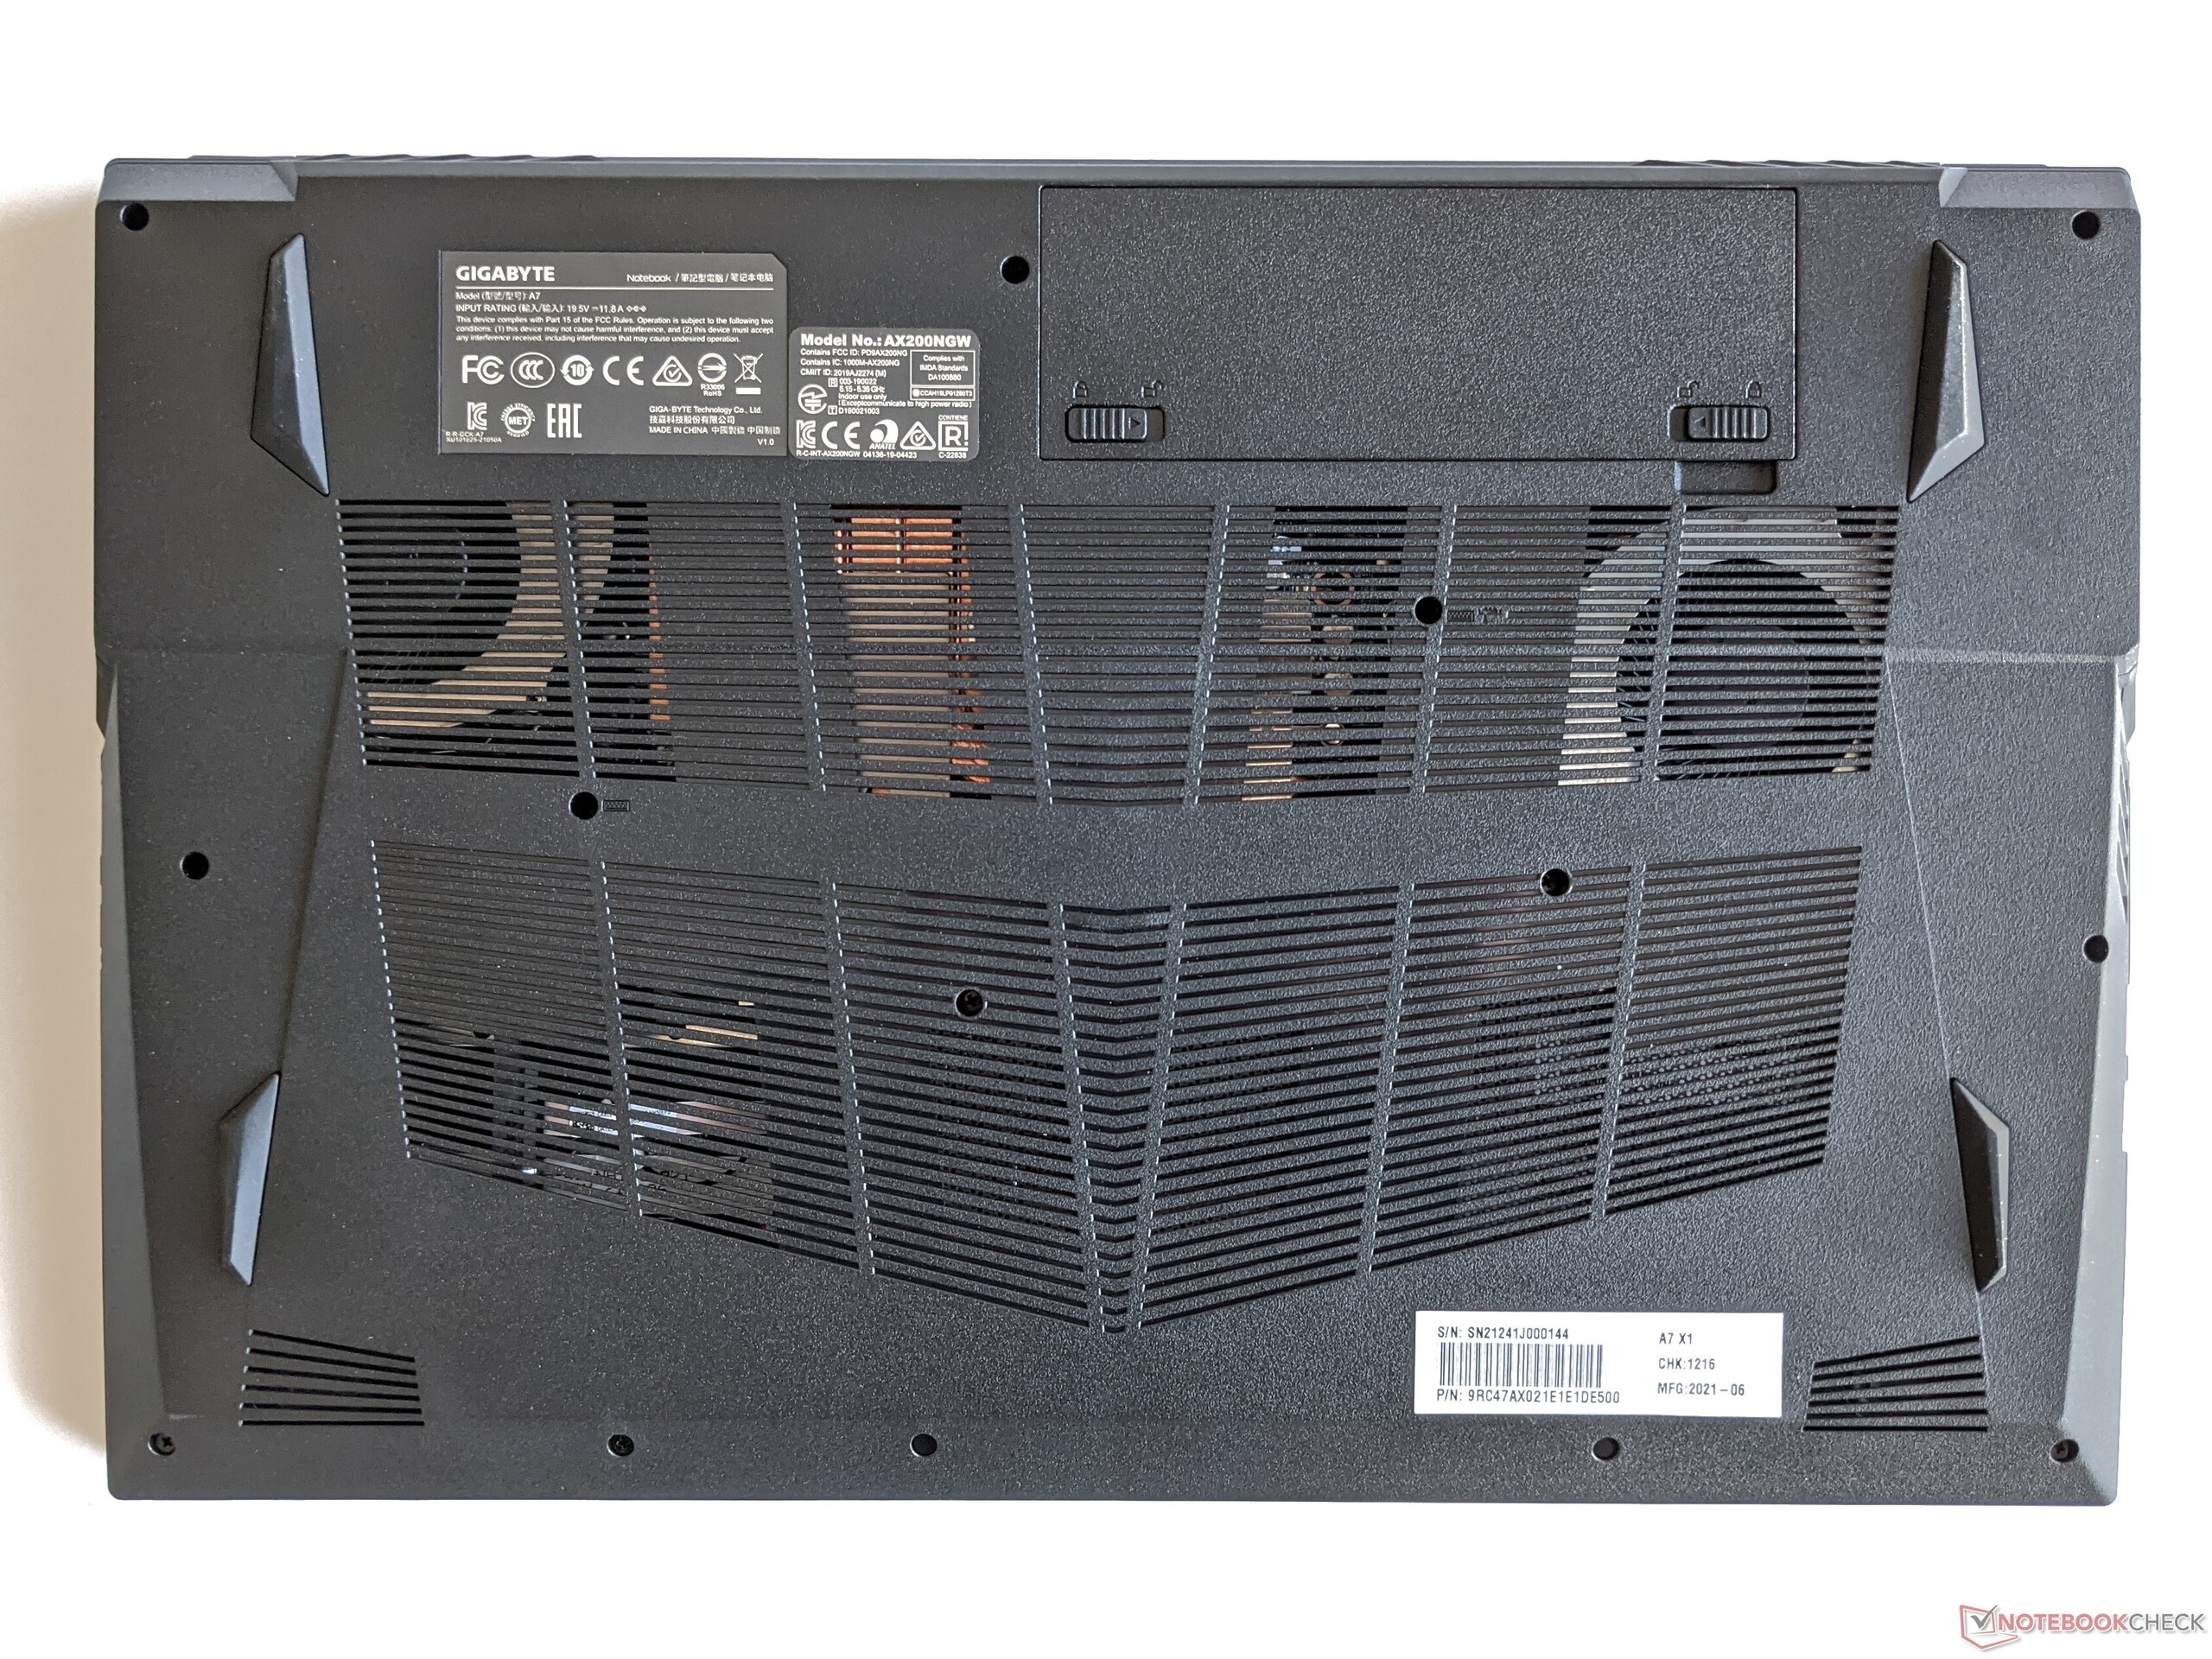
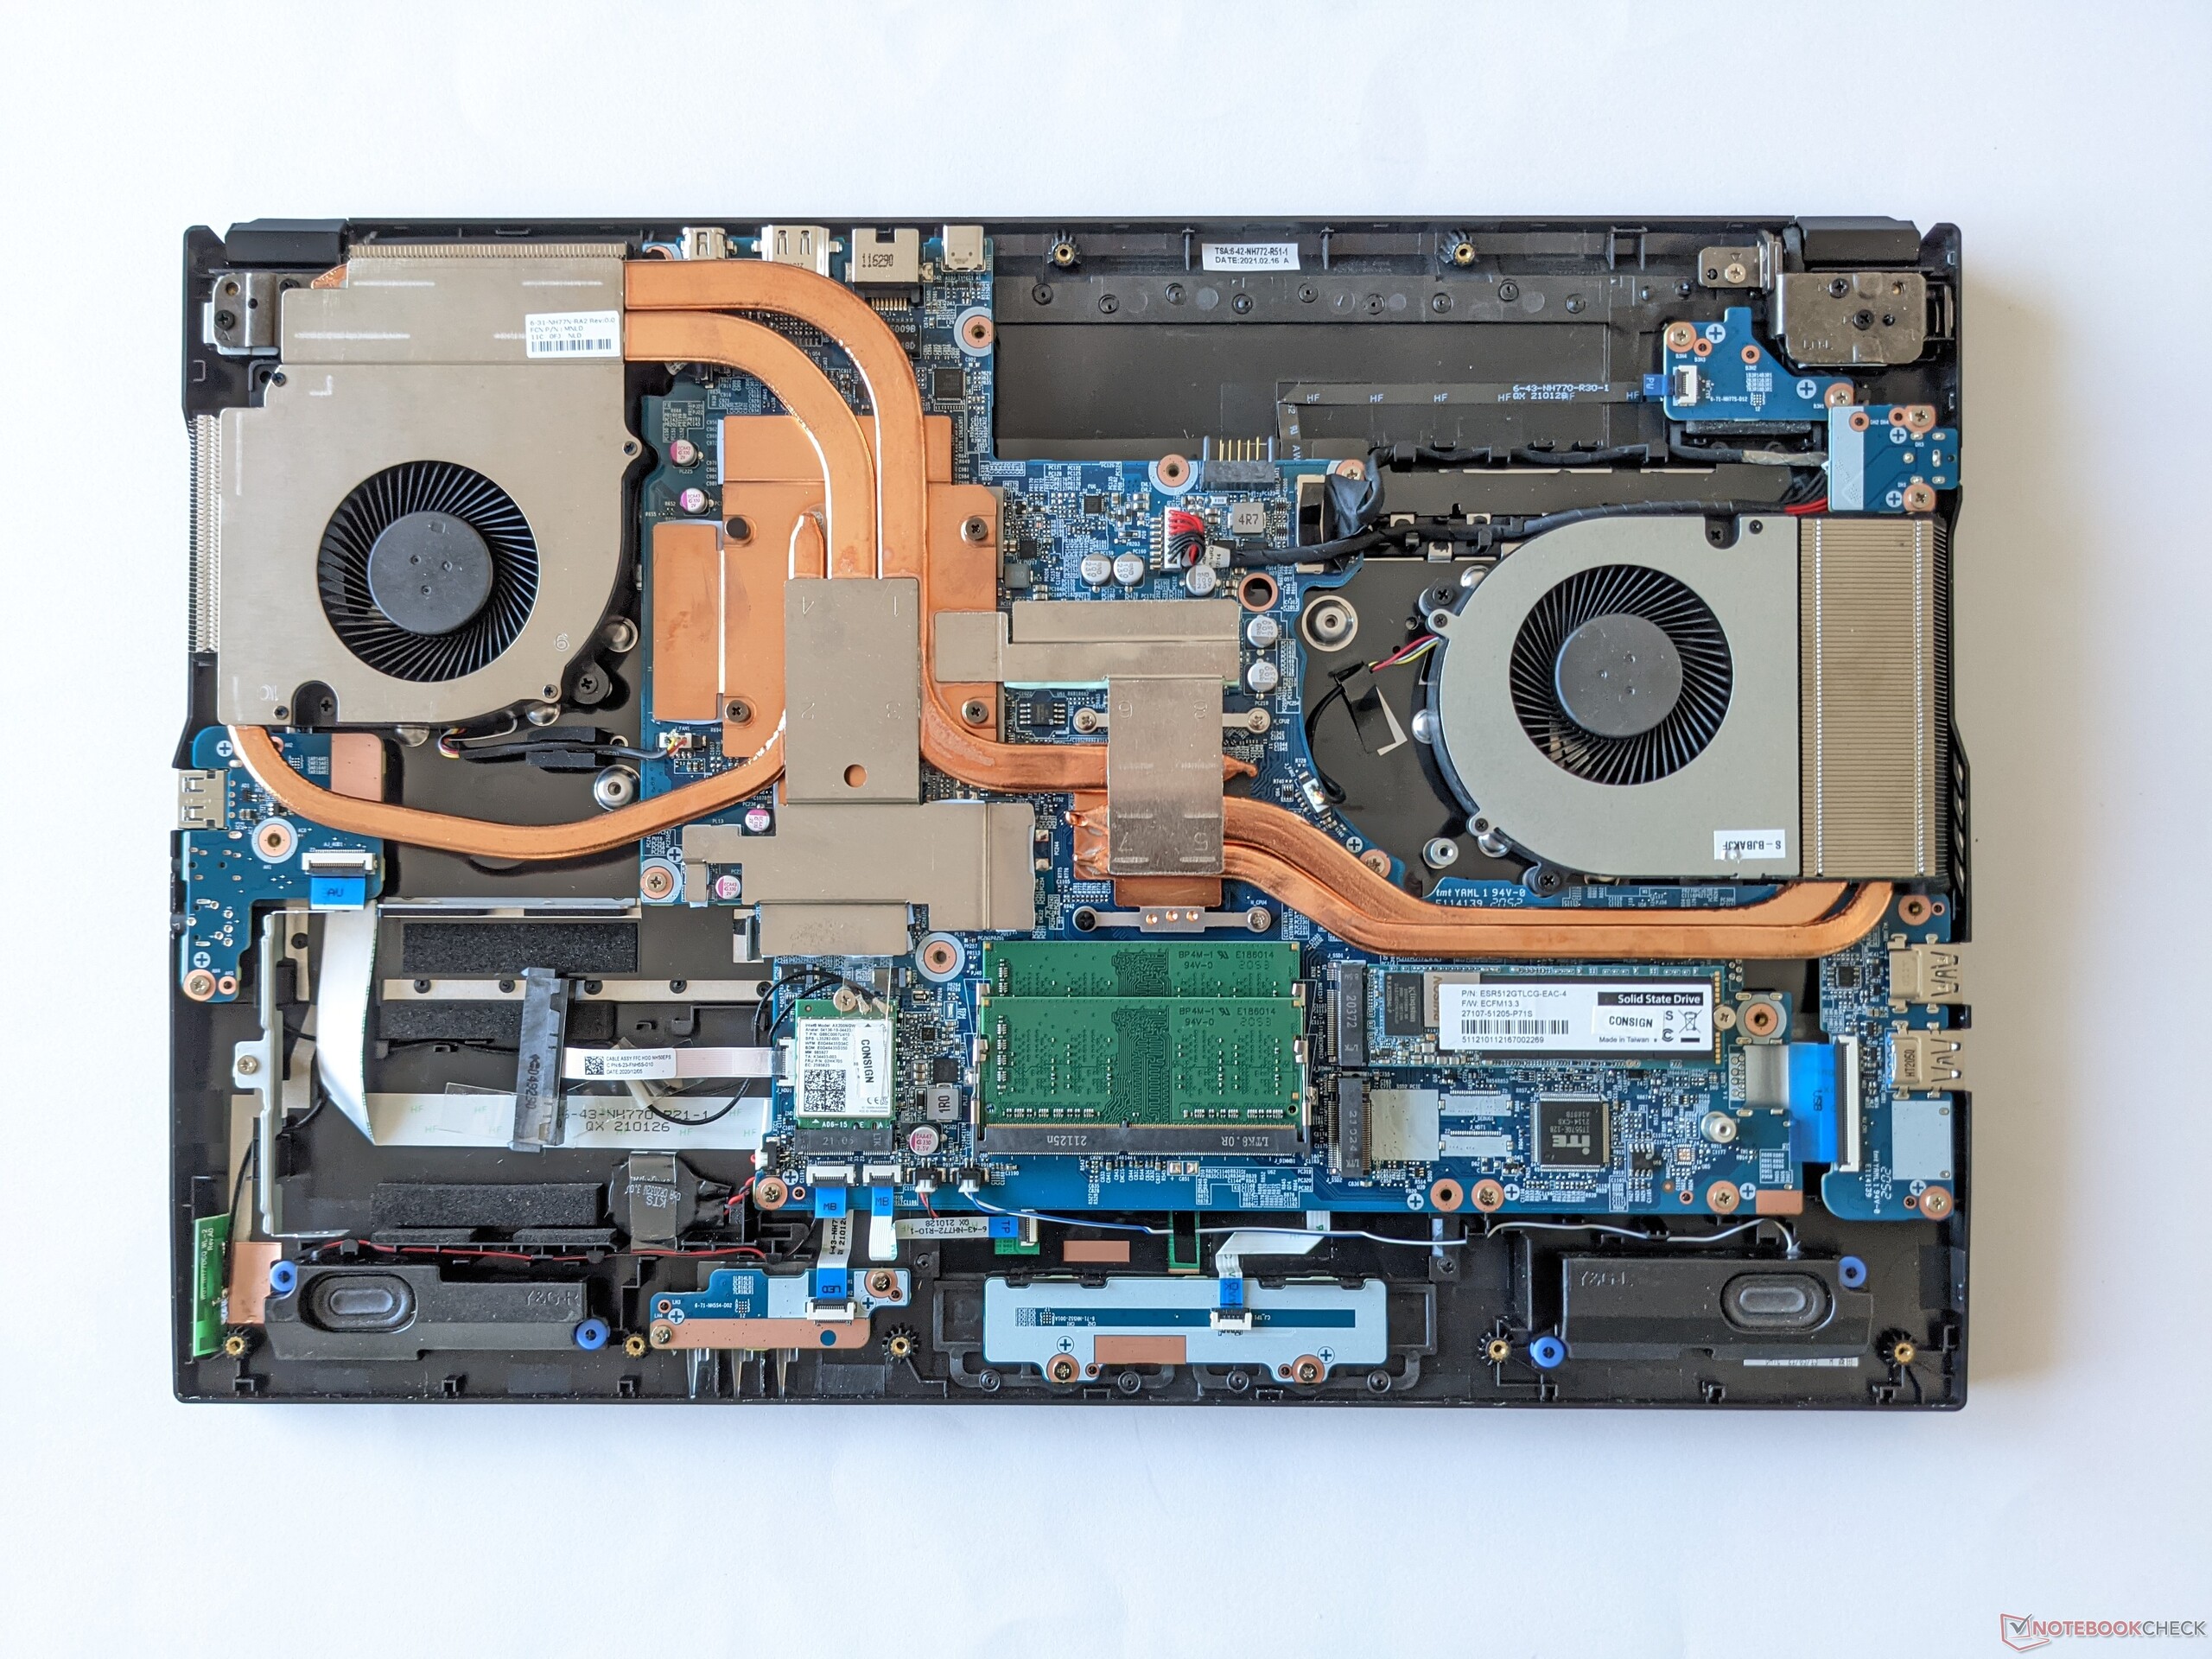
En annan fördel med den rejäla konstruktionen är att många komponenter lätt kan uppgraderas eller bytas ut. Som exempel går det att byta ut batteriet helt utan verktyg, det går att komma åt RAM och WLAN-modul och det finns dessutom lediga platser för lagringsenheter på insidan.
Tycker du att A7 X1 är för kraftig kan du ta en titt på 15-tumsmotsvarigheten Gigabyte G5 KC, som kommer med en Intel CPU. Schenker XMG Neo 17 är lite tunnare men också dyrare.
Gigabyte A7 X1
- 10/13/2021 v7 (old)
Mike Wobker
Price comparison
