Test: MSI GE66 Raider 10SFS - Premiär för RTX 2070 Super (Sammanfattning)
Gradering | Datum | Modell | Vikt | Höjd | Storlek | Upplösning | Pris |
|---|---|---|---|---|---|---|---|
| 84.6 % v7 (old) | 07/2020 | MSI GE66 Raider 10SFS i9-10980HK, GeForce RTX 2070 Super Mobile | 2.4 kg | 23 mm | 15.60" | 1920x1080 | |
| 84.7 % v7 (old) | 12/2019 | MSI GE65 Raider 9SF-049US i9-9880H, GeForce RTX 2070 Mobile | 2.3 kg | 26.9 mm | 15.60" | 1920x1080 | |
| 86 % v6 (old) | 06/2019 | Asus Strix Scar III G531GW i9-9880H, GeForce RTX 2070 Mobile | 2.3 kg | 25 mm | 15.60" | 1920x1080 | |
| 85.9 % v6 (old) | Eurocom Nightsky RX15 i9-9980HK, GeForce RTX 2070 Mobile | 2.5 kg | 29.9 mm | 15.60" | 3840x2160 |

| SD Card Reader | |
| average JPG Copy Test (av. of 3 runs) | |
| MSI GE66 Raider 10SFS (Toshiba Exceria Pro SDXC 64 GB UHS-II) | |
| Eurocom Nightsky RX15 (Toshiba Exceria Pro SDXC 64 GB UHS-II) | |
| Genomsnitt av klass Gaming (20.9 - 210, n=54, senaste 2 åren) | |
| MSI GE65 Raider 9SF-049US (Toshiba Exceria Pro SDXC 64 GB UHS-II) | |
| maximum AS SSD Seq Read Test (1GB) | |
| Eurocom Nightsky RX15 (Toshiba Exceria Pro SDXC 64 GB UHS-II) | |
| MSI GE66 Raider 10SFS (Toshiba Exceria Pro SDXC 64 GB UHS-II) | |
| Genomsnitt av klass Gaming (25.5 - 261, n=51, senaste 2 åren) | |
| MSI GE65 Raider 9SF-049US (Toshiba Exceria Pro SDXC 64 GB UHS-II) | |
| Networking | |
| iperf3 transmit AX12 | |
| MSI GE66 Raider 10SFS | |
| Eurocom Nightsky RX15 | |
| Asus Strix Scar III G531GW | |
| iperf3 receive AX12 | |
| MSI GE66 Raider 10SFS | |
| Eurocom Nightsky RX15 | |
| Asus Strix Scar III G531GW | |


| |||||||||||||||||||||||||
Distribution av ljusstyrkan: 91 %
Mitt på batteriet: 291 cd/m²
Kontrast: 1164:1 (Svärta: 0.25 cd/m²)
ΔE ColorChecker Calman: 1.19 | ∀{0.5-29.43 Ø4.71}
ΔE Greyscale Calman: 1.9 | ∀{0.09-98 Ø4.96}
92% sRGB (Argyll 1.6.3 3D)
70% AdobeRGB 1998 (Argyll 1.6.3 3D)
69.8% AdobeRGB 1998 (Argyll 3D)
99% sRGB (Argyll 3D)
68% Display P3 (Argyll 3D)
Gamma: 2.216
CCT: 7018 K
| MSI GE66 Raider 10SFS Sharp LQ156M1JW03 (SHP14C5), IPS-Level, 1920x1080 | MSI GE65 Raider 9SF-049US Sharp LQ156M1JW03, IPS, 1920x1080 | Asus Strix Scar III G531GW Sharp LQ156M1JW09 (SHP14D3), IPS, 1920x1080 | Eurocom Nightsky RX15 Samsung SDCA029, OLED, 3840x2160 | |
|---|---|---|---|---|
| Display | 1% | -3% | 30% | |
| Display P3 Coverage (%) | 68 | 69.3 2% | 66.2 -3% | 99.9 47% |
| sRGB Coverage (%) | 99 | 98.9 0% | 96.5 -3% | 100 1% |
| AdobeRGB 1998 Coverage (%) | 69.8 | 70.7 1% | 67.5 -3% | 99.1 42% |
| Response Times | 6% | -7% | 80% | |
| Response Time Grey 50% / Grey 80% * (ms) | 16.4 ? | 13.2 ? 20% | 17.2 ? -5% | 2.4 ? 85% |
| Response Time Black / White * (ms) | 10.4 ? | 11.2 ? -8% | 11.2 ? -8% | 2.6 ? 75% |
| PWM Frequency (Hz) | 23580 ? | 23150 ? | 24040 ? | 59.5 ? |
| Screen | -19% | -14% | -107% | |
| Brightness middle (cd/m²) | 291 | 277.4 -5% | 266 -9% | 414.9 43% |
| Brightness (cd/m²) | 278 | 264 -5% | 252 -9% | 404 45% |
| Brightness Distribution (%) | 91 | 90 -1% | 88 -3% | 88 -3% |
| Black Level * (cd/m²) | 0.25 | 0.24 4% | 0.27 -8% | |
| Contrast (:1) | 1164 | 1156 -1% | 985 -15% | |
| Colorchecker dE 2000 * | 1.19 | 1.51 -27% | 1.81 -52% | 7.58 -537% |
| Colorchecker dE 2000 max. * | 3.04 | 4.93 -62% | 3.23 -6% | 14.85 -388% |
| Greyscale dE 2000 * | 1.9 | 3.7 -95% | 2.44 -28% | 2.9 -53% |
| Gamma | 2.216 99% | 2.23 99% | 2.42 91% | 2.05 107% |
| CCT | 7018 93% | 7061 92% | 7005 93% | 6538 99% |
| Color Space (Percent of AdobeRGB 1998) (%) | 70 | 65.1 -7% | 62 -11% | 88.2 26% |
| Color Space (Percent of sRGB) (%) | 92 | 99.1 8% | 97 5% | 100 9% |
| Colorchecker dE 2000 calibrated * | 1.77 | 1.03 | ||
| Totalt genomsnitt (program/inställningar) | -4% /
-12% | -8% /
-11% | 1% /
-47% |
* ... mindre är bättre
Visa svarstider
| ↔ Svarstid svart till vitt | ||
|---|---|---|
| 10.4 ms ... stiga ↗ och falla ↘ kombinerat | ↗ 6 ms stiga | 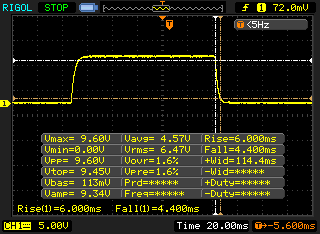 |
| ↘ 4.4 ms hösten | ||
| Skärmen visar bra svarsfrekvens i våra tester, men kan vara för långsam för konkurrenskraftiga spelare. I jämförelse sträcker sig alla testade enheter från 0.1 (minst) till 240 (maximalt) ms. » 28 % av alla enheter är bättre. Det betyder att den uppmätta svarstiden är bättre än genomsnittet av alla testade enheter (19.8 ms). | ||
| ↔ Svarstid 50 % grått till 80 % grått | ||
| 16.4 ms ... stiga ↗ och falla ↘ kombinerat | ↗ 6.8 ms stiga | 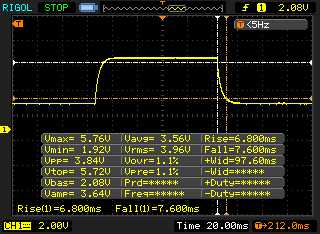 |
| ↘ 7.6 ms hösten | ||
| Skärmen visar bra svarsfrekvens i våra tester, men kan vara för långsam för konkurrenskraftiga spelare. I jämförelse sträcker sig alla testade enheter från 0.165 (minst) till 636 (maximalt) ms. » 31 % av alla enheter är bättre. Det betyder att den uppmätta svarstiden är bättre än genomsnittet av alla testade enheter (31 ms). | ||
Skärmflimmer / PWM (Puls-Width Modulation)
| Skärmflimmer / PWM upptäckt | 23580 Hz | ≤ 19 % ljusstyrka inställning | 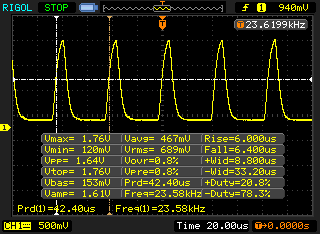 |
Displayens bakgrundsbelysning flimrar vid 23580 Hz (i värsta fall, t.ex. med PWM) Flimrande upptäckt vid en ljusstyrkeinställning på 19 % och lägre. Det ska inte finnas något flimmer eller PWM över denna ljusstyrkeinställning. Frekvensen för 23580 Hz är ganska hög, så de flesta användare som är känsliga för PWM bör inte märka något flimmer. Som jämförelse: 52 % av alla testade enheter använder inte PWM för att dämpa skärmen. Om PWM upptäcktes mättes ett medelvärde av 7754 (minst: 5 - maximum: 343500) Hz. | |||
| Cinebench R15 | |
| CPU Single 64Bit | |
| Genomsnitt av klass Gaming (188.8 - 350, n=106, senaste 2 åren) | |
| MSI GE66 Raider 10SFS | |
| Eurocom Nightsky RX15 | |
| MSI GE65 Raider 9SF-049US | |
| Asus Strix Scar III G531GW | |
| CPU Multi 64Bit | |
| Genomsnitt av klass Gaming (1578 - 6330, n=105, senaste 2 åren) | |
| Eurocom Nightsky RX15 | |
| MSI GE66 Raider 10SFS | |
| MSI GE65 Raider 9SF-049US | |
| Asus Strix Scar III G531GW | |
| Blender - v2.79 BMW27 CPU | |
| Eurocom Nightsky RX15 | |
| MSI GE66 Raider 10SFS | |
| Genomsnitt av klass Gaming (79 - 330, n=104, senaste 2 åren) | |
| 7-Zip 18.03 | |
| 7z b 4 -mmt1 | |
| Genomsnitt av klass Gaming (4199 - 7436, n=105, senaste 2 åren) | |
| MSI GE66 Raider 10SFS | |
| Eurocom Nightsky RX15 | |
| 7z b 4 | |
| Genomsnitt av klass Gaming (33491 - 148086, n=105, senaste 2 åren) | |
| MSI GE66 Raider 10SFS | |
| Eurocom Nightsky RX15 | |
| Cinebench R20 | |
| CPU (Single Core) | |
| Genomsnitt av klass Gaming (442 - 913, n=106, senaste 2 åren) | |
| Eurocom Nightsky RX15 | |
| MSI GE66 Raider 10SFS | |
| MSI GE65 Raider 9SF-049US | |
| CPU (Multi Core) | |
| Genomsnitt av klass Gaming (4029 - 16433, n=106, senaste 2 åren) | |
| MSI GE66 Raider 10SFS | |
| Eurocom Nightsky RX15 | |
| MSI GE65 Raider 9SF-049US | |
| Geekbench 5.5 | |
| Single-Core | |
| Genomsnitt av klass Gaming (986 - 2474, n=105, senaste 2 åren) | |
| MSI GE66 Raider 10SFS | |
| Multi-Core | |
| Genomsnitt av klass Gaming (6460 - 28263, n=105, senaste 2 åren) | |
| MSI GE66 Raider 10SFS | |
| HWBOT x265 Benchmark v2.2 - 4k Preset | |
| Genomsnitt av klass Gaming (11.5 - 44.4, n=105, senaste 2 åren) | |
| MSI GE66 Raider 10SFS | |
| Eurocom Nightsky RX15 | |
| LibreOffice - 20 Documents To PDF | |
| MSI GE66 Raider 10SFS | |
| Genomsnitt av klass Gaming (33.2 - 88.8, n=105, senaste 2 åren) | |
| R Benchmark 2.5 - Overall mean | |
| MSI GE66 Raider 10SFS | |
| Genomsnitt av klass Gaming (0.3439 - 0.759, n=106, senaste 2 åren) | |
* ... mindre är bättre
| PCMark 10 - Score | |
| Genomsnitt av klass Gaming (5828 - 12414, n=93, senaste 2 åren) | |
| MSI GE65 Raider 9SF-049US | |
| Eurocom Nightsky RX15 | |
| MSI GE66 Raider 10SFS | |
| Asus Strix Scar III G531GW | |
| DPC Latencies / LatencyMon - interrupt to process latency (max), Web, Youtube, Prime95 | |
| MSI GE66 Raider 10SFS | |
* ... mindre är bättre
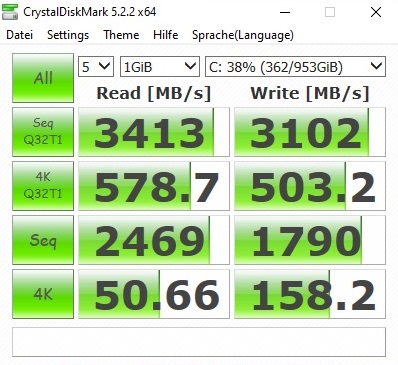
| MSI GE66 Raider 10SFS WDC PC SN730 SDBPNTY-1T00 | MSI GE65 Raider 9SF-049US Samsung SSD PM981 MZVLB1T0HALR | Asus Strix Scar III G531GW Intel SSD 660p 1TB SSDPEKNW010T8 | Eurocom Nightsky RX15 Samsung SSD 970 Pro 512GB | |
|---|---|---|---|---|
| CrystalDiskMark 5.2 / 6 | -9% | -18% | -3% | |
| Write 4K (MB/s) | 158.2 | 125.7 -21% | 135 -15% | 153 -3% |
| Read 4K (MB/s) | 50.7 | 45.04 -11% | 54.9 8% | 60.5 19% |
| Write Seq (MB/s) | 1790 | 2361 32% | 1649 -8% | 1938 8% |
| Read Seq (MB/s) | 2469 | 1987 -20% | 1449 -41% | 1932 -22% |
| Write 4K Q32T1 (MB/s) | 503 | 407.1 -19% | 508 1% | 482.5 -4% |
| Read 4K Q32T1 (MB/s) | 579 | 537 -7% | 559 -3% | 594 3% |
| Write Seq Q32T1 (MB/s) | 3102 | 2398 -23% | 1759 -43% | 2324 -25% |
| Read Seq Q32T1 (MB/s) | 3413 | 3309 -3% | 1826 -46% | 3539 4% |

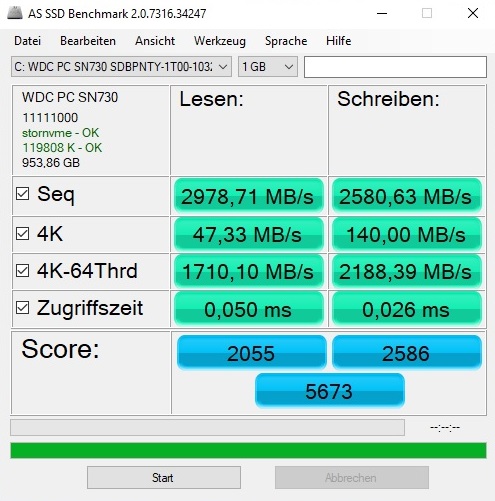
Continuous load read: DiskSpd Read Loop, Queue Depth 8
| 3DMark 06 Standard Score | 43041 poäng | |
| 3DMark Vantage P Result | 70601 poäng | |
| 3DMark 11 Performance | 24989 poäng | |
| 3DMark Cloud Gate Standard Score | 50695 poäng | |
| 3DMark Fire Strike Score | 19884 poäng | |
| 3DMark Time Spy Score | 8419 poäng | |
Hjälp | ||
| 3DMark | |
| 1920x1080 Fire Strike Graphics | |
| Genomsnitt av klass Gaming (12242 - 62849, n=115, senaste 2 åren) | |
| MSI GE66 Raider 10SFS | |
| MSI GE65 Raider 9SF-049US | |
| Eurocom Nightsky RX15 | |
| Asus Strix Scar III G531GW | |
| 2560x1440 Time Spy Graphics | |
| Genomsnitt av klass Gaming (5012 - 26212, n=115, senaste 2 åren) | |
| MSI GE66 Raider 10SFS | |
| MSI GE65 Raider 9SF-049US | |
| Eurocom Nightsky RX15 | |
| Asus Strix Scar III G531GW | |
| 2560x1440 Port Royal Graphics | |
| Genomsnitt av klass Gaming (4395 - 17286, n=71, senaste 2 åren) | |
| MSI GE66 Raider 10SFS | |
| MSI GE65 Raider 9SF-049US | |
| Eurocom Nightsky RX15 | |
| 3DMark 11 - 1280x720 Performance GPU | |
| Genomsnitt av klass Gaming (21841 - 80022, n=104, senaste 2 åren) | |
| MSI GE66 Raider 10SFS | |
| Eurocom Nightsky RX15 | |
| MSI GE65 Raider 9SF-049US | |
| Asus Strix Scar III G531GW | |
| The Witcher 3 - 1920x1080 Ultra Graphics & Postprocessing (HBAO+) | |
| Genomsnitt av klass Gaming (104.7 - 240, n=7, senaste 2 åren) | |
| MSI GE66 Raider 10SFS | |
| Eurocom Nightsky RX15 | |
| MSI GE65 Raider 9SF-049US | |
| Asus Strix Scar III G531GW | |
| låg | med. | hög | ultra | QHD | 4K | |
|---|---|---|---|---|---|---|
| GTA V (2015) | 182 | 177 | 163 | 94 | ||
| The Witcher 3 (2015) | 268 | 161 | 85.1 | 57.6 | ||
| Dota 2 Reborn (2015) | 155 | 141 | 133 | 126 | ||
| Fortnite (2018) | 164 | 156 | 129 | 93.4 | 47.9 | |
| Final Fantasy XV Benchmark (2018) | 121 | 91.1 | 37.7 | |||
| Kingdom Come: Deliverance (2018) | 146 | 119 | 82.5 | 59.7 | 31.1 | |
| X-Plane 11.11 (2018) | 117 | 103 | 87 | |||
| Monster Hunter World (2018) | 130 | 120 | 98.9 | 63.9 | 32.1 | |
| Shadow of the Tomb Raider (2018) | 123 | 118 | 108 | 73 | 37 | |
| Assassin´s Creed Odyssey (2018) | 104 | 90 | 63 | 56 | 36 | |
| Hitman 2 (2018) | 98.8 | 89.7 | 82.5 | 78.8 | 46.4 | |
| Battlefield V (2018) | 166 | 152 | 141 | 110 | 62.7 | |
| Darksiders III (2018) | 166 | 141 | 127 | 88.3 | 44 | |
| Just Cause 4 (2018) | 162 | 119 | 105 | 75 | 41.2 | |
| Apex Legends (2019) | 144 | 144 | 144 | 121 | 66.6 | |
| Far Cry New Dawn (2019) | 111 | 104 | 94 | 89 | 50 | |
| Metro Exodus (2019) | 112 | 82.7 | 65.5 | 54.4 | 31.9 | |
| Dirt Rally 2.0 (2019) | 211 | 178 | 97.7 | 72.4 | ||
| The Division 2 (2019) | 150 | 124 | 87 | 61 | 32 | |
| Anno 1800 (2019) | 116 | 90.4 | 51 | 44 | 23.9 | |
| Rage 2 (2019) | 143 | 121 | 119 | 74.2 | 36.7 | |
| F1 2019 (2019) | 203 | 178 | 170 | 116 | 73 | |
| Control (2019) | 107 | 80.8 | 52.6 | 25.6 | ||
| Borderlands 3 (2019) | 127 | 92.1 | 70.6 | 49.8 | 26.8 | |
| FIFA 20 (2019) | 280 | 267 | 264 | 262 | 211 | |
| Ghost Recon Breakpoint (2019) | 115 | 101 | 75 | 55 | 32 | |
| GRID 2019 (2019) | 160 | 119 | 80.7 | 70.2 | 47.2 | |
| Call of Duty Modern Warfare 2019 (2019) | 141 | 134 | 107 | 75.3 | 41.6 | |
| Need for Speed Heat (2019) | 105 | 97 | 92.4 | 81.7 | 48.1 | |
| Star Wars Jedi Fallen Order (2019) | 119 | 114 | 108 | 84 | 42.5 | |
| Red Dead Redemption 2 (2019) | 110 | 73.1 | 47.6 | 38.1 | 24.8 | |
| Escape from Tarkov (2020) | 121 | 121 | 121 | 81 | 41.4 | |
| Hunt Showdown (2020) | 136 | 113 | 74 | 34.1 | ||
| Doom Eternal (2020) | 198 | 176 | 170 | 118 | 61.6 | |
| Gears Tactics (2020) | 215 | 144 | 103 | 64.5 | 33.3 |
Ljudnivå
| Låg belastning |
| 30 / 35 / 44 dB(A) |
| Hög belastning |
| 53 / 55 dB(A) |
 | ||
30 dB tyst 40 dB(A) hörbar 50 dB(A) högt ljud |
||
min: | ||
| MSI GE66 Raider 10SFS i9-10980HK, GeForce RTX 2070 Super Mobile | MSI GE65 Raider 9SF-049US i9-9880H, GeForce RTX 2070 Mobile | Asus Strix Scar III G531GW i9-9880H, GeForce RTX 2070 Mobile | Eurocom Nightsky RX15 i9-9980HK, GeForce RTX 2070 Mobile | Genomsnitt av klass Gaming | |
|---|---|---|---|---|---|
| Noise | 7% | 1% | 8% | 18% | |
| av / miljö * (dB) | 30 | 28.8 4% | 29 3% | 28.2 6% | 24.1 ? 20% |
| Idle Minimum * (dB) | 30 | 33 -10% | 30 -0% | 28.2 6% | 26 ? 13% |
| Idle Average * (dB) | 35 | 33 6% | 37 -6% | 28.2 19% | 27.4 ? 22% |
| Idle Maximum * (dB) | 44 | 33.1 25% | 39 11% | 31.7 28% | 30.1 ? 32% |
| Load Average * (dB) | 53 | 38 28% | 54 -2% | 53.7 -1% | 43.6 ? 18% |
| Witcher 3 ultra * (dB) | 53 | 52.9 -0% | 54 -2% | 53.7 -1% | |
| Load Maximum * (dB) | 55 | 57.8 -5% | 54 2% | 53.7 2% | 54.2 ? 1% |
* ... mindre är bättre
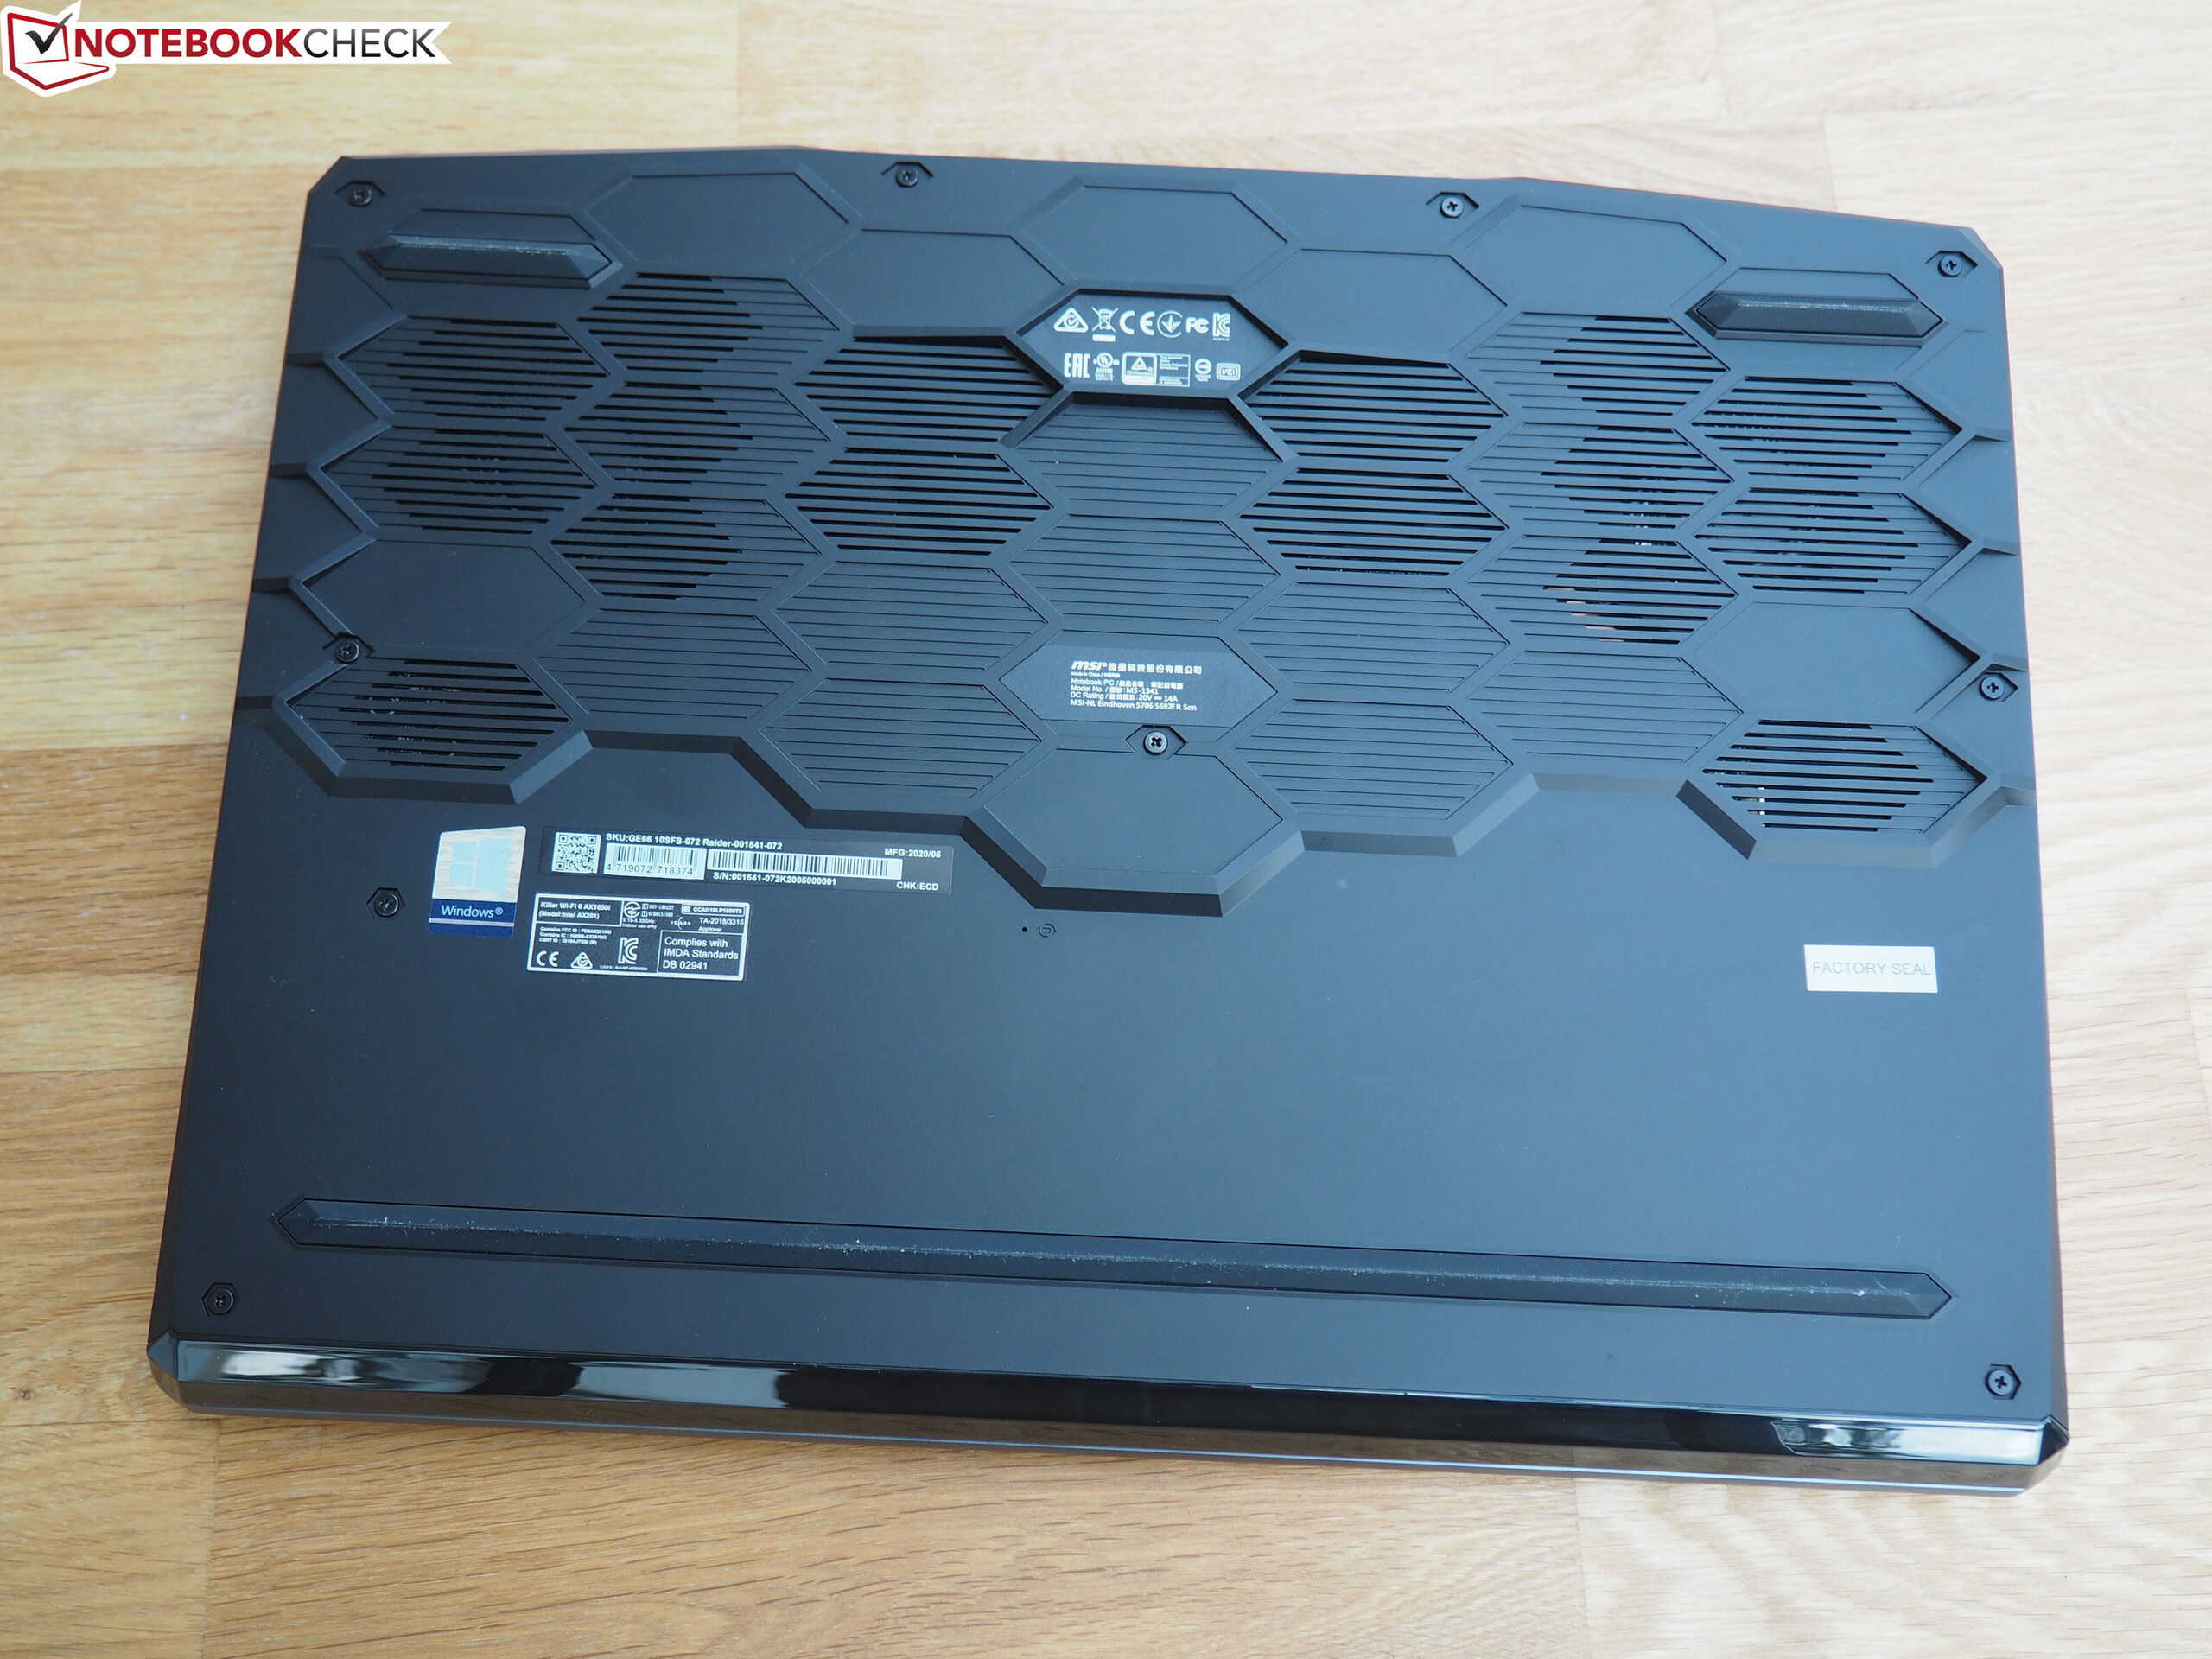
(-) Den maximala temperaturen på ovansidan är 49 °C / 120 F, jämfört med genomsnittet av 40.4 °C / 105 F , allt från 21.2 till 68.8 °C för klassen Gaming.
(-) Botten värms upp till maximalt 52 °C / 126 F, jämfört med genomsnittet av 43.2 °C / 110 F
(+) Vid tomgångsbruk är medeltemperaturen för ovansidan 29.1 °C / 84 F, jämfört med enhetsgenomsnittet på 33.9 °C / ### class_avg_f### F.
(-) När du spelar The Witcher 3 är medeltemperaturen för ovansidan 41.1 °C / 106 F, jämfört med enhetsgenomsnittet på 33.9 °C / ## #class_avg_f### F.
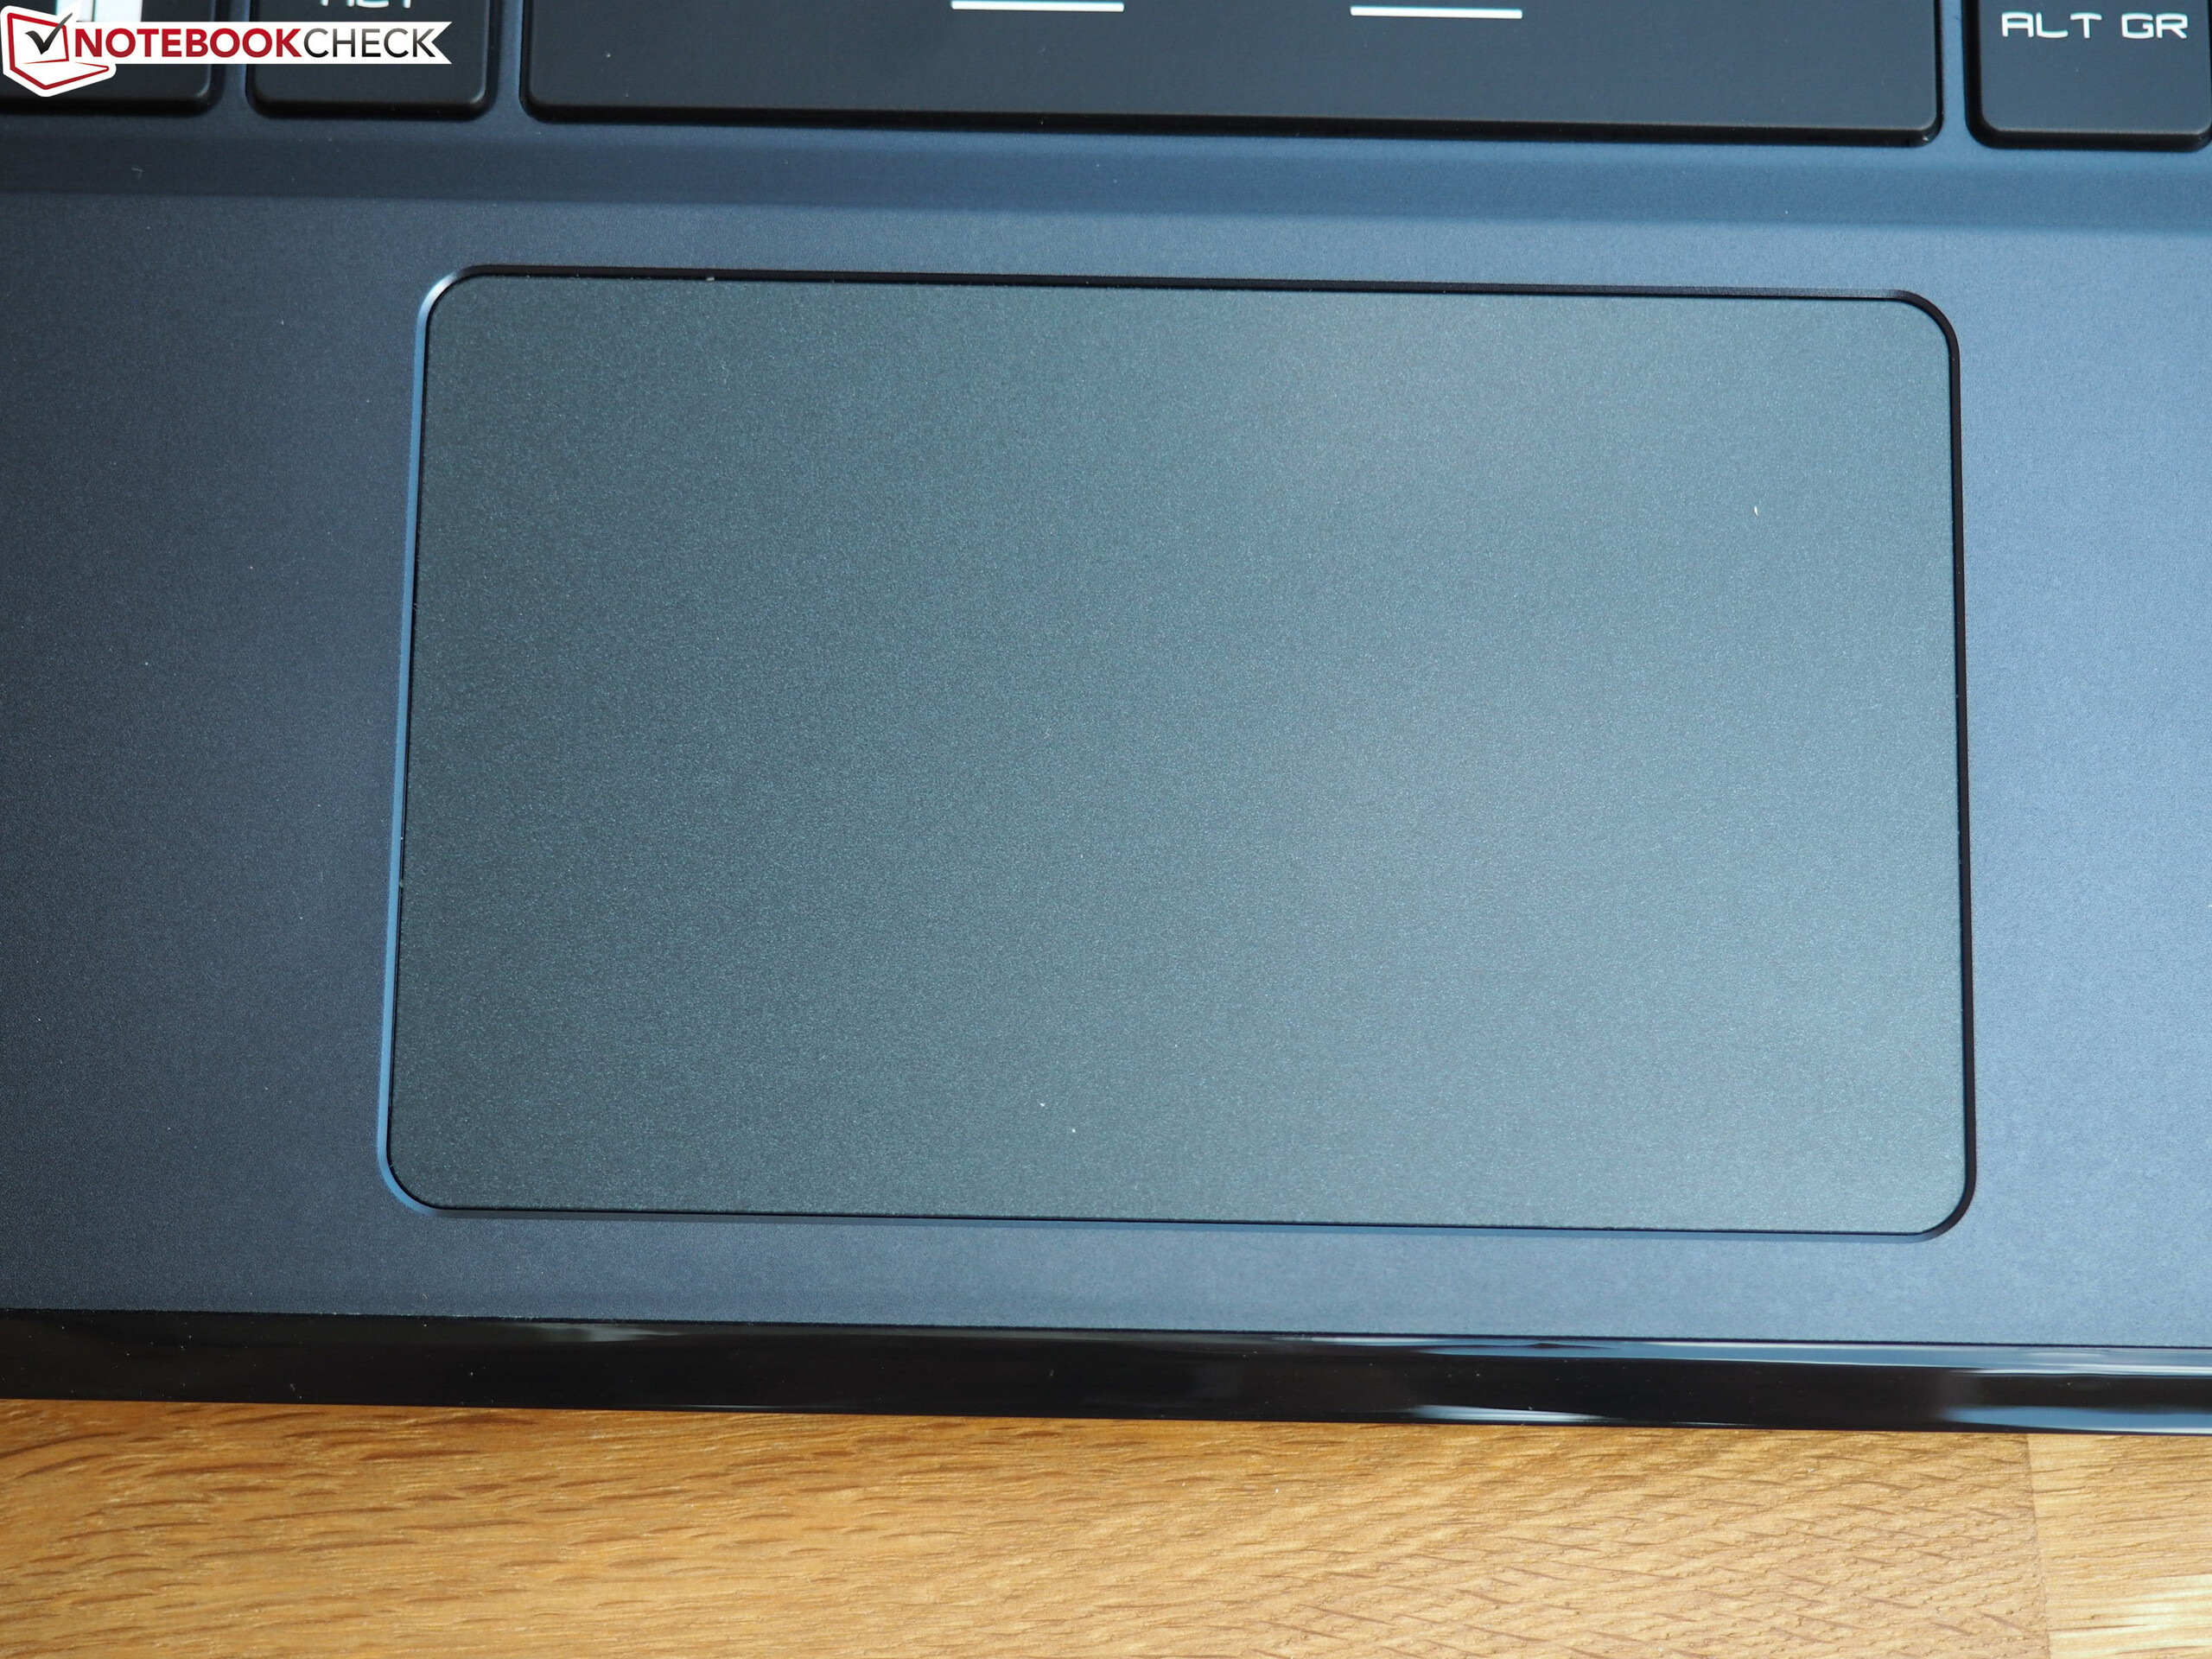
(+) Handledsstöden och pekplattan når maximal hudtemperatur (34 °C / 93.2 F) och är därför inte varma.
(-) Medeltemperaturen för handledsstödsområdet på liknande enheter var 28.8 °C / 83.8 F (-5.2 °C / -9.4 F).
| MSI GE66 Raider 10SFS i9-10980HK, GeForce RTX 2070 Super Mobile | MSI GE65 Raider 9SF-049US i9-9880H, GeForce RTX 2070 Mobile | Asus Strix Scar III G531GW i9-9880H, GeForce RTX 2070 Mobile | Eurocom Nightsky RX15 i9-9980HK, GeForce RTX 2070 Mobile | Genomsnitt av klass Gaming | |
|---|---|---|---|---|---|
| Heat | -3% | -0% | -4% | 3% | |
| Maximum Upper Side * (°C) | 49 | 45 8% | 51 -4% | 40.2 18% | 45.2 ? 8% |
| Maximum Bottom * (°C) | 52 | 53 -2% | 49 6% | 53 -2% | 48.1 ? 7% |
| Idle Upper Side * (°C) | 30 | 31.2 -4% | 30 -0% | 34.2 -14% | 31 ? -3% |
| Idle Bottom * (°C) | 34 | 39 -15% | 35 -3% | 39.6 -16% | 34.2 ? -1% |
* ... mindre är bättre
MSI GE66 Raider 10SFS ljudanalys
(+) | högtalare kan spela relativt högt (84 dB)
Bas 100 - 315 Hz
(-) | nästan ingen bas - i genomsnitt 32.4% lägre än medianen
(+) | basen är linjär (5.9% delta till föregående frekvens)
Mellan 400 - 2000 Hz
(±) | högre mellan - i genomsnitt 7.4% högre än median
(±) | linjäriteten för mids är genomsnittlig (8.9% delta till föregående frekvens)
Högsta 2 - 16 kHz
(±) | högre toppar - i genomsnitt 5.3% högre än medianen
(±) | linjäriteten för toppar är genomsnittlig (8.9% delta till föregående frekvens)
Totalt 100 - 16 000 Hz
(±) | linjäriteten för det totala ljudet är genomsnittlig (26.7% skillnad mot median)
Jämfört med samma klass
» 93% av alla testade enheter i den här klassen var bättre, 1% liknande, 6% sämre
» Den bästa hade ett delta på 6%, genomsnittet var 18%, sämst var 132%
Jämfört med alla testade enheter
» 82% av alla testade enheter var bättre, 4% liknande, 14% sämre
» Den bästa hade ett delta på 4%, genomsnittet var 23%, sämst var 134%
MSI GE65 Raider 9SF-049US ljudanalys
(+) | högtalare kan spela relativt högt (93 dB)
Bas 100 - 315 Hz
(-) | nästan ingen bas - i genomsnitt 20.5% lägre än medianen
(±) | linjäriteten för basen är genomsnittlig (8.8% delta till föregående frekvens)
Mellan 400 - 2000 Hz
(+) | balanserad mellan - endast 3.3% från medianen
(+) | mids är linjära (4.6% delta till föregående frekvens)
Högsta 2 - 16 kHz
(+) | balanserade toppar - endast 1.4% från medianen
(+) | toppar är linjära (5% delta till föregående frekvens)
Totalt 100 - 16 000 Hz
(±) | linjäriteten för det totala ljudet är genomsnittlig (15.6% skillnad mot median)
Jämfört med samma klass
» 36% av alla testade enheter i den här klassen var bättre, 6% liknande, 58% sämre
» Den bästa hade ett delta på 6%, genomsnittet var 18%, sämst var 132%
Jämfört med alla testade enheter
» 23% av alla testade enheter var bättre, 5% liknande, 72% sämre
» Den bästa hade ett delta på 4%, genomsnittet var 23%, sämst var 134%
| Av/Standby | |
| Låg belastning | |
| Hög belastning |
|
Förklaring:
min: | |
| MSI GE66 Raider 10SFS i9-10980HK, GeForce RTX 2070 Super Mobile | MSI GE65 Raider 9SF-049US i9-9880H, GeForce RTX 2070 Mobile | Asus Strix Scar III G531GW i9-9880H, GeForce RTX 2070 Mobile | Eurocom Nightsky RX15 i9-9980HK, GeForce RTX 2070 Mobile | Genomsnitt av klass Gaming | |
|---|---|---|---|---|---|
| Power Consumption | -26% | -95% | -34% | -29% | |
| Idle Minimum * (Watt) | 6 | 15 -150% | 29 -383% | 12.6 -110% | 13 ? -117% |
| Idle Average * (Watt) | 14 | 18.5 -32% | 32 -129% | 21.4 -53% | 19 ? -36% |
| Idle Maximum * (Watt) | 25 | 20.2 19% | 37 -48% | 34.4 -38% | 24.6 ? 2% |
| Load Average * (Watt) | 108 | 110.9 -3% | 157 -45% | 123.2 -14% | 110.7 ? -3% |
| Witcher 3 ultra * (Watt) | 195 | 187.3 4% | 173 11% | 192.4 1% | |
| Load Maximum * (Watt) | 280 | 260 7% | 217 22% | 246.6 12% | 259 ? 7% |
* ... mindre är bättre
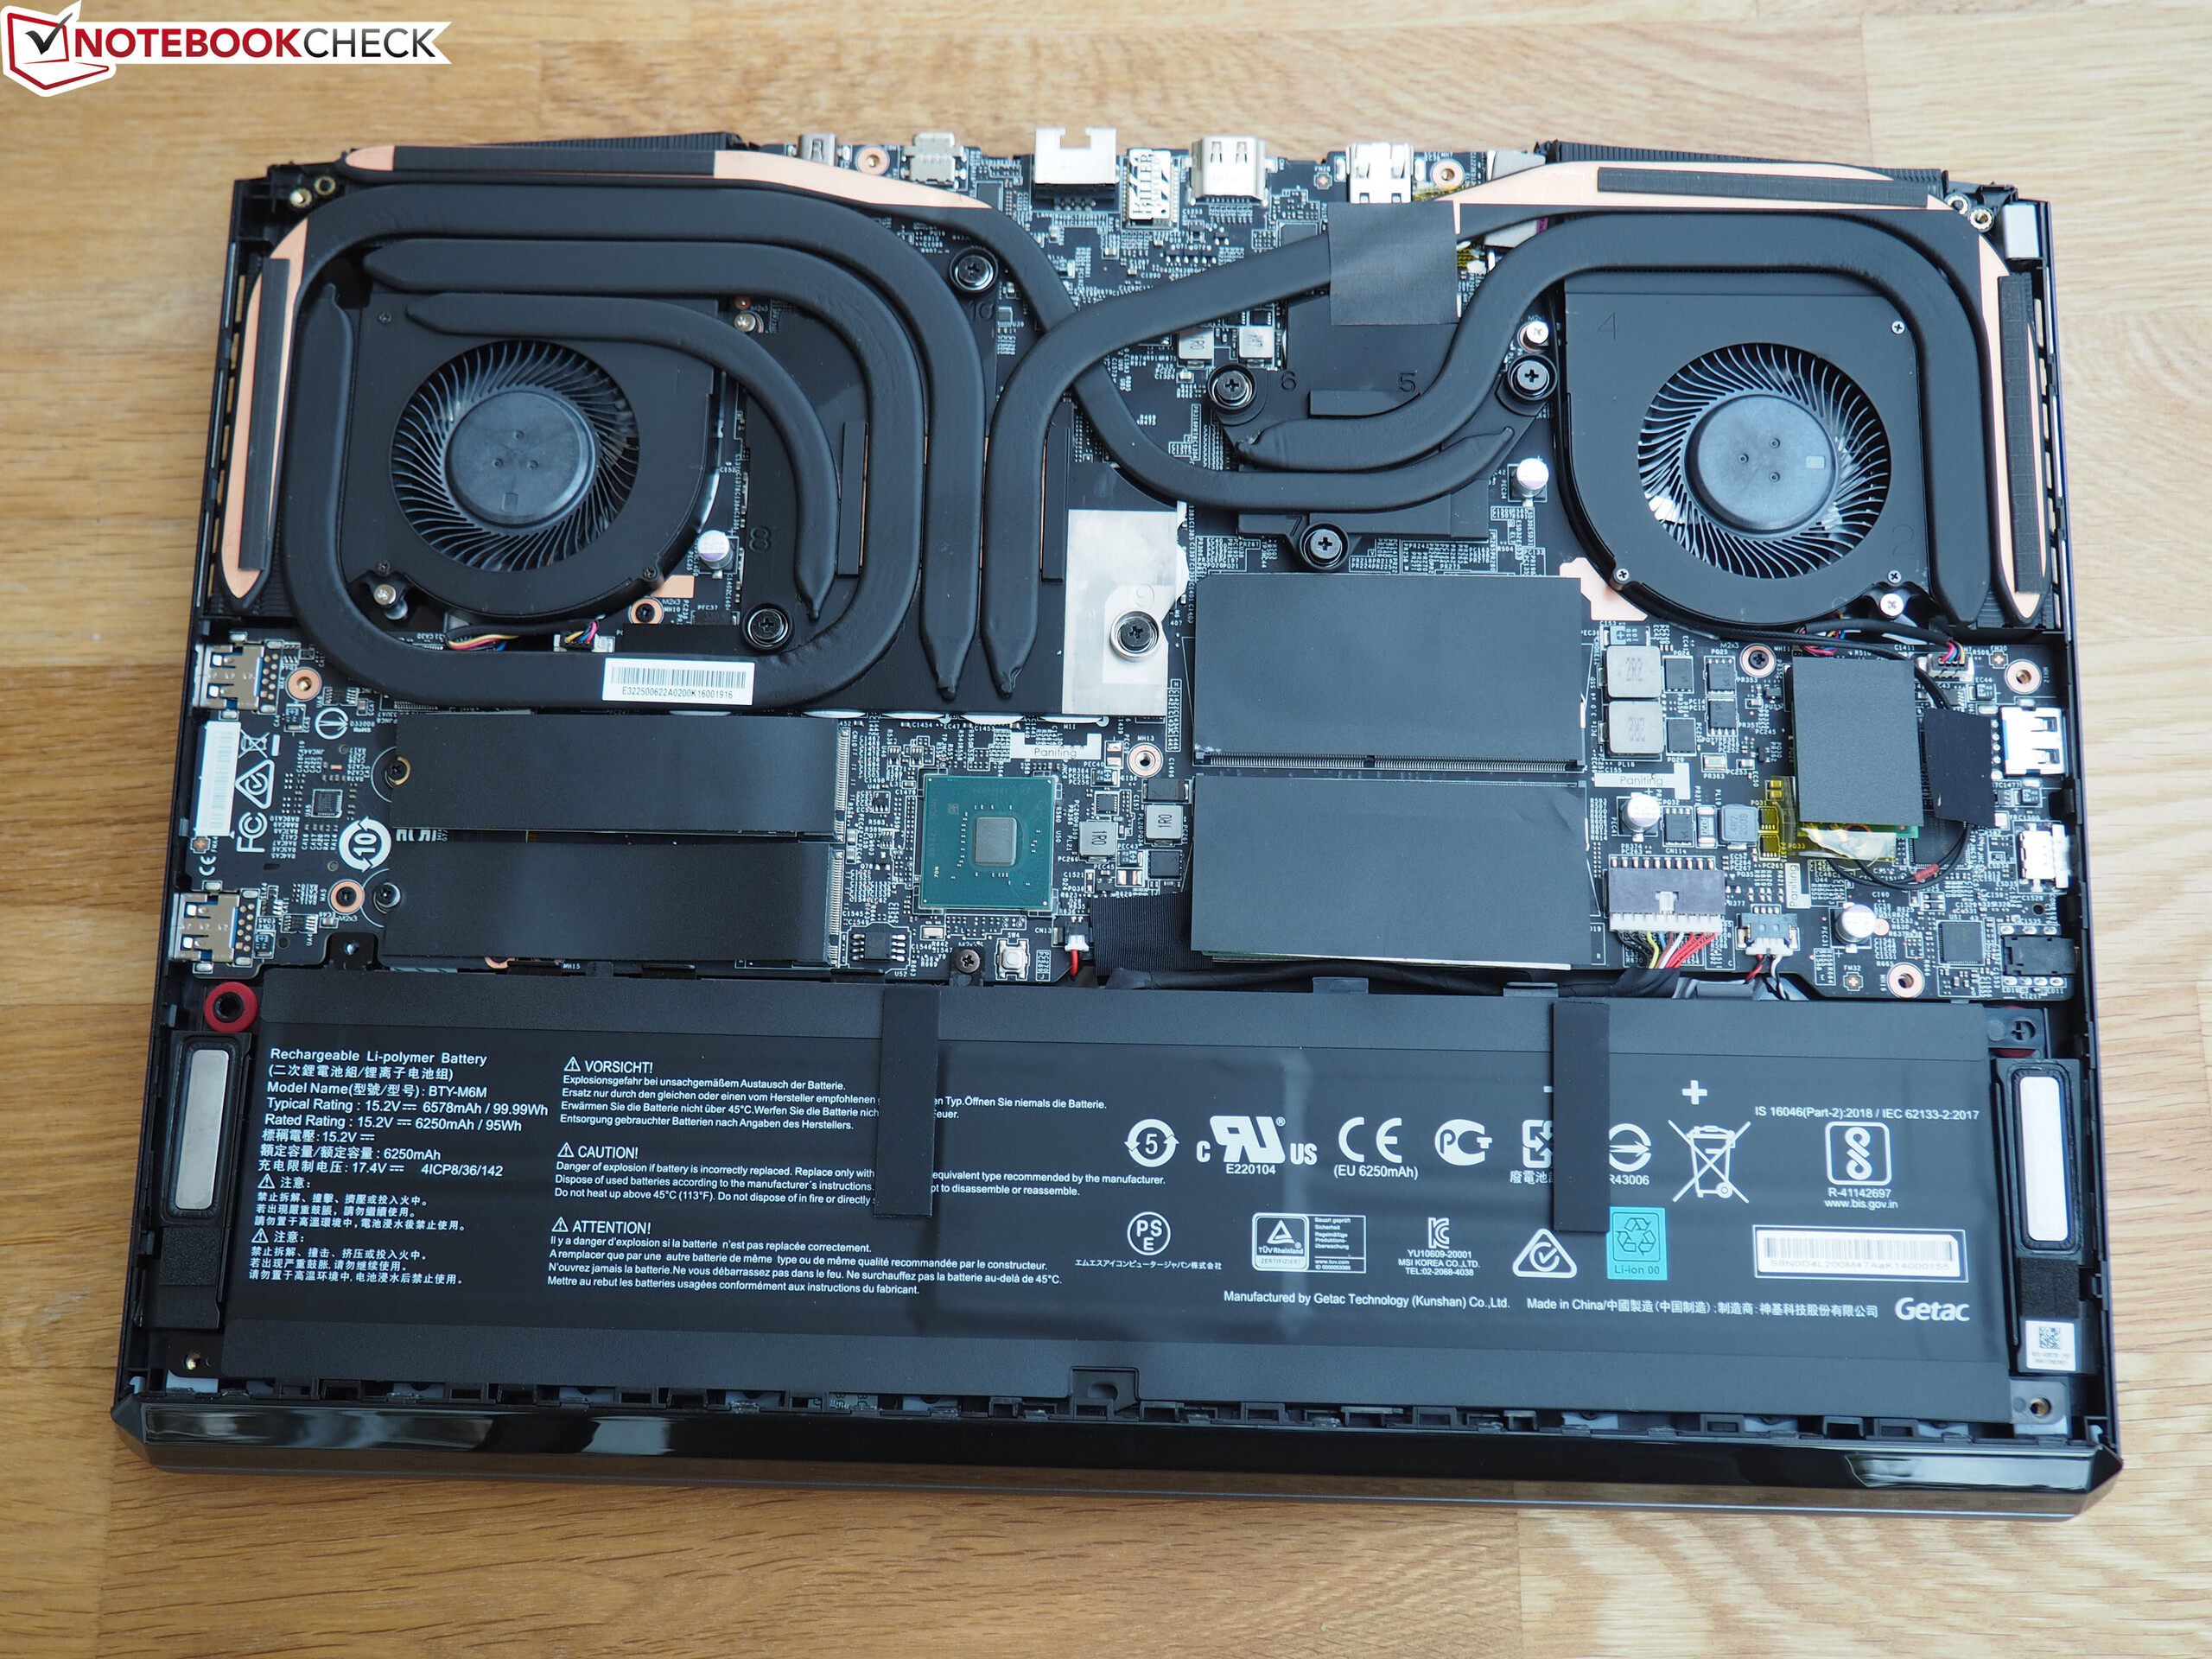
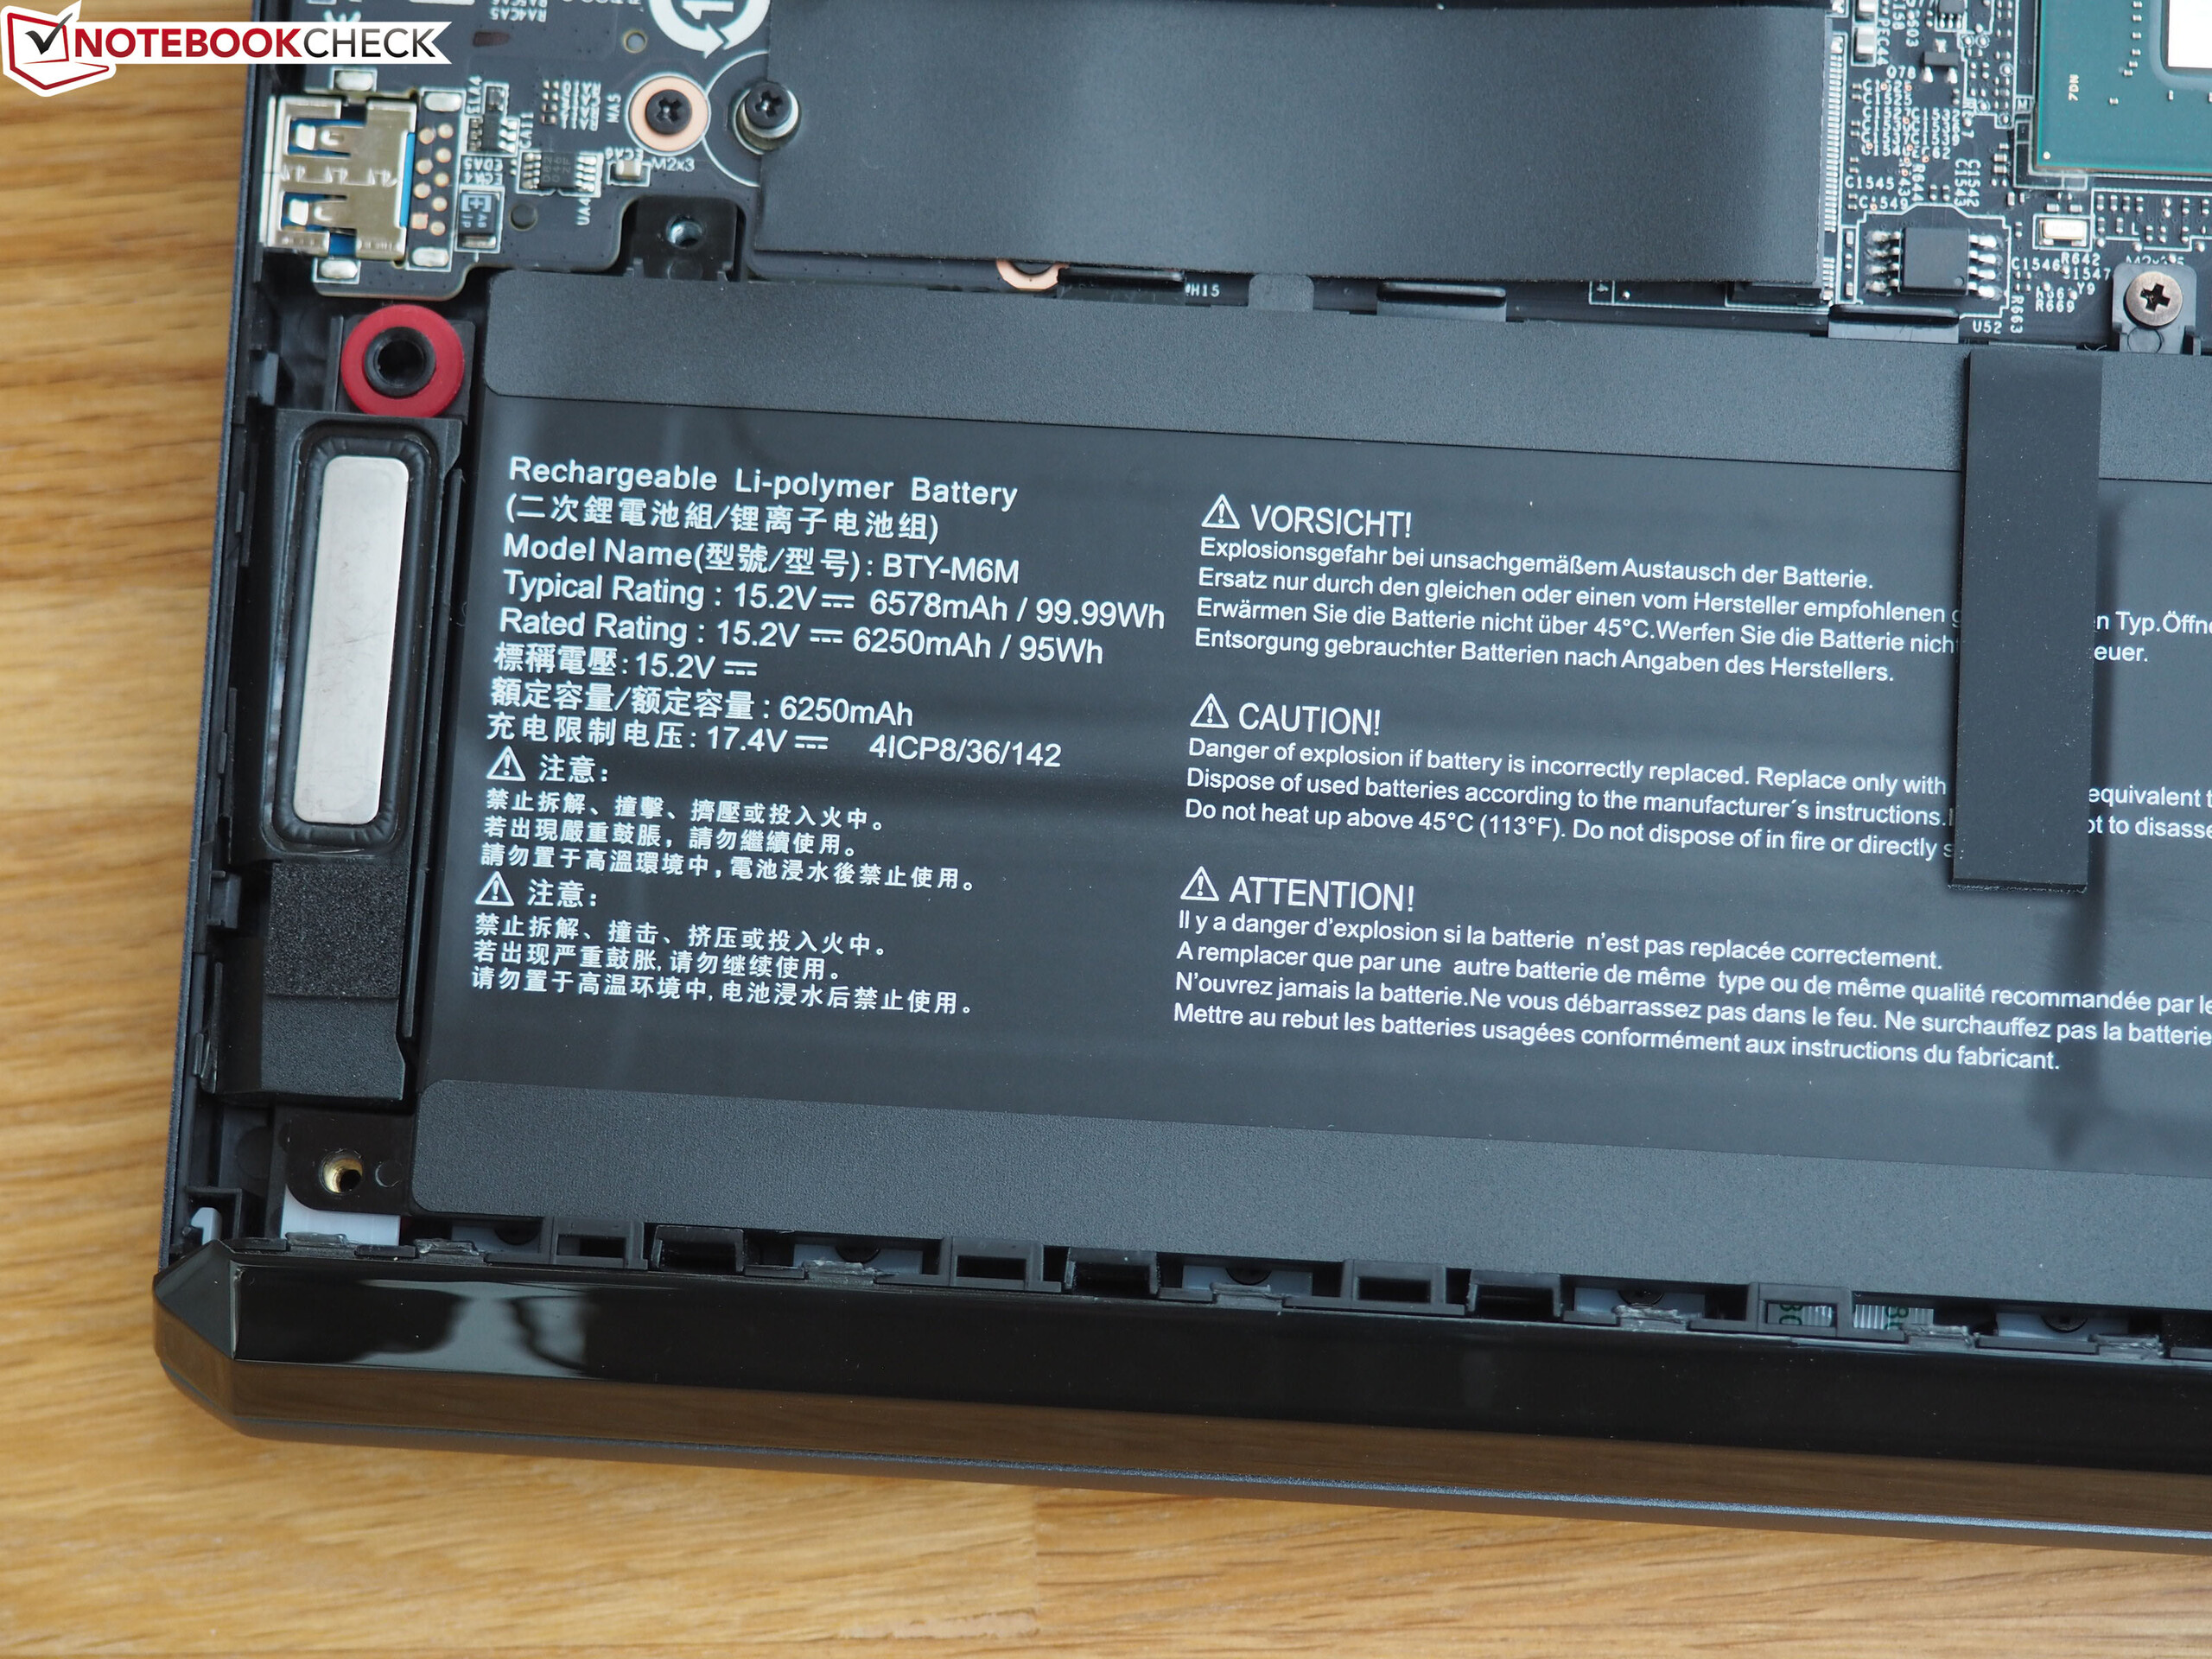
| MSI GE66 Raider 10SFS i9-10980HK, GeForce RTX 2070 Super Mobile, 99.99 Wh | MSI GE65 Raider 9SF-049US i9-9880H, GeForce RTX 2070 Mobile, 51 Wh | Asus Strix Scar III G531GW i9-9880H, GeForce RTX 2070 Mobile, 66 Wh | Eurocom Nightsky RX15 i9-9980HK, GeForce RTX 2070 Mobile, 62 Wh | Genomsnitt av klass Gaming | |
|---|---|---|---|---|---|
| Batteridrifttid | -42% | -34% | -44% | 3% | |
| Reader / Idle (h) | 7.6 | 6.2 -18% | 5.5 -28% | 8.27 ? 9% | |
| WiFi v1.3 (h) | 6.1 | 3.6 -41% | 3 -51% | 3.4 -44% | 7.11 ? 17% |
| Load (h) | 1.8 | 0.6 -67% | 1.4 -22% | 1.502 ? -17% |
För
Emot

Läs den fullständiga versionen av den här recensionen på engelska här.
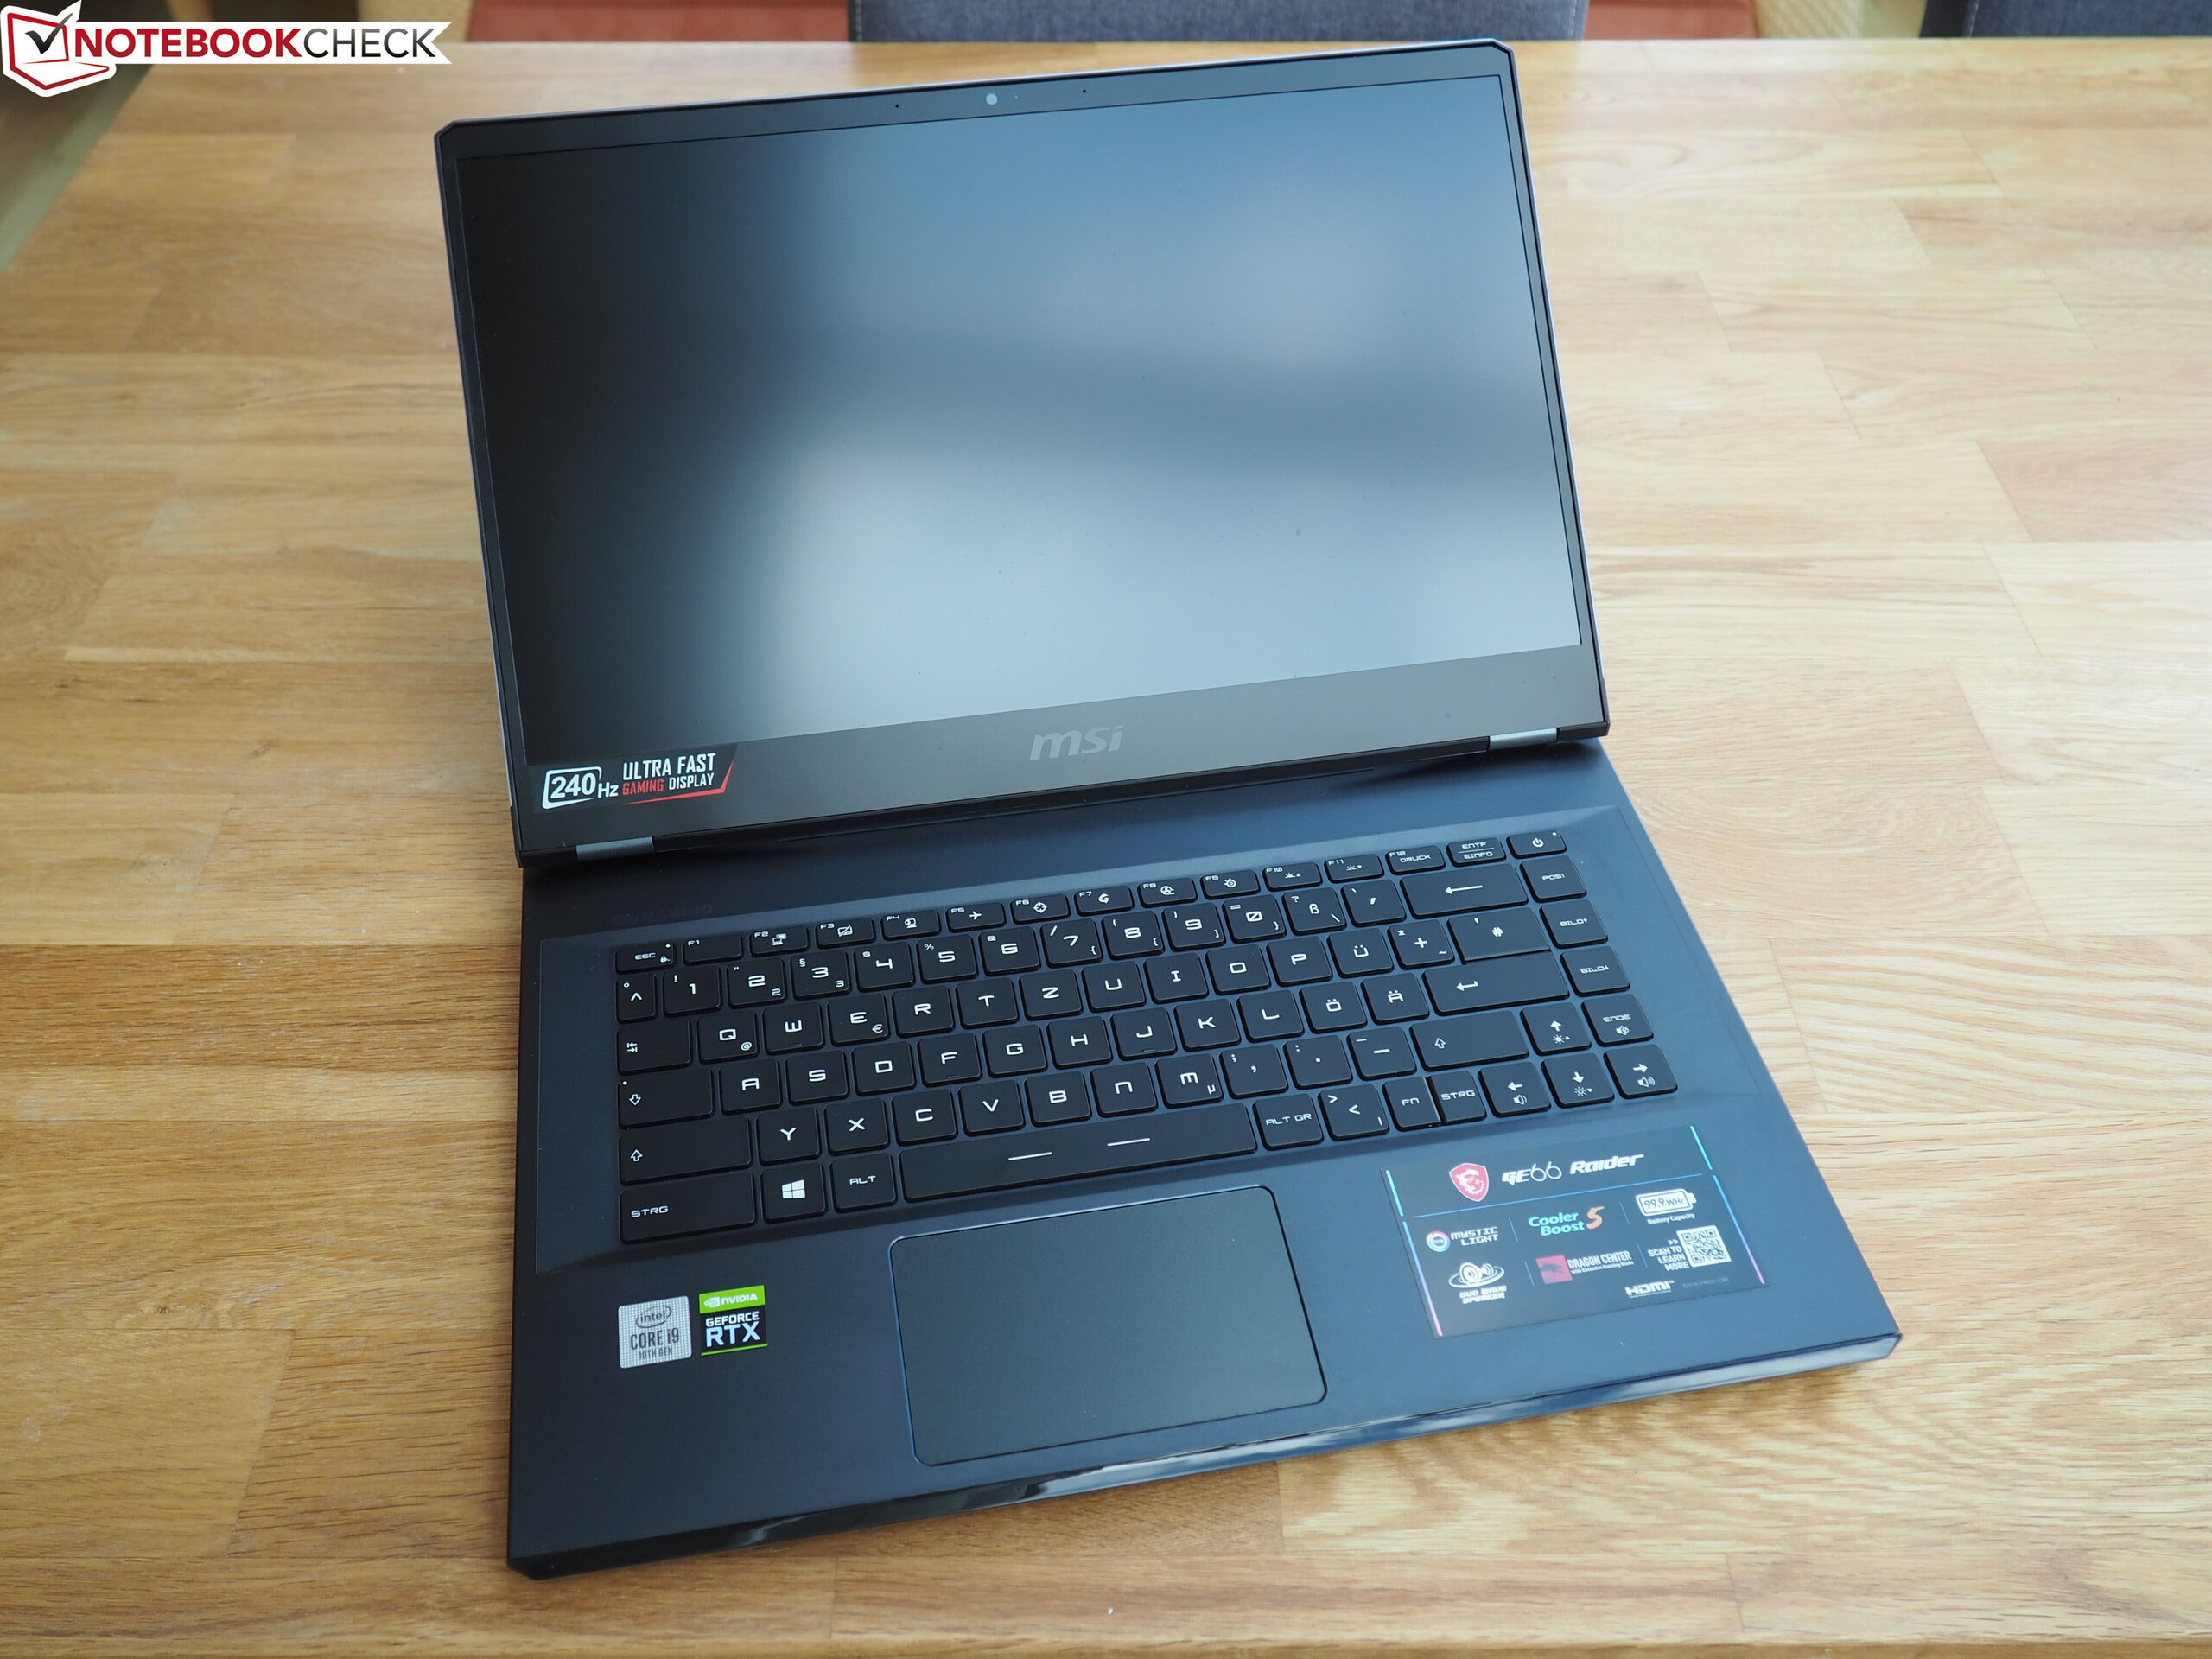
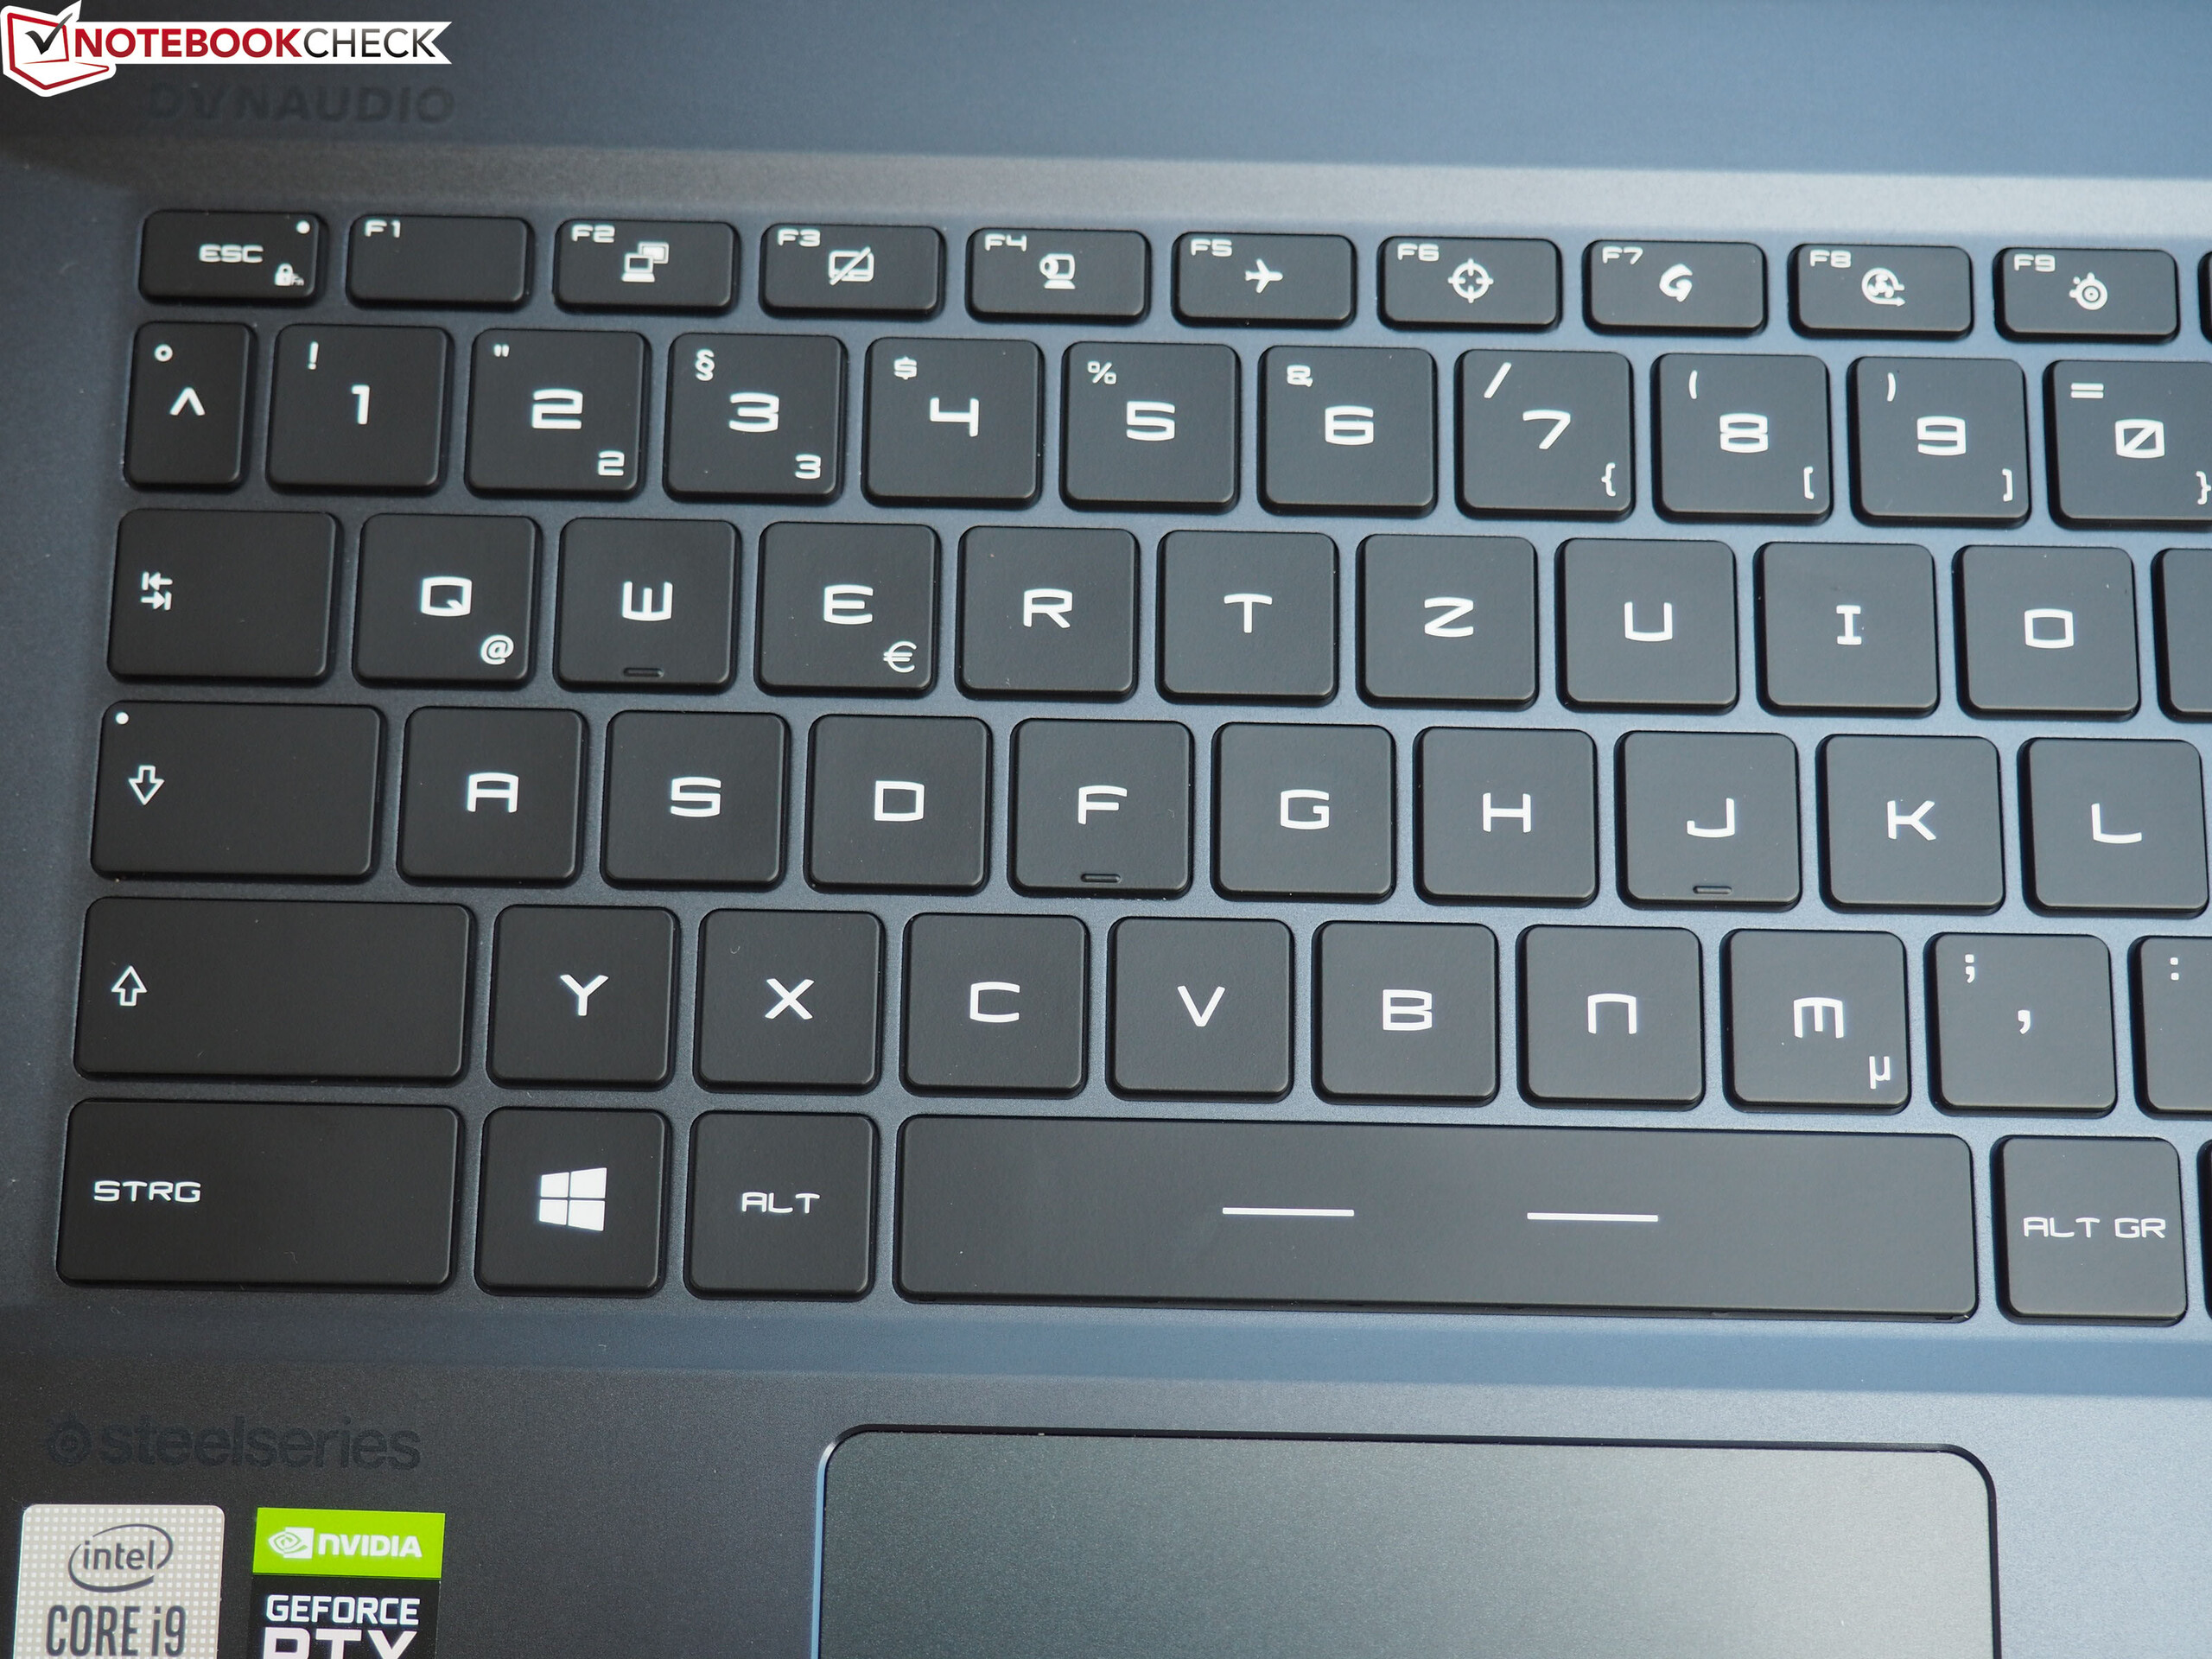
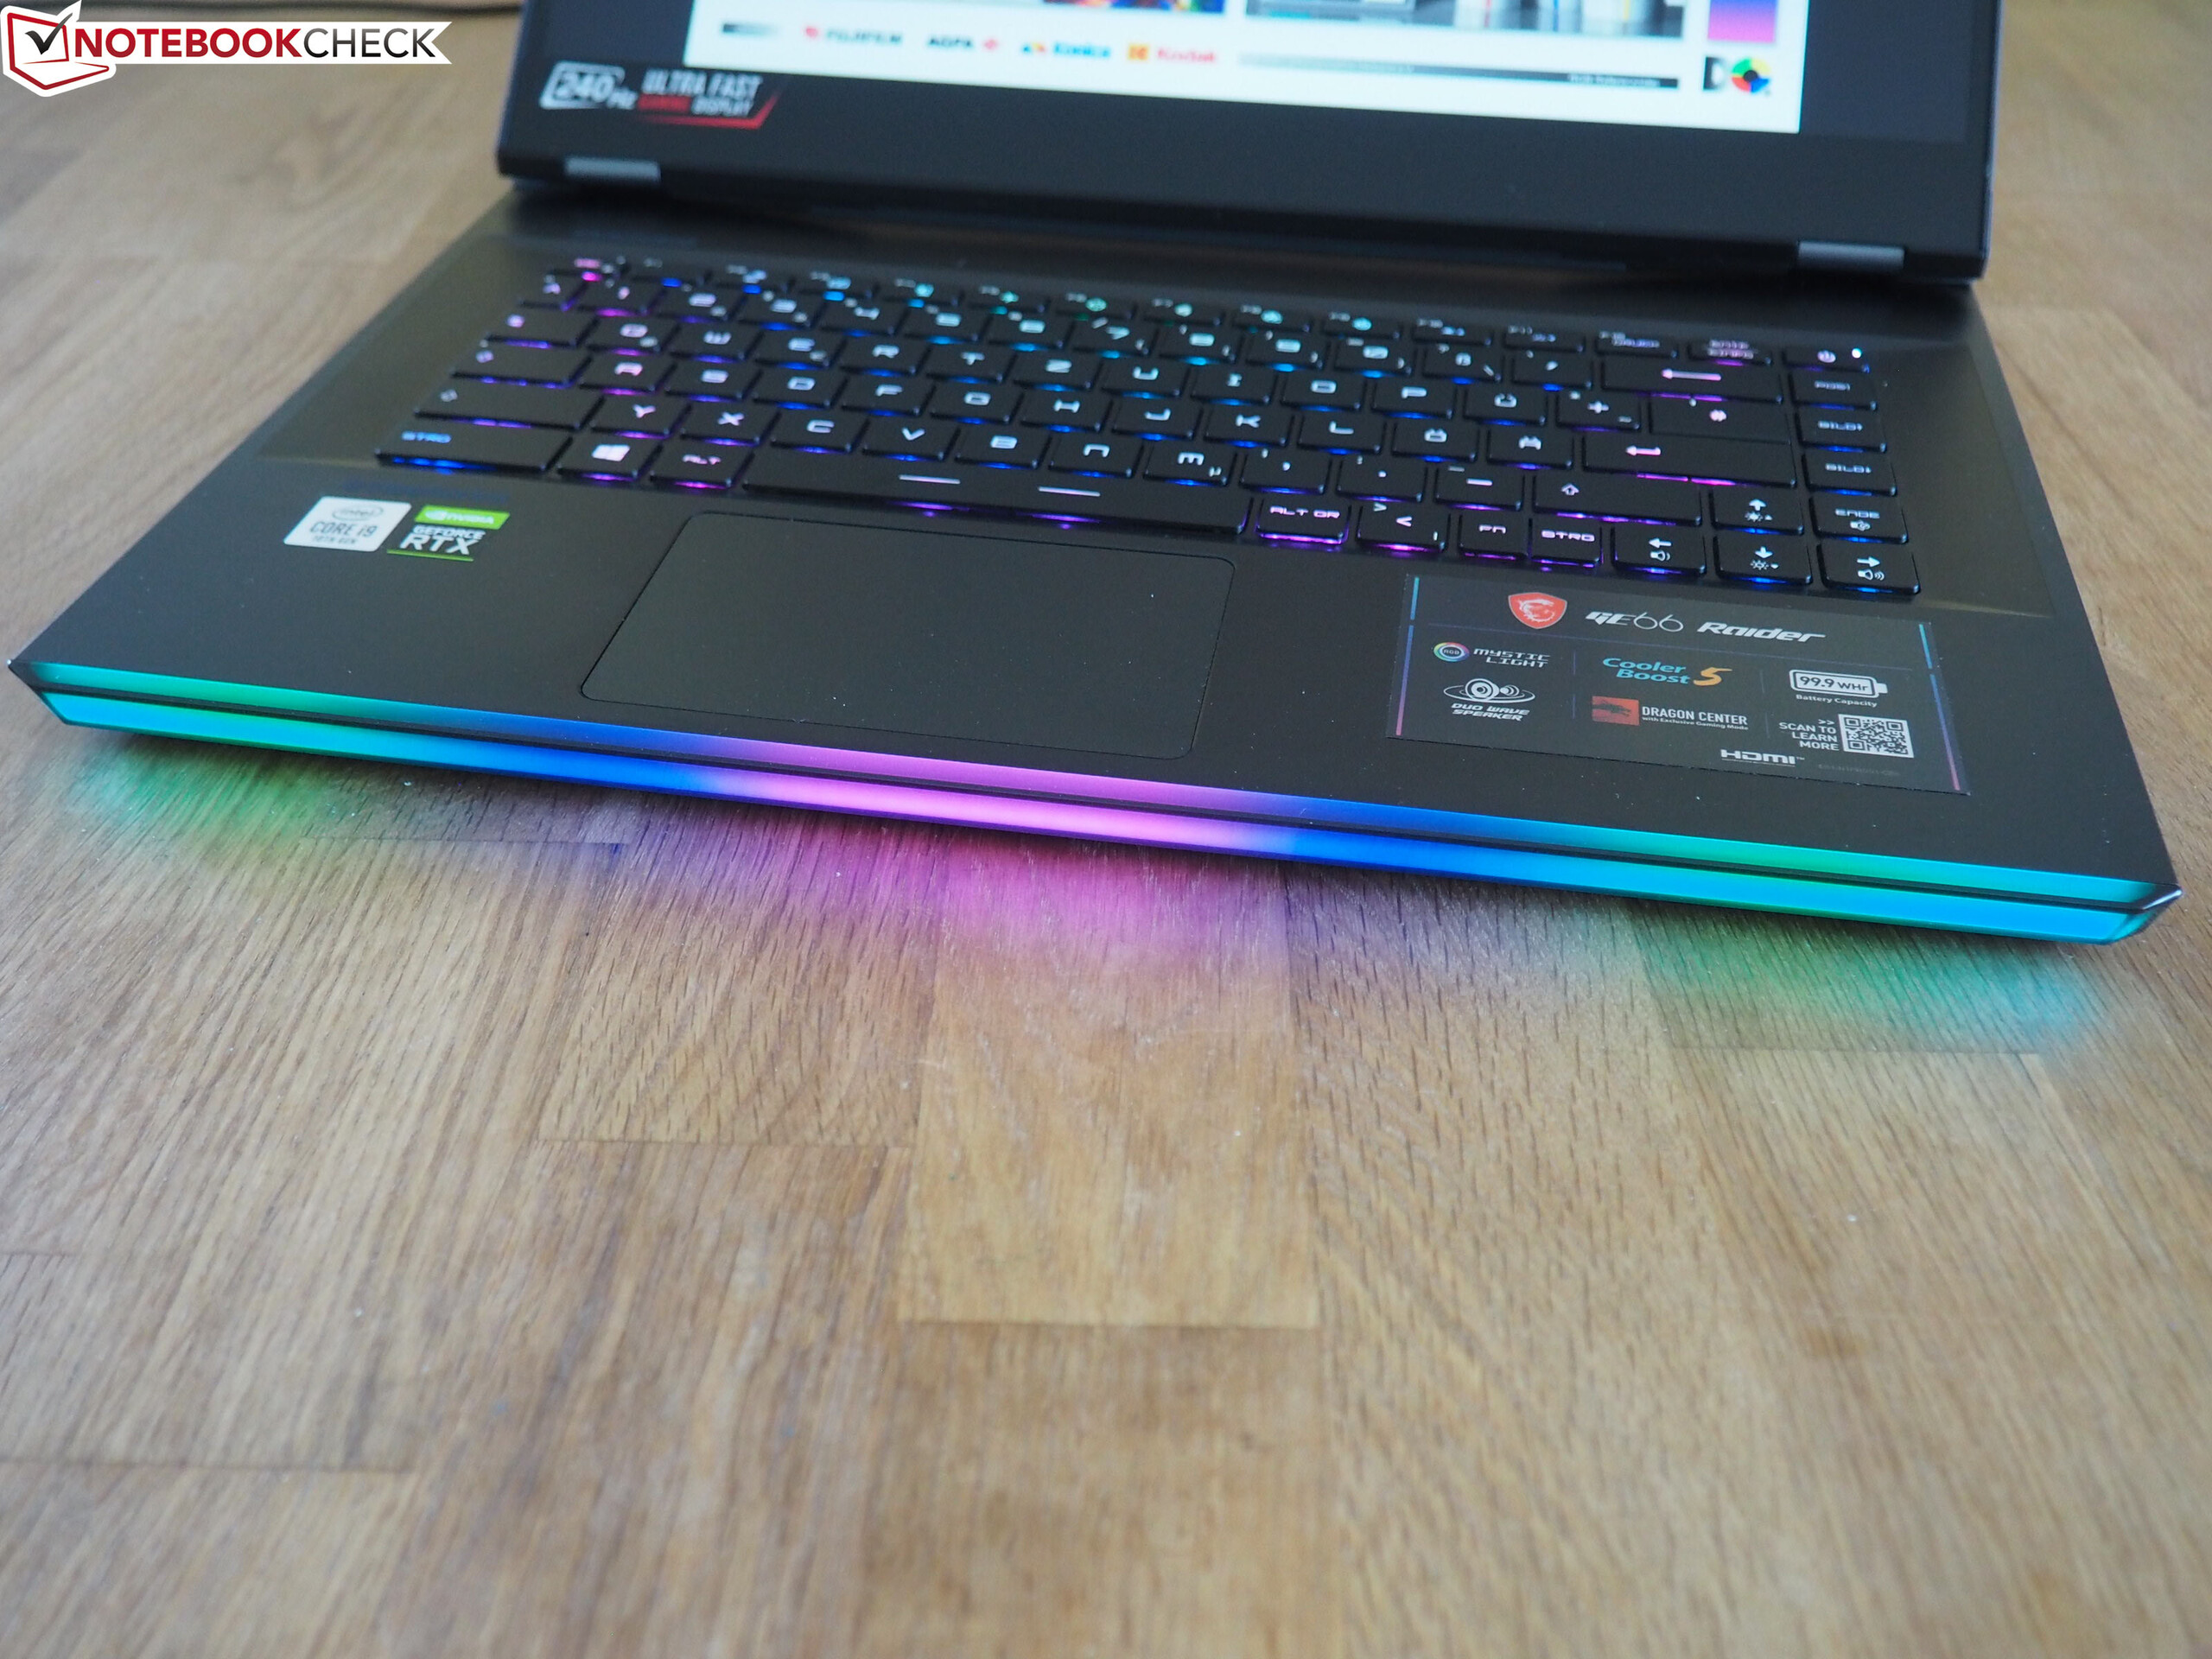
Med GE66 Raider 10SFS erbjuder MSI en kompakt och väldigt högpresterande gamer på 15 tum som inte bara tilltalar fans av belysning (LED-remsor på framsidan) utan också den som föredrar snabba skärmar.
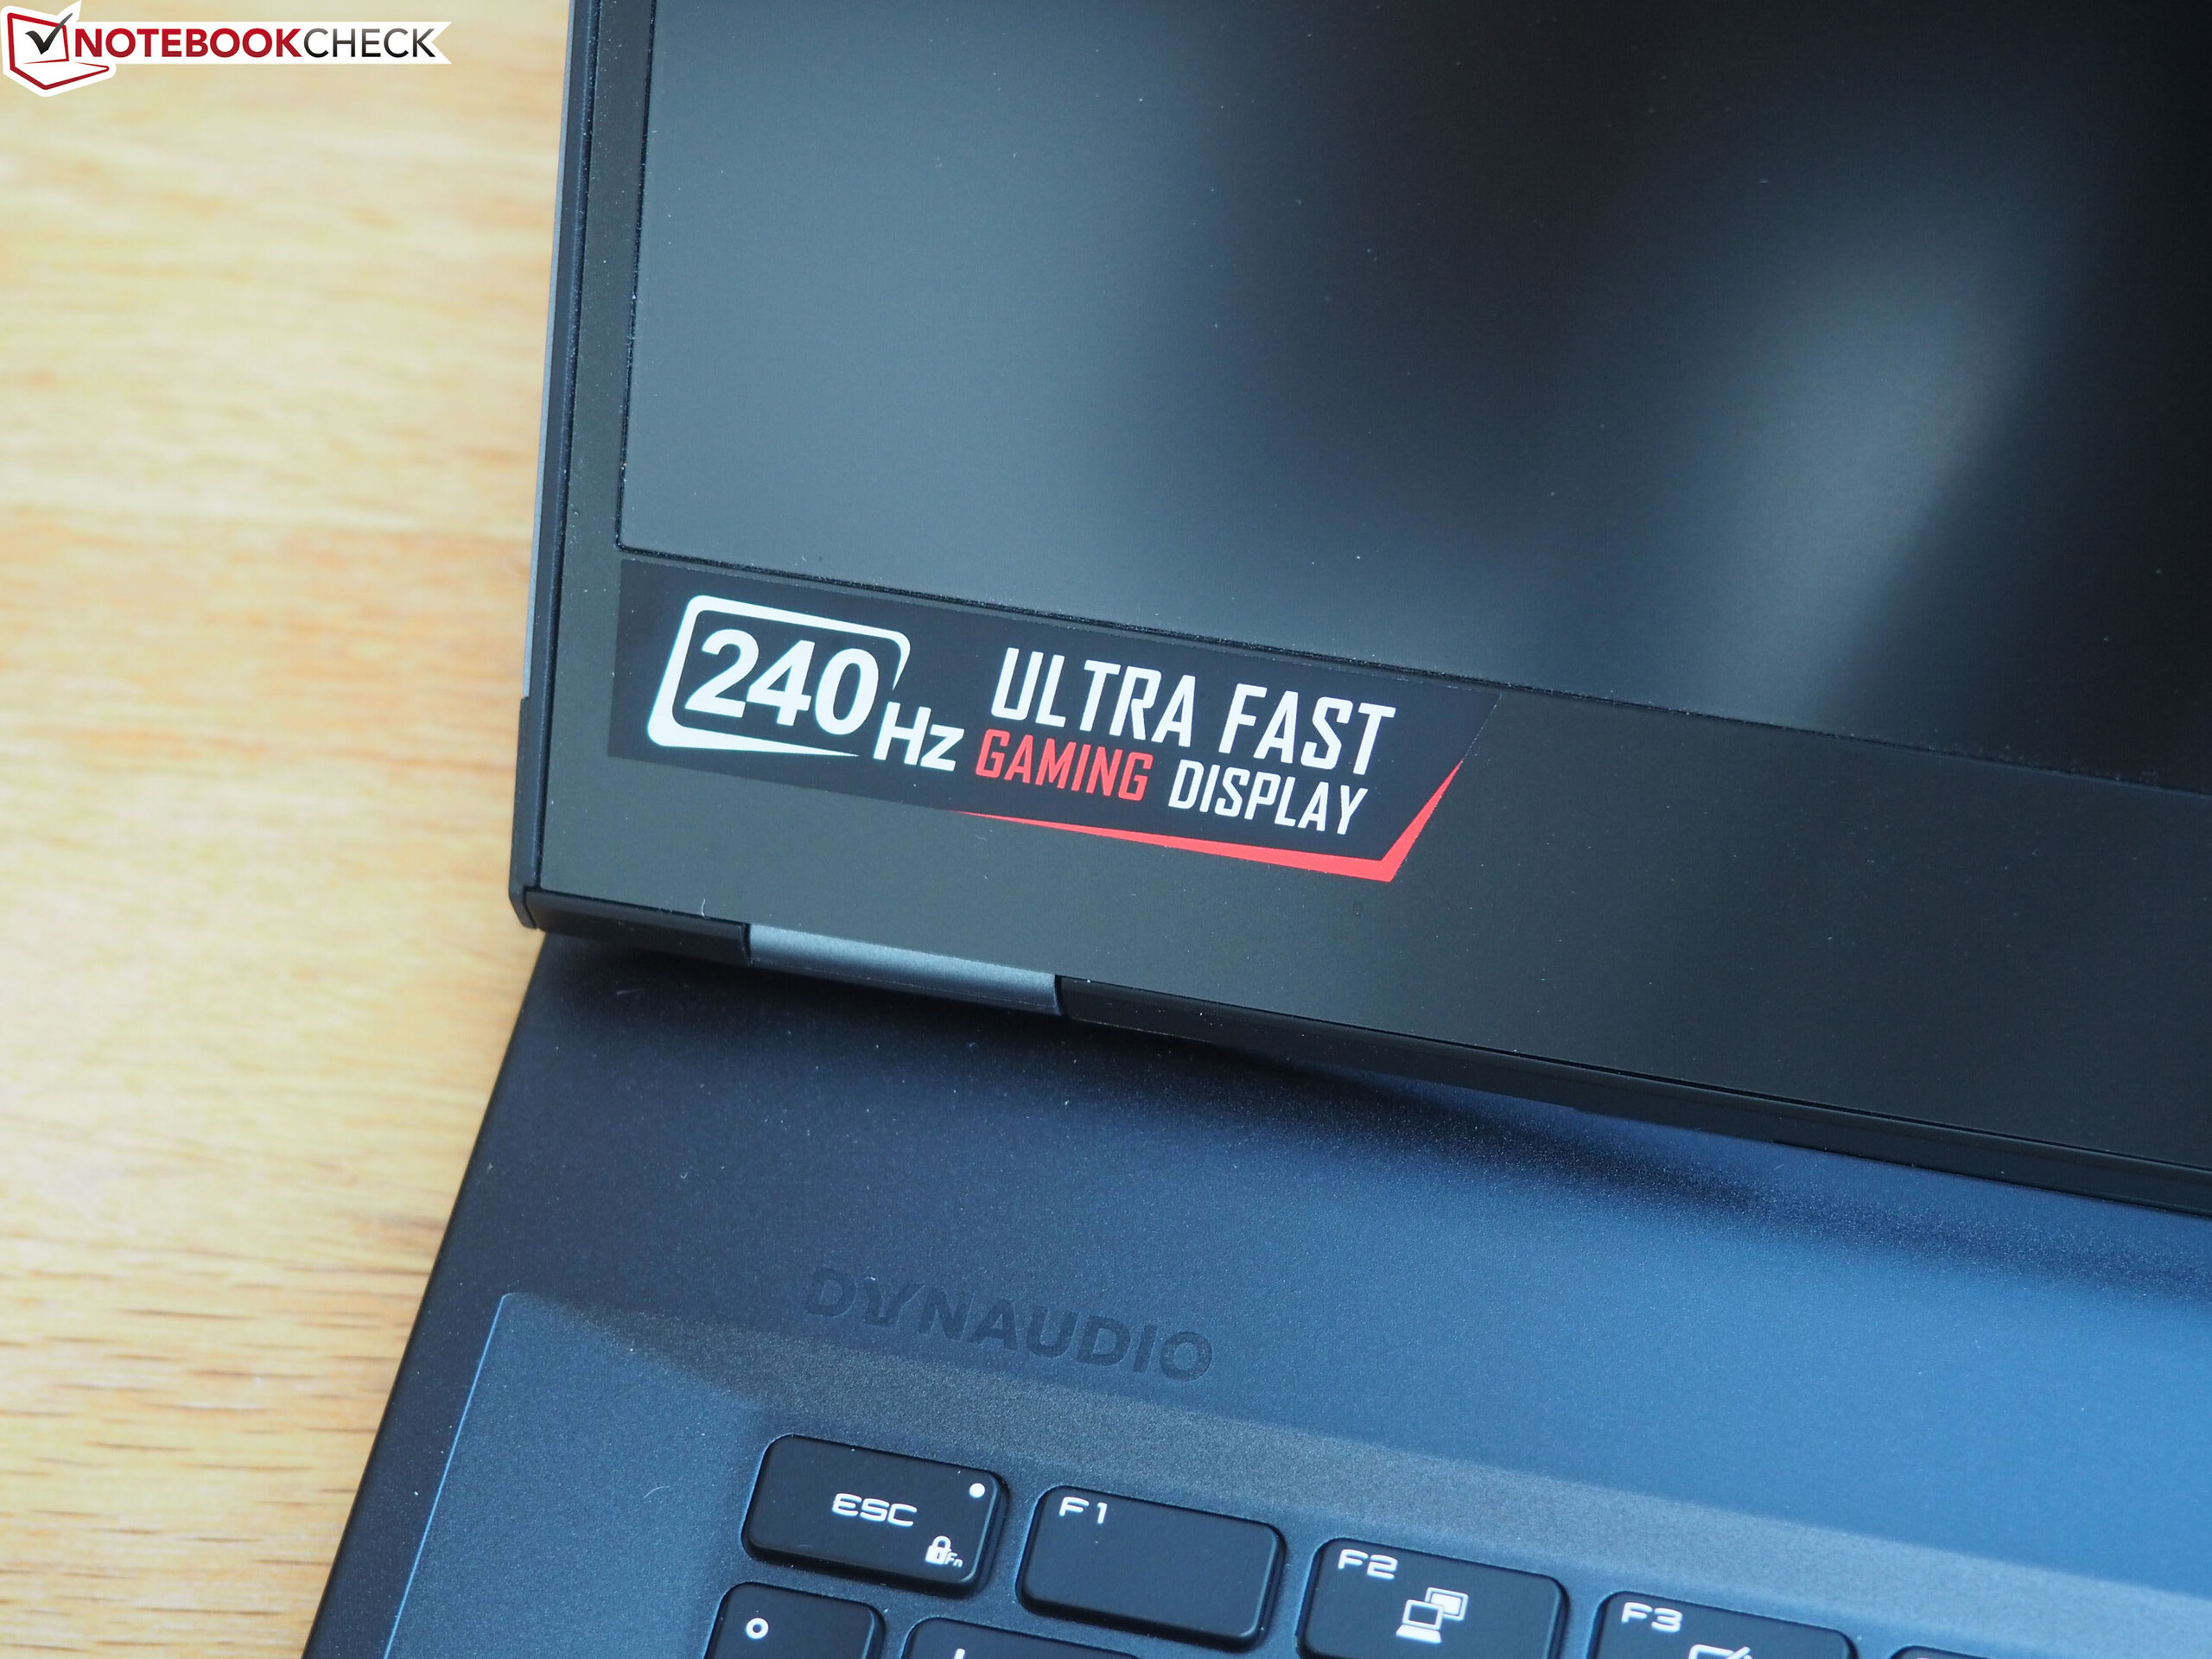
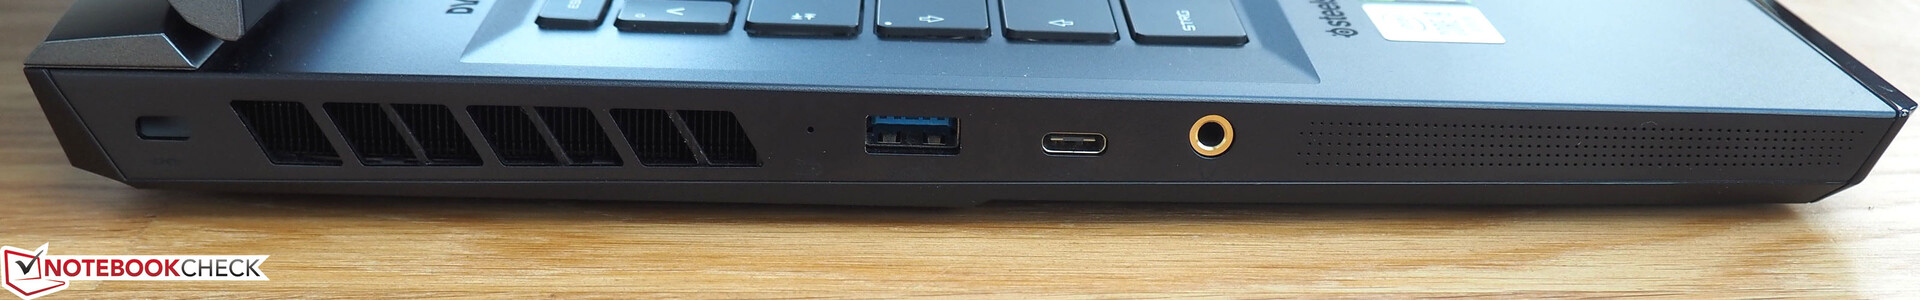
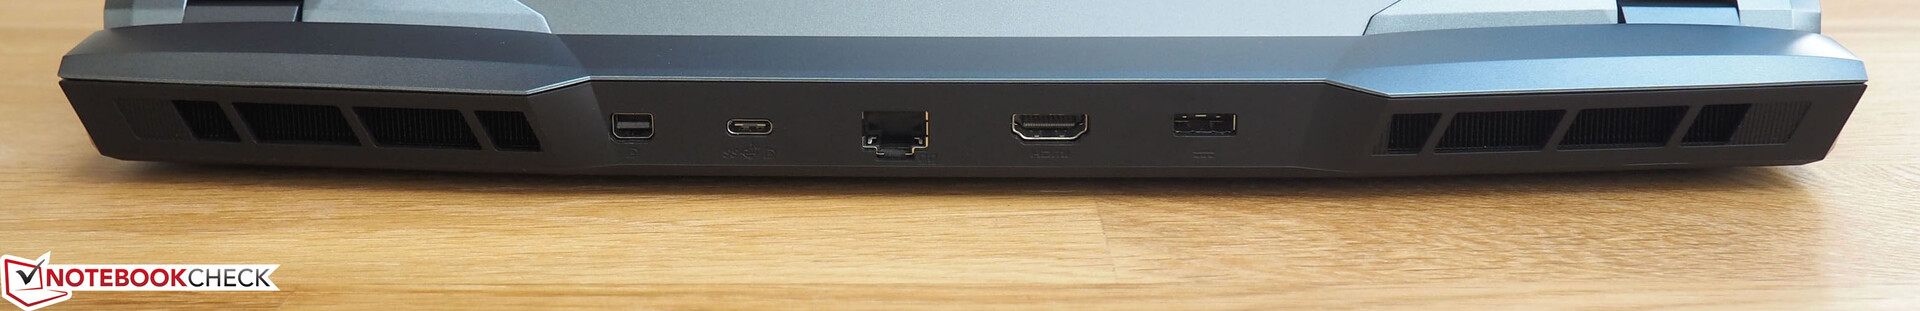
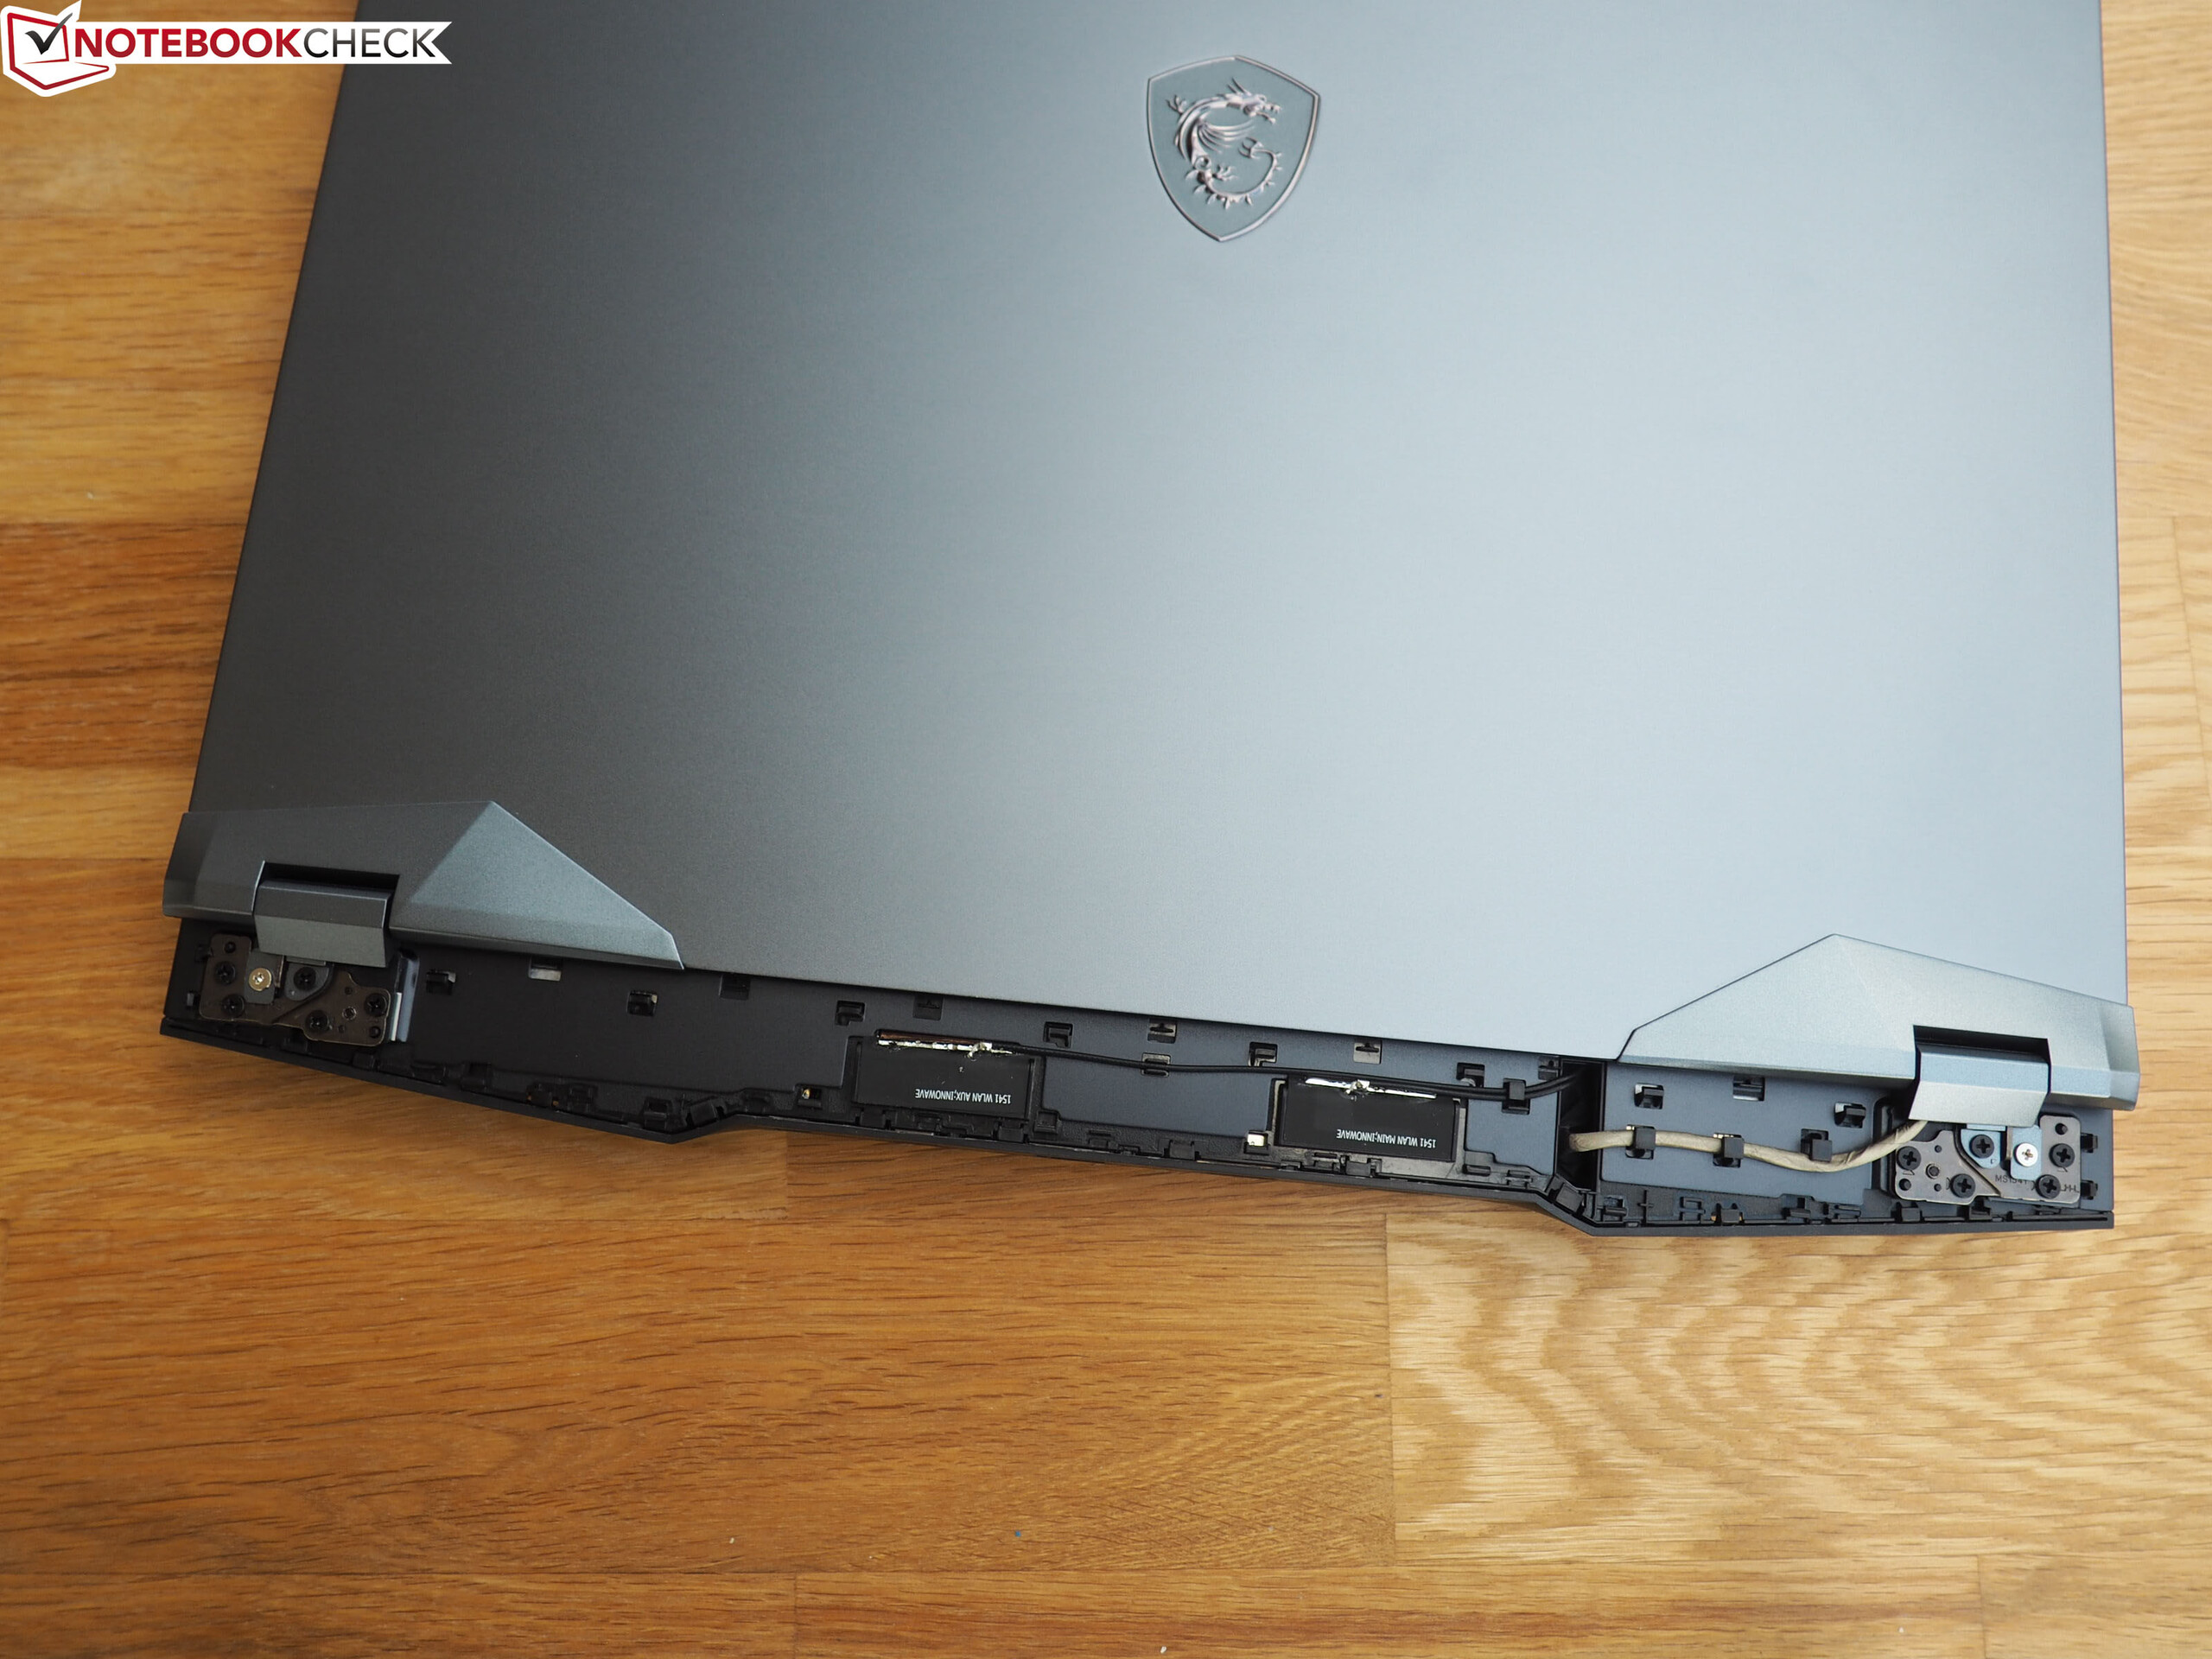
240 Hz-skärmen kunde varit mer ljusstark, men annars övertygar den på nästan alla sätt. Du behöver heller inte oroa dig över 3D-prestandan. Super-versionen av GeForce RTX 2070 har höga prestandanivåer. Andra säljargument är ett batteri på 99 Wh, en rejäl uppsättning anslutningar (som tyvärr inte inkluderar en Thunderbolt 3-port) samt ett utmärkt chassi.
Den når inte helt fram till ett "Riktigt Bra"-betyg, i huvudsak på grund av hög ljudnivå, en blygsam webbkamera och dåliga högtalare.
MSI GE66 Raider 10SFS
- 07/05/2020 v7 (old)
Florian Glaser
Price comparison