Test: Acer Nitro 5 AN517-52 - Stor och välavrundad spellaptop med skaplig batteritid (Sammanfattning)
Gradering | Datum | Modell | Vikt | Höjd | Storlek | Upplösning | Pris |
|---|---|---|---|---|---|---|---|
| 80.6 % v7 (old) | 06/2020 | Acer Nitro 5 AN517-52-77DS i7-10750H, GeForce RTX 2060 Mobile | 2.2 kg | 24.9 mm | 17.30" | 1920x1080 | |
| 82.9 % v7 (old) | 05/2020 | Asus TUF A17 FA706IU-AS76 R7 4800H, GeForce GTX 1660 Ti Mobile | 2.6 kg | 26 mm | 17.30" | 1920x1080 | |
| 83.2 % v7 (old) | Schenker XMG Pro 17 PB71RD-G i7-9750H, GeForce RTX 2060 Mobile | 2.8 kg | 30 mm | 17.30" | 1920x1080 | ||
| 81.6 % v7 (old) | 07/2019 | HP Pavilion Gaming 17-cd0085cl i7-9750H, GeForce GTX 1660 Ti Max-Q | 2.8 kg | 25 mm | 17.30" | 1920x1080 | |
| 82.3 % v7 (old) | 07/2019 | Lenovo Legion Y540-17IRH i5-9300H, GeForce GTX 1660 Ti Mobile | 2.8 kg | 26.3 mm | 17.30" | 1920x1080 |
| Networking | |
| iperf3 transmit AX12 | |
| Schenker XMG Pro 17 PB71RD-G | |
| Genomsnitt Intel Wi-Fi 6 AX201 (49.8 - 1775, n=324) | |
| Lenovo Legion Y540-17IRH | |
| Acer Nitro 5 AN517-52-77DS | |
| HP Pavilion Gaming 17-cd0085cl | |
| Acer Aspire Nitro 5 AN517-51-7887 | |
| Asus TUF A17 FA706IU-AS76 | |
| iperf3 receive AX12 | |
| Schenker XMG Pro 17 PB71RD-G | |
| Genomsnitt Intel Wi-Fi 6 AX201 (136 - 1743, n=324) | |
| Acer Nitro 5 AN517-52-77DS | |
| Lenovo Legion Y540-17IRH | |
| Acer Aspire Nitro 5 AN517-51-7887 | |
| HP Pavilion Gaming 17-cd0085cl | |
| Asus TUF A17 FA706IU-AS76 | |


| |||||||||||||||||||||||||
Distribution av ljusstyrkan: 85 %
Mitt på batteriet: 263 cd/m²
Kontrast: 560:1 (Svärta: 0.47 cd/m²)
ΔE ColorChecker Calman: 5.07 | ∀{0.5-29.43 Ø4.71}
calibrated: 4.9
ΔE Greyscale Calman: 2.55 | ∀{0.09-98 Ø4.96}
59% sRGB (Argyll 1.6.3 3D)
37% AdobeRGB 1998 (Argyll 1.6.3 3D)
40.77% AdobeRGB 1998 (Argyll 3D)
58.9% sRGB (Argyll 3D)
39.47% Display P3 (Argyll 3D)
Gamma: 2.37
CCT: 6446 K
| Acer Nitro 5 AN517-52-77DS IPS, 1920x1080, 17.3" | Asus TUF A17 FA706IU-AS76 IPS, 1920x1080, 17.3" | Lenovo Legion Y540-17IRH IPS, 1920x1080, 17.3" | Schenker XMG Pro 17 PB71RD-G IPS, 1920x1080, 17.3" | HP Pavilion Gaming 17-cd0085cl IPS, 1920x1080, 17.3" | Acer Aspire Nitro 5 AN517-51-7887 IPS, 1920x1080, 17.3" | |
|---|---|---|---|---|---|---|
| Display | 2% | 72% | 56% | 57% | 57% | |
| Display P3 Coverage (%) | 39.47 | 40.55 3% | 69 75% | 62.8 59% | 63.3 60% | 62.7 59% |
| sRGB Coverage (%) | 58.9 | 59.7 1% | 98.3 67% | 89.8 52% | 90.2 53% | 92.5 57% |
| AdobeRGB 1998 Coverage (%) | 40.77 | 41.89 3% | 70.7 73% | 64.2 57% | 64.3 58% | 63.5 56% |
| Response Times | 31% | 50% | 53% | 18% | -3% | |
| Response Time Grey 50% / Grey 80% * (ms) | 35 ? | 22.4 ? 36% | 18 ? 49% | 16.8 ? 52% | 31.6 ? 10% | 37 ? -6% |
| Response Time Black / White * (ms) | 26 ? | 19.2 ? 26% | 12.8 ? 51% | 12 ? 54% | 19.6 ? 25% | 26 ? -0% |
| PWM Frequency (Hz) | ||||||
| Screen | 15% | 44% | 27% | 28% | 25% | |
| Brightness middle (cd/m²) | 263 | 264.8 1% | 286 9% | 274 4% | 299.6 14% | 407 55% |
| Brightness (cd/m²) | 246 | 253 3% | 282 15% | 273 11% | 285 16% | 364 48% |
| Brightness Distribution (%) | 85 | 90 6% | 87 2% | 95 12% | 86 1% | 84 -1% |
| Black Level * (cd/m²) | 0.47 | 0.31 34% | 0.19 60% | 0.26 45% | 0.33 30% | 0.3 36% |
| Contrast (:1) | 560 | 854 53% | 1505 169% | 1054 88% | 908 62% | 1357 142% |
| Colorchecker dE 2000 * | 5.07 | 4.73 7% | 3.57 30% | 4.62 9% | 3.68 27% | 4.55 10% |
| Colorchecker dE 2000 max. * | 20.5 | 18.89 8% | 7.5 63% | 7.66 63% | 8.05 61% | 12.44 39% |
| Colorchecker dE 2000 calibrated * | 4.9 | 4.64 5% | 1.31 73% | 1.93 61% | 3.15 36% | |
| Greyscale dE 2000 * | 2.55 | 1.4 45% | 4.51 -77% | 5.3 -108% | 3.8 -49% | 7.61 -198% |
| Gamma | 2.37 93% | 2.16 102% | 2.36 93% | 2.34 94% | 2.12 104% | 2.51 88% |
| CCT | 6446 101% | 6641 98% | 7411 88% | 7619 85% | 7240 90% | 7212 90% |
| Color Space (Percent of AdobeRGB 1998) (%) | 37 | 38.4 4% | 64 73% | 58 57% | 58.1 57% | 59 59% |
| Color Space (Percent of sRGB) (%) | 59 | 59.3 1% | 98 66% | 90 53% | 89.8 52% | 92 56% |
| Totalt genomsnitt (program/inställningar) | 16% /
15% | 55% /
50% | 45% /
36% | 34% /
32% | 26% /
27% |
* ... mindre är bättre
Visa svarstider
| ↔ Svarstid svart till vitt | ||
|---|---|---|
| 26 ms ... stiga ↗ och falla ↘ kombinerat | ↗ 14 ms stiga | 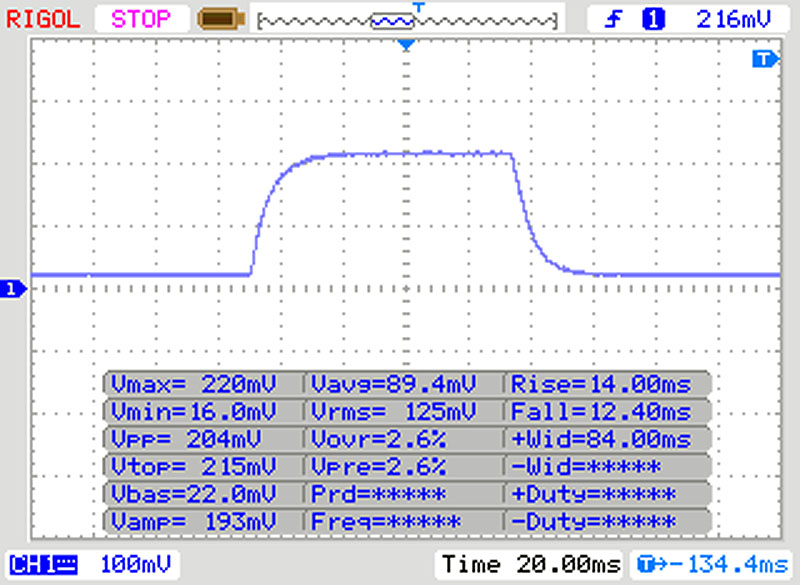 |
| ↘ 12 ms hösten | ||
| Skärmen visar relativt långsamma svarsfrekvenser i våra tester och kan vara för långsam för spelare. I jämförelse sträcker sig alla testade enheter från 0.1 (minst) till 240 (maximalt) ms. » 63 % av alla enheter är bättre. Detta innebär att den uppmätta svarstiden är sämre än genomsnittet av alla testade enheter (19.8 ms). | ||
| ↔ Svarstid 50 % grått till 80 % grått | ||
| 35 ms ... stiga ↗ och falla ↘ kombinerat | ↗ 17 ms stiga | 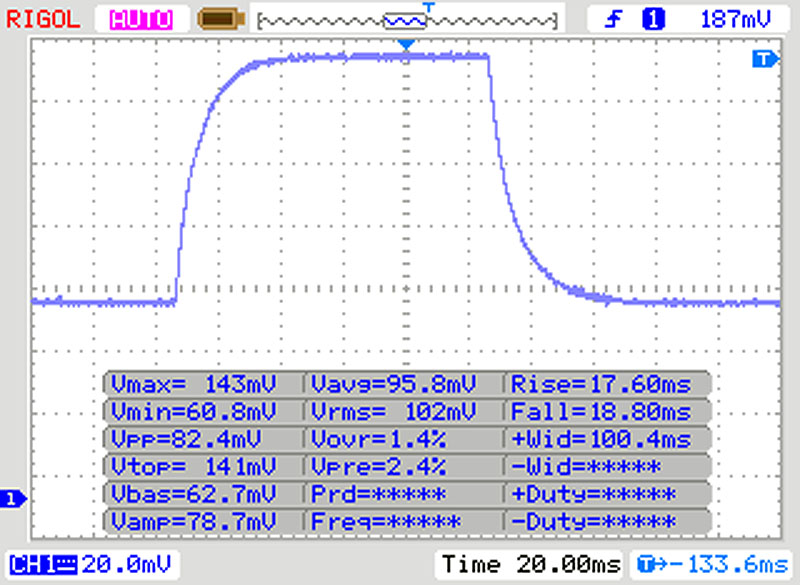 |
| ↘ 18 ms hösten | ||
| Skärmen visar långsamma svarsfrekvenser i våra tester och kommer att vara otillfredsställande för spelare. I jämförelse sträcker sig alla testade enheter från 0.165 (minst) till 636 (maximalt) ms. » 49 % av alla enheter är bättre. Detta innebär att den uppmätta svarstiden är sämre än genomsnittet av alla testade enheter (31 ms). | ||
Skärmflimmer / PWM (Puls-Width Modulation)
| Skärmflimmer / PWM upptäcktes inte | 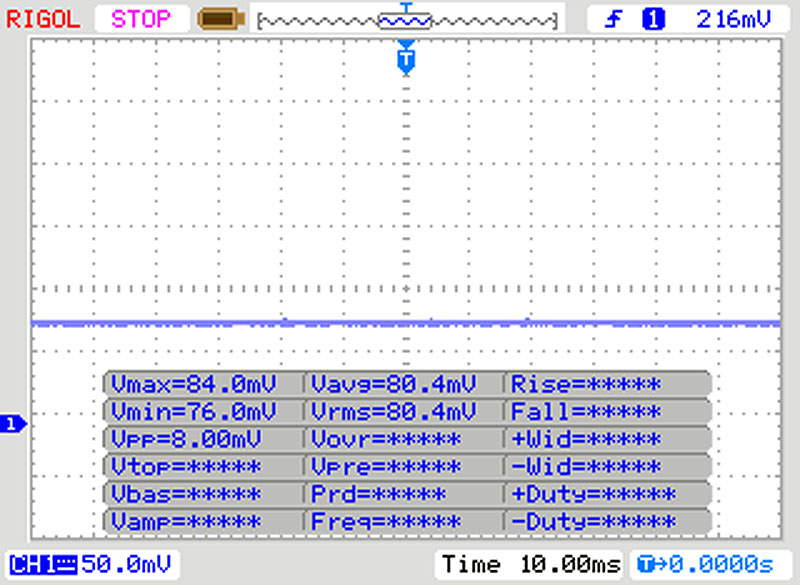 | ||
Som jämförelse: 52 % av alla testade enheter använder inte PWM för att dämpa skärmen. Om PWM upptäcktes mättes ett medelvärde av 7747 (minst: 5 - maximum: 343500) Hz. | |||
| Blender - v2.79 BMW27 CPU | |
| Acer Aspire Nitro 5 AN517-51-7887 | |
| Schenker XMG Pro 17 PB71RD-G | |
| Genomsnitt Intel Core i7-10750H (322 - 587, n=43) | |
| Acer Nitro 5 AN517-52-77DS | |
| Asus TUF A17 FA706IU-AS76 | |
| Genomsnitt av klass Gaming (79 - 330, n=104, senaste 2 åren) | |
| 7-Zip 18.03 | |
| 7z b 4 -mmt1 | |
| Genomsnitt av klass Gaming (4199 - 7436, n=105, senaste 2 åren) | |
| Genomsnitt Intel Core i7-10750H (4504 - 5470, n=43) | |
| Acer Nitro 5 AN517-52-77DS | |
| Acer Aspire Nitro 5 AN517-51-7887 | |
| Asus TUF A17 FA706IU-AS76 | |
| Schenker XMG Pro 17 PB71RD-G | |
| 7z b 4 | |
| Genomsnitt av klass Gaming (33491 - 148086, n=105, senaste 2 åren) | |
| Asus TUF A17 FA706IU-AS76 | |
| Genomsnitt Intel Core i7-10750H (26040 - 37345, n=43) | |
| Acer Nitro 5 AN517-52-77DS | |
| Acer Aspire Nitro 5 AN517-51-7887 | |
| Schenker XMG Pro 17 PB71RD-G | |
| Cinebench R20 | |
| CPU (Single Core) | |
| Genomsnitt av klass Gaming (442 - 913, n=106, senaste 2 åren) | |
| Acer Nitro 5 AN517-52-77DS | |
| Asus TUF A17 FA706IU-AS76 | |
| Genomsnitt Intel Core i7-10750H (431 - 504, n=43) | |
| Acer Aspire Nitro 5 AN517-51-7887 | |
| Lenovo Legion Y540-17IRH | |
| Schenker XMG Pro 17 PB71RD-G | |
| CPU (Multi Core) | |
| Genomsnitt av klass Gaming (4029 - 16433, n=106, senaste 2 åren) | |
| Asus TUF A17 FA706IU-AS76 | |
| Acer Nitro 5 AN517-52-77DS | |
| Genomsnitt Intel Core i7-10750H (1749 - 3325, n=43) | |
| Schenker XMG Pro 17 PB71RD-G | |
| Acer Aspire Nitro 5 AN517-51-7887 | |
| Lenovo Legion Y540-17IRH | |
| Geekbench 5.5 | |
| Single-Core | |
| Genomsnitt av klass Gaming (986 - 2474, n=105, senaste 2 åren) | |
| Genomsnitt Intel Core i7-10750H (1114 - 1333, n=43) | |
| Acer Nitro 5 AN517-52-77DS | |
| Asus TUF A17 FA706IU-AS76 | |
| Schenker XMG Pro 17 PB71RD-G | |
| Multi-Core | |
| Genomsnitt av klass Gaming (6460 - 28263, n=105, senaste 2 åren) | |
| Asus TUF A17 FA706IU-AS76 | |
| Acer Nitro 5 AN517-52-77DS | |
| Genomsnitt Intel Core i7-10750H (4443 - 6674, n=43) | |
| Schenker XMG Pro 17 PB71RD-G | |
| HWBOT x265 Benchmark v2.2 - 4k Preset | |
| Genomsnitt av klass Gaming (11.5 - 44.4, n=105, senaste 2 åren) | |
| Asus TUF A17 FA706IU-AS76 | |
| Genomsnitt Intel Core i7-10750H (5.54 - 11.6, n=43) | |
| Acer Nitro 5 AN517-52-77DS | |
| Acer Aspire Nitro 5 AN517-51-7887 | |
| Schenker XMG Pro 17 PB71RD-G | |
| LibreOffice - 20 Documents To PDF | |
| Asus TUF A17 FA706IU-AS76 | |
| Genomsnitt Intel Core i7-10750H (43.1 - 99.2, n=43) | |
| Acer Nitro 5 AN517-52-77DS | |
| Genomsnitt av klass Gaming (33.2 - 88.8, n=105, senaste 2 åren) | |
| R Benchmark 2.5 - Overall mean | |
| Schenker XMG Pro 17 PB71RD-G | |
| Acer Nitro 5 AN517-52-77DS | |
| Genomsnitt Intel Core i7-10750H (0.578 - 0.708, n=42) | |
| Asus TUF A17 FA706IU-AS76 | |
| Genomsnitt av klass Gaming (0.3439 - 0.759, n=106, senaste 2 åren) | |
* ... mindre är bättre
| PCMark 8 Home Score Accelerated v2 | 3836 poäng | |
| PCMark 8 Creative Score Accelerated v2 | 4075 poäng | |
| PCMark 8 Work Score Accelerated v2 | 5552 poäng | |
| PCMark 10 Score | 5201 poäng | |
Hjälp | ||
| DPC Latencies / LatencyMon - interrupt to process latency (max), Web, Youtube, Prime95 | |
| Asus TUF A17 FA706IU-AS76 | |
| Acer Nitro 5 AN517-52-77DS | |
* ... mindre är bättre

| Acer Nitro 5 AN517-52-77DS WDC PC SN530 SDBPNPZ-1T00 | Asus TUF A17 FA706IU-AS76 Intel SSD 660p 1TB SSDPEKNW010T8 | Lenovo Legion Y540-17IRH WDC PC SN520 SDAPNUW-512G | Schenker XMG Pro 17 PB71RD-G Samsung SSD 970 EVO Plus 500GB | HP Pavilion Gaming 17-cd0085cl Samsung SSD PM981 MZVLB256HAHQ | Acer Aspire Nitro 5 AN517-51-7887 WDC PC SN520 SDAPNUW-512G | Genomsnitt WDC PC SN530 SDBPNPZ-1T00 | |
|---|---|---|---|---|---|---|---|
| CrystalDiskMark 5.2 / 6 | 10% | -27% | 22% | 16% | -21% | 16% | |
| Write 4K (MB/s) | 140 | 189.7 36% | 105.1 -25% | 117.5 -16% | 135.3 -3% | 104.6 -25% | 182.7 ? 31% |
| Read 4K (MB/s) | 49.04 | 62.3 27% | 34.41 -30% | 46.47 -5% | 63.7 30% | 39.76 -19% | 48.6 ? -1% |
| Write Seq (MB/s) | 1963 | 1681 -14% | 1298 -34% | 1345 -31% | 1337 -32% | 1268 -35% | 1979 ? 1% |
| Read Seq (MB/s) | 1455 | 1608 11% | 1099 -24% | 2804 93% | 1617 11% | 1414 -3% | 1828 ? 26% |
| Write 4K Q32T1 (MB/s) | 398.2 | 468.6 18% | 335.7 -16% | 368.2 -8% | 568 43% | 287.9 -28% | 498 ? 25% |
| Read 4K Q32T1 (MB/s) | 461.9 | 541 17% | 231.4 -50% | 412.9 -11% | 645 40% | 381.1 -17% | 573 ? 24% |
| Write Seq Q32T1 (MB/s) | 1969 | 1770 -10% | 1454 -26% | 3248 65% | 1428 -27% | 1319 -33% | 1980 ? 1% |
| Read Seq Q32T1 (MB/s) | 1927 | 1898 -2% | 1740 -10% | 3559 85% | 3184 65% | 1735 -10% | 2336 ? 21% |
Kontinuerlig inläsning: DiskSpd Read Loop, Queue Depth 8
| 3DMark 06 Standard Score | 38509 poäng | |
| 3DMark 11 Performance | 18057 poäng | |
| 3DMark Ice Storm Standard Score | 117009 poäng | |
| 3DMark Cloud Gate Standard Score | 31601 poäng | |
| 3DMark Fire Strike Score | 14191 poäng | |
| 3DMark Time Spy Score | 5759 poäng | |
Hjälp | ||
| 3DMark 11 - 1280x720 Performance GPU | |
| Genomsnitt av klass Gaming (21841 - 80022, n=104, senaste 2 åren) | |
| Genomsnitt NVIDIA GeForce RTX 2060 Mobile (19143 - 24662, n=40) | |
| Schenker XMG Pro 17 PB71RD-G | |
| Asus TUF A17 FA706IU-AS76 | |
| Acer Nitro 5 AN517-52-77DS | |
| Acer Aspire Nitro 5 AN517-51-7887 | |
| Lenovo Legion Y740-17IRH | |
| Lenovo Legion Y540-17IRH | |
| HP Pavilion Gaming 17-cd0085cl | |
| The Witcher 3 - 1920x1080 Ultra Graphics & Postprocessing (HBAO+) | |
| Genomsnitt av klass Gaming (104.7 - 240, n=6, senaste 2 åren) | |
| Acer Nitro 5 AN517-52-77DS | |
| Genomsnitt NVIDIA GeForce RTX 2060 Mobile (50.6 - 74, n=40) | |
| Schenker XMG Pro 17 PB71RD-G | |
| Lenovo Legion Y740-17IRH | |
| Asus TUF A17 FA706IU-AS76 | |
| Acer Aspire Nitro 5 AN517-51-7887 | |
| Lenovo Legion Y540-17IRH | |
| HP Pavilion Gaming 17-cd0085cl | |
| BioShock Infinite - 1920x1080 Ultra Preset, DX11 (DDOF) | |
| Lenovo Legion Y740-17IRH | |
| Genomsnitt NVIDIA GeForce RTX 2060 Mobile (119 - 156, n=17) | |
| Acer Nitro 5 AN517-52-77DS | |
| Lenovo Legion Y540-17IRH | |
| Acer Aspire Nitro 5 AN517-51-7887 | |
| HP Pavilion Gaming 17-cd0085cl | |
| Shadow of the Tomb Raider - 1920x1080 Highest Preset AA:T | |
| Genomsnitt av klass Gaming (96 - 116, n=2, senaste 2 åren) | |
| Lenovo Legion Y740-17IRH | |
| Genomsnitt NVIDIA GeForce RTX 2060 Mobile (54 - 86, n=22) | |
| Asus TUF A17 FA706IU-AS76 | |
| Acer Nitro 5 AN517-52-77DS | |
| HP Pavilion Gaming 17-cd0085cl | |
| låg | med. | hög | ultra | |
|---|---|---|---|---|
| BioShock Infinite (2013) | 327.4 | 285.5 | 263.5 | 138.4 |
| The Witcher 3 (2015) | 277 | 188.3 | 108.9 | 63 |
| Dota 2 Reborn (2015) | 146.1 | 133.9 | 123.8 | 116.8 |
| X-Plane 11.11 (2018) | 98.3 | 84.1 | 75.8 | |
| Shadow of the Tomb Raider (2018) | 114 | 89 | 82 | 73 |
| Metro Exodus (2019) | 142.4 | 75.9 | 56.6 | 44.5 |
| Total War: Three Kingdoms (2019) | 229.6 | 107.4 | 66.9 | 46.3 |
| Control (2019) | 201.9 | 74.9 | 54.6 | |
| Borderlands 3 (2019) | 133 | 86.9 | 62.2 | 47.7 |
| Call of Duty Modern Warfare 2019 (2019) | 133.5 | 90.2 | 74.3 | 65.5 |
| Red Dead Redemption 2 (2019) | 116.9 | 76.1 | 50.7 | 32.5 |
| Escape from Tarkov (2020) | 121 | 121 | 117.5 | 103.3 |
| Hunt Showdown (2020) | 170.6 | 94.2 | 75 | |
| Doom Eternal (2020) | 195.6 | 125.4 | 112.4 | 108.9 |
| Gears Tactics (2020) | 236.1 | 145.6 | 93.3 | 60.7 |
Ljudnivå
| Låg belastning |
| 30.2 / 30.2 / 30.2 dB(A) |
| Hög belastning |
| 41.5 / 44.6 dB(A) |
 | ||
30 dB tyst 40 dB(A) hörbar 50 dB(A) högt ljud |
||
min: | ||
| Acer Nitro 5 AN517-52-77DS i7-10750H, GeForce RTX 2060 Mobile | Asus TUF A17 FA706IU-AS76 R7 4800H, GeForce GTX 1660 Ti Mobile | Schenker XMG Pro 17 PB71RD-G i7-9750H, GeForce RTX 2060 Mobile | Lenovo Legion Y540-17IRH i5-9300H, GeForce GTX 1660 Ti Mobile | HP Pavilion Gaming 17-cd0085cl i7-9750H, GeForce GTX 1660 Ti Max-Q | Acer Aspire Nitro 5 AN517-51-7887 i7-9750H, GeForce GTX 1660 Ti Mobile | Genomsnitt NVIDIA GeForce RTX 2060 Mobile | Genomsnitt av klass Gaming | |
|---|---|---|---|---|---|---|---|---|
| Noise | -5% | -14% | -7% | 7% | -3% | -3% | 3% | |
| av / miljö * (dB) | 30.2 | 28.7 5% | 30 1% | 30 1% | 28.2 7% | 30 1% | 27.9 ? 8% | 24.1 ? 20% |
| Idle Minimum * (dB) | 30.2 | 28.7 5% | 30 1% | 30 1% | 30.1 -0% | 30.2 -0% | 29 ? 4% | 25.9 ? 14% |
| Idle Average * (dB) | 30.2 | 30.5 -1% | 32 -6% | 32 -6% | 30.1 -0% | 30.2 -0% | 30 ? 1% | 27.4 ? 9% |
| Idle Maximum * (dB) | 30.2 | 32.5 -8% | 39 -29% | 34 -13% | 30.1 -0% | 31 -3% | 33 ? -9% | 30.1 ? -0% |
| Load Average * (dB) | 41.5 | 42.5 -2% | 51 -23% | 44 -6% | 34.2 18% | 43.4 -5% | 44 ? -6% | 43.6 ? -5% |
| Witcher 3 ultra * (dB) | 44.5 | 50.1 -13% | 54 -21% | 50 -12% | 34.2 23% | 48.5 -9% | ||
| Load Maximum * (dB) | 44.6 | 53.4 -20% | 54 -21% | 52 -17% | 43.8 2% | 45.5 -2% | 51.6 ? -16% | 54.2 ? -22% |
* ... mindre är bättre
(-) Den maximala temperaturen på ovansidan är 50.6 °C / 123 F, jämfört med genomsnittet av 40.4 °C / 105 F , allt från 21.2 till 68.8 °C för klassen Gaming.
(-) Botten värms upp till maximalt 53.8 °C / 129 F, jämfört med genomsnittet av 43.2 °C / 110 F
(+) Vid tomgångsbruk är medeltemperaturen för ovansidan 25 °C / 77 F, jämfört med enhetsgenomsnittet på 33.9 °C / ### class_avg_f### F.
(±) När du spelar The Witcher 3 är medeltemperaturen för ovansidan 37.3 °C / 99 F, jämfört med enhetsgenomsnittet på 33.9 °C / ## #class_avg_f### F.
(+) Handledsstöden och pekplattan är kallare än hudtemperaturen med maximalt 26.1 °C / 79 F och är därför svala att ta på.
(+) Medeltemperaturen för handledsstödsområdet på liknande enheter var 28.8 °C / 83.8 F (+2.7 °C / 4.8 F).
| Acer Nitro 5 AN517-52-77DS i7-10750H, GeForce RTX 2060 Mobile | Asus TUF A17 FA706IU-AS76 R7 4800H, GeForce GTX 1660 Ti Mobile | Schenker XMG Pro 17 PB71RD-G i7-9750H, GeForce RTX 2060 Mobile | Lenovo Legion Y740-17IRH i7-9750H, GeForce RTX 2060 Mobile | HP Pavilion Gaming 17-cd0085cl i7-9750H, GeForce GTX 1660 Ti Max-Q | Acer Aspire Nitro 5 AN517-51-7887 i7-9750H, GeForce GTX 1660 Ti Mobile | Genomsnitt NVIDIA GeForce RTX 2060 Mobile | Genomsnitt av klass Gaming | |
|---|---|---|---|---|---|---|---|---|
| Heat | -4% | -4% | -3% | -11% | -5% | -7% | -5% | |
| Maximum Upper Side * (°C) | 50.6 | 47.6 6% | 47 7% | 43 15% | 42.6 16% | 51.7 -2% | 47.2 ? 7% | 45.2 ? 11% |
| Maximum Bottom * (°C) | 53.8 | 50.8 6% | 48 11% | 46 14% | 49 9% | 55.4 -3% | 52.7 ? 2% | 48.2 ? 10% |
| Idle Upper Side * (°C) | 26.6 | 33 -24% | 30 -13% | 31 -17% | 34 -28% | 29.1 -9% | 31 ? -17% | 31 ? -17% |
| Idle Bottom * (°C) | 27.8 | 29 -4% | 34 -22% | 34 -22% | 39.4 -42% | 29 -4% | 32.9 ? -18% | 34.3 ? -23% |
* ... mindre är bättre
Acer Nitro 5 AN517-52-77DS ljudanalys
(-) | inte särskilt höga högtalare (67.8 dB)
Bas 100 - 315 Hz
(-) | nästan ingen bas - i genomsnitt 22.3% lägre än medianen
(±) | linjäriteten för basen är genomsnittlig (12% delta till föregående frekvens)
Mellan 400 - 2000 Hz
(+) | balanserad mellan - endast 4.1% från medianen
(±) | linjäriteten för mids är genomsnittlig (9.2% delta till föregående frekvens)
Högsta 2 - 16 kHz
(+) | balanserade toppar - endast 2.6% från medianen
(+) | toppar är linjära (6.3% delta till föregående frekvens)
Totalt 100 - 16 000 Hz
(±) | linjäriteten för det totala ljudet är genomsnittlig (22.4% skillnad mot median)
Jämfört med samma klass
» 80% av alla testade enheter i den här klassen var bättre, 6% liknande, 14% sämre
» Den bästa hade ett delta på 6%, genomsnittet var 18%, sämst var 132%
Jämfört med alla testade enheter
» 66% av alla testade enheter var bättre, 6% liknande, 29% sämre
» Den bästa hade ett delta på 4%, genomsnittet var 23%, sämst var 134%
Asus TUF A17 FA706IU-AS76 ljudanalys
(±) | högtalarljudstyrkan är genomsnittlig men bra (74 dB)
Bas 100 - 315 Hz
(±) | reducerad bas - i genomsnitt 12.7% lägre än medianen
(±) | linjäriteten för basen är genomsnittlig (11.5% delta till föregående frekvens)
Mellan 400 - 2000 Hz
(+) | balanserad mellan - endast 4.8% från medianen
(±) | linjäriteten för mids är genomsnittlig (9.1% delta till föregående frekvens)
Högsta 2 - 16 kHz
(+) | balanserade toppar - endast 3.1% från medianen
(±) | linjäriteten för toppar är genomsnittlig (8.7% delta till föregående frekvens)
Totalt 100 - 16 000 Hz
(±) | linjäriteten för det totala ljudet är genomsnittlig (23.5% skillnad mot median)
Jämfört med samma klass
» 85% av alla testade enheter i den här klassen var bättre, 5% liknande, 10% sämre
» Den bästa hade ett delta på 6%, genomsnittet var 18%, sämst var 132%
Jämfört med alla testade enheter
» 70% av alla testade enheter var bättre, 6% liknande, 24% sämre
» Den bästa hade ett delta på 4%, genomsnittet var 23%, sämst var 134%
| Av/Standby | |
| Låg belastning | |
| Hög belastning |
|
Förklaring:
min: | |
| Acer Nitro 5 AN517-52-77DS i7-10750H, GeForce RTX 2060 Mobile | Asus TUF A17 FA706IU-AS76 R7 4800H, GeForce GTX 1660 Ti Mobile | Schenker XMG Pro 17 PB71RD-G i7-9750H, GeForce RTX 2060 Mobile | Lenovo Legion Y540-17IRH i5-9300H, GeForce GTX 1660 Ti Mobile | HP Pavilion Gaming 17-cd0085cl i7-9750H, GeForce GTX 1660 Ti Max-Q | Acer Aspire Nitro 5 AN517-51-7887 i7-9750H, GeForce GTX 1660 Ti Mobile | Genomsnitt NVIDIA GeForce RTX 2060 Mobile | Genomsnitt av klass Gaming | |
|---|---|---|---|---|---|---|---|---|
| Power Consumption | -15% | -60% | -89% | 5% | 10% | -61% | -79% | |
| Idle Minimum * (Watt) | 5.4 | 7.4 -37% | 11 -104% | 19 -252% | 5.4 -0% | 3.9 28% | 11.5 ? -113% | 13 ? -141% |
| Idle Average * (Watt) | 9.8 | 10.5 -7% | 18 -84% | 22 -124% | 9.2 6% | 8.9 9% | 16.5 ? -68% | 18.7 ? -91% |
| Idle Maximum * (Watt) | 10.9 | 17 -56% | 28 -157% | 30 -175% | 13 -19% | 12.2 -12% | 23.7 ? -117% | 24.3 ? -123% |
| Load Average * (Watt) | 104 | 103.7 -0% | 99 5% | 79 24% | 85.9 17% | 83 20% | 107.5 ? -3% | 110.2 ? -6% |
| Witcher 3 ultra * (Watt) | 134.3 | 128.1 5% | 146 -9% | 134 -0% | 107.9 20% | 130 3% | ||
| Load Maximum * (Watt) | 193 | 183.2 5% | 210 -9% | 201 -4% | 182.2 6% | 168 13% | 199.7 ? -3% | 258 ? -34% |
* ... mindre är bättre
| Acer Nitro 5 AN517-52-77DS i7-10750H, GeForce RTX 2060 Mobile, 57.48 Wh | Asus TUF A17 FA706IU-AS76 R7 4800H, GeForce GTX 1660 Ti Mobile, 90 Wh | Lenovo Legion Y540-17IRH i5-9300H, GeForce GTX 1660 Ti Mobile, 57 Wh | Schenker XMG Pro 17 PB71RD-G i7-9750H, GeForce RTX 2060 Mobile, 62 Wh | HP Pavilion Gaming 17-cd0085cl i7-9750H, GeForce GTX 1660 Ti Max-Q, 52.5 Wh | Acer Aspire Nitro 5 AN517-51-7887 i7-9750H, GeForce GTX 1660 Ti Mobile, 57 Wh | Genomsnitt av klass Gaming | |
|---|---|---|---|---|---|---|---|
| Batteridrifttid | 26% | -49% | -42% | -20% | -3% | -5% | |
| Reader / Idle (h) | 11 | 9.1 -17% | 5.2 -53% | 5.2 -53% | 11.6 5% | 13.4 22% | 8.71 ? -21% |
| H.264 (h) | 7.3 | 3.4 -53% | 6.3 -14% | 8.64 ? 18% | |||
| WiFi v1.3 (h) | 6.6 | 8.5 29% | 3.7 -44% | 4.1 -38% | 5.7 -14% | 6.2 -6% | 7.11 ? 8% |
| Load (h) | 2 | 3.3 65% | 1.1 -45% | 1.3 -35% | 1 -50% | 1.7 -15% | 1.502 ? -25% |
För
Emot
Läs den fullständiga versionen av den här recensionen på engelska här.
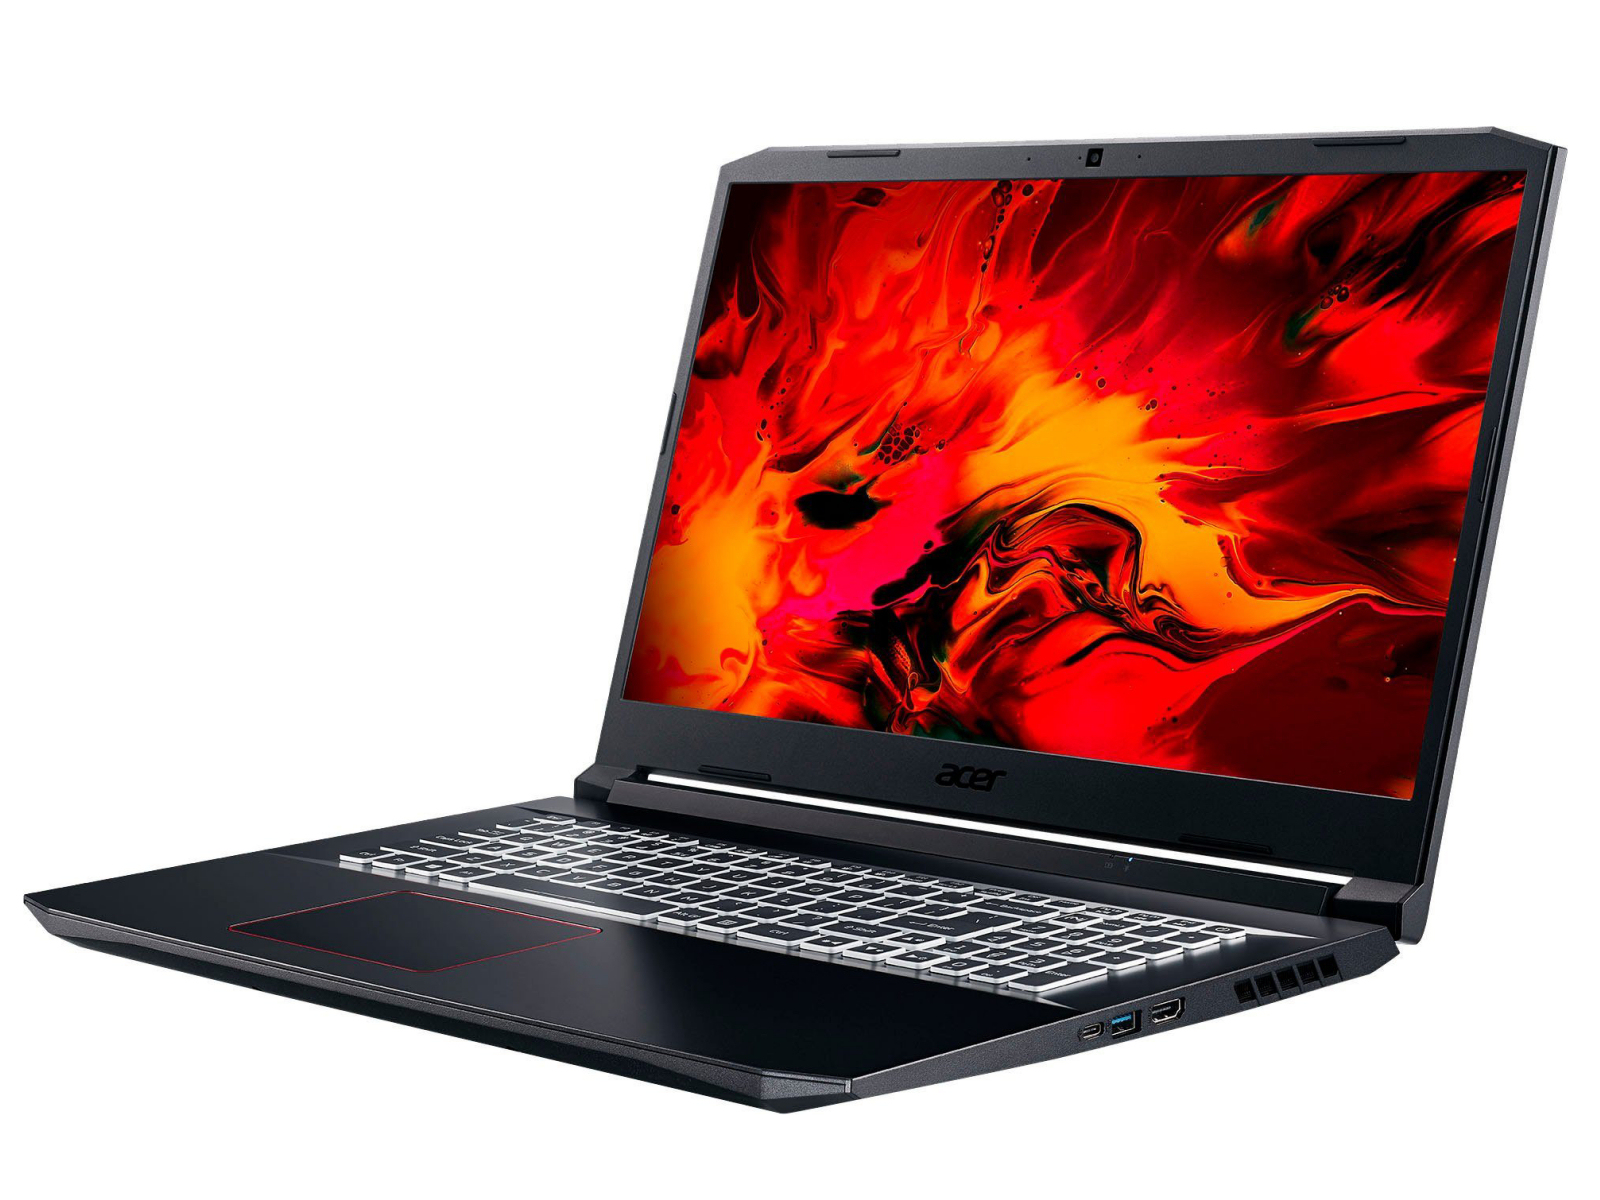
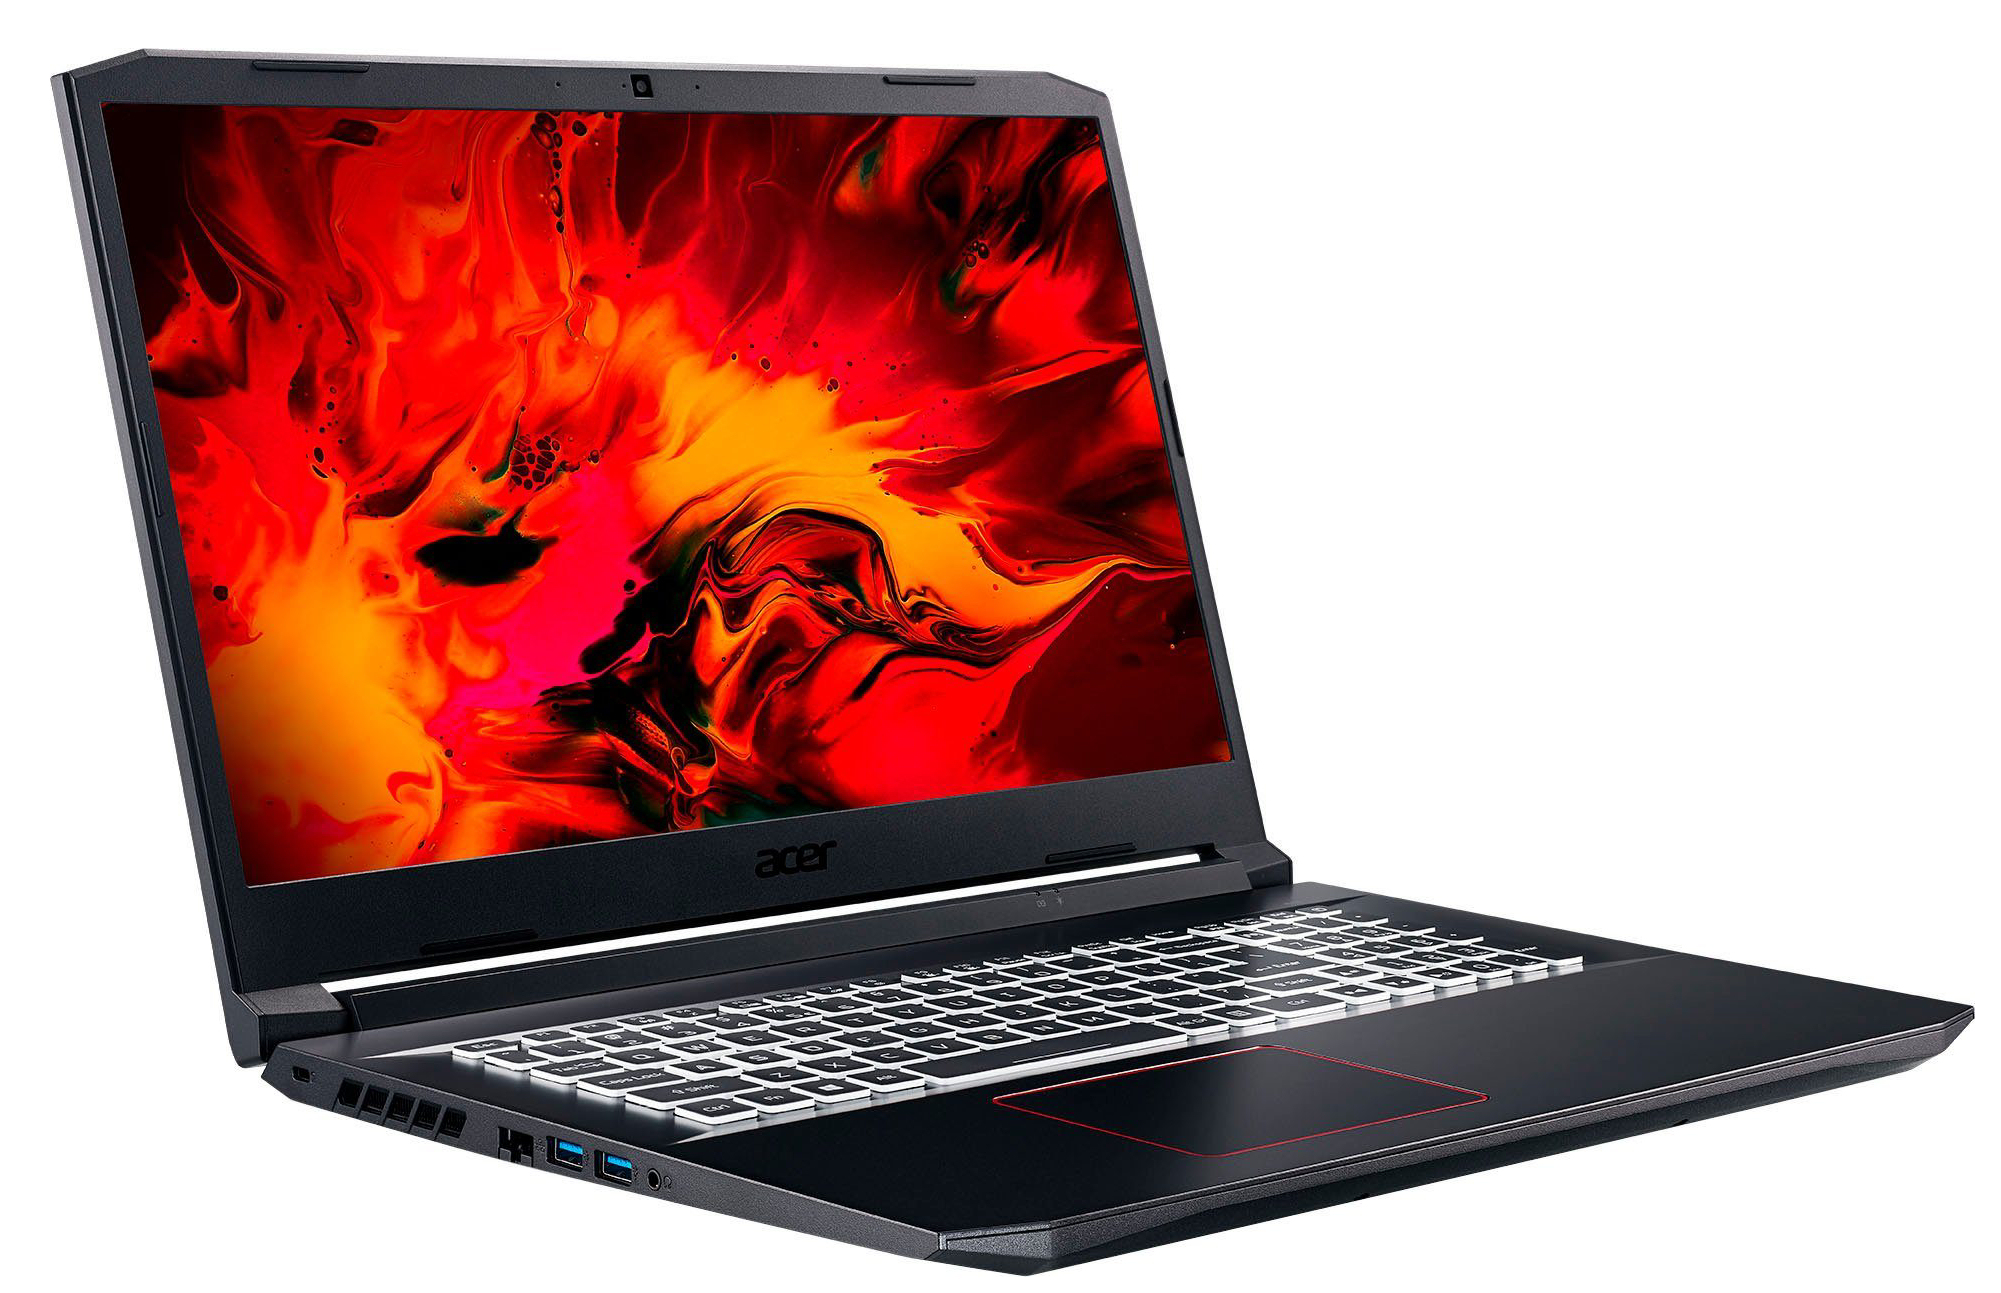
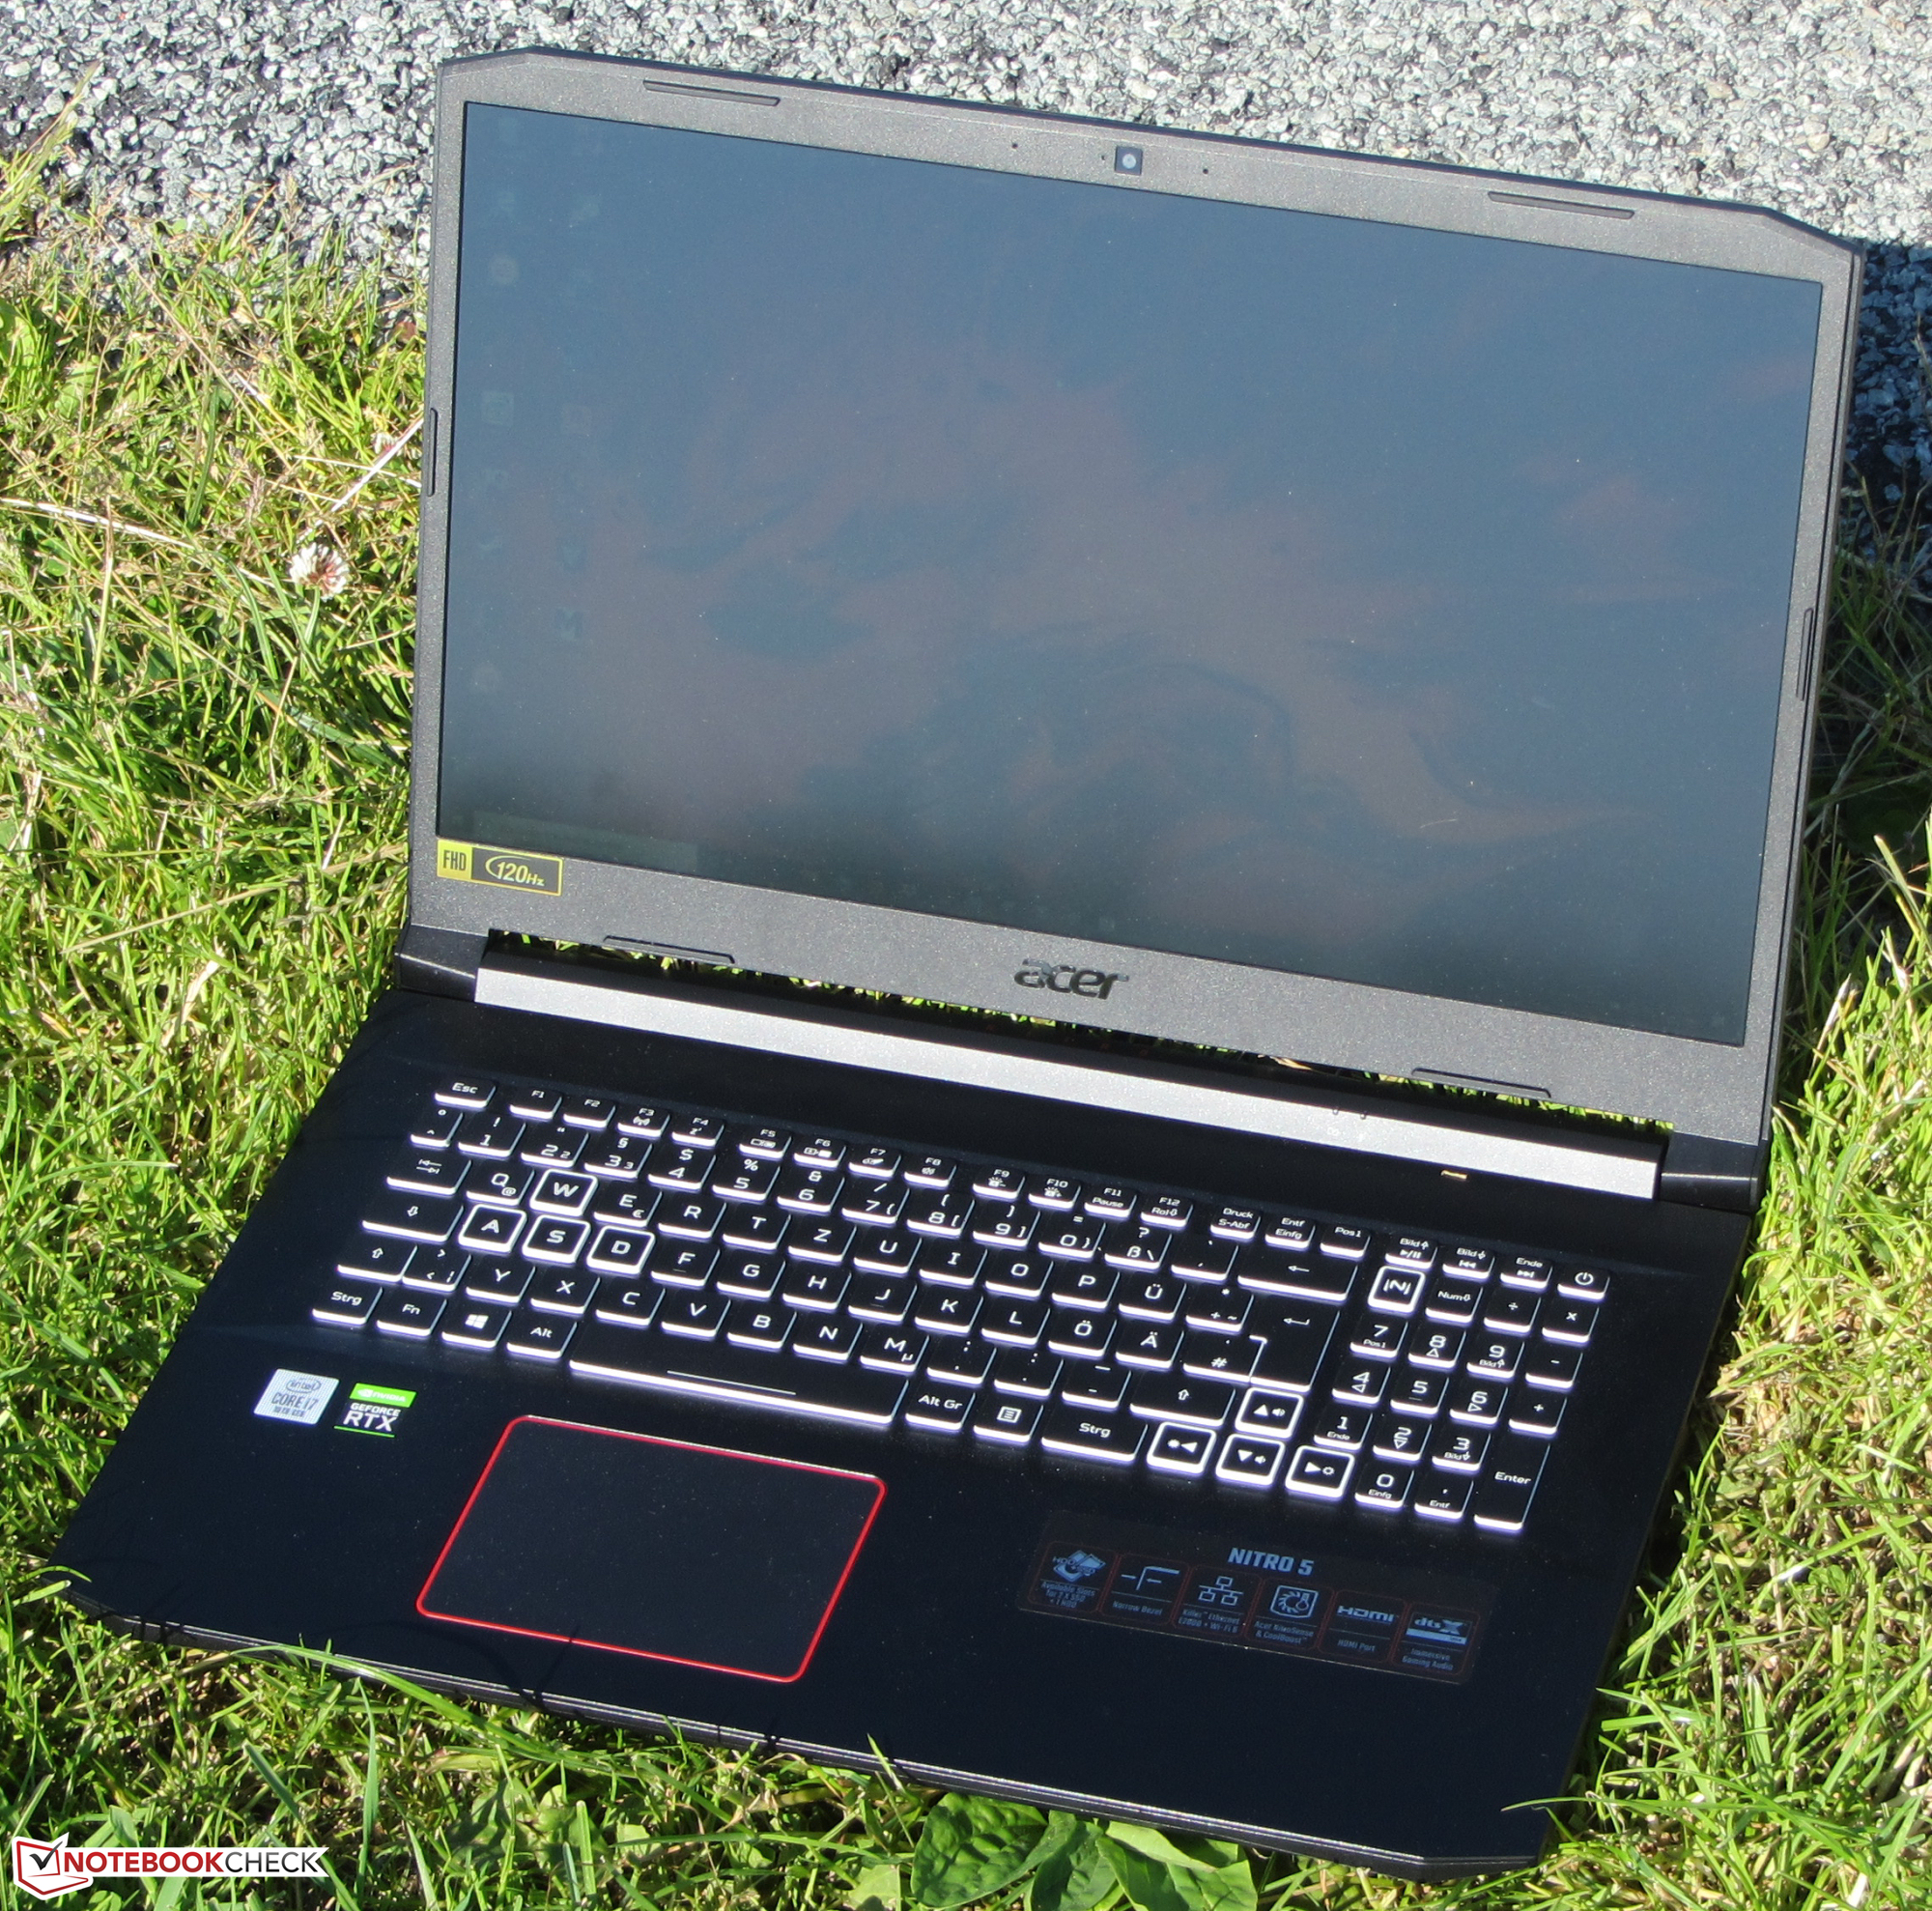
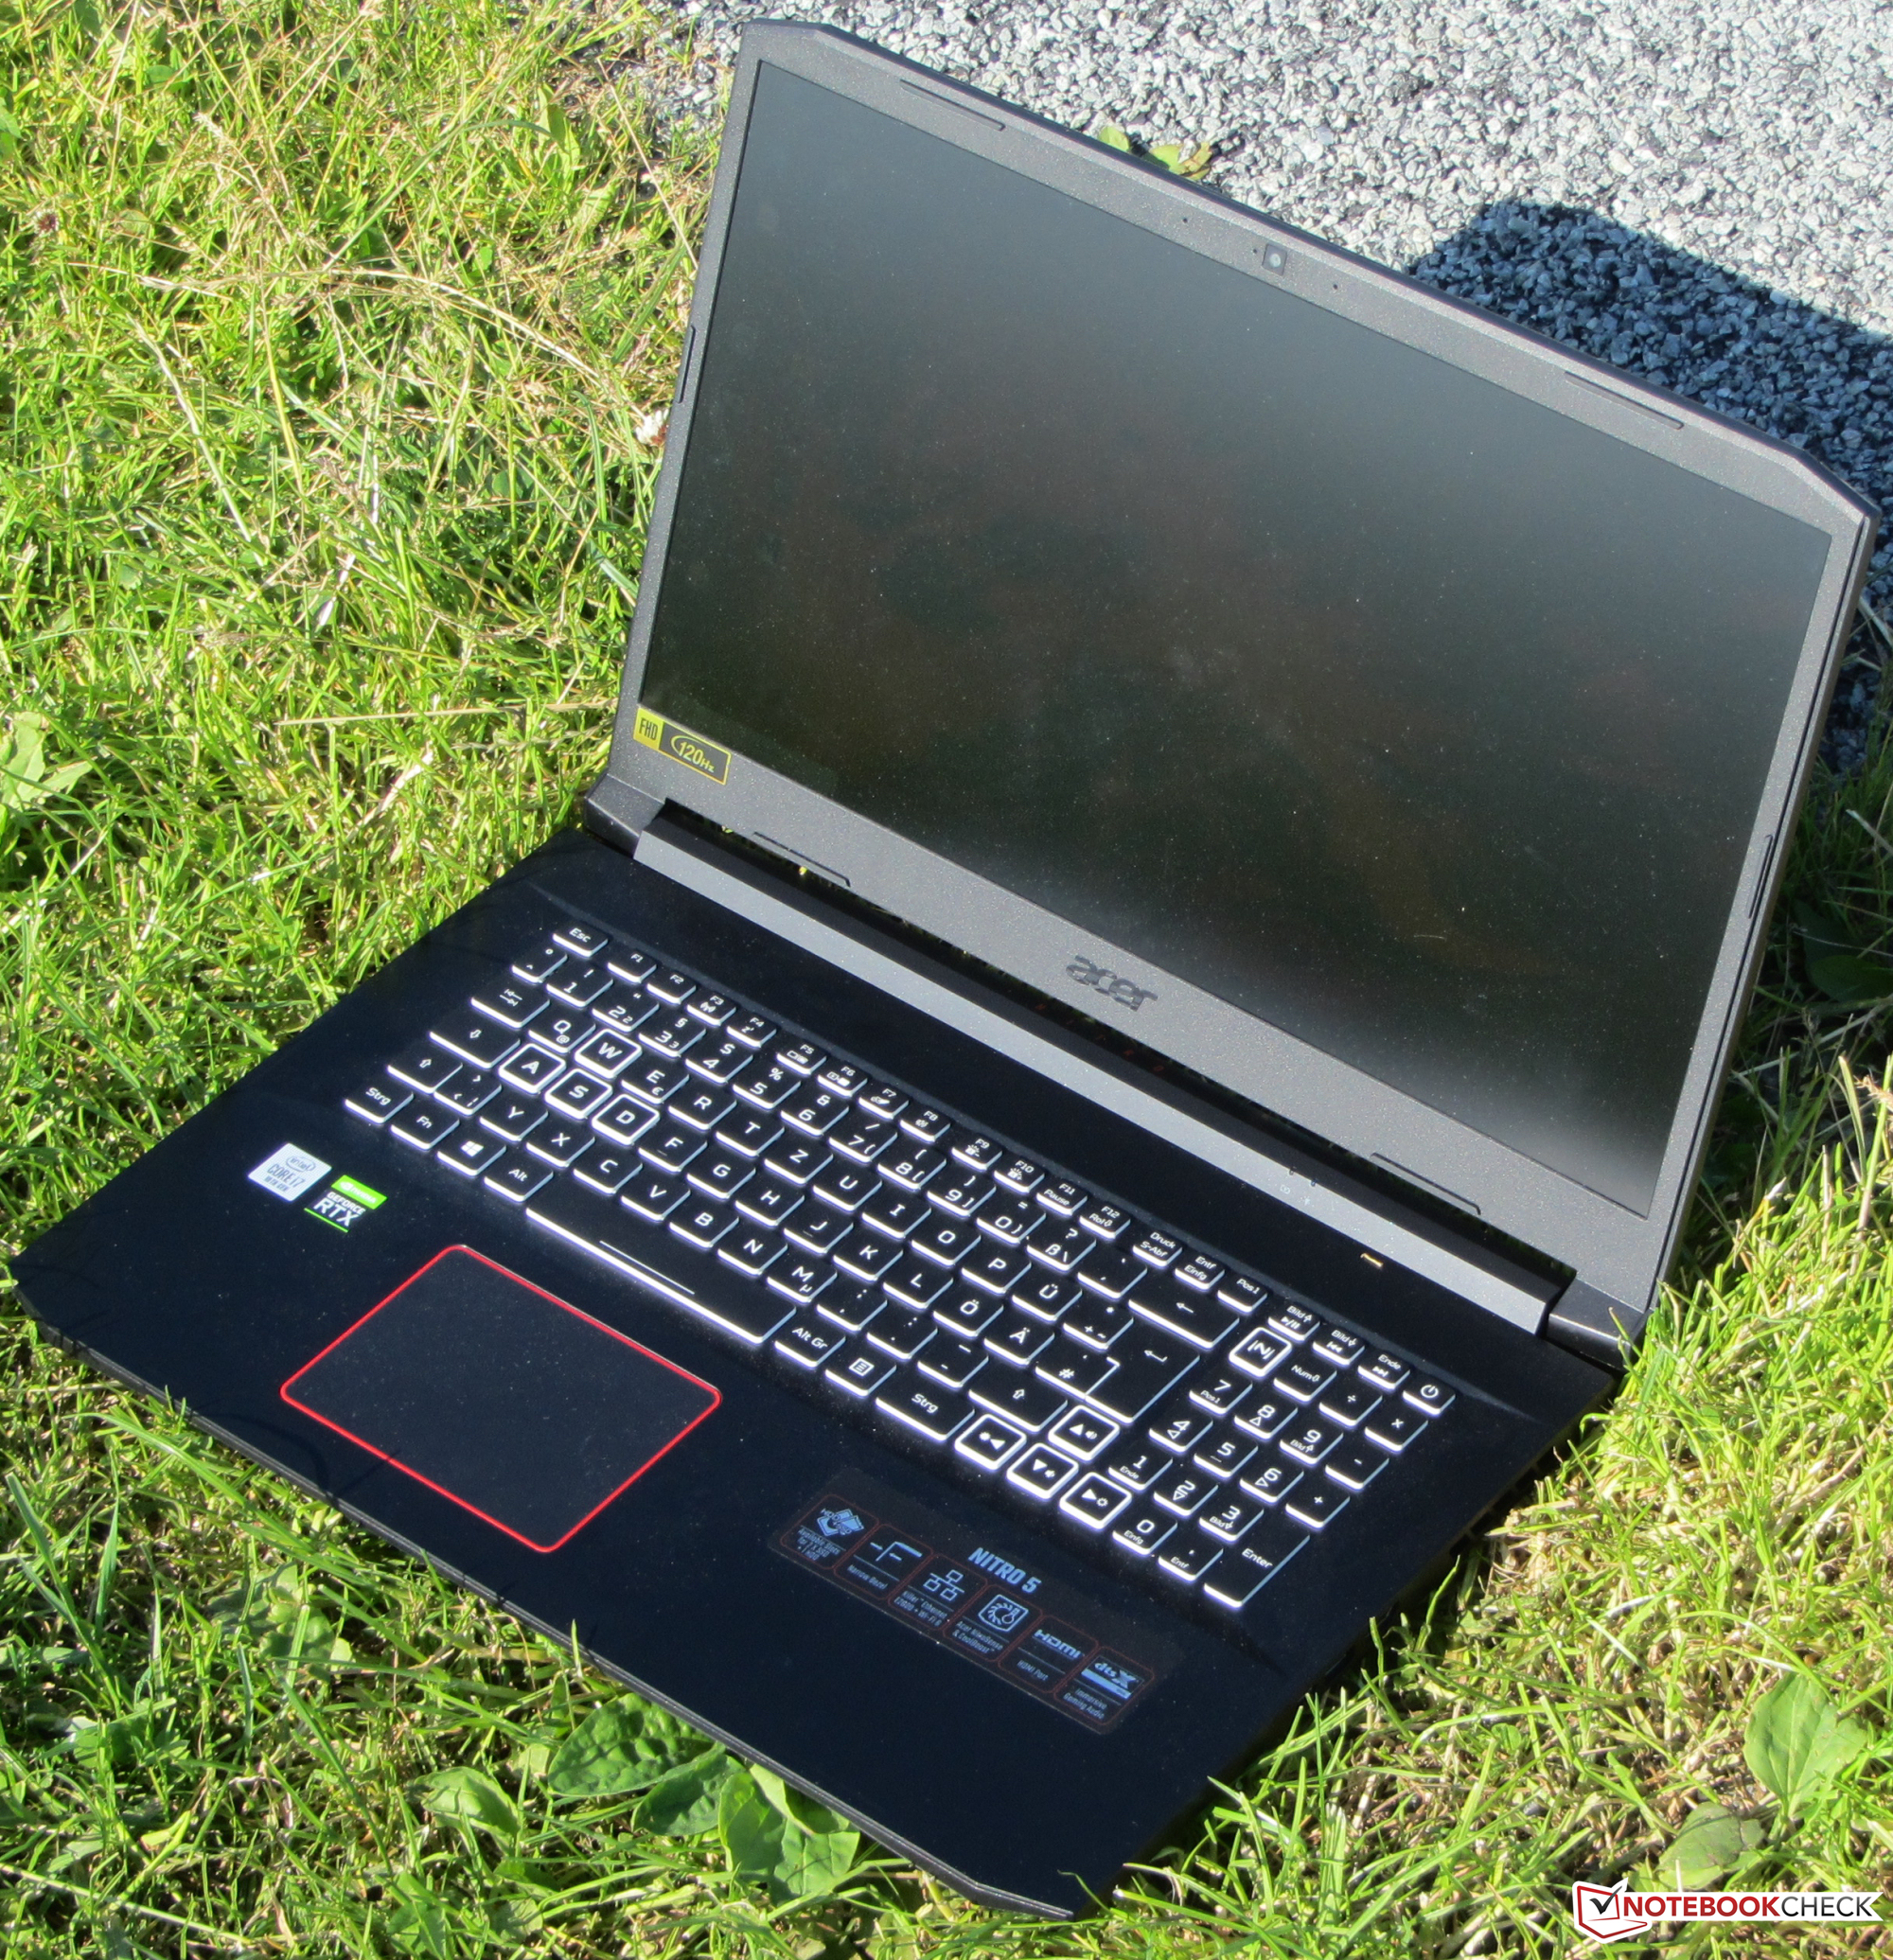
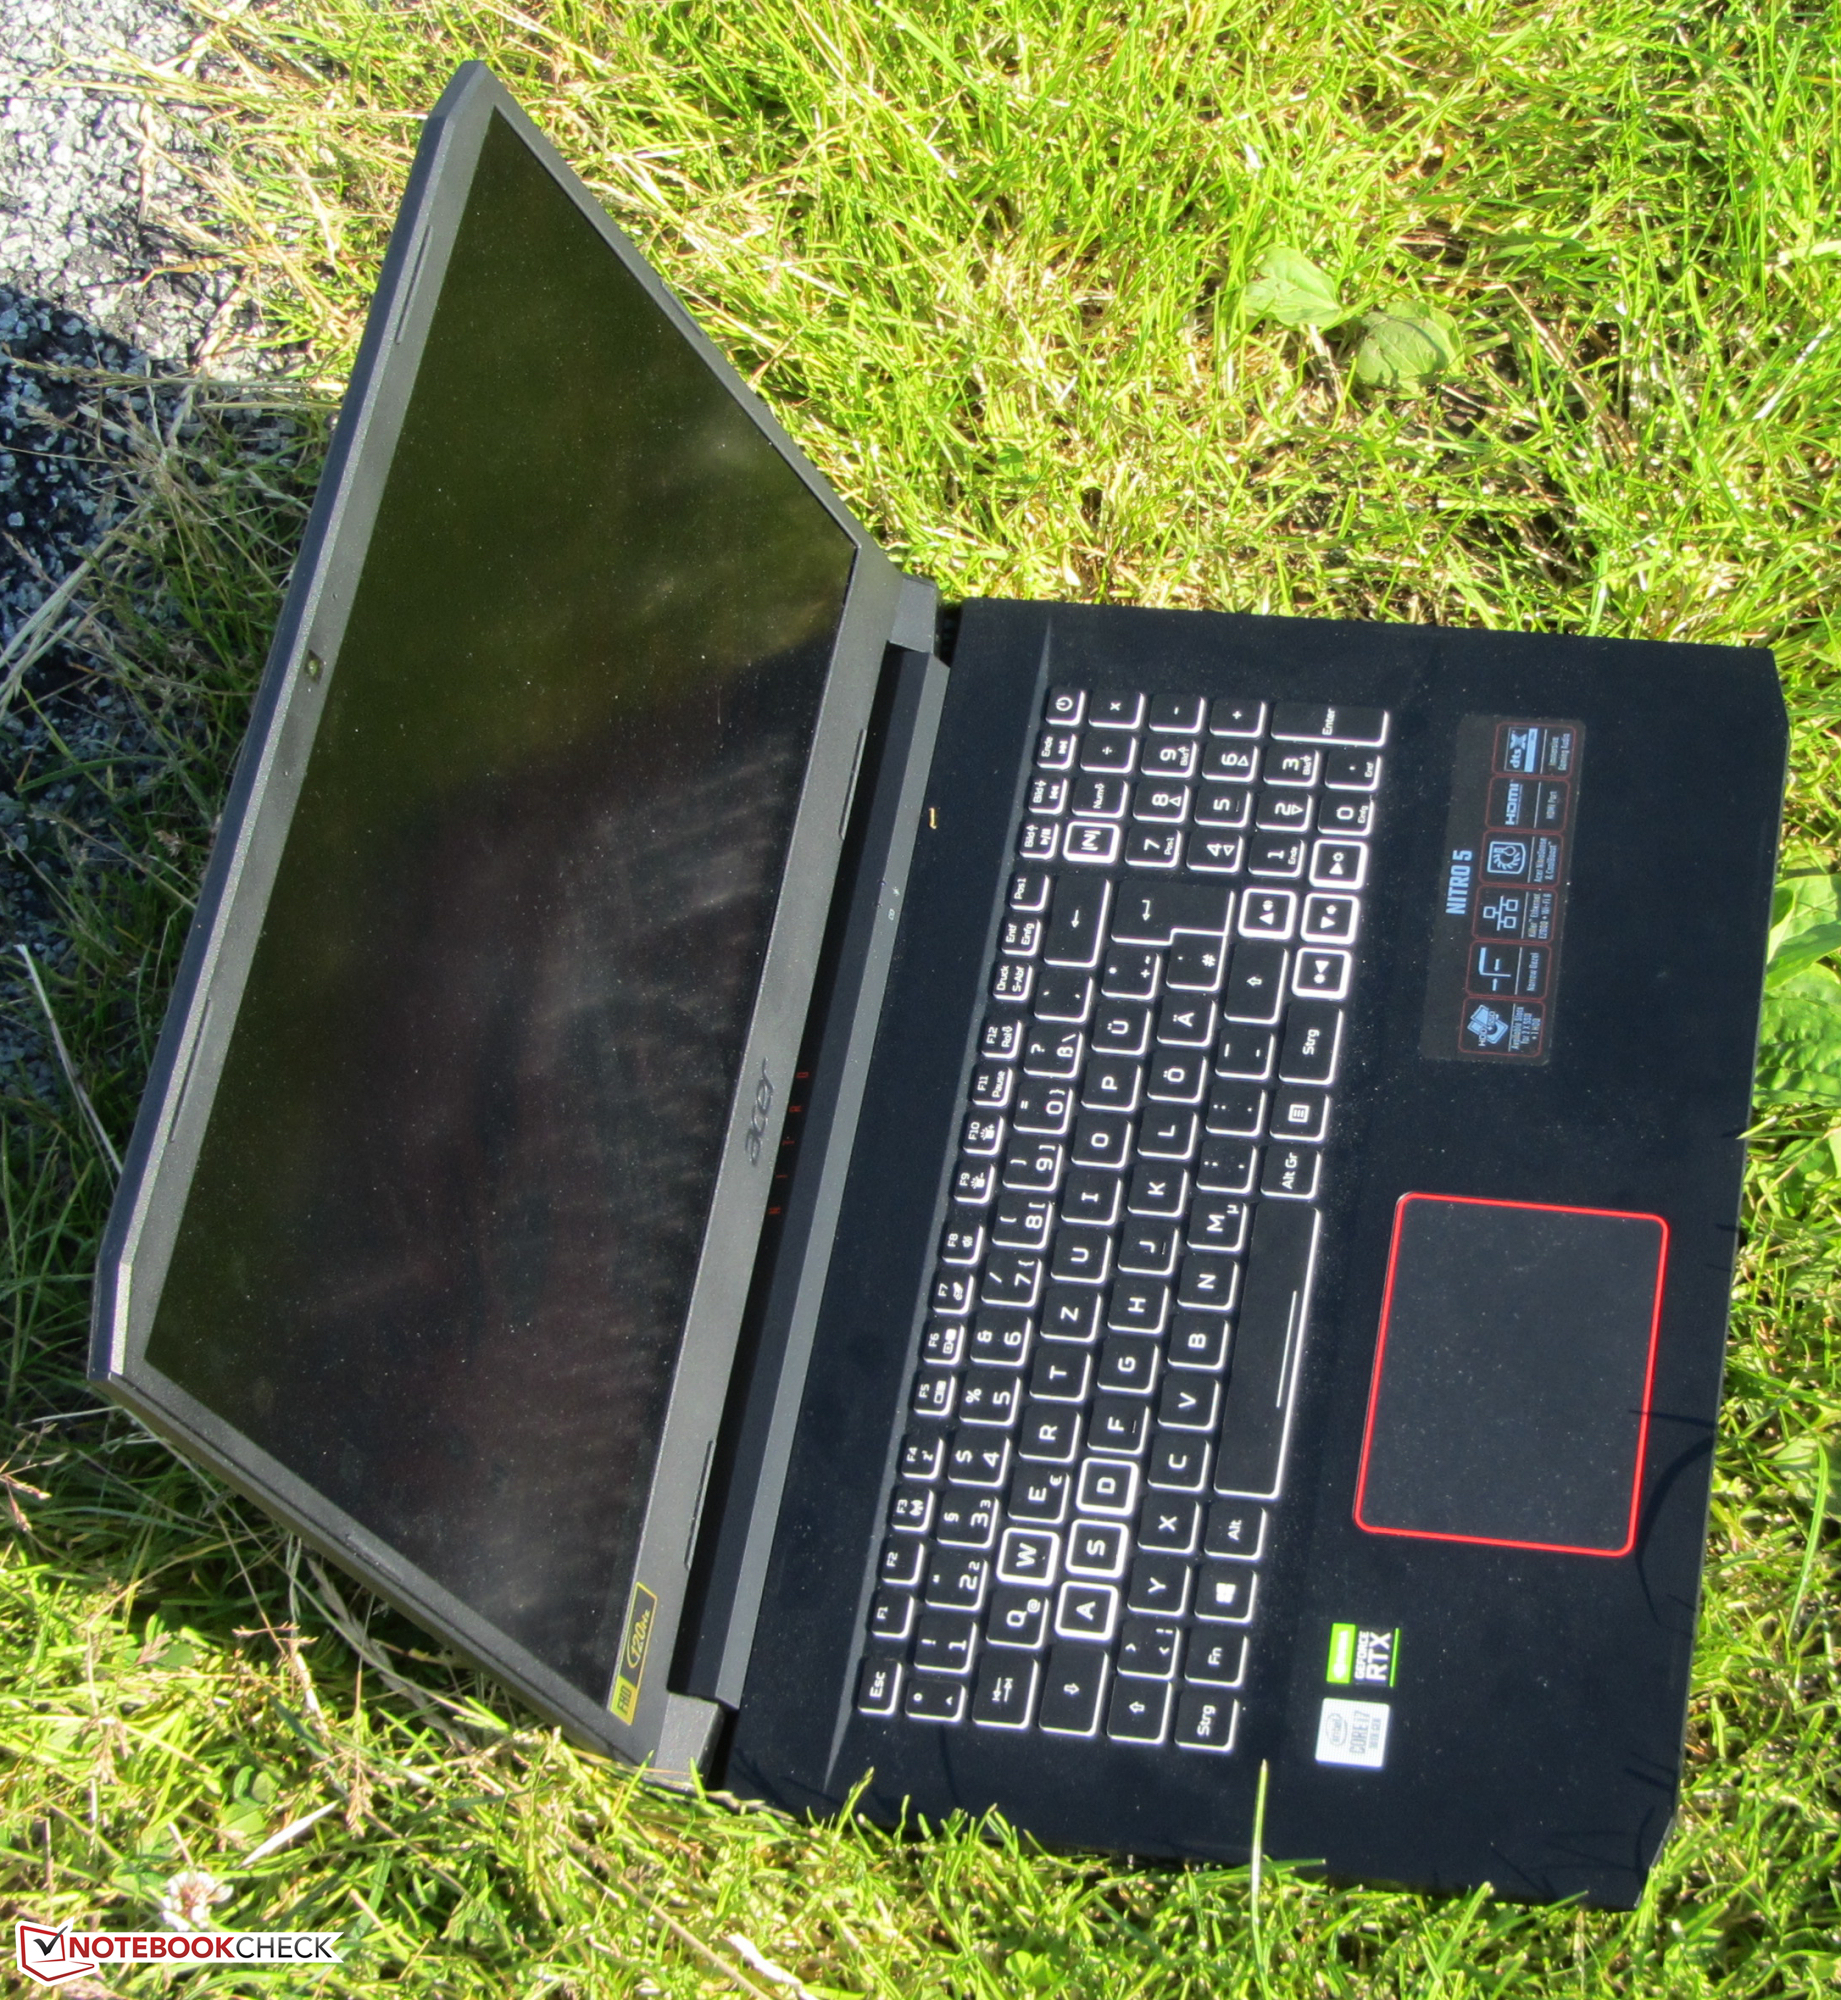
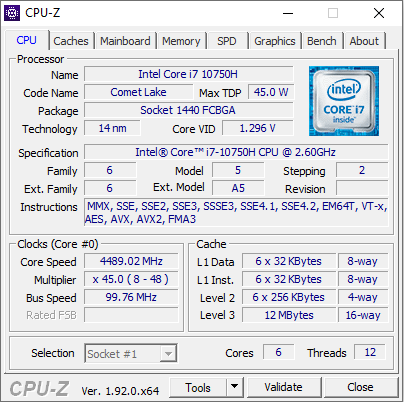
Acers spellaptop på 17.3 tum kan enkelt visa alla de senaste spelen smidigt på sin matta Full HD-skärm, tack vare en Core i7-10750H-processor och en GeForce RTX 2060 GPU. Du kan oftast spela i Full HD-upplösning med höga eller maximala inställningar.
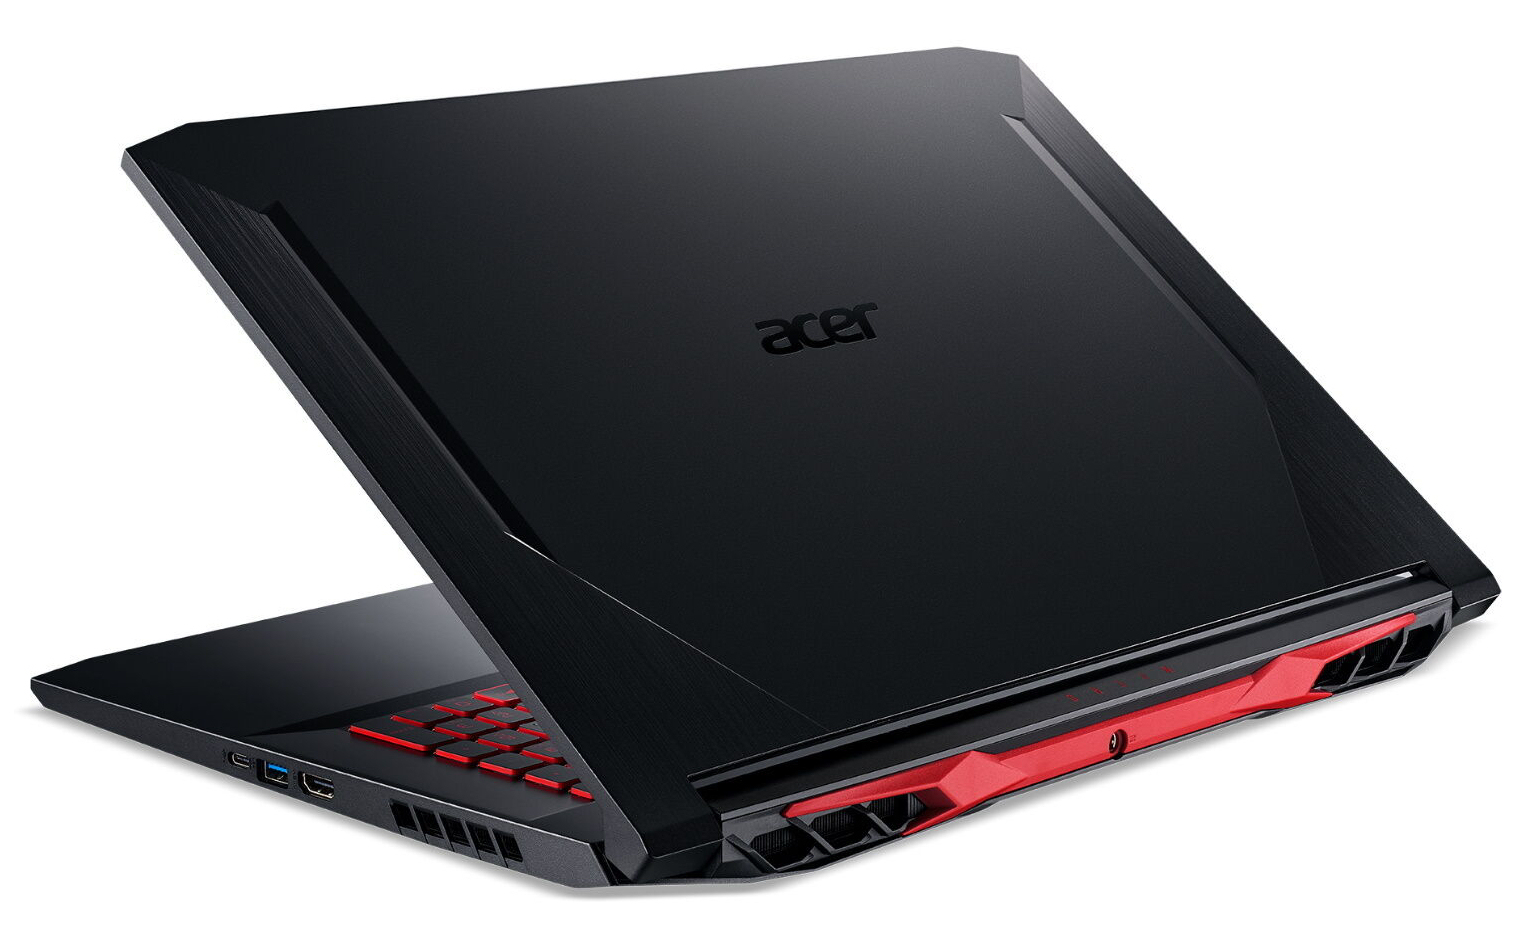
Acer Nitro 5 AN517-52 är en stor och välavrundad spellaptop som förtjänar en bättre skärm.
Det finns tillräckligt med plats för spel och program tack vare en NVMe SSD-enhet på 1 TB. Om du någonsin får slut på lagring går den att utöka. Det finns också plats för en andra M.2 2280 NVMe SSD samt en lagringsenhet på 2.5 tum. Du behöver dock öppna datorn om du vill installera något sådant, för den har tyvärr ingen servicelucka.
Totalt sett lyckas IPS-skärmen inte övertyga trots 120 Hz bilduppdatering. Ljusstyrkan, kontrastförhållandet och färgomfånget är alla alldeles för låga. Responstiderna kan bara beskrivas som medelmåttiga. En laptop för 15.000 kronor behöver erbjuda mer på den här punkten. Stabila betraktningsvinklar, en matt yta och skaplig färgåtergivning talar däremot för skärmen.
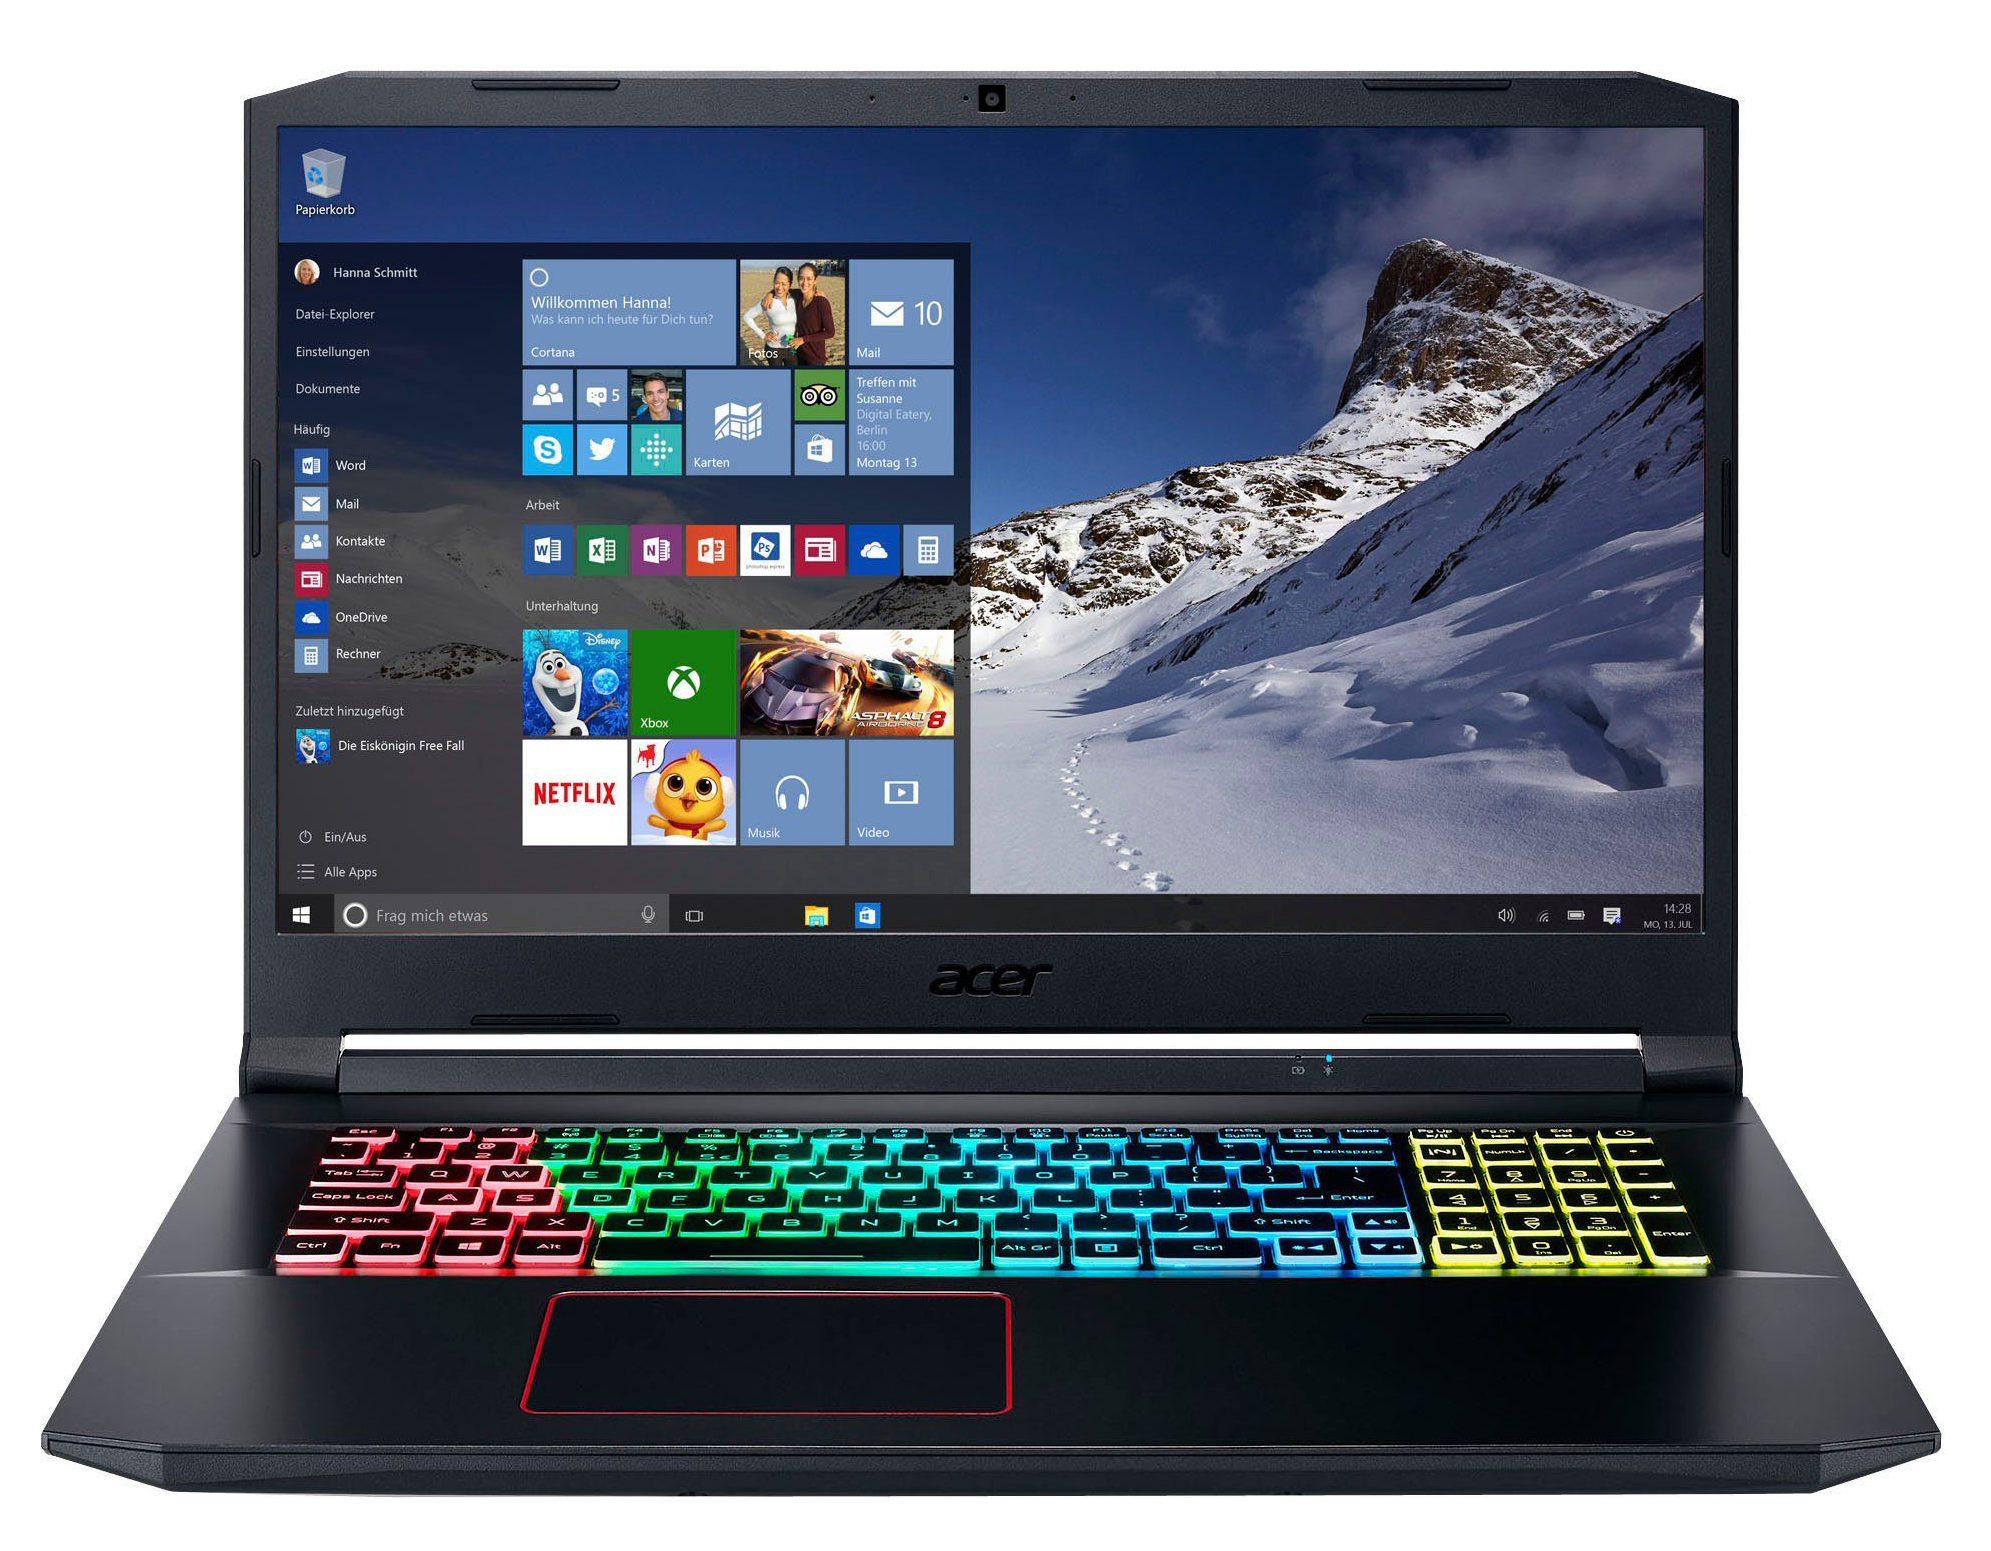
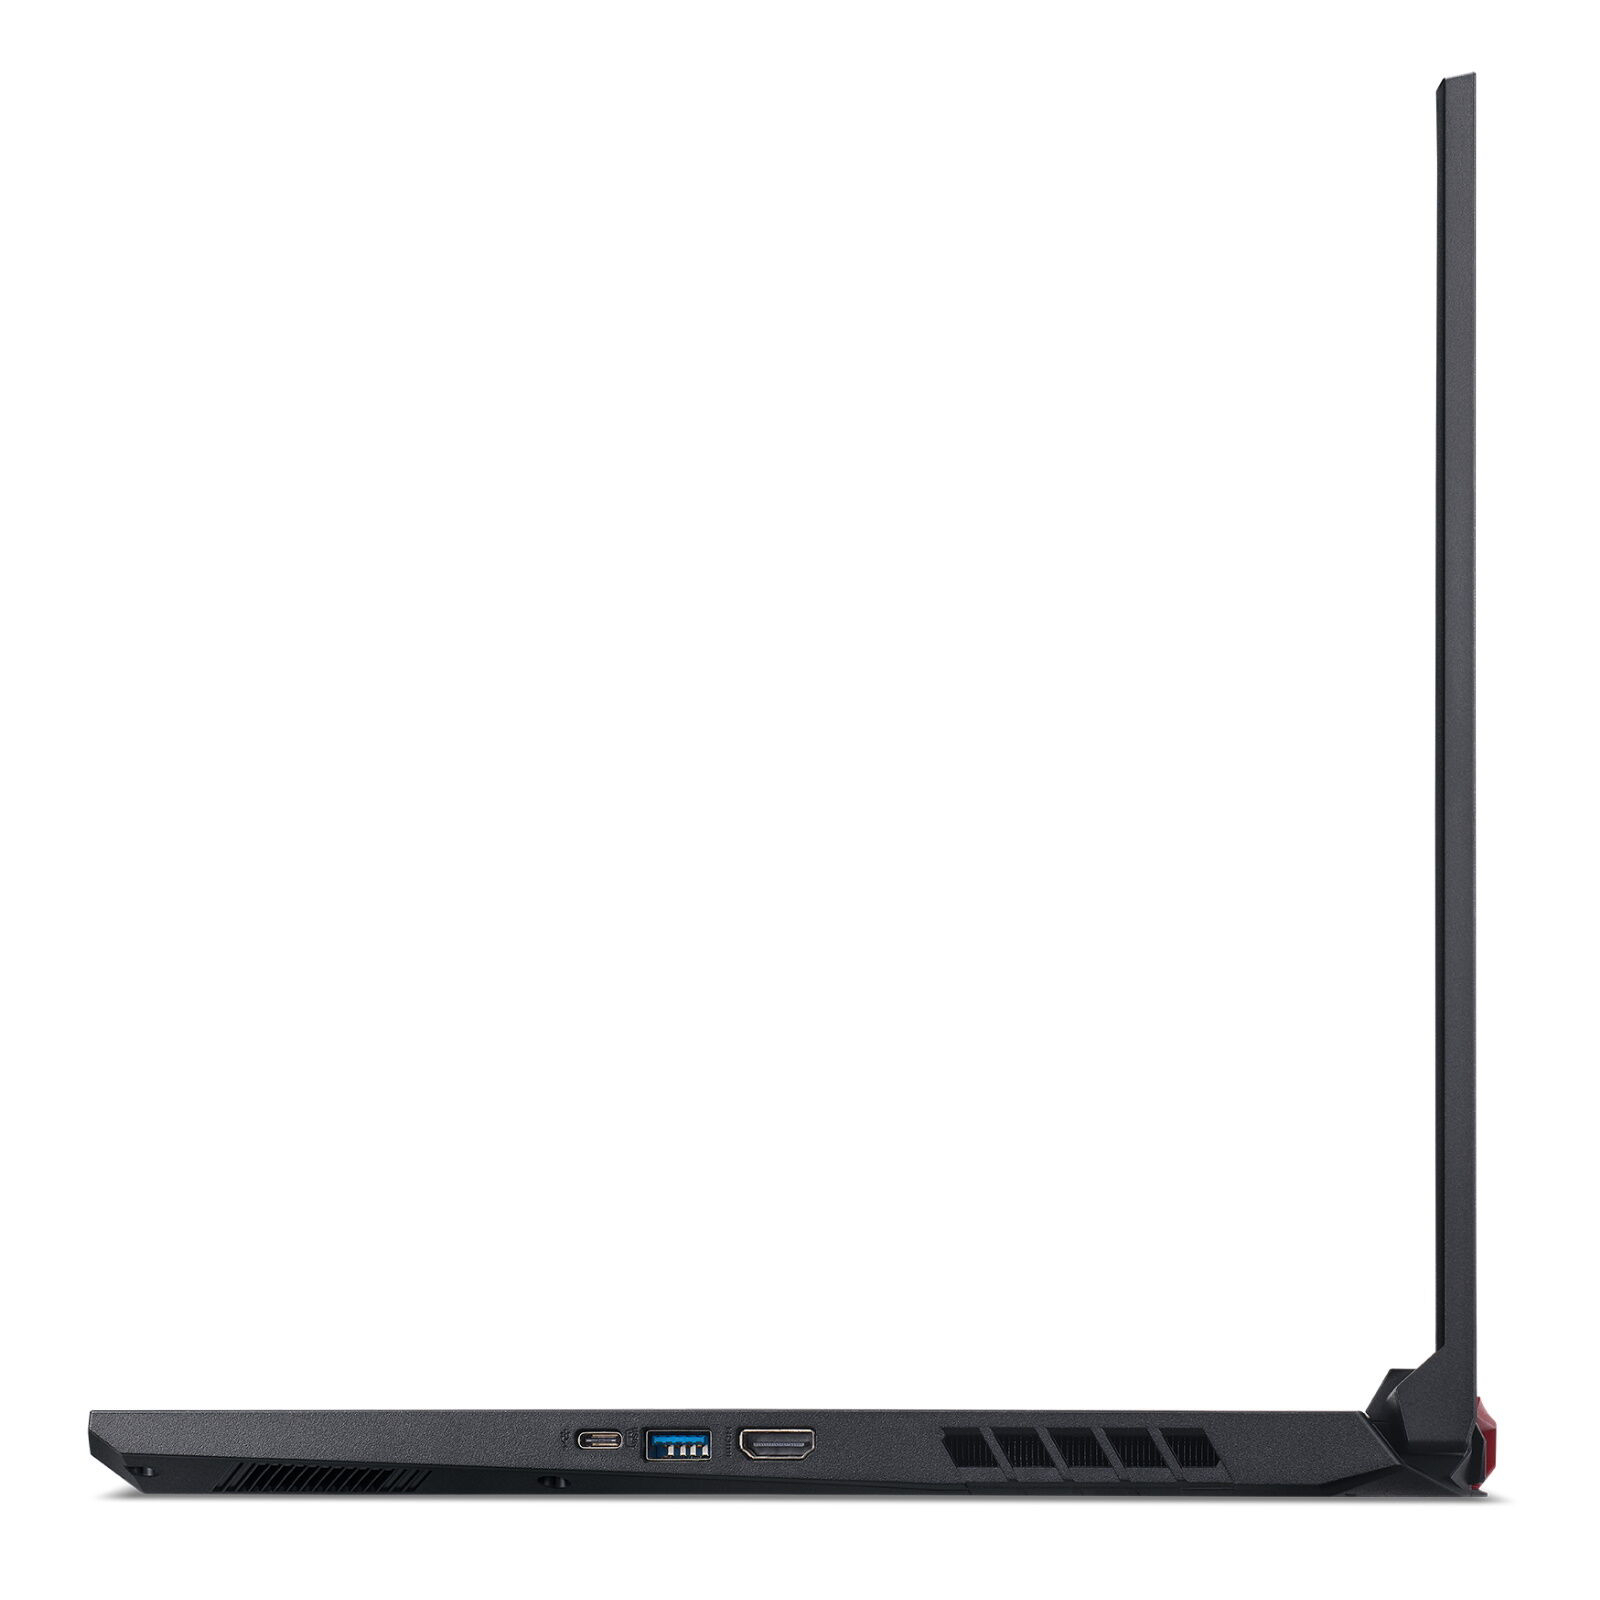
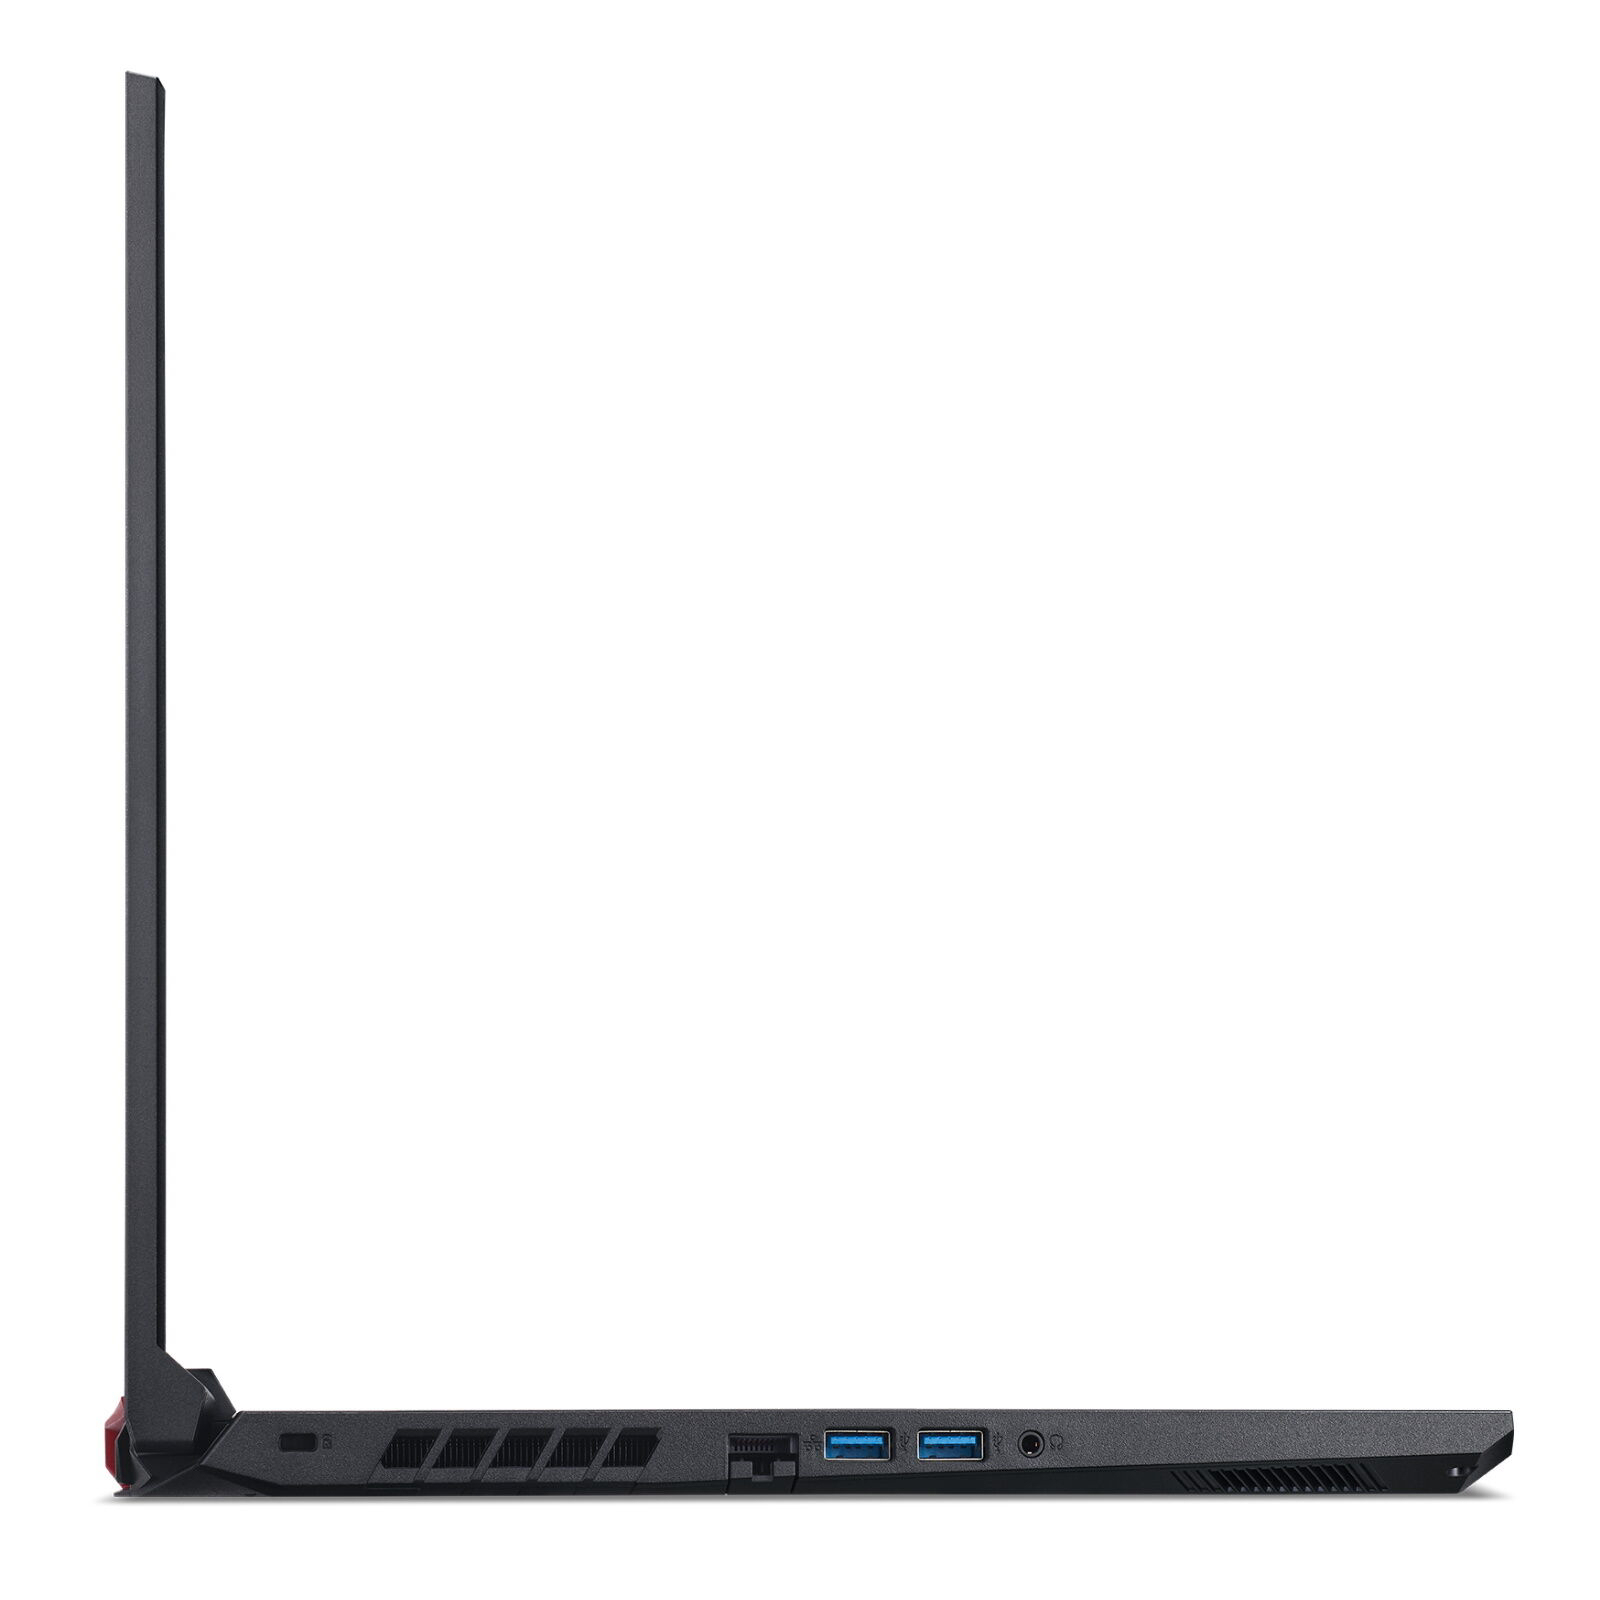
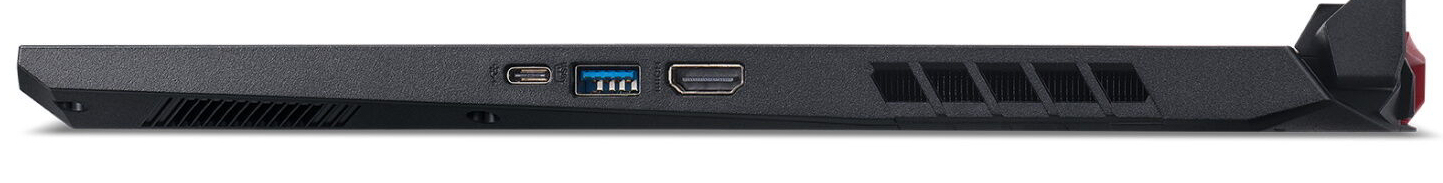
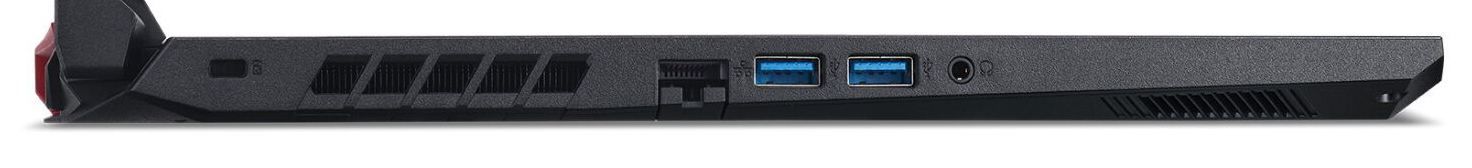
Datorn kommer med de flesta vanliga portarna. Du letar däremot förgäves om du vill hitta en Thunderbolt 3-port. Det finns bara en USB Typ C 3.2 Gen 2-port och den saknar stöd för DisplayPort genom USB-C. Det inbyggda tangentbordet (med RGB-belysning) visade sig lämplig för vardagsbruk. Dessutom är batteritiden mer än okej för en spellaptop på 17.3 tum.
För tillfället kostar den 15.000 kronor och framstår därför inte direkt som ett kap. Men den har ändå ett bra pris i förhållande till sin prestanda.
Acer Nitro 5 AN517-52-77DS
- 06/18/2020 v7 (old)
Sascha Mölck
Price comparison
