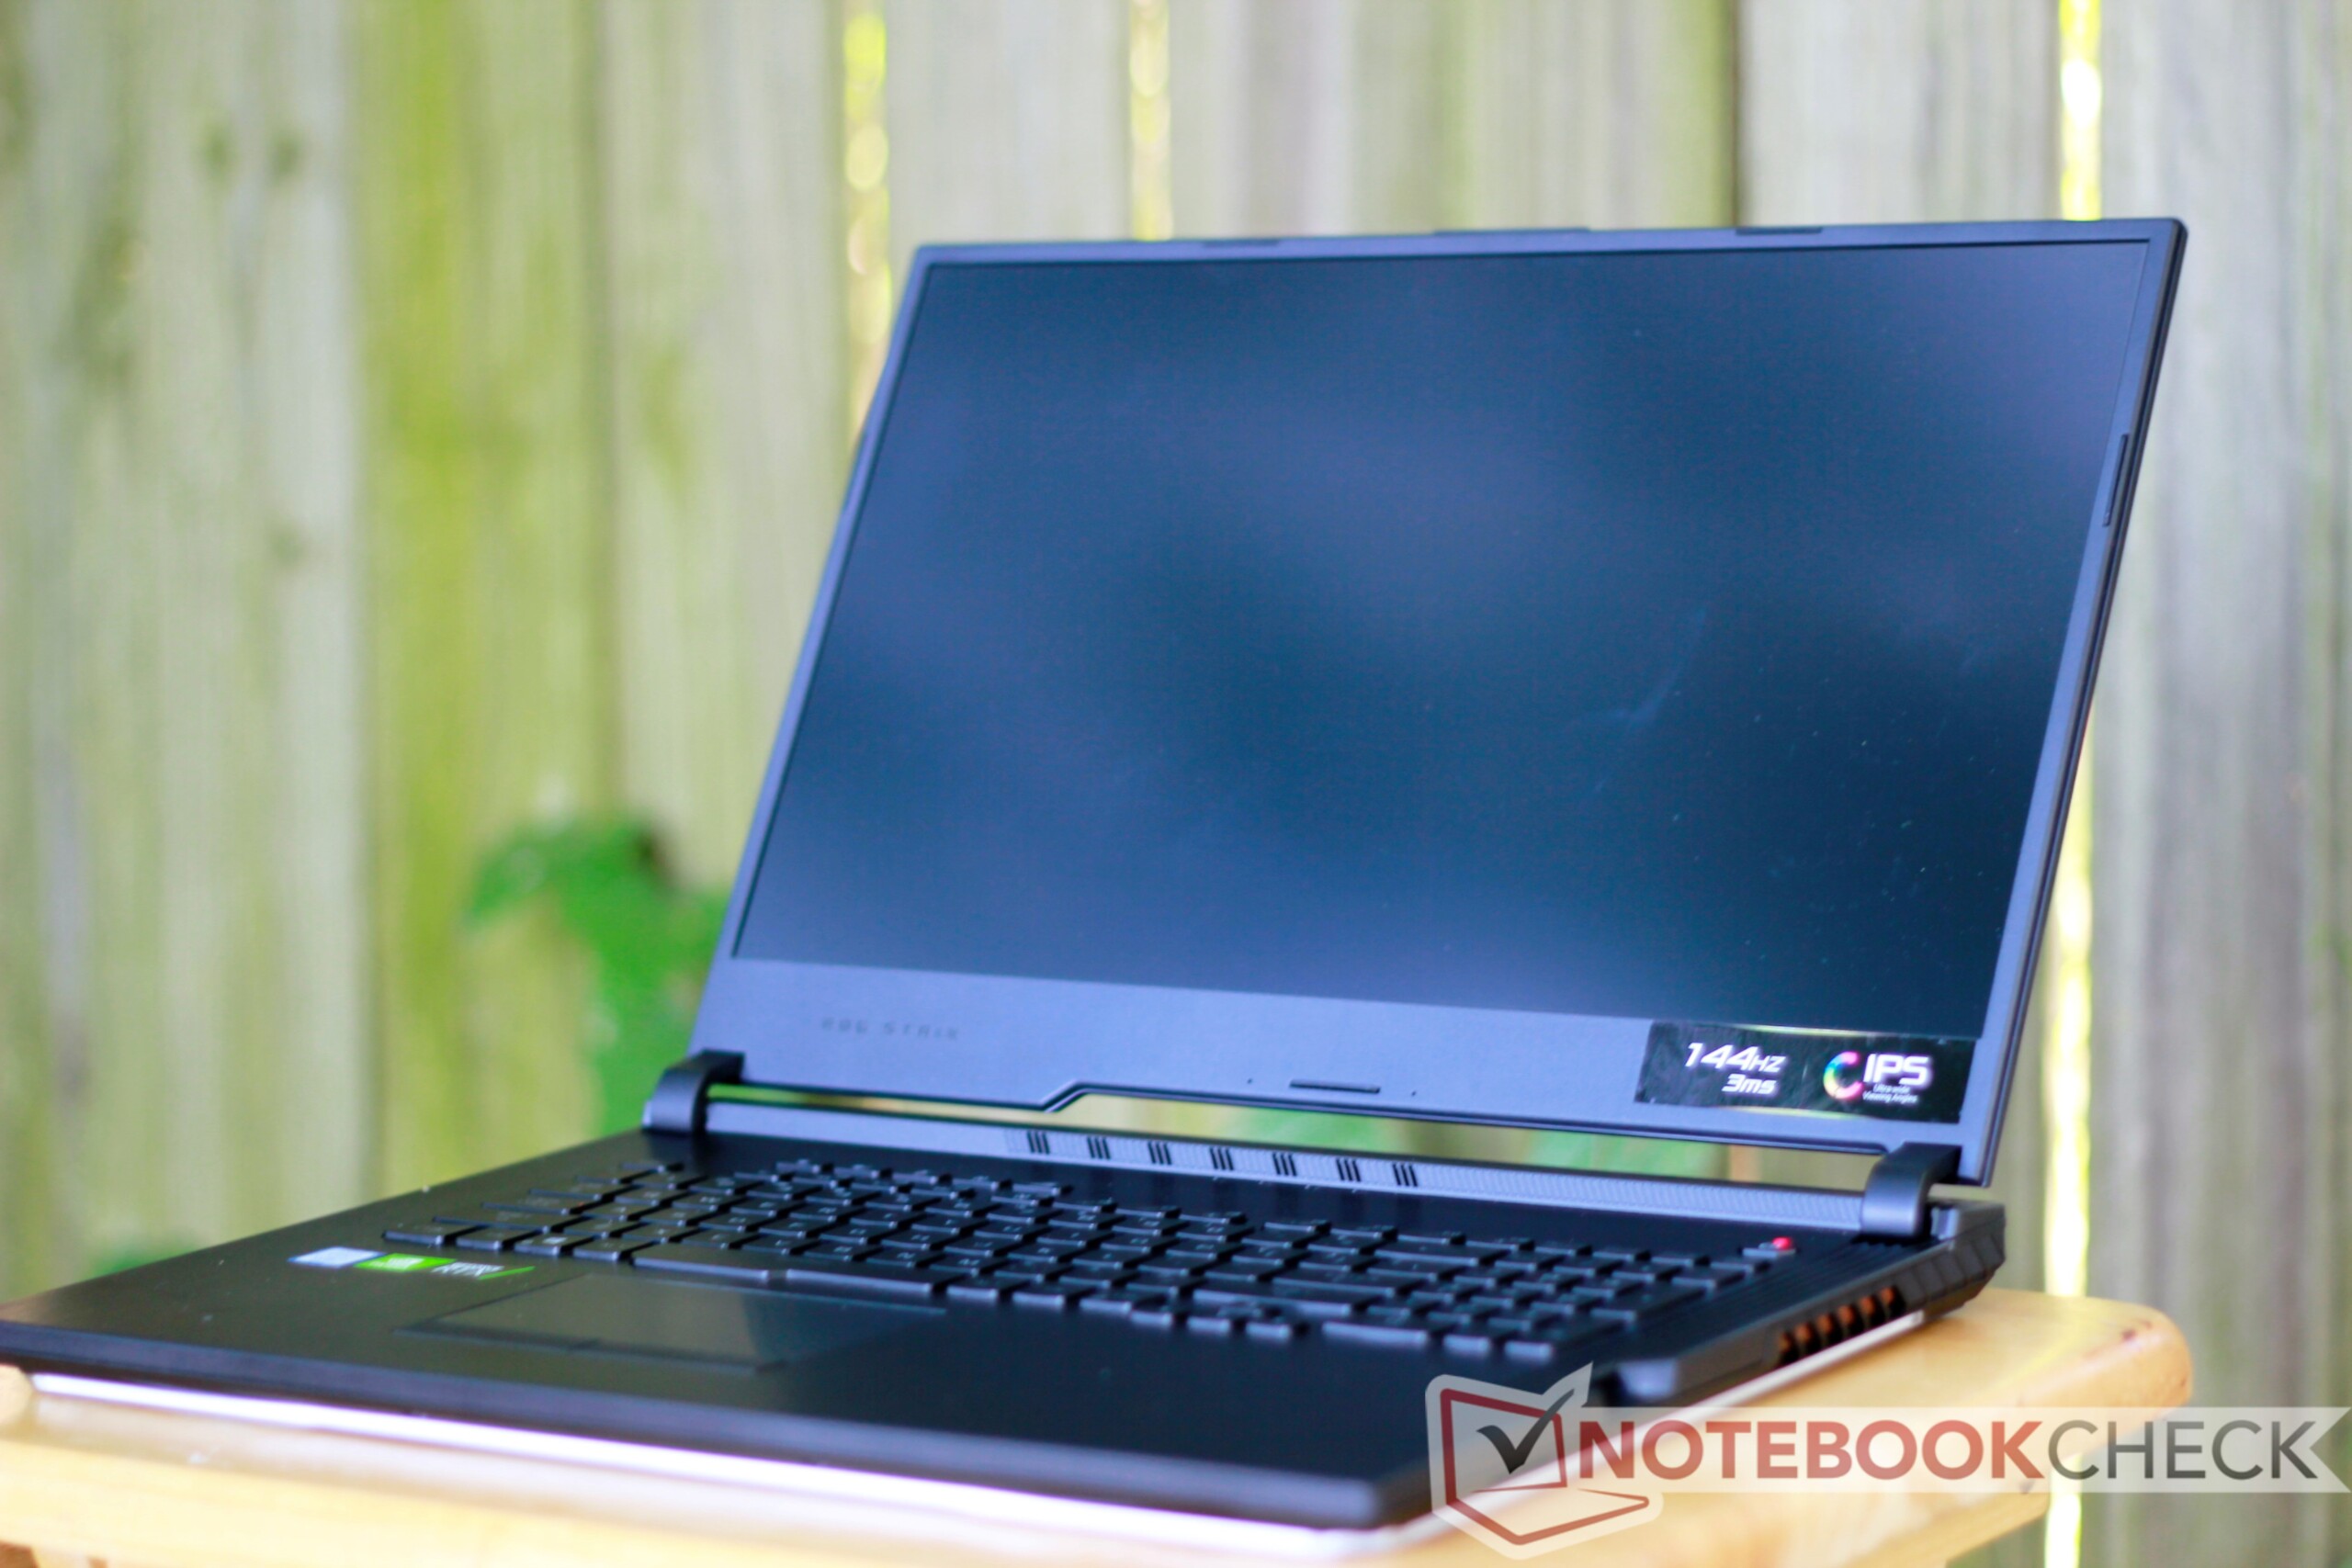
Test: Asus ROG Strix Hero III G731GW - En färgglad laptop med kompromisser

| |||||||||||||||||||||||||
Distribution av ljusstyrkan: 80 %
Mitt på batteriet: 297.4 cd/m²
Kontrast: 959:1 (Svärta: 0.31 cd/m²)
ΔE ColorChecker Calman: 4.08 | ∀{0.5-29.43 Ø4.73}
calibrated: 4
ΔE Greyscale Calman: 4 | ∀{0.09-98 Ø4.97}
86% sRGB (Argyll 1.6.3 3D)
56% AdobeRGB 1998 (Argyll 1.6.3 3D)
62.9% AdobeRGB 1998 (Argyll 3D)
86.3% sRGB (Argyll 3D)
61.9% Display P3 (Argyll 3D)
Gamma: 2.259
CCT: 7205 K
| Asus ASUS ROG Strix SCAR III G731GW-XB74 AU Optronics AUO409D, IPS, 17.3", 1920x1080 | Acer Predator Triton 500 AU Optronics B156HAN08.2 (AUO82ED), IPS, 15.6", 1920x1080 | Alienware m17 P37E AU Optronics B173ZAN01.0, IPS, 17.3", 3840x2160 | HP Omen 15-dc1303ng LG Philips LGD05C0, IPS, 15.6", 1920x1080 | Aorus 15 X9 LG Philips LP156WFG-SPB2, IPS, 15.6", 1920x1080 | MSI GE75 8SF Chi Mei N173HCE-G33, IPS, 17.3", 1920x1080 | Eurocom Nightsky RX17 BOE NV173FHM-N44, IPS, 17.3", 1920x1080 | |
|---|---|---|---|---|---|---|---|
| Display | 5% | 38% | 5% | 7% | 5% | 7% | |
| Display P3 Coverage (%) | 61.9 | 64.2 4% | 86.4 40% | 63.8 3% | 64.9 5% | 63.1 2% | 66.1 7% |
| sRGB Coverage (%) | 86.3 | 92.6 7% | 99.9 16% | 93.4 8% | 95.6 11% | 94.4 9% | 93.1 8% |
| AdobeRGB 1998 Coverage (%) | 62.9 | 65.7 4% | 99.1 58% | 65 3% | 66.3 5% | 65.2 4% | 67.2 7% |
| Response Times | -4% | -268% | -45% | -59% | -12% | -59% | |
| Response Time Grey 50% / Grey 80% * (ms) | 7.2 ? | 8 ? -11% | 35.6 ? -394% | 14 ? -94% | 15.2 ? -111% | 9.6 ? -33% | 16.4 ? -128% |
| Response Time Black / White * (ms) | 11.6 ? | 11.2 ? 3% | 28 ? -141% | 11 ? 5% | 12.4 ? -7% | 10.4 ? 10% | 10.4 ? 10% |
| PWM Frequency (Hz) | 25770 ? | 990 ? | |||||
| Screen | 2% | -4% | 11% | 15% | 33% | 9% | |
| Brightness middle (cd/m²) | 297.4 | 304 2% | 357.9 20% | 316 6% | 305.1 3% | 370.4 25% | 298.4 0% |
| Brightness (cd/m²) | 306 | 299 -2% | 347 13% | 295 -4% | 295 -4% | 348 14% | 287 -6% |
| Brightness Distribution (%) | 80 | 89 11% | 94 18% | 84 5% | 78 -2% | 89 11% | 90 13% |
| Black Level * (cd/m²) | 0.31 | 0.27 13% | 0.33 -6% | 0.42 -35% | 0.33 -6% | 0.29 6% | 0.3 3% |
| Contrast (:1) | 959 | 1126 17% | 1085 13% | 752 -22% | 925 -4% | 1277 33% | 995 4% |
| Colorchecker dE 2000 * | 4.08 | 4.66 -14% | 6.57 -61% | 2.7 34% | 2.58 37% | 1.26 69% | 3.58 12% |
| Colorchecker dE 2000 max. * | 6.88 | 9.65 -40% | 9.86 -43% | 5.65 18% | 4.32 37% | 3.02 56% | 6.29 9% |
| Colorchecker dE 2000 calibrated * | 4 | 1.72 57% | 6.74 -69% | 1.58 60% | 1.33 67% | 1.21 70% | 2.82 29% |
| Greyscale dE 2000 * | 4 | 5.53 -38% | 4.3 -8% | 2.35 41% | 3.4 15% | 1.4 65% | 3.1 22% |
| Gamma | 2.259 97% | 2.5 88% | 2.6 85% | 2.41 91% | 2.28 96% | 2.2 100% | 2.24 98% |
| CCT | 7205 90% | 8028 81% | 6403 102% | 6904 94% | 6374 102% | 6747 96% | 7064 92% |
| Color Space (Percent of AdobeRGB 1998) (%) | 56 | 60 7% | 88.4 58% | 60 7% | 60.7 8% | 59.7 7% | 60.2 8% |
| Color Space (Percent of sRGB) (%) | 86 | 93 8% | 100 16% | 93 8% | 95.2 11% | 94.4 10% | 92.7 8% |
| Totalt genomsnitt (program/inställningar) | 1% /
2% | -78% /
-29% | -10% /
3% | -12% /
4% | 9% /
22% | -14% /
0% |
* ... mindre är bättre
Visa svarstider
| ↔ Svarstid svart till vitt | ||
|---|---|---|
| 11.6 ms ... stiga ↗ och falla ↘ kombinerat | ↗ 6.4 ms stiga | 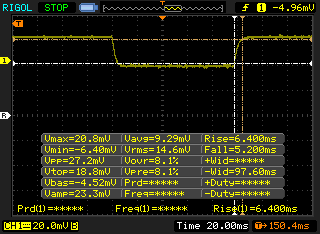 |
| ↘ 5.2 ms hösten | ||
| Skärmen visar bra svarsfrekvens i våra tester, men kan vara för långsam för konkurrenskraftiga spelare. I jämförelse sträcker sig alla testade enheter från 0.1 (minst) till 240 (maximalt) ms. » 31 % av alla enheter är bättre. Det betyder att den uppmätta svarstiden är bättre än genomsnittet av alla testade enheter (19.9 ms). | ||
| ↔ Svarstid 50 % grått till 80 % grått | ||
| 7.2 ms ... stiga ↗ och falla ↘ kombinerat | ↗ 3.6 ms stiga | 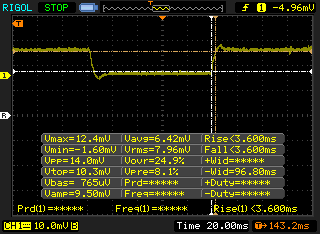 |
| ↘ 3.6 ms hösten | ||
| Skärmen visar väldigt snabba svarsfrekvenser i våra tester och borde vara mycket väl lämpad för fartfyllt spel. I jämförelse sträcker sig alla testade enheter från 0.165 (minst) till 636 (maximalt) ms. » 20 % av alla enheter är bättre. Det betyder att den uppmätta svarstiden är bättre än genomsnittet av alla testade enheter (31.1 ms). | ||
Skärmflimmer / PWM (Puls-Width Modulation)
| Skärmflimmer / PWM upptäcktes inte | 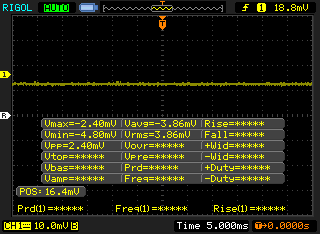 | ||
Som jämförelse: 52 % av alla testade enheter använder inte PWM för att dämpa skärmen. Om PWM upptäcktes mättes ett medelvärde av 7798 (minst: 5 - maximum: 343500) Hz. | |||
| Cinebench R10 | |
| Rendering Multiple CPUs 32Bit | |
| Genomsnitt av klass Gaming (42932 - 81339, n=8, senaste 2 åren) | |
| Dell G5 15 5590 | |
| Genomsnitt Intel Core i7-9750H (28251 - 36304, n=13) | |
| Asus TUF FX705DY-AU072 | |
| Rendering Single 32Bit | |
| Genomsnitt av klass Gaming (7457 - 11779, n=8, senaste 2 åren) | |
| Asus TUF FX705DY-AU072 | |
| Genomsnitt Intel Core i7-9750H (6659 - 7214, n=13) | |
| Dell G5 15 5590 | |
| PCMark 8 Home Score Accelerated v2 | 4460 poäng | |
| PCMark 8 Work Score Accelerated v2 | 5764 poäng | |
| PCMark 10 Score | 5834 poäng | |
Hjälp | ||
| Asus ASUS ROG Strix SCAR III G731GW-XB74 Intel SSD 660p 1TB SSDPEKNW010T8 | Acer Predator Triton 500 2x WDC PC SN720 SDAPNTW-256G-1014 (RAID 0) | Alienware m17 P37E SK Hynix PC401 512GB M.2 (HFS512GD9TNG) | HP Omen 15-dc1303ng Samsung SSD PM981 MZVLB256HAHQ | Aorus 15 X9 Intel SSD 760p SSDPEKKW512G8 | MSI GE75 8SF Kingston RBUSNS8154P3256GJ1 | Eurocom Nightsky RX17 2x Samsung SSD 970 Pro 512GB (RAID 0) | Genomsnitt Intel SSD 660p 1TB SSDPEKNW010T8 | |
|---|---|---|---|---|---|---|---|---|
| AS SSD | 67% | 1% | 48% | 23% | -27% | 67% | 9% | |
| Seq Read (MB/s) | 1427 | 2913 104% | 1835 29% | 2485 74% | 1912 34% | 949 -33% | 2297 61% | 1456 ? 2% |
| Seq Write (MB/s) | 1610 | 2492 55% | 1121 -30% | 1575 -2% | 1553 -4% | 823 -49% | 2860 78% | 1404 ? -13% |
| 4K Read (MB/s) | 25.63 | 38.7 51% | 23.98 -6% | 53.4 108% | 56.5 120% | 25.36 -1% | 52.2 104% | 48.7 ? 90% |
| 4K Write (MB/s) | 84.2 | 107.2 27% | 100 19% | 113.5 35% | 119.6 42% | 67.1 -20% | 125.8 49% | 131.6 ? 56% |
| 4K-64 Read (MB/s) | 588 | 1228 109% | 687 17% | 725 23% | 869 48% | 748 27% | 1412 140% | 586 ? 0% |
| 4K-64 Write (MB/s) | 732 | 1079 47% | 776 6% | 1371 87% | 584 -20% | 650 -11% | 1228 68% | 788 ? 8% |
| Access Time Read * (ms) | 0.054 | 0.047 13% | 0.059 -9% | 0.049 9% | 0.173 -220% | 0.04 26% | 0.07236 ? -34% | |
| Access Time Write * (ms) | 0.071 | 0.035 51% | 0.053 25% | 0.032 55% | 0.031 56% | 0.059 17% | 0.09 -27% | 0.07731 ? -9% |
| Score Read (Points) | 756 | 1558 106% | 895 18% | 1027 36% | 1116 48% | 869 15% | 1694 124% | 780 ? 3% |
| Score Write (Points) | 978 | 1435 47% | 988 1% | 1642 68% | 859 -12% | 799 -18% | 1640 68% | 1060 ? 8% |
| Score Total (Points) | 2134 | 3770 77% | 2306 8% | 3163 48% | 2544 19% | 2109 -1% | 4235 98% | 2252 ? 6% |
| Copy ISO MB/s (MB/s) | 1489 | 773 -48% | 1329 -11% | 1121 -25% | 2514 69% | 1469 ? -1% | ||
| Copy Program MB/s (MB/s) | 514 | 493 -4% | 404.3 -21% | 532 4% | 592 15% | 484 ? -6% | ||
| Copy Game MB/s (MB/s) | 893 | 647 -28% | 1071 20% | 380.5 -57% | 1494 67% | 997 ? 12% | ||
| CrystalDiskMark 5.2 / 6 | 3% | -6% | -6% | 16% | -39% | 38% | -4% | |
| Write 4K (MB/s) | 130.1 | 93.6 -28% | 120.2 -8% | 50.2 -61% | 147.2 13% | 73.3 -44% | 133 2% | 144.5 ? 11% |
| Read 4K (MB/s) | 56 | 38.82 -31% | 44.3 -21% | 35.32 -37% | 63.7 14% | 33.35 -40% | 61.6 10% | 54.1 ? -3% |
| Write Seq (MB/s) | 2455 | 1278 | 991 | 1573 | 849 | 2935 | 1445 ? | |
| Read Seq (MB/s) | 2107 | 1389 | 1526 | 2602 | 964 | 3118 | 1446 ? | |
| Write 4K Q32T1 (MB/s) | 465.7 | 298.7 -36% | 436.2 -6% | 445.1 -4% | 531 14% | 236.2 -49% | 571 23% | 427 ? -8% |
| Read 4K Q32T1 (MB/s) | 547 | 338.7 -38% | 515 -6% | 526 -4% | 598 9% | 384.7 -30% | 654 20% | 456 ? -17% |
| Write Seq Q32T1 (MB/s) | 1766 | 2902 64% | 1157 -34% | 1647 -7% | 1592 -10% | 867 -51% | 3296 87% | 1650 ? -7% |
| Read Seq Q32T1 (MB/s) | 1922 | 3536 84% | 2671 39% | 3427 78% | 2981 55% | 1586 -17% | 3560 85% | 1728 ? -10% |
| Write 4K Q8T8 (MB/s) | 860 | 880 ? 2% | ||||||
| Read 4K Q8T8 (MB/s) | 628 | 629 ? 0% | ||||||
| Totalt genomsnitt (program/inställningar) | 35% /
43% | -3% /
-1% | 21% /
29% | 20% /
21% | -33% /
-30% | 53% /
58% | 3% /
4% |
* ... mindre är bättre

| 3DMark 11 | |
| 1280x720 Performance GPU | |
| Genomsnitt av klass Gaming (21841 - 80022, n=108, senaste 2 åren) | |
| Razer Blade Pro 17 RTX 2080 Max-Q | |
| Genomsnitt NVIDIA GeForce RTX 2070 Mobile (23335 - 27298, n=21) | |
| Asus ASUS ROG Strix SCAR III G731GW-XB74 | |
| MSI WS75 9TL-636 | |
| Medion Erazer X15805 | |
| MSI GE65 Raider 9SE | |
| Asus ROG Strix G GL731GU-RB74 | |
| Apple MacBook Pro 15 2018 (2.9 GHz, Vega 20) | |
| Asus TUF FX705DY-AU072 | |
| 1280x720 Performance Combined | |
| Genomsnitt av klass Gaming (10258 - 30851, n=108, senaste 2 åren) | |
| MSI WS75 9TL-636 | |
| Asus ROG Strix G GL731GU-RB74 | |
| Medion Erazer X15805 | |
| Genomsnitt NVIDIA GeForce RTX 2070 Mobile (8716 - 16364, n=21) | |
| Razer Blade Pro 17 RTX 2080 Max-Q | |
| MSI GE65 Raider 9SE | |
| Asus ASUS ROG Strix SCAR III G731GW-XB74 | |
| Apple MacBook Pro 15 2018 (2.9 GHz, Vega 20) | |
| Asus TUF FX705DY-AU072 | |
| 3DMark 11 Performance | 19495 poäng | |
| 3DMark Ice Storm Standard Score | 118130 poäng | |
| 3DMark Cloud Gate Standard Score | 34236 poäng | |
| 3DMark Fire Strike Score | 16924 poäng | |
| 3DMark Fire Strike Extreme Score | 8686 poäng | |
| 3DMark Time Spy Score | 7261 poäng | |
Hjälp | ||
| The Witcher 3 - 1920x1080 Ultra Graphics & Postprocessing (HBAO+) | |
| Genomsnitt av klass Gaming (95 - 240, n=8, senaste 2 åren) | |
| Acer Predator Triton 500 | |
| Alienware m17 P37E | |
| Genomsnitt NVIDIA GeForce RTX 2070 Mobile (64 - 82.1, n=21) | |
| Eurocom Nightsky RX17 | |
| Aorus 15 X9 | |
| MSI GE75 8SF | |
| Asus ASUS ROG Strix SCAR III G731GW-XB74 | |
| låg | med. | hög | ultra | |
|---|---|---|---|---|
| The Witcher 3 (2015) | 64 | |||
| Fortnite (2018) | 236 | 190 | 140 | 132 |
| Final Fantasy XV Benchmark (2018) | 158 | 100 | 77 | |
| Shadow of the Tomb Raider (2018) | 105 | 97 | 93 | 85 |
| F1 2019 (2019) | 198 | 168 | 139 | 95 |
| Asus ASUS ROG Strix SCAR III G731GW-XB74 GeForce RTX 2070 Mobile, i7-9750H, Intel SSD 660p 1TB SSDPEKNW010T8 | Acer Predator Triton 500 GeForce RTX 2080 Max-Q, i7-8750H, 2x WDC PC SN720 SDAPNTW-256G-1014 (RAID 0) | Alienware m17 P37E GeForce RTX 2080 Max-Q, i9-8950HK, SK Hynix PC401 512GB M.2 (HFS512GD9TNG) | HP Omen 15-dc1303ng GeForce RTX 2070 Max-Q, i7-8750H, Samsung SSD PM981 MZVLB256HAHQ | Aorus 15 X9 GeForce RTX 2070 Mobile, i7-8750H, Intel SSD 760p SSDPEKKW512G8 | MSI GE75 8SF GeForce RTX 2070 Mobile, i7-8750H, Kingston RBUSNS8154P3256GJ1 | Eurocom Nightsky RX17 GeForce RTX 2070 Mobile, i7-9750H, 2x Samsung SSD 970 Pro 512GB (RAID 0) | |
|---|---|---|---|---|---|---|---|
| Noise | 2% | 2% | -3% | -4% | -3% | 2% | |
| av / miljö * (dB) | 28.2 | 29 -3% | 28.2 -0% | 30.5 -8% | 28.2 -0% | 28.3 -0% | 28 1% |
| Idle Minimum * (dB) | 28.2 | 30 -6% | 28.2 -0% | 32.8 -16% | 32.6 -16% | 33.5 -19% | 28 1% |
| Idle Average * (dB) | 28.5 | 32 -12% | 28.2 1% | 32.8 -15% | 32.7 -15% | 33.6 -18% | 28.4 -0% |
| Idle Maximum * (dB) | 30 | 34 -13% | 31 -3% | 32.8 -9% | 32.7 -9% | 35 -17% | 32.9 -10% |
| Load Average * (dB) | 51.5 | 44 15% | 50.8 1% | 42.5 17% | 38.9 24% | 38 26% | 45 13% |
| Witcher 3 ultra * (dB) | 55.3 | 46 17% | 50.8 8% | 51.8 6% | 50 10% | 53.2 4% | |
| Load Maximum * (dB) | 55.3 | 47 15% | 50.8 8% | 47.5 14% | 64.1 -16% | 56.9 -3% | 53.2 4% |
* ... mindre är bättre
Ljudnivå
| Låg belastning |
| 28.2 / 28.5 / 30 dB(A) |
| Hög belastning |
| 51.5 / 55.3 dB(A) |
 | ||
30 dB tyst 40 dB(A) hörbar 50 dB(A) högt ljud |
||
min: | ||
(-) Den maximala temperaturen på ovansidan är 45.2 °C / 113 F, jämfört med genomsnittet av 40.4 °C / 105 F , allt från 21.2 till 68.8 °C för klassen Gaming.
(-) Botten värms upp till maximalt 52 °C / 126 F, jämfört med genomsnittet av 43.2 °C / 110 F
(+) Vid tomgångsbruk är medeltemperaturen för ovansidan 29.1 °C / 84 F, jämfört med enhetsgenomsnittet på 33.9 °C / ### class_avg_f### F.
(±) När du spelar The Witcher 3 är medeltemperaturen för ovansidan 32.1 °C / 90 F, jämfört med enhetsgenomsnittet på 33.9 °C / ## #class_avg_f### F.
(+) Handledsstöden och pekplattan är kallare än hudtemperaturen med maximalt 26.8 °C / 80.2 F och är därför svala att ta på.
(±) Medeltemperaturen för handledsstödsområdet på liknande enheter var 28.8 °C / 83.8 F (+2 °C / 3.6 F).
MSI GE75 8SF ljudanalys
(+) | högtalare kan spela relativt högt (89.3 dB)
Bas 100 - 315 Hz
(±) | reducerad bas - i genomsnitt 13.7% lägre än medianen
(+) | basen är linjär (6.8% delta till föregående frekvens)
Mellan 400 - 2000 Hz
(±) | reducerade mids - i genomsnitt 5.1% lägre än median
(±) | linjäriteten för mids är genomsnittlig (7.4% delta till föregående frekvens)
Högsta 2 - 16 kHz
(+) | balanserade toppar - endast 3.3% från medianen
(+) | toppar är linjära (6.4% delta till föregående frekvens)
Totalt 100 - 16 000 Hz
(±) | linjäriteten för det totala ljudet är genomsnittlig (16.2% skillnad mot median)
Jämfört med samma klass
» 40% av alla testade enheter i den här klassen var bättre, 7% liknande, 54% sämre
» Den bästa hade ett delta på 6%, genomsnittet var 18%, sämst var 132%
Jämfört med alla testade enheter
» 26% av alla testade enheter var bättre, 6% liknande, 68% sämre
» Den bästa hade ett delta på 4%, genomsnittet var 24%, sämst var 134%
Alienware m17 P37E ljudanalys
(±) | högtalarljudstyrkan är genomsnittlig men bra (80.4 dB)
Bas 100 - 315 Hz
(±) | reducerad bas - i genomsnitt 11.4% lägre än medianen
(±) | linjäriteten för basen är genomsnittlig (12.4% delta till föregående frekvens)
Mellan 400 - 2000 Hz
(+) | balanserad mellan - endast 3% från medianen
(+) | mids är linjära (6.1% delta till föregående frekvens)
Högsta 2 - 16 kHz
(+) | balanserade toppar - endast 4.3% från medianen
(+) | toppar är linjära (5.2% delta till föregående frekvens)
Totalt 100 - 16 000 Hz
(+) | det totala ljudet är linjärt (13.8% skillnad mot median)
Jämfört med samma klass
» 21% av alla testade enheter i den här klassen var bättre, 7% liknande, 72% sämre
» Den bästa hade ett delta på 6%, genomsnittet var 18%, sämst var 132%
Jämfört med alla testade enheter
» 15% av alla testade enheter var bättre, 4% liknande, 81% sämre
» Den bästa hade ett delta på 4%, genomsnittet var 24%, sämst var 134%
| Av/Standby | |
| Låg belastning | |
| Hög belastning |
|
Förklaring:
min: | |
| Asus ASUS ROG Strix SCAR III G731GW-XB74 i7-9750H, GeForce RTX 2070 Mobile, Intel SSD 660p 1TB SSDPEKNW010T8, IPS, 1920x1080, 17.3" | Acer Predator Triton 500 i7-8750H, GeForce RTX 2080 Max-Q, 2x WDC PC SN720 SDAPNTW-256G-1014 (RAID 0), IPS, 1920x1080, 15.6" | Alienware m17 P37E i9-8950HK, GeForce RTX 2080 Max-Q, SK Hynix PC401 512GB M.2 (HFS512GD9TNG), IPS, 3840x2160, 17.3" | HP Omen 15-dc1303ng i7-8750H, GeForce RTX 2070 Max-Q, Samsung SSD PM981 MZVLB256HAHQ, IPS, 1920x1080, 15.6" | Aorus 15 X9 i7-8750H, GeForce RTX 2070 Mobile, Intel SSD 760p SSDPEKKW512G8, IPS, 1920x1080, 15.6" | MSI GE75 8SF i7-8750H, GeForce RTX 2070 Mobile, Kingston RBUSNS8154P3256GJ1, IPS, 1920x1080, 17.3" | Eurocom Nightsky RX17 i7-9750H, GeForce RTX 2070 Mobile, 2x Samsung SSD 970 Pro 512GB (RAID 0), IPS, 1920x1080, 17.3" | |
|---|---|---|---|---|---|---|---|
| Power Consumption | 17% | -6% | 30% | -7% | 11% | 11% | |
| Idle Minimum * (Watt) | 18.2 | 16 12% | 21.2 -16% | 14.7 19% | 26 -43% | 16.4 10% | 18.6 -2% |
| Idle Average * (Watt) | 23 | 22 4% | 29.6 -29% | 18.6 19% | 30.8 -34% | 21.9 5% | 22.6 2% |
| Idle Maximum * (Watt) | 33.1 | 32 3% | 34 -3% | 22.6 32% | 34.9 -5% | 25.4 23% | 23 31% |
| Load Average * (Watt) | 124.8 | 89 29% | 130.9 -5% | 90 28% | 90.7 27% | 90.7 27% | 93.4 25% |
| Witcher 3 ultra * (Watt) | 180.8 | 147 19% | 177.5 2% | 175 3% | 203.3 -12% | 186.4 -3% | |
| Load Maximum * (Watt) | 263 | 173 34% | 219.7 16% | 120 54% | 241.2 8% | 222.9 15% | 233.6 11% |
* ... mindre är bättre
| Asus ASUS ROG Strix SCAR III G731GW-XB74 i7-9750H, GeForce RTX 2070 Mobile, 66 Wh | Acer Predator Triton 500 i7-8750H, GeForce RTX 2080 Max-Q, 82 Wh | Alienware m17 P37E i9-8950HK, GeForce RTX 2080 Max-Q, 90 Wh | HP Omen 15-dc1303ng i7-8750H, GeForce RTX 2070 Max-Q, 70 Wh | Aorus 15 X9 i7-8750H, GeForce RTX 2070 Mobile, 62 Wh | MSI GE75 8SF i7-8750H, GeForce RTX 2070 Mobile, 65 Wh | Eurocom Nightsky RX17 i7-9750H, GeForce RTX 2070 Mobile, 62 Wh | |
|---|---|---|---|---|---|---|---|
| Batteridrifttid | 5% | 33% | -3% | -48% | -10% | -21% | |
| Reader / Idle (h) | 4.2 | 5.6 33% | 9.1 117% | 5 19% | 1.8 -57% | 4.2 0% | |
| WiFi v1.3 (h) | 3.9 | 3.2 -18% | 4.9 26% | 3.3 -15% | 1.6 -59% | 3.5 -10% | 2 -49% |
| Load (h) | 1.4 | 1.4 0% | 0.8 -43% | 1.2 -14% | 1 -29% | 1.2 -14% |
För
Emot

Läs den fullständiga versionen av den här recensionen på engelska här.
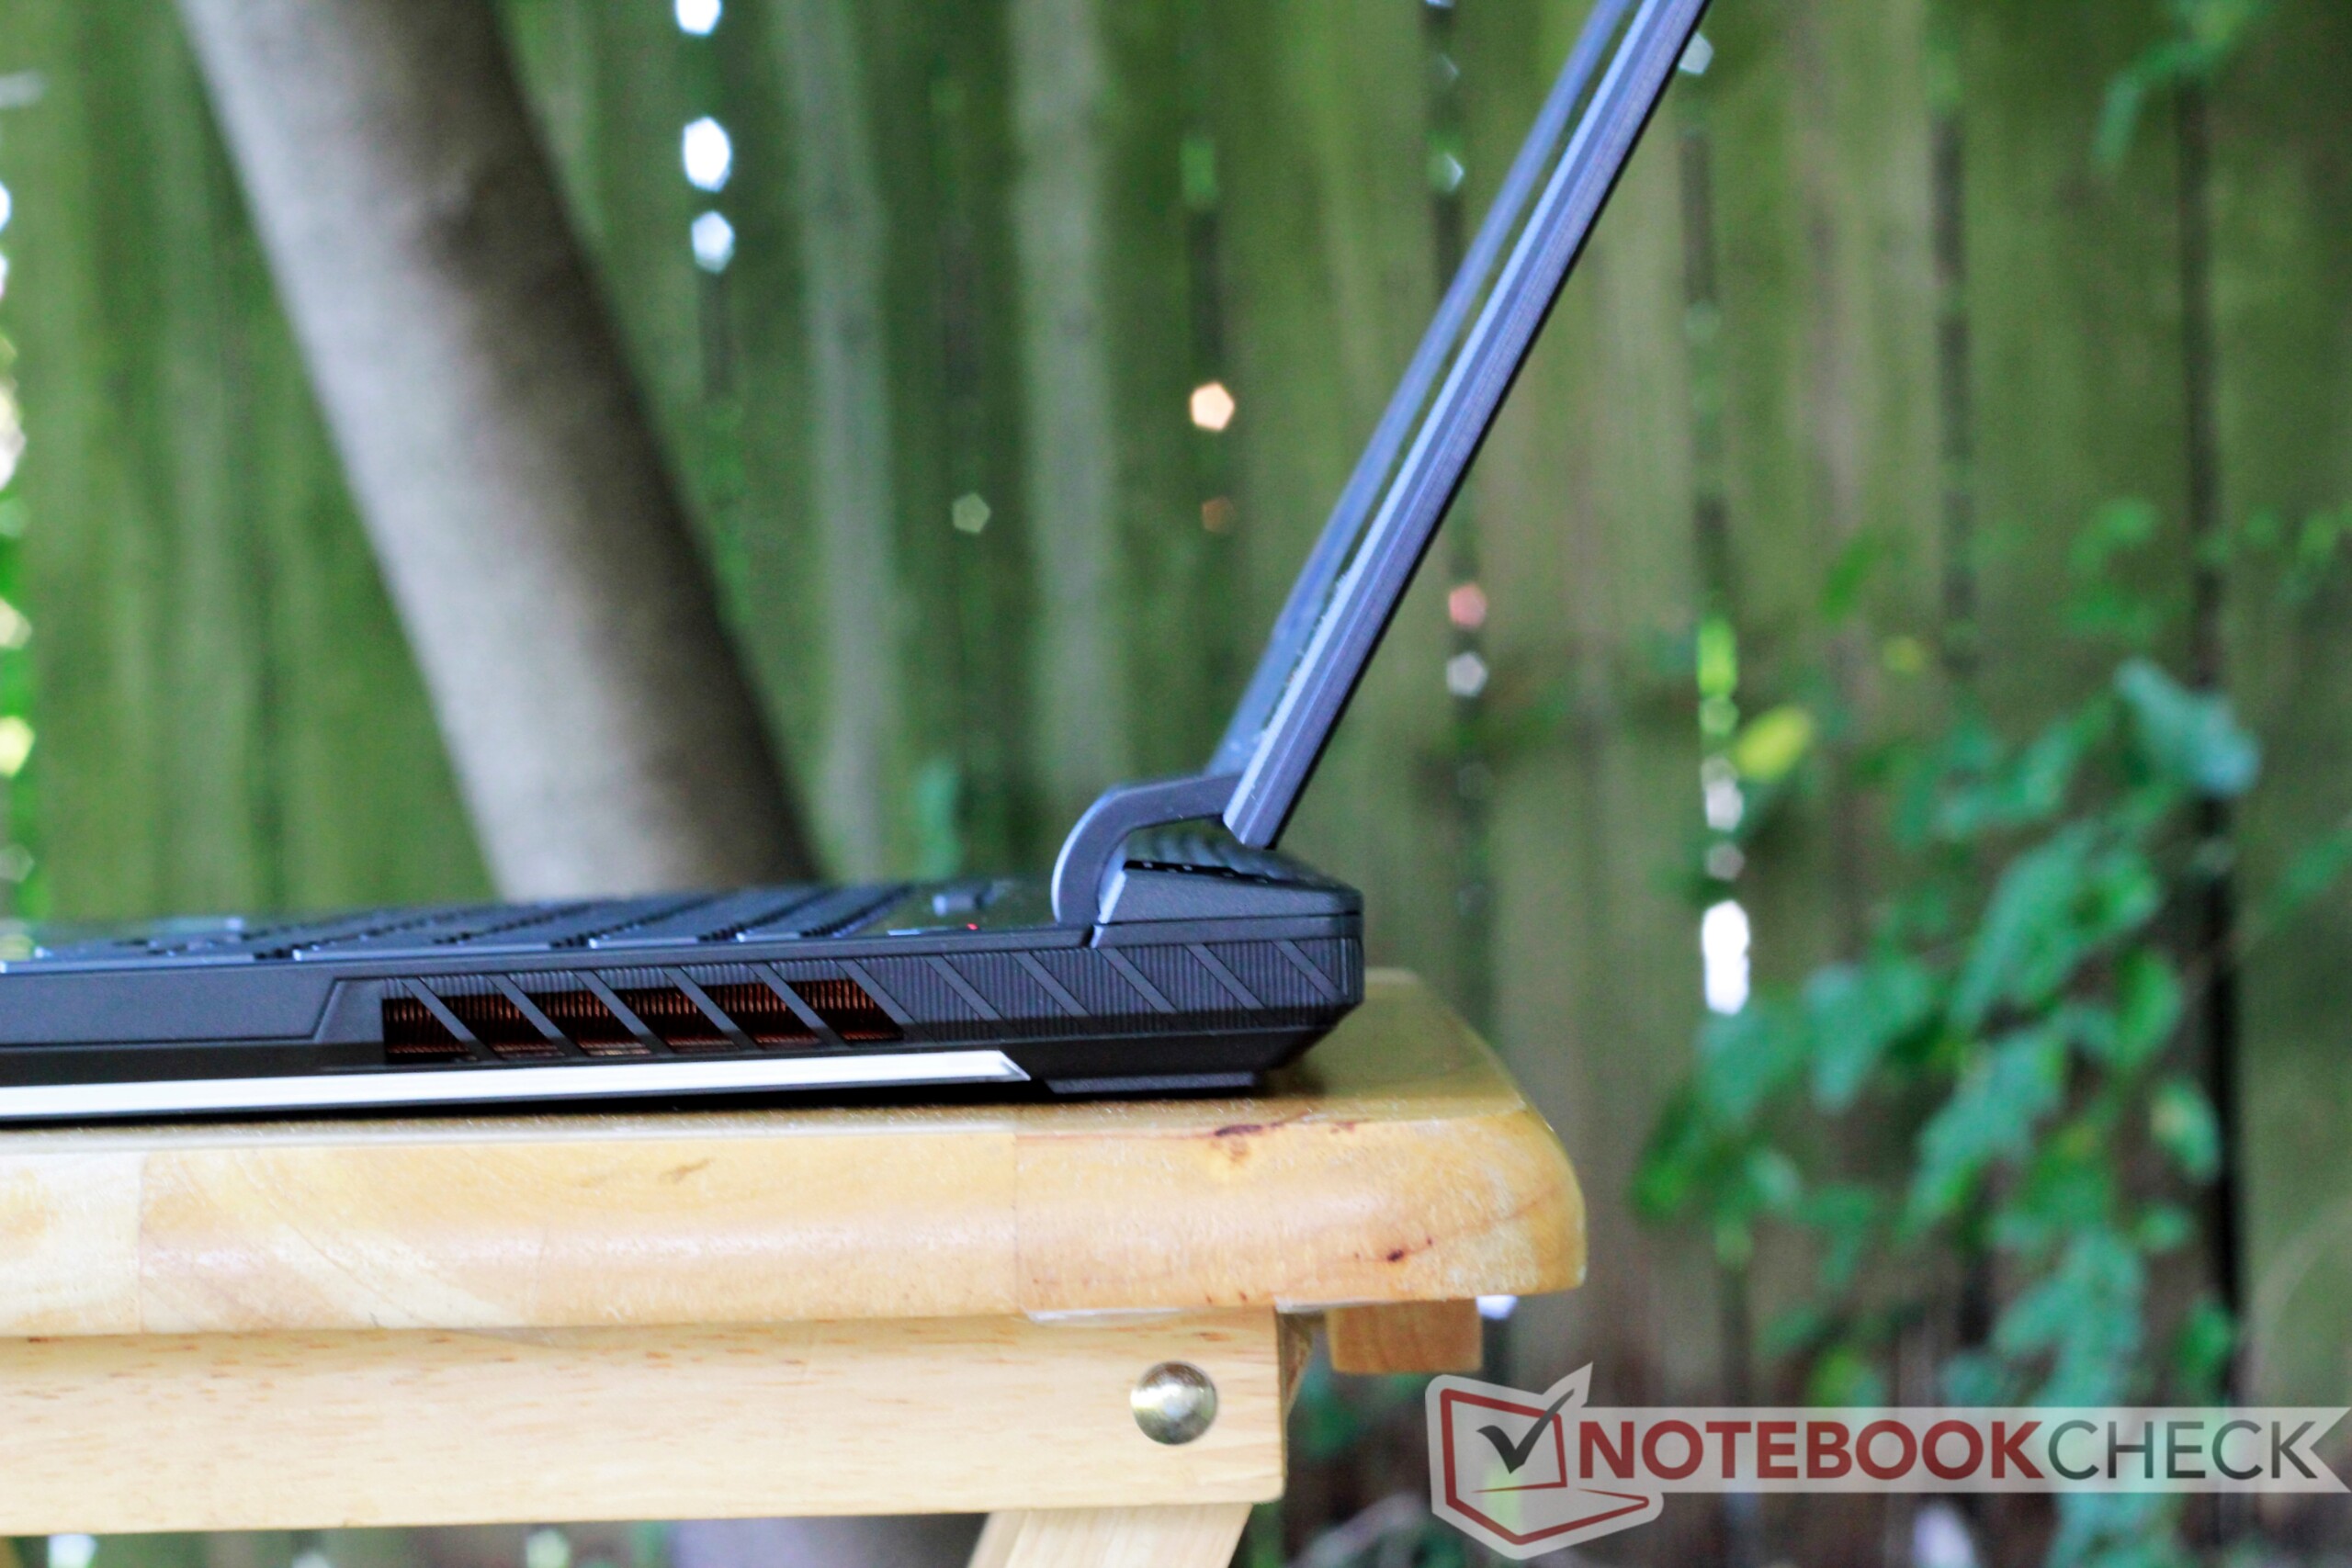
Det sägs att skönhet bara sitter på ytan. Asus har lagt till mycket stil till utsidan av G731GW men verkar ha glömt bort några av de faktorer som gör en spellaptop bra. I synnerhet lämnar den märkliga portplaceringen och den irriterande serviceprocessen en dålig smak i munnen till vad som i övrigt är en angenäm rätt.
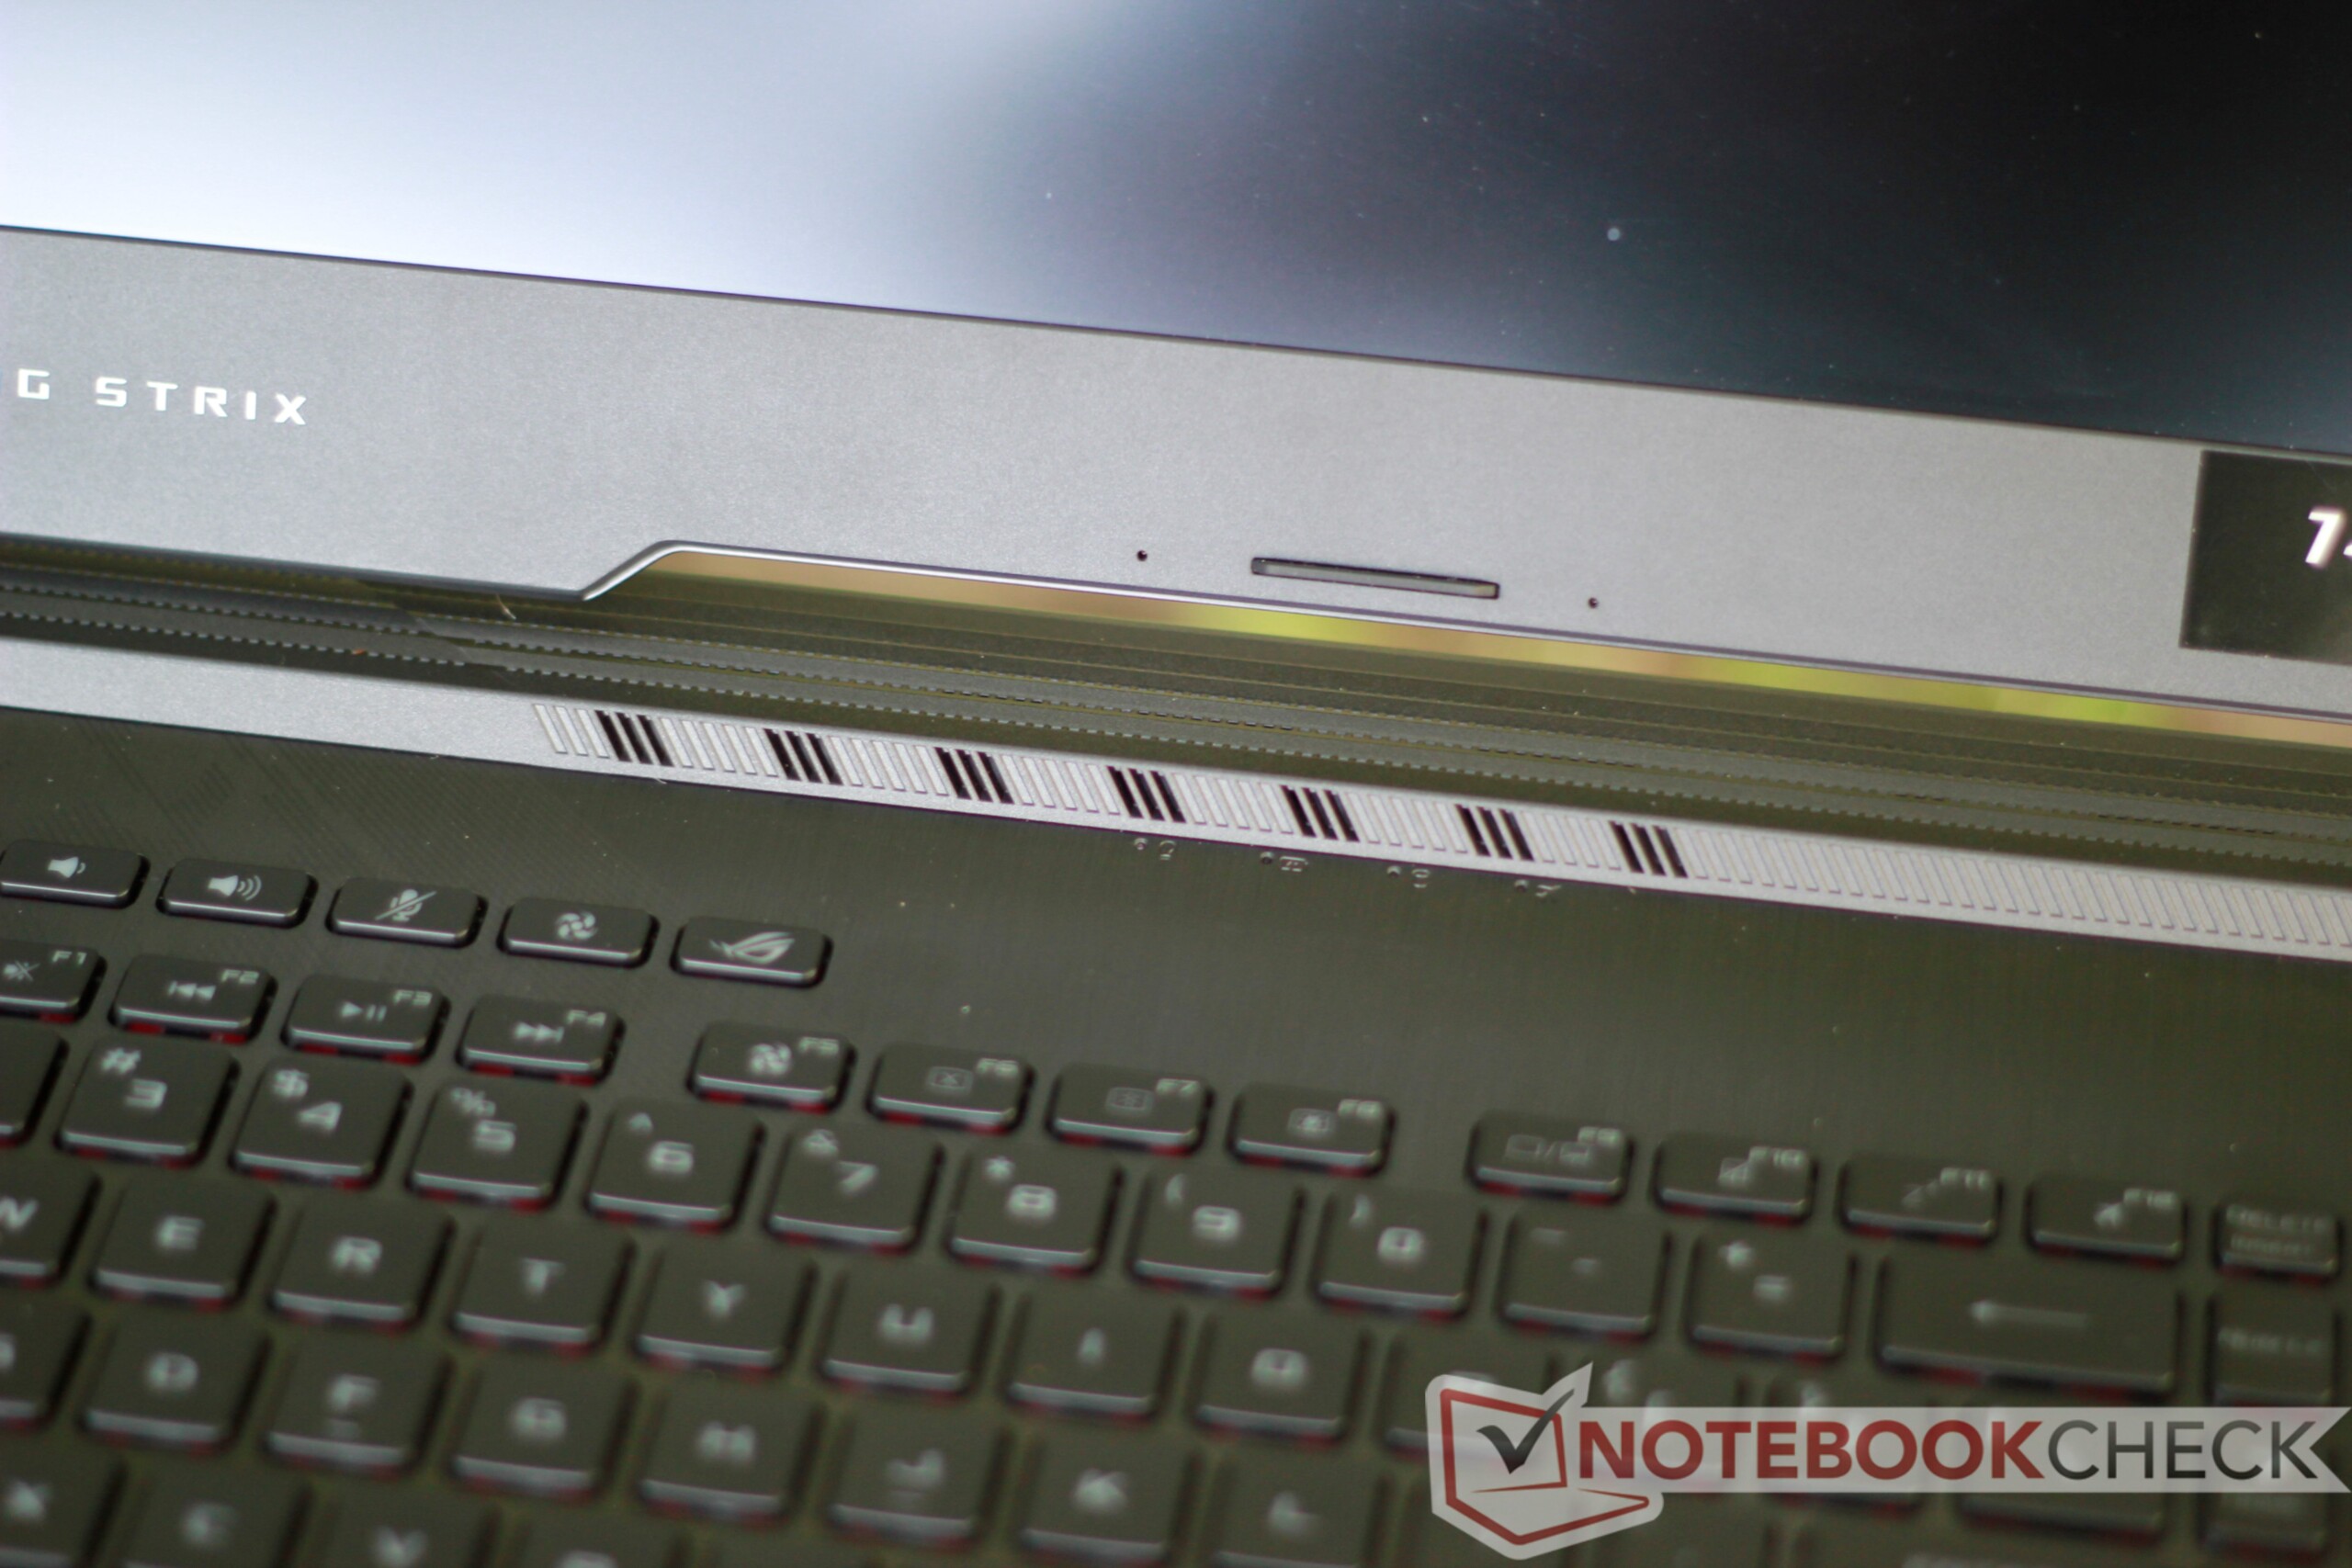
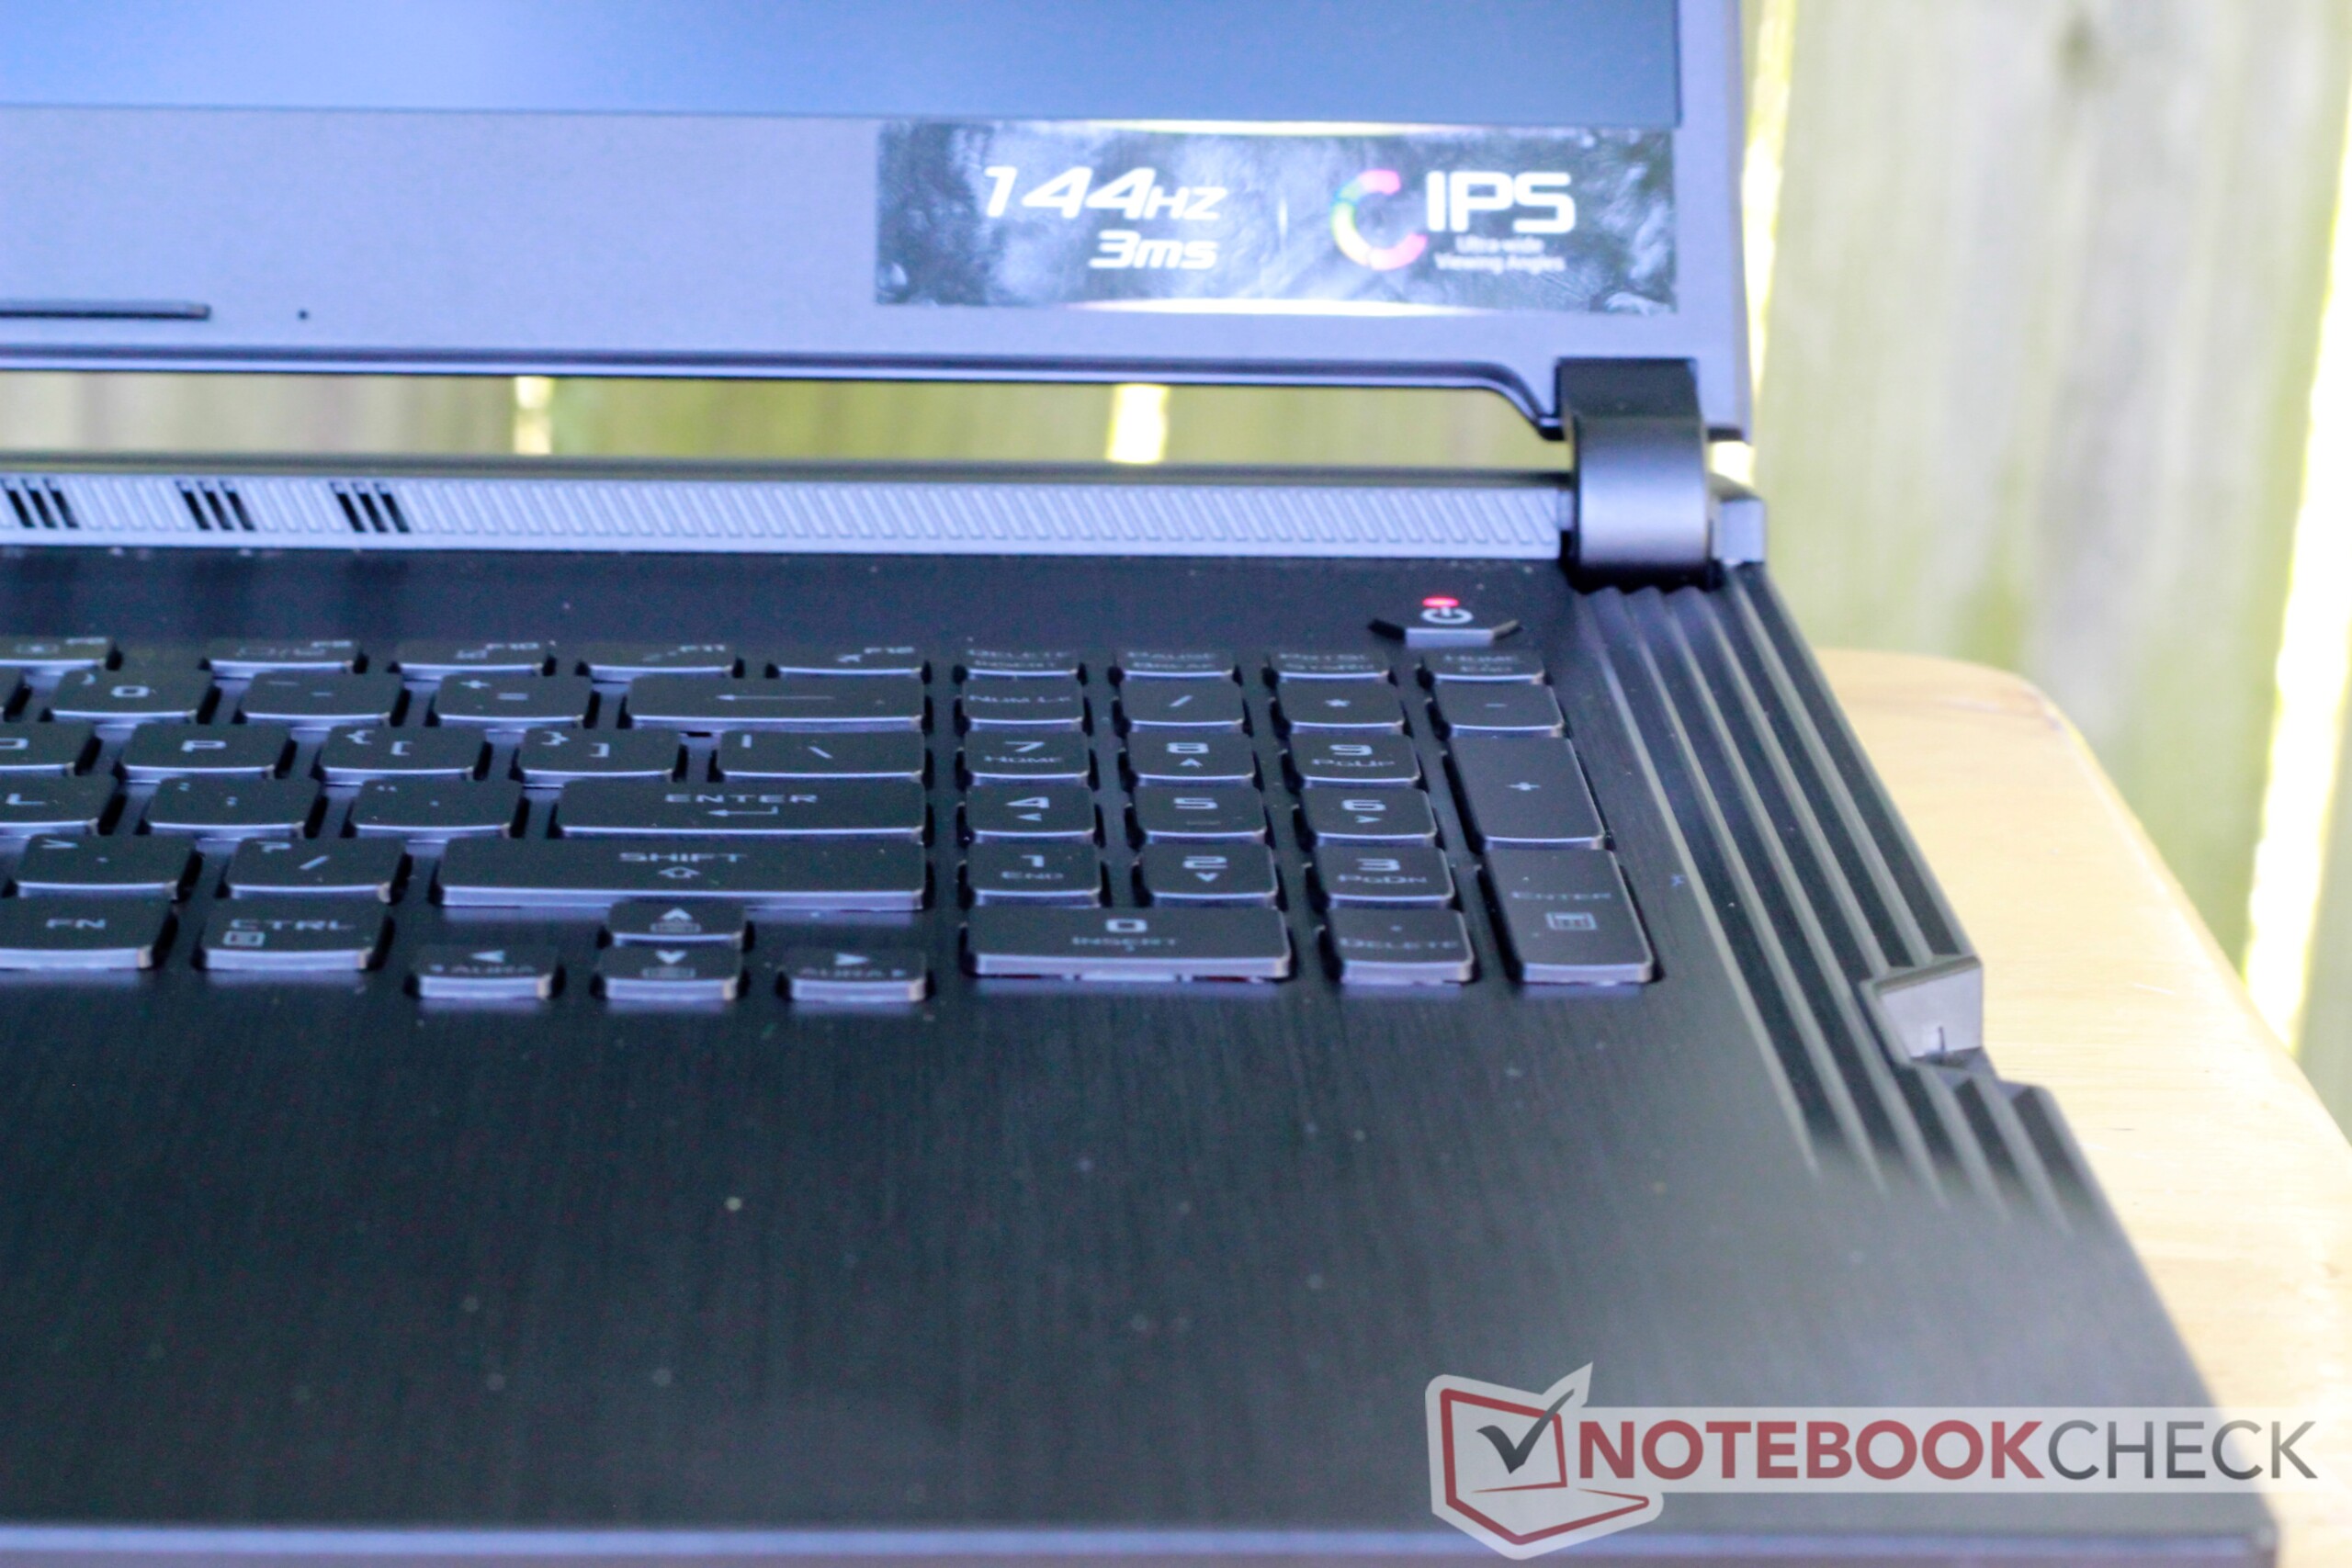
G731GW lyckas med mycket. 144 Hz-skärmen är en av de bästa vi sett på en spellaptop och tangentbordet känns utmärkt och svarar snabbt. På samma sätt har den utmärkt spelprestanda; de flesta spel kommer glida fram smidigt med skärmens snabba bilduppdatering tack vare en kraftfull kombination av ett GeForce RTX 2070 och en Core i7-9750H.
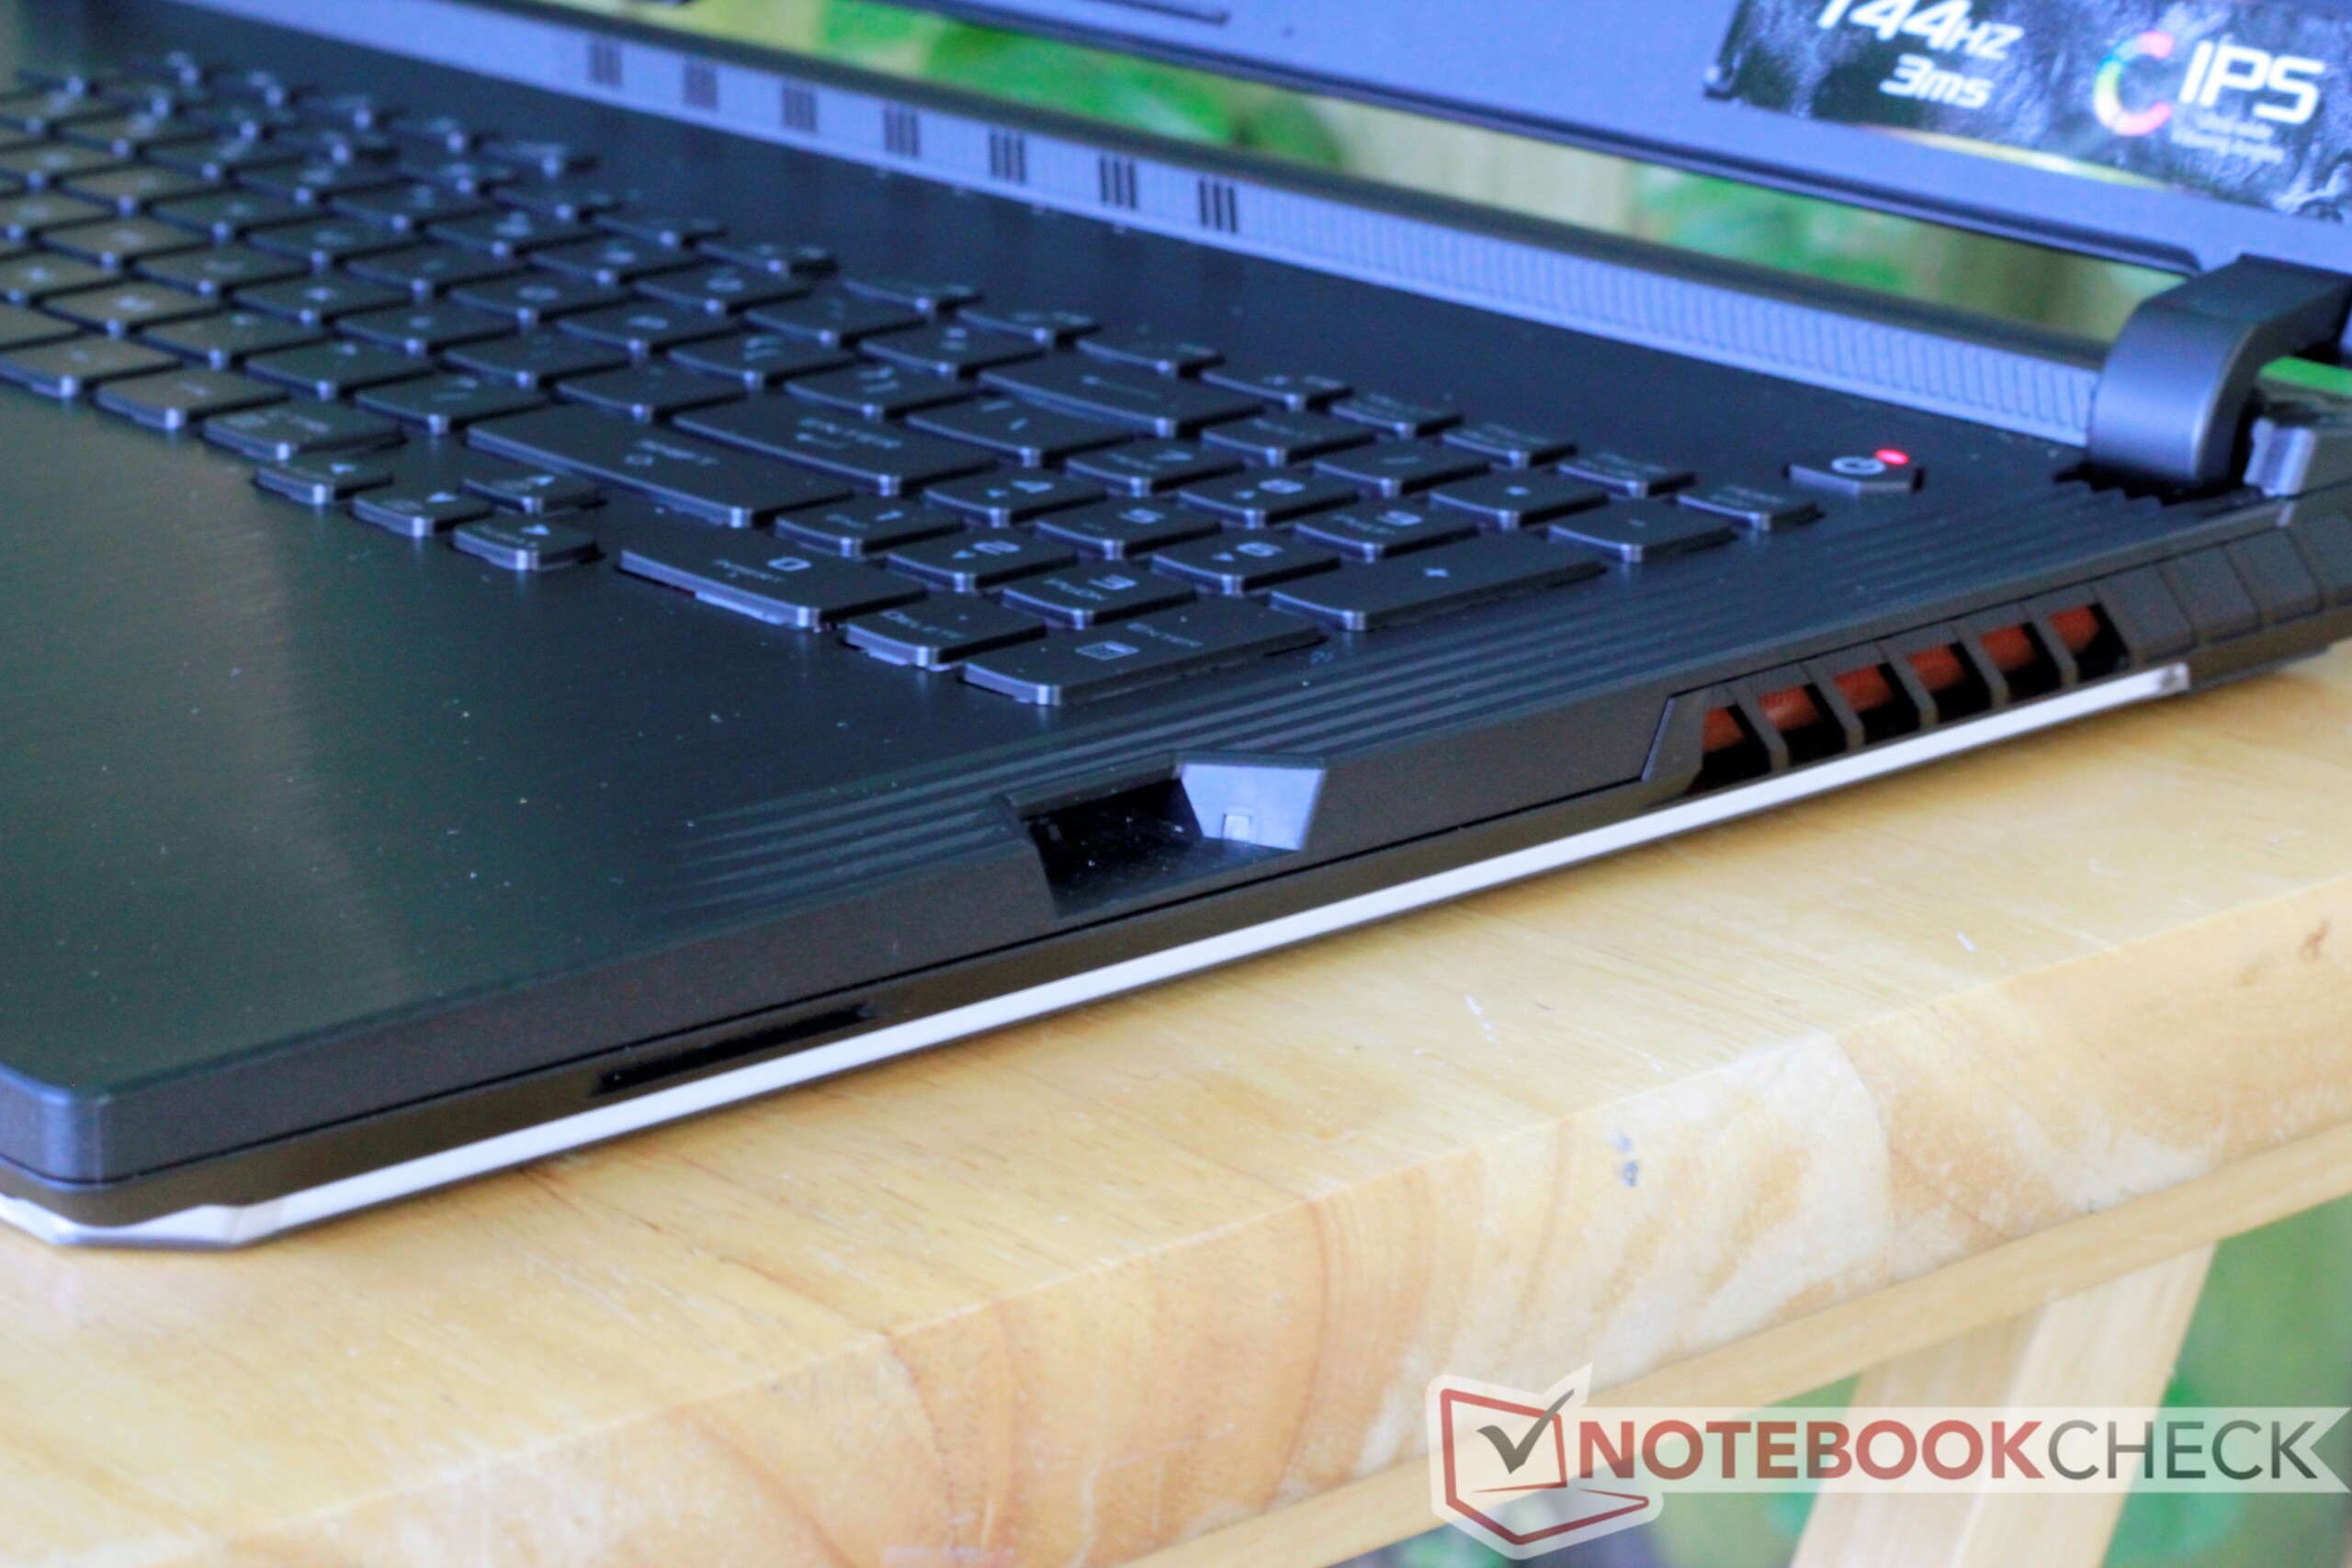
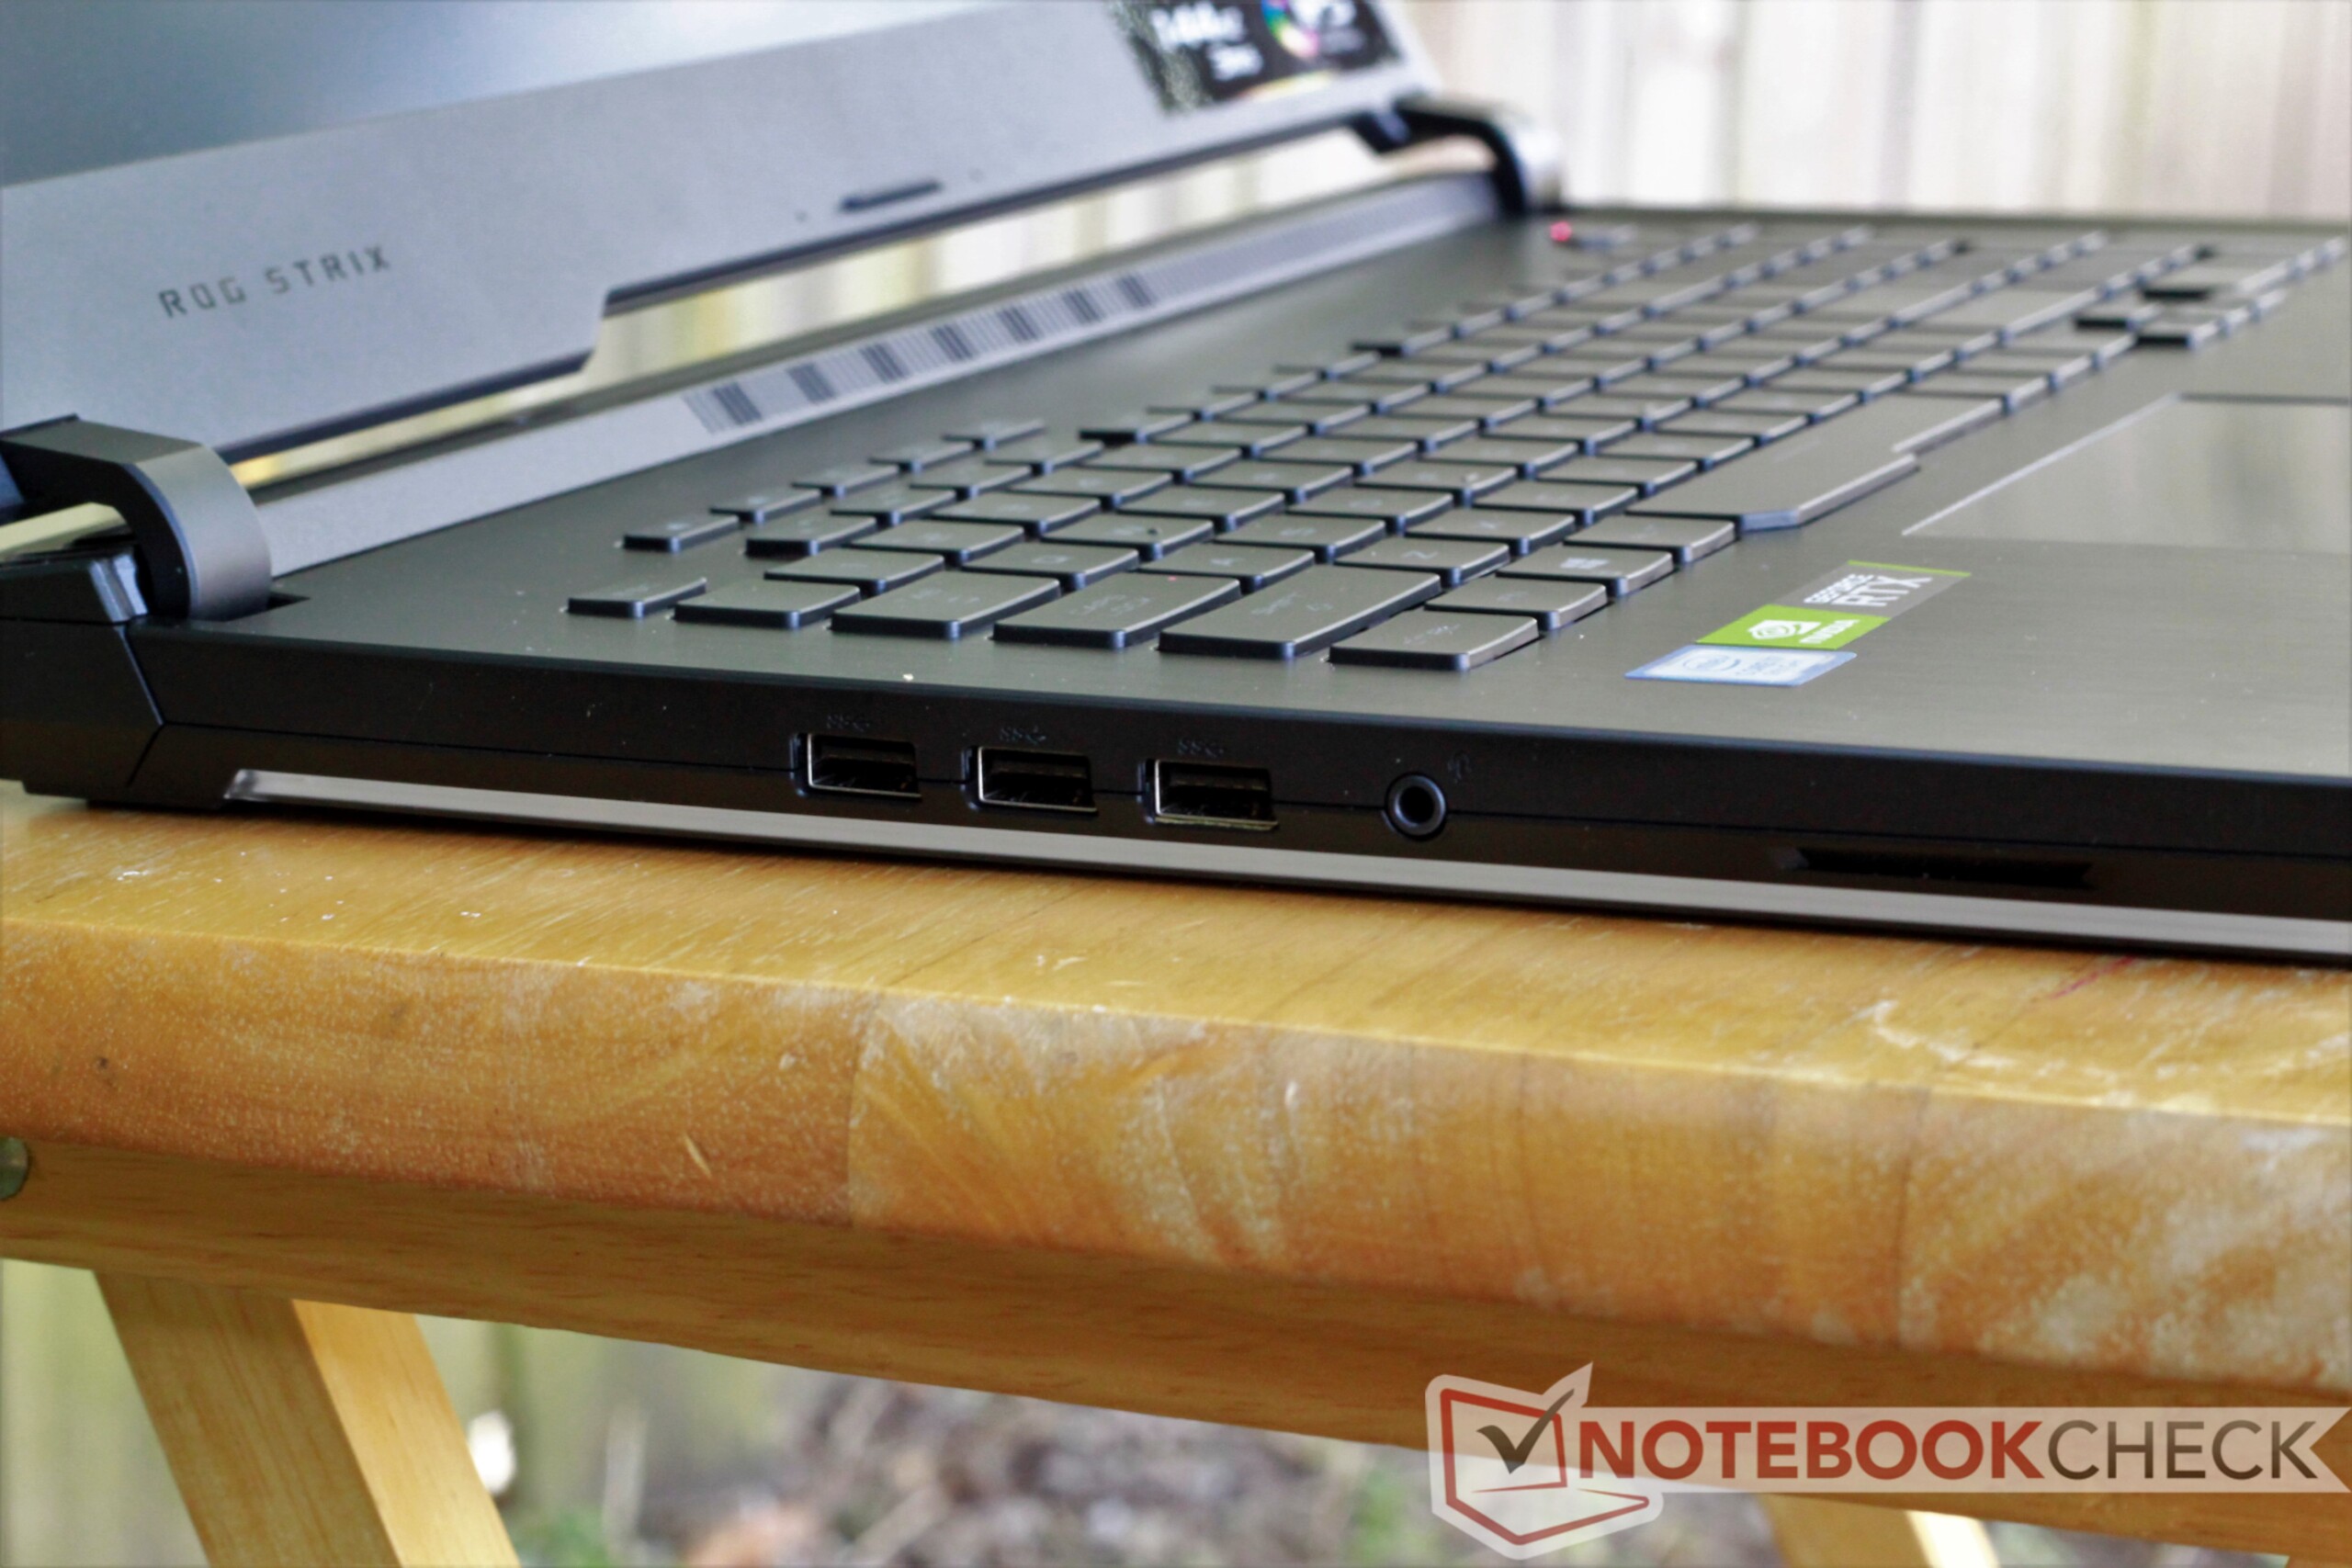
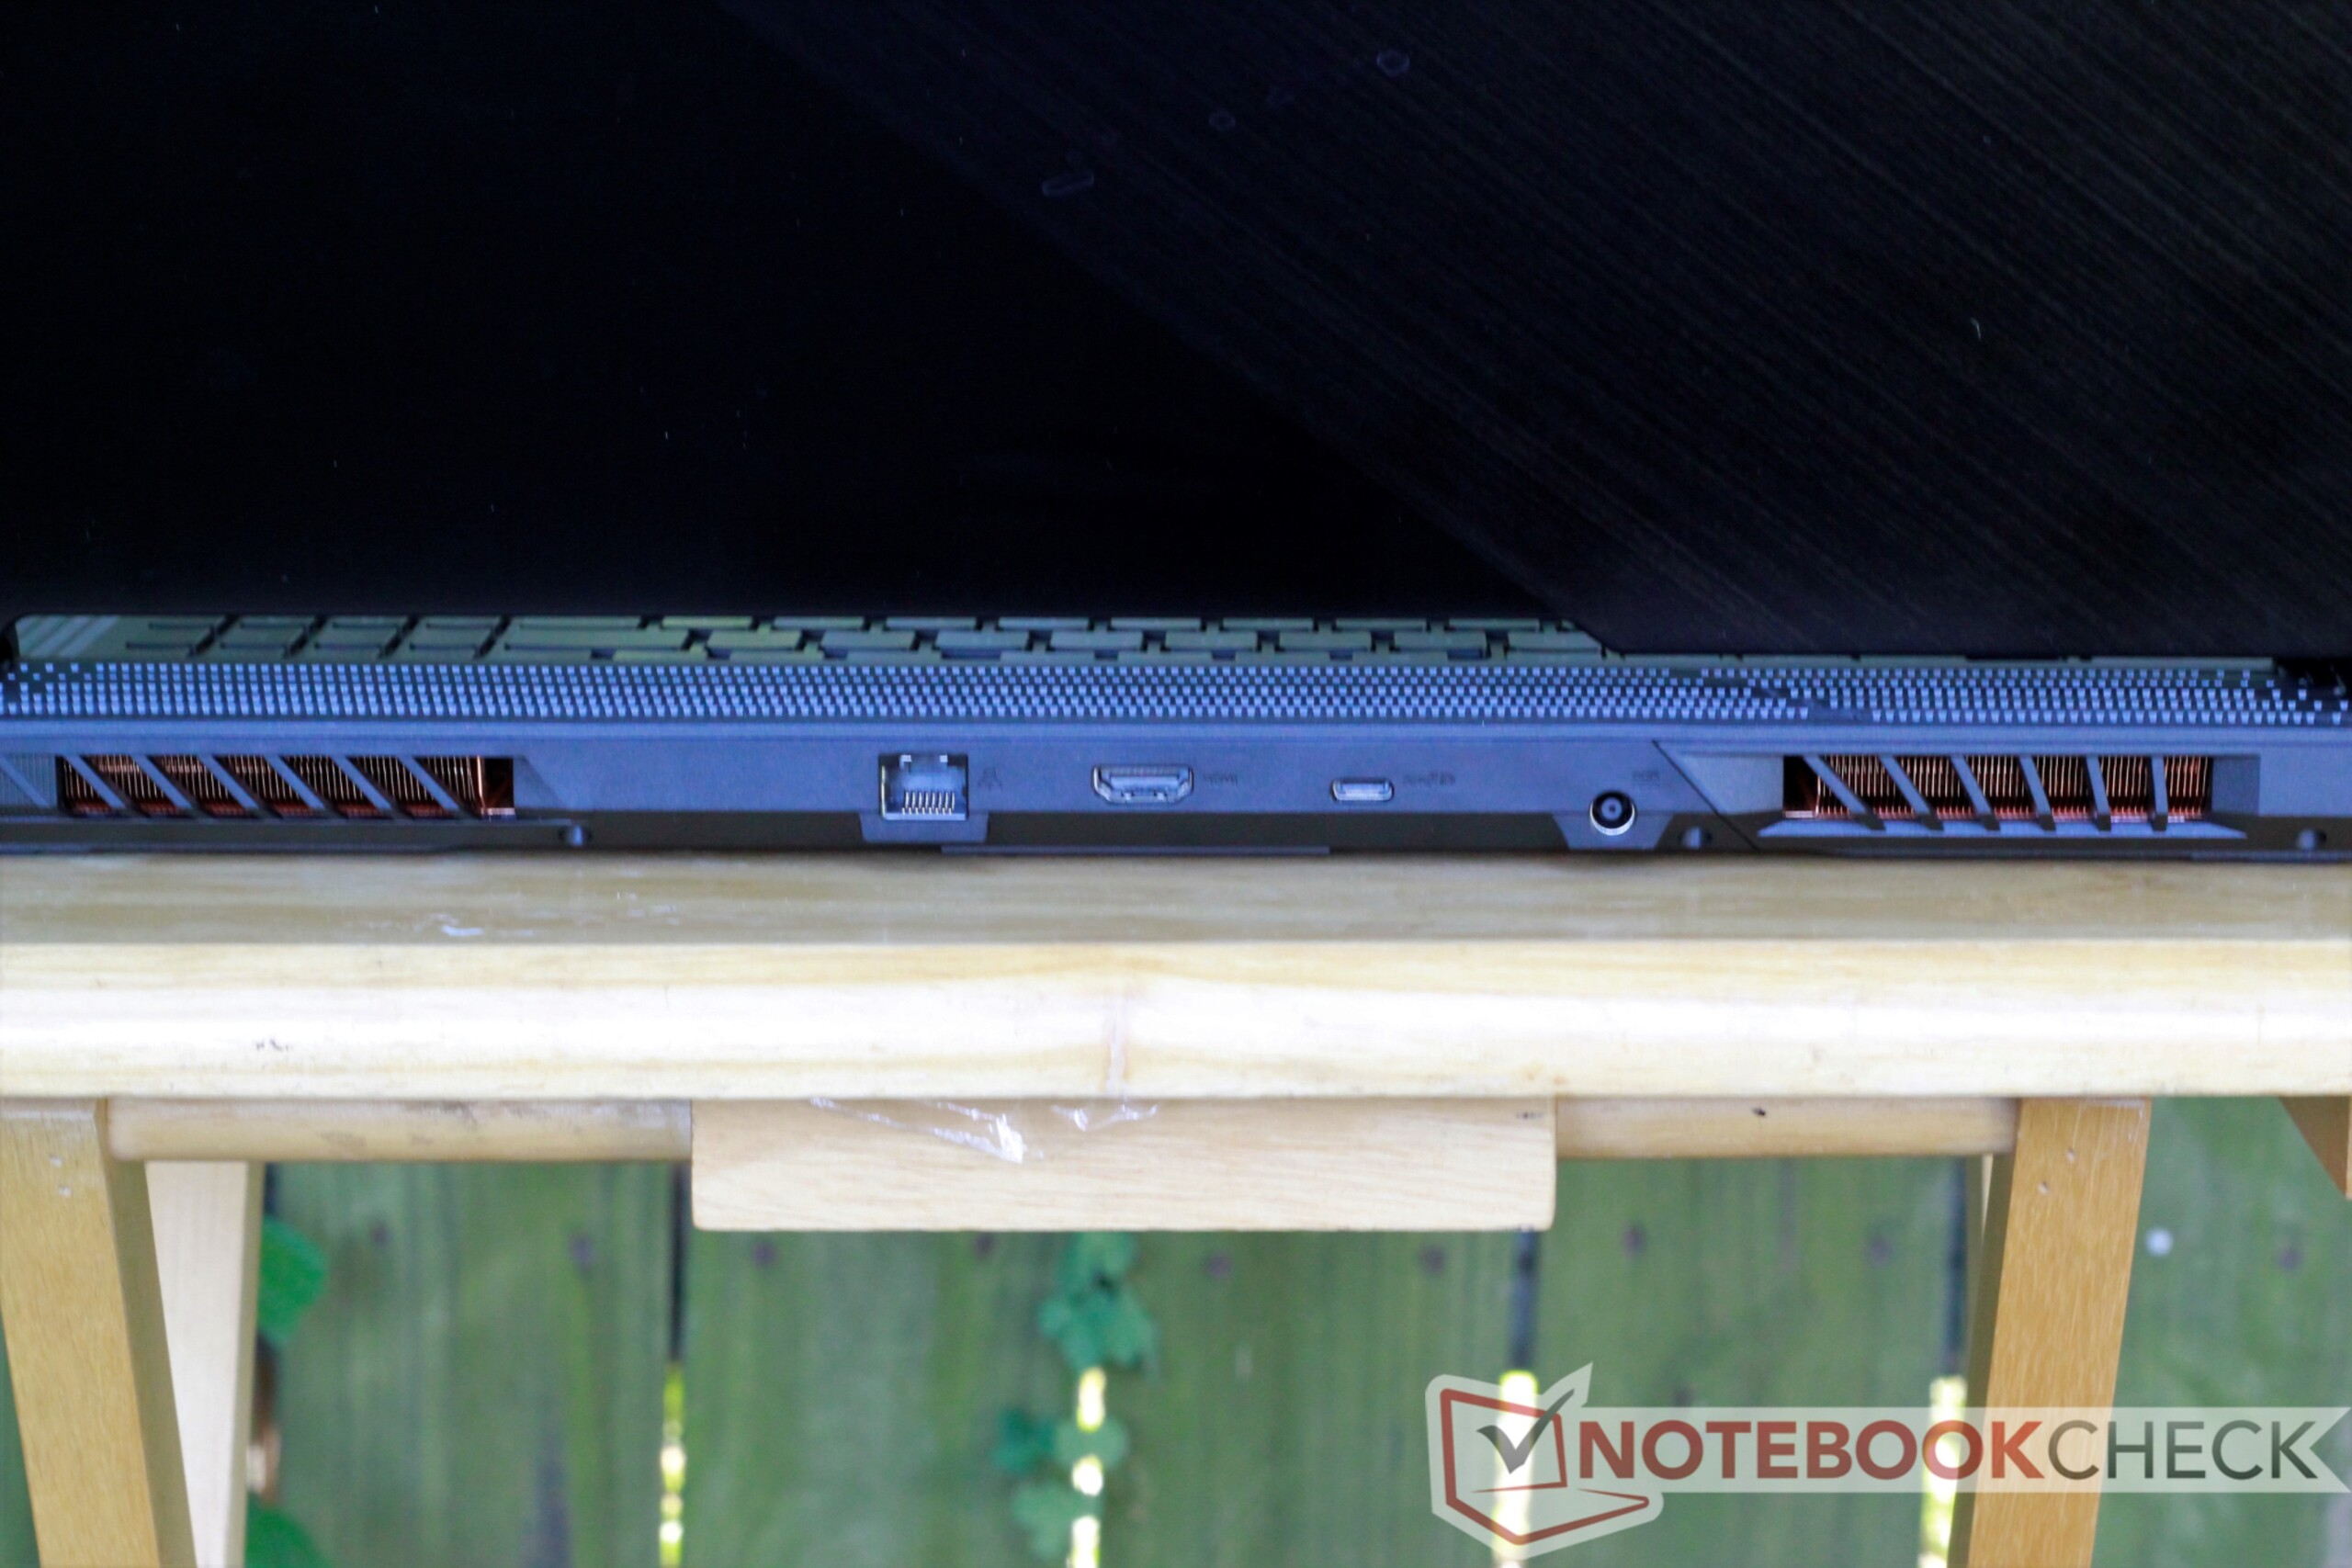
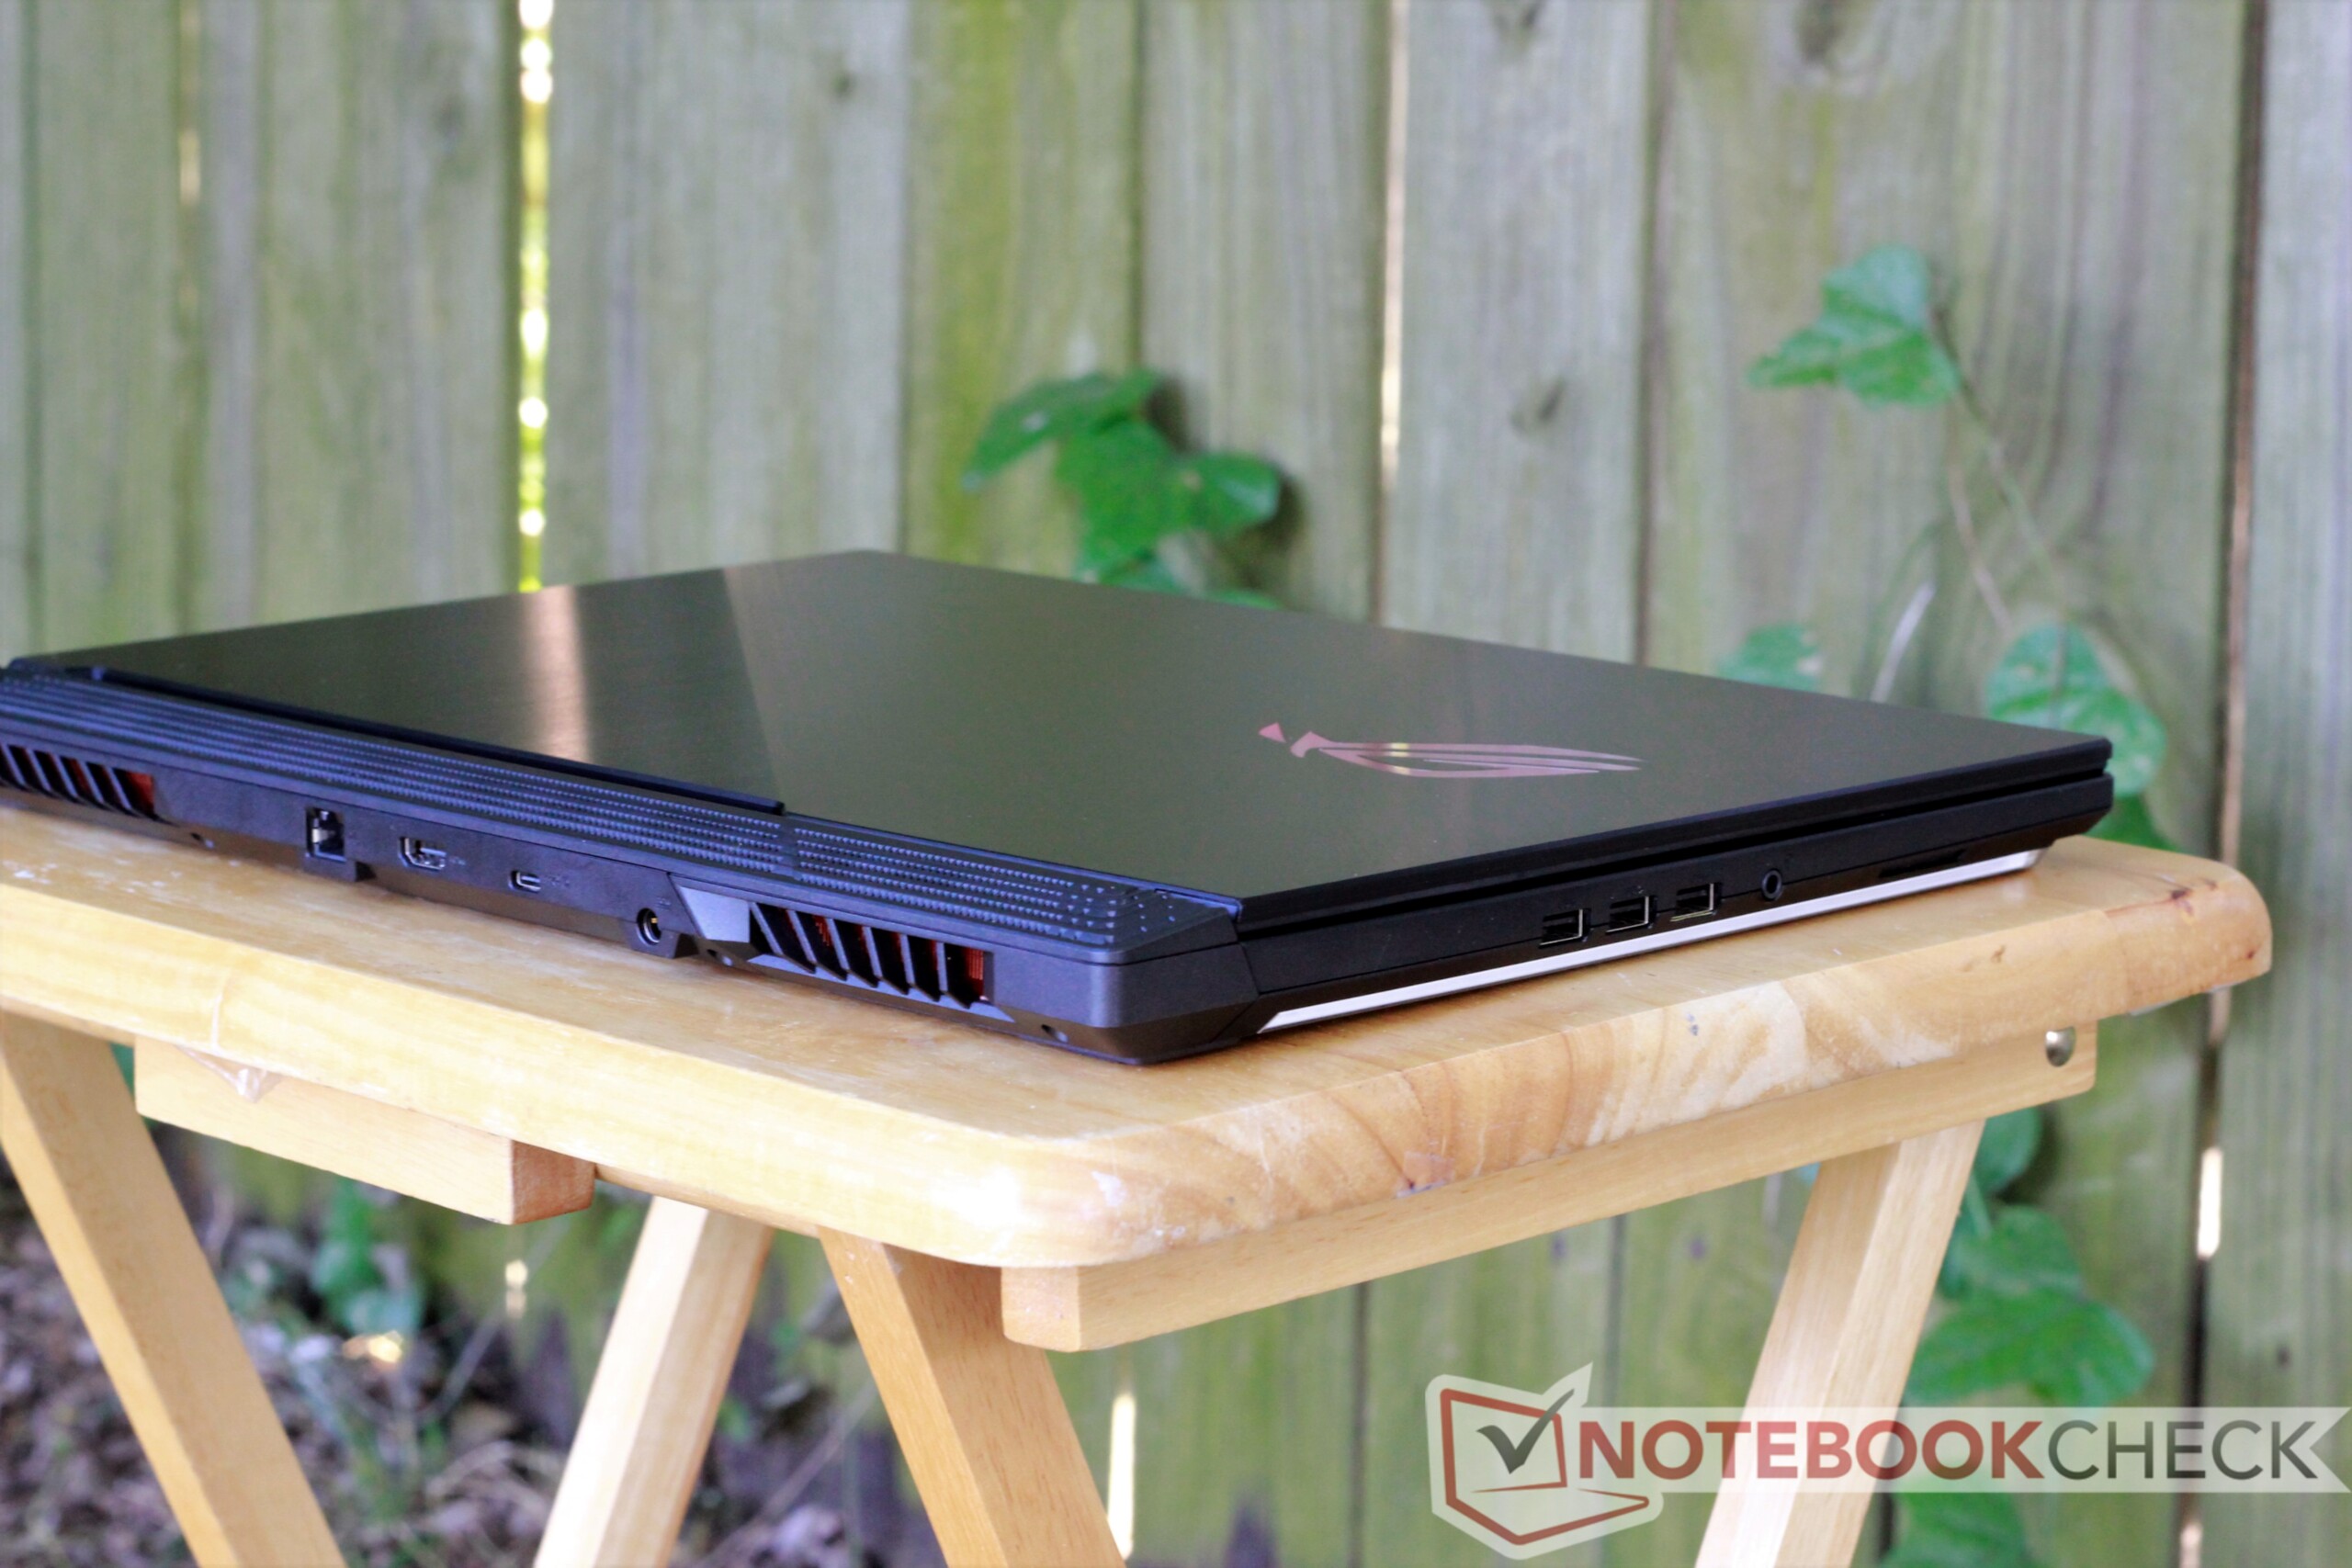
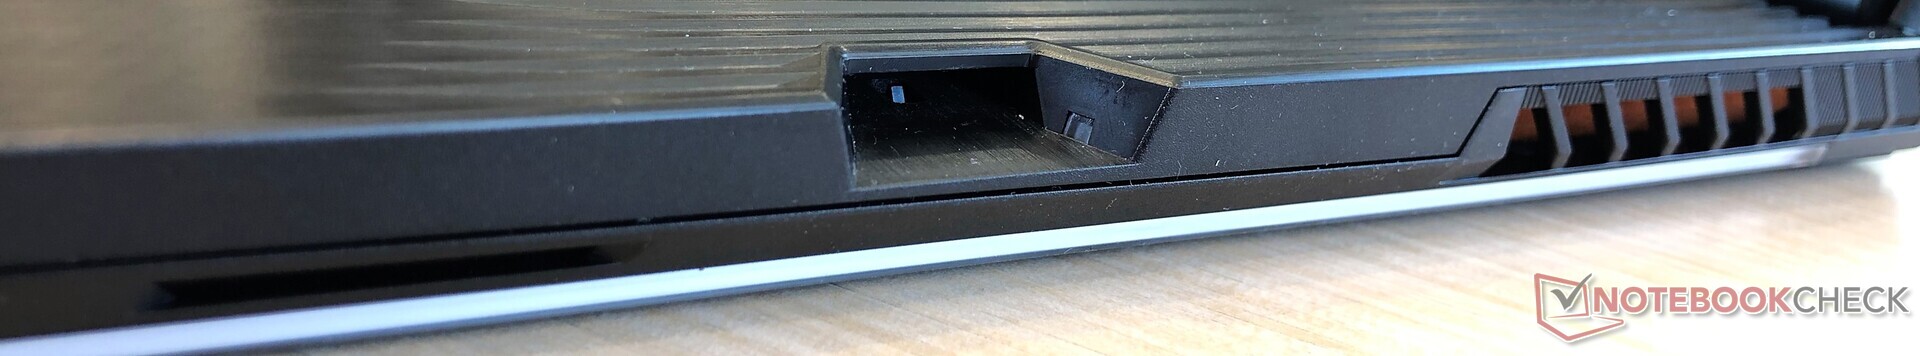
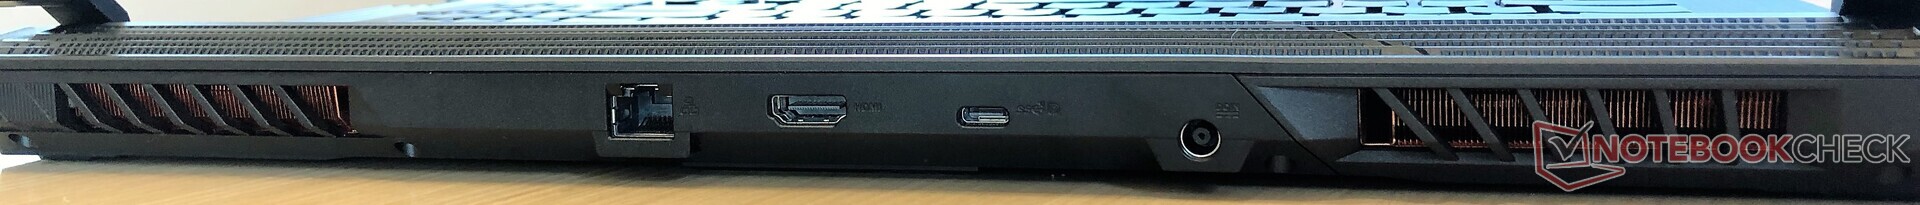
Men det finns en del irritationsmoment som intresserade köpare bör känna till. RGB-logon och RGB-remsan på undersidan går inte att stänga av utan att också stänga av tangentbordets bakgrundsbelysning. Alla USB-portar sitter på enhetens vänstra sida, vilket gör det krångligt att dra en muskabel. RGB-belysningens flatkablar gör att man får vara riktigt försiktig om man vill öppna enheten för service. Slutligen ligger den generella prestandan en aning efter konkurrerande modeller, särskilt jämfört med Eurocom Nightsky RX17.
Totalt sett är Asus G731GW nära storhet men hålls tillbaka av en kombination av flera mindre brister. Men med tanke på det relativt låga priset jämfört med andra bärbara speldatorer från toppskiktet (ca 20.000 - 23.000 beroende på konfiguration), så kan de små bristerna vara värda kostnadsbesparingen.
Asus ASUS ROG Strix SCAR III G731GW-XB74
- 09/20/2019 v7 (old)
Sam Medley
Price comparison
