Test: ASUS TUF Gaming FX705DY (Ryzen 5 3550H, Radeon RX 560X, SSD, FHD) Laptop (Sammanfattning)

| Networking | |
| iperf3 transmit AX12 | |
| Asus TUF FX705GM | |
| HP Envy 17-ae143ng | |
| Asus TUF FX705GE-EW096T | |
| Acer Predator Helios 300 PH317-52-51M6 | |
| Lenovo Legion Y730-17ICH, i7-8750H | |
| Asus TUF FX705DY-AU072 | |
| Dell G3 17 3779 | |
| Lenovo IdeaPad 330-17IKB 81DM | |
| HP 17-ca0013ng | |
| iperf3 receive AX12 | |
| Acer Predator Helios 300 PH317-52-51M6 | |
| Asus TUF FX705GM | |
| Asus TUF FX705GE-EW096T | |
| Lenovo Legion Y730-17ICH, i7-8750H | |
| HP Envy 17-ae143ng | |
| Lenovo IdeaPad 330-17IKB 81DM | |
| Dell G3 17 3779 | |
| Asus TUF FX705DY-AU072 | |
| HP 17-ca0013ng | |
| |||||||||||||||||||||||||
Distribution av ljusstyrkan: 84 %
Mitt på batteriet: 322 cd/m²
Kontrast: 1006:1 (Svärta: 0.32 cd/m²)
ΔE ColorChecker Calman: 2.97 | ∀{0.5-29.43 Ø4.71}
calibrated: 2.29
ΔE Greyscale Calman: 2.26 | ∀{0.09-98 Ø4.96}
87% sRGB (Argyll 1.6.3 3D)
57% AdobeRGB 1998 (Argyll 1.6.3 3D)
Gamma: 2.45
CCT: 6892 K
| Asus TUF FX705DY-AU072 IPS, 1920x1080, 17.3" | Asus TUF FX705GE-EW096T IPS, 1920x1080, 17.3" | Dell G3 17 3779 IPS, 1920x1080, 17.3" | Lenovo Legion Y730-17ICH, i7-8750H IPS, 1920x1080, 17.3" | Acer Predator Helios 300 PH317-52-51M6 IPS, 1920x1080, 17.3" | Asus TUF FX705GM IPS, 1920x1080, 17.3" | |
|---|---|---|---|---|---|---|
| Display | ||||||
| Display P3 Coverage (%) | 63.1 | 63.9 | 66.4 | 67.1 | 62.4 | |
| sRGB Coverage (%) | 86.8 | 89.8 | 84.9 | 86.1 | 88.8 | |
| AdobeRGB 1998 Coverage (%) | 63.5 | 64.9 | 62.1 | 63 | 63.8 | |
| Response Times | -1% | 5% | 10% | 15% | 72% | |
| Response Time Grey 50% / Grey 80% * (ms) | 40 ? | 39 ? 2% | 38 ? 5% | 36.8 ? 8% | 36 ? 10% | 7.4 ? 81% |
| Response Time Black / White * (ms) | 27 ? | 28 ? -4% | 26 ? 4% | 24 ? 11% | 22 ? 19% | 10 ? 63% |
| PWM Frequency (Hz) | 122000 ? | |||||
| Screen | -1% | -26% | -37% | -44% | 8% | |
| Brightness middle (cd/m²) | 322 | 299 -7% | 323 0% | 328.7 2% | 365 13% | 234 -27% |
| Brightness (cd/m²) | 303 | 291 -4% | 306 1% | 318 5% | 341 13% | 228 -25% |
| Brightness Distribution (%) | 84 | 90 7% | 89 6% | 91 8% | 89 6% | 85 1% |
| Black Level * (cd/m²) | 0.32 | 0.28 12% | 0.31 3% | 0.51 -59% | 0.32 -0% | 0.2 37% |
| Contrast (:1) | 1006 | 1068 6% | 1042 4% | 645 -36% | 1141 13% | 1170 16% |
| Colorchecker dE 2000 * | 2.97 | 3.02 -2% | 4.96 -67% | 4.91 -65% | 6.51 -119% | 2.16 27% |
| Colorchecker dE 2000 max. * | 5.08 | 5.27 -4% | 8.25 -62% | 10.15 -100% | 12.32 -143% | 3.39 33% |
| Colorchecker dE 2000 calibrated * | 2.29 | 2.76 -21% | 4.27 -86% | 2.9 -27% | 2.02 12% | |
| Greyscale dE 2000 * | 2.26 | 2.18 4% | 5.65 -150% | 3.9 -73% | 7.65 -238% | 2 12% |
| Gamma | 2.45 90% | 2.48 89% | 2.24 98% | 2.13 103% | 2.64 83% | 2.46 89% |
| CCT | 6892 94% | 6392 102% | 7441 87% | 6911 94% | 8066 81% | 6394 102% |
| Color Space (Percent of AdobeRGB 1998) (%) | 57 | 57 0% | 58 2% | 55.6 -2% | 56 -2% | 58 2% |
| Color Space (Percent of sRGB) (%) | 87 | 87 0% | 90 3% | 84.7 -3% | 86 -1% | 89 2% |
| Totalt genomsnitt (program/inställningar) | -1% /
-1% | -11% /
-21% | -14% /
-30% | -15% /
-35% | 40% /
18% |
* ... mindre är bättre
Visa svarstider
| ↔ Svarstid svart till vitt | ||
|---|---|---|
| 27 ms ... stiga ↗ och falla ↘ kombinerat | ↗ 16 ms stiga | 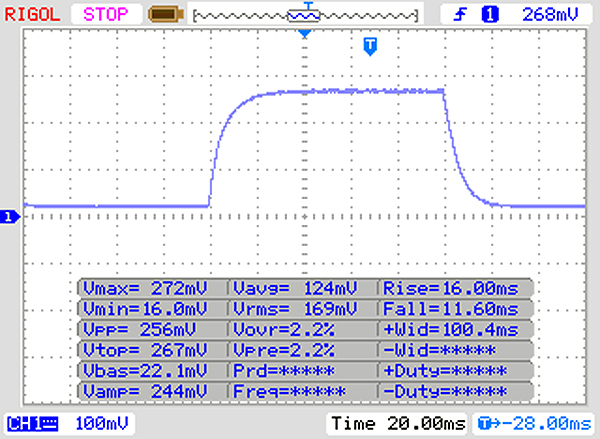 |
| ↘ 11 ms hösten | ||
| Skärmen visar relativt långsamma svarsfrekvenser i våra tester och kan vara för långsam för spelare. I jämförelse sträcker sig alla testade enheter från 0.1 (minst) till 240 (maximalt) ms. » 67 % av alla enheter är bättre. Detta innebär att den uppmätta svarstiden är sämre än genomsnittet av alla testade enheter (19.8 ms). | ||
| ↔ Svarstid 50 % grått till 80 % grått | ||
| 40 ms ... stiga ↗ och falla ↘ kombinerat | ↗ 20 ms stiga | 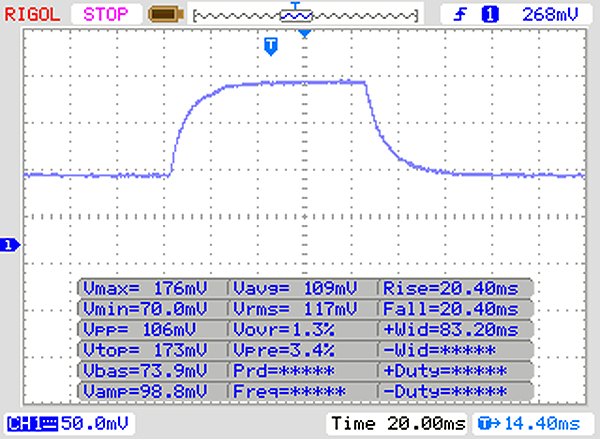 |
| ↘ 20 ms hösten | ||
| Skärmen visar långsamma svarsfrekvenser i våra tester och kommer att vara otillfredsställande för spelare. I jämförelse sträcker sig alla testade enheter från 0.165 (minst) till 636 (maximalt) ms. » 61 % av alla enheter är bättre. Detta innebär att den uppmätta svarstiden är sämre än genomsnittet av alla testade enheter (31 ms). | ||
Skärmflimmer / PWM (Puls-Width Modulation)
| Skärmflimmer / PWM upptäcktes inte | 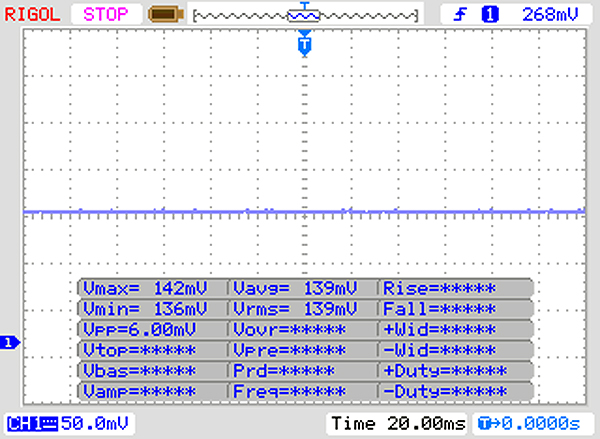 | ||
Som jämförelse: 52 % av alla testade enheter använder inte PWM för att dämpa skärmen. Om PWM upptäcktes mättes ett medelvärde av 7754 (minst: 5 - maximum: 343500) Hz. | |||
| Cinebench R15 | |
| CPU Single 64Bit | |
| Genomsnitt av klass Gaming (188.8 - 350, n=106, senaste 2 åren) | |
| Asus TUF FX705GM | |
| Acer Predator Helios 300 PH317-52-51M6 | |
| Lenovo Legion Y730-17ICH, i7-8750H | |
| Asus TUF FX705GE-EW096T | |
| Dell G3 17 3779 | |
| Acer Nitro 5 AN515-52 | |
| Lenovo IdeaPad 330-17IKB 81DM | |
| HP Envy 17-ae143ng | |
| Asus TUF FX705DY-AU072 | |
| Asus TUF FX705DY-AU072 (Turbo-Modus) | |
| Genomsnitt AMD Ryzen 5 3550H (77 - 146, n=11) | |
| HP 17-ca0013ng | |
| Asus TUF FX705DY-AU072 (Leise-Modus) | |
| CPU Multi 64Bit | |
| Genomsnitt av klass Gaming (1578 - 6330, n=105, senaste 2 åren) | |
| Lenovo Legion Y730-17ICH, i7-8750H | |
| Asus TUF FX705GM | |
| Asus TUF FX705GE-EW096T | |
| Acer Predator Helios 300 PH317-52-51M6 | |
| Acer Nitro 5 AN515-52 | |
| Dell G3 17 3779 | |
| Asus TUF FX705DY-AU072 (Turbo-Modus) | |
| Asus TUF FX705DY-AU072 | |
| Genomsnitt AMD Ryzen 5 3550H (635 - 769, n=11) | |
| Asus TUF FX705DY-AU072 (Leise-Modus) | |
| HP Envy 17-ae143ng | |
| HP 17-ca0013ng | |
| Lenovo IdeaPad 330-17IKB 81DM | |
| Cinebench R10 | |
| Rendering Single 32Bit | |
| Genomsnitt av klass Gaming (7457 - 12575, n=9, senaste 2 åren) | |
| Asus TUF FX705DY-AU072 | |
| Dell G3 17 3779 | |
| Asus TUF FX705GE-EW096T | |
| HP Envy 17-ae143ng | |
| Genomsnitt AMD Ryzen 5 3550H (4575 - 7893, n=4) | |
| Rendering Multiple CPUs 32Bit | |
| Genomsnitt av klass Gaming (42932 - 102066, n=9, senaste 2 åren) | |
| Asus TUF FX705GE-EW096T | |
| Dell G3 17 3779 | |
| HP Envy 17-ae143ng | |
| Genomsnitt AMD Ryzen 5 3550H (19002 - 20097, n=4) | |
| Asus TUF FX705DY-AU072 | |
| Geekbench 3 | |
| 32 Bit Multi-Core Score | |
| Asus TUF FX705GE-EW096T | |
| Acer Nitro 5 AN515-52 | |
| Asus TUF FX705DY-AU072 | |
| Genomsnitt AMD Ryzen 5 3550H (13474 - 15114, n=3) | |
| HP Envy 17-ae143ng | |
| 32 Bit Single-Core Score | |
| Acer Nitro 5 AN515-52 | |
| Asus TUF FX705GE-EW096T | |
| HP Envy 17-ae143ng | |
| Genomsnitt AMD Ryzen 5 3550H (3348 - 3558, n=3) | |
| Asus TUF FX705DY-AU072 | |
| Geekbench 4.4 | |
| 64 Bit Multi-Core Score | |
| Genomsnitt av klass Gaming (89200 - 101054, n=3, senaste 2 åren) | |
| Asus TUF FX705GE-EW096T | |
| Acer Nitro 5 AN515-52 | |
| HP Envy 17-ae143ng | |
| Genomsnitt AMD Ryzen 5 3550H (11183 - 13441, n=7) | |
| Asus TUF FX705DY-AU072 | |
| 64 Bit Single-Core Score | |
| Genomsnitt av klass Gaming (9335 - 9775, n=3, senaste 2 åren) | |
| Acer Nitro 5 AN515-52 | |
| Asus TUF FX705GE-EW096T | |
| HP Envy 17-ae143ng | |
| Genomsnitt AMD Ryzen 5 3550H (3623 - 3938, n=7) | |
| Asus TUF FX705DY-AU072 | |
| Mozilla Kraken 1.1 - Total | |
| Asus TUF FX705DY-AU072 (Edge 44) | |
| Dell G3 17 3779 (Edge 42.17134.1.0) | |
| Genomsnitt AMD Ryzen 5 3550H (1042 - 1229, n=8) | |
| Genomsnitt av klass Gaming (391 - 590, n=100, senaste 2 åren) | |
| Octane V2 - Total Score | |
| Genomsnitt av klass Gaming (93292 - 139447, n=27, senaste 2 åren) | |
| Dell G3 17 3779 (Edge 42.17134.1.0) | |
| Asus TUF FX705DY-AU072 (Edge 44) | |
| Genomsnitt AMD Ryzen 5 3550H (28324 - 29361, n=4) | |
| WebXPRT 3 - Overall | |
| Genomsnitt av klass Gaming (220 - 532, n=98, senaste 2 åren) | |
| Asus TUF FX705DY-AU072 (Edge 44) | |
| Genomsnitt AMD Ryzen 5 3550H (151.3 - 174, n=5) | |
| Speedometer 2.0 - Result 2.0 | |
| Genomsnitt av klass Gaming (29 - 736, n=27, senaste 2 åren) | |
| Asus TUF FX705DY-AU072 (Edge 44) | |
| Genomsnitt AMD Ryzen 5 3550H (42.1 - 43.5, n=2) | |
* ... mindre är bättre
| PCMark 7 Score | 7154 poäng | |
| PCMark 8 Home Score Accelerated v2 | 4041 poäng | |
| PCMark 8 Creative Score Accelerated v2 | 4142 poäng | |
| PCMark 8 Work Score Accelerated v2 | 4877 poäng | |
| PCMark 10 Score | 4237 poäng | |
Hjälp | ||

| Asus TUF FX705DY-AU072 Kingston RBUSNS8154P3512GJ | Asus TUF FX705GE-EW096T SK hynix BC501 HFM128GDJTNG-831 | Dell G3 17 3779 SK hynix SC311 SATA | Lenovo Legion Y730-17ICH, i7-8750H Toshiba KBG30ZMT128G | Acer Predator Helios 300 PH317-52-51M6 Hynix HFS128G39TND | Asus TUF FX705GM WDC PC SN520 SDAPNUW-256G | Genomsnitt Kingston RBUSNS8154P3512GJ | |
|---|---|---|---|---|---|---|---|
| CrystalDiskMark 5.2 / 6 | -29% | -56% | -51% | -60% | 9% | -5% | |
| Write 4K (MB/s) | 107.7 | 90.3 -16% | 62.8 -42% | 71.4 -34% | 61.9 -43% | 104.2 -3% | 87.8 ? -18% |
| Read 4K (MB/s) | 36.5 | 37.03 1% | 24.63 -33% | 29.98 -18% | 22.78 -38% | 41.46 14% | 33.7 ? -8% |
| Write Seq (MB/s) | 988 | 320.3 -68% | 203.9 -79% | 129.6 -87% | 136.1 -86% | 1295 31% | 878 ? -11% |
| Read Seq (MB/s) | 1115 | 1012 -9% | 550 -51% | 843 -24% | 490.1 -56% | 1325 19% | 949 ? -15% |
| Write 4K Q32T1 (MB/s) | 334.9 | 196.8 -41% | 160.1 -52% | 88.9 -73% | 136.2 -59% | 282.8 -16% | 355 ? 6% |
| Read 4K Q32T1 (MB/s) | 360.8 | 271.5 -25% | 184.3 -49% | 196.4 -46% | 208.4 -42% | 321.3 -11% | 402 ? 11% |
| Write Seq Q32T1 (MB/s) | 1008 | 268.8 -73% | 235 -77% | 130.5 -87% | 136 -87% | 1301 29% | 977 ? -3% |
| Read Seq Q32T1 (MB/s) | 1609 | 1595 -1% | 554 -66% | 1037 -36% | 553 -66% | 1704 6% | 1597 ? -1% |
| 3DMark 06 Standard Score | 25527 poäng | |
| 3DMark 11 Performance | 7725 poäng | |
| 3DMark Ice Storm Standard Score | 60240 poäng | |
| 3DMark Cloud Gate Standard Score | 10106 poäng | |
| 3DMark Fire Strike Score | 5513 poäng | |
| 3DMark Time Spy Score | 1909 poäng | |
Hjälp | ||
| 3DMark 11 - 1280x720 Performance GPU | |
| Genomsnitt av klass Gaming (21841 - 80022, n=104, senaste 2 åren) | |
| Asus TUF FX705GM | |
| Asus TUF FX705GE-EW096T | |
| Acer Predator Helios 300 PH317-52-51M6 | |
| Asus TUF FX705DY-AU072 | |
| Asus TUF FX505DY | |
| Genomsnitt AMD Radeon RX 560X (Laptop) (6491 - 8451, n=6) | |
| Dell G3 17 3779 | |
| Lenovo IdeaPad 330-17IKB 81DM | |
| HP Envy 17-ae143ng | |
| HP 17-ca0013ng | |
| låg | med. | hög | ultra | |
|---|---|---|---|---|
| StarCraft 2 (2010) | 256.3 | 116.3 | 113.6 | 81.6 |
| Diablo III (2012) | 150.2 | 133.5 | 130.8 | 105.7 |
| Counter-Strike: GO (2012) | 209.3 | 188.2 | 162 | 121.7 |
| BioShock Infinite (2013) | 188 | 158.2 | 140.9 | 53 |
| Sims 4 (2014) | 145.4 | 114.8 | 73.2 | 64.8 |
| GTA V (2015) | 89.3 | 83 | 48.3 | 21.2 |
| The Witcher 3 (2015) | 105.5 | 67.6 | 35.9 | 21.7 |
| Batman: Arkham Knight (2015) | 90 | 84 | 47 | |
| Dota 2 Reborn (2015) | 80 | 73.1 | 65.6 | 60.7 |
| World of Warships (2015) | 125.7 | 105.9 | 83.6 | 71.4 |
| Ashes of the Singularity (2016) | 44.5 | 31.7 | 24.2 | |
| Mafia 3 (2016) | 44.9 | 34.4 | 22.7 | |
| Civilization 6 (2016) | 107.6 | 76.4 | 39.3 | 33.9 |
| Warhammer 40.000: Dawn of War III (2017) | 90.8 | 50 | 45 | 39.4 |
| Team Fortress 2 (2017) | 95.3 | 93.8 | 84.1 | 80.5 |
| Ark Survival Evolved (2017) | 64.3 | 18.9 | 14 | 9.7 |
| Destiny 2 (2017) | 77.8 | 50.8 | 46.7 | 37.3 |
| X-Plane 11.11 (2018) | 37 | 30 | 26.6 | |
| Far Cry 5 (2018) | 63 | 39 | 36 | 33 |
| Call of Duty Black Ops 4 (2018) | 89.3 | 48.4 | 45.2 | 37.3 |
| Battlefield V (2018) | 81.2 | 53.9 | 45.8 | 41.9 |
| Darksiders III (2018) | 96.8 | 40.3 | 31.8 | 27.6 |
| Just Cause 4 (2018) | 65.8 | 41.8 | 29.6 | 26.8 |
| Apex Legends (2019) | 106.8 | 45.4 | 37.5 | 34.9 |
| Far Cry New Dawn (2019) | 56 | 39 | 36 | 33 |
| Metro Exodus (2019) | 55.1 | 27.8 | 18.3 | 15.3 |
| Anthem (2019) | 47.2 | 36.6 | 33.1 | 30.2 |
| Dirt Rally 2.0 (2019) | 151.9 | 65.7 | 53.1 | 28.3 |
| The Division 2 (2019) | 69 | 42 | 31 | 23 |
| BioShock Infinite - 1920x1080 Ultra Preset, DX11 (DDOF) | |
| Lenovo Legion Y730-17ICH, i7-8750H | |
| Asus TUF FX705GE-EW096T | |
| Dell G3 17 3779 | |
| Asus TUF FX505DY | |
| Genomsnitt AMD Radeon RX 560X (Laptop) (53 - 53.1, n=2) | |
| Asus TUF FX705DY-AU072 | |
| HP Envy 17-ae143ng | |
| HP 17-ca0013ng | |
| The Witcher 3 - 1366x768 Medium Graphics & Postprocessing | |
| Genomsnitt av klass Gaming (428 - 517, n=2, senaste 2 åren) | |
| Lenovo Legion Y730-17ICH, i7-8750H | |
| Asus TUF FX705GE-EW096T | |
| Dell G3 17 3779 | |
| Asus TUF FX505DY | |
| Genomsnitt AMD Radeon RX 560X (Laptop) (67.6 - 70.3, n=3) | |
| Asus TUF FX705DY-AU072 | |
| Lenovo IdeaPad 330-17IKB 81DM | |
| Far Cry 5 - 1920x1080 Medium Preset AA:T | |
| Genomsnitt av klass Gaming (84 - 173, n=6, senaste 2 åren) | |
| Asus TUF FX705GE-EW096T | |
| Dell G3 17 3779 | |
| Asus TUF FX705DY-AU072 | |
| Genomsnitt AMD Radeon RX 560X (Laptop) (38 - 39, n=2) | |
| Darksiders III - 1920x1080 Medium | |
| Asus TUF FX705GE-EW096T | |
| Asus TUF FX705DY-AU072 | |
| Genomsnitt AMD Radeon RX 560X (Laptop) (n=1) | |
| Diablo III - 1920x1080 High AA:on | |
| Asus TUF FX705GE-EW096T | |
| Asus TUF FX705DY-AU072 | |
| Genomsnitt AMD Radeon RX 560X (Laptop) (n=1) | |
| HP Envy 17-ae143ng | |
| StarCraft 2 - 1920x1080 ultra | |
| Asus TUF FX705GE-EW096T | |
| Asus TUF FX705DY-AU072 | |
| Genomsnitt AMD Radeon RX 560X (Laptop) (n=1) | |
| HP Envy 17-ae143ng | |
Ljudnivå
| Låg belastning |
| 32.5 / 32.6 / 33.3 dB(A) |
| Hög belastning |
| 38.7 / 45 dB(A) |
 | ||
30 dB tyst 40 dB(A) hörbar 50 dB(A) högt ljud |
||
min: | ||
| Asus TUF FX705DY-AU072 R5 3550H, Radeon RX 560X (Laptop) | Dell G3 17 3779 i5-8300H, GeForce GTX 1050 Mobile | Asus TUF FX705GE-EW096T i7-8750H, GeForce GTX 1050 Ti Mobile | Lenovo Legion Y730-17ICH, i7-8750H i7-8750H, GeForce GTX 1050 Ti Mobile | Acer Predator Helios 300 PH317-52-51M6 i5-8300H, GeForce GTX 1050 Ti Mobile | Asus TUF FX705GM i7-8750H, GeForce GTX 1060 Mobile | Genomsnitt AMD Radeon RX 560X (Laptop) | Genomsnitt av klass Gaming | |
|---|---|---|---|---|---|---|---|---|
| Noise | 3% | -2% | 9% | -1% | -9% | 3% | 6% | |
| av / miljö * (dB) | 30.7 | 30.5 1% | 30.5 1% | 28 9% | 29 6% | 29 6% | 29.3 ? 5% | 24.1 ? 21% |
| Idle Minimum * (dB) | 32.5 | 30.5 6% | 31.2 4% | 28 14% | 29 11% | 32 2% | 29.9 ? 8% | 26 ? 20% |
| Idle Average * (dB) | 32.6 | 31.1 5% | 32.4 1% | 28 14% | 31 5% | 33 -1% | 30.6 ? 6% | 27.4 ? 16% |
| Idle Maximum * (dB) | 33.3 | 32.1 4% | 32.8 2% | 31.3 6% | 33 1% | 44 -32% | 31.2 ? 6% | 30.1 ? 10% |
| Load Average * (dB) | 38.7 | 43.4 -12% | 43 -11% | 33.4 14% | 45 -16% | 46 -19% | 39.5 ? -2% | 43.6 ? -13% |
| Load Maximum * (dB) | 45 | 39.2 13% | 48.1 -7% | 46.2 -3% | 51 -13% | 50 -11% | 47.2 ? -5% | 54.2 ? -20% |
| Witcher 3 ultra * (dB) | 42.8 | 45 | 48 |
* ... mindre är bättre
(±) Den maximala temperaturen på ovansidan är 41.5 °C / 107 F, jämfört med genomsnittet av 40.4 °C / 105 F , allt från 21.2 till 68.8 °C för klassen Gaming.
(+) Botten värms upp till maximalt 39.6 °C / 103 F, jämfört med genomsnittet av 43.2 °C / 110 F
(+) Vid tomgångsbruk är medeltemperaturen för ovansidan 23.7 °C / 75 F, jämfört med enhetsgenomsnittet på 33.9 °C / ### class_avg_f### F.
(+) Handledsstöden och pekplattan är kallare än hudtemperaturen med maximalt 22.9 °C / 73.2 F och är därför svala att ta på.
(+) Medeltemperaturen för handledsstödsområdet på liknande enheter var 28.8 °C / 83.8 F (+5.9 °C / 10.6 F).
| Asus TUF FX705DY-AU072 R5 3550H, Radeon RX 560X (Laptop) | Dell G3 17 3779 i5-8300H, GeForce GTX 1050 Mobile | Asus TUF FX705GE-EW096T i7-8750H, GeForce GTX 1050 Ti Mobile | Lenovo Legion Y730-17ICH, i7-8750H i7-8750H, GeForce GTX 1050 Ti Mobile | Acer Predator Helios 300 PH317-52-51M6 i5-8300H, GeForce GTX 1050 Ti Mobile | Asus TUF FX705GM i7-8750H, GeForce GTX 1060 Mobile | Genomsnitt AMD Radeon RX 560X (Laptop) | Genomsnitt av klass Gaming | |
|---|---|---|---|---|---|---|---|---|
| Heat | -33% | -17% | -25% | -26% | -26% | -10% | -23% | |
| Maximum Upper Side * (°C) | 41.5 | 53 -28% | 53.3 -28% | 42 -1% | 50 -20% | 54 -30% | 44.2 ? -7% | 45.2 ? -9% |
| Maximum Bottom * (°C) | 39.6 | 60.5 -53% | 44.7 -13% | 51.2 -29% | 52 -31% | 53 -34% | 44.3 ? -12% | 48.1 ? -21% |
| Idle Upper Side * (°C) | 25.7 | 30.3 -18% | 29.5 -15% | 31.8 -24% | 33 -28% | 30 -17% | 27.2 ? -6% | 31 ? -21% |
| Idle Bottom * (°C) | 24.2 | 32 -32% | 27 -12% | 35.4 -46% | 30 -24% | 30 -24% | 27.7 ? -14% | 34.2 ? -41% |
* ... mindre är bättre
Asus TUF FX705DY-AU072 ljudanalys
(-) | inte särskilt höga högtalare (66.8 dB)
Bas 100 - 315 Hz
(-) | nästan ingen bas - i genomsnitt 19.2% lägre än medianen
(±) | linjäriteten för basen är genomsnittlig (10.6% delta till föregående frekvens)
Mellan 400 - 2000 Hz
(+) | balanserad mellan - endast 3.3% från medianen
(±) | linjäriteten för mids är genomsnittlig (9.5% delta till föregående frekvens)
Högsta 2 - 16 kHz
(±) | högre toppar - i genomsnitt 8% högre än medianen
(±) | linjäriteten för toppar är genomsnittlig (9.4% delta till föregående frekvens)
Totalt 100 - 16 000 Hz
(±) | linjäriteten för det totala ljudet är genomsnittlig (29.1% skillnad mot median)
Jämfört med samma klass
» 95% av alla testade enheter i den här klassen var bättre, 2% liknande, 4% sämre
» Den bästa hade ett delta på 6%, genomsnittet var 18%, sämst var 132%
Jämfört med alla testade enheter
» 87% av alla testade enheter var bättre, 2% liknande, 11% sämre
» Den bästa hade ett delta på 4%, genomsnittet var 23%, sämst var 134%
| Av/Standby | |
| Låg belastning | |
| Hög belastning |
|
Förklaring:
min: | |
| Asus TUF FX705DY-AU072 R5 3550H, Radeon RX 560X (Laptop) | Dell G3 17 3779 i5-8300H, GeForce GTX 1050 Mobile | Asus TUF FX705GE-EW096T i7-8750H, GeForce GTX 1050 Ti Mobile | Lenovo Legion Y730-17ICH, i7-8750H i7-8750H, GeForce GTX 1050 Ti Mobile | Acer Predator Helios 300 PH317-52-51M6 i5-8300H, GeForce GTX 1050 Ti Mobile | Asus TUF FX705GM i7-8750H, GeForce GTX 1060 Mobile | Genomsnitt AMD Radeon RX 560X (Laptop) | Genomsnitt av klass Gaming | |
|---|---|---|---|---|---|---|---|---|
| Power Consumption | -21% | 6% | -7% | -6% | -75% | -0% | -93% | |
| Idle Minimum * (Watt) | 5.5 | 7.7 -40% | 3.8 31% | 6.3 -15% | 6 -9% | 13 -136% | 5.9 ? -7% | 13 ? -136% |
| Idle Average * (Watt) | 10.9 | 14 -28% | 9 17% | 11 -1% | 9 17% | 17 -56% | 9.47 ? 13% | 19 ? -74% |
| Idle Maximum * (Watt) | 12.2 | 15.5 -27% | 11.2 8% | 11.5 6% | 13 -7% | 24 -97% | 13.2 ? -8% | 24.6 ? -102% |
| Load Average * (Watt) | 77 | 95 -23% | 101 -31% | 89.8 -17% | 95 -23% | 106 -38% | 76.3 ? 1% | 110.7 ? -44% |
| Load Maximum * (Watt) | 123 | 106 14% | 119.7 3% | 130.7 -6% | 134 -9% | 179 -46% | 123.9 ? -1% | 259 ? -111% |
| Witcher 3 ultra * (Watt) | 102 | 102 | 151 |
* ... mindre är bättre
| Asus TUF FX705DY-AU072 R5 3550H, Radeon RX 560X (Laptop), 64 Wh | Dell G3 17 3779 i5-8300H, GeForce GTX 1050 Mobile, 56 Wh | Lenovo Legion Y730-17ICH, i7-8750H i7-8750H, GeForce GTX 1050 Ti Mobile, 76 Wh | Acer Predator Helios 300 PH317-52-51M6 i5-8300H, GeForce GTX 1050 Ti Mobile, 48 Wh | Asus TUF FX705GE-EW096T i7-8750H, GeForce GTX 1050 Ti Mobile, 64 Wh | Asus TUF FX705GM i7-8750H, GeForce GTX 1060 Mobile, 64 Wh | Genomsnitt av klass Gaming | |
|---|---|---|---|---|---|---|---|
| Batteridrifttid | -10% | -19% | -13% | 19% | -36% | -9% | |
| Reader / Idle (h) | 12.6 | 12.2 -3% | 13.2 5% | 11.8 -6% | 6.3 -50% | 8.27 ? -34% | |
| H.264 (h) | 6.7 | 5.3 -21% | 4.3 -36% | 8.32 ? 24% | |||
| WiFi v1.3 (h) | 7.2 | 5.8 -19% | 6.7 -7% | 5.9 -18% | 8.6 19% | 4.5 -37% | 7.11 ? -1% |
| Load (h) | 2 | 2.1 5% | 0.9 -55% | 1.7 -15% | 1.6 -20% | 1.502 ? -25% |
För
Emot
Läs den fullständiga versionen av den här recensionen på engelska här.
ASUS TUF Gaming FX705DY är med tanke på priset en välutrustad enhet. Kombinationen av APU och GPU från AMD är bra och levererar skaplig systemprestanda och är tillräckligt kraftfull för att kunna hantera alla moderna spel med behaglig bilduppdatering och trevliga grafikinställningar.
Vidare är denna maskin inte alltid högljudd likt många andra bärbara speldatorer, men först måste du aktivera det tysta läget som offrar en del processorprestanda. Maskinen kan dock ändå plöja igenom kontors- och internetbaserade uppgifter i det läget.
ASUS TUF Gaming FX705DY är mycket prisvärd och levererar en skaplig spelupplevelse med endast ett fåtal kompromisser.
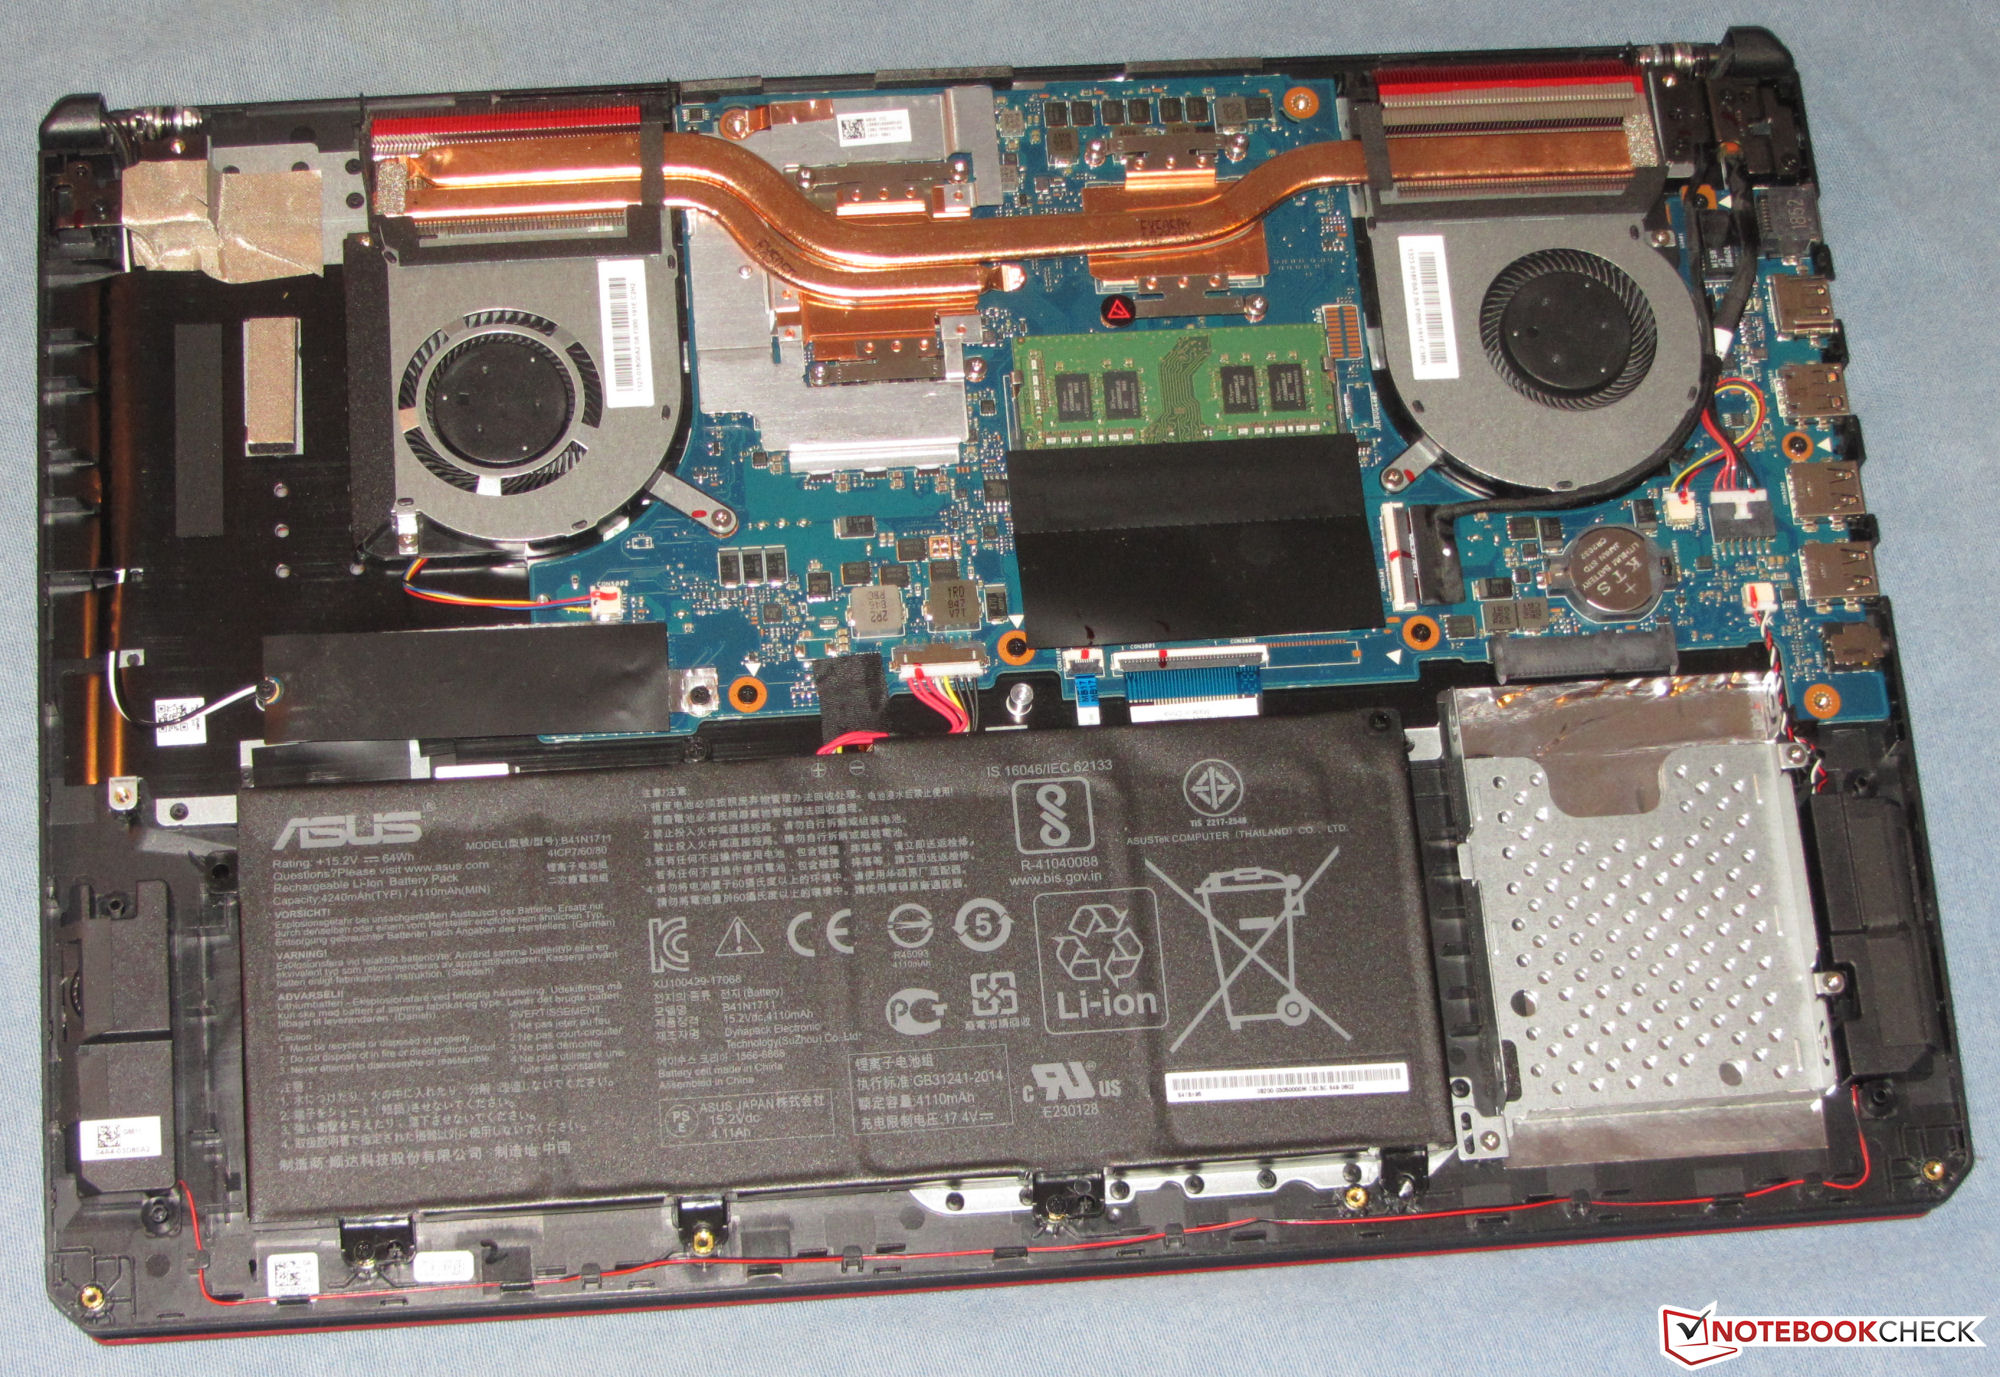
En NVMe SSD på 512 GB bör ge tillräckligt med lagring för de flesta, men det går alltid att lägga till en 2.5-tums HDD om du får slut på plats. Tyvärr måste du ta bort höljets botten för att komma åt enhetsplatsen, men så är ofta fallet med moderna laptops.
Vidare gillade vi den matta IPS-skärmen. Den är ljusstark, har bra kontrast, stabila betraktningsvinklar och återger färger med god precision. Datorn har också ett skapligt RGB-belyst tangentbord och batteriet bör hålla hela dagen, även om FX705GE håller ett par timmar till.
Det är synd att ASUS valt att inte inkludera en USB Typ C-port eller någon form av kortläsare. Dessutom känns det som ett misstag att bara utrusta enheten med en enda videoutgång. Men bortsett från dessa småsaker är ASUS TUF Gaming FX705DY ett fynd till priset av 8.000 kronor om du letar efter en spellaptop på 17.3 tum. Den bör bocka av punkterna från de flesta användares listor även om den hamnar efter konkurrenterna på några områden.
Asus TUF FX705DY-AU072
- 04/17/2019 v6 (old)
Sascha Mölck
Price comparison
