Test: Schenker XMG Fusion 15 - Intels referensdesign utmanar konkurrenterna (Sammanfattning)
| SD Card Reader | |
| average JPG Copy Test (av. of 3 runs) | |
| Gigabyte Aero 15 Classic-XA (Toshiba Exceria Pro SDXC 64 GB UHS-II) | |
| Lenovo ThinkPad P1 2019-20QT000RGE (Toshiba Exceria Pro SDXC 64 GB UHS-II) | |
| Genomsnitt av klass Gaming (20.9 - 210, n=54, senaste 2 åren) | |
| Schenker XMG Fusion 15 XFU15L19 (Toshiba Exceria Pro SDXC 64 GB UHS-II) | |
| maximum AS SSD Seq Read Test (1GB) | |
| Gigabyte Aero 15 Classic-XA (Toshiba Exceria Pro SDXC 64 GB UHS-II) | |
| Lenovo ThinkPad P1 2019-20QT000RGE (Toshiba Exceria Pro SDXC 64 GB UHS-II) | |
| Genomsnitt av klass Gaming (25.5 - 261, n=51, senaste 2 åren) | |
| Schenker XMG Fusion 15 XFU15L19 (Toshiba Exceria Pro SDXC 64 GB UHS-II) | |
| |||||||||||||||||||||||||
Distribution av ljusstyrkan: 85 %
Mitt på batteriet: 331 cd/m²
Kontrast: 1034:1 (Svärta: 0.32 cd/m²)
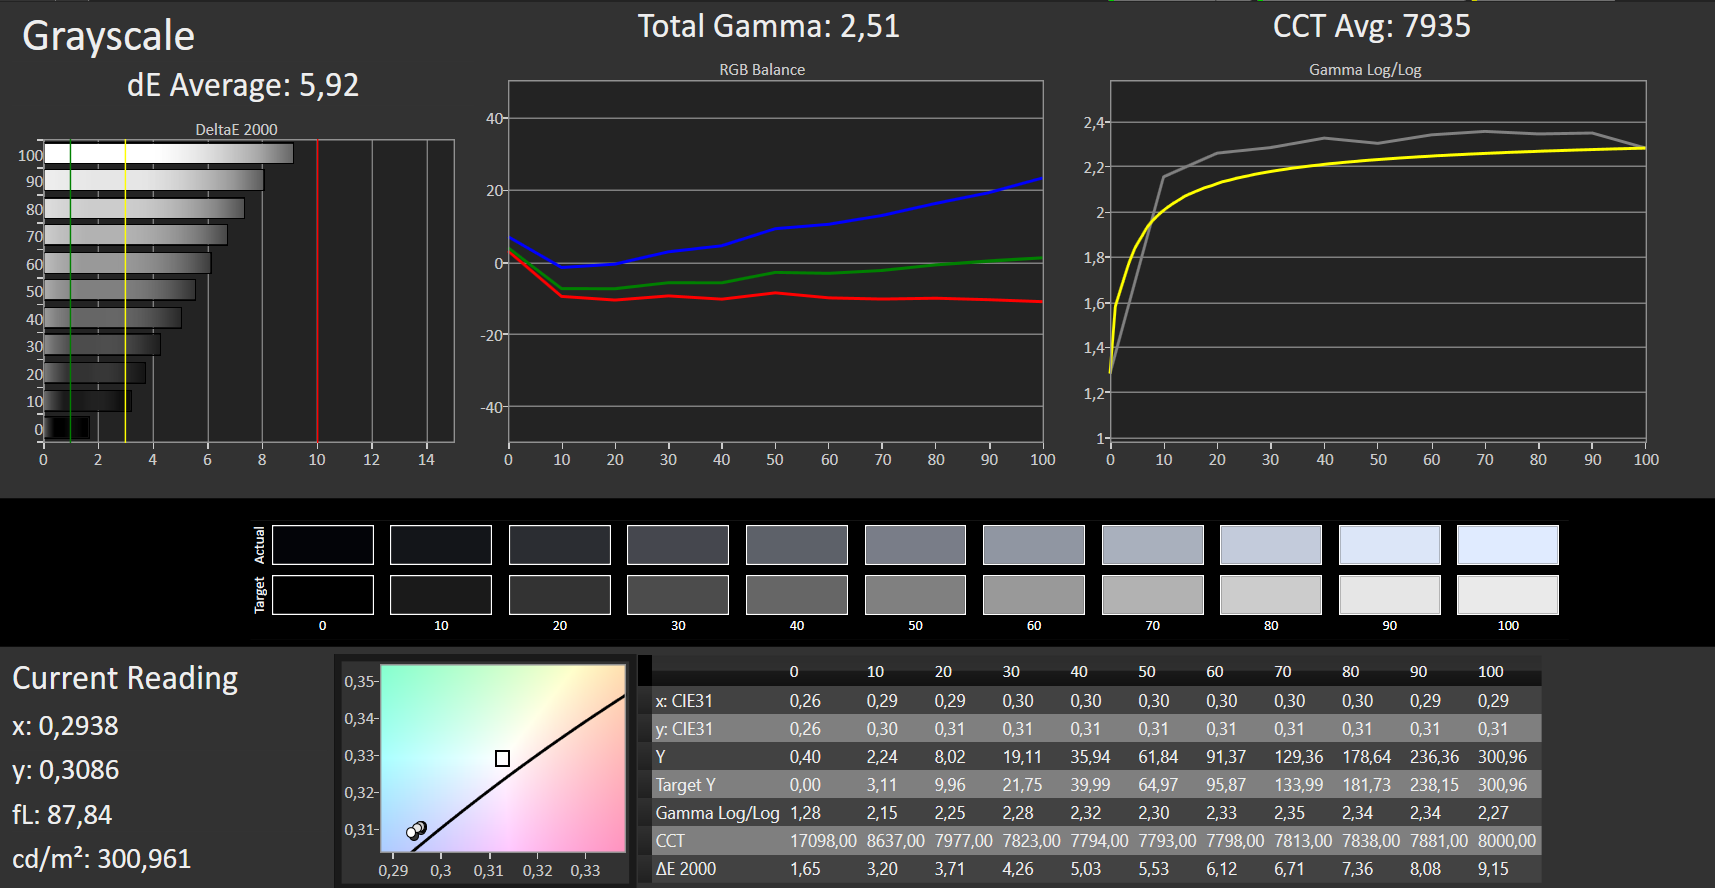
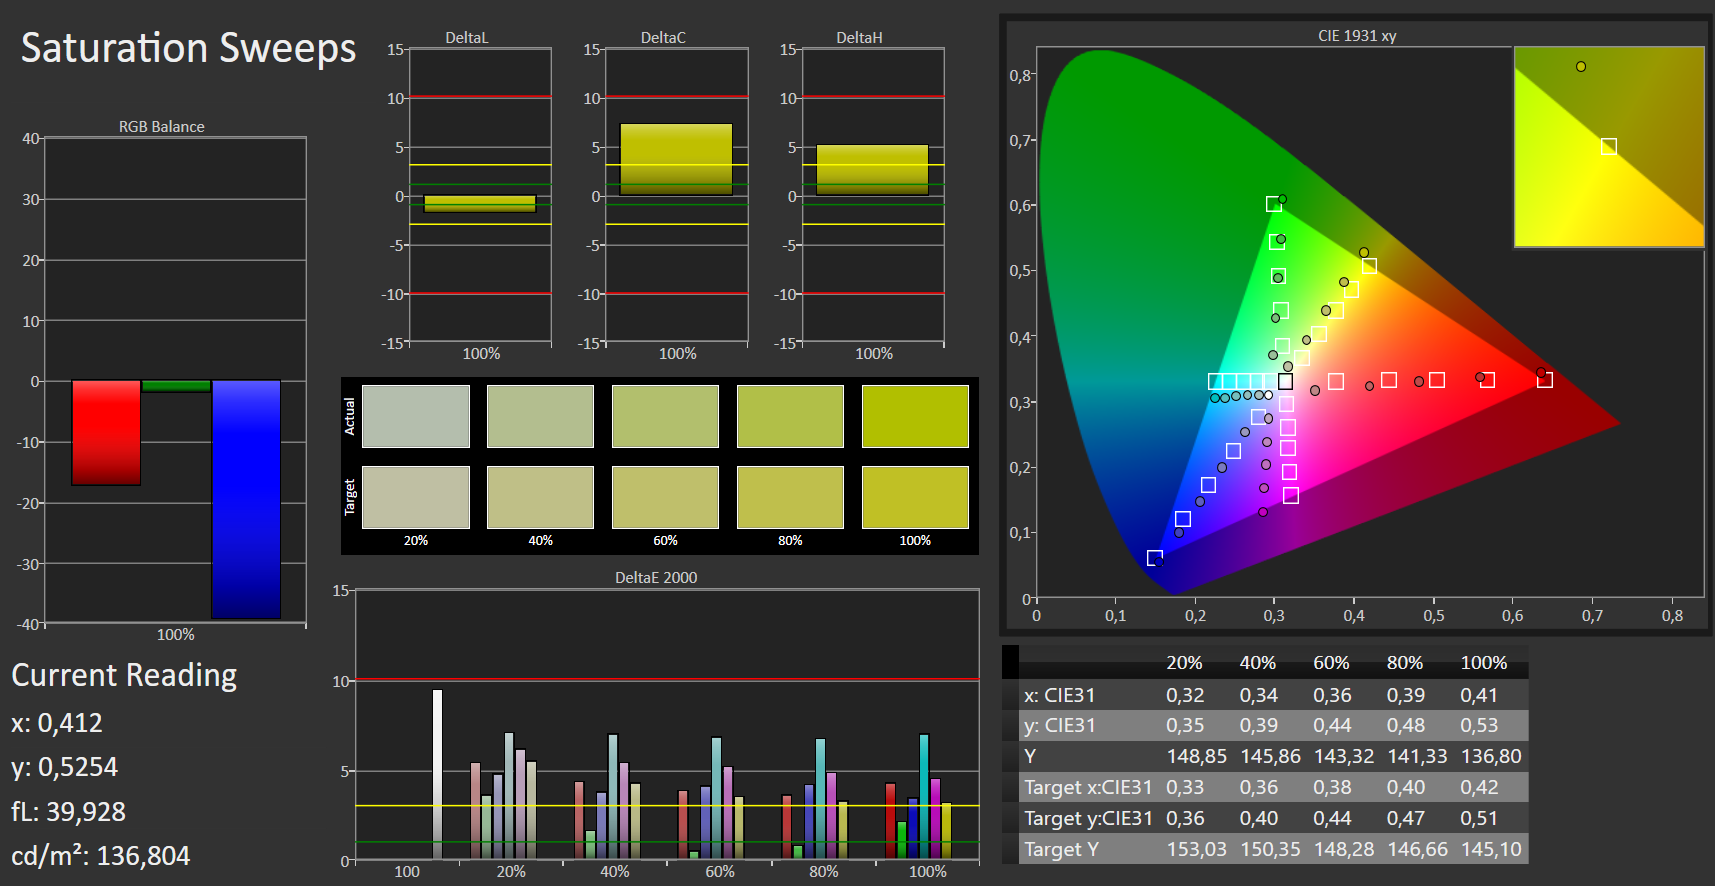
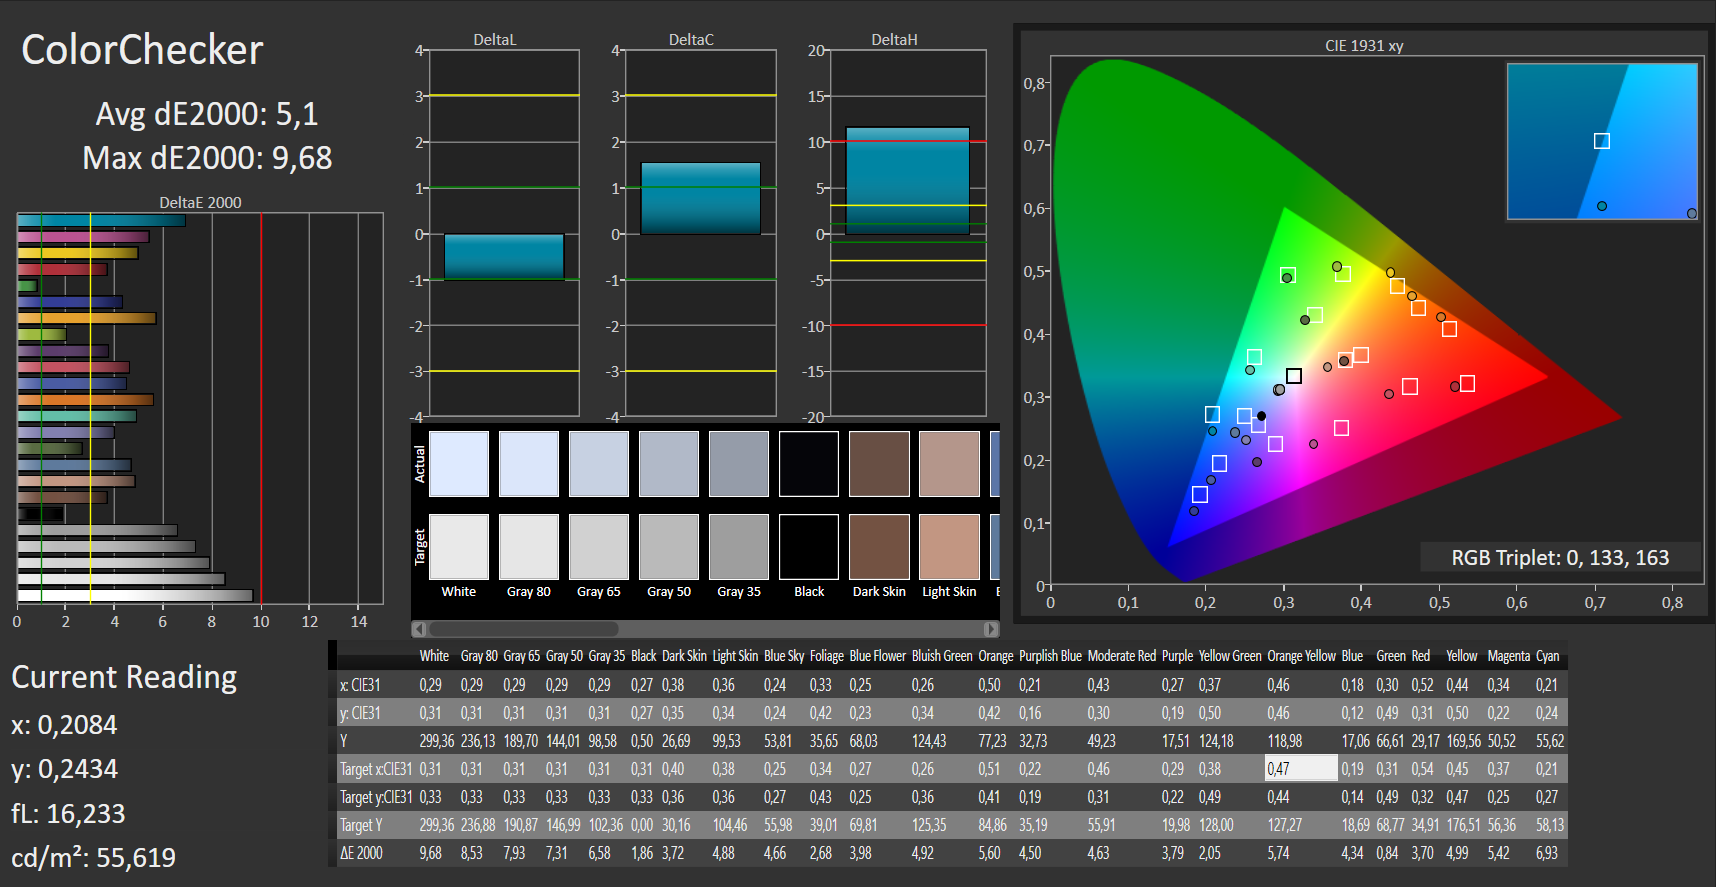
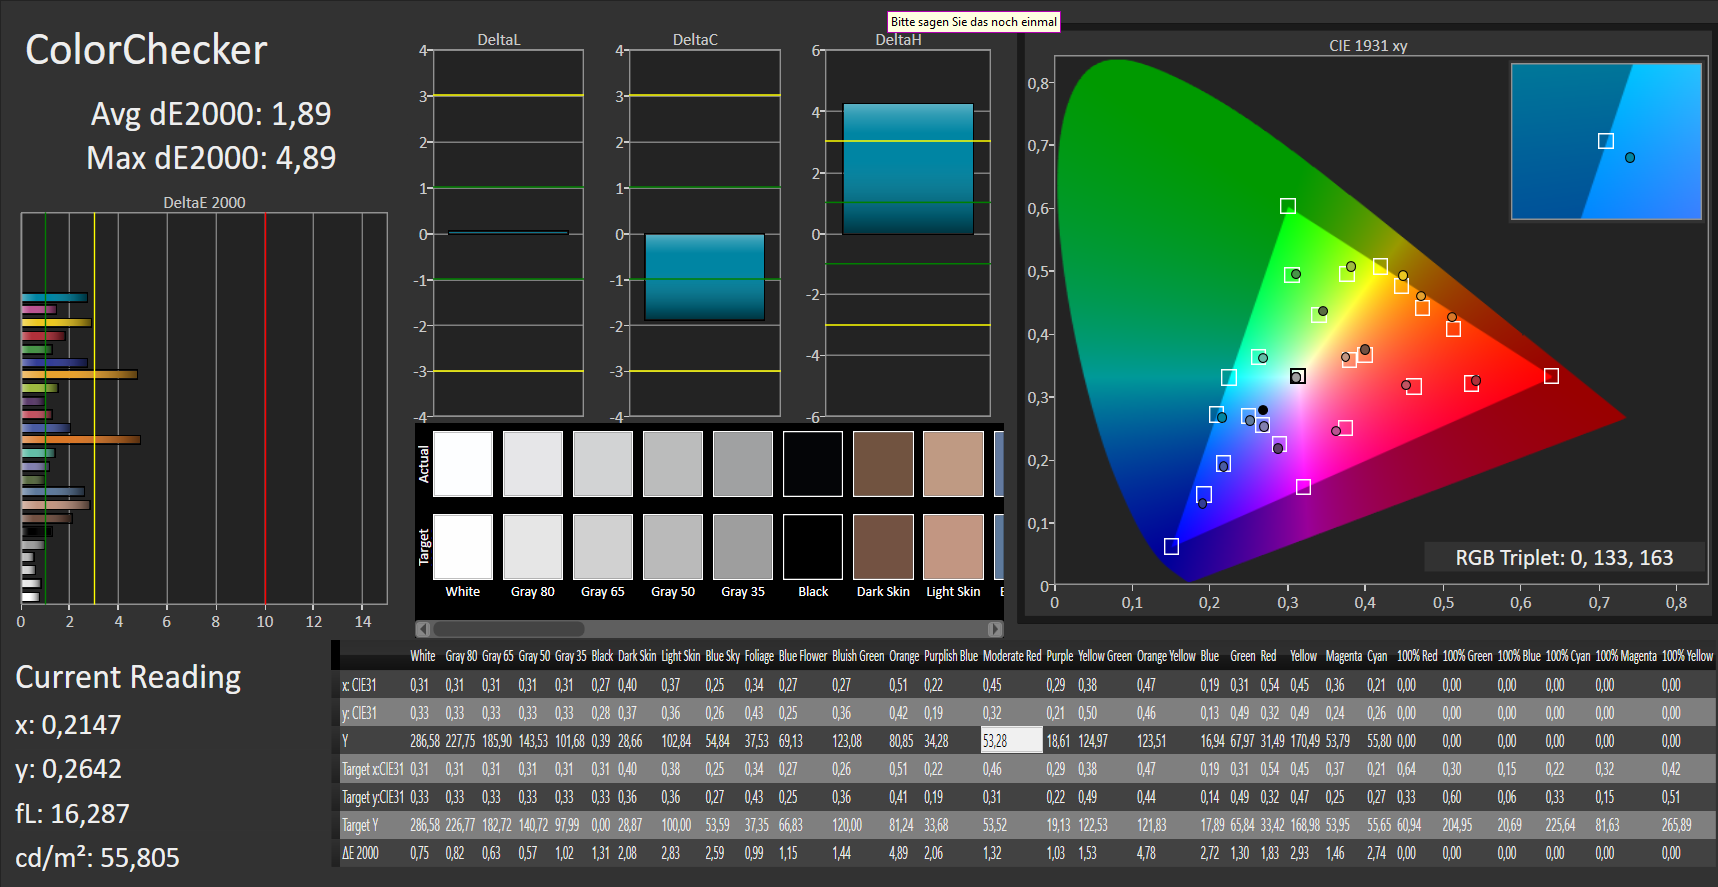
ΔE ColorChecker Calman: 4.5 | ∀{0.5-29.43 Ø4.72}
calibrated: 1.9
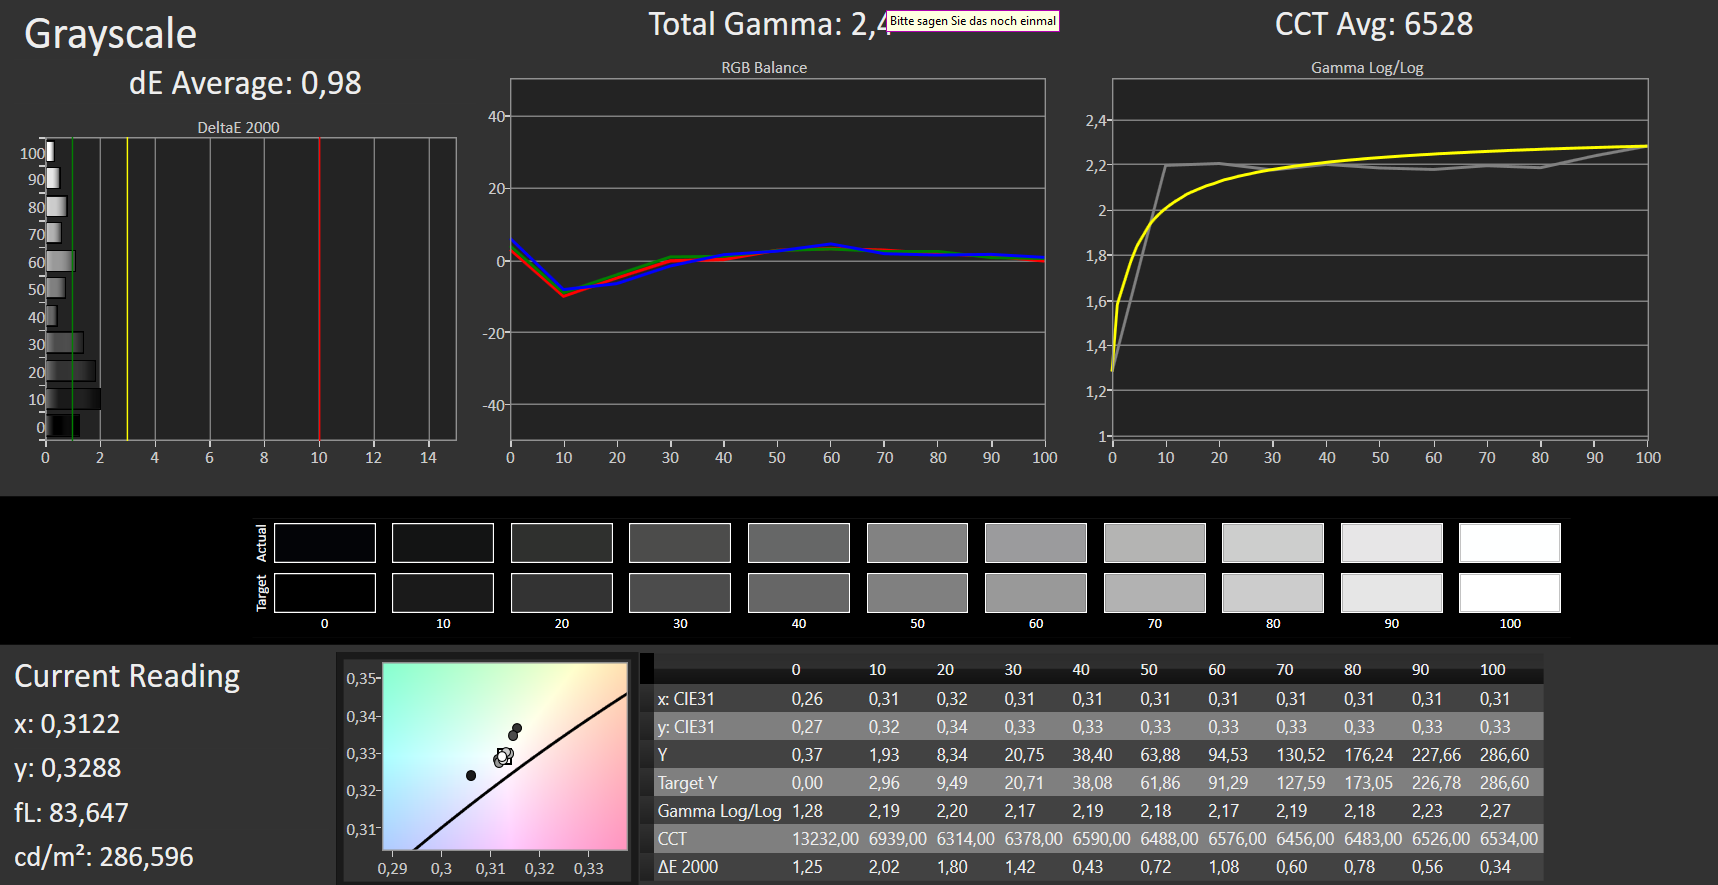
ΔE Greyscale Calman: 4.7 | ∀{0.09-98 Ø4.97}
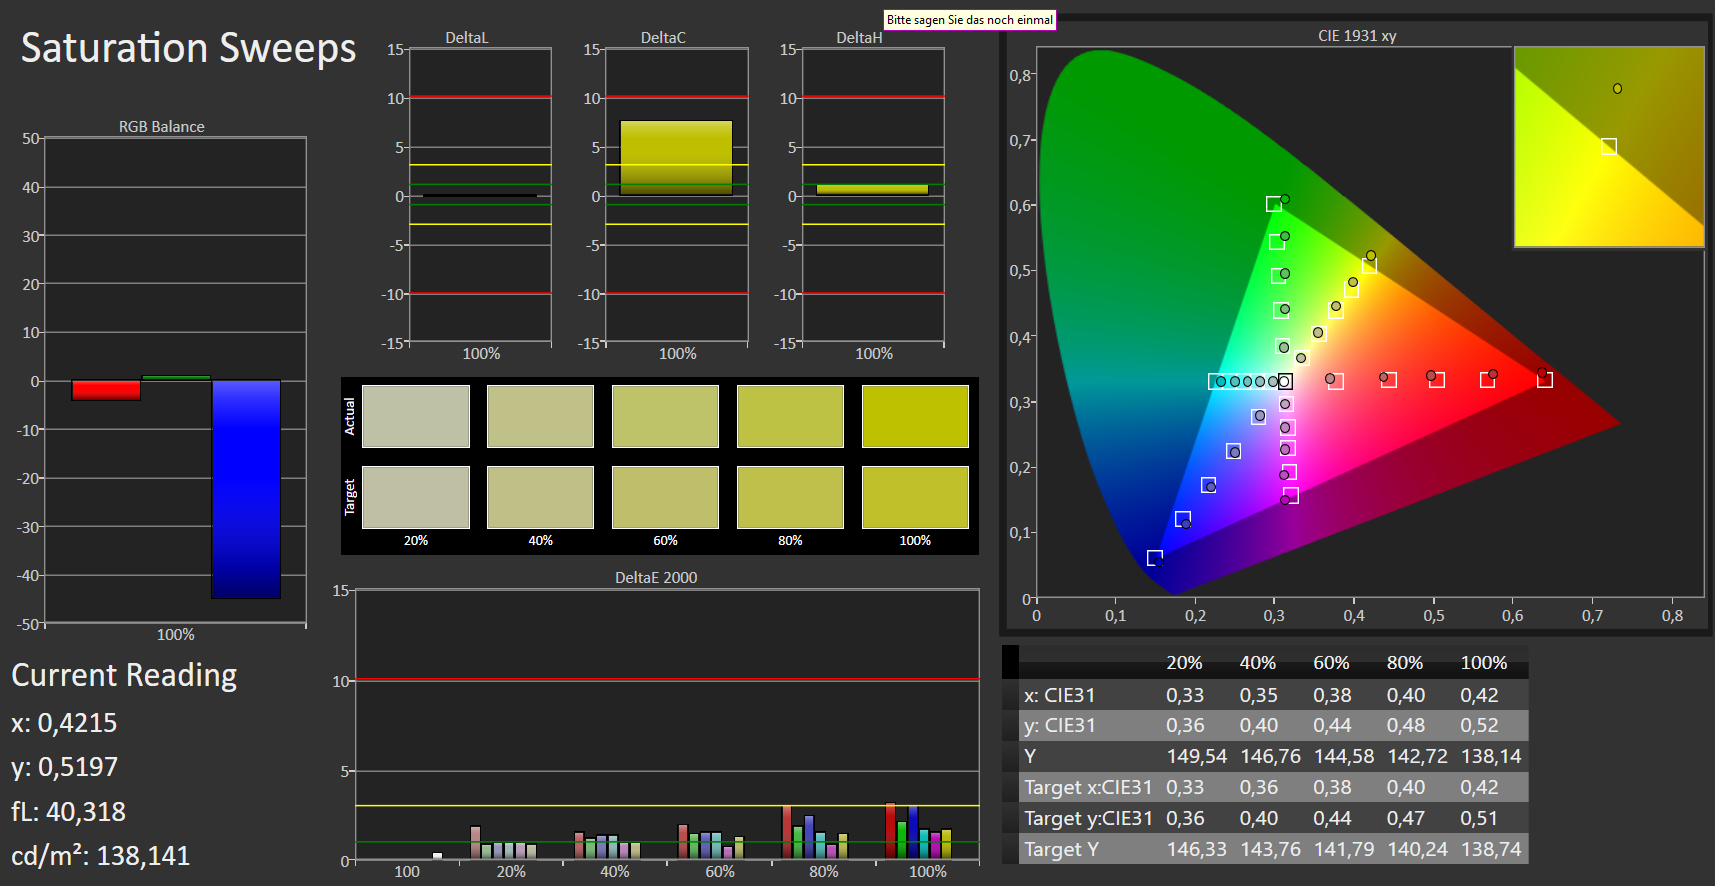
91% sRGB (Argyll 1.6.3 3D)
59% AdobeRGB 1998 (Argyll 1.6.3 3D)
65% AdobeRGB 1998 (Argyll 3D)
91% sRGB (Argyll 3D)
63.8% Display P3 (Argyll 3D)
Gamma: 2.31
CCT: 7537 K
| Schenker XMG Fusion 15 XFU15L19 BOE NV156FHM-N4G, , 1920x1080, 15.6" | Asus Zephyrus S GX502GW AU Optronics B156HAN08.2 (AUO82ED), , 1920x1080, 15.6" | Acer Predator Triton 500 PT515-51-71PZ NV156FHM-N4K (BOE082A), , 1920x1080, 15.6" | Gigabyte Aero 15 Classic-XA Sharp LQ156M1JW03 (SHP14C5), , 1920x1080, 15.6" | Razer Blade 15 RTX 2070 Max-Q LG Philips LGD05C0, , 1920x1080, 15.6" | |
|---|---|---|---|---|---|
| Display | 1% | 2% | 3% | 3% | |
| Display P3 Coverage (%) | 63.8 | 64.9 2% | 64.6 1% | 65.3 2% | 65.3 2% |
| sRGB Coverage (%) | 91 | 91 0% | 92.6 2% | 95.5 5% | 94.9 4% |
| AdobeRGB 1998 Coverage (%) | 65 | 65.9 1% | 66 2% | 66.5 2% | 66.3 2% |
| Response Times | 6% | 6% | -57% | -70% | |
| Response Time Grey 50% / Grey 80% * (ms) | 8 ? | 7.2 ? 10% | 5.2 ? 35% | 15.2 ? -90% | 16.8 ? -110% |
| Response Time Black / White * (ms) | 9 ? | 8.8 ? 2% | 11.2 ? -24% | 11.2 ? -24% | 11.6 ? -29% |
| PWM Frequency (Hz) | 23580 ? | ||||
| Screen | 6% | 12% | 9% | 8% | |
| Brightness middle (cd/m²) | 331 | 286 -14% | 288 -13% | 266 -20% | 314.7 -5% |
| Brightness (cd/m²) | 309 | 275 -11% | 265 -14% | 248 -20% | 312 1% |
| Brightness Distribution (%) | 85 | 90 6% | 84 -1% | 89 5% | 90 6% |
| Black Level * (cd/m²) | 0.32 | 0.37 -16% | 0.22 31% | 0.31 3% | 0.38 -19% |
| Contrast (:1) | 1034 | 773 -25% | 1309 27% | 858 -17% | 828 -20% |
| Colorchecker dE 2000 * | 4.5 | 2.19 51% | 3.22 28% | 2.78 38% | 2.56 43% |
| Colorchecker dE 2000 max. * | 8 | 4.4 45% | 6.26 22% | 5.96 25% | 4.89 39% |
| Colorchecker dE 2000 calibrated * | 1.9 | 2.27 -19% | 1.5 21% | 0.91 52% | 1.71 10% |
| Greyscale dE 2000 * | 4.7 | 2.2 53% | 3.43 27% | 3.58 24% | 3.4 28% |
| Gamma | 2.31 95% | 2.41 91% | 2.41 91% | 2.46 89% | 2.3 96% |
| CCT | 7537 86% | 6405 101% | 7290 89% | 7186 90% | 6435 101% |
| Color Space (Percent of AdobeRGB 1998) (%) | 59 | 59 0% | 60 2% | 62 5% | 60.7 3% |
| Color Space (Percent of sRGB) (%) | 91 | 91 0% | 93 2% | 96 5% | 94.6 4% |
| Totalt genomsnitt (program/inställningar) | 4% /
5% | 7% /
9% | -15% /
-0% | -20% /
-3% |
* ... mindre är bättre
Visa svarstider
| ↔ Svarstid svart till vitt | ||
|---|---|---|
| 9 ms ... stiga ↗ och falla ↘ kombinerat | ↗ 5 ms stiga | 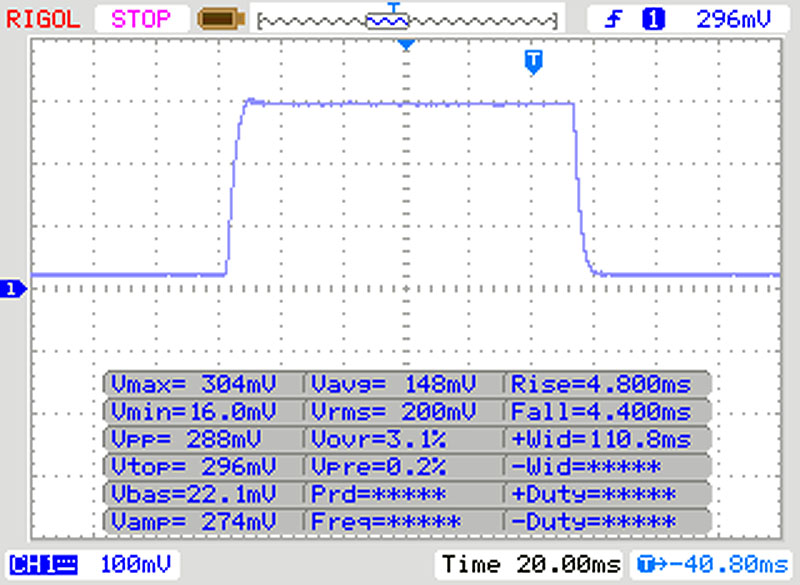 |
| ↘ 4 ms hösten | ||
| Skärmen visar snabba svarsfrekvenser i våra tester och bör passa för spel. I jämförelse sträcker sig alla testade enheter från 0.1 (minst) till 240 (maximalt) ms. » 25 % av alla enheter är bättre. Det betyder att den uppmätta svarstiden är bättre än genomsnittet av alla testade enheter (19.8 ms). | ||
| ↔ Svarstid 50 % grått till 80 % grått | ||
| 8 ms ... stiga ↗ och falla ↘ kombinerat | ↗ 4 ms stiga | 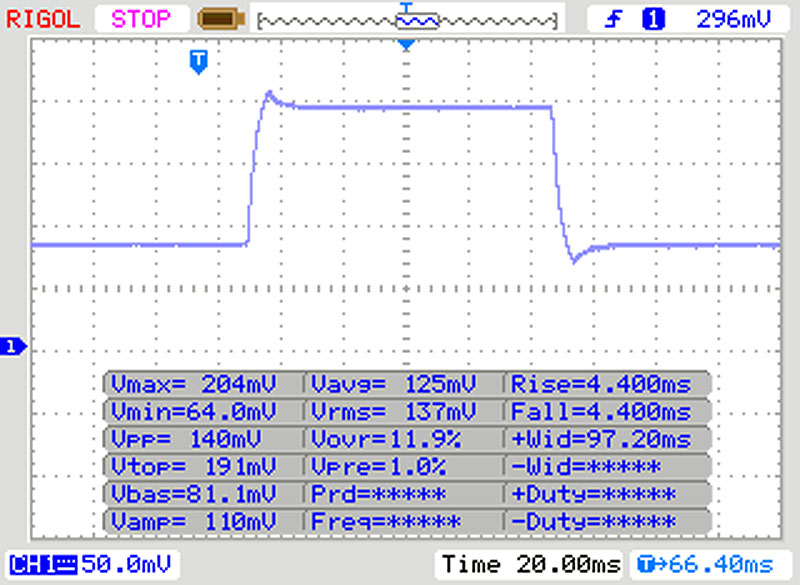 |
| ↘ 4 ms hösten | ||
| Skärmen visar snabba svarsfrekvenser i våra tester och bör passa för spel. I jämförelse sträcker sig alla testade enheter från 0.165 (minst) till 636 (maximalt) ms. » 21 % av alla enheter är bättre. Det betyder att den uppmätta svarstiden är bättre än genomsnittet av alla testade enheter (31 ms). | ||
Skärmflimmer / PWM (Puls-Width Modulation)
| Skärmflimmer / PWM upptäcktes inte | 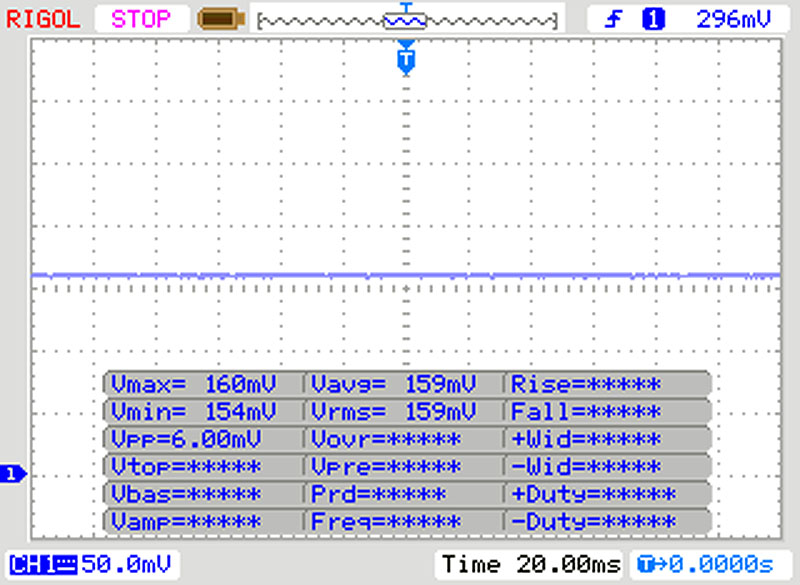 | ||
Som jämförelse: 52 % av alla testade enheter använder inte PWM för att dämpa skärmen. Om PWM upptäcktes mättes ett medelvärde av 7763 (minst: 5 - maximum: 343500) Hz. | |||
| PCMark 8 Home Score Accelerated v2 | 4890 poäng | |
| PCMark 8 Creative Score Accelerated v2 | 5931 poäng | |
| PCMark 8 Work Score Accelerated v2 | 5694 poäng | |
| PCMark 10 Score | 5784 poäng | |
Hjälp | ||
| Schenker XMG Fusion 15 XFU15L19 Samsung SSD 970 EVO Plus 500GB | Asus Zephyrus S GX502GW 2x Intel SSD 660p SSDPEKNW512G8 (RAID 0) | Acer Predator Triton 500 PT515-51-71PZ WDC PC SN720 SDAPNTW-512G | Gigabyte Aero 15 Classic-XA Intel SSD 760p SSDPEKKW512G8 | Razer Blade 15 RTX 2070 Max-Q Samsung SSD PM981 MZVLB512HAJQ | Genomsnitt Samsung SSD 970 EVO Plus 500GB | |
|---|---|---|---|---|---|---|
| CrystalDiskMark 5.2 / 6 | 7% | 15% | 13% | -8% | 29% | |
| Write 4K (MB/s) | 106.5 | 97 -9% | 108.8 2% | 115.5 8% | 93.9 -12% | 159.2 ? 49% |
| Read 4K (MB/s) | 42.24 | 49.58 17% | 40.31 -5% | 58 37% | 40.56 -4% | 48.5 ? 15% |
| Write Seq (MB/s) | 1466 | 1838 25% | 2488 70% | 1555 6% | 1468 0% | 2114 ? 44% |
| Read Seq (MB/s) | 1337 | 2421 81% | 1916 43% | 2590 94% | 1540 15% | 2044 ? 53% |
| Write 4K Q32T1 (MB/s) | 337.3 | 326.9 -3% | 382.4 13% | 369.3 9% | 293.5 -13% | 435 ? 29% |
| Read 4K Q32T1 (MB/s) | 407.6 | 372.9 -9% | 421.8 3% | 441.7 8% | 346 -15% | 508 ? 25% |
| Write Seq Q32T1 (MB/s) | 2933 | 1894 -35% | 2542 -13% | 1547 -47% | 1941 -34% | 3238 ? 10% |
| Read Seq Q32T1 (MB/s) | 3235 | 2828 -13% | 3320 3% | 2969 -8% | 3266 1% | 3499 ? 8% |
| AS SSD | -28% | -2% | -23% | -7% | 6% | |
| Seq Read (MB/s) | 2438 | 2506 3% | 2888 18% | 2517 3% | 1840 -25% | 2640 ? 8% |
| Seq Write (MB/s) | 2179 | 1712 -21% | 2374 9% | 924 -58% | 1822 -16% | 2500 ? 15% |
| 4K Read (MB/s) | 50.6 | 48.32 -5% | 42.95 -15% | 59.1 17% | 52.3 3% | 54.8 ? 8% |
| 4K Write (MB/s) | 117.2 | 103.6 -12% | 143.6 23% | 126.5 8% | 110.7 -6% | 141.2 ? 20% |
| 4K-64 Read (MB/s) | 1159 | 624 -46% | 1272 10% | 876 -24% | 1126 -3% | 1345 ? 16% |
| 4K-64 Write (MB/s) | 2359 | 1253 -47% | 1546 -34% | 922 -61% | 1717 -27% | 2116 ? -10% |
| Access Time Read * (ms) | 0.063 | 0.08 -27% | 0.042 33% | 0.047 25% | 0.0475 ? 25% | |
| Access Time Write * (ms) | 0.031 | 0.04 -29% | 0.065 -110% | 0.033 -6% | 0.02775 ? 10% | |
| Score Read (Points) | 1454 | 923 -37% | 1604 10% | 1186 -18% | 1362 -6% | 1664 ? 14% |
| Score Write (Points) | 2694 | 1528 -43% | 1927 -28% | 1141 -58% | 2010 -25% | 2507 ? -7% |
| Score Total (Points) | 4886 | 2896 -41% | 4329 -11% | 2870 -41% | 4079 -17% | 5023 ? 3% |
| Copy ISO MB/s (MB/s) | 1998 | 2086 4% | 1975 -1% | 1989 ? 0% | ||
| Copy Program MB/s (MB/s) | 511 | 454.2 -11% | 526 3% | 442 ? -14% | ||
| Copy Game MB/s (MB/s) | 1216 | 1141 -6% | 1200 -1% | 1121 ? -8% | ||
| Totalt genomsnitt (program/inställningar) | -11% /
-13% | 7% /
6% | -5% /
-10% | -8% /
-7% | 18% /
14% |
* ... mindre är bättre

| 3DMark 11 Performance | 20181 poäng | |
| 3DMark Cloud Gate Standard Score | 39529 poäng | |
| 3DMark Fire Strike Score | 17593 poäng | |
Hjälp | ||
| The Witcher 3 - 1920x1080 Ultra Graphics & Postprocessing (HBAO+) | |
| Genomsnitt av klass Gaming (95 - 240, n=7, senaste 2 åren) | |
| Asus Zephyrus S GX502GW | |
| Razer Blade 15 RTX 2070 Max-Q | |
| Genomsnitt NVIDIA GeForce RTX 2070 Max-Q (56 - 83.8, n=31) | |
| Schenker XMG Fusion 15 XFU15L19 | |
| Acer Predator Triton 500 PT515-51-71PZ | |
| Gigabyte Aero 15 Classic-XA | |
| F1 2019 - 1920x1080 Ultra High Preset AA:T AF:16x | |
| Schenker XMG Fusion 15 XFU15L19 | |
| Genomsnitt NVIDIA GeForce RTX 2070 Max-Q (97 - 112, n=5) | |
| Acer Predator Triton 500 PT515-51-71PZ | |
| Dirt Rally 2.0 - 1920x1080 Ultra Preset AA:T AF:16x | |
| Acer Predator Triton 500 PT515-51-71PZ | |
| Schenker XMG Fusion 15 XFU15L19 | |
| Asus Zephyrus S GX502GW | |
| Genomsnitt NVIDIA GeForce RTX 2070 Max-Q (68.8 - 79.1, n=4) | |
| Anthem - 1920x1080 Ultra Preset | |
| Asus Zephyrus S GX502GW | |
| Acer Predator Triton 500 PT515-51-71PZ | |
| Genomsnitt NVIDIA GeForce RTX 2070 Max-Q (67.8 - 75.7, n=4) | |
| Schenker XMG Fusion 15 XFU15L19 | |
| Farming Simulator 19 - 1920x1080 Very High Preset | |
| Schenker XMG Fusion 15 XFU15L19 | |
| Genomsnitt NVIDIA GeForce RTX 2070 Max-Q (106 - 128.1, n=2) | |
| Shadow of the Tomb Raider - 1920x1080 Highest Preset AA:T | |
| Genomsnitt av klass Gaming (96 - 116, n=2, senaste 2 åren) | |
| Genomsnitt NVIDIA GeForce RTX 2070 Max-Q (57 - 89, n=12) | |
| Asus Zephyrus S GX502GW | |
| Schenker XMG Fusion 15 XFU15L19 | |
| The Witcher 3 - 1920x1080 Ultra Graphics & Postprocessing (HBAO+) | |
| Genomsnitt av klass Gaming (95 - 240, n=7, senaste 2 åren) | |
| Asus Zephyrus S GX502GW | |
| Razer Blade 15 RTX 2070 Max-Q | |
| Genomsnitt NVIDIA GeForce RTX 2070 Max-Q (56 - 83.8, n=31) | |
| Schenker XMG Fusion 15 XFU15L19 | |
| Acer Predator Triton 500 PT515-51-71PZ | |
| Gigabyte Aero 15 Classic-XA | |
| låg | med. | hög | ultra | |
|---|---|---|---|---|
| The Witcher 3 (2015) | 66 | |||
| Shadow of the Tomb Raider (2018) | 77 | 72 | ||
| Farming Simulator 19 (2018) | 128.1 | |||
| Anthem (2019) | 70.6 | |||
| Dirt Rally 2.0 (2019) | 77.4 | |||
| F1 2019 (2019) | 105 |
Ljudnivå
| Låg belastning |
| 30 / 30 / 30 dB(A) |
| Hög belastning |
| 46 / 51.6 dB(A) |
 | ||
30 dB tyst 40 dB(A) hörbar 50 dB(A) högt ljud |
||
min: | ||
| Schenker XMG Fusion 15 XFU15L19 GeForce RTX 2070 Max-Q, i7-9750H, Samsung SSD 970 EVO Plus 500GB | Asus Zephyrus S GX502GW GeForce RTX 2070 Mobile, i7-9750H, 2x Intel SSD 660p SSDPEKNW512G8 (RAID 0) | Acer Predator Triton 500 PT515-51-71PZ GeForce RTX 2070 Max-Q, i7-9750H, WDC PC SN720 SDAPNTW-512G | Gigabyte Aero 15 Classic-XA GeForce RTX 2070 Max-Q, i7-9750H, Intel SSD 760p SSDPEKKW512G8 | Razer Blade 15 RTX 2070 Max-Q GeForce RTX 2070 Max-Q, i7-8750H, Samsung SSD PM981 MZVLB512HAJQ | |
|---|---|---|---|---|---|
| Emissions | |||||
| Fan Noise (dB(A)) | 51.6 | ||||
| Noise | -9% | -5% | -8% | 9% | |
| av / miljö * (dB) | 30 | 30 -0% | 30 -0% | 30 -0% | 28.8 4% |
| Idle Minimum * (dB) | 30 | 31 -3% | 30 -0% | 31 -3% | 28.8 4% |
| Idle Average * (dB) | 30 | 33 -10% | 33 -10% | 34 -13% | 28.8 4% |
| Idle Maximum * (dB) | 30 | 38 -27% | 39 -30% | 39 -30% | 29.4 2% |
| Load Average * (dB) | 46 | 50 -9% | 45 2% | 46 -0% | 35.7 22% |
| Witcher 3 ultra * (dB) | 51.5 | 53 -3% | 49 5% | 53 -3% | 42.5 17% |
| Load Maximum * (dB) | 51.6 | 56 -9% | 51 1% | 55 -7% | 45 13% |
| Totalt genomsnitt (program/inställningar) | -9% /
-9% | -5% /
-5% | -8% /
-8% | 9% /
9% |
* ... mindre är bättre
(-) Den maximala temperaturen på ovansidan är 52.7 °C / 127 F, jämfört med genomsnittet av 40.4 °C / 105 F , allt från 21.2 till 68.8 °C för klassen Gaming.
(-) Botten värms upp till maximalt 52.2 °C / 126 F, jämfört med genomsnittet av 43.2 °C / 110 F
(±) Vid tomgångsbruk är medeltemperaturen för ovansidan 32.3 °C / 90 F, jämfört med enhetsgenomsnittet på 33.9 °C / ### class_avg_f### F.
(-) När du spelar The Witcher 3 är medeltemperaturen för ovansidan 42.1 °C / 108 F, jämfört med enhetsgenomsnittet på 33.9 °C / ## #class_avg_f### F.
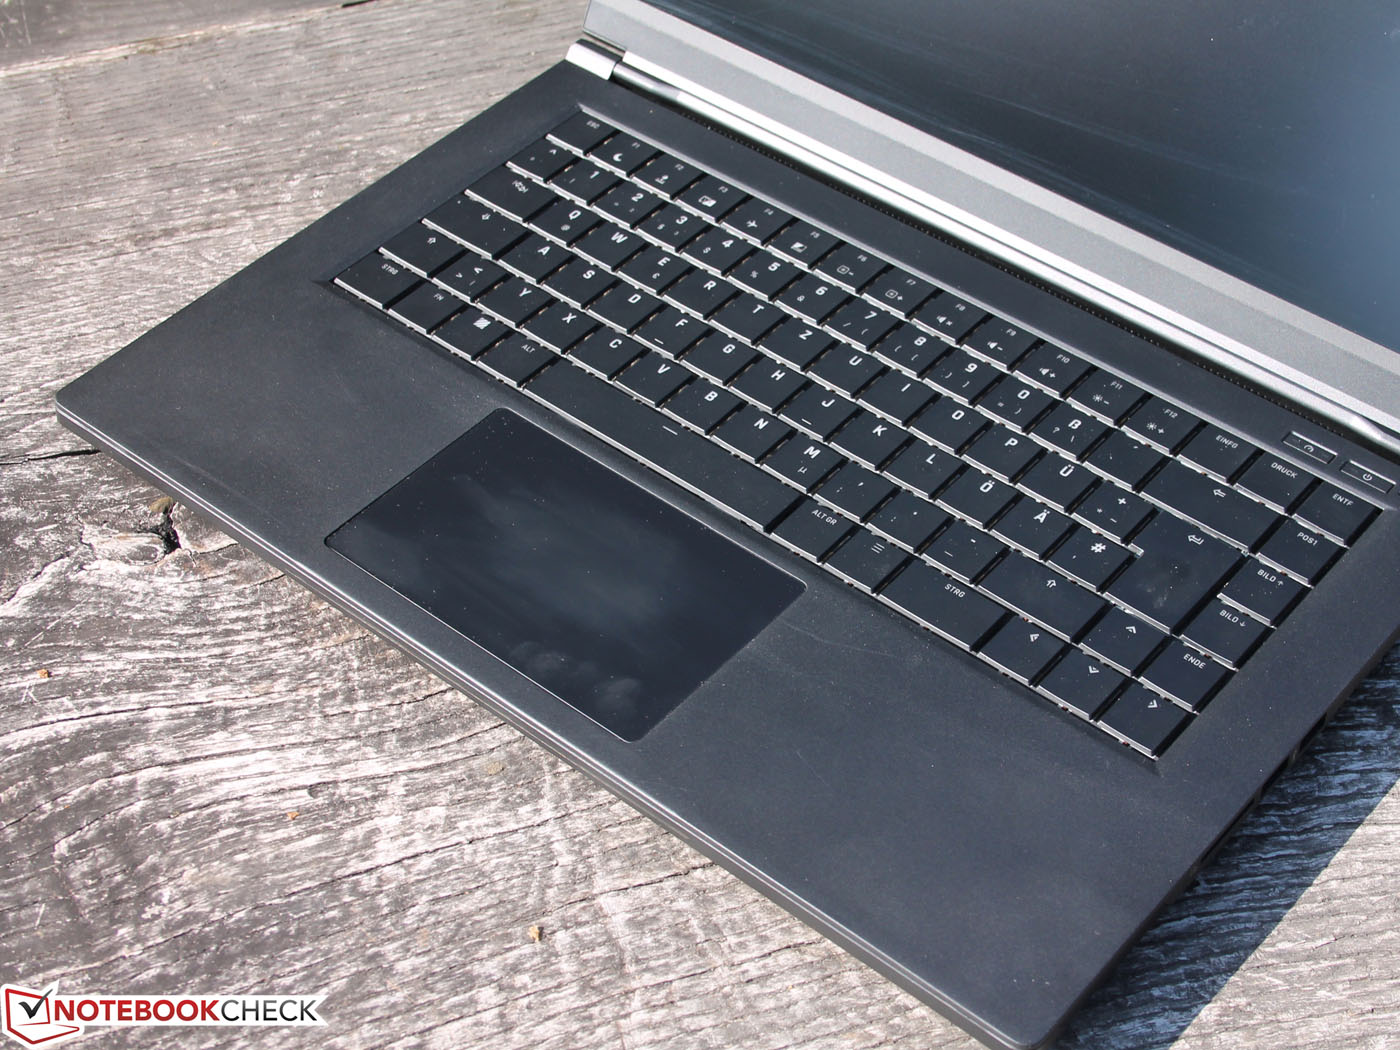
(±) Handledsstöden och pekplattan kan bli väldigt varma vid beröring med maximalt 37.1 °C / 98.8 F.
(-) Medeltemperaturen för handledsstödsområdet på liknande enheter var 28.8 °C / 83.8 F (-8.3 °C / -15 F).
Schenker XMG Fusion 15 XFU15L19 ljudanalys
(-) | inte särskilt höga högtalare (67 dB)
Bas 100 - 315 Hz
(-) | nästan ingen bas - i genomsnitt 17.3% lägre än medianen
(±) | linjäriteten för basen är genomsnittlig (11.3% delta till föregående frekvens)
Mellan 400 - 2000 Hz
(±) | högre mellan - i genomsnitt 6% högre än median
(±) | linjäriteten för mids är genomsnittlig (12.9% delta till föregående frekvens)
Högsta 2 - 16 kHz
(+) | balanserade toppar - endast 3.1% från medianen
(±) | linjäriteten för toppar är genomsnittlig (12% delta till föregående frekvens)
Totalt 100 - 16 000 Hz
(±) | linjäriteten för det totala ljudet är genomsnittlig (26.9% skillnad mot median)
Jämfört med samma klass
» 93% av alla testade enheter i den här klassen var bättre, 2% liknande, 6% sämre
» Den bästa hade ett delta på 6%, genomsnittet var 18%, sämst var 132%
Jämfört med alla testade enheter
» 82% av alla testade enheter var bättre, 4% liknande, 14% sämre
» Den bästa hade ett delta på 4%, genomsnittet var 23%, sämst var 134%
Asus Zephyrus S GX502GW ljudanalys
(+) | högtalare kan spela relativt högt (90 dB)
Bas 100 - 315 Hz
(±) | reducerad bas - i genomsnitt 12.7% lägre än medianen
(±) | linjäriteten för basen är genomsnittlig (8.5% delta till föregående frekvens)
Mellan 400 - 2000 Hz
(+) | balanserad mellan - endast 4.5% från medianen
(+) | mids är linjära (4.1% delta till föregående frekvens)
Högsta 2 - 16 kHz
(±) | högre toppar - i genomsnitt 6.7% högre än medianen
(±) | linjäriteten för toppar är genomsnittlig (10.8% delta till föregående frekvens)
Totalt 100 - 16 000 Hz
(+) | det totala ljudet är linjärt (14.6% skillnad mot median)
Jämfört med samma klass
» 28% av alla testade enheter i den här klassen var bättre, 7% liknande, 65% sämre
» Den bästa hade ett delta på 6%, genomsnittet var 18%, sämst var 132%
Jämfört med alla testade enheter
» 19% av alla testade enheter var bättre, 4% liknande, 77% sämre
» Den bästa hade ett delta på 4%, genomsnittet var 23%, sämst var 134%
| Av/Standby | |
| Låg belastning | |
| Hög belastning |
|
Förklaring:
min: | |
| Schenker XMG Fusion 15 XFU15L19 i7-9750H, GeForce RTX 2070 Max-Q, Samsung SSD 970 EVO Plus 500GB, IPS, 1920x1080, 15.6" | Asus Zephyrus S GX502GW i7-9750H, GeForce RTX 2070 Mobile, 2x Intel SSD 660p SSDPEKNW512G8 (RAID 0), IPS, 1920x1080, 15.6" | Acer Predator Triton 500 PT515-51-71PZ i7-9750H, GeForce RTX 2070 Max-Q, WDC PC SN720 SDAPNTW-512G, IPS, 1920x1080, 15.6" | Gigabyte Aero 15 Classic-XA i7-9750H, GeForce RTX 2070 Max-Q, Intel SSD 760p SSDPEKKW512G8, IGZO, 1920x1080, 15.6" | Razer Blade 15 RTX 2070 Max-Q i7-8750H, GeForce RTX 2070 Max-Q, Samsung SSD PM981 MZVLB512HAJQ, IPS, 1920x1080, 15.6" | Genomsnitt NVIDIA GeForce RTX 2070 Max-Q | Genomsnitt av klass Gaming | |
|---|---|---|---|---|---|---|---|
| Power Consumption | -61% | 15% | -43% | 8% | -28% | -22% | |
| Idle Minimum * (Watt) | 7.5 | 24 -220% | 7 7% | 21 -180% | 10.4 -39% | 15.4 ? -105% | 13 ? -73% |
| Idle Average * (Watt) | 14.6 | 27 -85% | 12 18% | 23 -58% | 14.6 -0% | 20 ? -37% | 18.7 ? -28% |
| Idle Maximum * (Watt) | 17 | 33 -94% | 22 -29% | 32 -88% | 16.3 4% | 26.7 ? -57% | 24.3 ? -43% |
| Load Average * (Watt) | 181 | 129 29% | 86 52% | 97 46% | 88.5 51% | 105.2 ? 42% | 108.2 ? 40% |
| Witcher 3 ultra * (Watt) | 170 | 176 -4% | 144 15% | 148 13% | 155.4 9% | ||
| Load Maximum * (Watt) | 243 | 216 11% | 177 27% | 213 12% | 182.4 25% | 201 ? 17% | 254 ? -5% |
* ... mindre är bättre
| Schenker XMG Fusion 15 XFU15L19 i7-9750H, GeForce RTX 2070 Max-Q, 93 Wh | Asus Zephyrus S GX502GW i7-9750H, GeForce RTX 2070 Mobile, 76 Wh | Acer Predator Triton 500 PT515-51-71PZ i7-9750H, GeForce RTX 2070 Max-Q, Wh | Gigabyte Aero 15 Classic-XA i7-9750H, GeForce RTX 2070 Max-Q, 94.24 Wh | Razer Blade 15 RTX 2070 Max-Q i7-8750H, GeForce RTX 2070 Max-Q, 80 Wh | Gigabyte Aero 15-X9 i7-8750H, GeForce RTX 2070 Max-Q, 94.24 Wh | Acer Predator Triton 500 i7-8750H, GeForce RTX 2080 Max-Q, 82 Wh | MSI GS65 8RF-019DE Stealth Thin i7-8750H, GeForce GTX 1070 Max-Q, 82 Wh | Genomsnitt av klass Gaming | |
|---|---|---|---|---|---|---|---|---|---|
| Batteridrifttid | -36% | 20% | 38% | 10% | 33% | -31% | -5% | 4% | |
| Reader / Idle (h) | 9.3 | 5.9 -37% | 11.1 19% | 9.1 -2% | 11.4 23% | 9.2 -1% | 5.6 -40% | 8.5 -9% | 8.71 ? -6% |
| WiFi v1.3 (h) | 6 | 3.7 -38% | 8 33% | 7 17% | 6.5 8% | 6.4 7% | 3.2 -47% | 6 0% | 7 ? 17% |
| Load (h) | 1.5 | 1 -33% | 1.6 7% | 3 100% | 1.5 0% | 2.9 93% | 1.4 -7% | 1.4 -7% | 1.51 ? 1% |
| H.264 (h) | 6.8 | 6.1 | 5.9 | 8.9 ? |
För
Emot
Läs den fullständiga versionen av den här recensionen på engelska här.
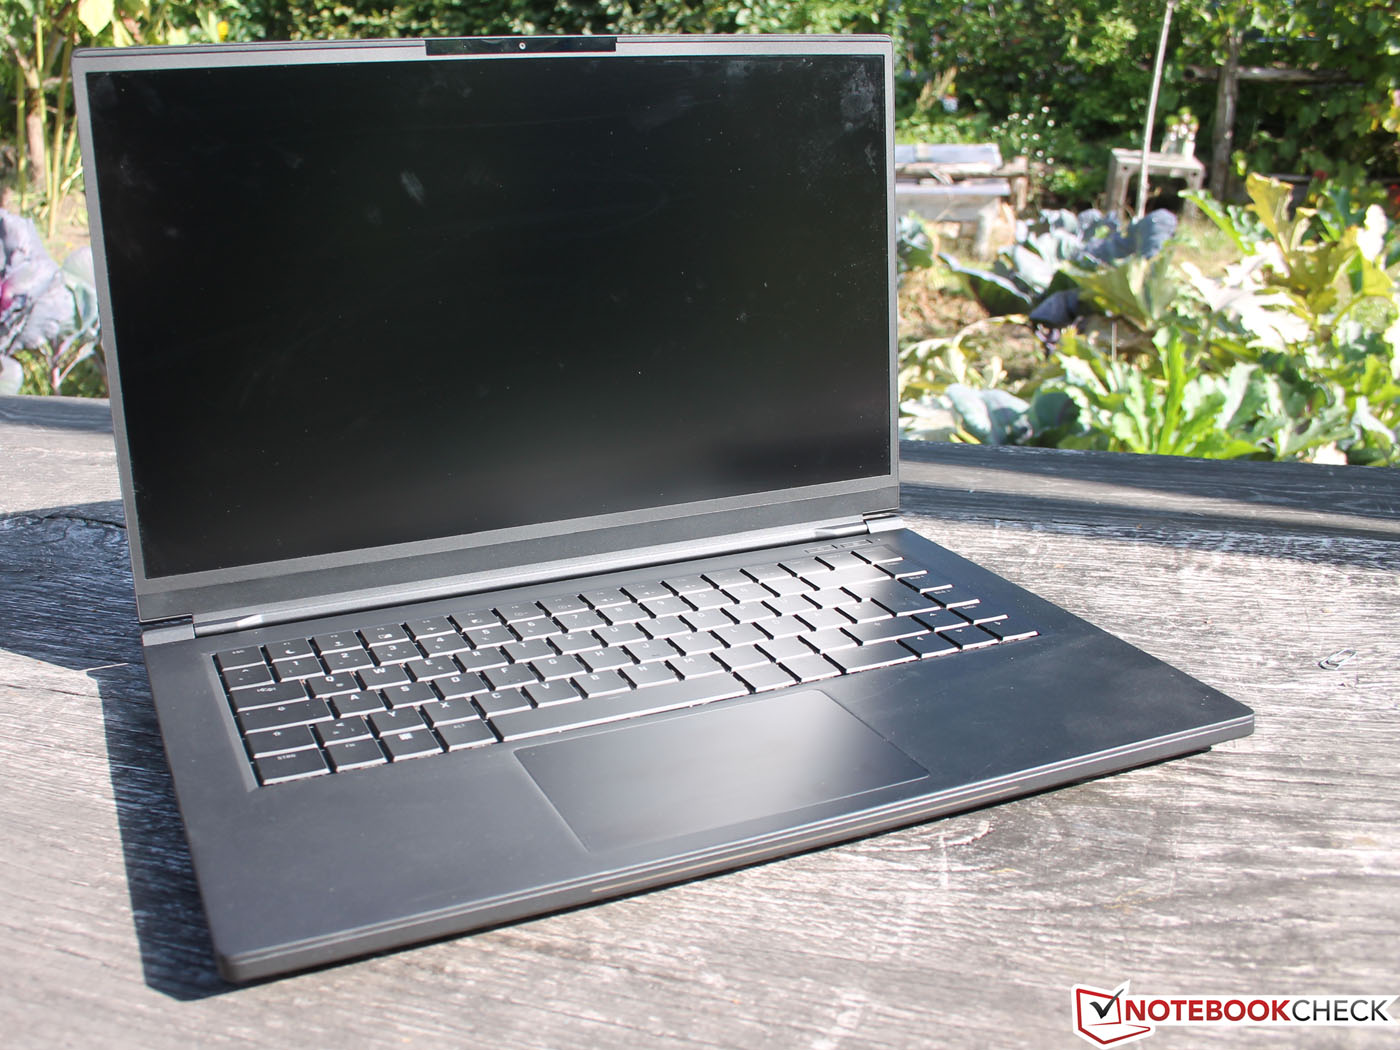
Den tekniska sidan har fått stor nytta av samarbetet mellan Intel och Schenker: Fusion 15 har mer prestanda än andra konkurrerande tunna spellaptops trots att de är utrustade med samma hårdvara. Det är i huvudsak processorn som drar nytta av detta, men skillnaden i spel är minimal. Detta speglar inte bara kyllösningen positivt utan säger också något om balansen mellan chippen och GPU:ns energibegränsningar.
Vår konfiguration av Fusion 15 (RTX 2070) kombinerar mobilitet och prestanda, som ofta står mot varandra, på ett sätt få andra enheter lyckas med.
Å andra sidan har den tunna 15-tumsdatorn förvånansvärt bra batteritid: Vi uppmätte en batteritid på sex till straxt över nio timmar i vårt WiFi-test respektive vid tomgång. Även om det finns andra enheter som kan matcha de siffrorna (Acer Predator Triton 500) kan de inte få ut samma prestanda ur komponenterna när datorn är ansluten till elnätet.
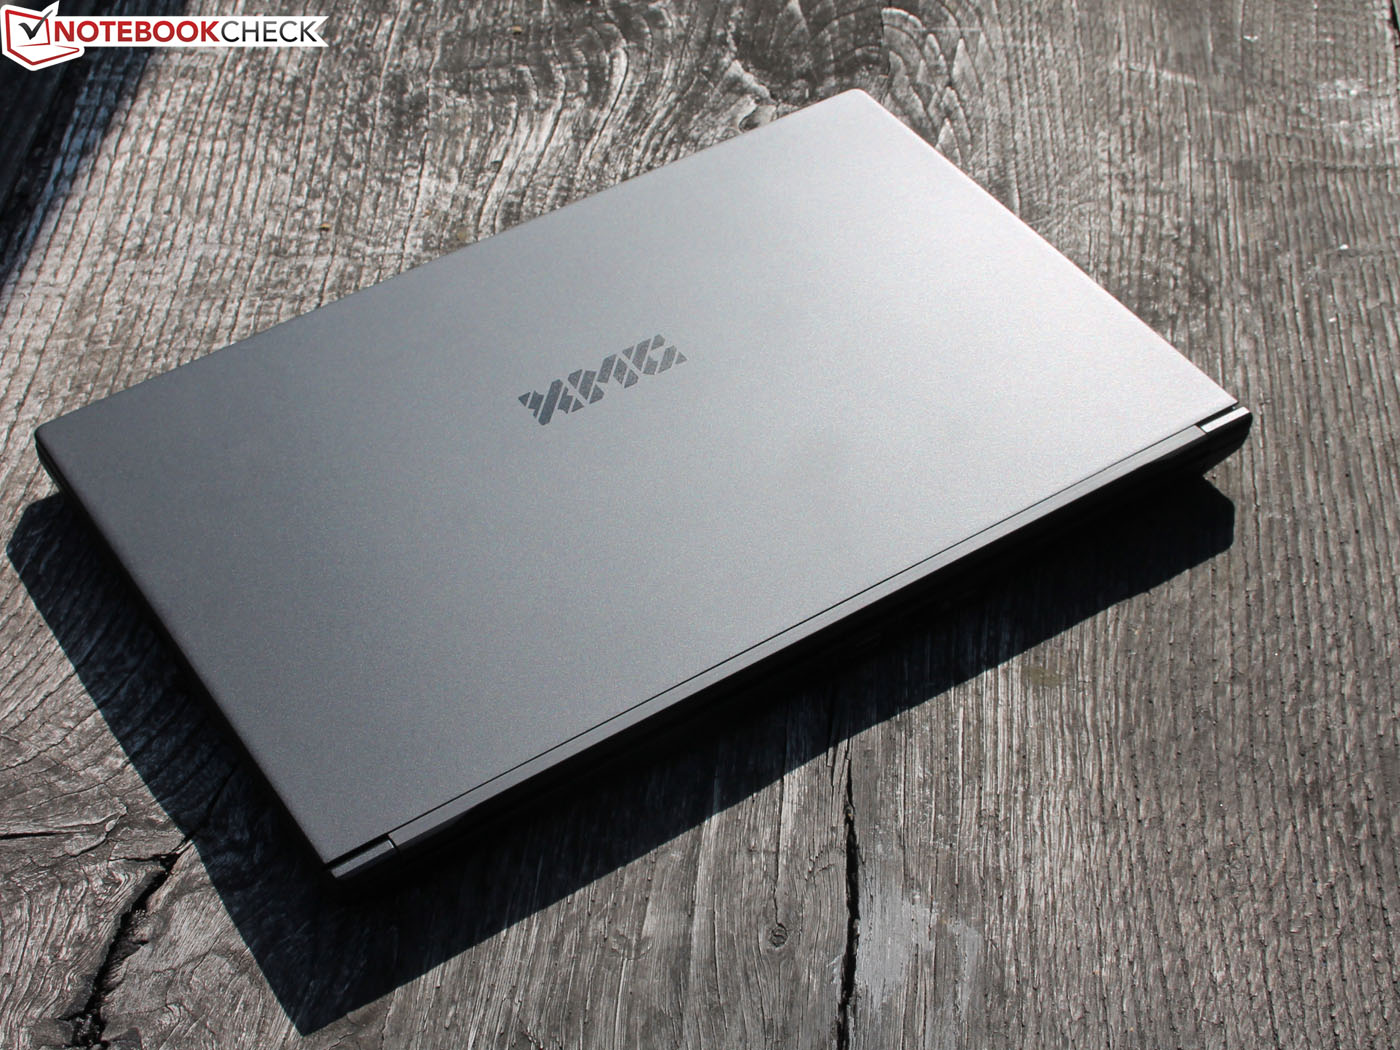
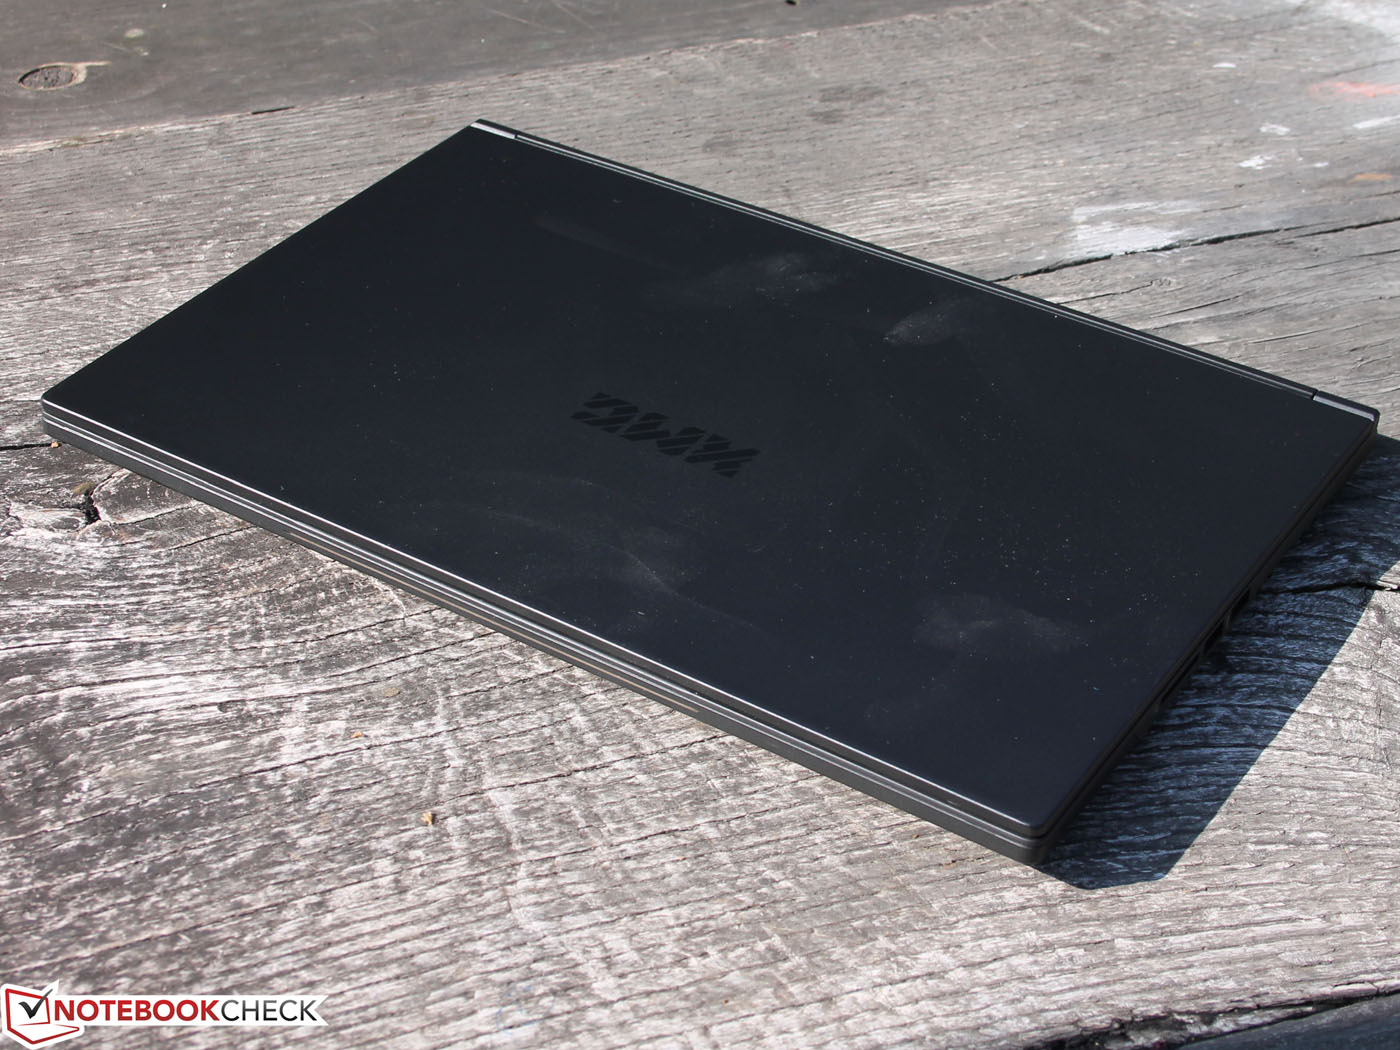
Höljet av aluminium/magnesium-legering väger hela 200 gram mindre än motsvarigheten i rent aluminium. Trots detta håller det blygsamma, matta och lätthanterliga höljet hög kvalitet.
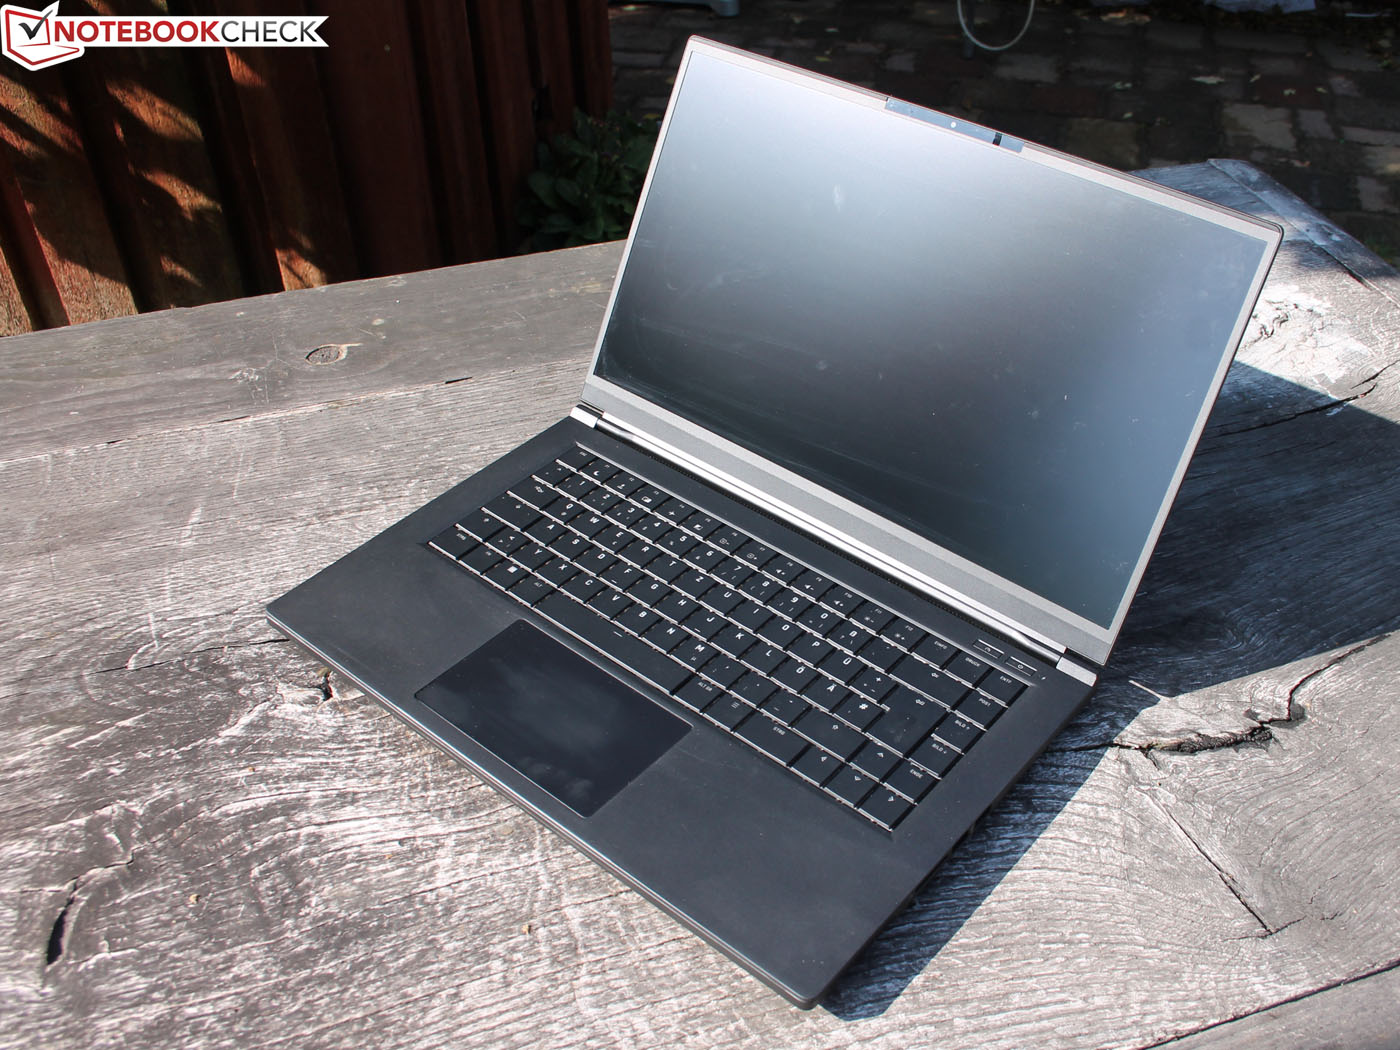
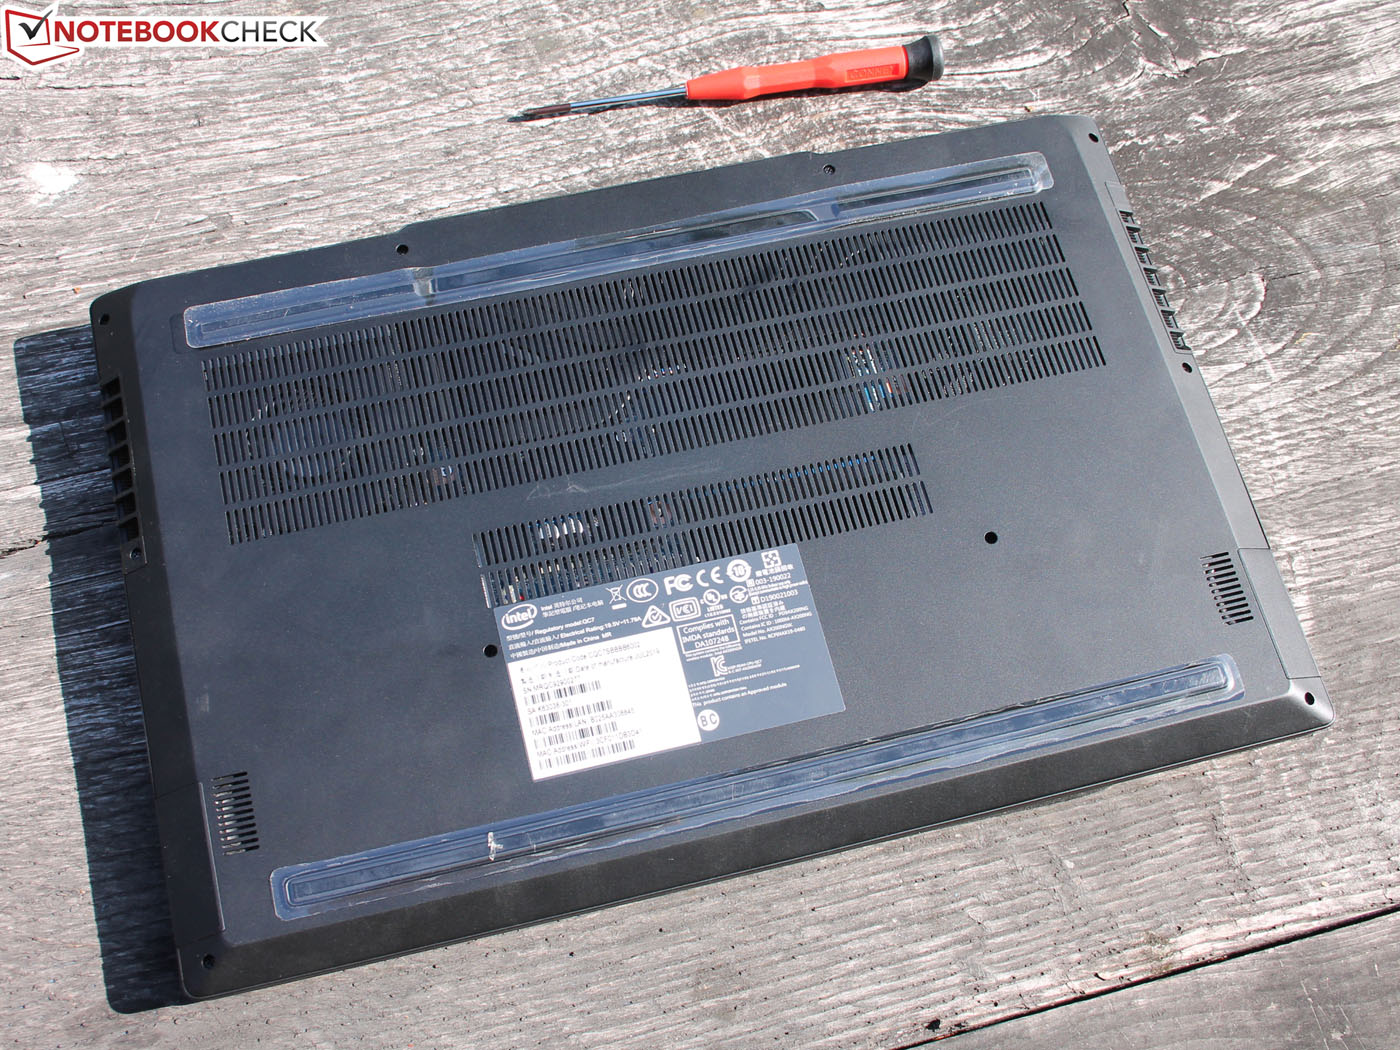
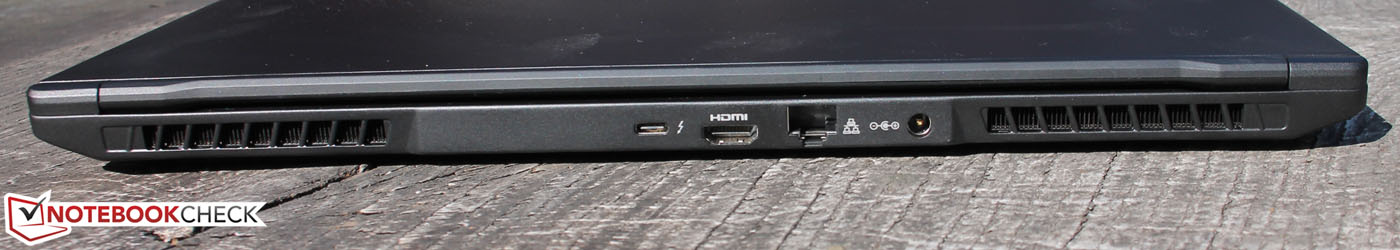
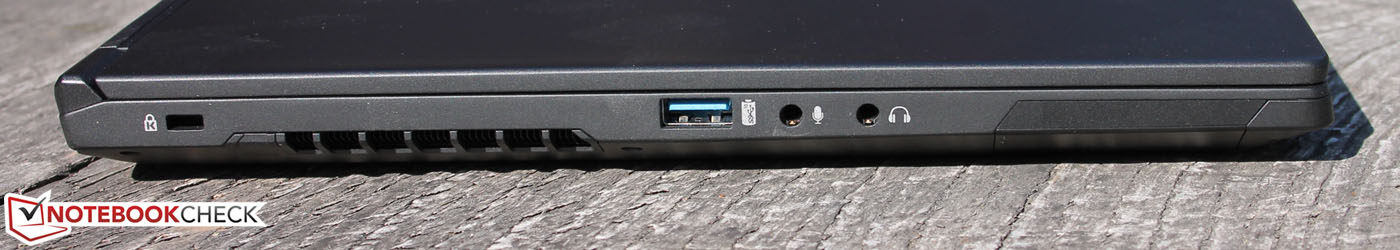
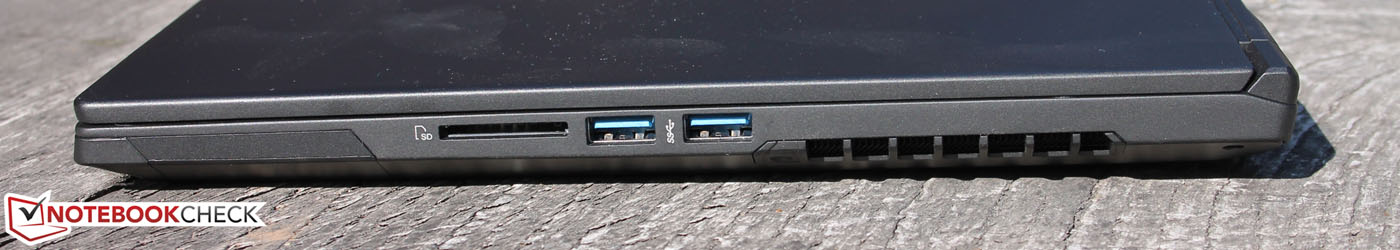
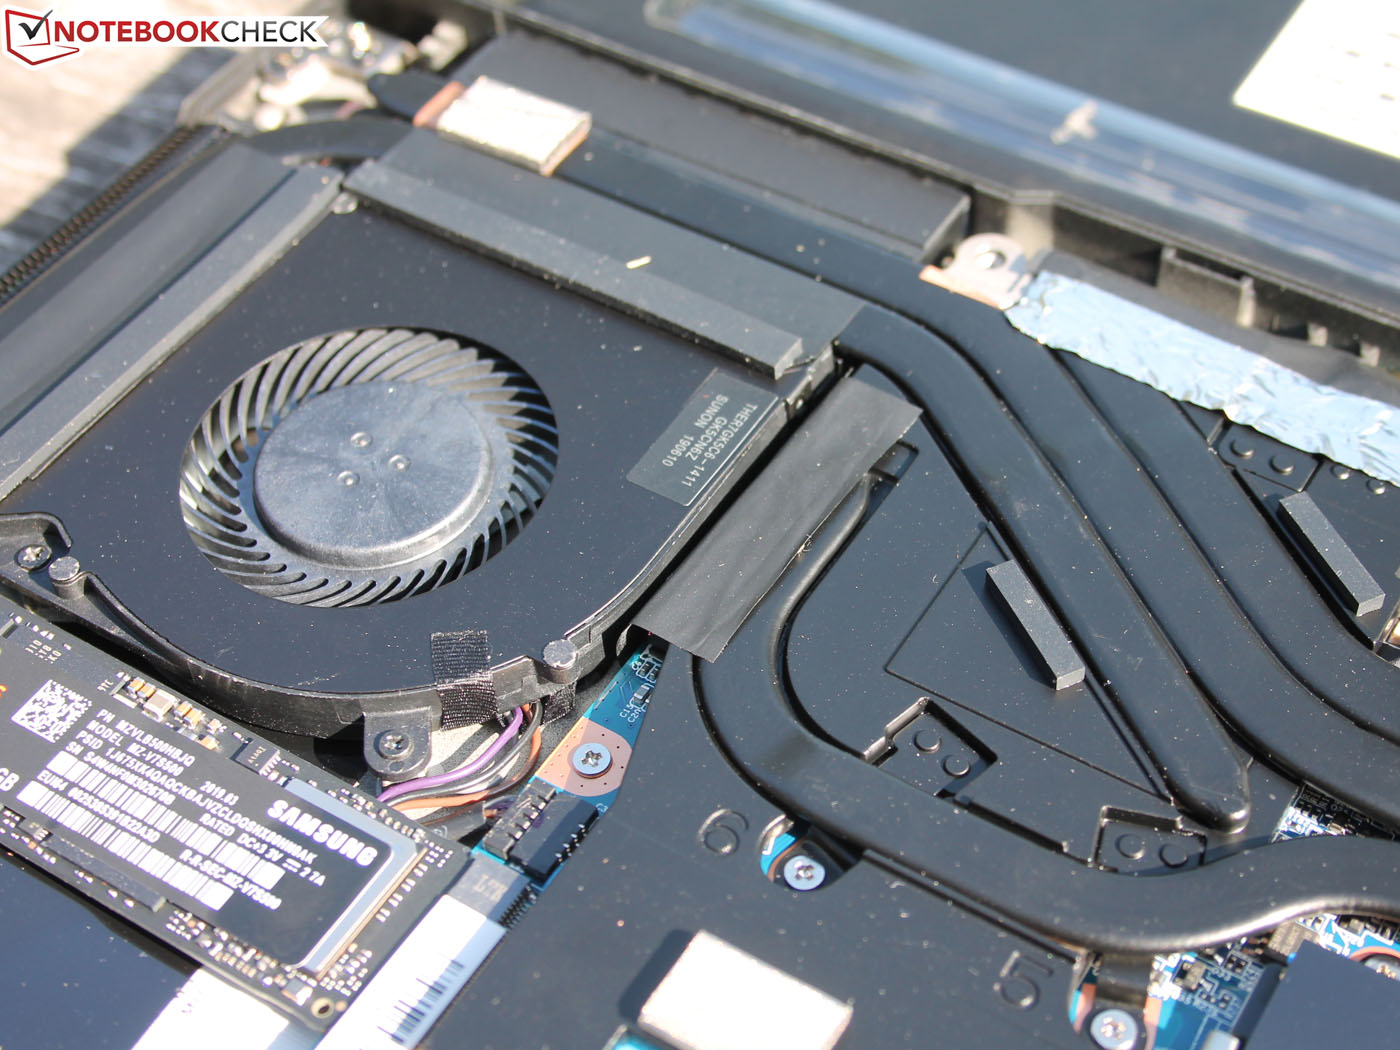
Schenker kompromissar heller inte när det kommer till anslutbarhet, underhåll och möjlighet till uppgraderingar. En Thunderbolt-anslutning med stöd för DisplayPort och två M.2 2280-platser är båda imponerande.
Bristerna rör i huvudsak att den låter mycket vid belastning eller när man spelar spel. För kreativt arbete kan avsaknaden av fullständig sRGB-täckning och lågt kontrastförhållande också vara ett problem. Å andra sidan kommer inte gamers påverkas lika mycket av detta och kan istället uppskatta 144 Hz och korta responstider. Detta kompenserar nästan för det undermåliga kontrastförhållandet.
Om du letar efter ännu mer prestanda kanske inte tunn-och-lätt kategorin är för dig. Schenker och Intel har skapat en riktigt bra mix av mobilitet och prestanda.
Schenker XMG Fusion 15 XFU15L19
- 10/17/2019 v7 (old)
Sebastian Jentsch
Price comparison
