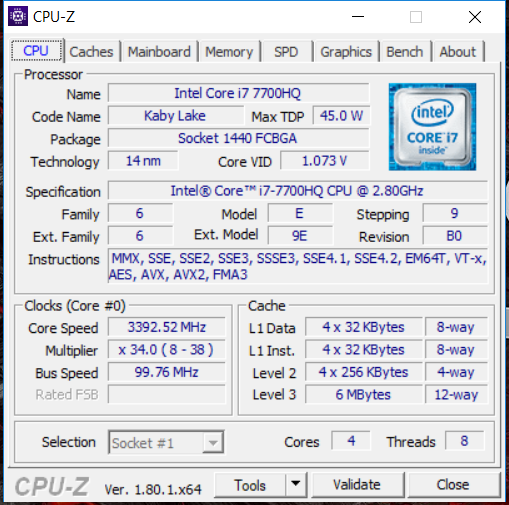
Test: MSI GE63VR Raider-075 (i7-7700HQ, GTX 1070, Full HD) Laptop (Sammanfattning)


| SD Card Reader | |
| average JPG Copy Test (av. of 3 runs) | |
| MSI GE63VR 7RF Raider (Toshiba Exceria Pro SDXC 64 GB UHS-II) | |
| Acer Predator 15 G9-593-751X (Toshiba Exceria Pro SDXC 64 GB UHS-II) | |
| maximum AS SSD Seq Read Test (1GB) | |
| MSI GE63VR 7RF Raider (Toshiba Exceria Pro SDXC 64 GB UHS-II) | |
| Acer Predator 15 G9-593-751X (Toshiba Exceria Pro SDXC 64 GB UHS-II) | |
| Networking | |
| iperf3 transmit AX12 | |
| Acer Predator 15 G9-593-751X | |
| Alienware 15 R3 | |
| MSI GE63VR 7RF Raider | |
| Asus Zephyrus GX501VS | |
| iperf3 receive AX12 | |
| Acer Predator 15 G9-593-751X | |
| MSI GE63VR 7RF Raider | |
| Alienware 15 R3 | |
| Asus Zephyrus GX501VS | |
| |||||||||||||||||||||||||
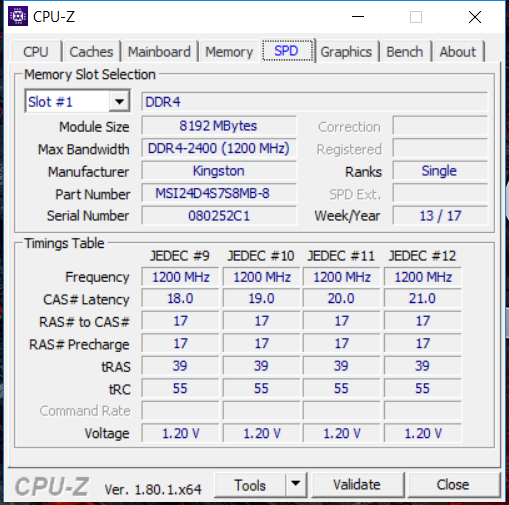
Distribution av ljusstyrkan: 84 %
Mitt på batteriet: 285 cd/m²
Kontrast: 1239:1 (Svärta: 0.23 cd/m²)
ΔE ColorChecker Calman: 3.52 | ∀{0.5-29.43 Ø4.71}
ΔE Greyscale Calman: 3.41 | ∀{0.09-98 Ø4.96}
100% sRGB (Argyll 1.6.3 3D)
77% AdobeRGB 1998 (Argyll 1.6.3 3D)
86.7% AdobeRGB 1998 (Argyll 3D)
100% sRGB (Argyll 3D)
91.3% Display P3 (Argyll 3D)
Gamma: 2.05
CCT: 7077 K
| MSI GE63VR 7RF Raider Chi Mei N156HHE-GA1 (CMN15F4), 1920x1080, 15.6" | Acer Predator 15 G9-593-751X LG Philips LP156WF6-SPP1 (LGD04D5), 1920x1080, 15.6" | Alienware 15 R3 HPJGK_B156HTN (AUO51ED), 1920x1080, 15.6" | Asus Zephyrus GX501VS ID: AUO42ED, Name: AU Optronics B156HAN04.2, 1920x1080, 15.6" | |
|---|---|---|---|---|
| Display | -23% | -20% | -25% | |
| Display P3 Coverage (%) | 91.3 | 65.4 -28% | 66 -28% | 62.1 -32% |
| sRGB Coverage (%) | 100 | 85.5 -14% | 90.5 -9% | 85.6 -14% |
| AdobeRGB 1998 Coverage (%) | 86.7 | 62.5 -28% | 66.2 -24% | 62.4 -28% |
| Response Times | -271% | -114% | -268% | |
| Response Time Grey 50% / Grey 80% * (ms) | 9.6 ? | 36 ? -275% | 25 ? -160% | 33.2 ? -246% |
| Response Time Black / White * (ms) | 7.2 ? | 26.4 ? -267% | 12 ? -67% | 28 ? -289% |
| PWM Frequency (Hz) | 26000 ? | 20830 ? | ||
| Screen | -26% | -66% | -10% | |
| Brightness middle (cd/m²) | 285 | 295 4% | 386 35% | 307.1 8% |
| Brightness (cd/m²) | 273 | 274 0% | 382 40% | 309 13% |
| Brightness Distribution (%) | 84 | 88 5% | 93 11% | 86 2% |
| Black Level * (cd/m²) | 0.23 | 0.32 -39% | 0.39 -70% | 0.35 -52% |
| Contrast (:1) | 1239 | 922 -26% | 990 -20% | 877 -29% |
| Colorchecker dE 2000 * | 3.52 | 4.59 -30% | 10.2 -190% | 3.4 3% |
| Colorchecker dE 2000 max. * | 5.18 | 11 -112% | 15.81 -205% | 8.2 -58% |
| Greyscale dE 2000 * | 3.41 | 4.03 -18% | 11.28 -231% | 1.4 59% |
| Gamma | 2.05 107% | 2.3 96% | 2.23 99% | 2.19 100% |
| CCT | 7077 92% | 7229 90% | 11383 57% | 6558 99% |
| Color Space (Percent of AdobeRGB 1998) (%) | 77 | 56 -27% | 59 -23% | 55.6 -28% |
| Color Space (Percent of sRGB) (%) | 100 | 85 -15% | 90 -10% | 85 -15% |
| Totalt genomsnitt (program/inställningar) | -107% /
-58% | -67% /
-63% | -101% /
-47% |
* ... mindre är bättre
Visa svarstider
| ↔ Svarstid svart till vitt | ||
|---|---|---|
| 7.2 ms ... stiga ↗ och falla ↘ kombinerat | ↗ 5 ms stiga | 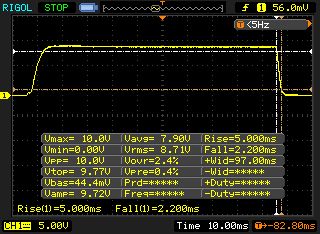 |
| ↘ 2.2 ms hösten | ||
| Skärmen visar väldigt snabba svarsfrekvenser i våra tester och borde vara mycket väl lämpad för fartfyllt spel. I jämförelse sträcker sig alla testade enheter från 0.1 (minst) till 240 (maximalt) ms. » 22 % av alla enheter är bättre. Det betyder att den uppmätta svarstiden är bättre än genomsnittet av alla testade enheter (19.8 ms). | ||
| ↔ Svarstid 50 % grått till 80 % grått | ||
| 9.6 ms ... stiga ↗ och falla ↘ kombinerat | ↗ 5.2 ms stiga | 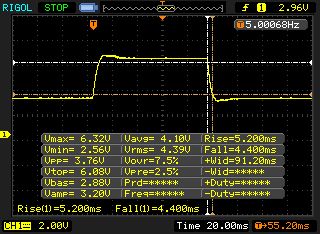 |
| ↘ 4.4 ms hösten | ||
| Skärmen visar snabba svarsfrekvenser i våra tester och bör passa för spel. I jämförelse sträcker sig alla testade enheter från 0.165 (minst) till 636 (maximalt) ms. » 23 % av alla enheter är bättre. Det betyder att den uppmätta svarstiden är bättre än genomsnittet av alla testade enheter (31 ms). | ||
Skärmflimmer / PWM (Puls-Width Modulation)
| Skärmflimmer / PWM upptäckt | 26000 Hz | ≤ 25 % ljusstyrka inställning | 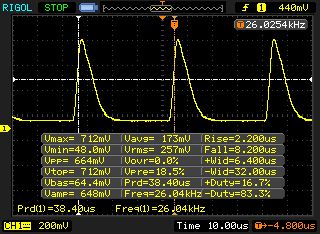 |
Displayens bakgrundsbelysning flimrar vid 26000 Hz (i värsta fall, t.ex. med PWM) Flimrande upptäckt vid en ljusstyrkeinställning på 25 % och lägre. Det ska inte finnas något flimmer eller PWM över denna ljusstyrkeinställning. Frekvensen för 26000 Hz är ganska hög, så de flesta användare som är känsliga för PWM bör inte märka något flimmer. Som jämförelse: 52 % av alla testade enheter använder inte PWM för att dämpa skärmen. Om PWM upptäcktes mättes ett medelvärde av 7754 (minst: 5 - maximum: 343500) Hz. | |||
| Cinebench R15 | |
| CPU Single 64Bit | |
| Alienware 15 R3 | |
| Acer Predator 15 G9-593-751X | |
| MSI GE63VR 7RF Raider | |
| Asus Zephyrus GX501VS | |
| CPU Multi 64Bit | |
| Acer Predator 15 G9-593-751X | |
| Alienware 15 R3 | |
| Asus Zephyrus GX501VS | |
| MSI GE63VR 7RF Raider | |
| PCMark 8 | |
| Home Score Accelerated v2 | |
| Acer Predator 15 G9-593-751X | |
| Asus Zephyrus GX501VS | |
| Alienware 15 R3 | |
| MSI GE63VR 7RF Raider | |
| Work Score Accelerated v2 | |
| Acer Predator 15 G9-593-751X | |
| Asus Zephyrus GX501VS | |
| Alienware 15 R3 | |
| MSI GE63VR 7RF Raider | |
| PCMark 8 Home Score Accelerated v2 | 4406 poäng | |
| PCMark 8 Work Score Accelerated v2 | 5270 poäng | |
Hjälp | ||
| MSI GE63VR 7RF Raider Toshiba HG6 THNSNJ256G8NY | Acer Predator 15 G9-593-751X Samsung SM951 MZVPV256HDGL m.2 PCI-e | Alienware 15 R3 | Asus Zephyrus GX501VS Samsung SM961 MZVPW256HEGL | |
|---|---|---|---|---|
| CrystalDiskMark 3.0 | 146% | 64% | ||
| Read Seq (MB/s) | 507 | 1939 282% | 1123 121% | |
| Write Seq (MB/s) | 441.4 | 1262 186% | 429.2 -3% | |
| Read 512 (MB/s) | 411.9 | 1078 162% | 833 102% | |
| Write 512 (MB/s) | 409.9 | 1192 191% | 428.1 4% | |
| Read 4k (MB/s) | 21.77 | 50.8 133% | 37.8 74% | |
| Write 4k (MB/s) | 88.9 | 141.9 60% | 122.9 38% | |
| Read 4k QD32 (MB/s) | 368.8 | 573 55% | 542 47% | |
| Write 4k QD32 (MB/s) | 190.3 | 375.3 97% | 429.8 126% |

| 3DMark 11 - 1280x720 Performance GPU | |
| MSI GE63VR 7RF Raider | |
| Alienware 15 R3 | |
| Acer Predator 15 G9-593-751X | |
| Asus Zephyrus GX501VS | |
| 3DMark - 1920x1080 Fire Strike Graphics | |
| MSI GE63VR 7RF Raider | |
| Alienware 15 R3 | |
| Acer Predator 15 G9-593-751X | |
| Asus Zephyrus GX501VS | |
| 3DMark 11 Performance | 16625 poäng | |
| 3DMark Cloud Gate Standard Score | 27629 poäng | |
| 3DMark Fire Strike Score | 13917 poäng | |
Hjälp | ||
| The Witcher 3 - 1920x1080 Ultra Graphics & Postprocessing (HBAO+) | |
| MSI GE63VR 7RF Raider | |
| Acer Predator 15 G9-593-751X | |
| Asus Zephyrus GX501VS | |
| Rise of the Tomb Raider | |
| 1920x1080 Very High Preset AA:FX AF:16x | |
| MSI GE63VR 7RF Raider | |
| Asus Zephyrus GX501VS | |
| 1920x1080 High Preset AA:FX AF:4x | |
| MSI GE63VR 7RF Raider | |
| Battlefield 1 | |
| 1920x1080 Ultra Preset AA:T | |
| Acer Predator 15 G9-593-751X | |
| Alienware 15 R3 | |
| MSI GE63VR 7RF Raider | |
| 1920x1080 High Preset AA:T | |
| Acer Predator 15 G9-593-751X | |
| Alienware 15 R3 | |
| MSI GE63VR 7RF Raider | |
| For Honor | |
| 1920x1080 Extreme Preset AA:T AF:16x | |
| MSI GE63VR 7RF Raider | |
| Acer Predator 15 G9-593-751X | |
| 1920x1080 High Preset AA:T AF:8x | |
| MSI GE63VR 7RF Raider | |
| Acer Predator 15 G9-593-751X | |
| Ghost Recon Wildlands | |
| 1920x1080 Ultra Preset AA:T AF:16x | |
| MSI GE63VR 7RF Raider | |
| Acer Predator 15 G9-593-751X | |
| 1920x1080 High Preset AA:T AF:4x | |
| MSI GE63VR 7RF Raider | |
| Acer Predator 15 G9-593-751X | |
| låg | med. | hög | ultra | |
|---|---|---|---|---|
| The Witcher 3 (2015) | 62.2 | |||
| Rise of the Tomb Raider (2016) | 118.8 | 102.5 | ||
| Far Cry Primal (2016) | 76 | 74 | ||
| Deus Ex Mankind Divided (2016) | 83.1 | 45.6 | ||
| Battlefield 1 (2016) | 110.5 | 103.2 | ||
| For Honor (2017) | 144.4 | 113 | ||
| Ghost Recon Wildlands (2017) | 90.8 | 52.2 |
Ljudnivå
| Låg belastning |
| 33 / 35 / 40 dB(A) |
| Hårddisk |
| 34 dB(A) |
| Hög belastning |
| 48 / 55 dB(A) |
 | ||
30 dB tyst 40 dB(A) hörbar 50 dB(A) högt ljud |
||
min: | ||
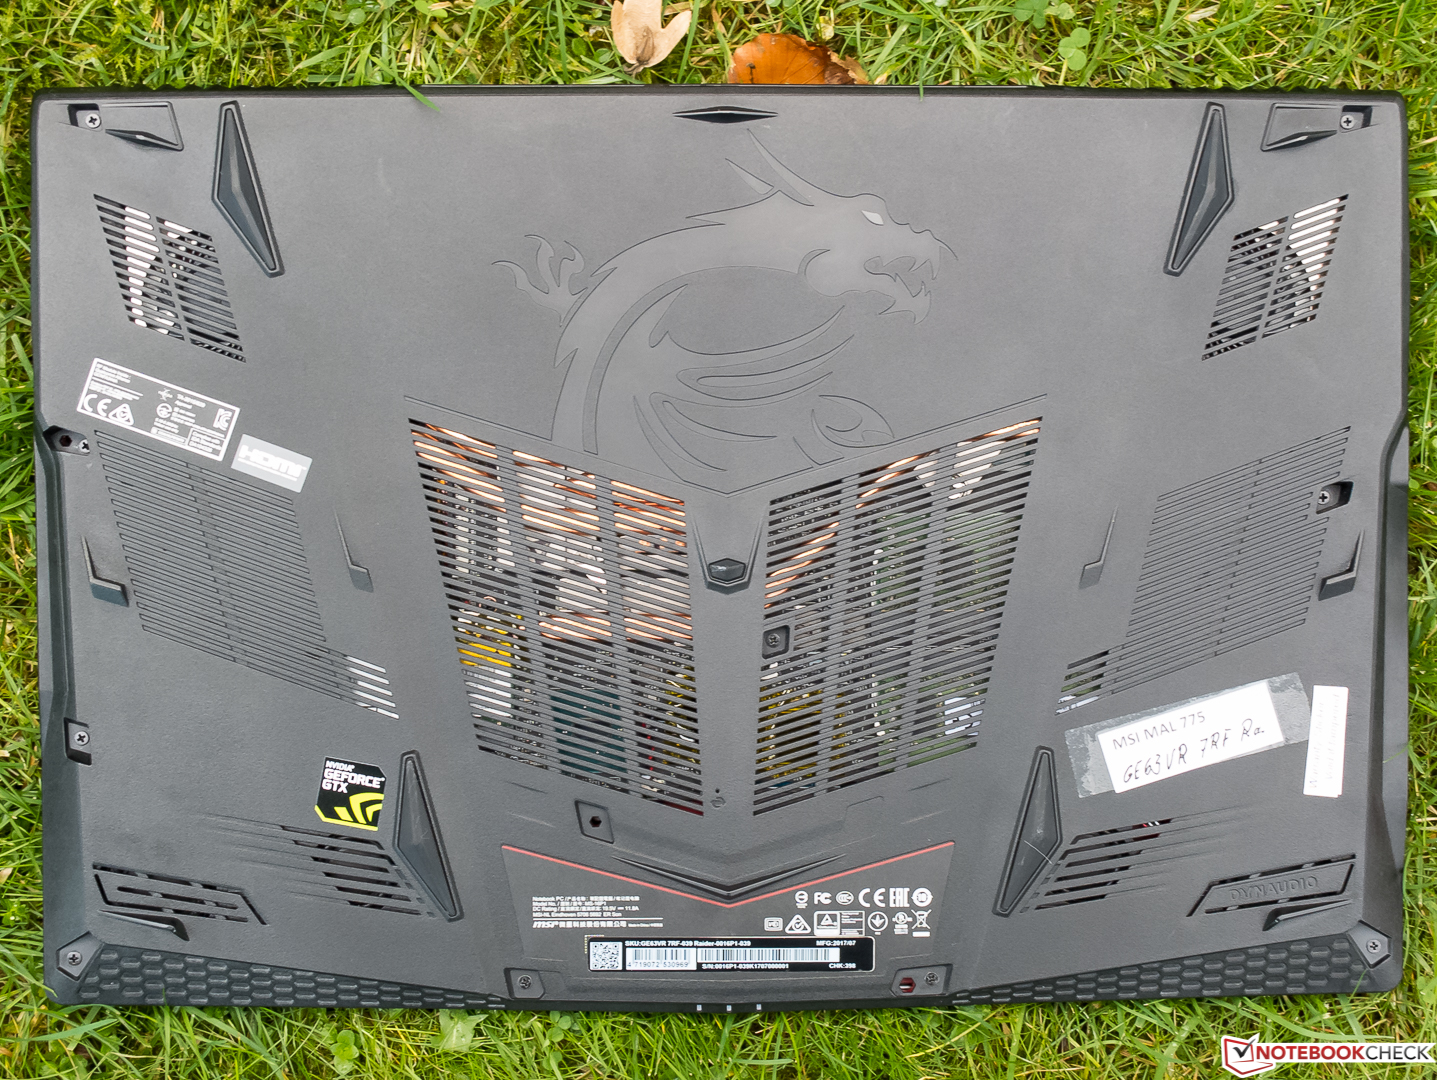
(-) Den maximala temperaturen på ovansidan är 48 °C / 118 F, jämfört med genomsnittet av 40.4 °C / 105 F , allt från 21.2 till 68.8 °C för klassen Gaming.
(-) Botten värms upp till maximalt 47 °C / 117 F, jämfört med genomsnittet av 43.2 °C / 110 F
(+) Vid tomgångsbruk är medeltemperaturen för ovansidan 28.4 °C / 83 F, jämfört med enhetsgenomsnittet på 33.9 °C / ### class_avg_f### F.
(-) När du spelar The Witcher 3 är medeltemperaturen för ovansidan 42 °C / 108 F, jämfört med enhetsgenomsnittet på 33.9 °C / ## #class_avg_f### F.
(±) Handledsstöden och pekplattan kan bli väldigt varma vid beröring med maximalt 39 °C / 102.2 F.
(-) Medeltemperaturen för handledsstödsområdet på liknande enheter var 28.8 °C / 83.8 F (-10.2 °C / -18.4 F).
MSI GE63VR 7RF Raider ljudanalys
(+) | högtalare kan spela relativt högt (93 dB)
Bas 100 - 315 Hz
(±) | reducerad bas - i genomsnitt 6.6% lägre än medianen
(±) | linjäriteten för basen är genomsnittlig (8.2% delta till föregående frekvens)
Mellan 400 - 2000 Hz
(+) | balanserad mellan - endast 4.1% från medianen
(+) | mids är linjära (4.7% delta till föregående frekvens)
Högsta 2 - 16 kHz
(+) | balanserade toppar - endast 2.6% från medianen
(+) | toppar är linjära (4.6% delta till föregående frekvens)
Totalt 100 - 16 000 Hz
(+) | det totala ljudet är linjärt (9.9% skillnad mot median)
Jämfört med samma klass
» 5% av alla testade enheter i den här klassen var bättre, 2% liknande, 94% sämre
» Den bästa hade ett delta på 6%, genomsnittet var 18%, sämst var 132%
Jämfört med alla testade enheter
» 4% av alla testade enheter var bättre, 1% liknande, 95% sämre
» Den bästa hade ett delta på 4%, genomsnittet var 23%, sämst var 134%
Alienware 15 R3 ljudanalys
(+) | högtalare kan spela relativt högt (82 dB)
Bas 100 - 315 Hz
(-) | nästan ingen bas - i genomsnitt 19.1% lägre än medianen
(±) | linjäriteten för basen är genomsnittlig (10.4% delta till föregående frekvens)
Mellan 400 - 2000 Hz
(±) | högre mellan - i genomsnitt 6.7% högre än median
(±) | linjäriteten för mids är genomsnittlig (7.5% delta till föregående frekvens)
Högsta 2 - 16 kHz
(+) | balanserade toppar - endast 3.6% från medianen
(+) | toppar är linjära (5.2% delta till föregående frekvens)
Totalt 100 - 16 000 Hz
(±) | linjäriteten för det totala ljudet är genomsnittlig (21.6% skillnad mot median)
Jämfört med samma klass
» 77% av alla testade enheter i den här klassen var bättre, 5% liknande, 18% sämre
» Den bästa hade ett delta på 6%, genomsnittet var 18%, sämst var 132%
Jämfört med alla testade enheter
» 61% av alla testade enheter var bättre, 7% liknande, 32% sämre
» Den bästa hade ett delta på 4%, genomsnittet var 23%, sämst var 134%
Acer Predator 15 G9-593-751X ljudanalys
(+) | högtalare kan spela relativt högt (91 dB)
Bas 100 - 315 Hz
(±) | reducerad bas - i genomsnitt 14.1% lägre än medianen
(±) | linjäriteten för basen är genomsnittlig (10.6% delta till föregående frekvens)
Mellan 400 - 2000 Hz
(+) | balanserad mellan - endast 3.2% från medianen
(+) | mids är linjära (4.9% delta till föregående frekvens)
Högsta 2 - 16 kHz
(+) | balanserade toppar - endast 3.7% från medianen
(+) | toppar är linjära (5.3% delta till föregående frekvens)
Totalt 100 - 16 000 Hz
(+) | det totala ljudet är linjärt (14.1% skillnad mot median)
Jämfört med samma klass
» 24% av alla testade enheter i den här klassen var bättre, 8% liknande, 68% sämre
» Den bästa hade ett delta på 6%, genomsnittet var 18%, sämst var 132%
Jämfört med alla testade enheter
» 17% av alla testade enheter var bättre, 4% liknande, 79% sämre
» Den bästa hade ett delta på 4%, genomsnittet var 23%, sämst var 134%
Asus Zephyrus GX501VS ljudanalys
(-) | inte särskilt höga högtalare (71.4 dB)
Bas 100 - 315 Hz
(-) | nästan ingen bas - i genomsnitt 18.8% lägre än medianen
(±) | linjäriteten för basen är genomsnittlig (11.3% delta till föregående frekvens)
Mellan 400 - 2000 Hz
(+) | balanserad mellan - endast 1.2% från medianen
(+) | mids är linjära (6.3% delta till föregående frekvens)
Högsta 2 - 16 kHz
(±) | högre toppar - i genomsnitt 6.5% högre än medianen
(+) | toppar är linjära (6.3% delta till föregående frekvens)
Totalt 100 - 16 000 Hz
(±) | linjäriteten för det totala ljudet är genomsnittlig (23.4% skillnad mot median)
Jämfört med samma klass
» 85% av alla testade enheter i den här klassen var bättre, 5% liknande, 11% sämre
» Den bästa hade ett delta på 6%, genomsnittet var 18%, sämst var 132%
Jämfört med alla testade enheter
» 70% av alla testade enheter var bättre, 6% liknande, 24% sämre
» Den bästa hade ett delta på 4%, genomsnittet var 23%, sämst var 134%
| Av/Standby | |
| Låg belastning | |
| Hög belastning |
|
Förklaring:
min: | |
| MSI GE63VR 7RF Raider i7-7700HQ, GeForce GTX 1070 Mobile | Acer Predator 15 G9-593-751X i7-7700HQ, GeForce GTX 1070 Mobile | Alienware 15 R3 i7-7700HQ, GeForce GTX 1070 Mobile | Asus Zephyrus GX501VS i7-7700HQ, GeForce GTX 1070 Max-Q | |
|---|---|---|---|---|
| Power Consumption | -22% | -27% | -6% | |
| Idle Minimum * (Watt) | 11 | 18 -64% | 19 -73% | 19.1 -74% |
| Idle Average * (Watt) | 16 | 23 -44% | 23 -44% | 20.8 -30% |
| Idle Maximum * (Watt) | 21 | 30 -43% | 29 -38% | 21.8 -4% |
| Load Average * (Watt) | 92 | 89 3% | 85 8% | 73.7 20% |
| Witcher 3 ultra * (Watt) | 185 | 168 9% | 130.2 30% | |
| Load Maximum * (Watt) | 224 | 213 5% | 192 14% | 173.1 23% |
* ... mindre är bättre
| MSI GE63VR 7RF Raider i7-7700HQ, GeForce GTX 1070 Mobile, 51 Wh | Acer Predator 15 G9-593-751X i7-7700HQ, GeForce GTX 1070 Mobile, 90 Wh | Alienware 15 R3 i7-7700HQ, GeForce GTX 1070 Mobile, 99 Wh | Asus Zephyrus GX501VS i7-7700HQ, GeForce GTX 1070 Max-Q, 50 Wh | |
|---|---|---|---|---|
| Batteridrifttid | 101% | 64% | -14% | |
| Reader / Idle (h) | 5.4 | 8.4 56% | 6.4 19% | 3.8 -30% |
| WiFi v1.3 (h) | 3.4 | 5.5 62% | 4.4 29% | 2.5 -26% |
| Load (h) | 0.7 | 2 186% | 1.7 143% | 0.8 14% |
| H.264 (h) | 4.9 | 4.4 |
För
Emot
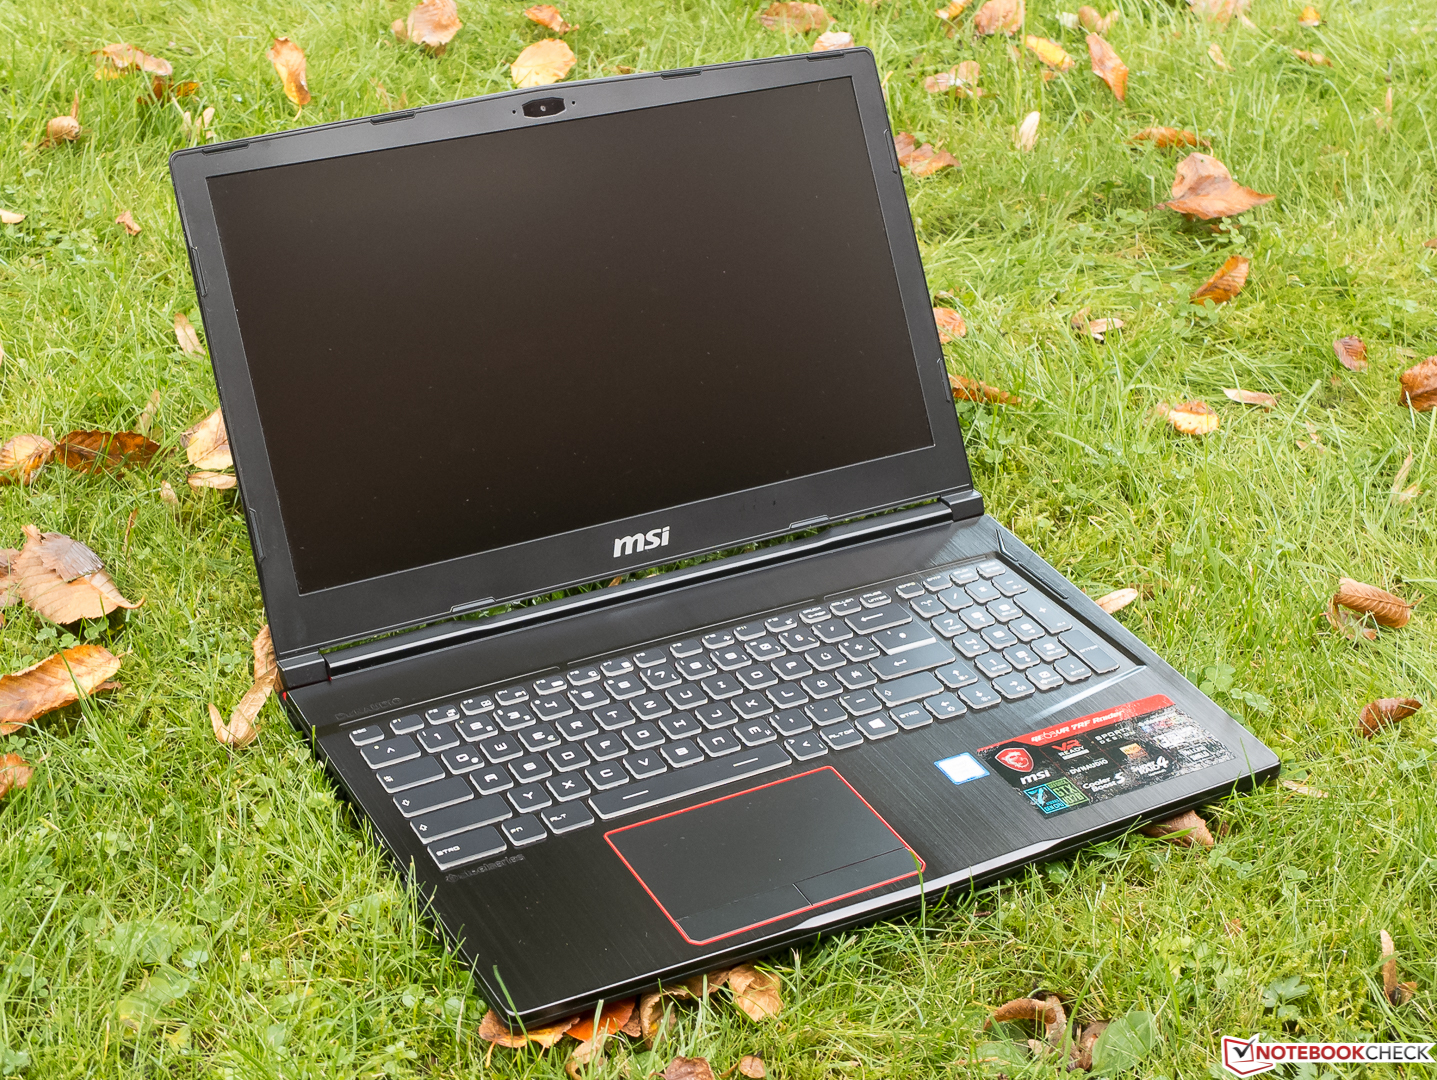
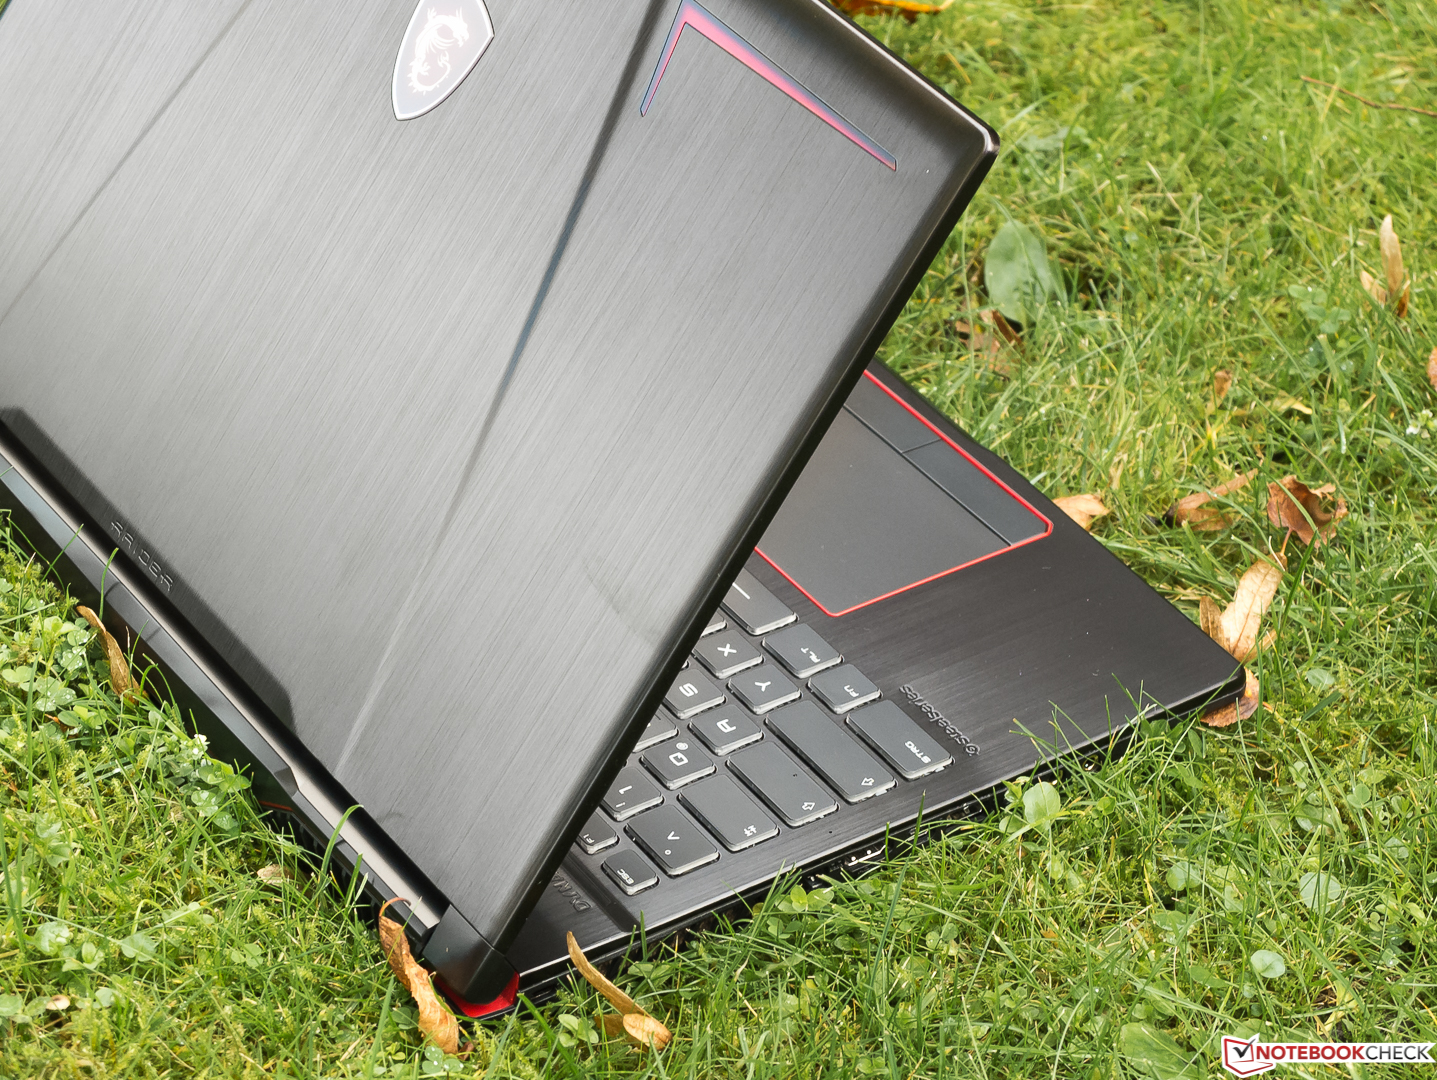
MSI har tagit ett steg ifrån den allmänna IPS-trenden och vågat vara ofullkomliga. Om du inte behöver allt för mycket ledigt utrymme runt din laptop och kan undvika att titta på skärmen underifrån kommer du att uppskatta den här datorn för dess snabba responstider, exakta färgåtergivning, 100% sRGB-täckning och 120 Hz - även om det hade känts rimligare om MSI inte hade utelämnat G-Sync till förmån för låg energiåtgång.
Den välgjorda MSI GE63VR Raider-075 gav oss ett gott intryck i våra tester - det är bara valet att stå över G-Sync som är förvånande.
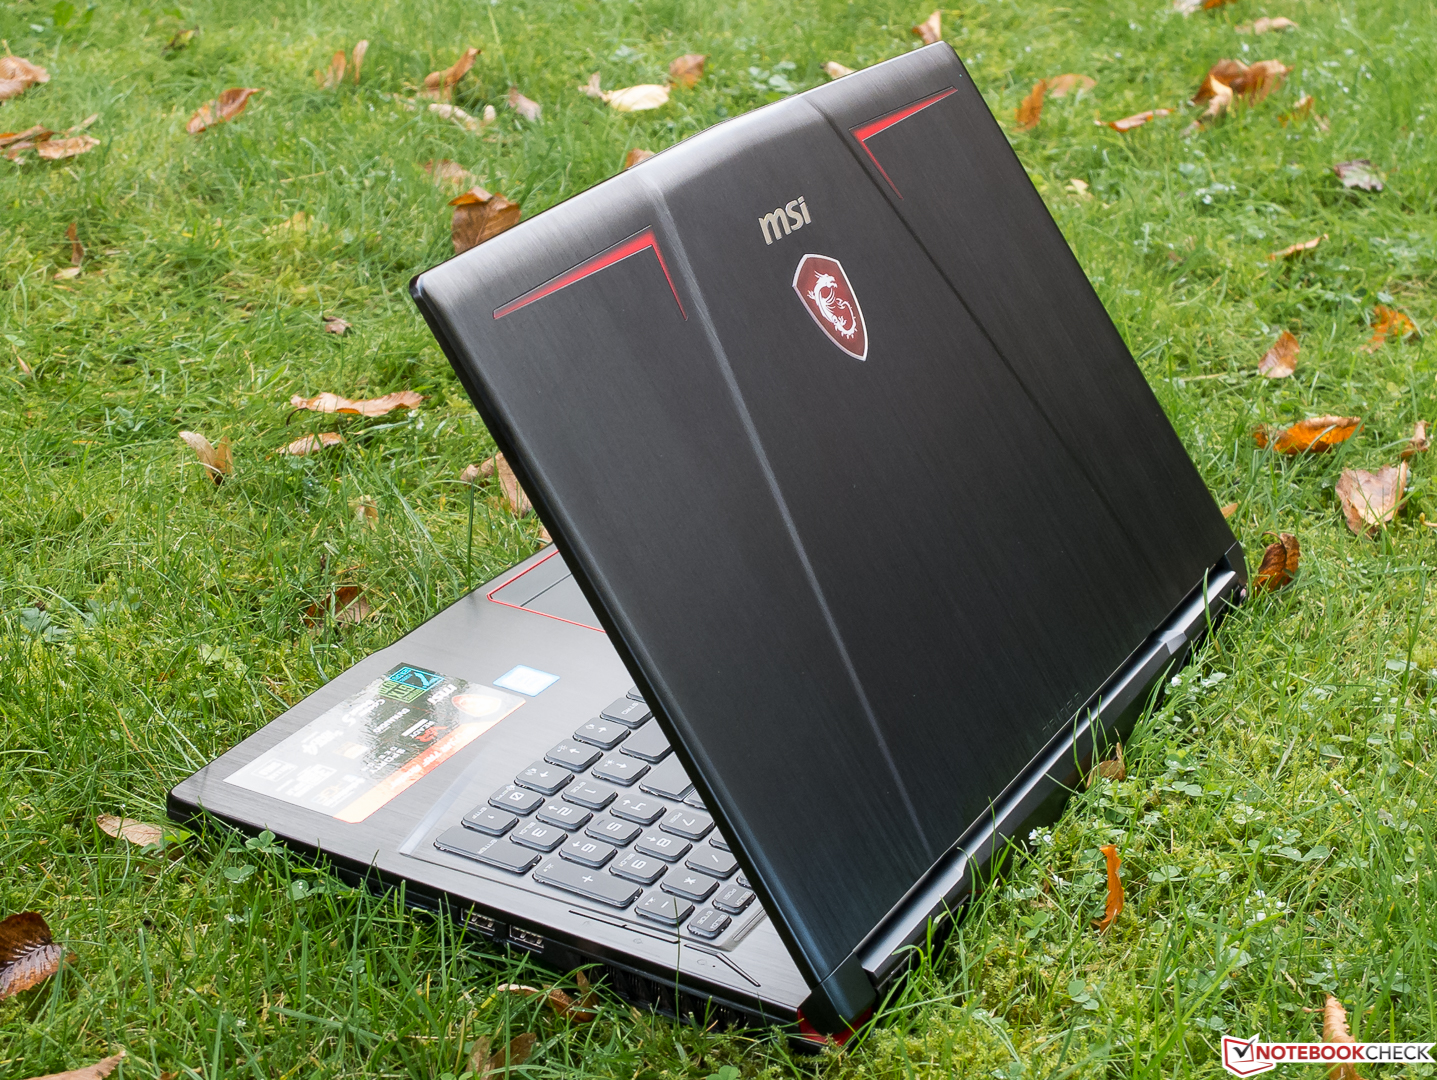
MSI GE63VR Raider-075 går att få tag på för ~14 200 SEK ($1700) och är en kompakt, lätt och högpresterande spellaptop med en egensinnig skärm vars få nackdelar knappast kommer störa ambitiösa gamers. Vi kan klart rekommendera denna enhet.
MSI GE63VR 7RF Raider
- 10/28/2017 v6 (old)
Sven Kloevekorn