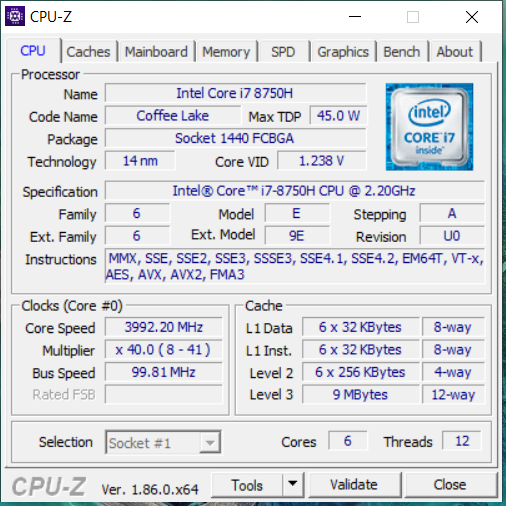
Test: Acer Aspire 7 A715-72G (i7-8750H, GTX 1050 Ti, SSD, FHD) Laptop (Sammanfattning)
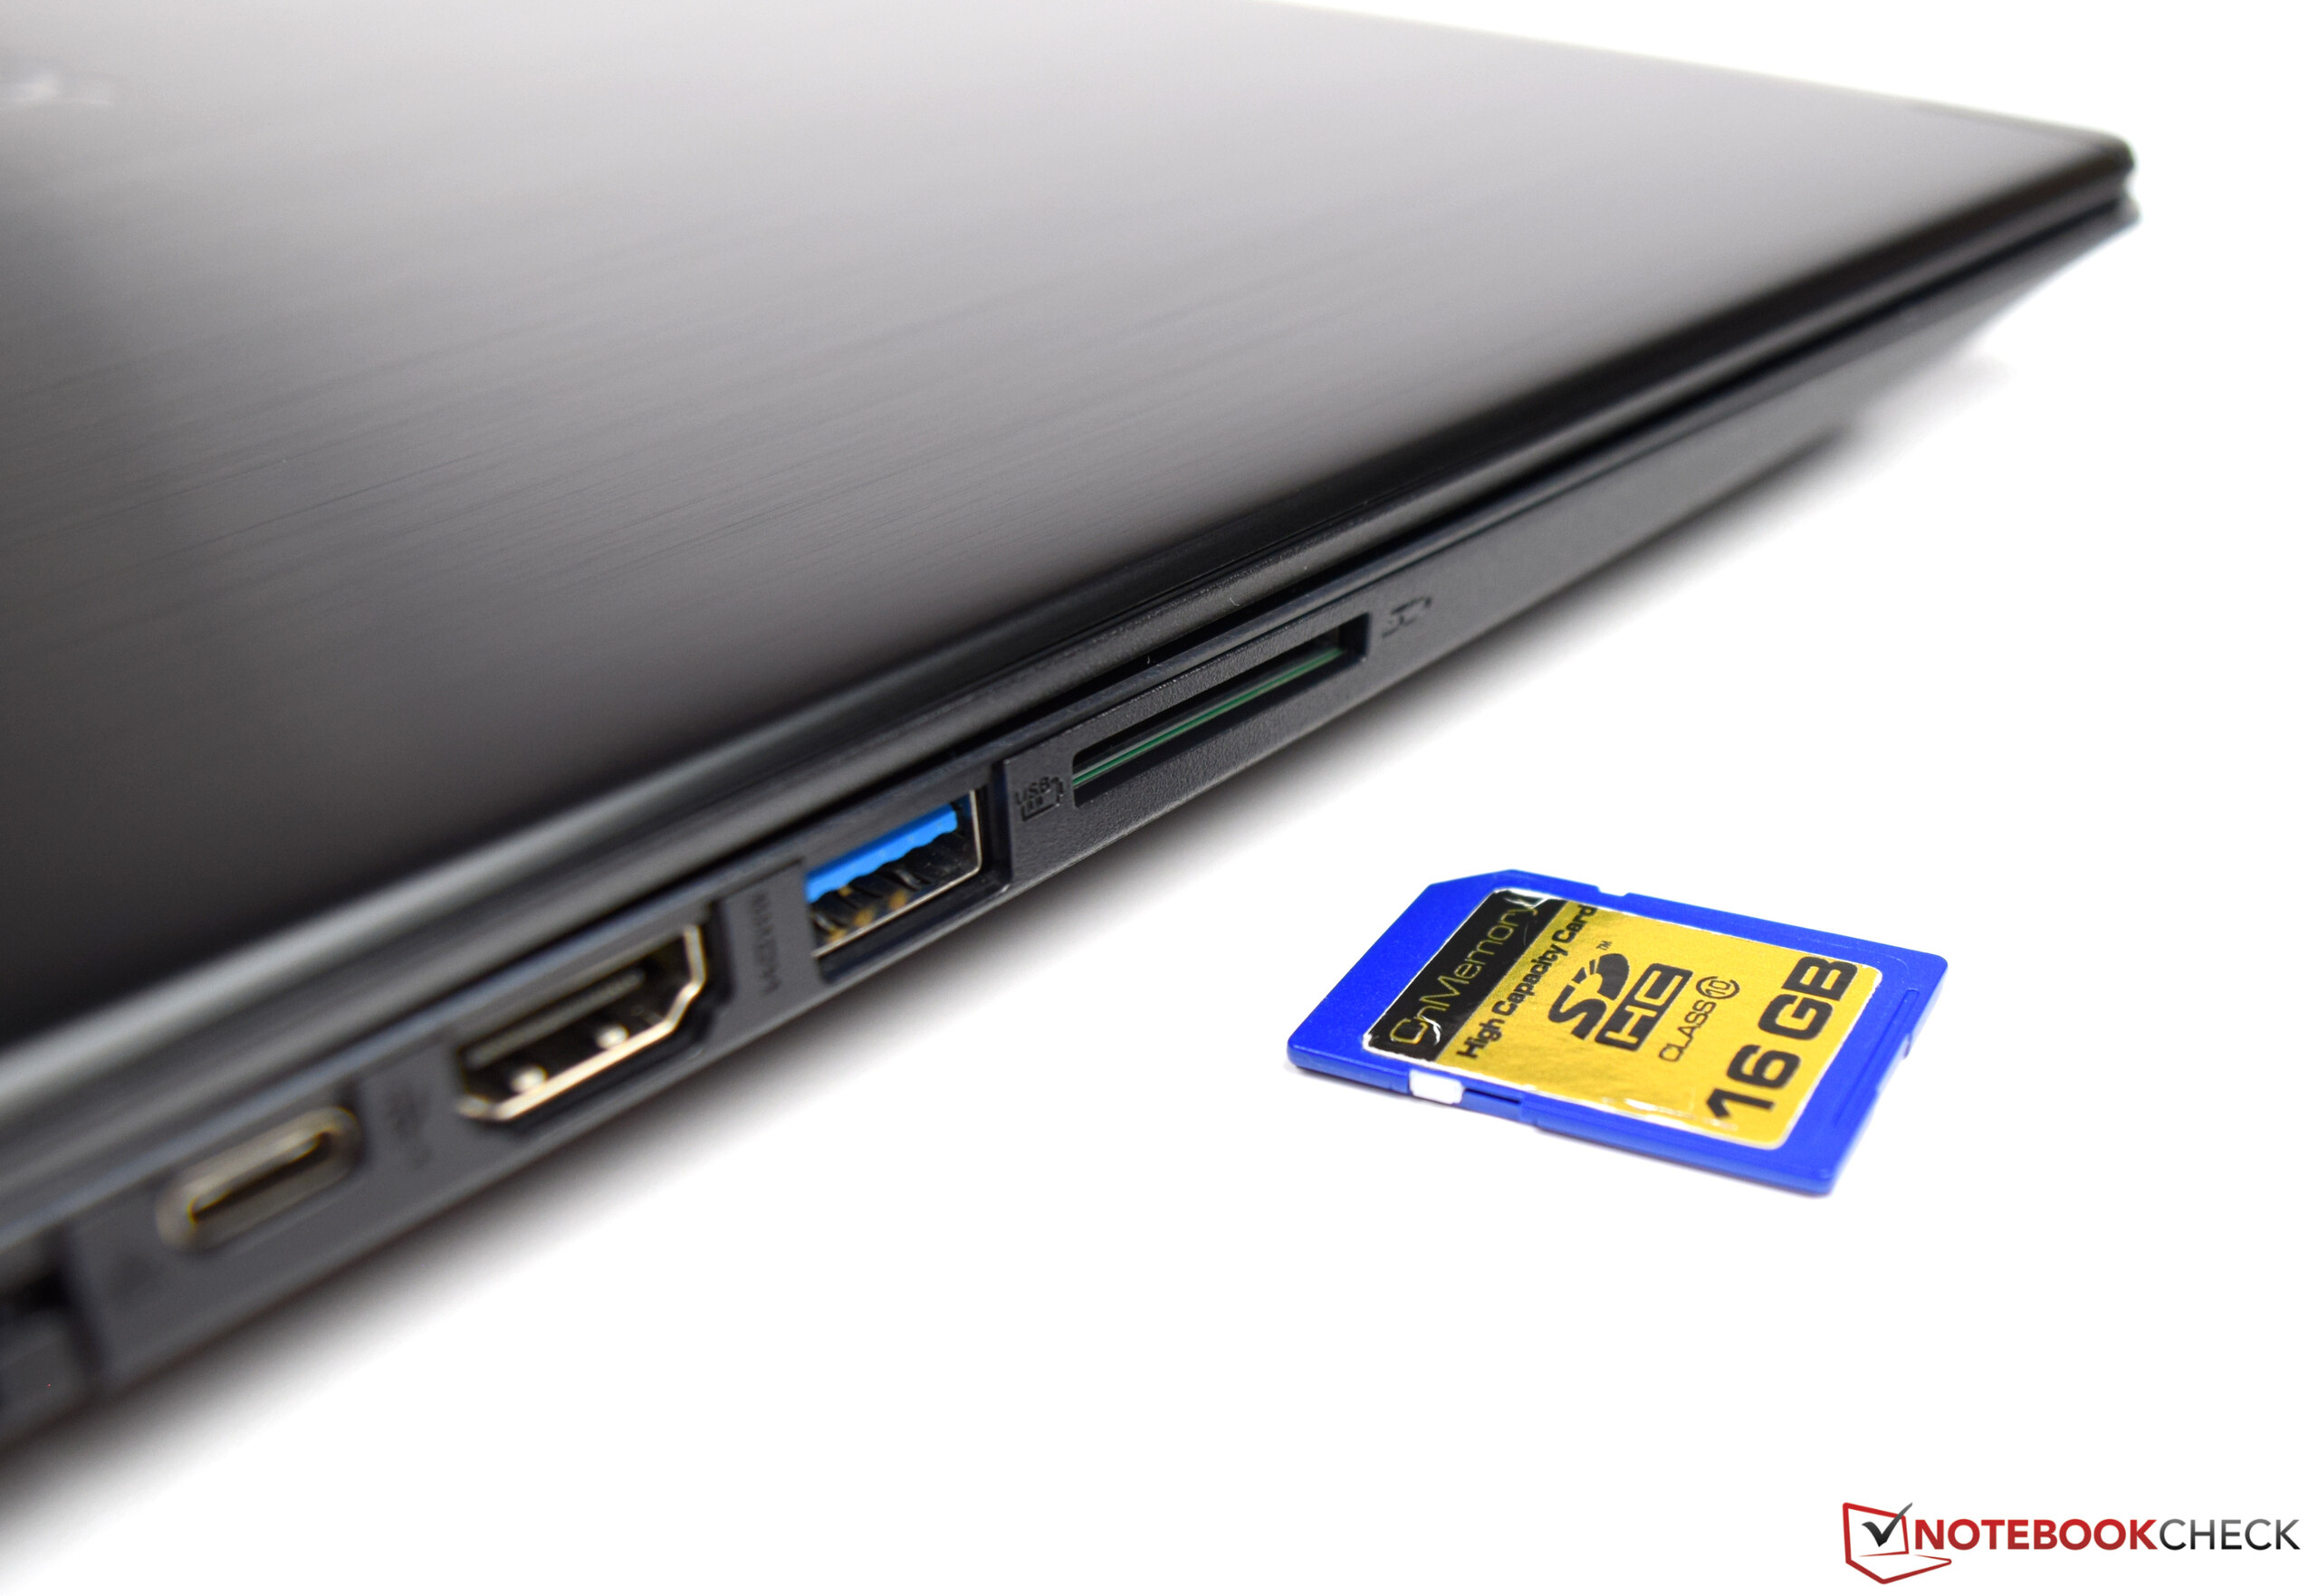
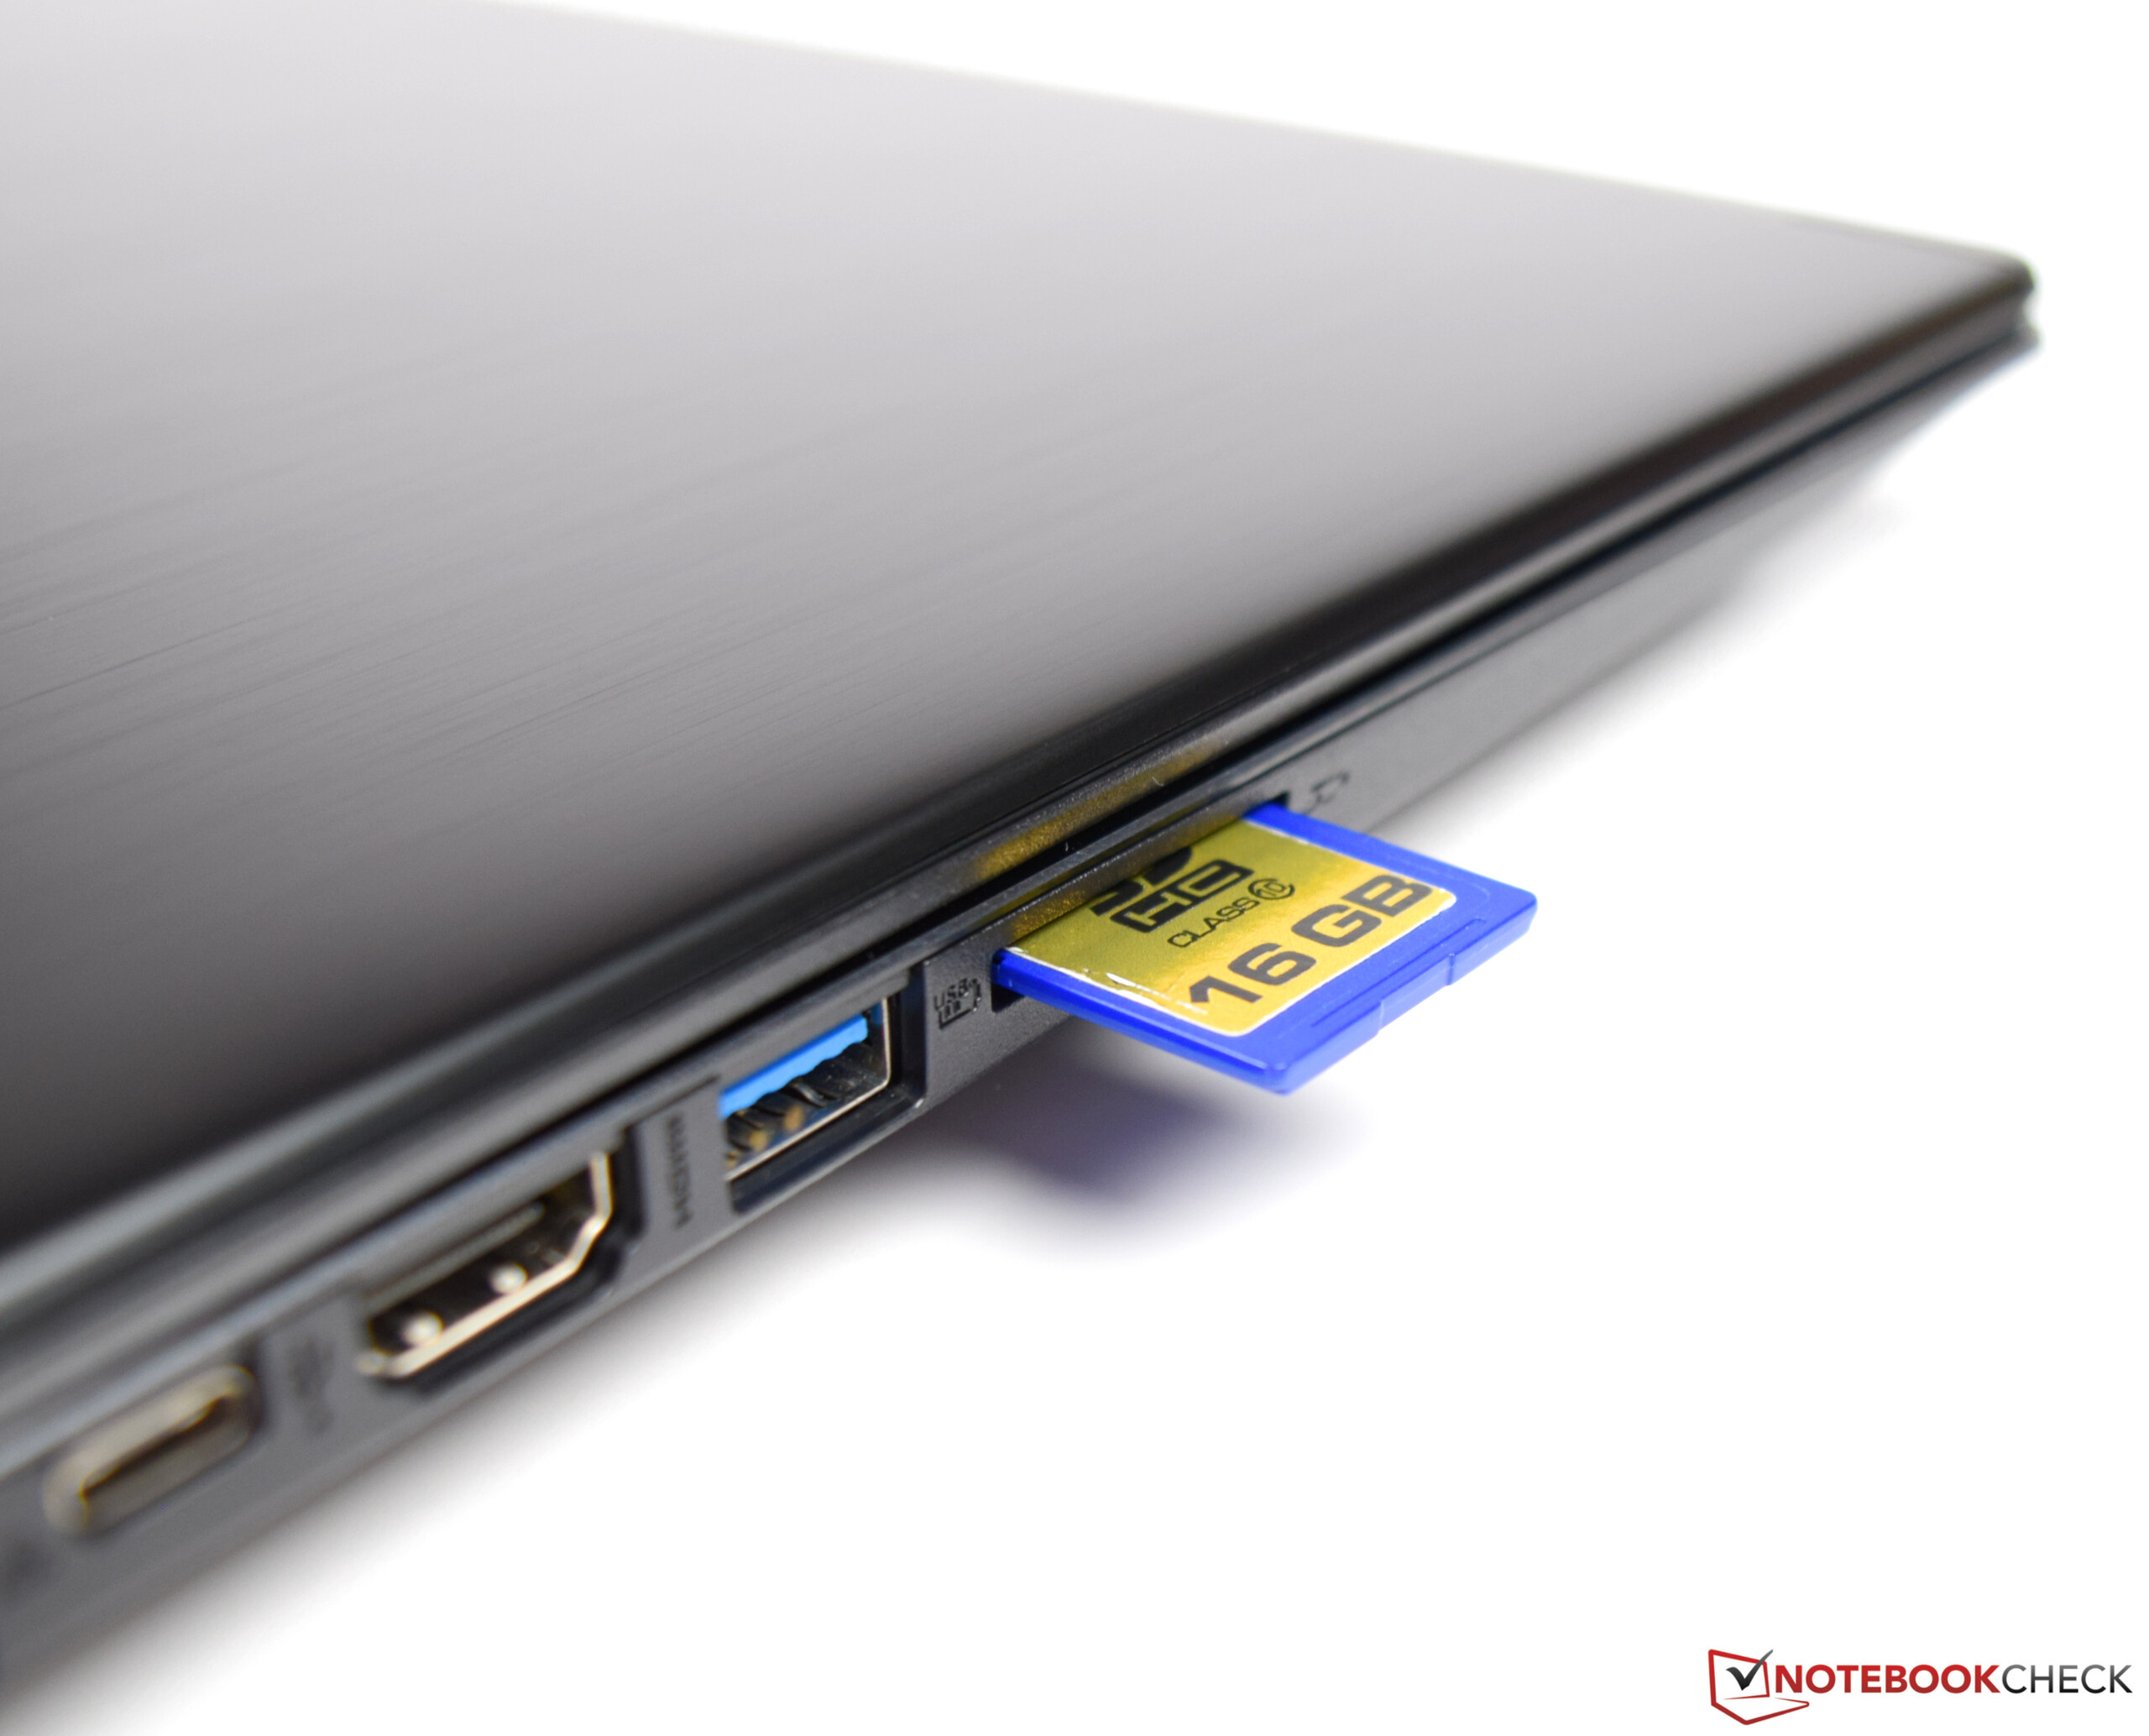
| SD Card Reader | |
| average JPG Copy Test (av. of 3 runs) | |
| Genomsnitt av klass Multimedia (23 - 531, n=36, senaste 2 åren) | |
| Acer Aspire 7 A715-71G-53TU (Toshiba Exceria Pro SDXC 64 GB UHS-II) | |
| HP Pavilion Gaming 15-cx0003ng (Toshiba Exceria Pro SDXC 64 GB UHS-II) | |
| Acer Aspire 7 A715-72G-704Q (Toshiba Exceria Pro SDXC 64 GB UHS-II) | |
| Dell G3 15 3579 (Toshiba Exceria Pro SDXC 64 GB UHS-II) | |
| maximum AS SSD Seq Read Test (1GB) | |
| Genomsnitt av klass Multimedia (37.3 - 1455, n=35, senaste 2 åren) | |
| Acer Aspire 7 A715-71G-53TU (Toshiba Exceria Pro SDXC 64 GB UHS-II) | |
| HP Pavilion Gaming 15-cx0003ng (Toshiba Exceria Pro SDXC 64 GB UHS-II) | |
| Acer Aspire 7 A715-72G-704Q (Toshiba Exceria Pro SDXC 64 GB UHS-II) | |
| Dell G3 15 3579 (Toshiba Exceria Pro SDXC 64 GB UHS-II) | |
| |||||||||||||||||||||||||
Distribution av ljusstyrkan: 81 %
Mitt på batteriet: 276 cd/m²
Kontrast: 500:1 (Svärta: 0.56 cd/m²)
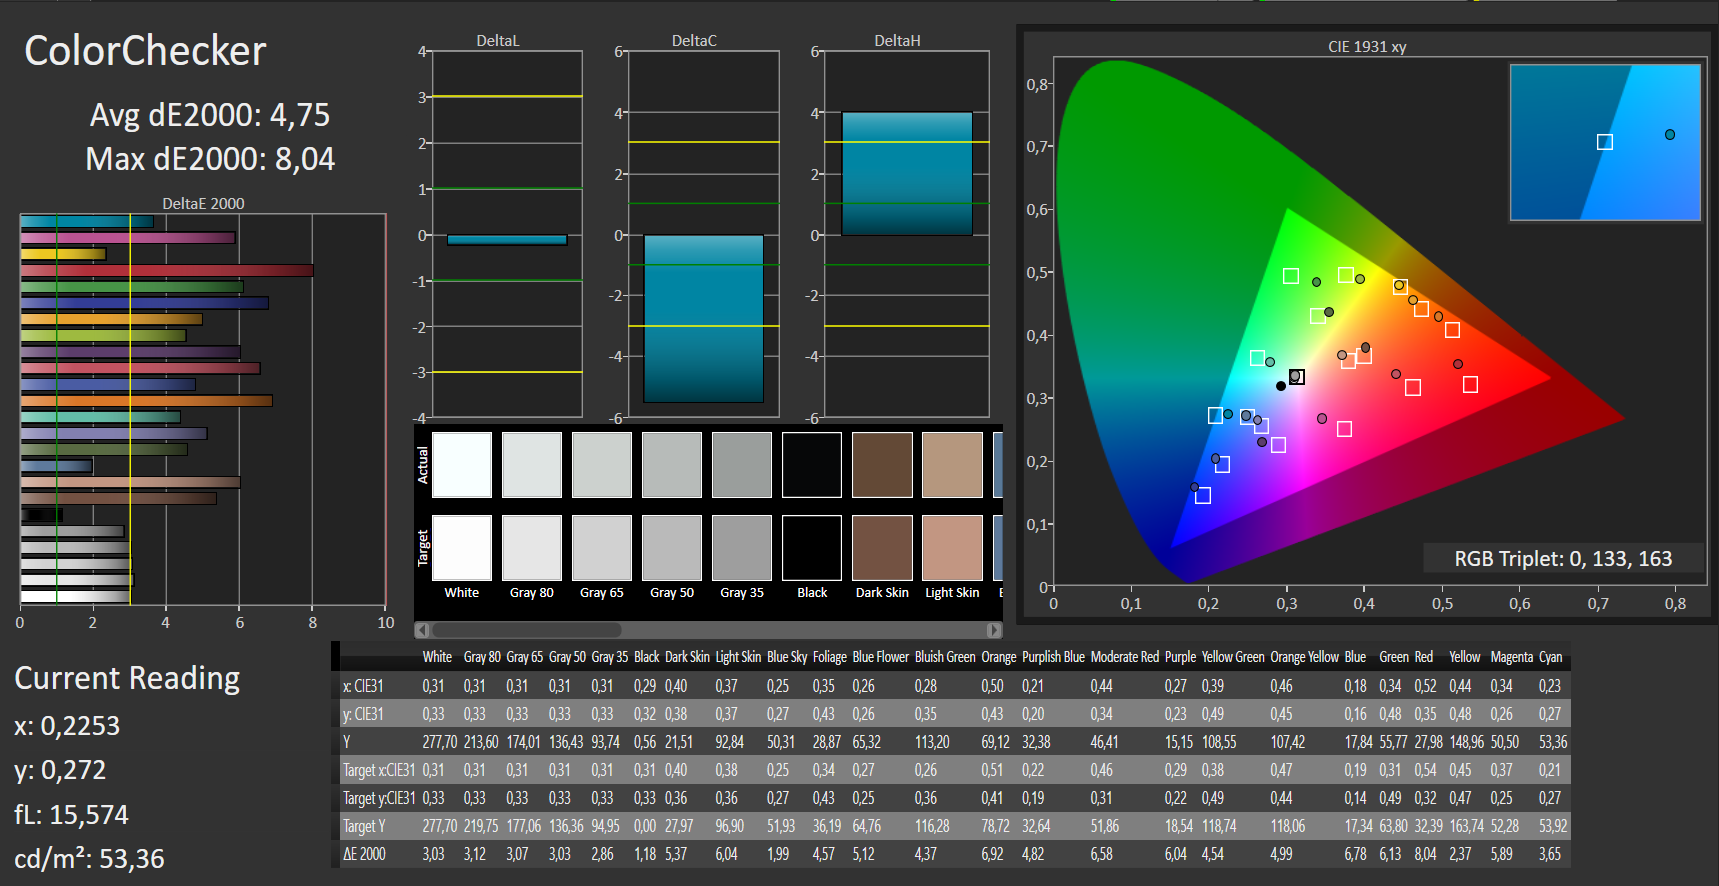
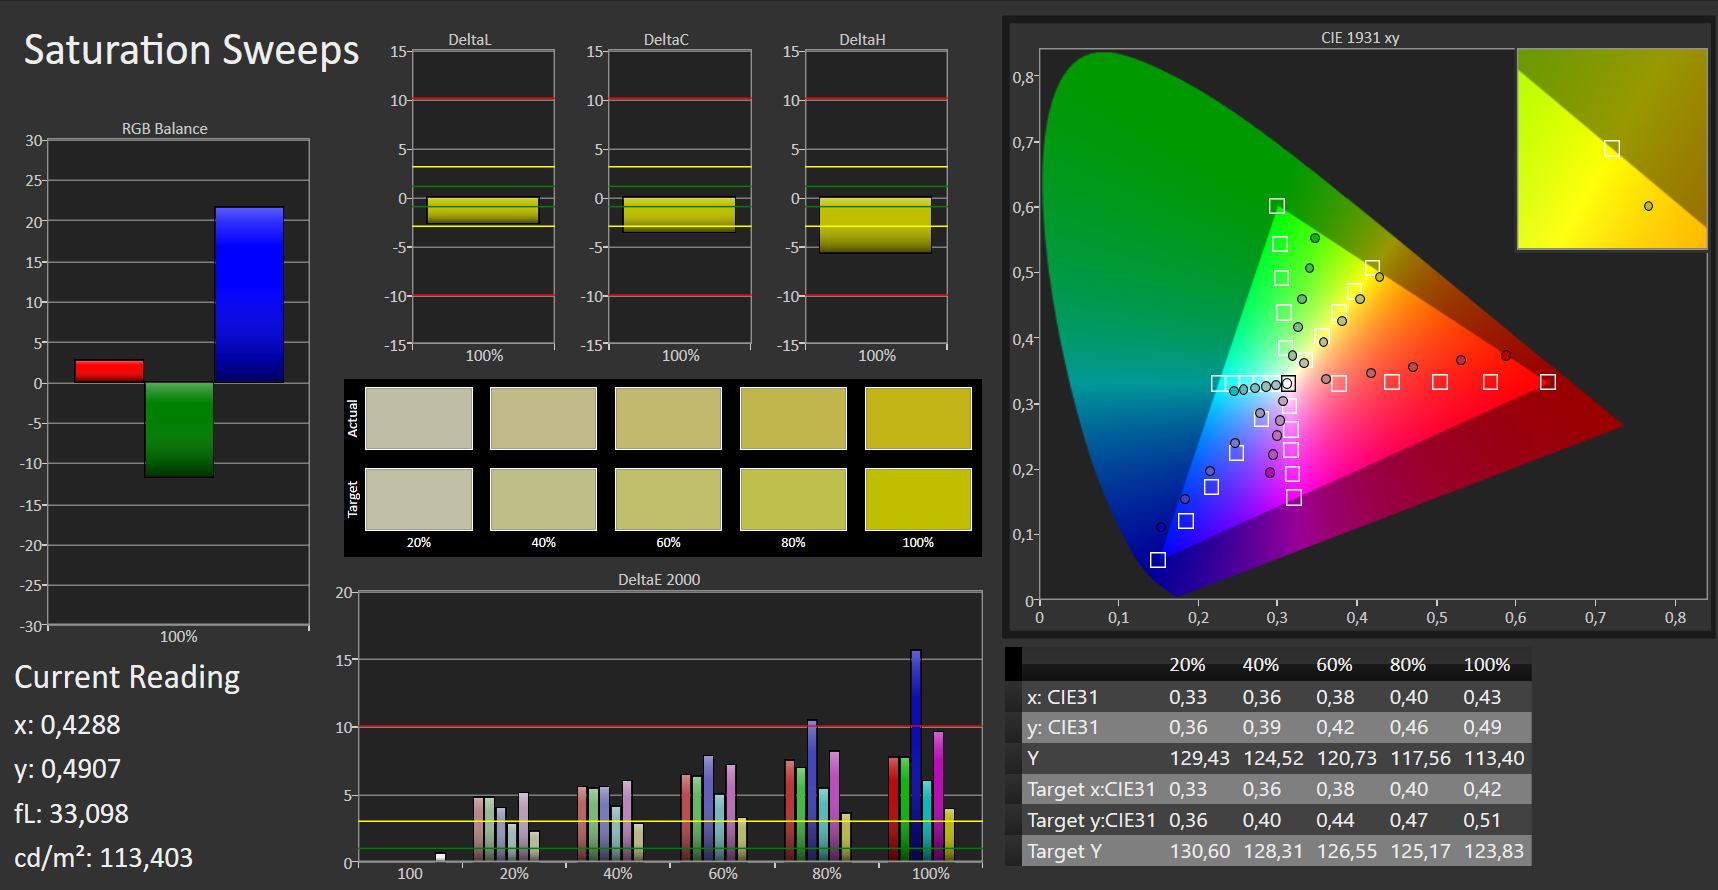
ΔE ColorChecker Calman: 4.75 | ∀{0.5-29.43 Ø4.71}
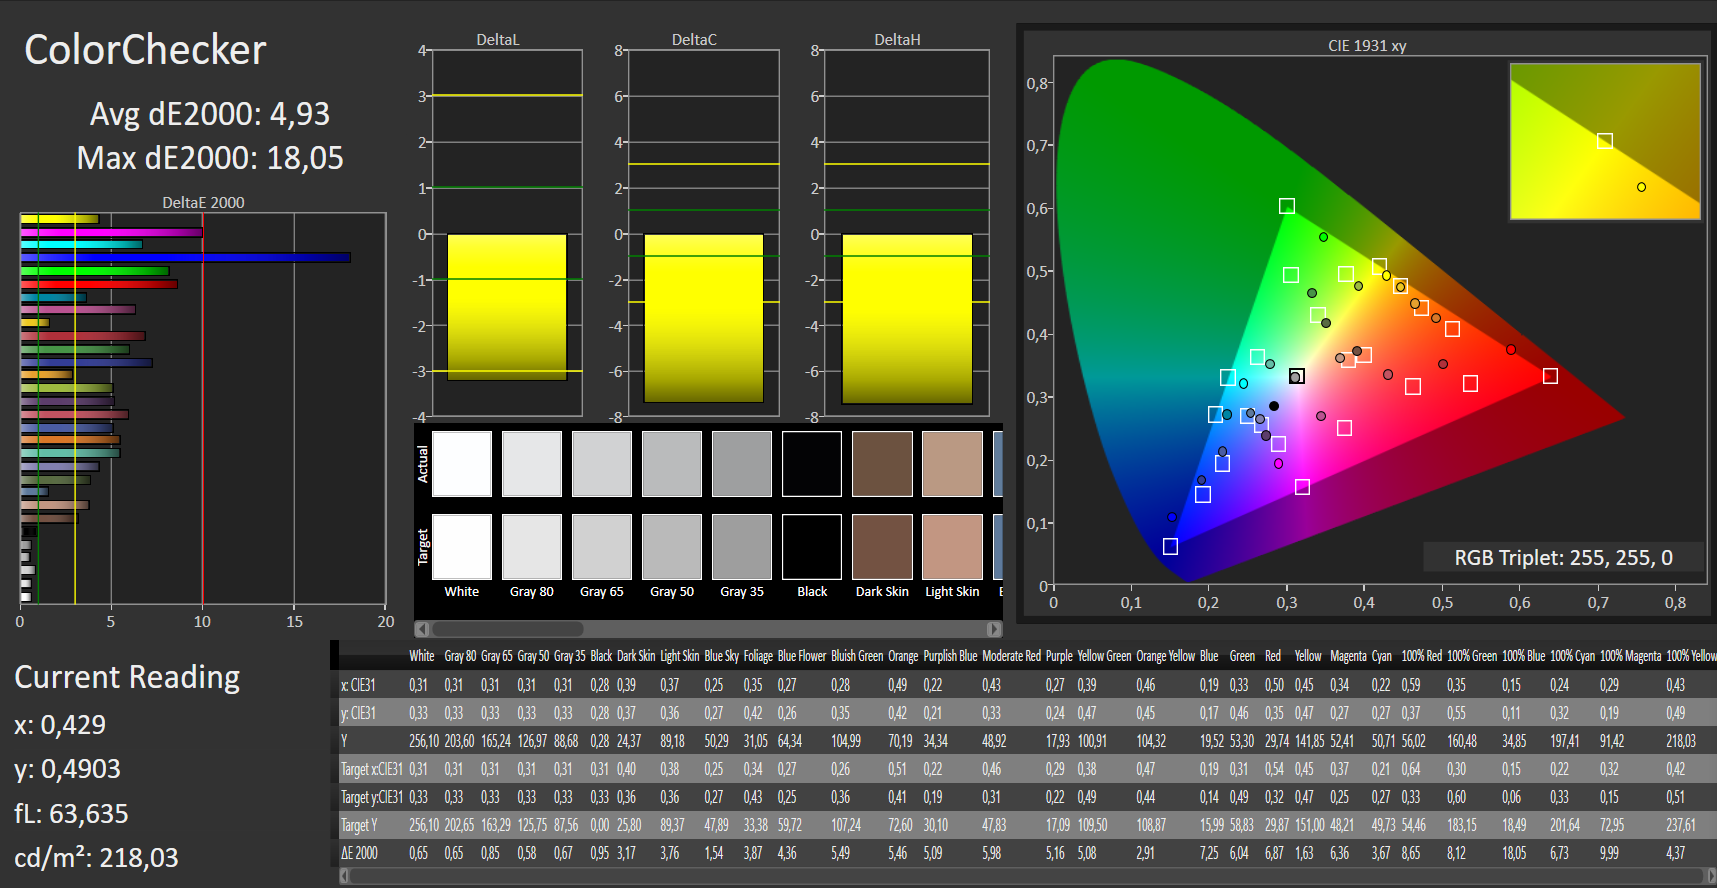
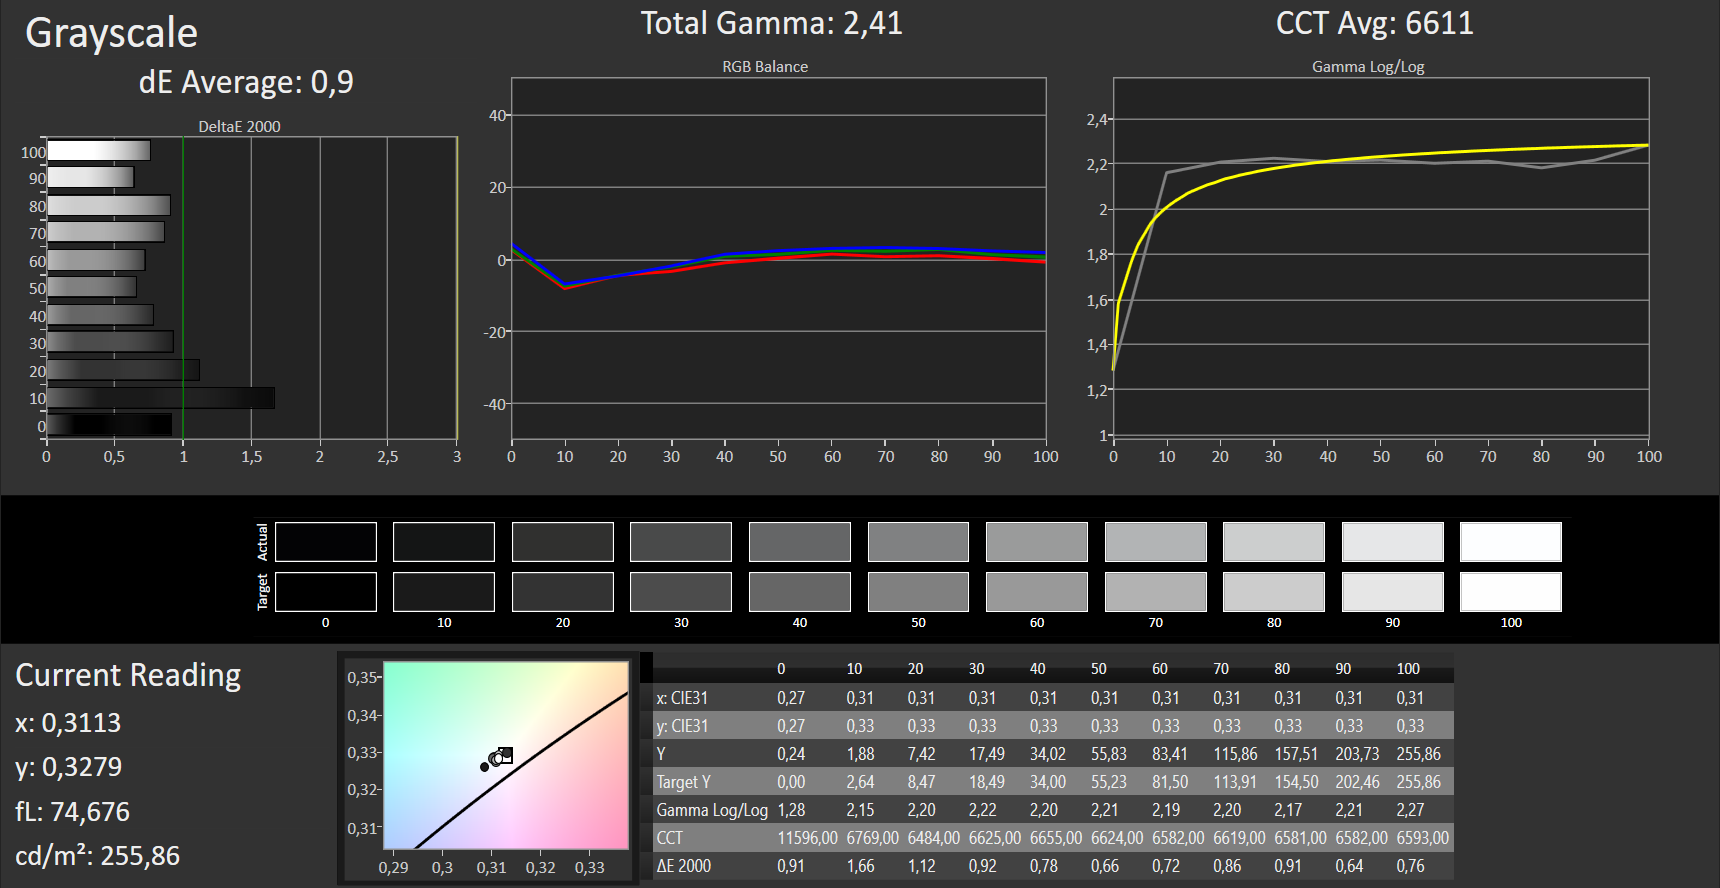
calibrated: 4.93
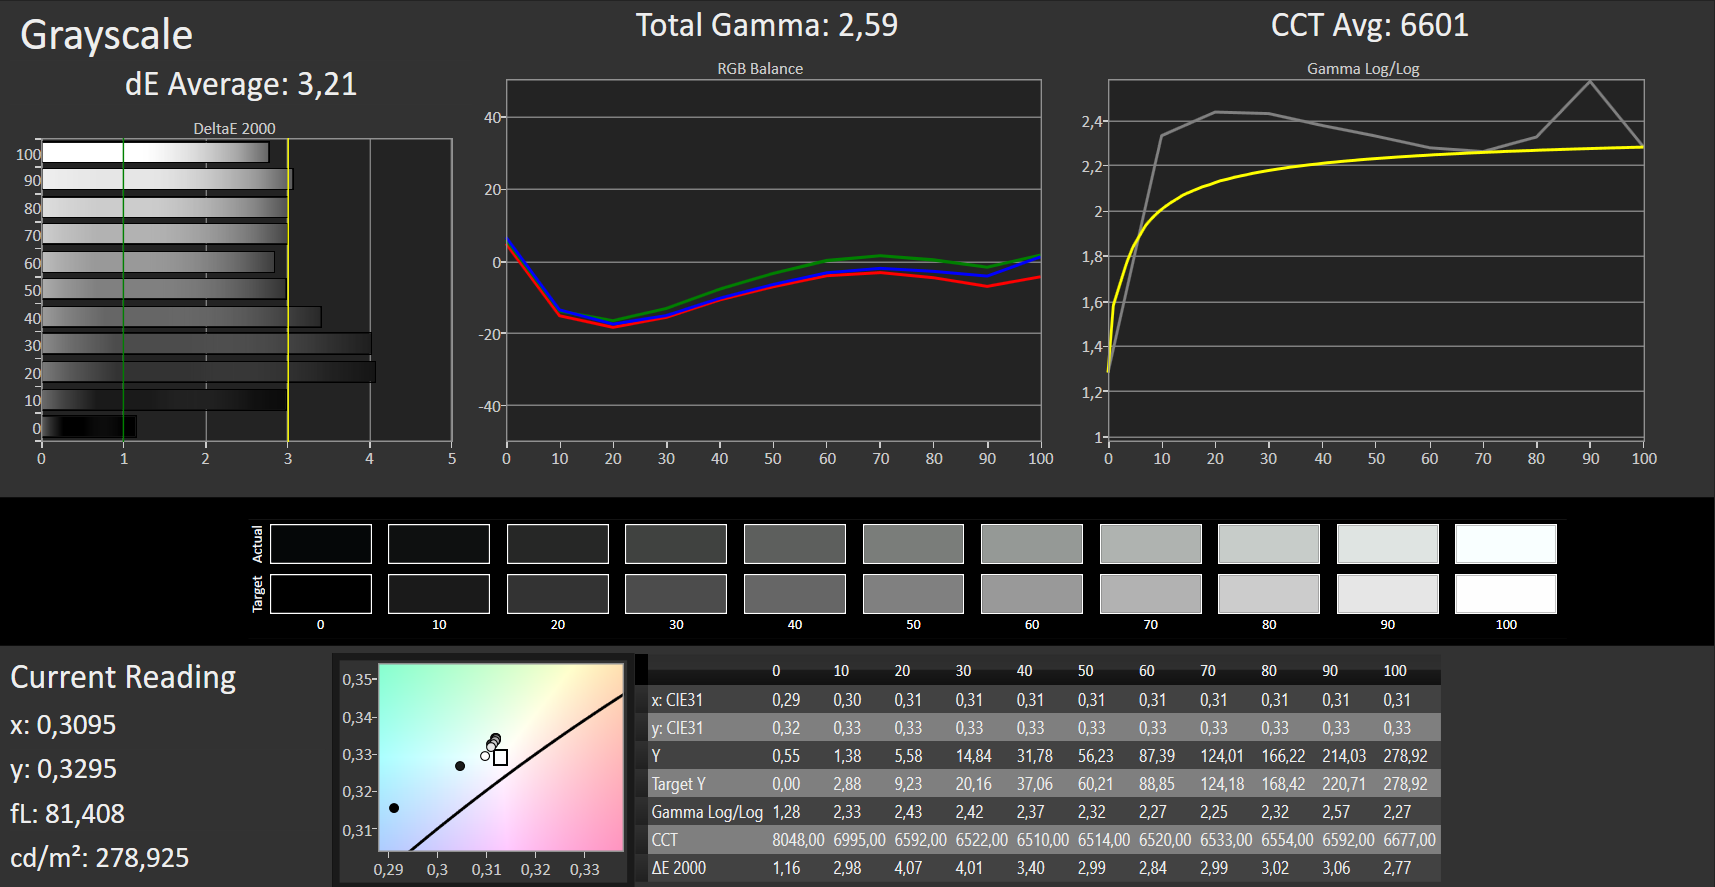
ΔE Greyscale Calman: 3.21 | ∀{0.09-98 Ø4.96}
57% sRGB (Argyll 1.6.3 3D)
36% AdobeRGB 1998 (Argyll 1.6.3 3D)
39.65% AdobeRGB 1998 (Argyll 3D)
57.5% sRGB (Argyll 3D)
38.34% Display P3 (Argyll 3D)
Gamma: 2.59
CCT: 6601 K
| Acer Aspire 7 A715-72G-704Q IPS, 1920x1080, 15.6" | Acer Aspire 7 A715-71G-53TU a-Si TFT-LCD, IPS, 1920x1080, 15.6" | HP Pavilion Gaming 15-cx0003ng IPS, 1920x1080, 15.6" | Dell G3 15 3579 IPS, 1920x1080, 15.6" | Lenovo Legion Y730-15ICH i5-8300H IPS, 1920x1080, 15.6" | |
|---|---|---|---|---|---|
| Display | 5% | 4% | 0% | 60% | |
| Display P3 Coverage (%) | 38.34 | 40.53 6% | 39.72 4% | 38.48 0% | 65.9 72% |
| sRGB Coverage (%) | 57.5 | 59.9 4% | 59.3 3% | 57.9 1% | 85.5 49% |
| AdobeRGB 1998 Coverage (%) | 39.65 | 41.87 6% | 41.04 4% | 39.75 0% | 62.5 58% |
| Response Times | -45% | -32% | 5% | -45% | |
| Response Time Grey 50% / Grey 80% * (ms) | 35 ? | 49 ? -40% | 47 ? -34% | 32.4 ? 7% | 43.2 ? -23% |
| Response Time Black / White * (ms) | 24 ? | 36 ? -50% | 31 ? -29% | 23.2 ? 3% | 40 ? -67% |
| PWM Frequency (Hz) | 20000 ? | 208 ? | 21740 ? | ||
| Screen | 14% | 21% | -7% | 11% | |
| Brightness middle (cd/m²) | 280 | 267 -5% | 241 -14% | 208.2 -26% | 286.5 2% |
| Brightness (cd/m²) | 248 | 250 1% | 236 -5% | 203 -18% | 269 8% |
| Brightness Distribution (%) | 81 | 82 1% | 75 -7% | 81 0% | 84 4% |
| Black Level * (cd/m²) | 0.56 | 0.31 45% | 0.15 73% | 0.34 39% | 0.33 41% |
| Contrast (:1) | 500 | 861 72% | 1607 221% | 612 22% | 868 74% |
| Colorchecker dE 2000 * | 4.75 | 4.65 2% | 4.85 -2% | 4.65 2% | 6.3 -33% |
| Colorchecker dE 2000 max. * | 8.04 | 8.2 -2% | 8.82 -10% | 15.99 -99% | 10.01 -25% |
| Colorchecker dE 2000 calibrated * | 4.93 | 3.84 22% | 4.17 15% | ||
| Greyscale dE 2000 * | 3.21 | 2.65 17% | 5.15 -60% | 4.1 -28% | 5.6 -74% |
| Gamma | 2.59 85% | 2.44 90% | 2.49 88% | 2.3 96% | 2.23 99% |
| CCT | 6601 98% | 6820 95% | 7042 92% | 7352 88% | 6822 95% |
| Color Space (Percent of AdobeRGB 1998) (%) | 36 | 38 6% | 38 6% | 36.7 2% | 55.7 55% |
| Color Space (Percent of sRGB) (%) | 57 | 59 4% | 59 4% | 57.9 2% | 85.1 49% |
| Totalt genomsnitt (program/inställningar) | -9% /
4% | -2% /
10% | -1% /
-4% | 9% /
13% |
* ... mindre är bättre
Skärmflimmer / PWM (Puls-Width Modulation)
| Skärmflimmer / PWM upptäcktes inte | 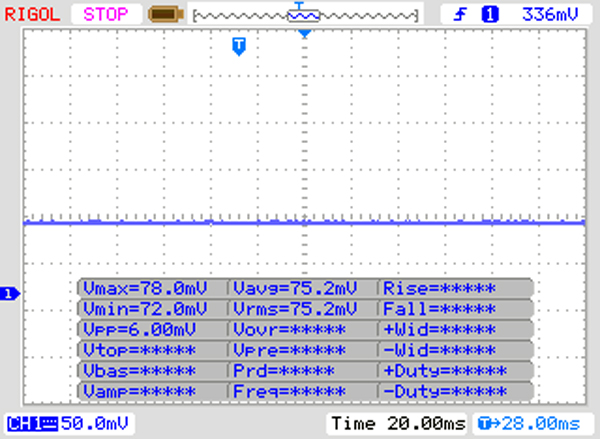 | ||
Som jämförelse: 52 % av alla testade enheter använder inte PWM för att dämpa skärmen. Om PWM upptäcktes mättes ett medelvärde av 7751 (minst: 5 - maximum: 343500) Hz. | |||

Visa svarstider
| ↔ Svarstid svart till vitt | ||
|---|---|---|
| 24 ms ... stiga ↗ och falla ↘ kombinerat | ↗ 14 ms stiga | 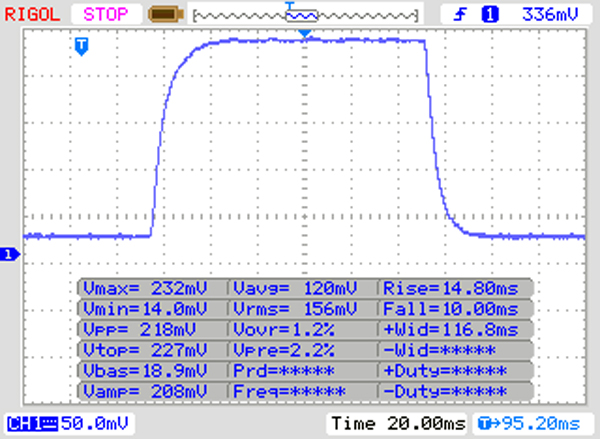 |
| ↘ 10 ms hösten | ||
| Skärmen visar bra svarsfrekvens i våra tester, men kan vara för långsam för konkurrenskraftiga spelare. I jämförelse sträcker sig alla testade enheter från 0.1 (minst) till 240 (maximalt) ms. » 54 % av alla enheter är bättre. Detta innebär att den uppmätta svarstiden är sämre än genomsnittet av alla testade enheter (19.8 ms). | ||
| ↔ Svarstid 50 % grått till 80 % grått | ||
| 35 ms ... stiga ↗ och falla ↘ kombinerat | ↗ 17 ms stiga | 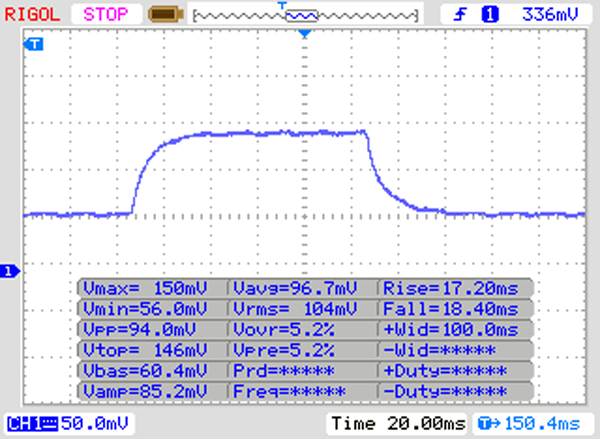 |
| ↘ 18 ms hösten | ||
| Skärmen visar långsamma svarsfrekvenser i våra tester och kommer att vara otillfredsställande för spelare. I jämförelse sträcker sig alla testade enheter från 0.165 (minst) till 636 (maximalt) ms. » 49 % av alla enheter är bättre. Detta innebär att den uppmätta svarstiden är sämre än genomsnittet av alla testade enheter (31 ms). | ||
| Geekbench 3 | |
| 32 Bit Multi-Core Score | |
| Genomsnitt Intel Core i7-8750H (20725 - 22665, n=13) | |
| HP Pavilion Gaming 15-cx0003ng | |
| Acer Aspire 7 A715-72G-704Q | |
| 32 Bit Single-Core Score | |
| Genomsnitt Intel Core i7-8750H (3734 - 4163, n=13) | |
| HP Pavilion Gaming 15-cx0003ng | |
| Acer Aspire 7 A715-72G-704Q | |
| Mozilla Kraken 1.1 - Total | |
| Dell G3 15 3579 (Edge 42.17134.1.0) | |
| Acer Aspire 7 A715-72G-704Q (Edge 44) | |
| Lenovo Legion Y730-15ICH i5-8300H (Edge 42.17134.1.0) | |
| Genomsnitt Intel Core i7-8750H (695 - 1272, n=50) | |
| HP Pavilion Gaming 15-cx0003ng | |
| Acer Aspire 7 A715-71G-53TU (EDGE: 41.16299.15.0) | |
| Genomsnitt av klass Multimedia (228 - 835, n=65, senaste 2 åren) | |
| Octane V2 - Total Score | |
| Genomsnitt av klass Multimedia (79641 - 153175, n=29, senaste 2 åren) | |
| Acer Aspire 7 A715-71G-53TU (EDGE: 41.16299.15.0) | |
| Acer Aspire 7 A715-72G-704Q (Edge 44) | |
| HP Pavilion Gaming 15-cx0003ng | |
| Genomsnitt Intel Core i7-8750H (27460 - 44549, n=47) | |
| Lenovo Legion Y730-15ICH i5-8300H (Edge 42.17134.1.0) | |
| Dell G3 15 3579 (Edge 42.17134.1.0) | |
| JetStream 1.1 - 1.1 Total | |
| Genomsnitt av klass Multimedia (n=1senaste 2 åren) | |
| Acer Aspire 7 A715-71G-53TU (EDGE: 41.16299.15.0) | |
| Acer Aspire 7 A715-72G-704Q (Edge 44) | |
| HP Pavilion Gaming 15-cx0003ng (Edge 44) | |
| Genomsnitt Intel Core i7-8750H (205 - 299, n=49) | |
| Dell G3 15 3579 (Edge 42.17134.1.0) | |
| Lenovo Legion Y730-15ICH i5-8300H (Edge 42.17134.1.0) | |
* ... mindre är bättre
| PCMark 7 Score | 6380 poäng | |
| PCMark 8 Home Score Accelerated v2 | 4125 poäng | |
| PCMark 8 Creative Score Accelerated v2 | 5255 poäng | |
| PCMark 8 Work Score Accelerated v2 | 5310 poäng | |
| PCMark 10 Score | 5162 poäng | |
Hjälp | ||

| Acer Aspire 7 A715-72G-704Q Intel SSD 760p SSDPEKKW256G8 | Acer Aspire 7 A715-71G-53TU Kingston RBUSNS8180DS3128GH | HP Pavilion Gaming 15-cx0003ng Intel Optane 16 GB MEMPEK1J016GAH + HGST HTS721010A9E630 1 TB HDD | Dell G3 15 3579 Seagate Mobile HDD 1TB ST1000LX015-1U7172 | Lenovo Legion Y730-15ICH i5-8300H Intel Optane 16 GB MEMPEK1J016GAL + HGST ST1000LM049 1 TB HDD | Genomsnitt Intel SSD 760p SSDPEKKW256G8 | |
|---|---|---|---|---|---|---|
| CrystalDiskMark 5.2 / 6 | -41% | -38% | -96% | -28% | 35% | |
| Write 4K (MB/s) | 103.4 | 74.3 -28% | 59.2 -43% | 0.202 -100% | 66.9 -35% | 148.8 ? 44% |
| Read 4K (MB/s) | 56 | 18.65 -67% | 91.3 63% | 0.461 -99% | 118.5 112% | 64.8 ? 16% |
| Write Seq (MB/s) | 808 | 405.8 -50% | 158.3 -80% | 53.5 -93% | 157.7 -80% | 956 ? 18% |
| Read Seq (MB/s) | 1939 | 480.7 -75% | 880 -55% | 107.2 -94% | 886 -54% | 2325 ? 20% |
| Write 4K Q32T1 (MB/s) | 281.3 | 235.7 -16% | 161.8 -42% | 0.882 -100% | 162.4 -42% | 381 ? 35% |
| Read 4K Q32T1 (MB/s) | 326.5 | 307.2 -6% | 286.5 -12% | 1.057 -100% | 353 8% | 462 ? 42% |
| Write Seq Q32T1 (MB/s) | 474.1 | 451.6 -5% | 159.8 -66% | 63.7 -87% | 159.8 -66% | 954 ? 101% |
| Read Seq Q32T1 (MB/s) | 2735 | 520 -81% | 929 -66% | 77.1 -97% | 926 -66% | 2848 ? 4% |
| 3DMark 06 Standard Score | 34938 poäng | |
| 3DMark 11 Performance | 9518 poäng | |
| 3DMark Ice Storm Standard Score | 108541 poäng | |
| 3DMark Cloud Gate Standard Score | 27353 poäng | |
| 3DMark Fire Strike Score | 6997 poäng | |
| 3DMark Fire Strike Extreme Score | 3647 poäng | |
| 3DMark Time Spy Score | 2595 poäng | |
Hjälp | ||
| låg | med. | hög | ultra | |
|---|---|---|---|---|
| Tomb Raider (2013) | 433 | 306.7 | 201.5 | 94.5 |
| BioShock Infinite (2013) | 270.6 | 216.5 | 195.4 | 76.7 |
| GTA V (2015) | 150.1 | 141 | 84.3 | 37.4 |
| The Witcher 3 (2015) | 145.5 | 86.5 | 50 | 29.7 |
| Dota 2 Reborn (2015) | 113 | 104 | 94 | 88 |
| World of Warships (2015) | 179.8 | 152.8 | 127.5 | 111.4 |
| The Division (2016) | 147 | 60.3 | 47.3 | 36.4 |
| Civilization 6 (2016) | 127.2 | 102.2 | 58.6 | 48 |
| X-Plane 11.11 (2018) | 87.8 | 78.2 | 65.9 | |
| F1 2018 (2018) | 146 | 86 | 63 | 39 |
| Shadow of the Tomb Raider (2018) | 95 | 42 | 37 | 31 |
| Assassin´s Creed Odyssey (2018) | 75 | 51 | 45 | 34 |
| Call of Duty Black Ops 4 (2018) | 114.7 | 52.9 | 52.3 | 47.7 |
| Hitman 2 (2018) | 71.6 | 49.4 | 44.9 | 42.3 |
| Battlefield V (2018) | 118.6 | 64.4 | 53.3 | 52 |
| Darksiders III (2018) | 167.3 | 70.4 | 55.3 | 46.3 |
| Just Cause 4 (2018) | 83.1 | 54 | 42.5 | 39.9 |
| BioShock Infinite - 1920x1080 Ultra Preset, DX11 (DDOF) | |
| Acer Aspire 7 A715-72G-704Q | |
| Lenovo Legion Y730-15ICH i5-8300H | |
| Genomsnitt NVIDIA GeForce GTX 1050 Ti Mobile (61 - 97, n=23) | |
| HP Pavilion Gaming 15-cx0003ng | |
| Dell G3 15 3579 | |
| Acer Aspire 7 A715-71G-53TU | |
| Shadow of the Tomb Raider - 1920x1080 Medium Preset | |
| Genomsnitt av klass Multimedia (28 - 167, n=8, senaste 2 åren) | |
| Acer Aspire 7 A715-72G-704Q | |
| Genomsnitt NVIDIA GeForce GTX 1050 Ti Mobile (38 - 42, n=4) | |
| Battlefield V - 1920x1080 Medium Preset | |
| Acer Aspire 7 A715-72G-704Q | |
| Genomsnitt NVIDIA GeForce GTX 1050 Ti Mobile (53.2 - 64.4, n=2) | |
| HP Pavilion Gaming 15-cx0003ng | |
Ljudnivå
| Låg belastning |
| 30.4 / 30.4 / 30.4 dB(A) |
| Hårddisk |
| 32.2 dB(A) |
| Hög belastning |
| 36.2 / 43.8 dB(A) |
 | ||
30 dB tyst 40 dB(A) hörbar 50 dB(A) högt ljud |
||
min: | ||
| Acer Aspire 7 A715-72G-704Q i7-8750H, GeForce GTX 1050 Ti Mobile | Acer Aspire 7 A715-71G-53TU i5-7300HQ, GeForce GTX 1050 Mobile | HP Pavilion Gaming 15-cx0003ng i7-8750H, GeForce GTX 1050 Ti Mobile | Dell G3 15 3579 i5-8300H, GeForce GTX 1050 Mobile | Lenovo Legion Y730-15ICH i5-8300H i5-8300H, GeForce GTX 1050 Ti Mobile | Genomsnitt NVIDIA GeForce GTX 1050 Ti Mobile | Genomsnitt av klass Multimedia | |
|---|---|---|---|---|---|---|---|
| Noise | 1% | -5% | -1% | -2% | -6% | 11% | |
| av / miljö * (dB) | 30.4 | 30.4 -0% | 30.6 -1% | 28 8% | 28.9 5% | 29.4 ? 3% | 24.1 ? 21% |
| Idle Minimum * (dB) | 30.4 | 30.4 -0% | 30.6 -1% | 29.8 2% | 32.2 -6% | 30.7 ? -1% | 24.3 ? 20% |
| Idle Average * (dB) | 30.4 | 30.8 -1% | 30.6 -1% | 29.8 2% | 32.5 -7% | 31.7 ? -4% | 24.6 ? 19% |
| Idle Maximum * (dB) | 30.4 | 30.8 -1% | 33.2 -9% | 30 1% | 32.7 -8% | 33.8 ? -11% | 26.2 ? 14% |
| Load Average * (dB) | 36.2 | 33.6 7% | 42.8 -18% | 38.6 -7% | 33.2 8% | 41.3 ? -14% | 37.3 ? -3% |
| Load Maximum * (dB) | 43.8 | 43.4 1% | 43 2% | 49.4 -13% | 45 -3% | 47.2 ? -8% | 46 ? -5% |
| Witcher 3 ultra * (dB) | 42.1 | 46.9 | 43.1 |
* ... mindre är bättre
(-) Den maximala temperaturen på ovansidan är 45.2 °C / 113 F, jämfört med genomsnittet av 36.8 °C / 98 F , allt från 21 till 71 °C för klassen Multimedia.
(±) Botten värms upp till maximalt 43.8 °C / 111 F, jämfört med genomsnittet av 39.1 °C / 102 F
(+) Vid tomgångsbruk är medeltemperaturen för ovansidan 23.2 °C / 74 F, jämfört med enhetsgenomsnittet på 31.3 °C / ### class_avg_f### F.
(+) Handledsstöden och pekplattan är kallare än hudtemperaturen med maximalt 25.1 °C / 77.2 F och är därför svala att ta på.
(+) Medeltemperaturen för handledsstödsområdet på liknande enheter var 28.7 °C / 83.7 F (+3.6 °C / 6.5 F).
| Acer Aspire 7 A715-72G-704Q i7-8750H, GeForce GTX 1050 Ti Mobile | Acer Aspire 7 A715-71G-53TU i5-7300HQ, GeForce GTX 1050 Mobile | HP Pavilion Gaming 15-cx0003ng i7-8750H, GeForce GTX 1050 Ti Mobile | Dell G3 15 3579 i5-8300H, GeForce GTX 1050 Mobile | Lenovo Legion Y730-15ICH i5-8300H i5-8300H, GeForce GTX 1050 Ti Mobile | Genomsnitt NVIDIA GeForce GTX 1050 Ti Mobile | Genomsnitt av klass Multimedia | |
|---|---|---|---|---|---|---|---|
| Heat | -5% | -5% | -29% | 11% | -10% | -1% | |
| Maximum Upper Side * (°C) | 45.2 | 41.6 8% | 44.1 2% | 47 -4% | 30 34% | 46.5 ? -3% | 41 ? 9% |
| Maximum Bottom * (°C) | 43.8 | 42.5 3% | 53.8 -23% | 61.2 -40% | 40.8 7% | 48.4 ? -11% | 43.4 ? 1% |
| Idle Upper Side * (°C) | 24.8 | 29.7 -20% | 24.6 1% | 34 -37% | 23.4 6% | 28.6 ? -15% | 26.9 ? -8% |
| Idle Bottom * (°C) | 26.4 | 29.4 -11% | 26.7 -1% | 35.8 -36% | 27.8 -5% | 28.9 ? -9% | 27.8 ? -5% |
* ... mindre är bättre
Acer Aspire 7 A715-72G-704Q ljudanalys
(-) | inte särskilt höga högtalare (65.1 dB)
Bas 100 - 315 Hz
(±) | reducerad bas - i genomsnitt 12% lägre än medianen
(±) | linjäriteten för basen är genomsnittlig (14.5% delta till föregående frekvens)
Mellan 400 - 2000 Hz
(+) | balanserad mellan - endast 4.6% från medianen
(±) | linjäriteten för mids är genomsnittlig (7.6% delta till föregående frekvens)
Högsta 2 - 16 kHz
(+) | balanserade toppar - endast 2.6% från medianen
(+) | toppar är linjära (4.6% delta till föregående frekvens)
Totalt 100 - 16 000 Hz
(±) | linjäriteten för det totala ljudet är genomsnittlig (19.1% skillnad mot median)
Jämfört med samma klass
» 61% av alla testade enheter i den här klassen var bättre, 7% liknande, 32% sämre
» Den bästa hade ett delta på 5%, genomsnittet var 17%, sämst var 45%
Jämfört med alla testade enheter
» 46% av alla testade enheter var bättre, 7% liknande, 47% sämre
» Den bästa hade ett delta på 4%, genomsnittet var 23%, sämst var 134%
HP Pavilion Gaming 15-cx0003ng ljudanalys
(-) | inte särskilt höga högtalare (70.4 dB)
Bas 100 - 315 Hz
(-) | nästan ingen bas - i genomsnitt 25.4% lägre än medianen
(±) | linjäriteten för basen är genomsnittlig (10.3% delta till föregående frekvens)
Mellan 400 - 2000 Hz
(+) | balanserad mellan - endast 2.3% från medianen
(+) | mids är linjära (6.9% delta till föregående frekvens)
Högsta 2 - 16 kHz
(+) | balanserade toppar - endast 1.8% från medianen
(+) | toppar är linjära (4.7% delta till föregående frekvens)
Totalt 100 - 16 000 Hz
(±) | linjäriteten för det totala ljudet är genomsnittlig (21.1% skillnad mot median)
Jämfört med samma klass
» 76% av alla testade enheter i den här klassen var bättre, 4% liknande, 20% sämre
» Den bästa hade ett delta på 6%, genomsnittet var 18%, sämst var 132%
Jämfört med alla testade enheter
» 58% av alla testade enheter var bättre, 7% liknande, 34% sämre
» Den bästa hade ett delta på 4%, genomsnittet var 23%, sämst var 134%
| Av/Standby | |
| Låg belastning | |
| Hög belastning |
|
Förklaring:
min: | |
| Acer Aspire 7 A715-72G-704Q i7-8750H, GeForce GTX 1050 Ti Mobile | Acer Aspire 7 A715-71G-53TU i5-7300HQ, GeForce GTX 1050 Mobile | HP Pavilion Gaming 15-cx0003ng i7-8750H, GeForce GTX 1050 Ti Mobile | Dell G3 15 3579 i5-8300H, GeForce GTX 1050 Mobile | Lenovo Legion Y730-15ICH i5-8300H i5-8300H, GeForce GTX 1050 Ti Mobile | Genomsnitt NVIDIA GeForce GTX 1050 Ti Mobile | Genomsnitt av klass Multimedia | |
|---|---|---|---|---|---|---|---|
| Power Consumption | 2% | -25% | -41% | -48% | -51% | -21% | |
| Idle Minimum * (Watt) | 3.9 | 4 -3% | 5.5 -41% | 7.9 -103% | 8 -105% | 7.92 ? -103% | 5.62 ? -44% |
| Idle Average * (Watt) | 6.6 | 6.9 -5% | 8.5 -29% | 9.6 -45% | 11.8 -79% | 11.9 ? -80% | 10.2 ? -55% |
| Idle Maximum * (Watt) | 8.5 | 9.4 -11% | 11.9 -40% | 13 -53% | 13.1 -54% | 15.4 ? -81% | 12.5 ? -47% |
| Load Average * (Watt) | 89 | 72.6 18% | 94 -6% | 93 -4% | 90.2 -1% | 85.1 ? 4% | 65 ? 27% |
| Load Maximum * (Watt) | 134 | 122 9% | 144 -7% | 132.7 1% | 136.2 -2% | 130.5 ? 3% | 111.9 ? 16% |
| Witcher 3 ultra * (Watt) | 86 | 100.6 | 107.8 |
* ... mindre är bättre
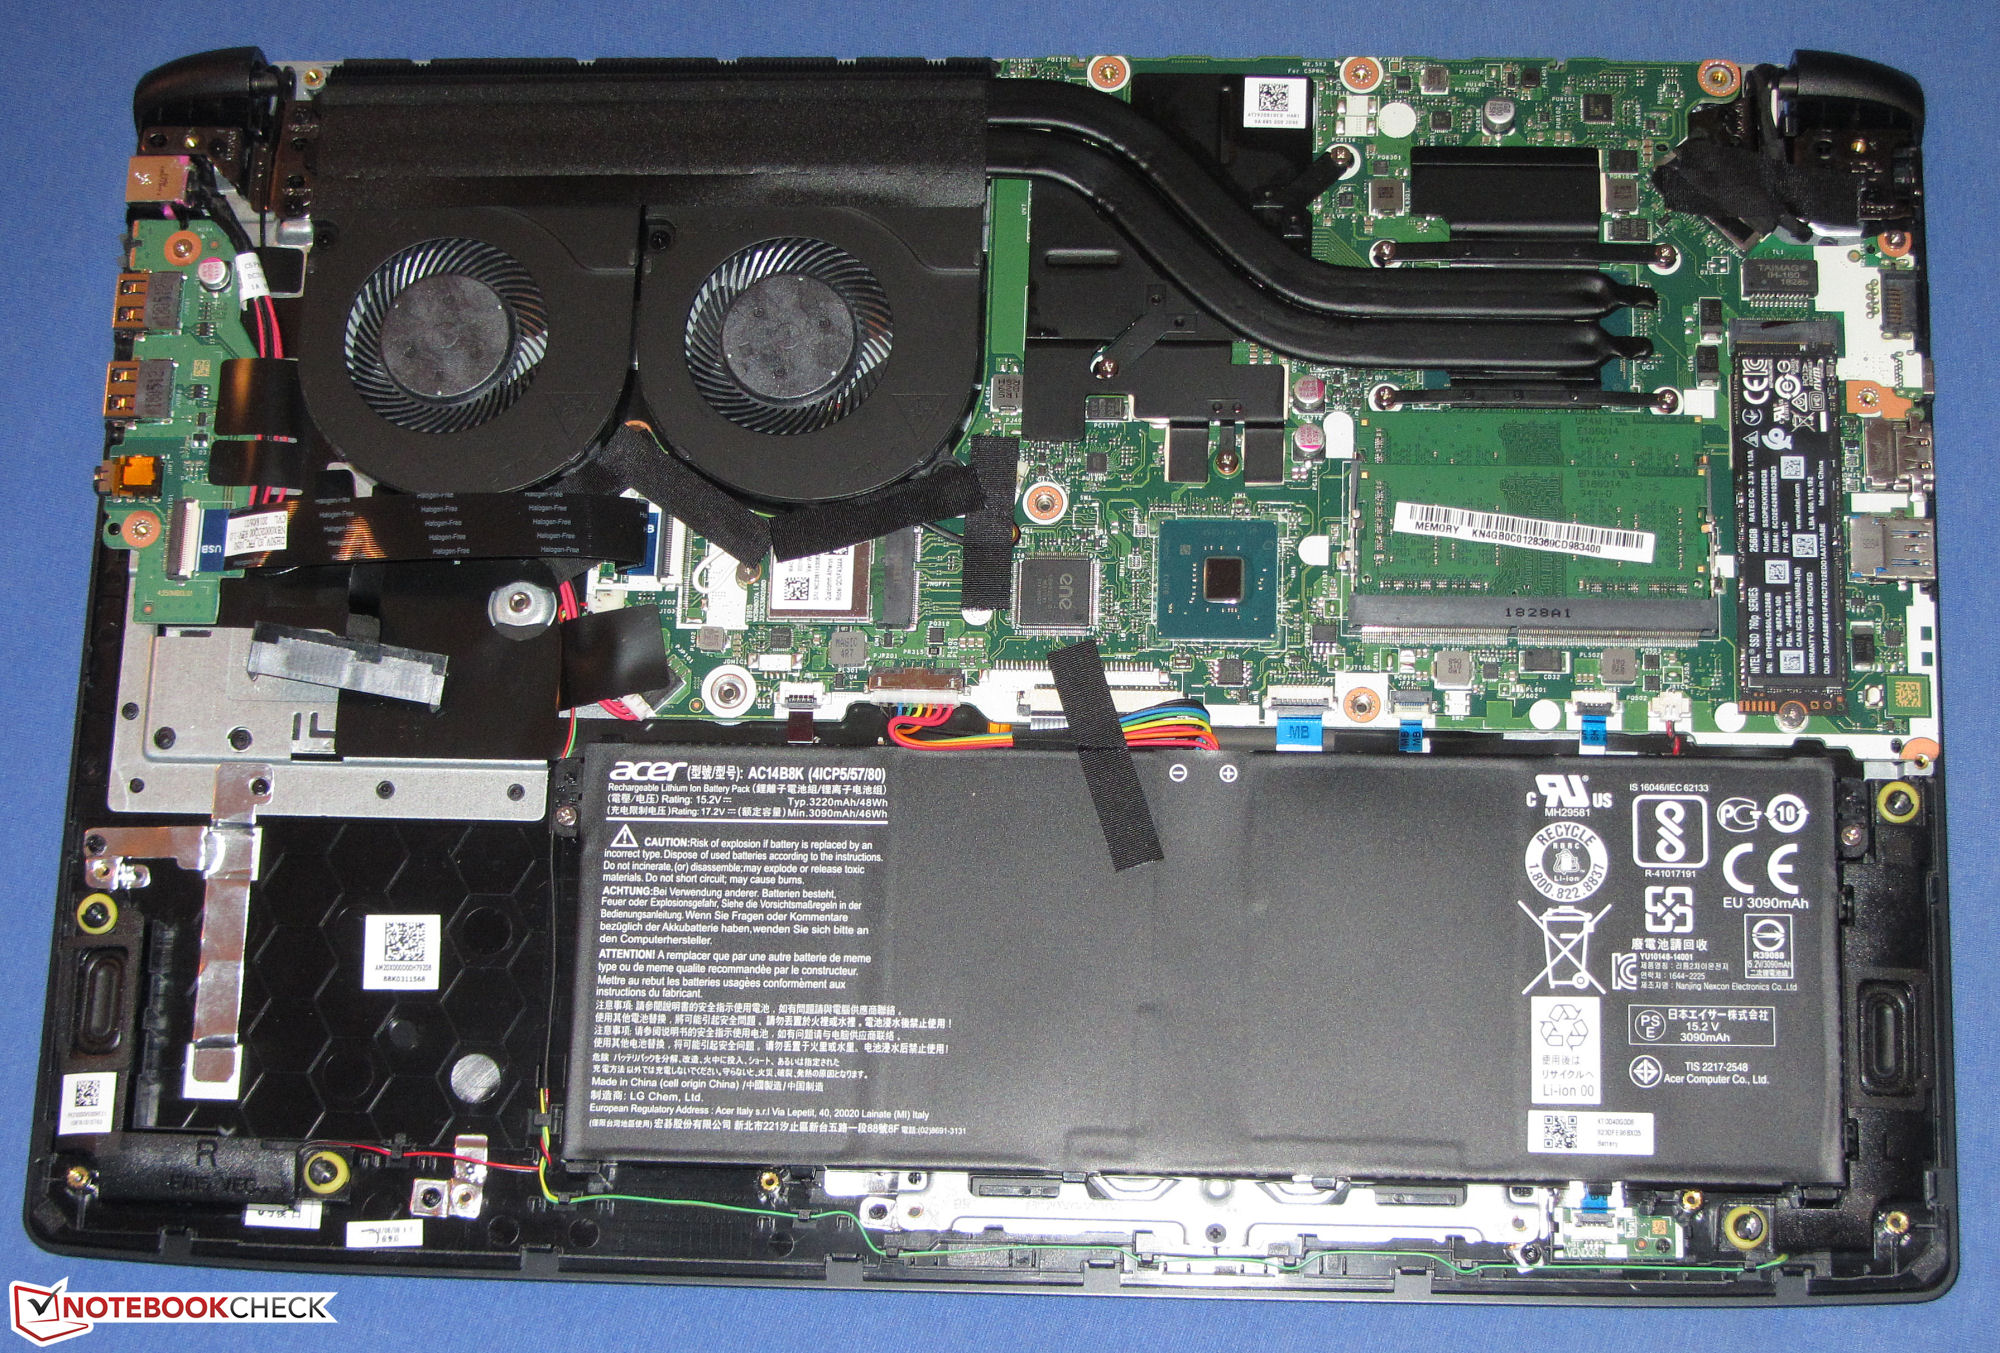
| Acer Aspire 7 A715-72G-704Q i7-8750H, GeForce GTX 1050 Ti Mobile, 48.9 Wh | Acer Aspire 7 A715-71G-53TU i5-7300HQ, GeForce GTX 1050 Mobile, 48 Wh | HP Pavilion Gaming 15-cx0003ng i7-8750H, GeForce GTX 1050 Ti Mobile, 52.5 Wh | Dell G3 15 3579 i5-8300H, GeForce GTX 1050 Mobile, 56 Wh | Lenovo Legion Y730-15ICH i5-8300H i5-8300H, GeForce GTX 1050 Ti Mobile, 57 Wh | Genomsnitt av klass Multimedia | |
|---|---|---|---|---|---|---|
| Batteridrifttid | -4% | -9% | 43% | -19% | 103% | |
| Reader / Idle (h) | 12.3 | 9.9 -20% | 10.8 -12% | 9.6 -22% | 24.9 ? 102% | |
| H.264 (h) | 6 | 5.1 -15% | 4.6 -23% | 16.8 ? 180% | ||
| WiFi v1.3 (h) | 6.4 | 5.6 -13% | 5.3 -17% | 6.5 2% | 5.3 -17% | 12.3 ? 92% |
| Load (h) | 1.2 | 1.6 33% | 1.4 17% | 2.2 83% | 1 -17% | 1.645 ? 37% |
För
Emot
Läs den fullständiga versionen av den här recensionen på engelska här.
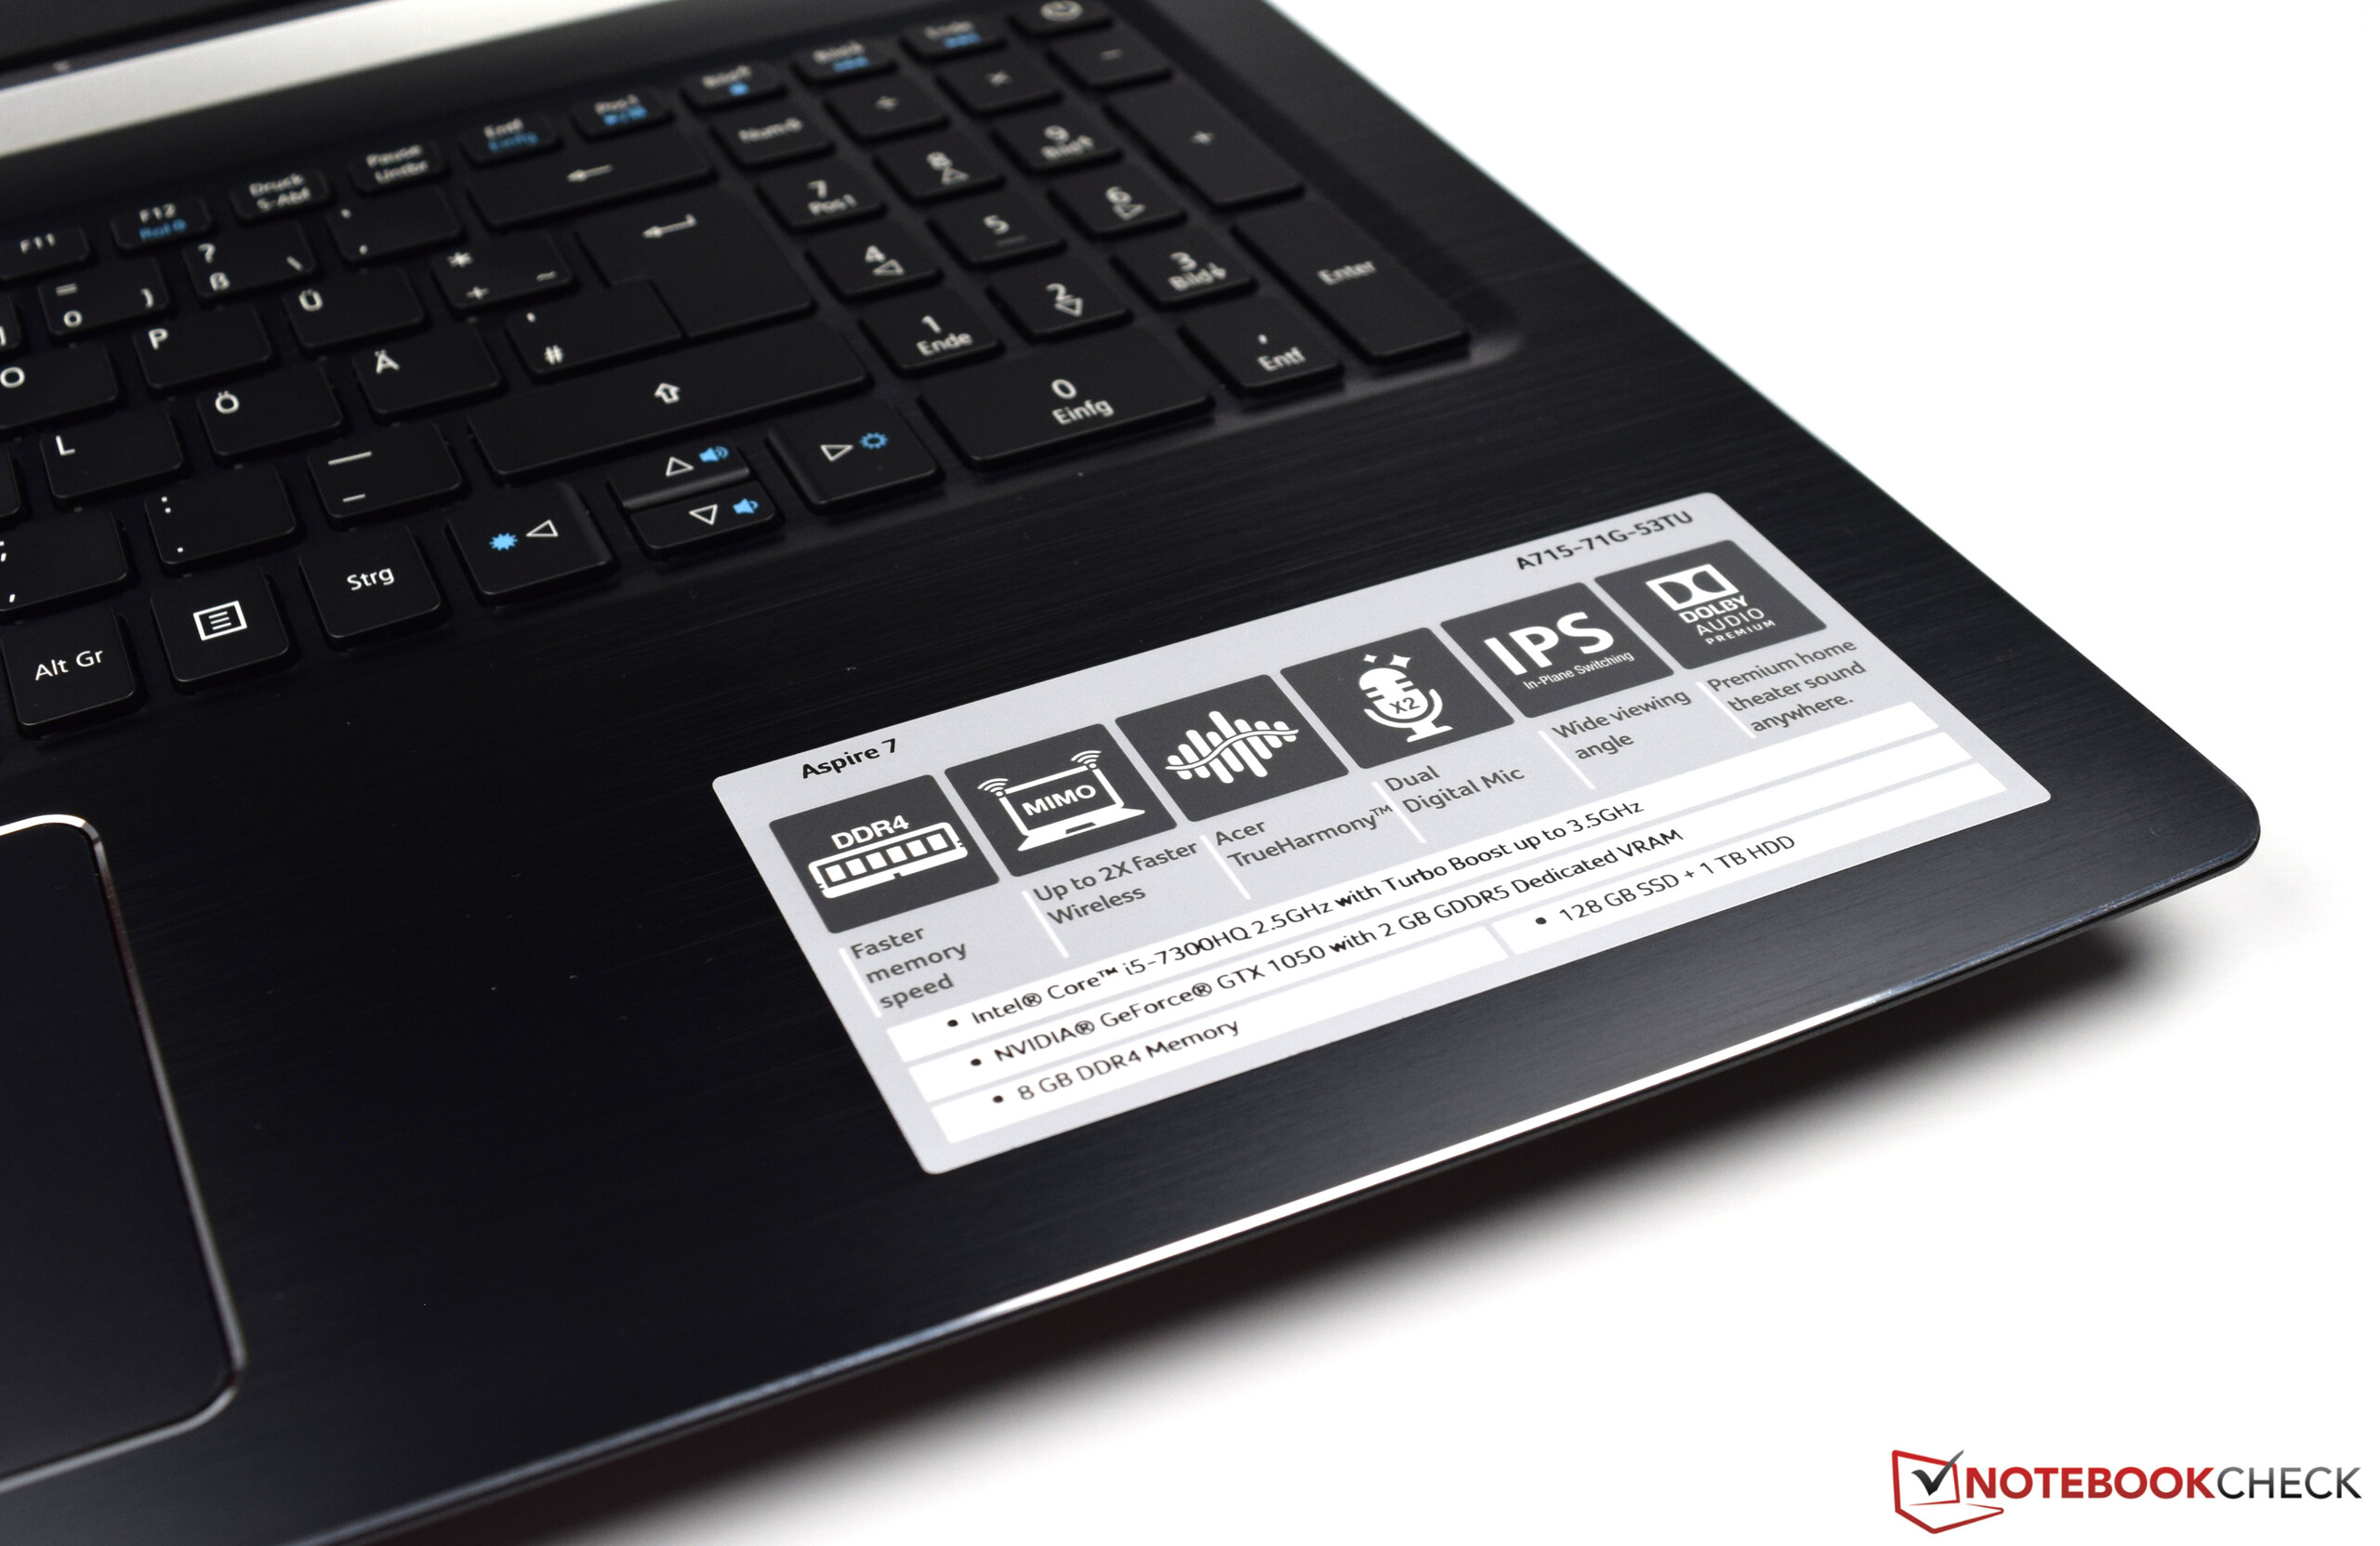
Aspire 7 A715-72G är en multimedialaptop på 15.6 tum som är lämplig att spela spel på. Den inbyggda Core i7-8750H processorn kommer inte att bli utdaterad än på länge. Ett GeForce GTX 1050 Ti är kapabelt att köra alla de senaste spelen smidigt.
Acers allt-i-allo lämnade ett gott intryck, men den är inte utan brister.
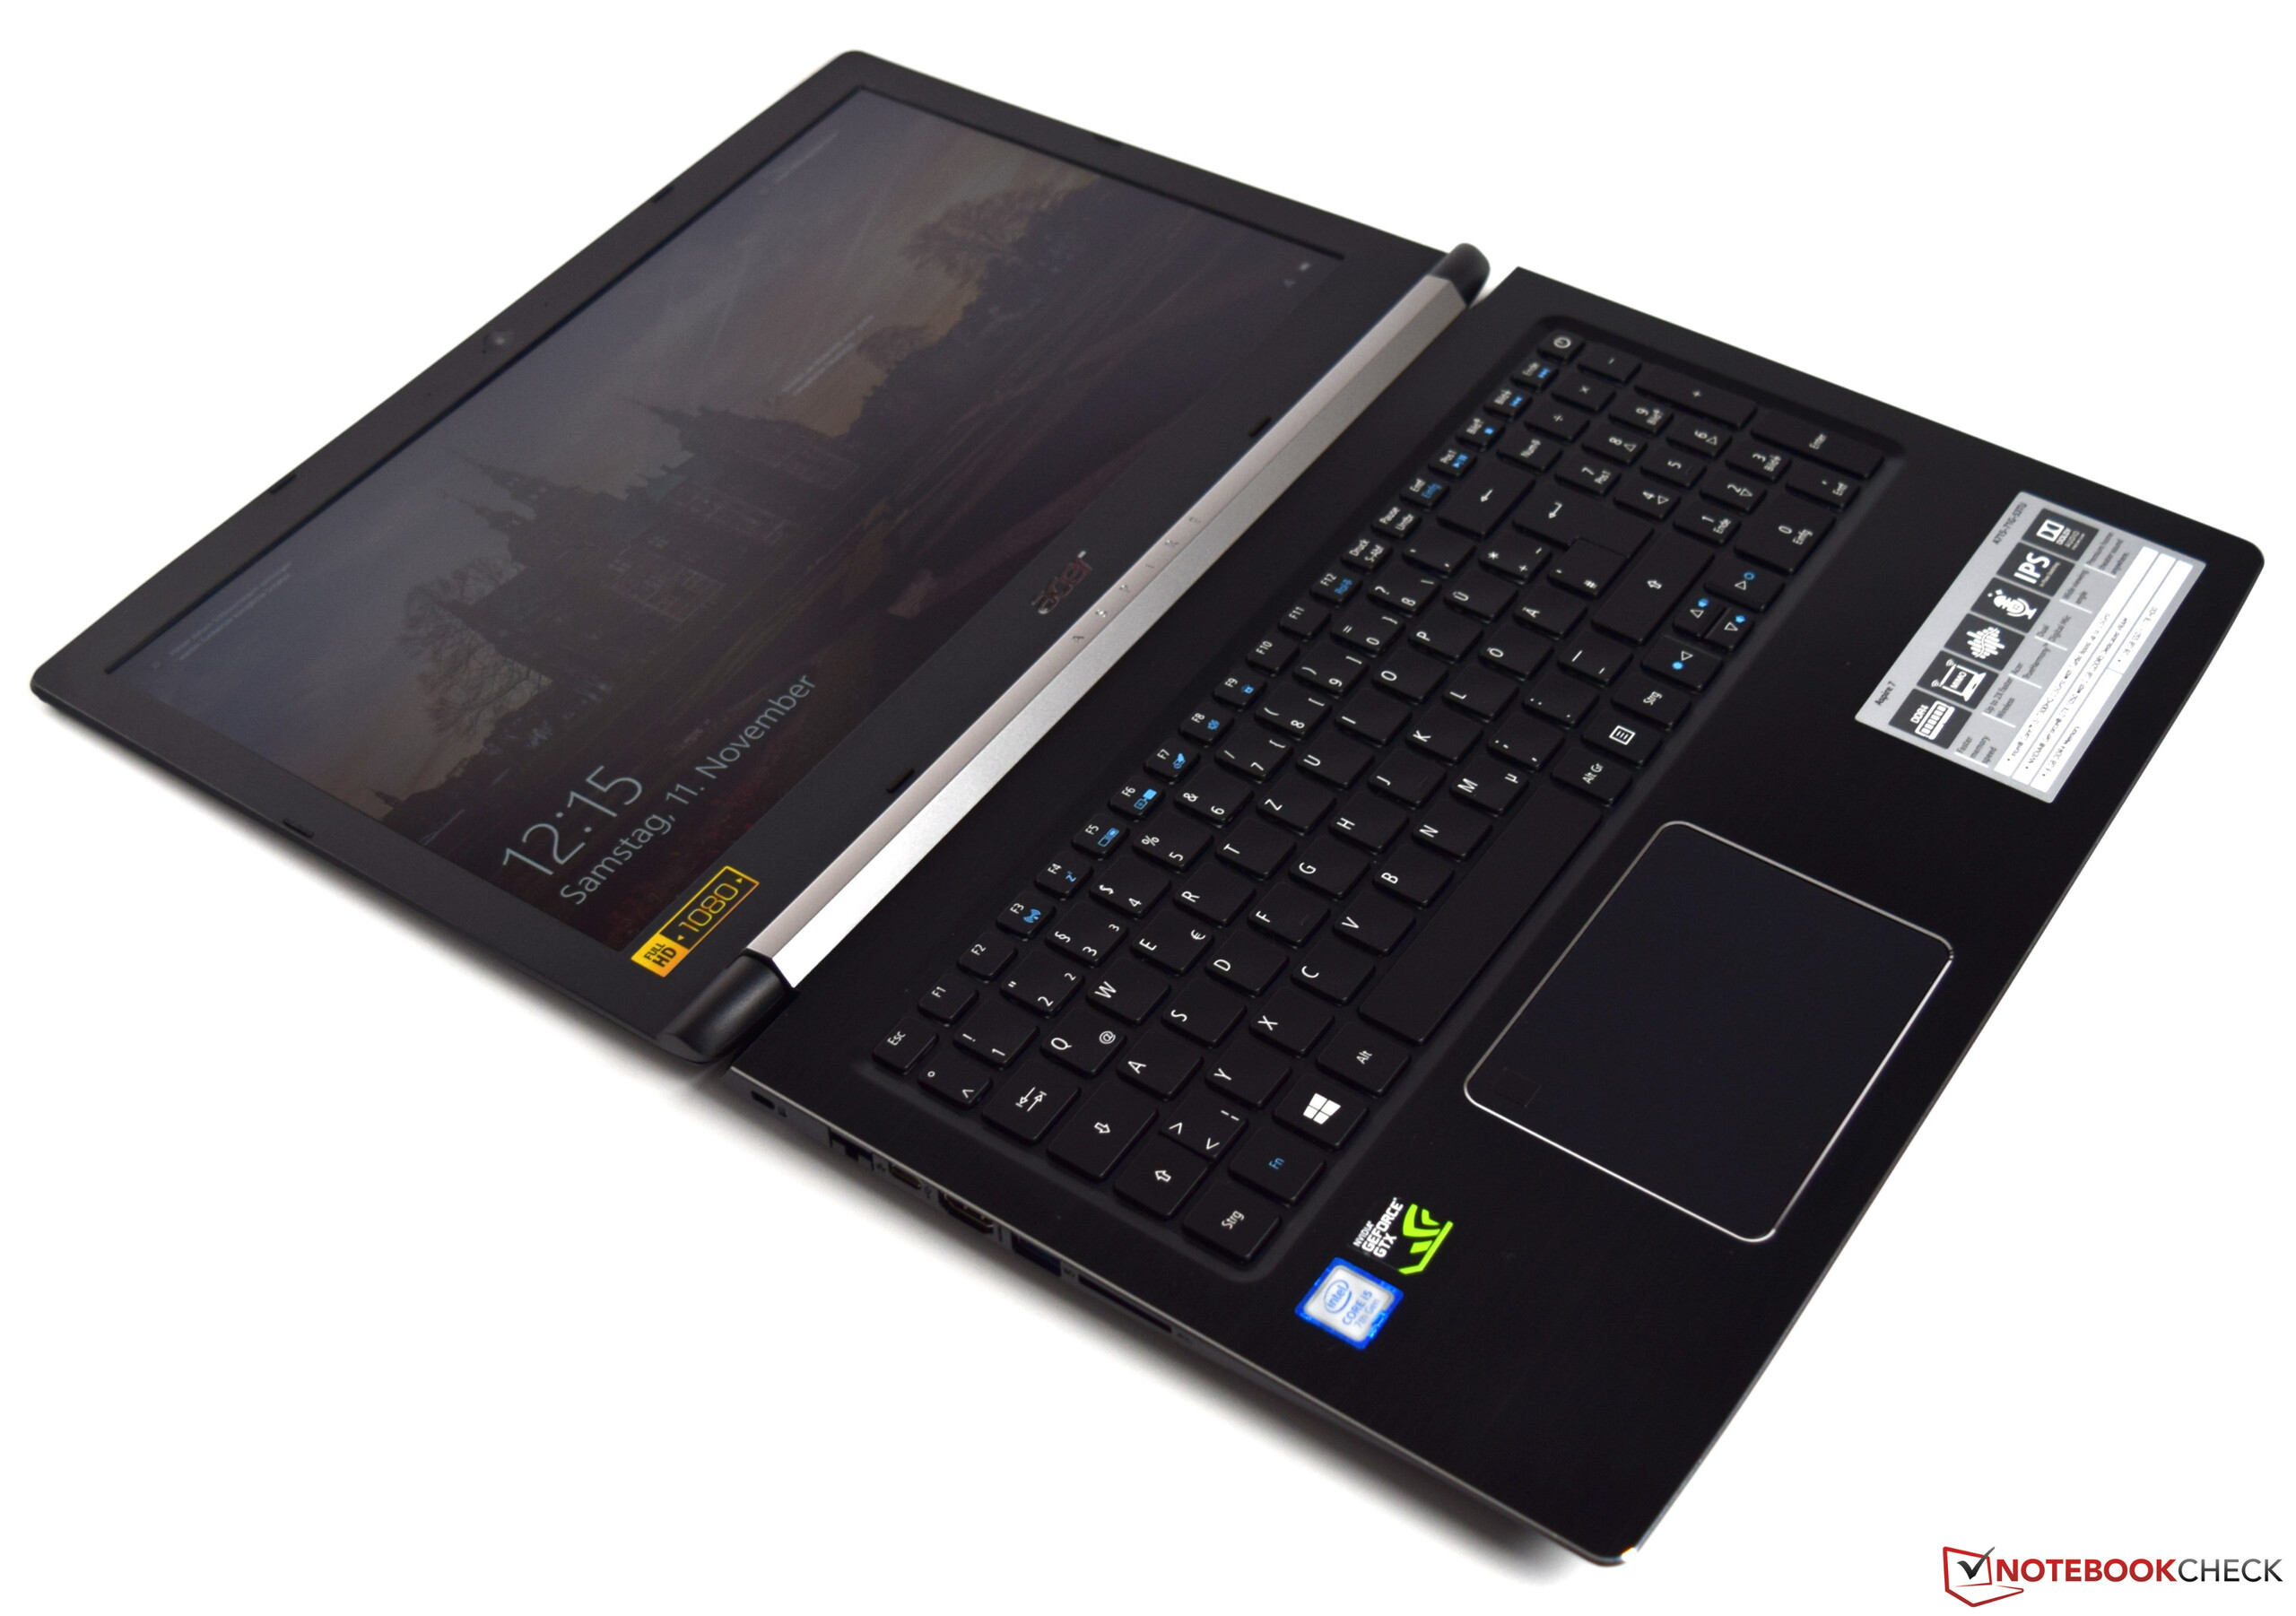
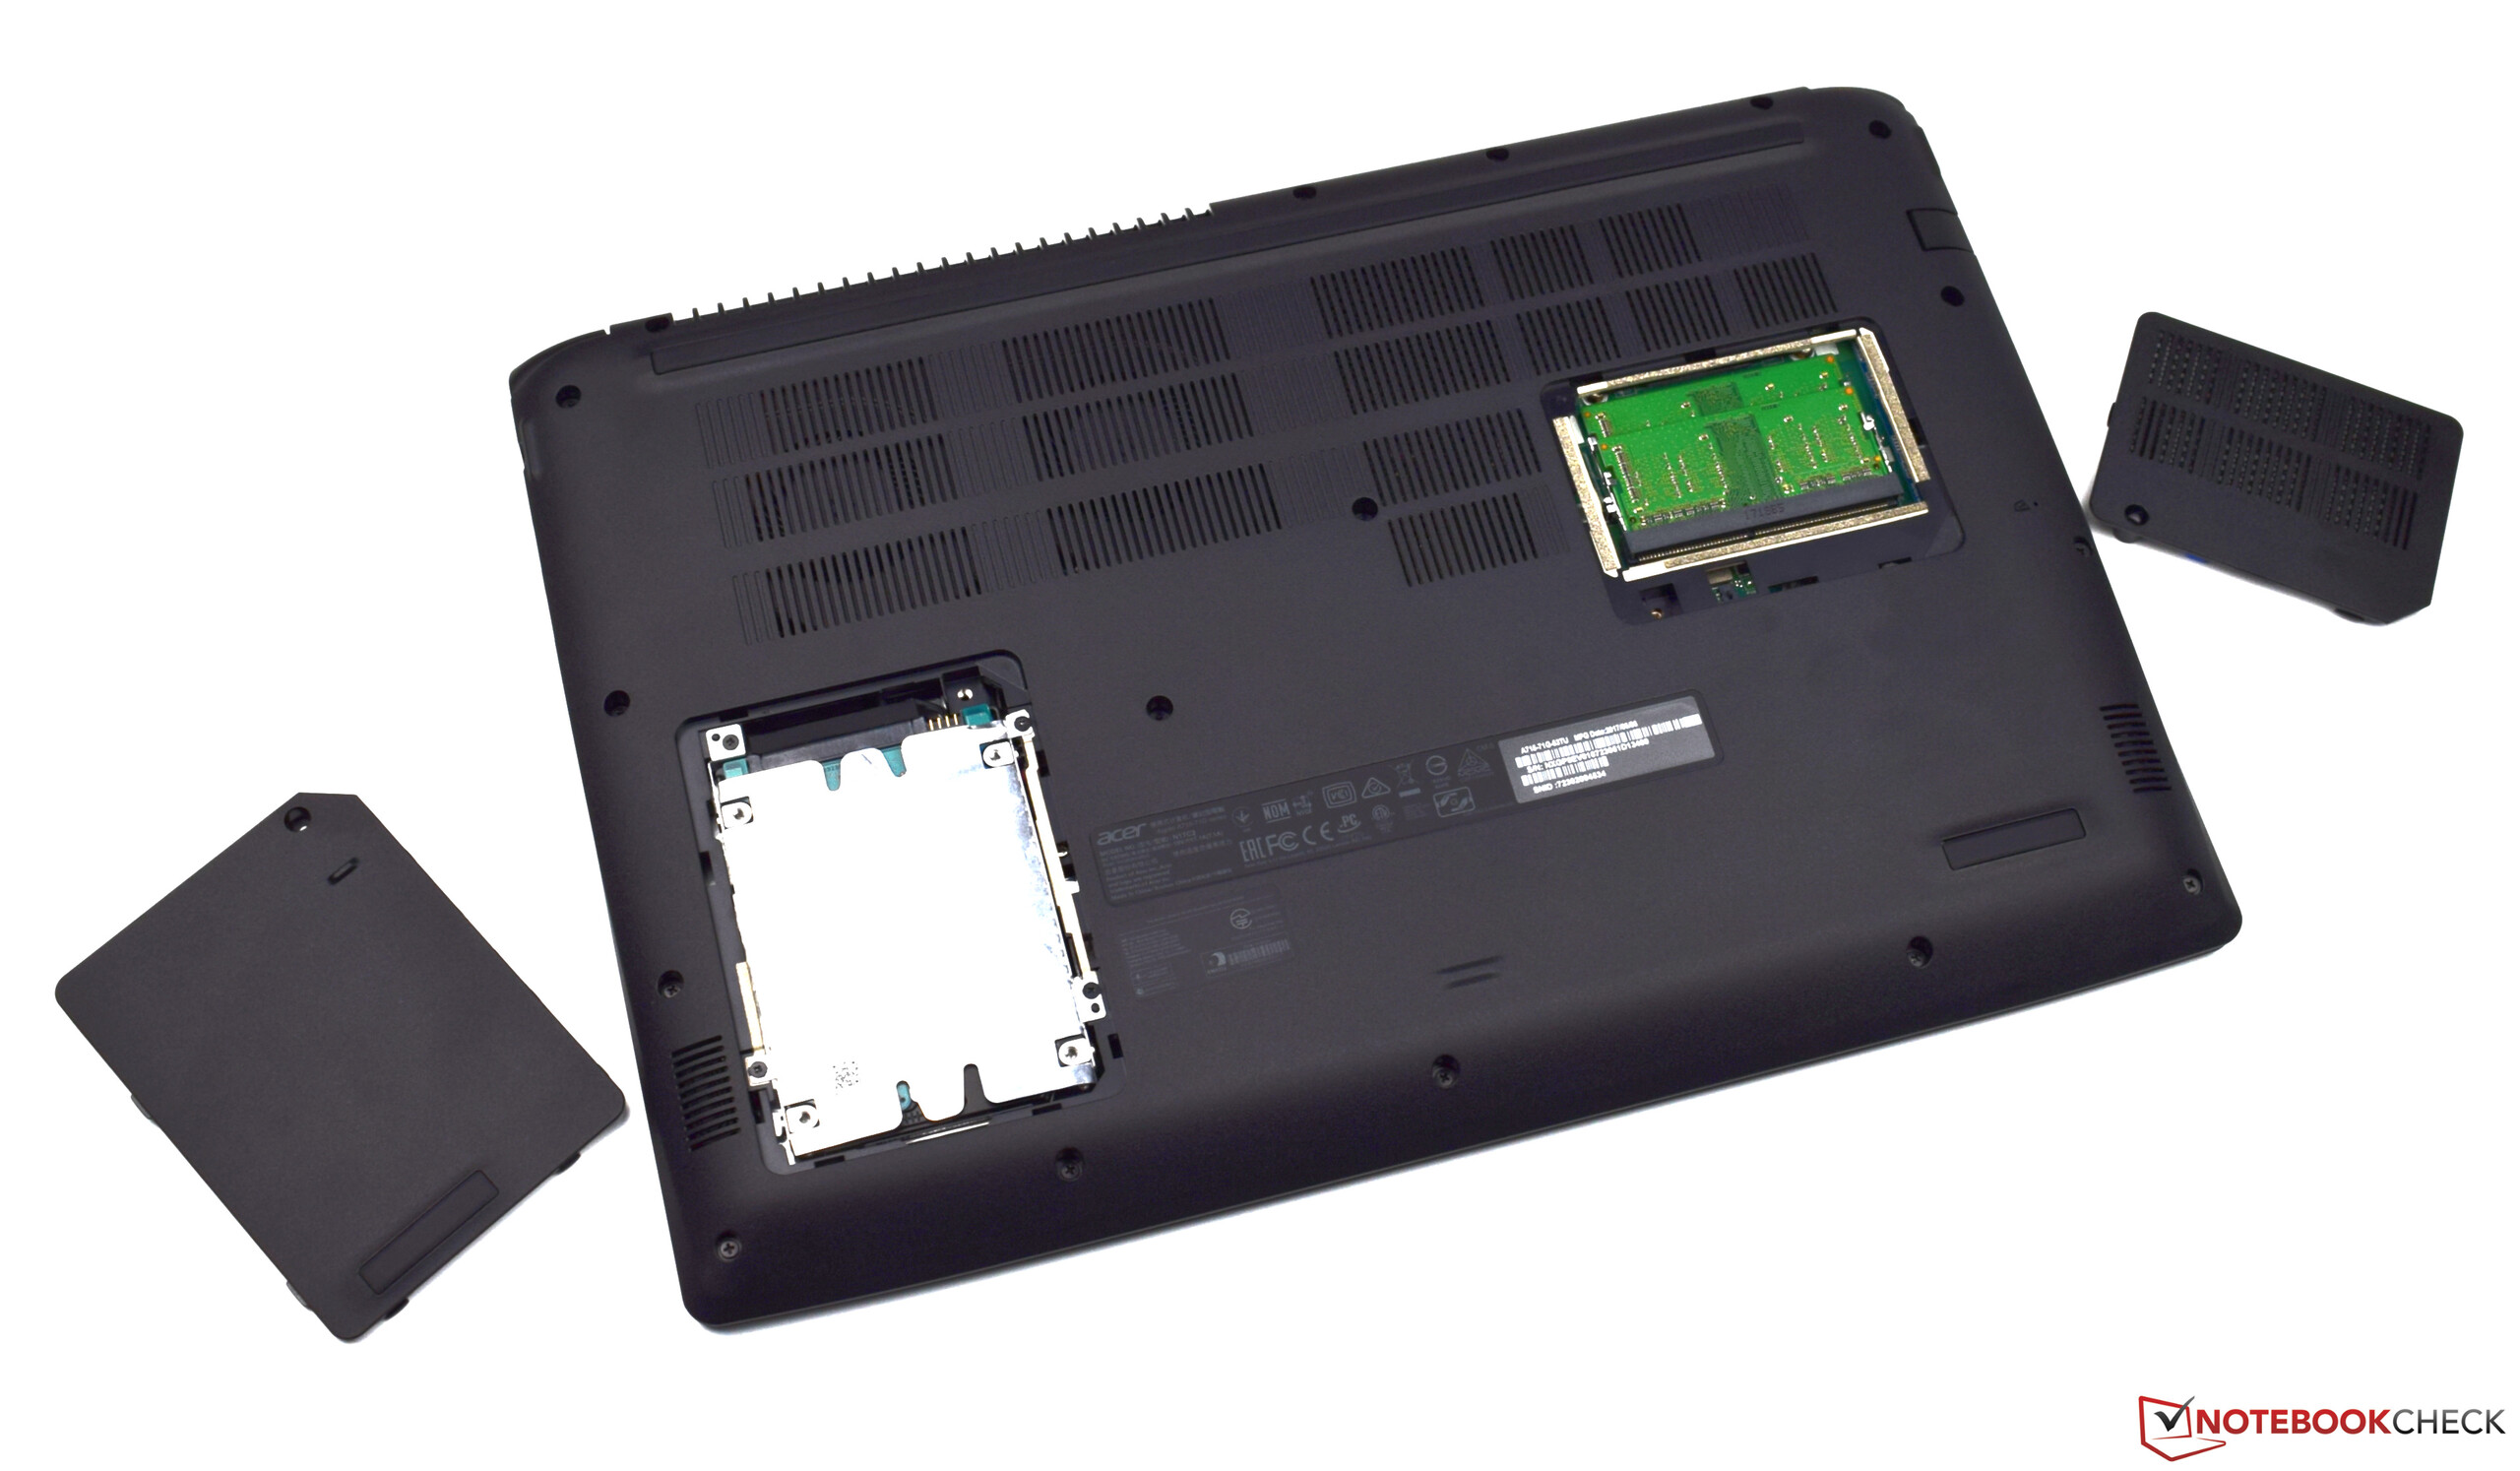
Trots kraftfull hårdvara är denna laptop i princip helt tyst när man använder kontorsprogram eller surfar på internet. Den blir heller inte särskilt varm. En NVMe SSD ger ett riktigt responsivt system. A715 har rikligt med lagringsutrymme. Utöver en SSD-enhet har Aspire 7 dessutom en hårddisk på 1 TB. Batteritiden är mer än okej för en laptop med såpass mycket kraft. Dessutom har Acers laptop ett bra tangentbord med bakgrundsbelysning.
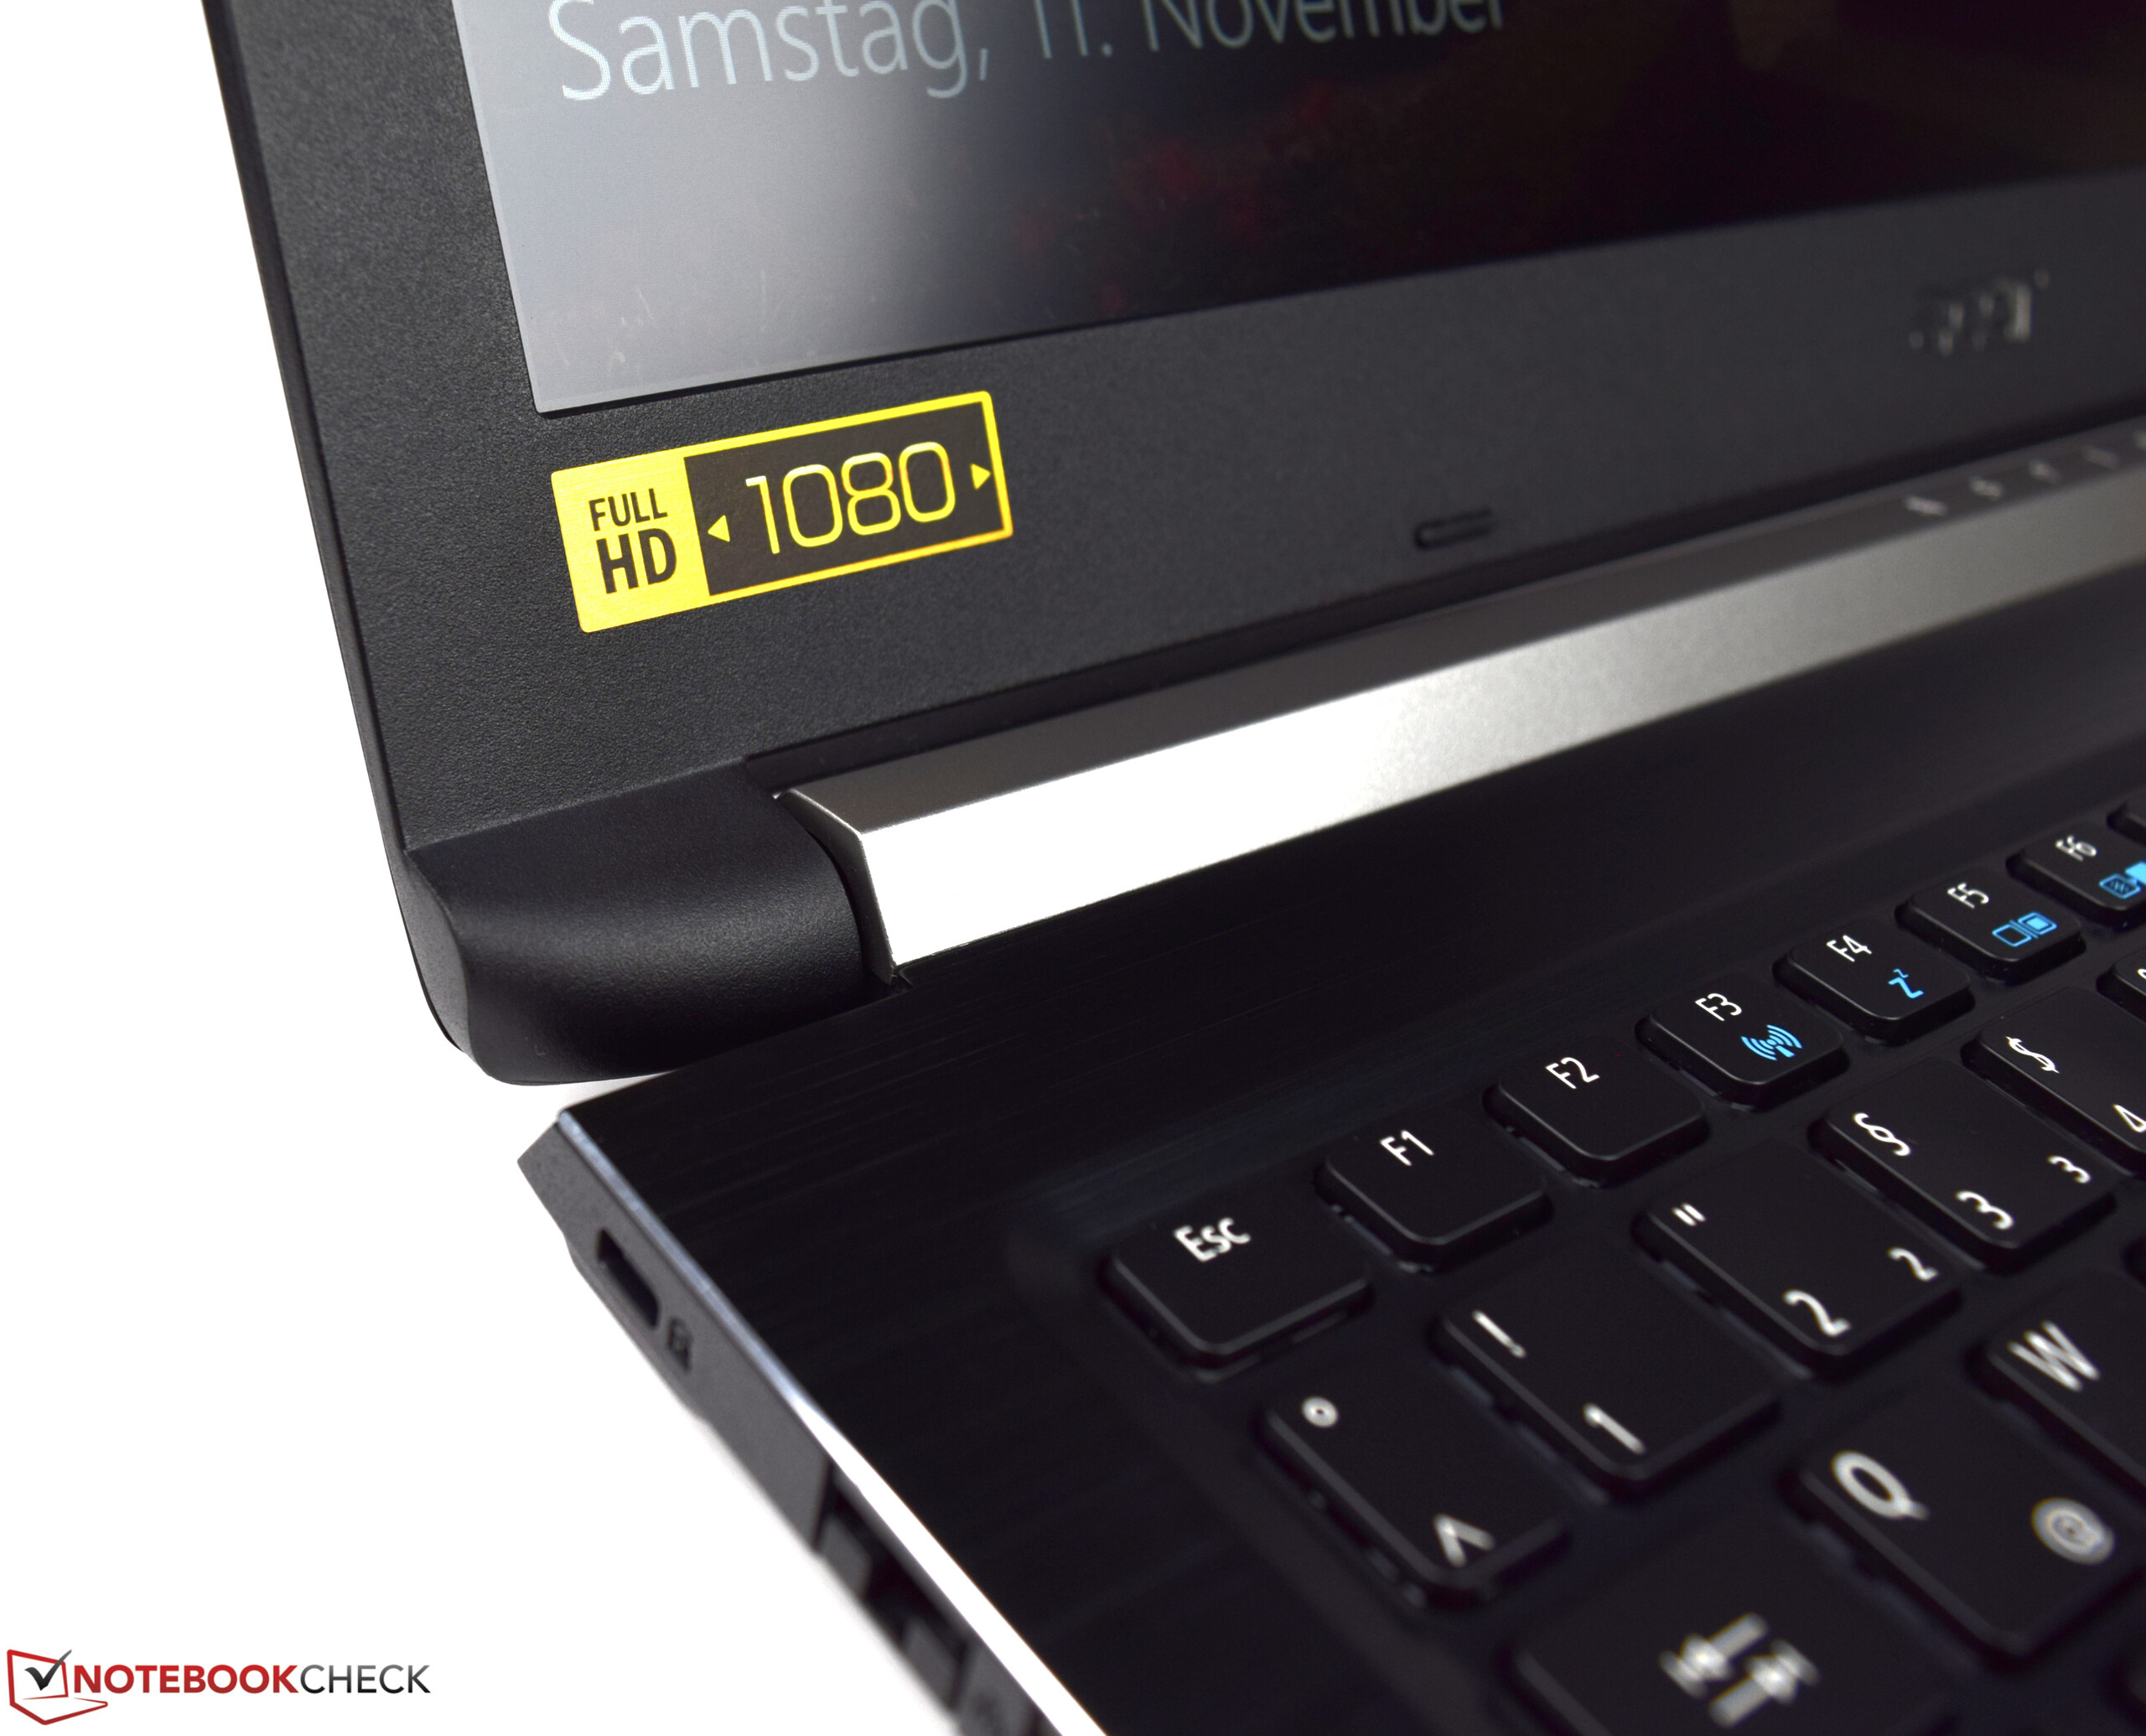
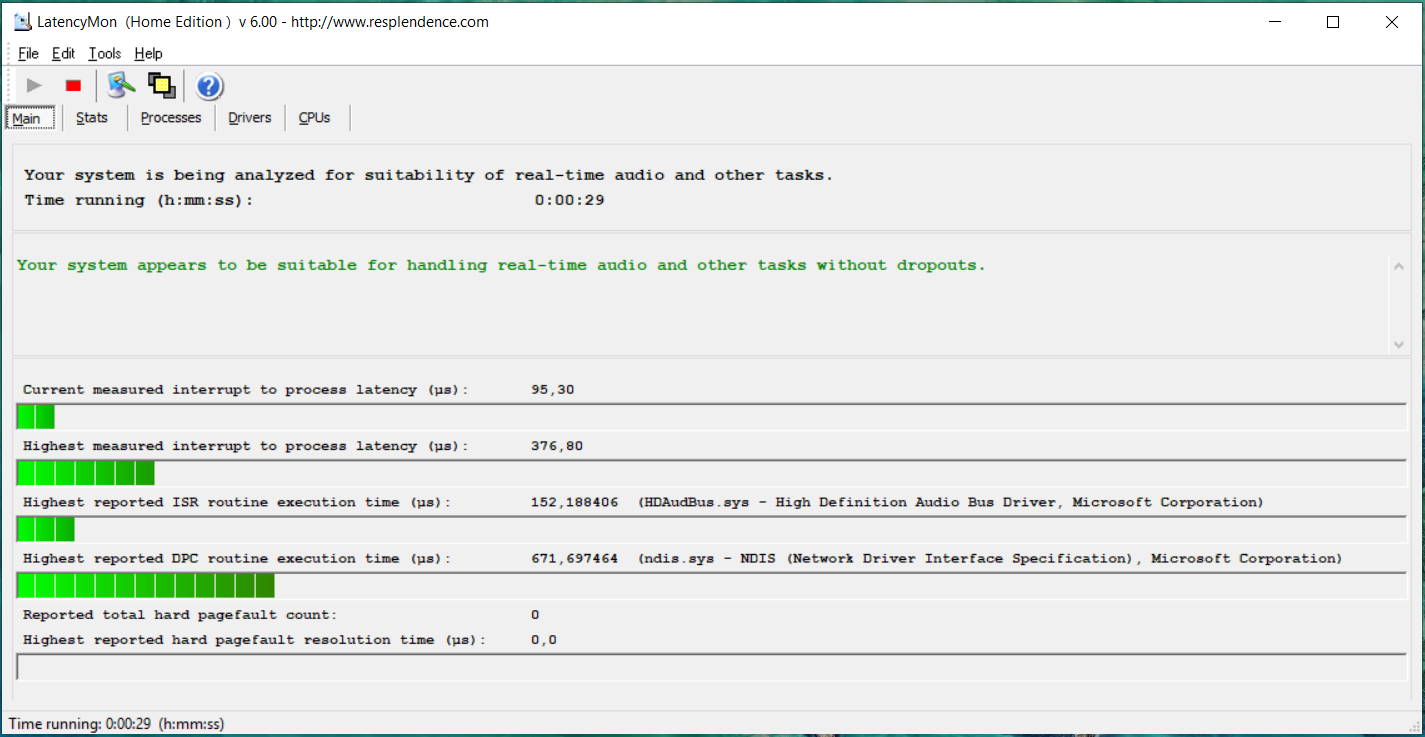
IPS-skärmen är inget att skryta om. Dess huvudsakliga fördelar inkluderar en matt skärmyta och bra betraktningsvinklar. Men både ljusstyrka och kontrastförhållande är för låga för en laptop som kostar 12.000 kronor. Spoltjut är ytterligare en nackdel. Det hörs ganska tydligt och blir irriterande i tysta miljöer.
Acer Aspire 7 A715-72G-704Q
- 01/30/2019 v6 (old)
Sascha Mölck