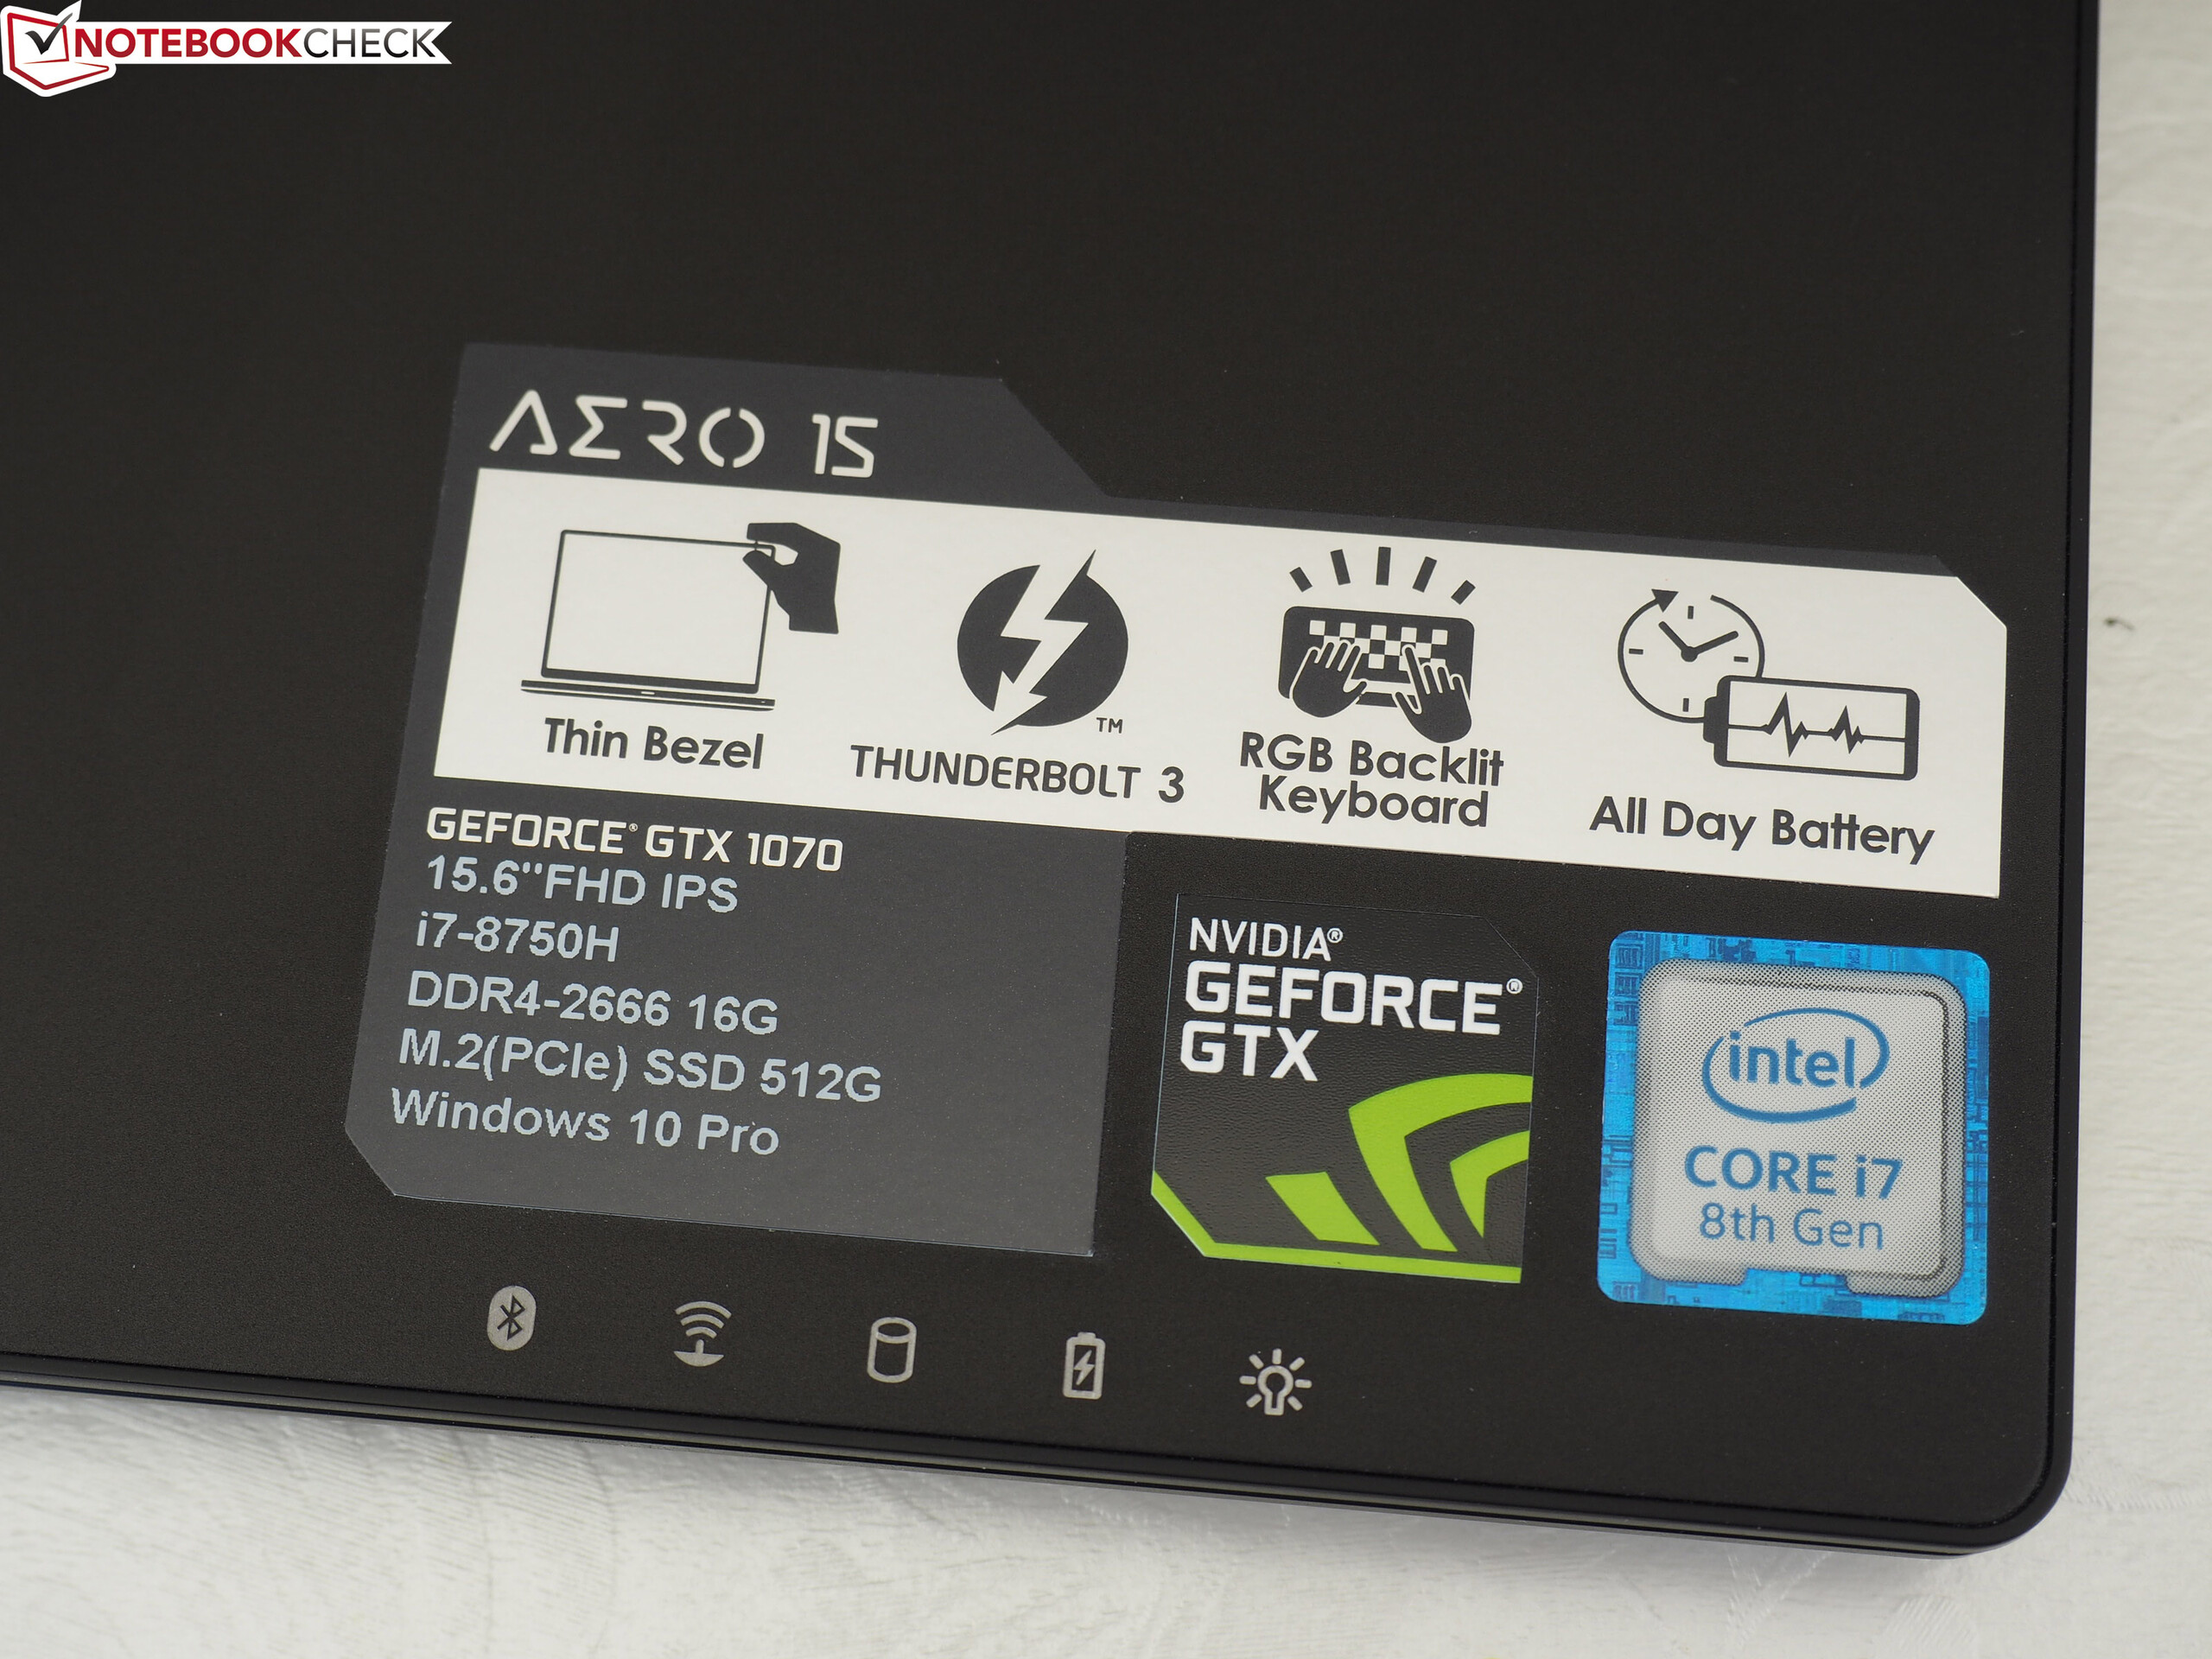
Test: Gigabyte Aero 15X v8 (i7-8750H, GTX 1070 Max-Q, Full-HD) Laptop (Sammanfattning)
| SD Card Reader | |
| average JPG Copy Test (av. of 3 runs) | |
| Gigabyte Aero 15X v8 (Toshiba Exceria Pro SDXC 64 GB UHS-II) | |
| MSI GS63VR 7RG-005 (Toshiba Exceria Pro SDXC 64 GB UHS-II) | |
| Genomsnitt av klass Gaming (20.9 - 210, n=54, senaste 2 åren) | |
| Gigabyte Aero 15X (Toshiba Exceria Pro SDXC 64 GB UHS-II) | |
| maximum AS SSD Seq Read Test (1GB) | |
| Gigabyte Aero 15X v8 (Toshiba Exceria Pro SDXC 64 GB UHS-II) | |
| MSI GS63VR 7RG-005 (Toshiba Exceria Pro SDXC 64 GB UHS-II) | |
| Genomsnitt av klass Gaming (25.5 - 261, n=51, senaste 2 åren) | |
| Gigabyte Aero 15X (Toshiba Exceria Pro SDXC 64 GB UHS-II) | |
| Networking | |
| iperf3 transmit AX12 | |
| Asus Zephyrus M GM501 | |
| Acer Predator Triton 700 | |
| MSI GS63VR 7RG-005 | |
| Gigabyte Aero 15X v8 | |
| Gigabyte Aero 15X | |
| iperf3 receive AX12 | |
| MSI GS63VR 7RG-005 | |
| Gigabyte Aero 15X | |
| Asus Zephyrus M GM501 | |
| Acer Predator Triton 700 | |
| Gigabyte Aero 15X v8 | |
| |||||||||||||||||||||||||
Distribution av ljusstyrkan: 78 %
Mitt på batteriet: 313 cd/m²
Kontrast: 948:1 (Svärta: 0.33 cd/m²)
ΔE ColorChecker Calman: 1.29 | ∀{0.5-29.43 Ø4.71}
ΔE Greyscale Calman: 0.69 | ∀{0.09-98 Ø4.96}
94% sRGB (Argyll 1.6.3 3D)
60% AdobeRGB 1998 (Argyll 1.6.3 3D)
64.9% AdobeRGB 1998 (Argyll 3D)
93.8% sRGB (Argyll 3D)
63.6% Display P3 (Argyll 3D)
Gamma: 2.43
CCT: 6550 K
| Gigabyte Aero 15X v8 LGD05C0, IPS, 1920x1080 | Gigabyte Aero 15X Chi Mei N156HCA-EA1 (CMN15D7), IPS, 1920x1080 | MSI GS63VR 7RG-005 Chi Mei N156HHE-GA1 (CMN15F4), TN LED, 1920x1080 | Asus Zephyrus M GM501 AUO B156HAN07.1 (AUO71ED), IPS, 1920x1080 | Acer Predator Triton 700 AUO B156HAN04.2 (AUO42ED), IPS, 1920x1080 | |
|---|---|---|---|---|---|
| Display | -0% | 28% | 2% | -3% | |
| Display P3 Coverage (%) | 63.6 | 64.7 2% | 91.6 44% | 66.1 4% | 62.5 -2% |
| sRGB Coverage (%) | 93.8 | 90.4 -4% | 100 7% | 92.7 -1% | 88.7 -5% |
| AdobeRGB 1998 Coverage (%) | 64.9 | 65.7 1% | 86.6 33% | 67.2 4% | 63.5 -2% |
| Response Times | -156% | 40% | 34% | -166% | |
| Response Time Grey 50% / Grey 80% * (ms) | 16.8 ? | 43.2 ? -157% | 10.4 ? 38% | 6.6 ? 61% | 44.8 ? -167% |
| Response Time Black / White * (ms) | 11.2 ? | 28.4 ? -154% | 6.6 ? 41% | 10.4 ? 7% | 29.6 ? -164% |
| PWM Frequency (Hz) | 26000 ? | 25510 ? | |||
| Screen | -179% | -58% | -157% | -155% | |
| Brightness middle (cd/m²) | 313 | 338 8% | 269 -14% | 307 -2% | 291 -7% |
| Brightness (cd/m²) | 300 | 324 8% | 254 -15% | 296 -1% | 277 -8% |
| Brightness Distribution (%) | 78 | 88 13% | 85 9% | 89 14% | 84 8% |
| Black Level * (cd/m²) | 0.33 | 0.34 -3% | 0.21 36% | 0.25 24% | 0.22 33% |
| Contrast (:1) | 948 | 994 5% | 1281 35% | 1228 30% | 1323 40% |
| Colorchecker dE 2000 * | 1.29 | 5.92 -359% | 3 -133% | 5.74 -345% | 5.52 -328% |
| Colorchecker dE 2000 max. * | 2.04 | 11.77 -477% | 5.62 -175% | 11.32 -455% | 10.72 -425% |
| Greyscale dE 2000 * | 0.69 | 7.45 -980% | 3.18 -361% | 6.44 -833% | 6.59 -855% |
| Gamma | 2.43 91% | 2.58 85% | 2.25 98% | 2.48 89% | 2.44 90% |
| CCT | 6550 99% | 6366 102% | 7274 89% | 8395 77% | 7816 83% |
| Color Space (Percent of AdobeRGB 1998) (%) | 60 | 59 -2% | 77 28% | 60 0% | 58 -3% |
| Color Space (Percent of sRGB) (%) | 94 | 90 -4% | 100 6% | 93 -1% | 89 -5% |
| Colorchecker dE 2000 calibrated * | 1.94 | ||||
| Totalt genomsnitt (program/inställningar) | -112% /
-140% | 3% /
-28% | -40% /
-100% | -108% /
-126% |
* ... mindre är bättre
Visa svarstider
| ↔ Svarstid svart till vitt | ||
|---|---|---|
| 11.2 ms ... stiga ↗ och falla ↘ kombinerat | ↗ 6 ms stiga | 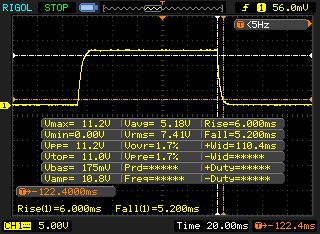 |
| ↘ 5.2 ms hösten | ||
| Skärmen visar bra svarsfrekvens i våra tester, men kan vara för långsam för konkurrenskraftiga spelare. I jämförelse sträcker sig alla testade enheter från 0.1 (minst) till 240 (maximalt) ms. » 30 % av alla enheter är bättre. Det betyder att den uppmätta svarstiden är bättre än genomsnittet av alla testade enheter (19.8 ms). | ||
| ↔ Svarstid 50 % grått till 80 % grått | ||
| 16.8 ms ... stiga ↗ och falla ↘ kombinerat | ↗ 8.4 ms stiga | 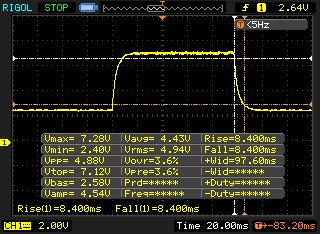 |
| ↘ 8.4 ms hösten | ||
| Skärmen visar bra svarsfrekvens i våra tester, men kan vara för långsam för konkurrenskraftiga spelare. I jämförelse sträcker sig alla testade enheter från 0.165 (minst) till 636 (maximalt) ms. » 31 % av alla enheter är bättre. Det betyder att den uppmätta svarstiden är bättre än genomsnittet av alla testade enheter (31 ms). | ||
Skärmflimmer / PWM (Puls-Width Modulation)
| Skärmflimmer / PWM upptäcktes inte |  | ||
Som jämförelse: 52 % av alla testade enheter använder inte PWM för att dämpa skärmen. Om PWM upptäcktes mättes ett medelvärde av 7754 (minst: 5 - maximum: 343500) Hz. | |||
| PCMark 8 Home Score Accelerated v2 | 4504 poäng | |
| PCMark 8 Work Score Accelerated v2 | 5676 poäng | |
| PCMark 10 Score | 5059 poäng | |
Hjälp | ||
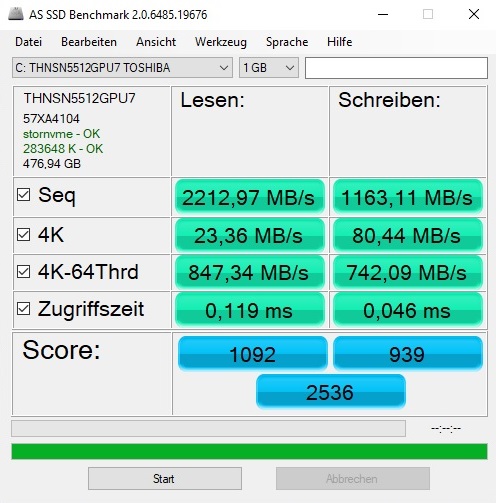
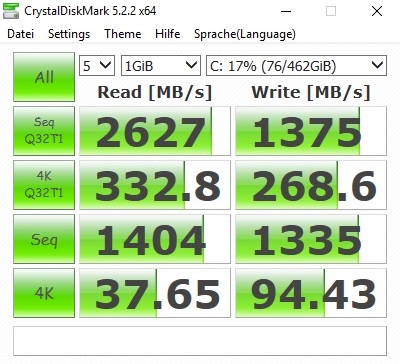
| Gigabyte Aero 15X v8 Toshiba NVMe THNSN5512GPU7 | Gigabyte Aero 15X Samsung SM961 MZVKW512HMJP m.2 PCI-e | MSI GS63VR 7RG-005 Samsung SM961 MZVPW256HEGL | Asus Zephyrus M GM501 Samsung SM961 MZVKW512HMJP m.2 PCI-e | Acer Predator Triton 700 2x SK Hynix Canvas SC300 512GB M.2 (HFS512G39MND) (RAID 0) | Genomsnitt Toshiba NVMe THNSN5512GPU7 | |
|---|---|---|---|---|---|---|
| AS SSD | 39% | 48% | 37% | 42% | 6% | |
| Seq Read (MB/s) | 2213 | 2508 13% | 2382 8% | 2091 -6% | 2517 14% | 2096 ? -5% |
| Seq Write (MB/s) | 1163 | 1124 -3% | 1281 10% | 1580 36% | 2372 104% | 1175 ? 1% |
| 4K Read (MB/s) | 23.36 | 46.56 99% | 51 118% | 43.42 86% | 41.47 78% | 31 ? 33% |
| 4K Write (MB/s) | 80.4 | 113.8 42% | 124.7 55% | 90.2 12% | 93 16% | 101.7 ? 26% |
| Score Read (Points) | 1092 | 1522 39% | 1795 64% | 1471 35% | 1350 24% | 1069 ? -2% |
| Score Write (Points) | 939 | 1333 42% | 1185 26% | 1446 54% | 1243 32% | 869 ? -7% |
| Score Total (Points) | 2536 | 3570 41% | 3848 52% | 3649 44% | 3282 29% | 2444 ? -4% |

| 3DMark 11 Performance | 15502 poäng | |
| 3DMark Ice Storm Standard Score | 152533 poäng | |
| 3DMark Cloud Gate Standard Score | 34461 poäng | |
| 3DMark Fire Strike Score | 13281 poäng | |
Hjälp | ||
| The Witcher 3 - 1920x1080 Ultra Graphics & Postprocessing (HBAO+) | |
| Genomsnitt av klass Gaming (104.7 - 240, n=7, senaste 2 åren) | |
| Acer Predator Triton 700 | |
| Asus Zephyrus M GM501 | |
| Gigabyte Aero 15X | |
| Gigabyte Aero 15X v8 | |
| Genomsnitt NVIDIA GeForce GTX 1070 Max-Q (46 - 55.3, n=19) | |
| MSI GS63VR 7RG-005 | |
| låg | med. | hög | ultra | |
|---|---|---|---|---|
| The Witcher 3 (2015) | 92.8 | 52.4 | ||
| FIFA 18 (2017) | 153 | 152 | ||
| Wolfenstein II: The New Colossus (2017) | 89.4 | 83 | ||
| Star Wars Battlefront 2 (2017) | 88.9 | 78.5 | ||
| Fortnite (2018) | 122 | 101 | ||
| Final Fantasy XV Benchmark (2018) | 51.7 | |||
| Kingdom Come: Deliverance (2018) | 64.8 | 50.2 | ||
| Far Cry 5 (2018) | 79 | 75 |
Ljudnivå
| Låg belastning |
| 30 / 31 / 35 dB(A) |
| Hög belastning |
| 49 / 54 dB(A) |
 | ||
30 dB tyst 40 dB(A) hörbar 50 dB(A) högt ljud |
||
min: | ||
| Gigabyte Aero 15X v8 GeForce GTX 1070 Max-Q, i7-8750H | Gigabyte Aero 15X GeForce GTX 1070 Max-Q, i7-7700HQ | MSI GS63VR 7RG-005 GeForce GTX 1070 Max-Q, i7-7700HQ | Asus Zephyrus M GM501 GeForce GTX 1070 Mobile, i7-8750H | Acer Predator Triton 700 GeForce GTX 1080 Max-Q, i7-7700HQ | Genomsnitt NVIDIA GeForce GTX 1070 Max-Q | Genomsnitt av klass Gaming | |
|---|---|---|---|---|---|---|---|
| Noise | 4% | 4% | 2% | 0% | 3% | 11% | |
| av / miljö * (dB) | 29 | 30 -3% | 30 -3% | 29 -0% | 31 -7% | 29.4 ? -1% | 24.1 ? 17% |
| Idle Minimum * (dB) | 30 | 31 -3% | 31 -3% | 30 -0% | 33 -10% | 30.5 ? -2% | 26 ? 13% |
| Idle Average * (dB) | 31 | 32 -3% | 34 -10% | 31 -0% | 34 -10% | 31.8 ? -3% | 27.4 ? 12% |
| Idle Maximum * (dB) | 35 | 36 -3% | 35 -0% | 33 6% | 40 -14% | 34.6 ? 1% | 30.1 ? 14% |
| Load Average * (dB) | 49 | 39 20% | 42 14% | 49 -0% | 41 16% | 43.2 ? 12% | 43.6 ? 11% |
| Witcher 3 ultra * (dB) | 51 | 44 14% | 44 14% | 50 2% | 43 16% | ||
| Load Maximum * (dB) | 54 | 52 4% | 46 15% | 52 4% | 48 11% | 48.2 ? 11% | 54.2 ? -0% |
* ... mindre är bättre
(-) Den maximala temperaturen på ovansidan är 53 °C / 127 F, jämfört med genomsnittet av 40.4 °C / 105 F , allt från 21.2 till 68.8 °C för klassen Gaming.
(-) Botten värms upp till maximalt 65 °C / 149 F, jämfört med genomsnittet av 43.2 °C / 110 F
(+) Vid tomgångsbruk är medeltemperaturen för ovansidan 24.8 °C / 77 F, jämfört med enhetsgenomsnittet på 33.9 °C / ### class_avg_f### F.
(-) När du spelar The Witcher 3 är medeltemperaturen för ovansidan 40.8 °C / 105 F, jämfört med enhetsgenomsnittet på 33.9 °C / ## #class_avg_f### F.
(±) Handledsstöden och pekplattan kan bli väldigt varma vid beröring med maximalt 38 °C / 100.4 F.
(-) Medeltemperaturen för handledsstödsområdet på liknande enheter var 28.8 °C / 83.8 F (-9.2 °C / -16.6 F).
| Gigabyte Aero 15X v8 GeForce GTX 1070 Max-Q, i7-8750H | Gigabyte Aero 15X GeForce GTX 1070 Max-Q, i7-7700HQ | MSI GS63VR 7RG-005 GeForce GTX 1070 Max-Q, i7-7700HQ | Asus Zephyrus M GM501 GeForce GTX 1070 Mobile, i7-8750H | Acer Predator Triton 700 GeForce GTX 1080 Max-Q, i7-7700HQ | Genomsnitt NVIDIA GeForce GTX 1070 Max-Q | Genomsnitt av klass Gaming | |
|---|---|---|---|---|---|---|---|
| Heat | 9% | 7% | 1% | -10% | 1% | 2% | |
| Maximum Upper Side * (°C) | 53 | 51 4% | 47 11% | 52 2% | 61 -15% | 52.1 ? 2% | 45.2 ? 15% |
| Maximum Bottom * (°C) | 65 | 58 11% | 63 3% | 49 25% | 69 -6% | 57.3 ? 12% | 48.1 ? 26% |
| Idle Upper Side * (°C) | 26 | 25 4% | 25 4% | 31 -19% | 29 -12% | 29.2 ? -12% | 31 ? -19% |
| Idle Bottom * (°C) | 30 | 25 17% | 27 10% | 31 -3% | 32 -7% | 29.9 ? -0% | 34.2 ? -14% |
* ... mindre är bättre
Gigabyte Aero 15X v8 ljudanalys
(±) | högtalarljudstyrkan är genomsnittlig men bra (78 dB)
Bas 100 - 315 Hz
(-) | nästan ingen bas - i genomsnitt 16.8% lägre än medianen
(±) | linjäriteten för basen är genomsnittlig (11.6% delta till föregående frekvens)
Mellan 400 - 2000 Hz
(+) | balanserad mellan - endast 4.3% från medianen
(+) | mids är linjära (5% delta till föregående frekvens)
Högsta 2 - 16 kHz
(+) | balanserade toppar - endast 3.6% från medianen
(±) | linjäriteten för toppar är genomsnittlig (9.1% delta till föregående frekvens)
Totalt 100 - 16 000 Hz
(±) | linjäriteten för det totala ljudet är genomsnittlig (18.4% skillnad mot median)
Jämfört med samma klass
» 59% av alla testade enheter i den här klassen var bättre, 9% liknande, 32% sämre
» Den bästa hade ett delta på 6%, genomsnittet var 18%, sämst var 132%
Jämfört med alla testade enheter
» 41% av alla testade enheter var bättre, 8% liknande, 51% sämre
» Den bästa hade ett delta på 4%, genomsnittet var 23%, sämst var 134%
MSI GS63VR 7RG-005 ljudanalys
(+) | högtalare kan spela relativt högt (90 dB)
Bas 100 - 315 Hz
(-) | nästan ingen bas - i genomsnitt 21.3% lägre än medianen
(-) | basen är inte linjär (15.2% delta till föregående frekvens)
Mellan 400 - 2000 Hz
(±) | högre mellan - i genomsnitt 11% högre än median
(±) | linjäriteten för mids är genomsnittlig (10% delta till föregående frekvens)
Högsta 2 - 16 kHz
(+) | balanserade toppar - endast 3.4% från medianen
(±) | linjäriteten för toppar är genomsnittlig (9.2% delta till föregående frekvens)
Totalt 100 - 16 000 Hz
(±) | linjäriteten för det totala ljudet är genomsnittlig (24.2% skillnad mot median)
Jämfört med samma klass
» 87% av alla testade enheter i den här klassen var bättre, 4% liknande, 9% sämre
» Den bästa hade ett delta på 6%, genomsnittet var 18%, sämst var 132%
Jämfört med alla testade enheter
» 73% av alla testade enheter var bättre, 6% liknande, 21% sämre
» Den bästa hade ett delta på 4%, genomsnittet var 23%, sämst var 134%
| Av/Standby | |
| Låg belastning | |
| Hög belastning |
|
Förklaring:
min: | |
| Gigabyte Aero 15X v8 GeForce GTX 1070 Max-Q, i7-8750H | Gigabyte Aero 15X GeForce GTX 1070 Max-Q, i7-7700HQ | MSI GS63VR 7RG-005 GeForce GTX 1070 Max-Q, i7-7700HQ | Asus Zephyrus M GM501 GeForce GTX 1070 Mobile, i7-8750H | Acer Predator Triton 700 GeForce GTX 1080 Max-Q, i7-7700HQ | Genomsnitt NVIDIA GeForce GTX 1070 Max-Q | Genomsnitt av klass Gaming | |
|---|---|---|---|---|---|---|---|
| Power Consumption | 17% | 9% | -16% | -52% | 6% | -17% | |
| Idle Minimum * (Watt) | 14 | 10 29% | 12 14% | 16 -14% | 28 -100% | 11.4 ? 19% | 13 ? 7% |
| Idle Average * (Watt) | 18 | 13 28% | 16 11% | 19 -6% | 33 -83% | 15.7 ? 13% | 19 ? -6% |
| Idle Maximum * (Watt) | 22 | 20 9% | 21 5% | 26 -18% | 41 -86% | 20.7 ? 6% | 24.6 ? -12% |
| Load Average * (Watt) | 91 | 79 13% | 85 7% | 103 -13% | 94 -3% | 98.1 ? -8% | 110.7 ? -22% |
| Witcher 3 ultra * (Watt) | 142 | 120 15% | 128 10% | 164 -15% | 160 -13% | ||
| Load Maximum * (Watt) | 173 | 165 5% | 162 6% | 223 -29% | 222 -28% | 173.8 ? -0% | 259 ? -50% |
* ... mindre är bättre
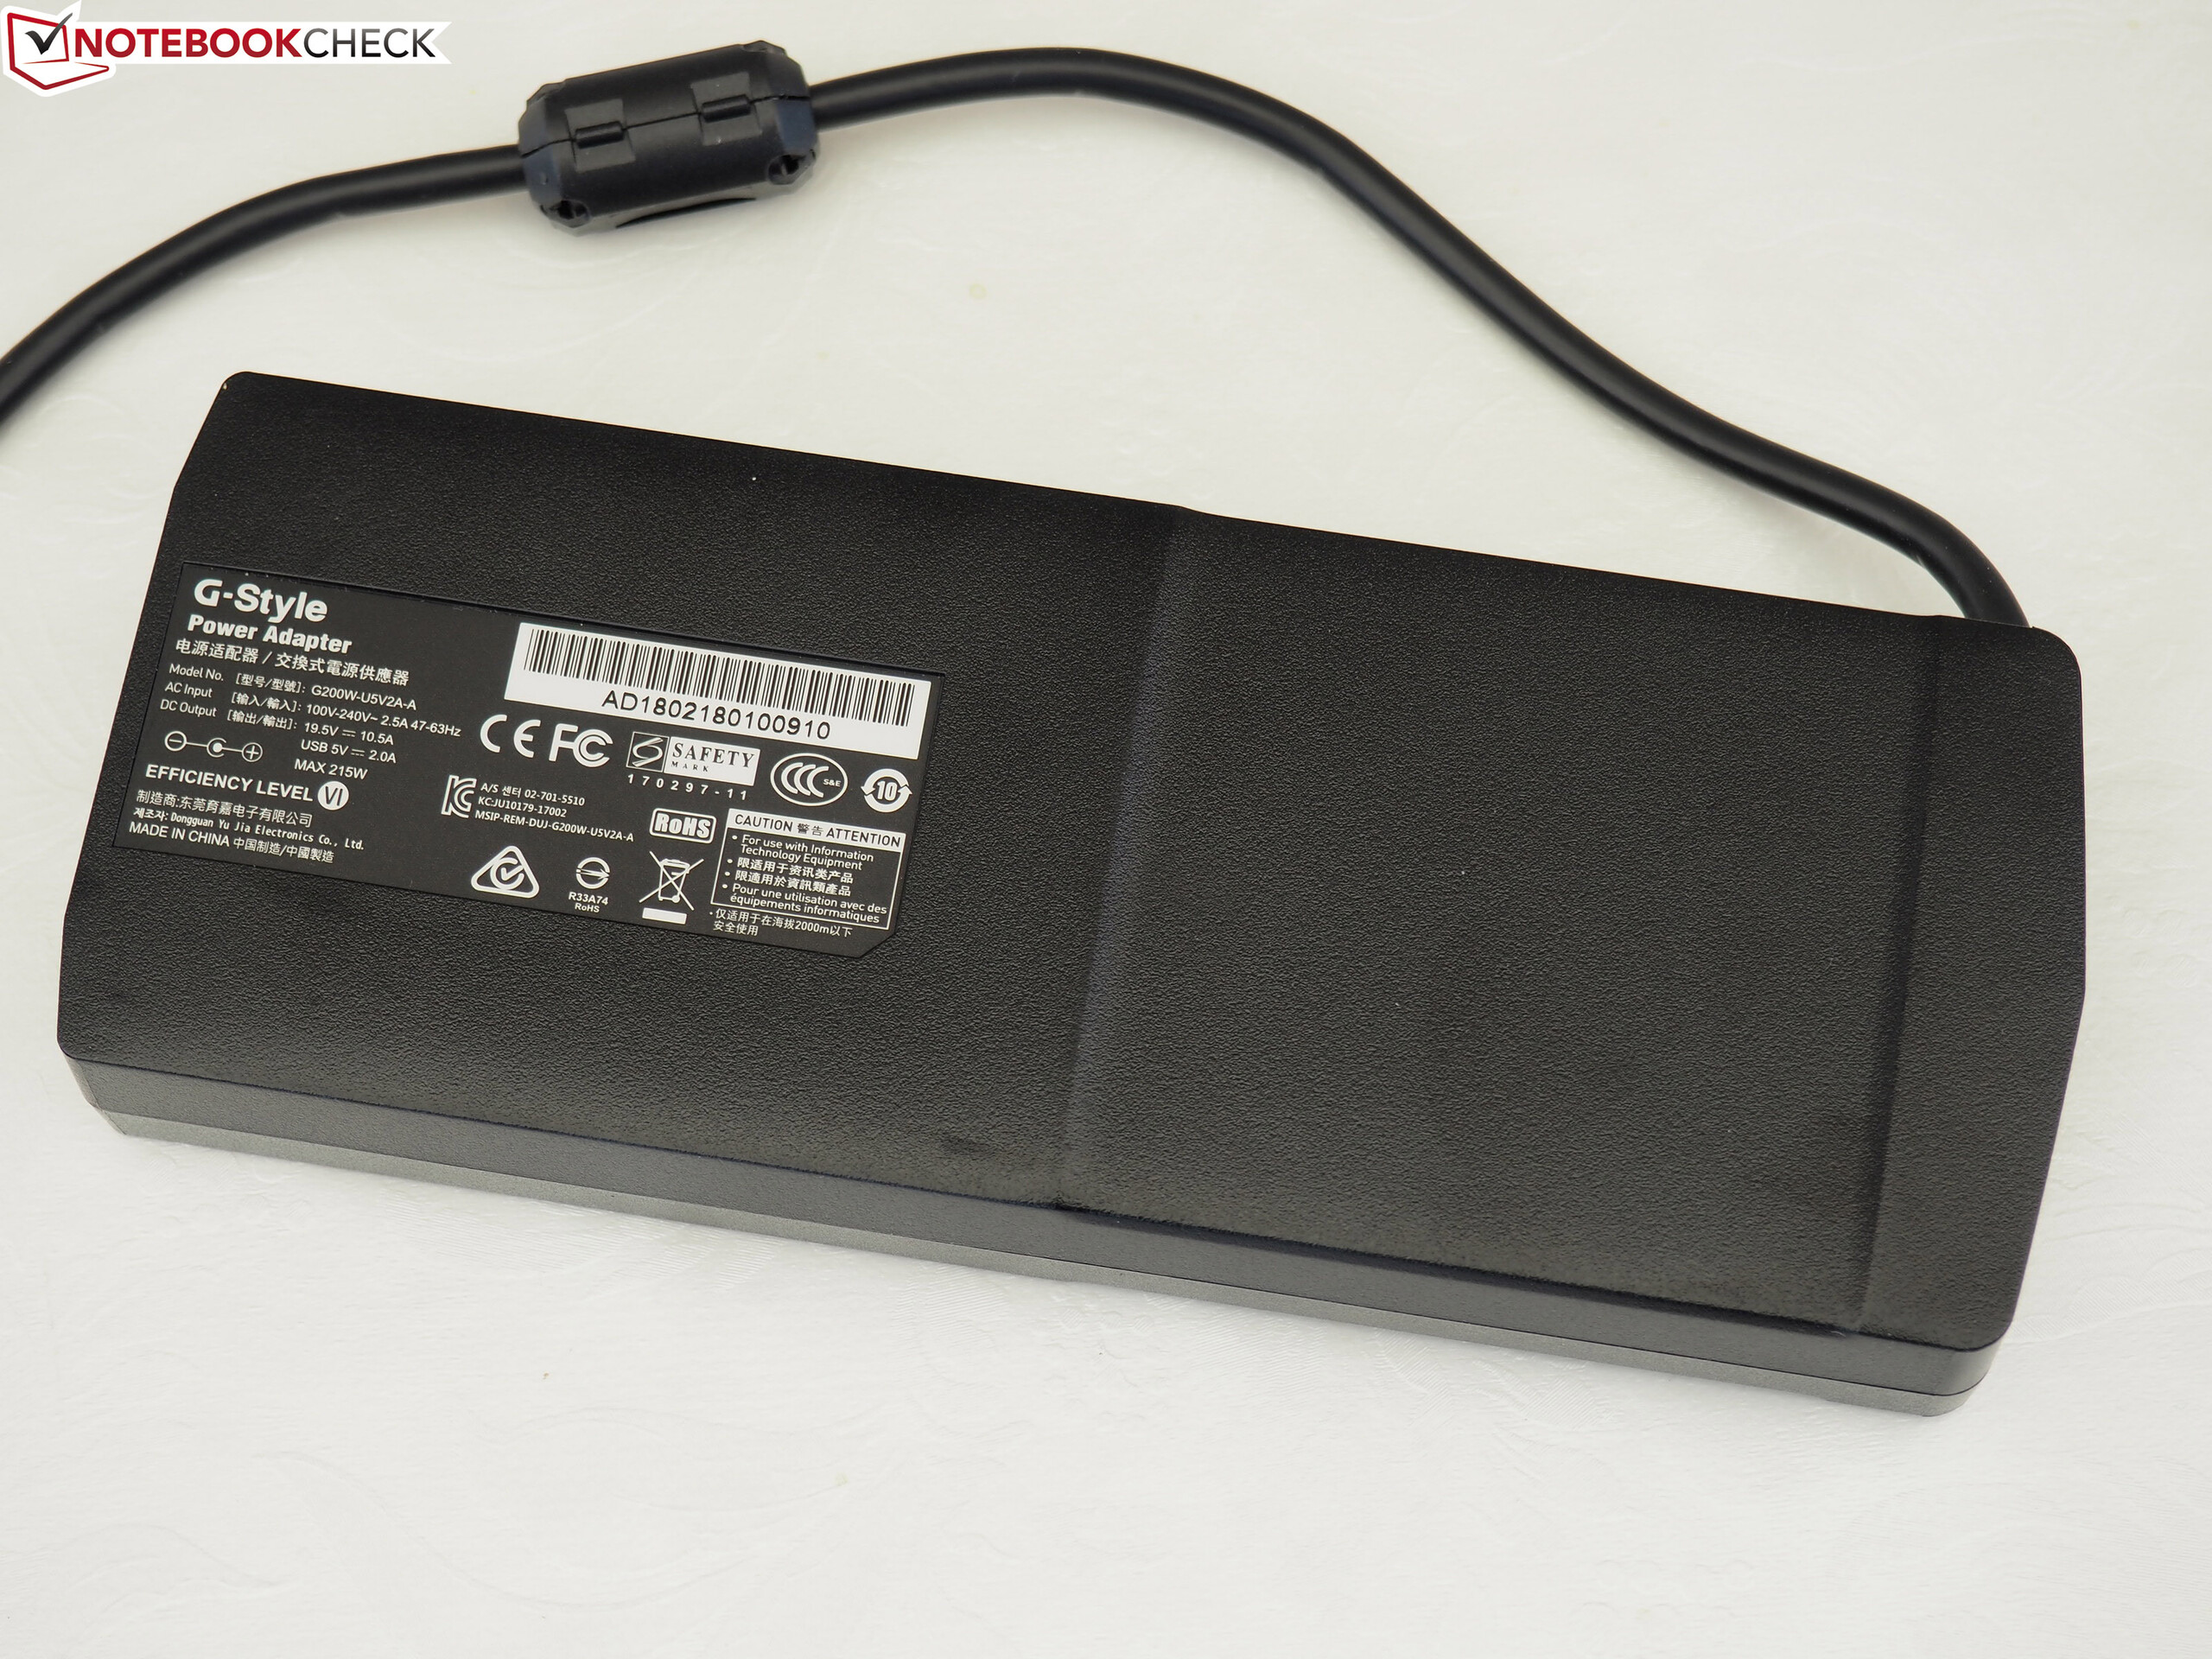
| Gigabyte Aero 15X v8 GeForce GTX 1070 Max-Q, i7-8750H, 94.24 Wh | Gigabyte Aero 15X GeForce GTX 1070 Max-Q, i7-7700HQ, 94.2 Wh | MSI GS63VR 7RG-005 GeForce GTX 1070 Max-Q, i7-7700HQ, 52.4 Wh | Asus Zephyrus M GM501 GeForce GTX 1070 Mobile, i7-8750H, 55 Wh | Acer Predator Triton 700 GeForce GTX 1080 Max-Q, i7-7700HQ, 54 Wh | Genomsnitt av klass Gaming | |
|---|---|---|---|---|---|---|
| Batteridrifttid | -3% | -57% | -65% | -71% | -24% | |
| Reader / Idle (h) | 12.7 | 13 2% | 5.7 -55% | 4 -69% | 2.5 -80% | 8.27 ? -35% |
| H.264 (h) | 8.4 | 7.6 -10% | 3.8 -55% | 2.7 -68% | 1.8 -79% | 8.32 ? -1% |
| WiFi v1.3 (h) | 8.6 | 8.2 -5% | 3.9 -55% | 2.7 -69% | 2.4 -72% | 7.11 ? -17% |
| Load (h) | 2.6 | 2.6 0% | 1 -62% | 1.2 -54% | 1.2 -54% | 1.502 ? -42% |
För
Emot
Läs den fullständiga versionen av den här recensionen på engelska här.
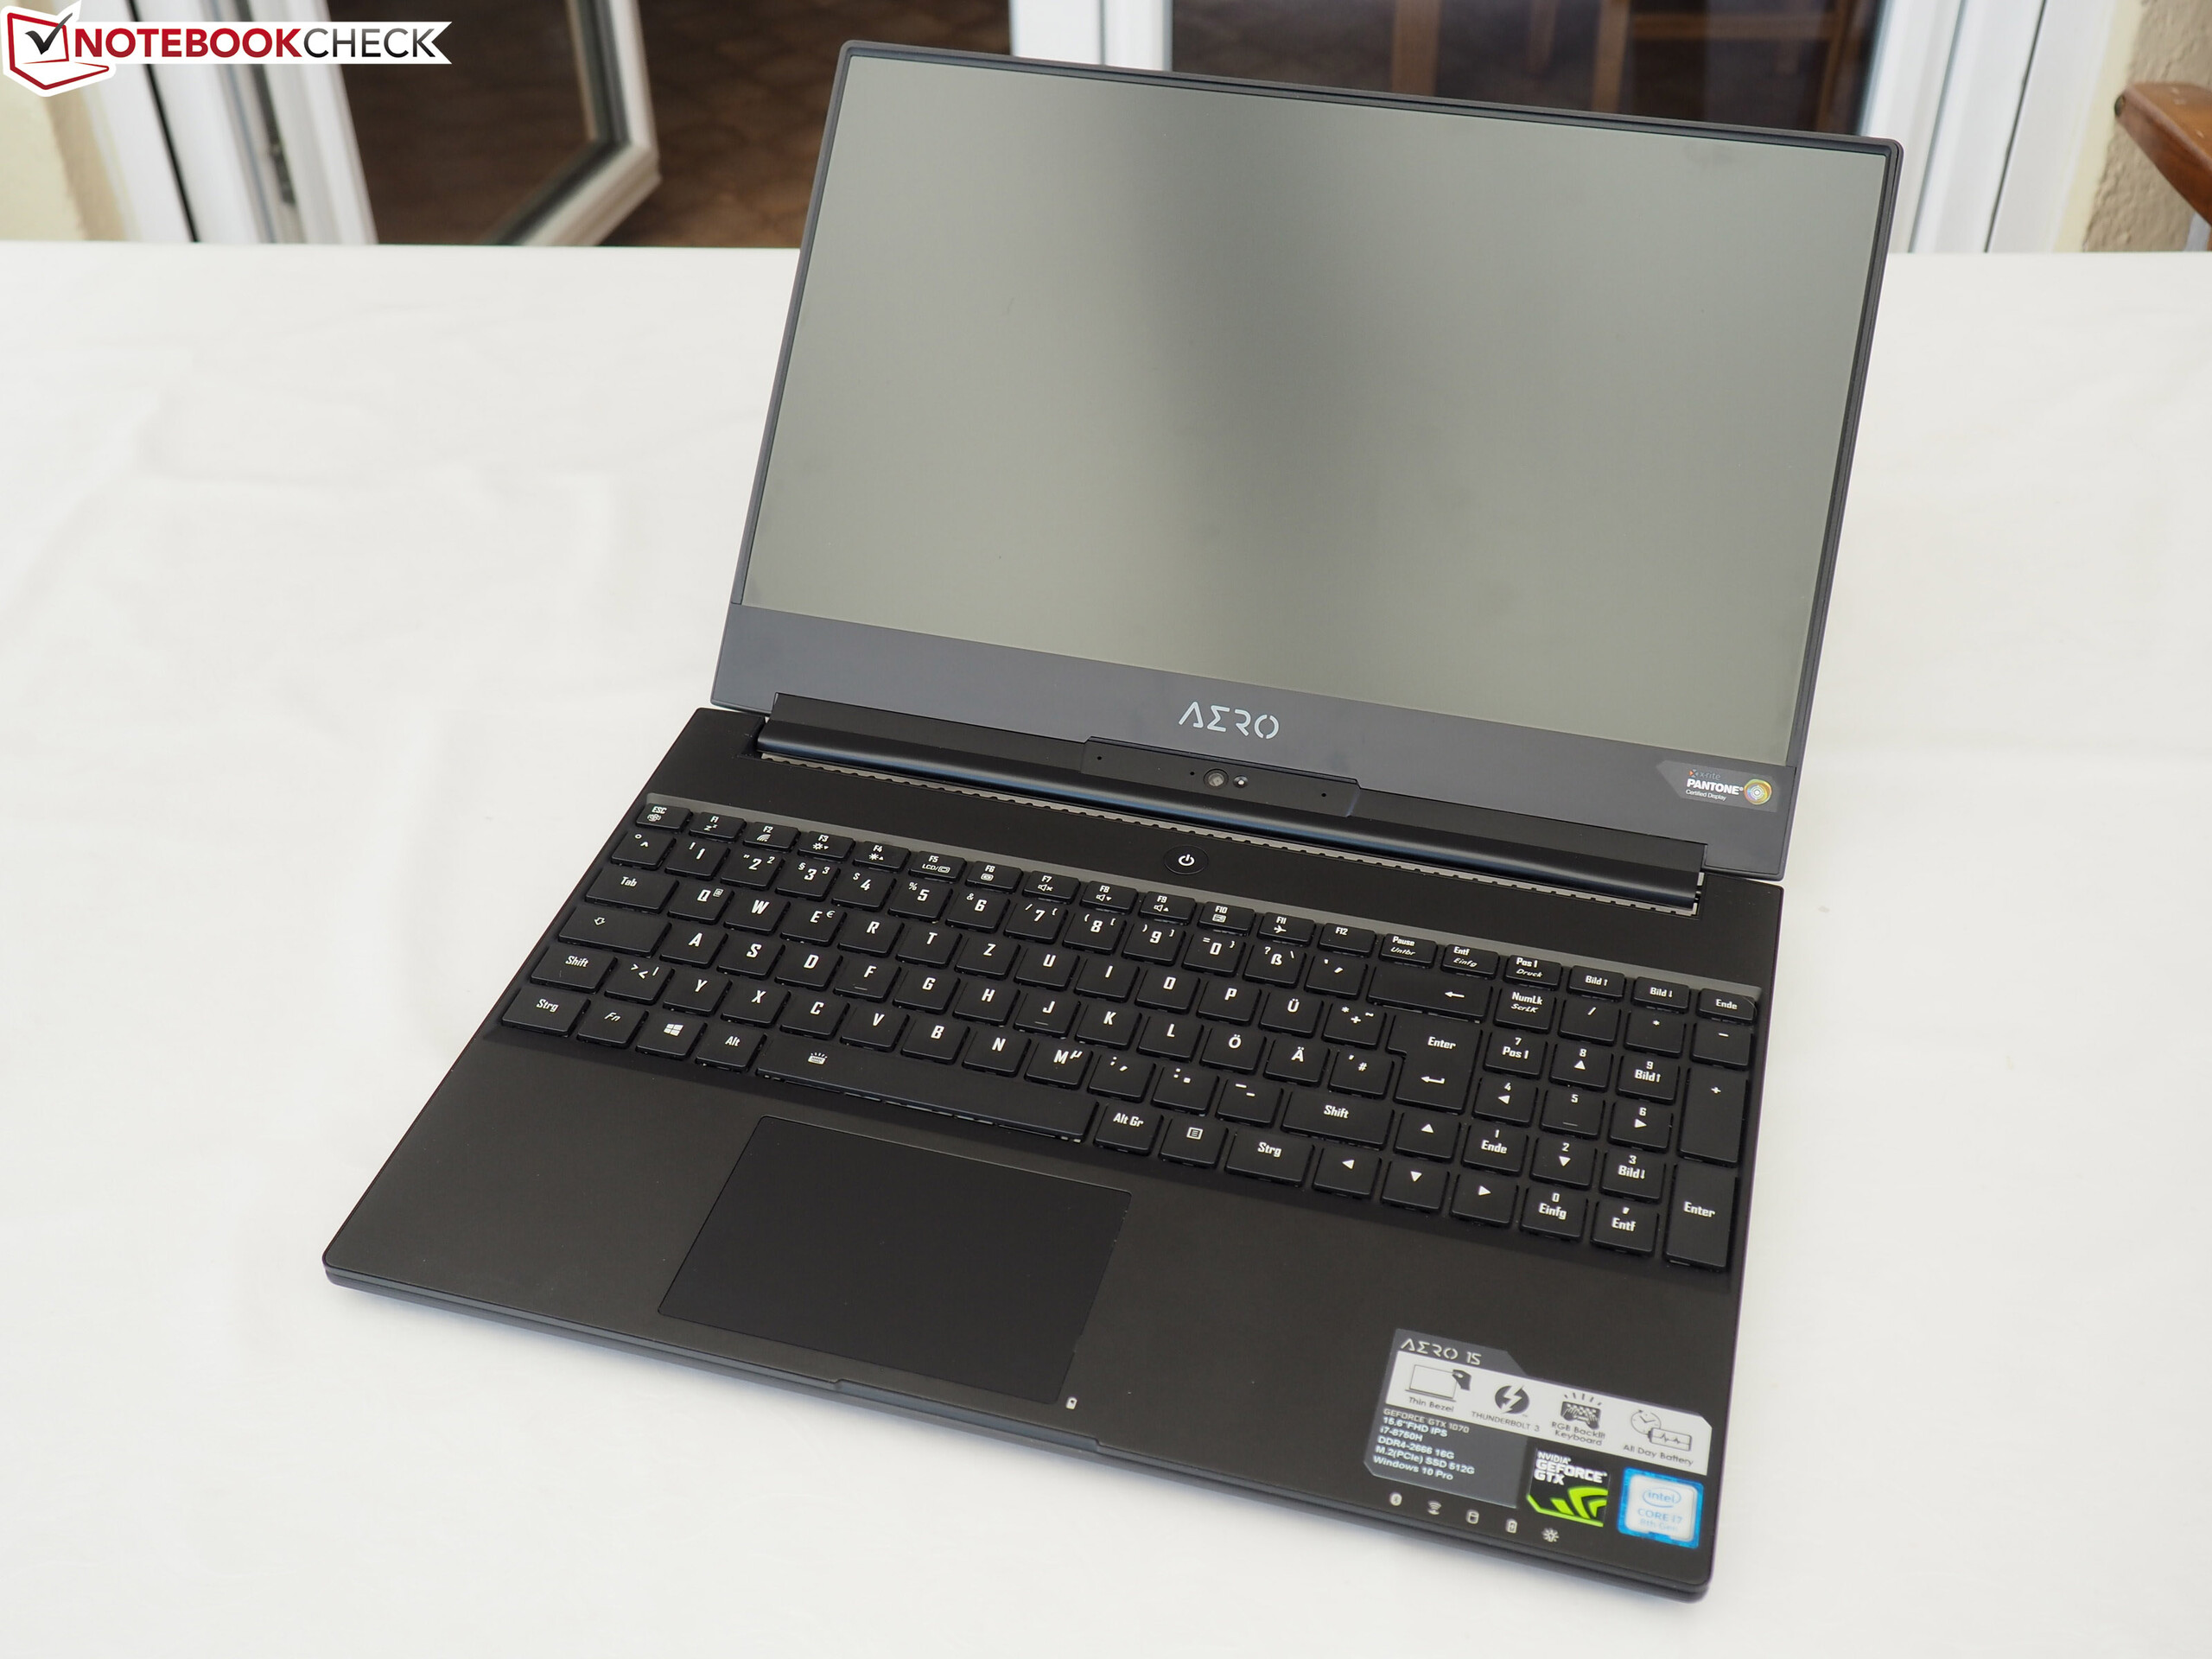
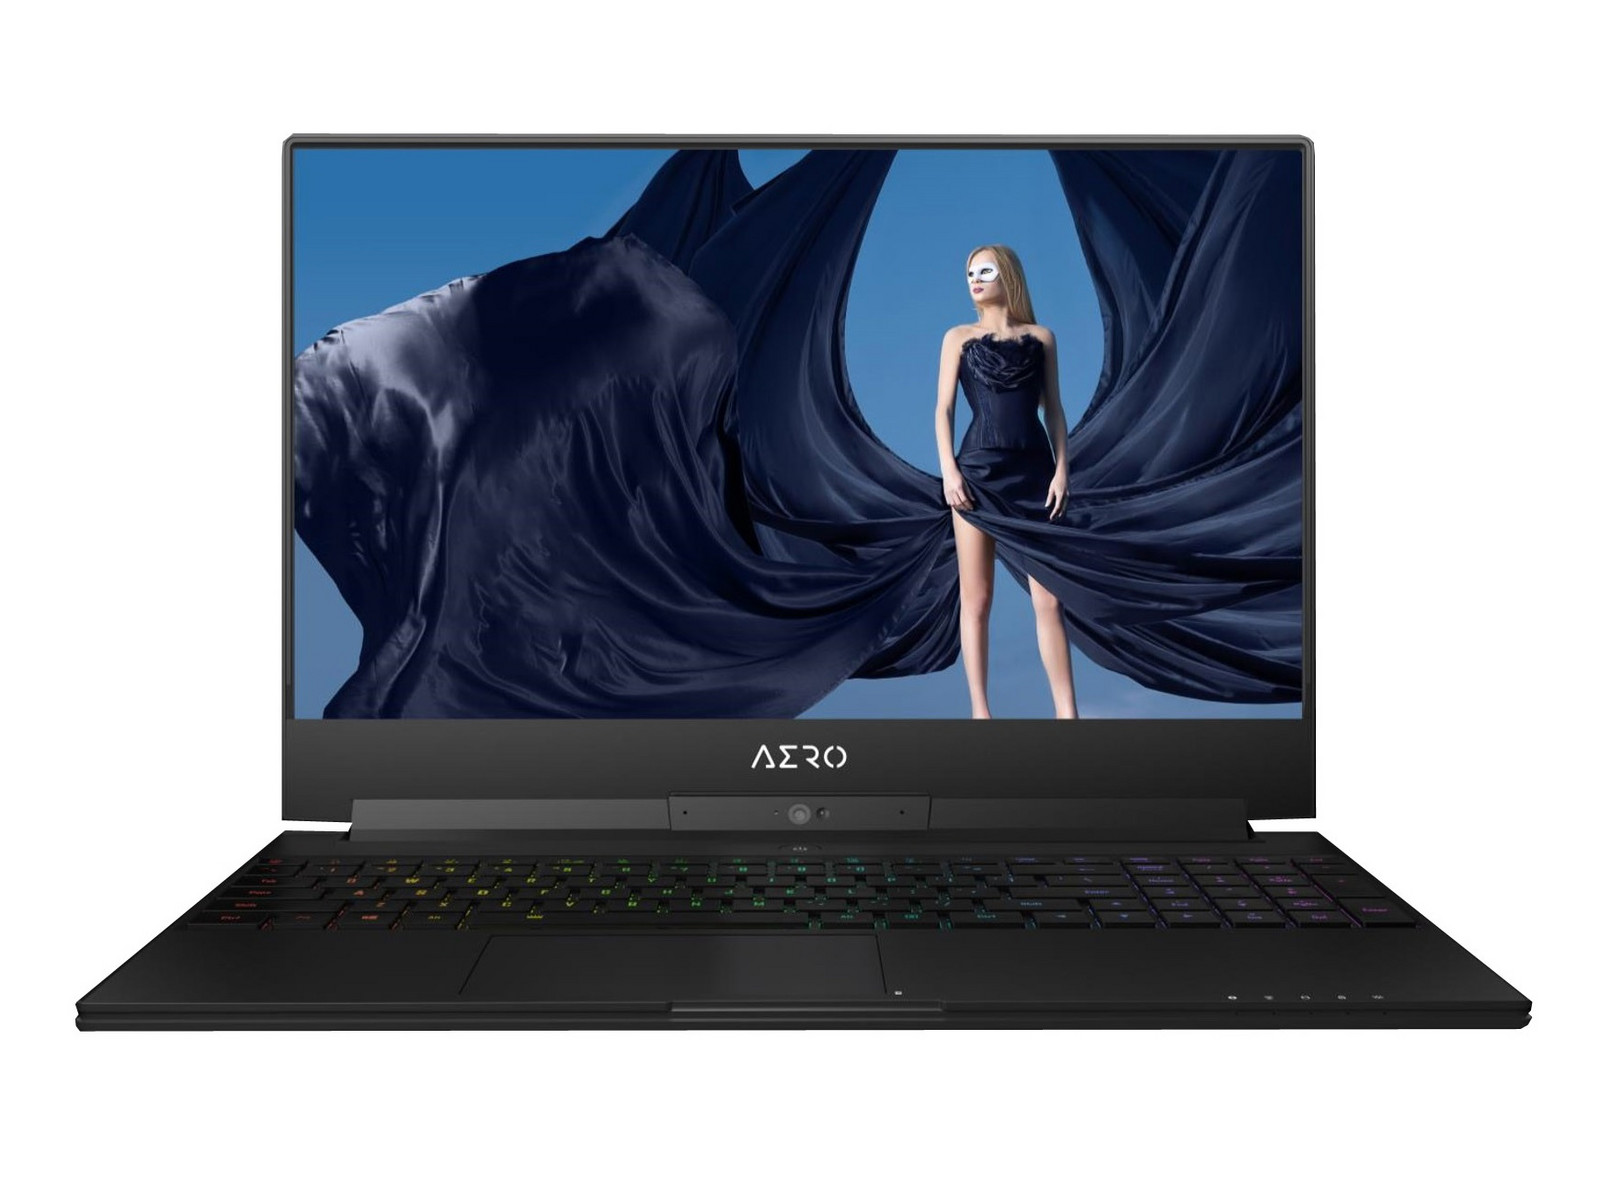
När det kommer till tunna toppskikts-laptops av hög kvalitet så ligger Gigabyte Aero 15 och Asus GM501 precis bredvid varandra i täten. Dom har båda sina unika styrkor och svagheter.
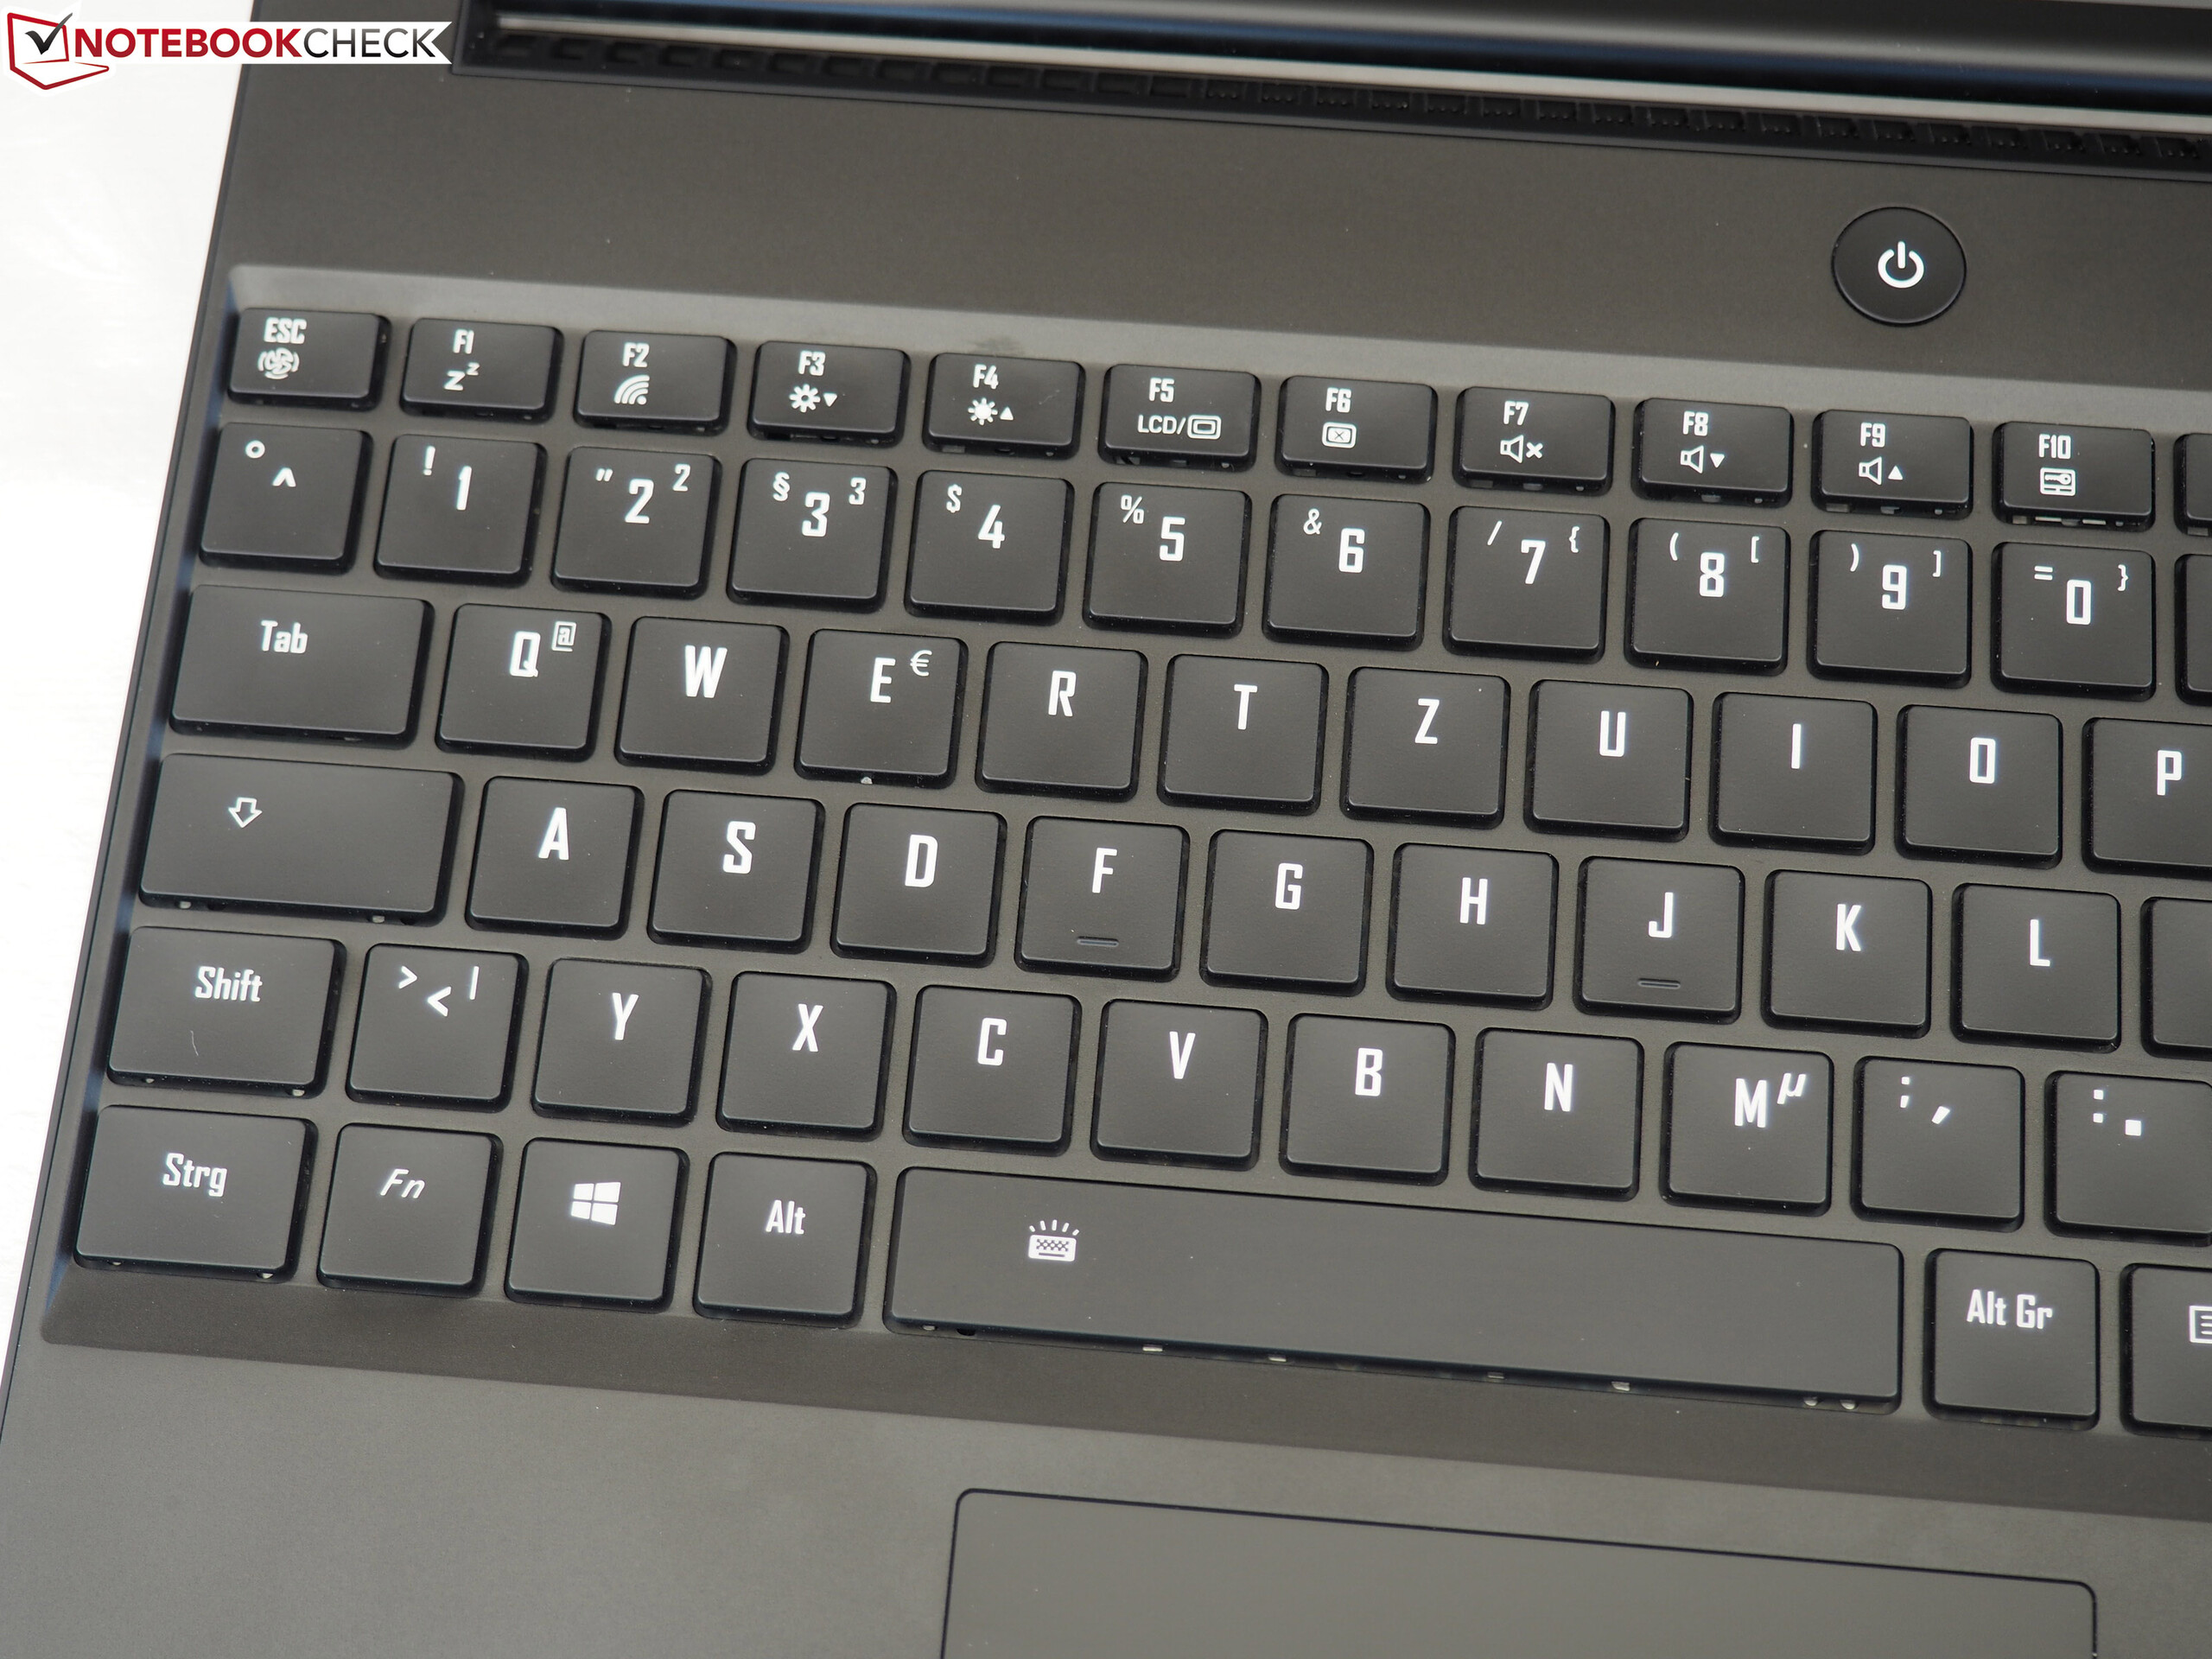
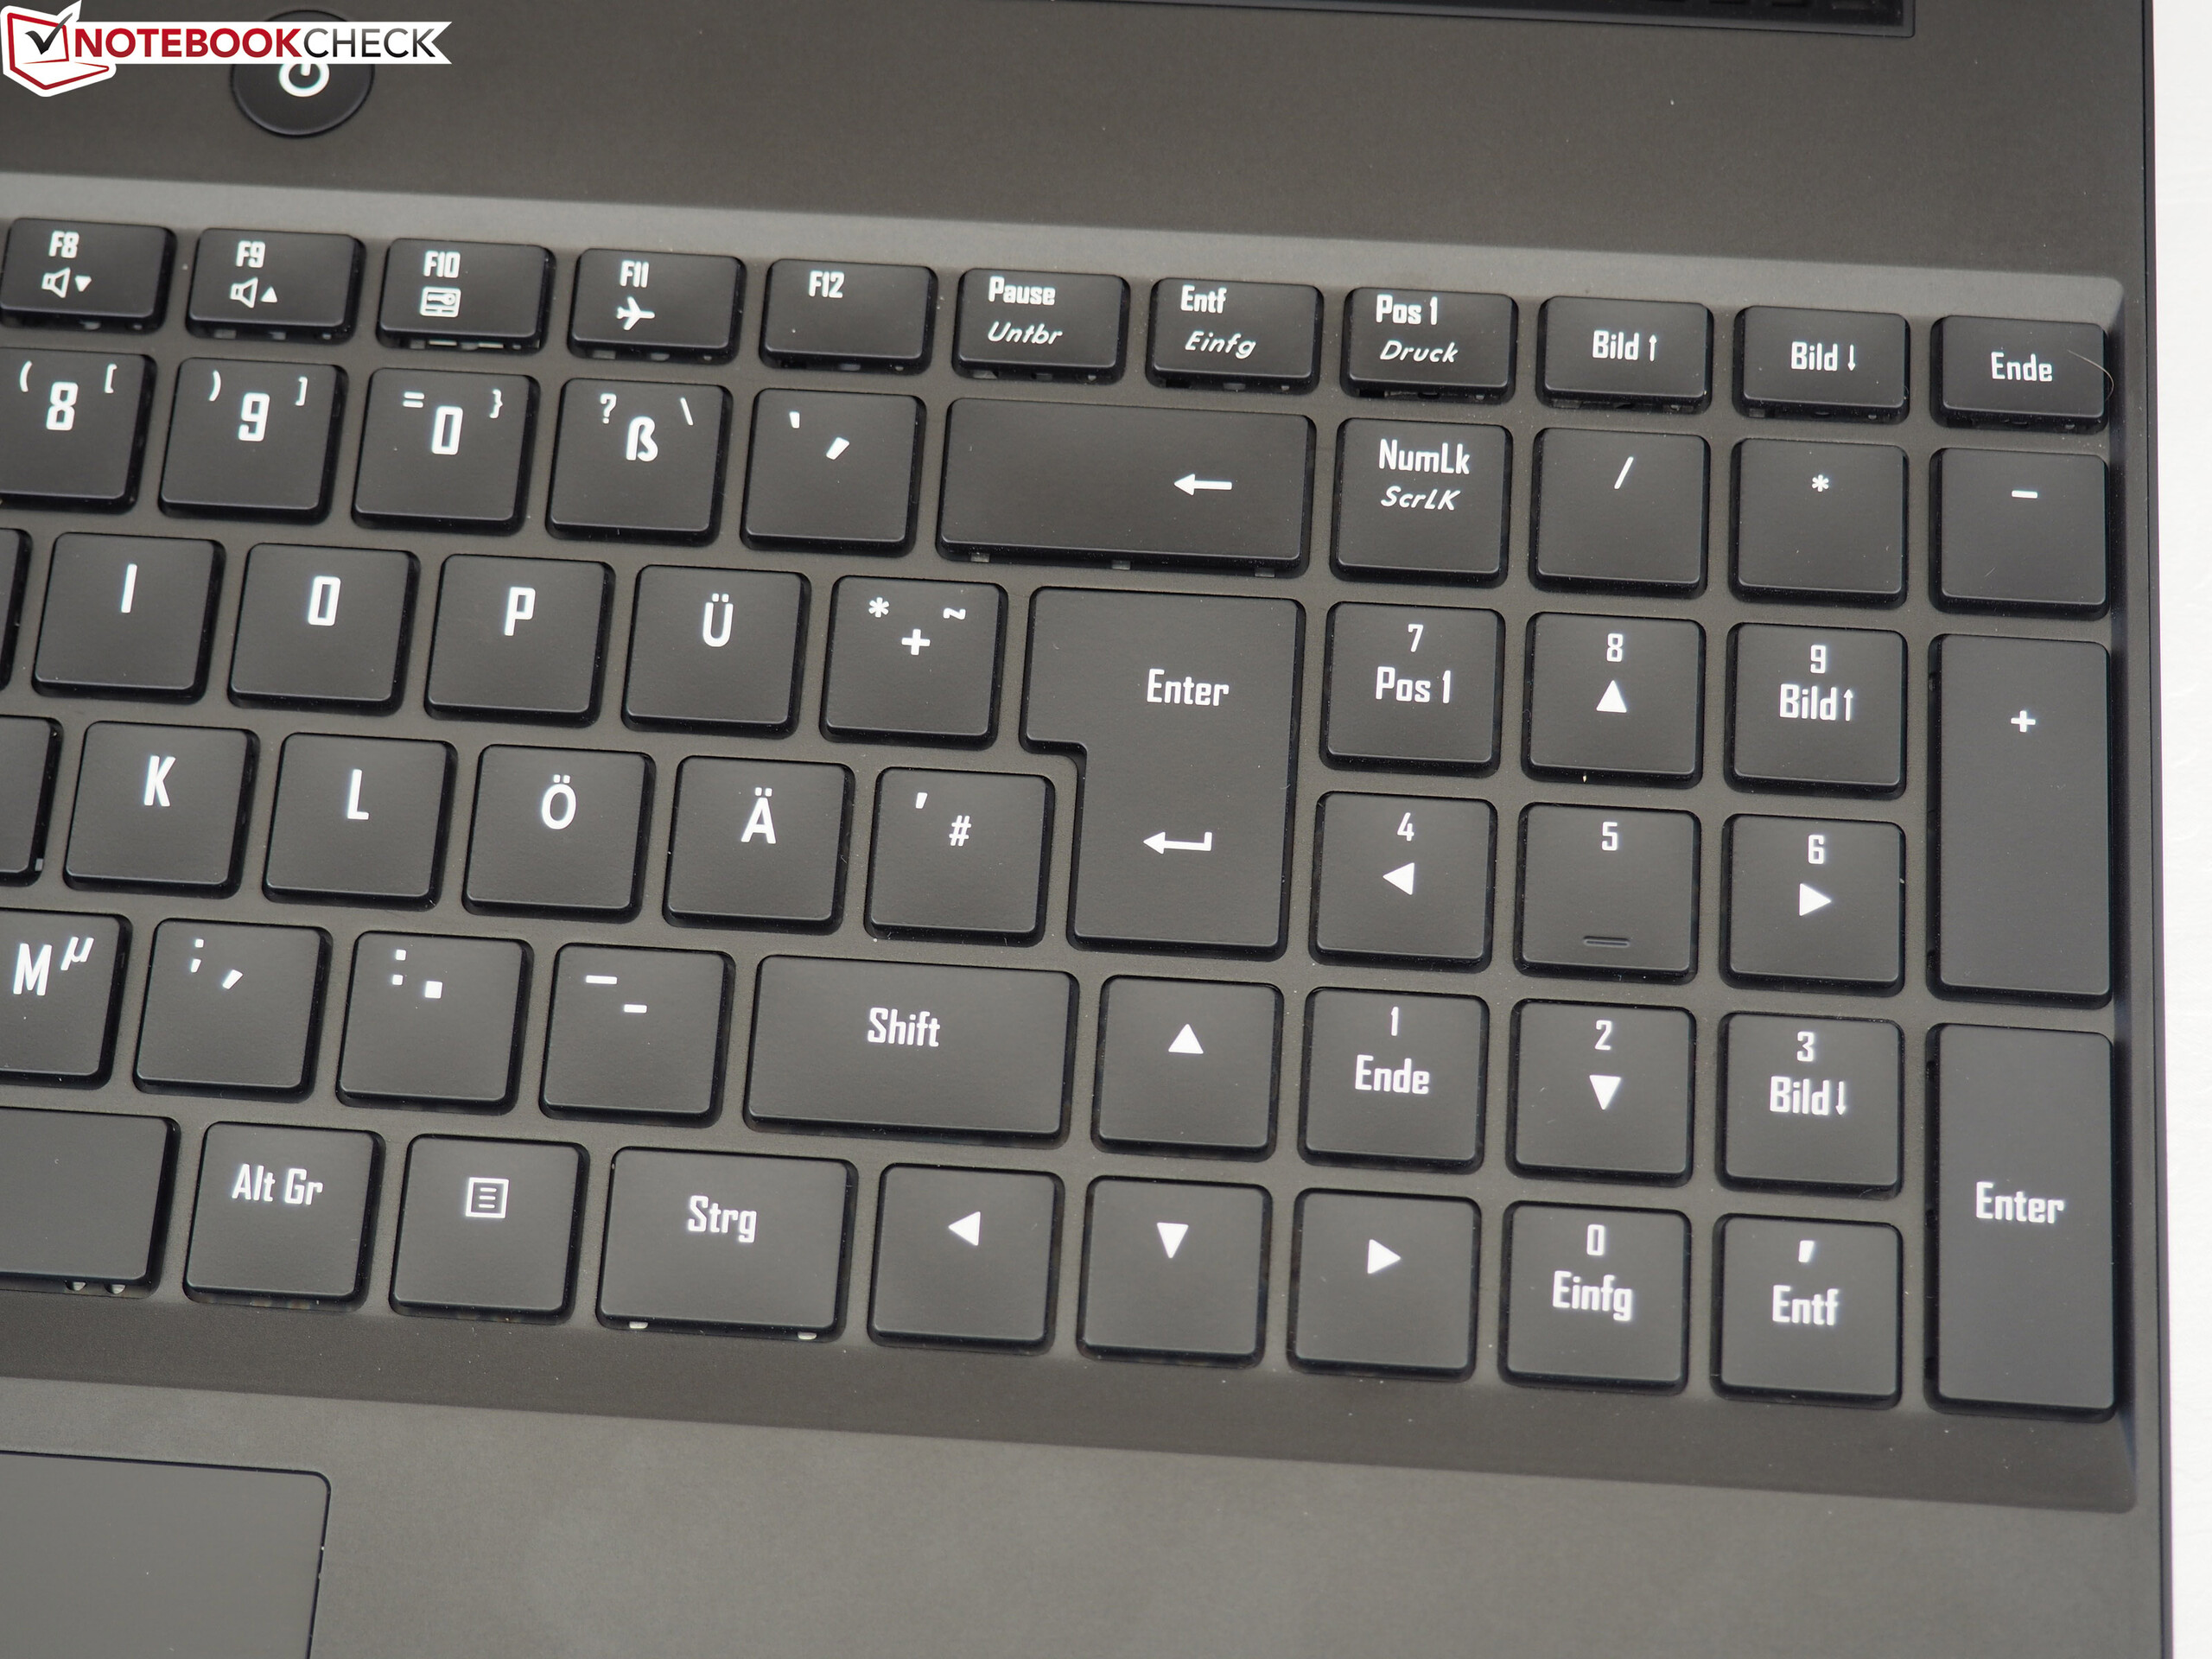
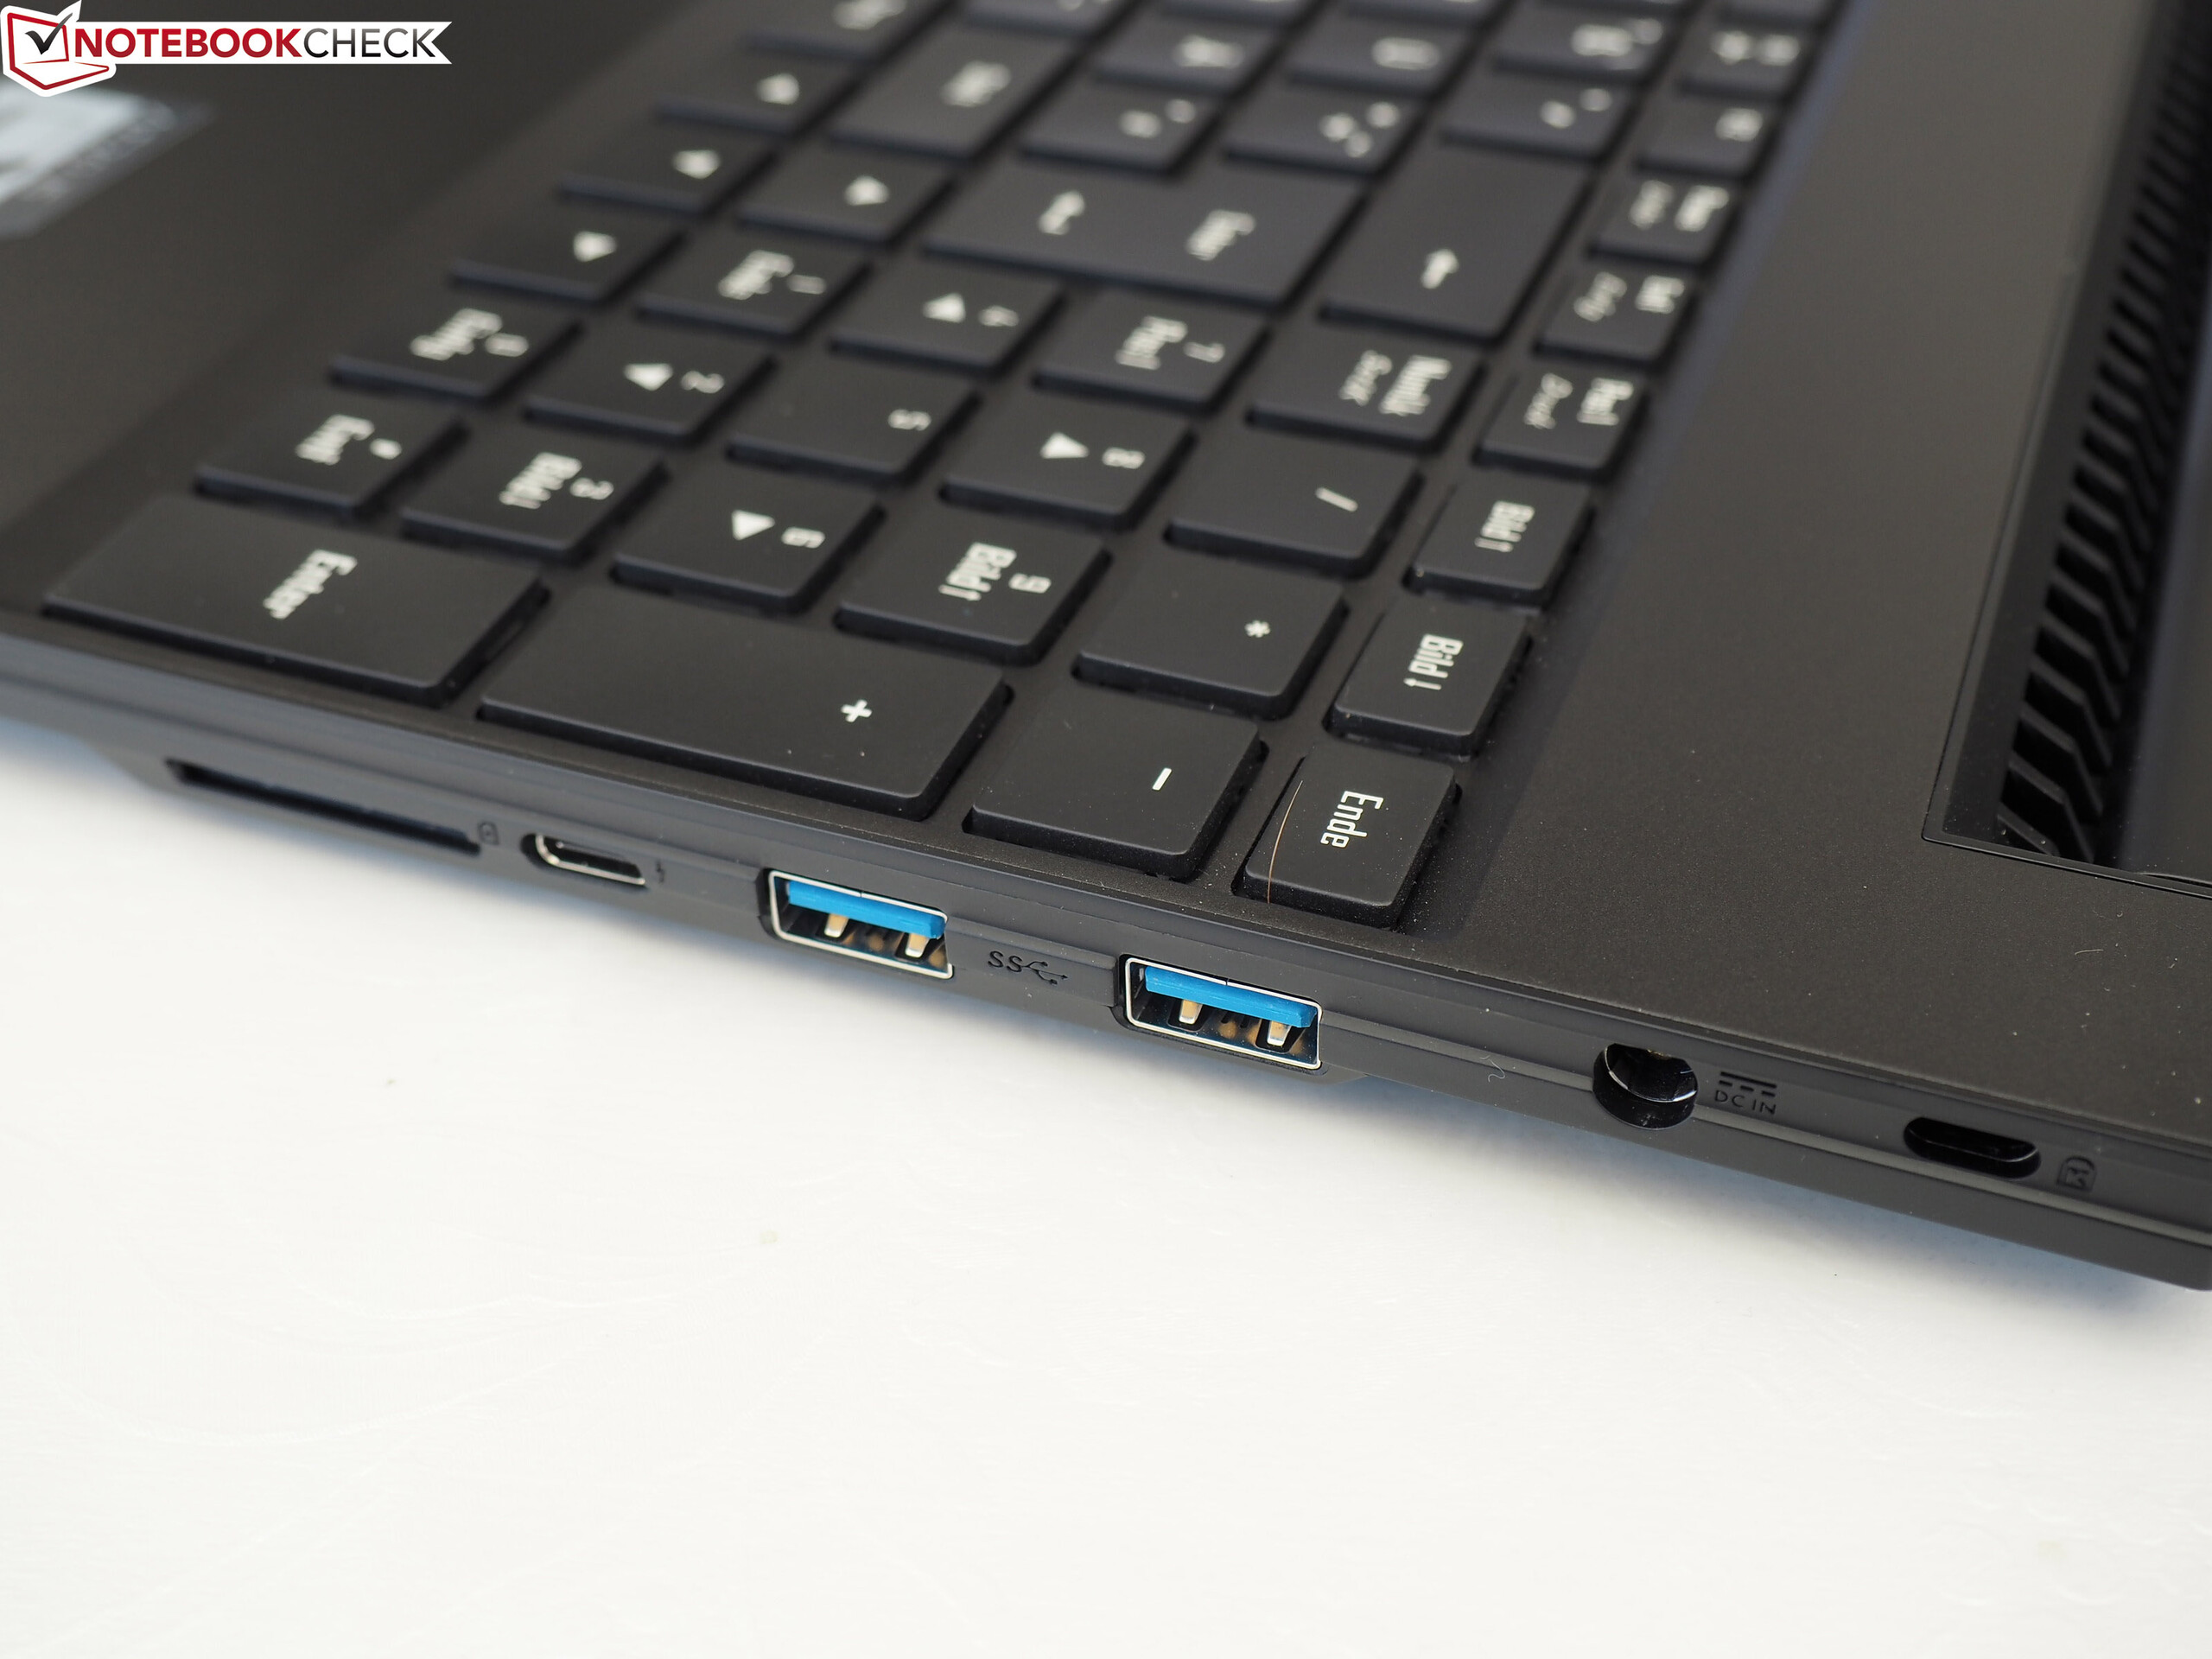
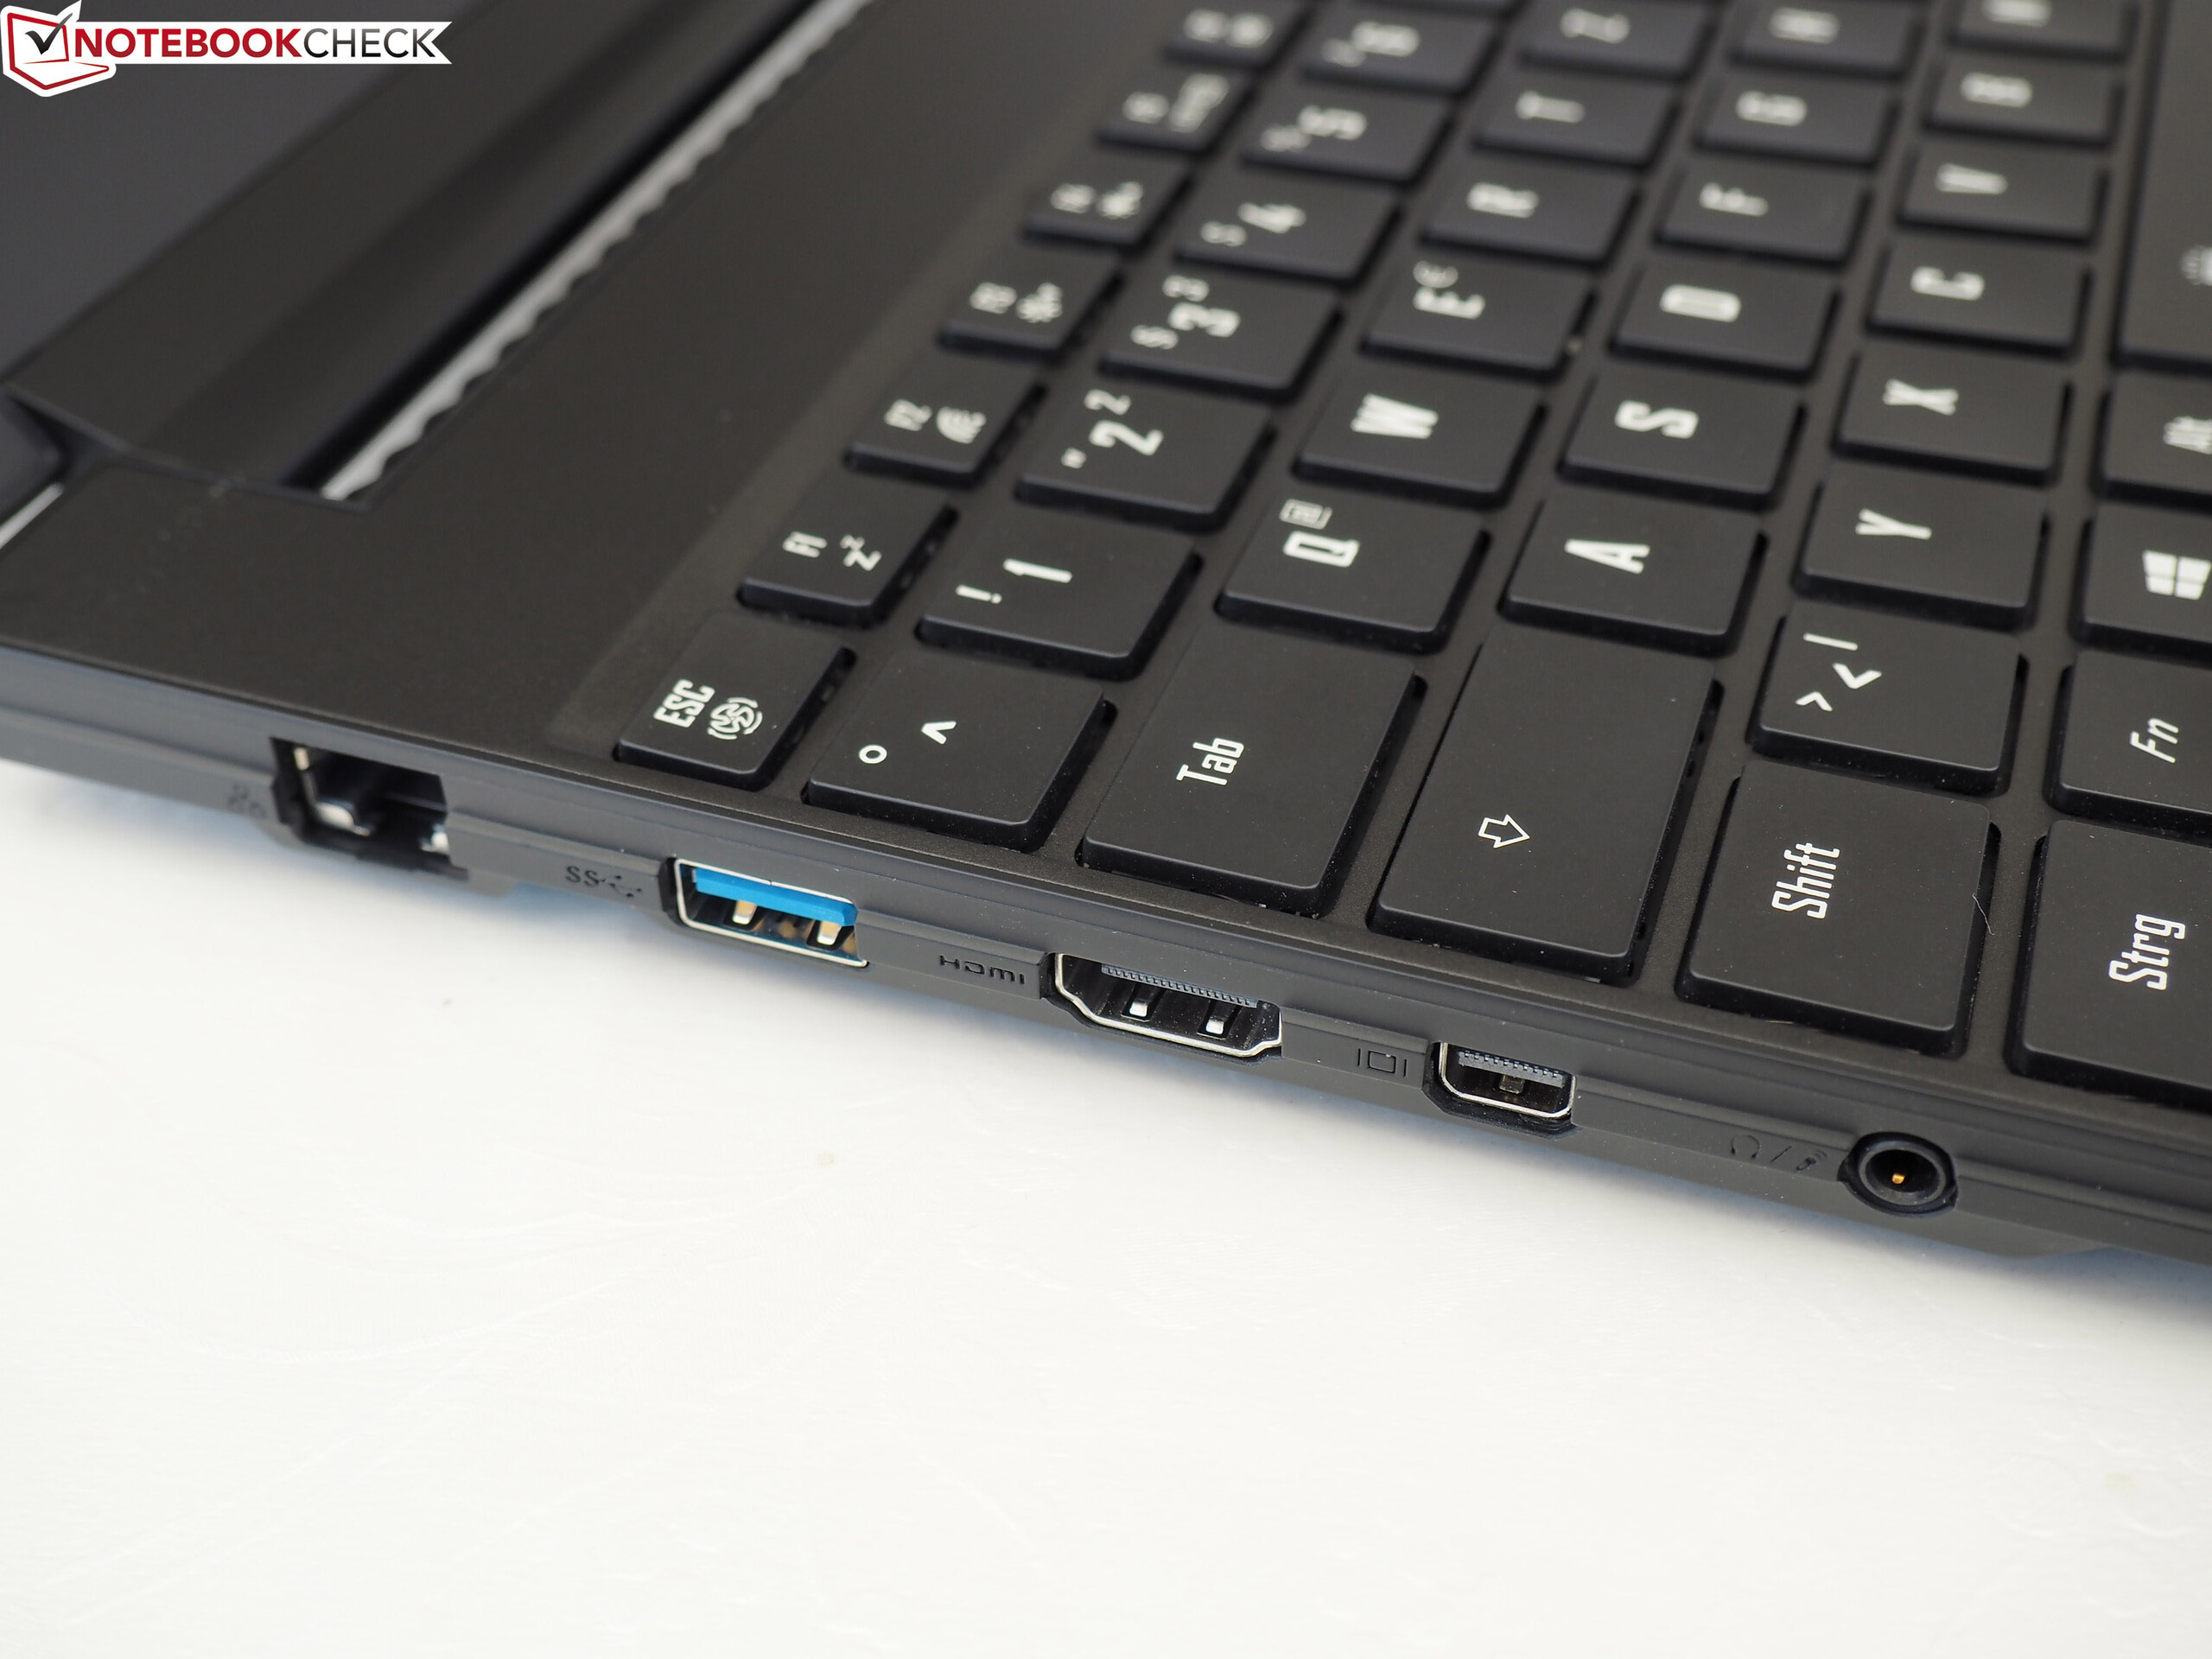
Medans ROG Zephyrus M erbjuder relativt bra ljud och - trots en starkare GPU - lägre temperatur och ljudnivå så imponerade Gigabyte-modellen med bättre inmatning, fler anslutningar och mycket längre batteritid. Den tunna skärminramningen och den färg-exakta panelen får den också att stå ut från mängden.
Men Gigabyte behöver få ljudnivån under kontroll. För tillfället så är nya Aero 15X ganska ljudlig vid 3D-belastning, vilket kan stoppa ljudkänsliga användare från att köpa den. Intels sexkärniga chip pressar kylsystemet till sin gräns mycket snabbare och oftare än föregångarens fyrakärniga CPU.
Gigabyte Aero 15X v8
- 04/04/2018 v6 (old)
Florian Glaser
Price comparison