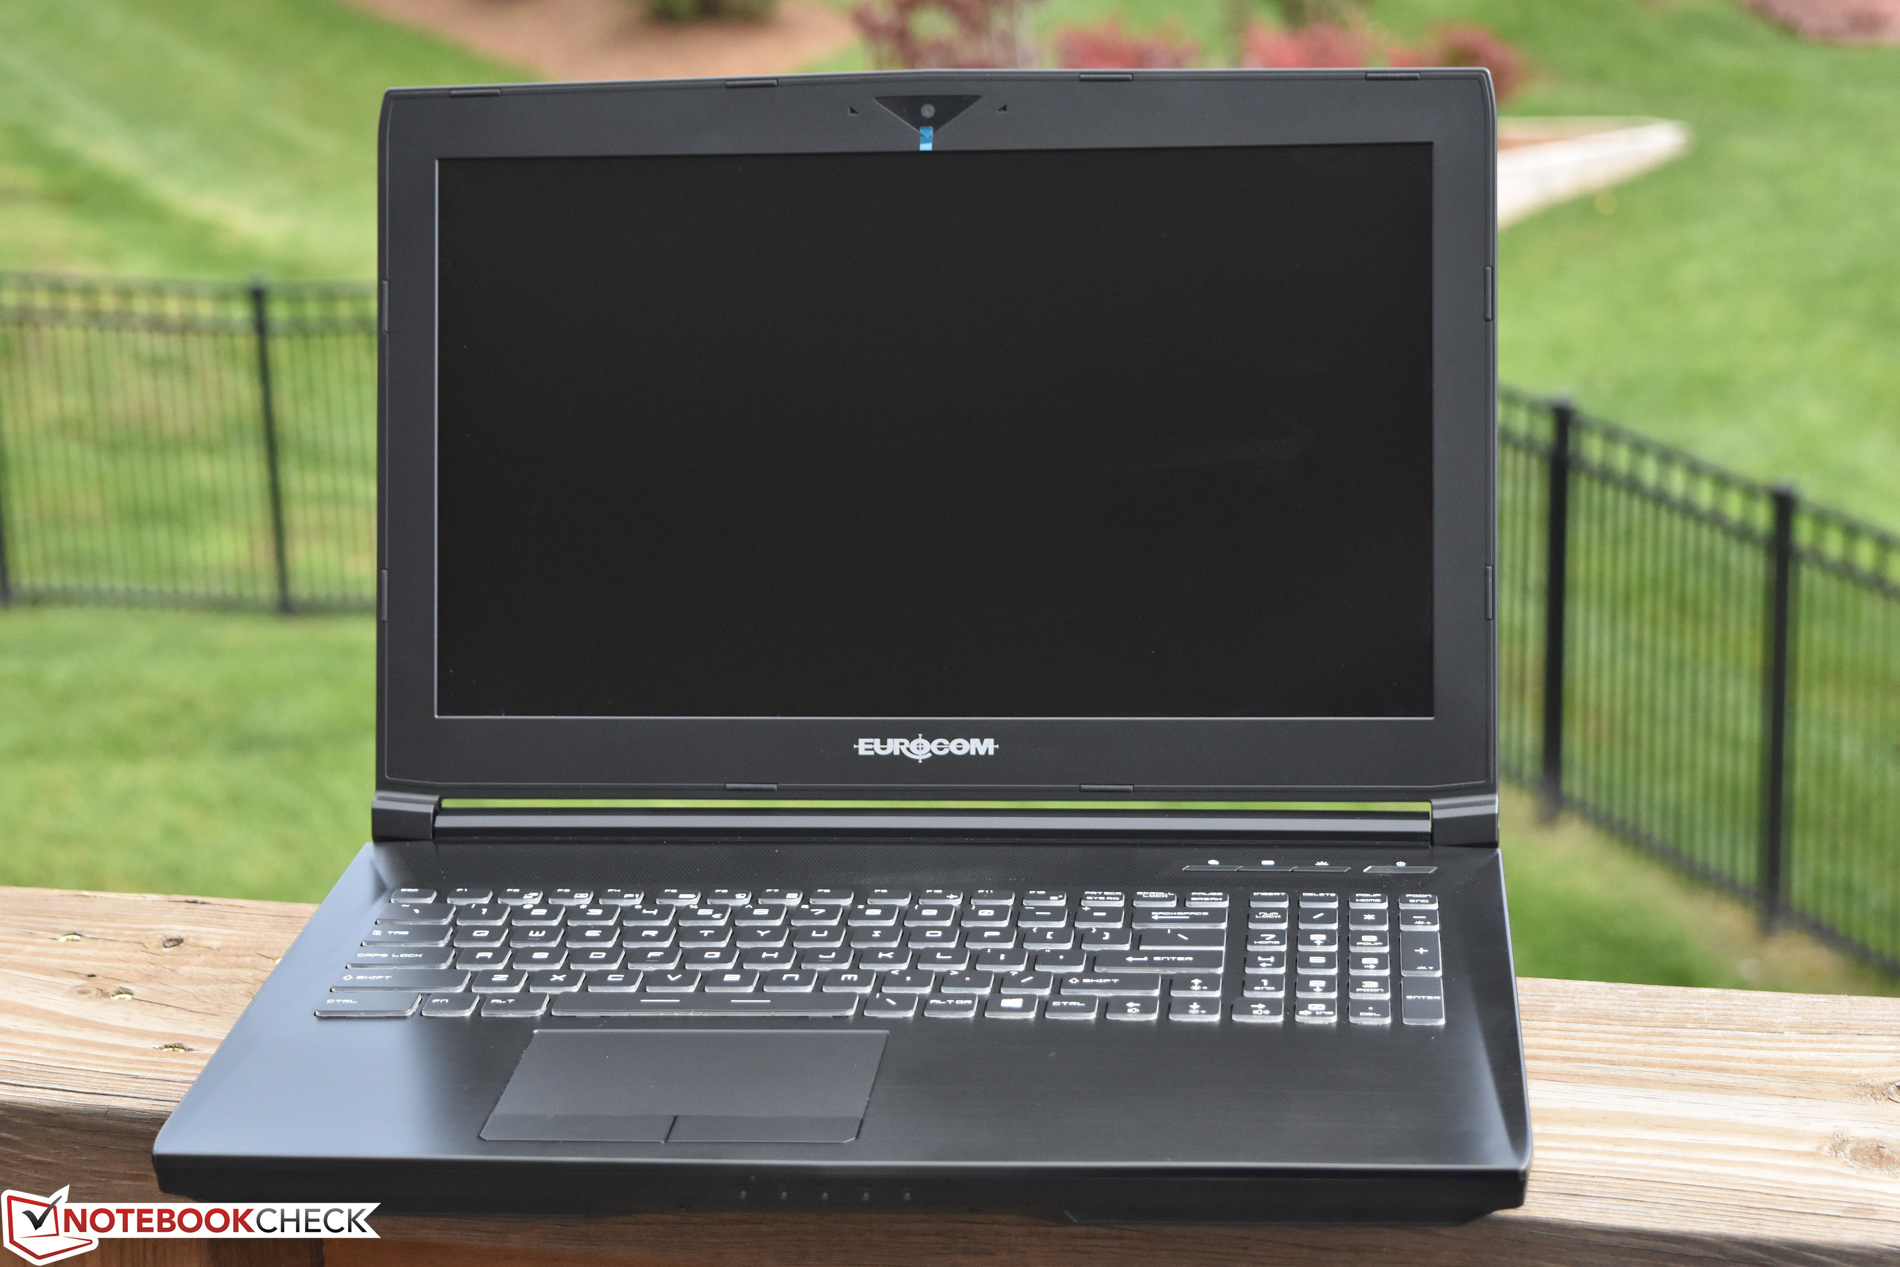
Test: Eurocom Tornado F5W (Xeon E3-1280 v5, Quadro P5000) Arbetsstation (Sammanfattning)


| SD Card Reader | |
| average JPG Copy Test (av. of 3 runs) | |
| HP ZBook 15 G4-Y4E80AV | |
| Eurocom Tornado F5W | |
| Dell Precision 5520 UHD | |
| Lenovo ThinkPad P51 20HH0016GE | |
| MSI WS63VR 7RL-023US | |
| Fujitsu Celsius H970 | |
| maximum AS SSD Seq Read Test (1GB) | |
| Dell Precision 5520 UHD | |
| Lenovo ThinkPad P51 20HH0016GE | |
| MSI WS63VR 7RL-023US | |
| HP ZBook 15 G4-Y4E80AV | |
| Eurocom Tornado F5W | |
| Fujitsu Celsius H970 | |
| Networking | |
| iperf3 transmit AX12 | |
| Eurocom Tornado F5W | |
| Lenovo ThinkPad P51 20HH0016GE | |
| Dell Precision 5520 UHD | |
| Fujitsu Celsius H970 | |
| HP ZBook 15 G4-Y4E80AV | |
| MSI WS63VR 7RL-023US | |
| iperf3 receive AX12 | |
| Fujitsu Celsius H970 | |
| MSI WS63VR 7RL-023US | |
| Lenovo ThinkPad P51 20HH0016GE | |
| Dell Precision 5520 UHD | |
| Eurocom Tornado F5W | |
| HP ZBook 15 G4-Y4E80AV | |
| |||||||||||||||||||||||||
Distribution av ljusstyrkan: 92 %
Mitt på batteriet: 405.7 cd/m²
Kontrast: 624:1 (Svärta: 0.65 cd/m²)
ΔE ColorChecker Calman: 8.5 | ∀{0.5-29.43 Ø4.71}
ΔE Greyscale Calman: 11.6 | ∀{0.09-98 Ø4.96}
87% sRGB (Argyll 1.6.3 3D)
57% AdobeRGB 1998 (Argyll 1.6.3 3D)
64.2% AdobeRGB 1998 (Argyll 3D)
87.7% sRGB (Argyll 3D)
66.1% Display P3 (Argyll 3D)
Gamma: 2.37
CCT: 10468 K
| Eurocom Tornado F5W AUO52ED B156HTN05.2, TN, 15.6", 1920x1080 | Fujitsu Celsius H970 LP173WF4-SPF3, IPS LED, 17.3", 1920x1080 | HP ZBook 15 G4-Y4E80AV LG Philips LGD057E, IPS, 15.6", 1920x1080 | MSI WS63VR 7RL-023US SAMSUNG LƒFL156FL02-101 , IPS, 15.6", 3840x2160 | Lenovo ThinkPad P51 20HH0016GE LEN40BD, B156ZAN02.1, IPS, 15.6", 3840x2160 | Dell Precision 5520 UHD SHP1476, IPS, 15.6", 3840x2160 | |
|---|---|---|---|---|---|---|
| Display | -2% | -5% | -24% | 33% | 7% | |
| Display P3 Coverage (%) | 66.1 | 66.8 1% | 64 -3% | 47.43 -28% | 86.3 31% | 67.4 2% |
| sRGB Coverage (%) | 87.7 | 84.6 -4% | 82.7 -6% | 71.4 -19% | 99.5 13% | 98.5 12% |
| AdobeRGB 1998 Coverage (%) | 64.2 | 61.8 -4% | 60.4 -6% | 49 -24% | 99.3 55% | 68.9 7% |
| Response Times | -125% | -135% | -147% | -136% | -272% | |
| Response Time Grey 50% / Grey 80% * (ms) | 23.2 ? | 32 ? -38% | 39.2 ? -69% | 36.8 ? -59% | 40.8 ? -76% | 59.2 ? -155% |
| Response Time Black / White * (ms) | 8.5 ? | 26.4 ? -211% | 25.6 ? -201% | 28.4 ? -234% | 25.2 ? -196% | 41.6 ? -389% |
| PWM Frequency (Hz) | 20830 ? | 1351 ? | ||||
| Screen | 23% | 24% | 4% | 32% | 26% | |
| Brightness middle (cd/m²) | 405.7 | 368 -9% | 321 -21% | 259.4 -36% | 317 -22% | 372.4 -8% |
| Brightness (cd/m²) | 397 | 360 -9% | 320 -19% | 247 -38% | 309 -22% | 368 -7% |
| Brightness Distribution (%) | 92 | 91 -1% | 89 -3% | 85 -8% | 89 -3% | 90 -2% |
| Black Level * (cd/m²) | 0.65 | 0.3 54% | 0.29 55% | 0.43 34% | 0.36 45% | 0.48 26% |
| Contrast (:1) | 624 | 1227 97% | 1107 77% | 603 -3% | 881 41% | 776 24% |
| Colorchecker dE 2000 * | 8.5 | 6.4 25% | 4.5 47% | 5.5 35% | 2.7 68% | 2.6 69% |
| Colorchecker dE 2000 max. * | 16.2 | 10.1 38% | 9.5 41% | 12.7 22% | 4.1 75% | 5.6 65% |
| Greyscale dE 2000 * | 11.6 | 7.2 38% | 2.9 75% | 3.6 69% | 3 74% | 3.7 68% |
| Gamma | 2.37 93% | 2.02 109% | 2.27 97% | 2.24 98% | 2.27 97% | 2.14 103% |
| CCT | 10468 62% | 6882 94% | 6519 100% | 7163 91% | 6077 107% | 7096 92% |
| Color Space (Percent of AdobeRGB 1998) (%) | 57 | 55.5 -3% | 54.2 -5% | 45 -21% | 87.6 54% | 63 11% |
| Color Space (Percent of sRGB) (%) | 87 | 84.4 -3% | 82.6 -5% | 71 -18% | 99.5 14% | 99 14% |
| Totalt genomsnitt (program/inställningar) | -35% /
-2% | -39% /
-3% | -56% /
-22% | -24% /
10% | -80% /
-18% |
* ... mindre är bättre
Visa svarstider
| ↔ Svarstid svart till vitt | ||
|---|---|---|
| 8.5 ms ... stiga ↗ och falla ↘ kombinerat | ↗ 6.8 ms stiga | 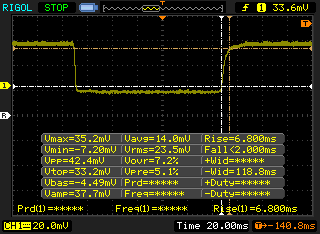 |
| ↘ 1.7 ms hösten | ||
| Skärmen visar snabba svarsfrekvenser i våra tester och bör passa för spel. I jämförelse sträcker sig alla testade enheter från 0.1 (minst) till 240 (maximalt) ms. » 24 % av alla enheter är bättre. Det betyder att den uppmätta svarstiden är bättre än genomsnittet av alla testade enheter (19.8 ms). | ||
| ↔ Svarstid 50 % grått till 80 % grått | ||
| 23.2 ms ... stiga ↗ och falla ↘ kombinerat | ↗ 18.8 ms stiga | 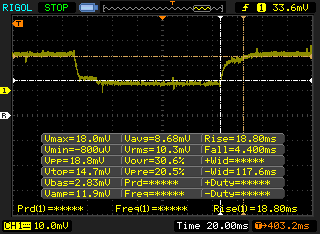 |
| ↘ 4.4 ms hösten | ||
| Skärmen visar bra svarsfrekvens i våra tester, men kan vara för långsam för konkurrenskraftiga spelare. I jämförelse sträcker sig alla testade enheter från 0.165 (minst) till 636 (maximalt) ms. » 34 % av alla enheter är bättre. Det betyder att den uppmätta svarstiden är bättre än genomsnittet av alla testade enheter (30.9 ms). | ||
Skärmflimmer / PWM (Puls-Width Modulation)
| Skärmflimmer / PWM upptäcktes inte | 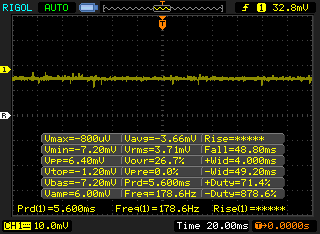 | ||
Som jämförelse: 52 % av alla testade enheter använder inte PWM för att dämpa skärmen. Om PWM upptäcktes mättes ett medelvärde av 7748 (minst: 5 - maximum: 343500) Hz. | |||
| Cinebench R15 | |
| CPU Single 64Bit | |
| HP ZBook 15 G4-Y4E80AV | |
| Lenovo ThinkPad P51 20HH0016GE | |
| Fujitsu Celsius H970 | |
| Dell Precision 5520 UHD | |
| Eurocom Tornado F5W | |
| MSI WS63VR 7RL-023US | |
| CPU Multi 64Bit | |
| Eurocom Tornado F5W | |
| HP ZBook 15 G4-Y4E80AV | |
| Lenovo ThinkPad P51 20HH0016GE | |
| MSI WS63VR 7RL-023US | |
| Fujitsu Celsius H970 | |
| Dell Precision 5520 UHD | |
| Cinebench R11.5 | |
| CPU Single 64Bit | |
| Dell Precision 5520 UHD | |
| Lenovo ThinkPad P51 20HH0016GE | |
| Fujitsu Celsius H970 | |
| Eurocom Tornado F5W | |
| MSI WS63VR 7RL-023US | |
| CPU Multi 64Bit | |
| Eurocom Tornado F5W | |
| Lenovo ThinkPad P51 20HH0016GE | |
| MSI WS63VR 7RL-023US | |
| Dell Precision 5520 UHD | |
| Fujitsu Celsius H970 | |
| wPrime 2.10 - 1024m | |
| Fujitsu Celsius H970 | |
| Lenovo ThinkPad P51 20HH0016GE | |
| Dell Precision 5520 UHD | |
| Eurocom Tornado F5W | |
| MSI WS63VR 7RL-023US | |
* ... mindre är bättre
| PCMark 8 | |
| Home Score Accelerated v2 | |
| Eurocom Tornado F5W | |
| HP ZBook 15 G4-Y4E80AV | |
| MSI WS63VR 7RL-023US | |
| Lenovo ThinkPad P51 20HH0016GE | |
| Dell Precision 5520 UHD | |
| Work Score Accelerated v2 | |
| Eurocom Tornado F5W | |
| HP ZBook 15 G4-Y4E80AV | |
| Fujitsu Celsius H970 | |
| MSI WS63VR 7RL-023US | |
| Dell Precision 5520 UHD | |
| Lenovo ThinkPad P51 20HH0016GE | |
| Creative Score Accelerated v2 | |
| Eurocom Tornado F5W | |
| Fujitsu Celsius H970 | |
| Lenovo ThinkPad P51 20HH0016GE | |
| HP ZBook 15 G4-Y4E80AV | |
| MSI WS63VR 7RL-023US | |
| Dell Precision 5520 UHD | |
| PCMark 8 Home Score Accelerated v2 | 5273 poäng | |
| PCMark 8 Creative Score Accelerated v2 | 8015 poäng | |
| PCMark 8 Work Score Accelerated v2 | 5433 poäng | |
| PCMark 10 Score | 5340 poäng | |
Hjälp | ||
| Eurocom Tornado F5W Samsung SSD 960 Pro 512 GB m.2 | Fujitsu Celsius H970 Samsung SM961 MZVKW512HMJP m.2 PCI-e | HP ZBook 15 G4-Y4E80AV Samsung SSD SM961 1TB M.2 MZVKW1T0HMLH | Lenovo ThinkPad P51 20HH0016GE Samsung PM961 NVMe MZVLW512HMJP | Dell Precision 5520 UHD Samsung SM961 MZVKW512HMJP m.2 PCI-e | |
|---|---|---|---|---|---|
| AS SSD | -15% | 11% | 3% | 4% | |
| Copy Game MB/s (MB/s) | 1094 | 839 -23% | 982 -10% | 1140 4% | 921 -16% |
| Copy Program MB/s (MB/s) | 419.8 | 297.5 -29% | 325.4 -22% | 425.6 1% | 372.8 -11% |
| Copy ISO MB/s (MB/s) | 1905 | 1722 -10% | 1486 -22% | 1607 -16% | 1659 -13% |
| Score Total (Points) | 3241 | 3509 8% | 4303 33% | 3424 6% | 3681 14% |
| Score Write (Points) | 1667 | 1210 -27% | 1472 -12% | 917 -45% | 1379 -17% |
| Score Read (Points) | 1066 | 1557 46% | 1902 78% | 1690 59% | 1554 46% |
| Access Time Write * (ms) | 0.024 | 0.048 -100% | 0.023 4% | 0.025 -4% | 0.023 4% |
| Access Time Read * (ms) | 0.042 | 0.05 -19% | 0.034 19% | 0.032 24% | 0.038 10% |
| 4K-64 Write (MB/s) | 1319 | 971 -26% | 1136 -14% | 623 -53% | 1055 -20% |
| 4K-64 Read (MB/s) | 719 | 1246 73% | 1578 119% | 1372 91% | 1223 70% |
| 4K Write (MB/s) | 154.6 | 78.1 -49% | 158 2% | 143.1 -7% | 155.3 0% |
| 4K Read (MB/s) | 51.1 | 38.88 -24% | 51.7 1% | 55.6 9% | 51.5 1% |
| Seq Write (MB/s) | 1939 | 1609 -17% | 1777 -8% | 1506 -22% | 1694 -13% |
| Seq Read (MB/s) | 2956 | 2726 -8% | 2719 -8% | 2624 -11% | 2799 -5% |
* ... mindre är bättre

| 3DMark 11 | |
| 1280x720 Performance GPU | |
| Eurocom Tornado F5 Killer Edition | |
| Alienware 17 R4 | |
| Eurocom Tornado F5 | |
| Eurocom Tornado F5W | |
| MSI WS63VR 7RL-023US | |
| Fujitsu Celsius H970 | |
| Lenovo ThinkPad P51 20HH0016GE | |
| Dell Precision 5520 UHD | |
| 1280x720 Performance Combined | |
| Eurocom Tornado F5 | |
| Eurocom Tornado F5W | |
| Alienware 17 R4 | |
| MSI WS63VR 7RL-023US | |
| Eurocom Tornado F5 Killer Edition | |
| Fujitsu Celsius H970 | |
| Lenovo ThinkPad P51 20HH0016GE | |
| Dell Precision 5520 UHD | |
| 3DMark | |
| 1280x720 Cloud Gate Standard Graphics | |
| Alienware 17 R4 | |
| Eurocom Tornado F5 | |
| Eurocom Tornado F5 Killer Edition | |
| Eurocom Tornado F5W | |
| MSI WS63VR 7RL-023US | |
| Fujitsu Celsius H970 | |
| HP ZBook 15 G4-Y4E80AV | |
| Lenovo ThinkPad P51 20HH0016GE | |
| Dell Precision 5520 UHD | |
| 1920x1080 Fire Strike Graphics | |
| Alienware 17 R4 | |
| Eurocom Tornado F5 Killer Edition | |
| Eurocom Tornado F5 | |
| Eurocom Tornado F5W | |
| MSI WS63VR 7RL-023US | |
| Fujitsu Celsius H970 | |
| Lenovo ThinkPad P51 20HH0016GE | |
| HP ZBook 15 G4-Y4E80AV | |
| Dell Precision 5520 UHD | |
| Fire Strike Extreme Graphics | |
| Alienware 17 R4 | |
| Eurocom Tornado F5 Killer Edition | |
| Eurocom Tornado F5 | |
| Eurocom Tornado F5W | |
| Fujitsu Celsius H970 | |
| Lenovo ThinkPad P51 20HH0016GE | |
| Dell Precision 5520 UHD | |
| 3840x2160 Fire Strike Ultra Graphics | |
| Alienware 17 R4 | |
| Eurocom Tornado F5 Killer Edition | |
| Eurocom Tornado F5 | |
| Eurocom Tornado F5W | |
| Fujitsu Celsius H970 | |
| Lenovo ThinkPad P51 20HH0016GE | |
| 1920x1080 Ice Storm Extreme Graphics | |
| Alienware 17 R4 | |
| Eurocom Tornado F5 | |
| Eurocom Tornado F5W | |
| Eurocom Tornado F5 Killer Edition | |
| Dell Precision 5520 UHD | |
| 3DMark 06 Standard Score | 33236 poäng | |
| 3DMark 11 Performance | 16603 poäng | |
| 3DMark Ice Storm Standard Score | 161394 poäng | |
| 3DMark Cloud Gate Standard Score | 29658 poäng | |
| 3DMark Fire Strike Score | 12441 poäng | |
| 3DMark Fire Strike Extreme Score | 6666 poäng | |
Hjälp | ||
| BioShock Infinite - 1920x1080 Ultra Preset, DX11 (DDOF) (sortera efter värde) | |
| Eurocom Tornado F5W | |
| Fujitsu Celsius H970 | |
| HP ZBook 15 G4-Y4E80AV | |
| MSI WS63VR 7RL-023US | |
| Dell Precision 5520 UHD | |
| Eurocom Tornado F5 | |
| Eurocom Tornado F5 Killer Edition | |
| Alienware 17 R4 | |
| Metro: Last Light - 1920x1080 Very High (DX11) AF:16x (sortera efter värde) | |
| Eurocom Tornado F5W | |
| MSI WS63VR 7RL-023US | |
| Eurocom Tornado F5 | |
| Eurocom Tornado F5 Killer Edition | |
| Alienware 17 R4 | |
| Thief - 1920x1080 Very High Preset AA:FXAA & High SS AF:8x (sortera efter värde) | |
| Eurocom Tornado F5W | |
| MSI WS63VR 7RL-023US | |
| Eurocom Tornado F5 Killer Edition | |
| Alienware 17 R4 | |
| The Witcher 3 - 1920x1080 Ultra Graphics & Postprocessing (HBAO+) (sortera efter värde) | |
| Eurocom Tornado F5W | |
| Fujitsu Celsius H970 | |
| HP ZBook 15 G4-Y4E80AV | |
| MSI WS63VR 7RL-023US | |
| Lenovo ThinkPad P51 20HH0016GE | |
| Eurocom Tornado F5 Killer Edition | |
| Alienware 17 R4 | |
| Batman: Arkham Knight - 1920x1080 High / On AA:SM AF:16x (sortera efter värde) | |
| Eurocom Tornado F5W | |
| MSI WS63VR 7RL-023US | |
| Dell Precision 5520 UHD | |
| Eurocom Tornado F5 | |
| Eurocom Tornado F5 Killer Edition | |
| Alienware 17 R4 | |
| Rise of the Tomb Raider - 1920x1080 Very High Preset AA:FX AF:16x (sortera efter värde) | |
| Eurocom Tornado F5W | |
| Fujitsu Celsius H970 | |
| HP ZBook 15 G4-Y4E80AV | |
| MSI WS63VR 7RL-023US | |
| Lenovo ThinkPad P51 20HH0016GE | |
| Eurocom Tornado F5 | |
| Eurocom Tornado F5 Killer Edition | |
| Alienware 17 R4 | |
| låg | med. | hög | ultra | |
|---|---|---|---|---|
| BioShock Infinite (2013) | 129 | |||
| Metro: Last Light (2013) | 99 | |||
| Thief (2014) | 98 | |||
| The Witcher 3 (2015) | 54 | |||
| Batman: Arkham Knight (2015) | 79 | |||
| Rise of the Tomb Raider (2016) | 90 |
Ljudnivå
| Låg belastning |
| 31.2 / 31.2 / 32.6 dB(A) |
| Hög belastning |
| 32.6 / 43.3 dB(A) |
 | ||
30 dB tyst 40 dB(A) hörbar 50 dB(A) högt ljud |
||
min: | ||
| Eurocom Tornado F5W Quadro P5000, E3-1280 v5, Samsung SSD 960 Pro 512 GB m.2 | Fujitsu Celsius H970 Quadro P4000, E3-1535M v6, Samsung SM961 MZVKW512HMJP m.2 PCI-e | HP ZBook 15 G4-Y4E80AV Quadro M2200, E3-1535M v6, Samsung SSD SM961 1TB M.2 MZVKW1T0HMLH | MSI WS63VR 7RL-023US Quadro P4000 Max-Q, i7-7700HQ, Toshiba NVMe THNSN5512GPU7 | Lenovo ThinkPad P51 20HH0016GE Quadro M2200, E3-1505M v6, Samsung PM961 NVMe MZVLW512HMJP | Dell Precision 5520 UHD Quadro M1200, E3-1505M v6, Samsung SM961 MZVKW512HMJP m.2 PCI-e | |
|---|---|---|---|---|---|---|
| Noise | -10% | 3% | -4% | 6% | -4% | |
| av / miljö * (dB) | 29.6 | 30.2 -2% | 29.5 -0% | 28 5% | 29.6 -0% | 28.7 3% |
| Idle Minimum * (dB) | 31.2 | 30.2 3% | 29.5 5% | 33.2 -6% | 29.6 5% | 28.7 8% |
| Idle Average * (dB) | 31.2 | 32.8 -5% | 29.5 5% | 33.2 -6% | 29.6 5% | 32.1 -3% |
| Idle Maximum * (dB) | 32.6 | 32.8 -1% | 30 8% | 33.2 -2% | 29.6 9% | 32.1 2% |
| Load Average * (dB) | 32.6 | 47.3 -45% | 39.5 -21% | 41.4 -27% | 32.2 1% | 41.3 -27% |
| Witcher 3 ultra * (dB) | 43.1 | 39.5 8% | 38.4 11% | 45.5 -6% | ||
| Load Maximum * (dB) | 43.3 | 47.3 -9% | 36 17% | 43.5 -0% | 36.6 15% | 45.5 -5% |
* ... mindre är bättre
(±) Den maximala temperaturen på ovansidan är 42.4 °C / 108 F, jämfört med genomsnittet av 38.2 °C / 101 F , allt från 22.2 till 69.8 °C för klassen Workstation.
(-) Botten värms upp till maximalt 51.4 °C / 125 F, jämfört med genomsnittet av 41.1 °C / 106 F
(+) Vid tomgångsbruk är medeltemperaturen för ovansidan 30.7 °C / 87 F, jämfört med enhetsgenomsnittet på 32 °C / ### class_avg_f### F.
(-) När du spelar The Witcher 3 är medeltemperaturen för ovansidan 40.3 °C / 105 F, jämfört med enhetsgenomsnittet på 32 °C / ## #class_avg_f### F.
(±) Handledsstöden och pekplattan kan bli väldigt varma vid beröring med maximalt 39.8 °C / 103.6 F.
(-) Medeltemperaturen för handledsstödsområdet på liknande enheter var 27.8 °C / 82 F (-12 °C / -21.6 F).
Eurocom Tornado F5W ljudanalys
(-) | inte särskilt höga högtalare (70.9 dB)
Bas 100 - 315 Hz
(±) | reducerad bas - i genomsnitt 13.2% lägre än medianen
(±) | linjäriteten för basen är genomsnittlig (12.4% delta till föregående frekvens)
Mellan 400 - 2000 Hz
(+) | balanserad mellan - endast 4.2% från medianen
(±) | linjäriteten för mids är genomsnittlig (13.8% delta till föregående frekvens)
Högsta 2 - 16 kHz
(+) | balanserade toppar - endast 4.3% från medianen
(±) | linjäriteten för toppar är genomsnittlig (8.4% delta till föregående frekvens)
Totalt 100 - 16 000 Hz
(±) | linjäriteten för det totala ljudet är genomsnittlig (25.7% skillnad mot median)
Jämfört med samma klass
» 87% av alla testade enheter i den här klassen var bättre, 6% liknande, 7% sämre
» Den bästa hade ett delta på 7%, genomsnittet var 17%, sämst var 35%
Jämfört med alla testade enheter
» 79% av alla testade enheter var bättre, 4% liknande, 17% sämre
» Den bästa hade ett delta på 4%, genomsnittet var 23%, sämst var 134%
Dell Precision 5520 UHD ljudanalys
(±) | högtalarljudstyrkan är genomsnittlig men bra (79.6 dB)
Bas 100 - 315 Hz
(±) | reducerad bas - i genomsnitt 12.8% lägre än medianen
(±) | linjäriteten för basen är genomsnittlig (14.2% delta till föregående frekvens)
Mellan 400 - 2000 Hz
(+) | balanserad mellan - endast 4% från medianen
(±) | linjäriteten för mids är genomsnittlig (9.9% delta till föregående frekvens)
Högsta 2 - 16 kHz
(+) | balanserade toppar - endast 3.3% från medianen
(±) | linjäriteten för toppar är genomsnittlig (12% delta till föregående frekvens)
Totalt 100 - 16 000 Hz
(±) | linjäriteten för det totala ljudet är genomsnittlig (16.7% skillnad mot median)
Jämfört med samma klass
» 46% av alla testade enheter i den här klassen var bättre, 9% liknande, 45% sämre
» Den bästa hade ett delta på 7%, genomsnittet var 17%, sämst var 35%
Jämfört med alla testade enheter
» 29% av alla testade enheter var bättre, 7% liknande, 64% sämre
» Den bästa hade ett delta på 4%, genomsnittet var 23%, sämst var 134%
| Av/Standby | |
| Låg belastning | |
| Hög belastning |
|
Förklaring:
min: | |
| Eurocom Tornado F5W E3-1280 v5, Quadro P5000, Samsung SSD 960 Pro 512 GB m.2, TN, 1920x1080, 15.6" | Fujitsu Celsius H970 E3-1535M v6, Quadro P4000, Samsung SM961 MZVKW512HMJP m.2 PCI-e, IPS LED, 1920x1080, 17.3" | HP ZBook 15 G4-Y4E80AV E3-1535M v6, Quadro M2200, Samsung SSD SM961 1TB M.2 MZVKW1T0HMLH, IPS, 1920x1080, 15.6" | MSI WS63VR 7RL-023US i7-7700HQ, Quadro P4000 Max-Q, Toshiba NVMe THNSN5512GPU7, IPS, 3840x2160, 15.6" | Lenovo ThinkPad P51 20HH0016GE E3-1505M v6, Quadro M2200, Samsung PM961 NVMe MZVLW512HMJP, IPS, 3840x2160, 15.6" | Dell Precision 5520 UHD E3-1505M v6, Quadro M1200, Samsung SM961 MZVKW512HMJP m.2 PCI-e, IPS, 3840x2160, 15.6" | |
|---|---|---|---|---|---|---|
| Power Consumption | 28% | 38% | 30% | 29% | 33% | |
| Idle Minimum * (Watt) | 23.7 | 10.7 55% | 5.9 75% | 13.3 44% | 8.6 64% | 8.9 62% |
| Idle Average * (Watt) | 24.9 | 15.8 37% | 8.9 64% | 17.2 31% | 15.9 36% | 13.6 45% |
| Idle Maximum * (Watt) | 28.4 | 17.8 37% | 12.7 55% | 17.9 37% | 22.1 22% | 14.1 50% |
| Load Average * (Watt) | 104.1 | 92 12% | 95.2 9% | 83.7 20% | 84.4 19% | 100.3 4% |
| Witcher 3 ultra * (Watt) | 145.9 | 87.7 40% | 101.9 30% | 100.2 31% | ||
| Load Maximum * (Watt) | 136.8 | 137 -0% | 154 -13% | 114.3 16% | 130.6 5% | 126.3 8% |
* ... mindre är bättre
| Eurocom Tornado F5W E3-1280 v5, Quadro P5000, 75.24 Wh | Fujitsu Celsius H970 E3-1535M v6, Quadro P4000, 96 Wh | HP ZBook 15 G4-Y4E80AV E3-1535M v6, Quadro M2200, 90 Wh | MSI WS63VR 7RL-023US i7-7700HQ, Quadro P4000 Max-Q, 48 Wh | Lenovo ThinkPad P51 20HH0016GE E3-1505M v6, Quadro M2200, 90 Wh | Dell Precision 5520 UHD E3-1505M v6, Quadro M1200, 97 Wh | |
|---|---|---|---|---|---|---|
| Batteridrifttid | 127% | 158% | -23% | 118% | 48% | |
| Reader / Idle (h) | 4.7 | 16.7 255% | 18.3 289% | 3.9 -17% | 16.4 249% | 12.1 157% |
| WiFi v1.3 (h) | 4 | 9 125% | 9.1 128% | 2.9 -27% | 6.9 73% | 4.2 5% |
| Load (h) | 1.2 | 1.2 0% | 1.9 58% | 0.9 -25% | 1.6 33% | 1 -17% |
För
Emot
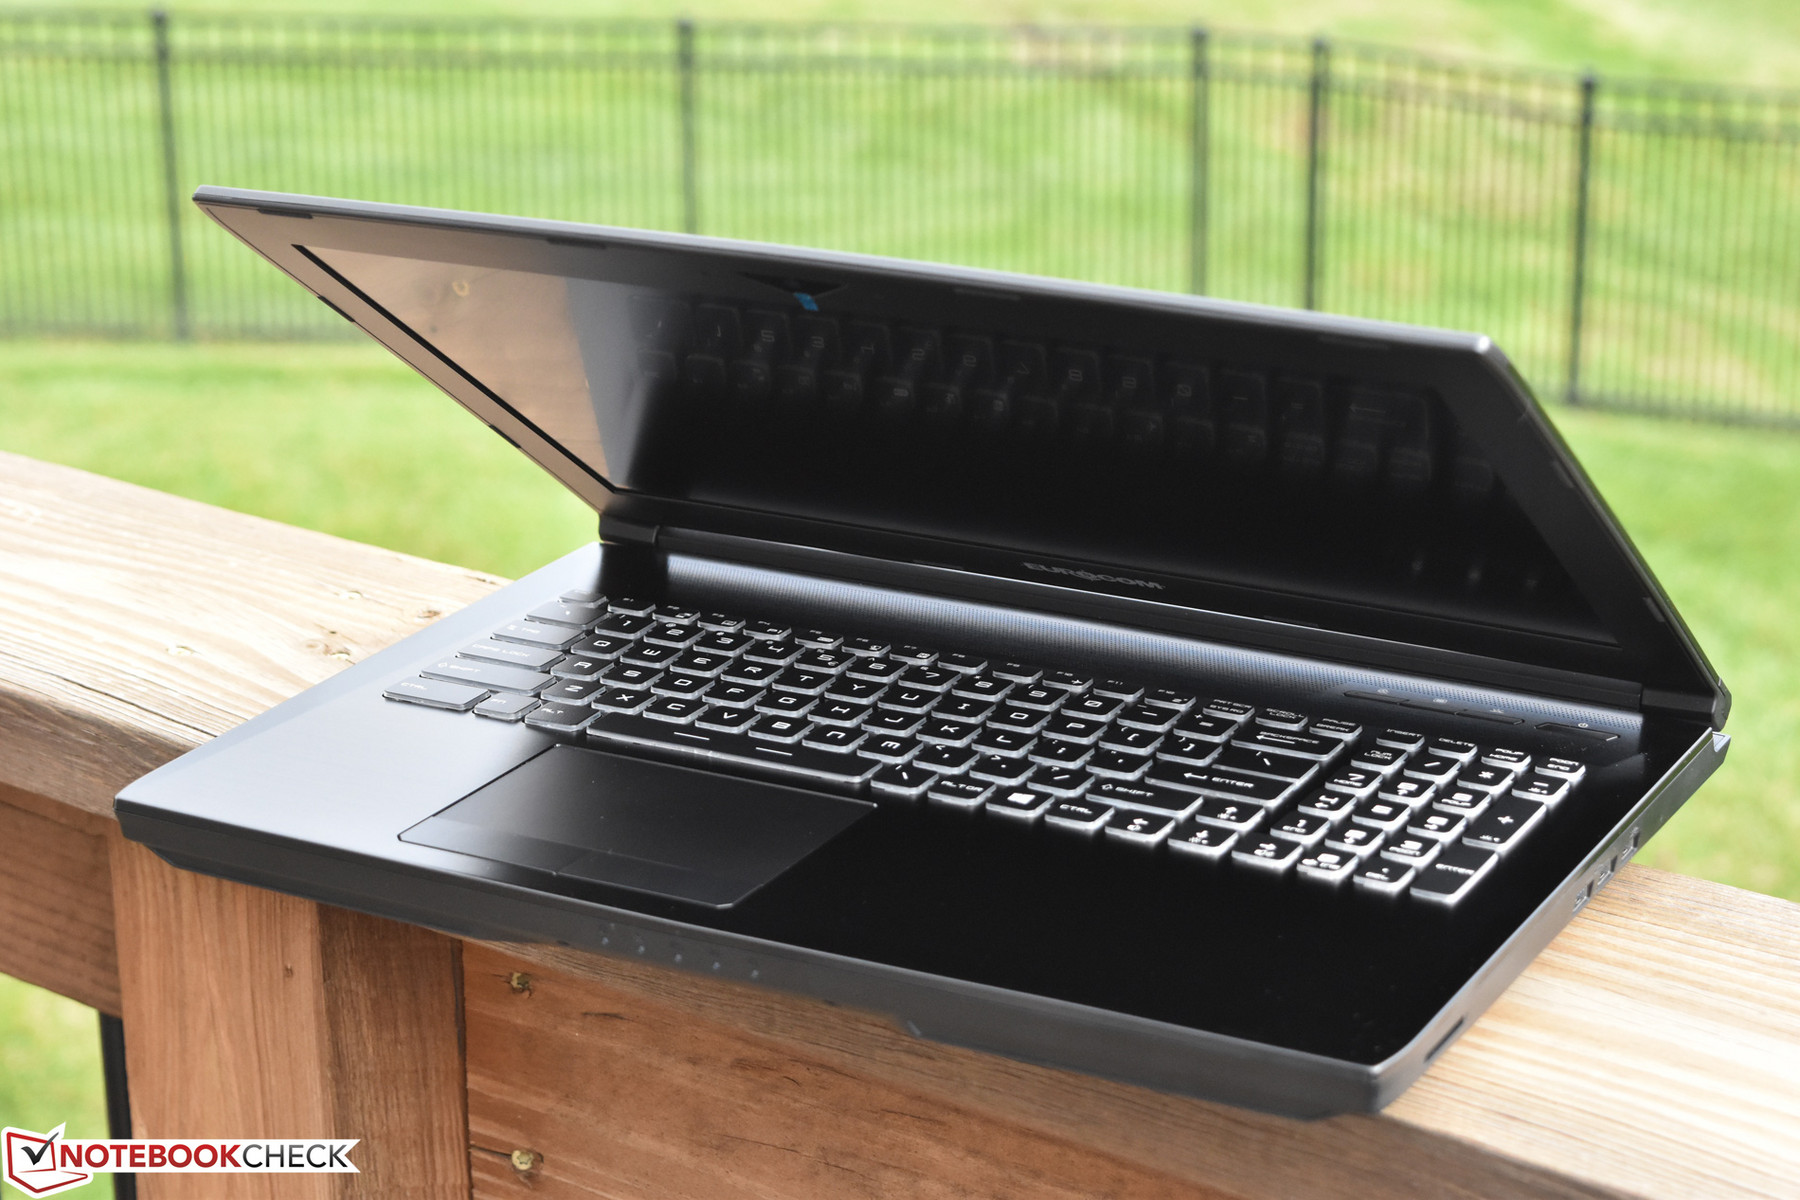
För nästan 50 000 SEK ($6000) är det inget som är billigt med den, men dagens konfiguration av Eurocom Tornado F5W bevisar att prestanda på desktop-nivå är mer än möjligt på en 15.6-tums mobil arbetsstation. Med en kraftfull CPU och en GPU som är (i våra tester) 70% snabbare än närmaste konkurrent, så är det få andra maskiner som kan tävla om du bara är ute efter ren processorkraft. Best av allt, Tornado hanterar allt detta utan prestanda-strypning i någon skepnad, med temperaturer som är under kontroll i alla situationer och ett valfritt Turbo Fan-läge (likt MSIs laptops) för att ytterligare öka på kyl-potentialen och krama ur ytterligare lite extra prestanda.
Om vi förlåter flyttbarhet, vikt och kostnad är Eurocom Tornado F5W en arbetsstation att räkna med, som erbjuder prestanda på desktop-nivå med väldigt få kompromisser överhuvudtaget.
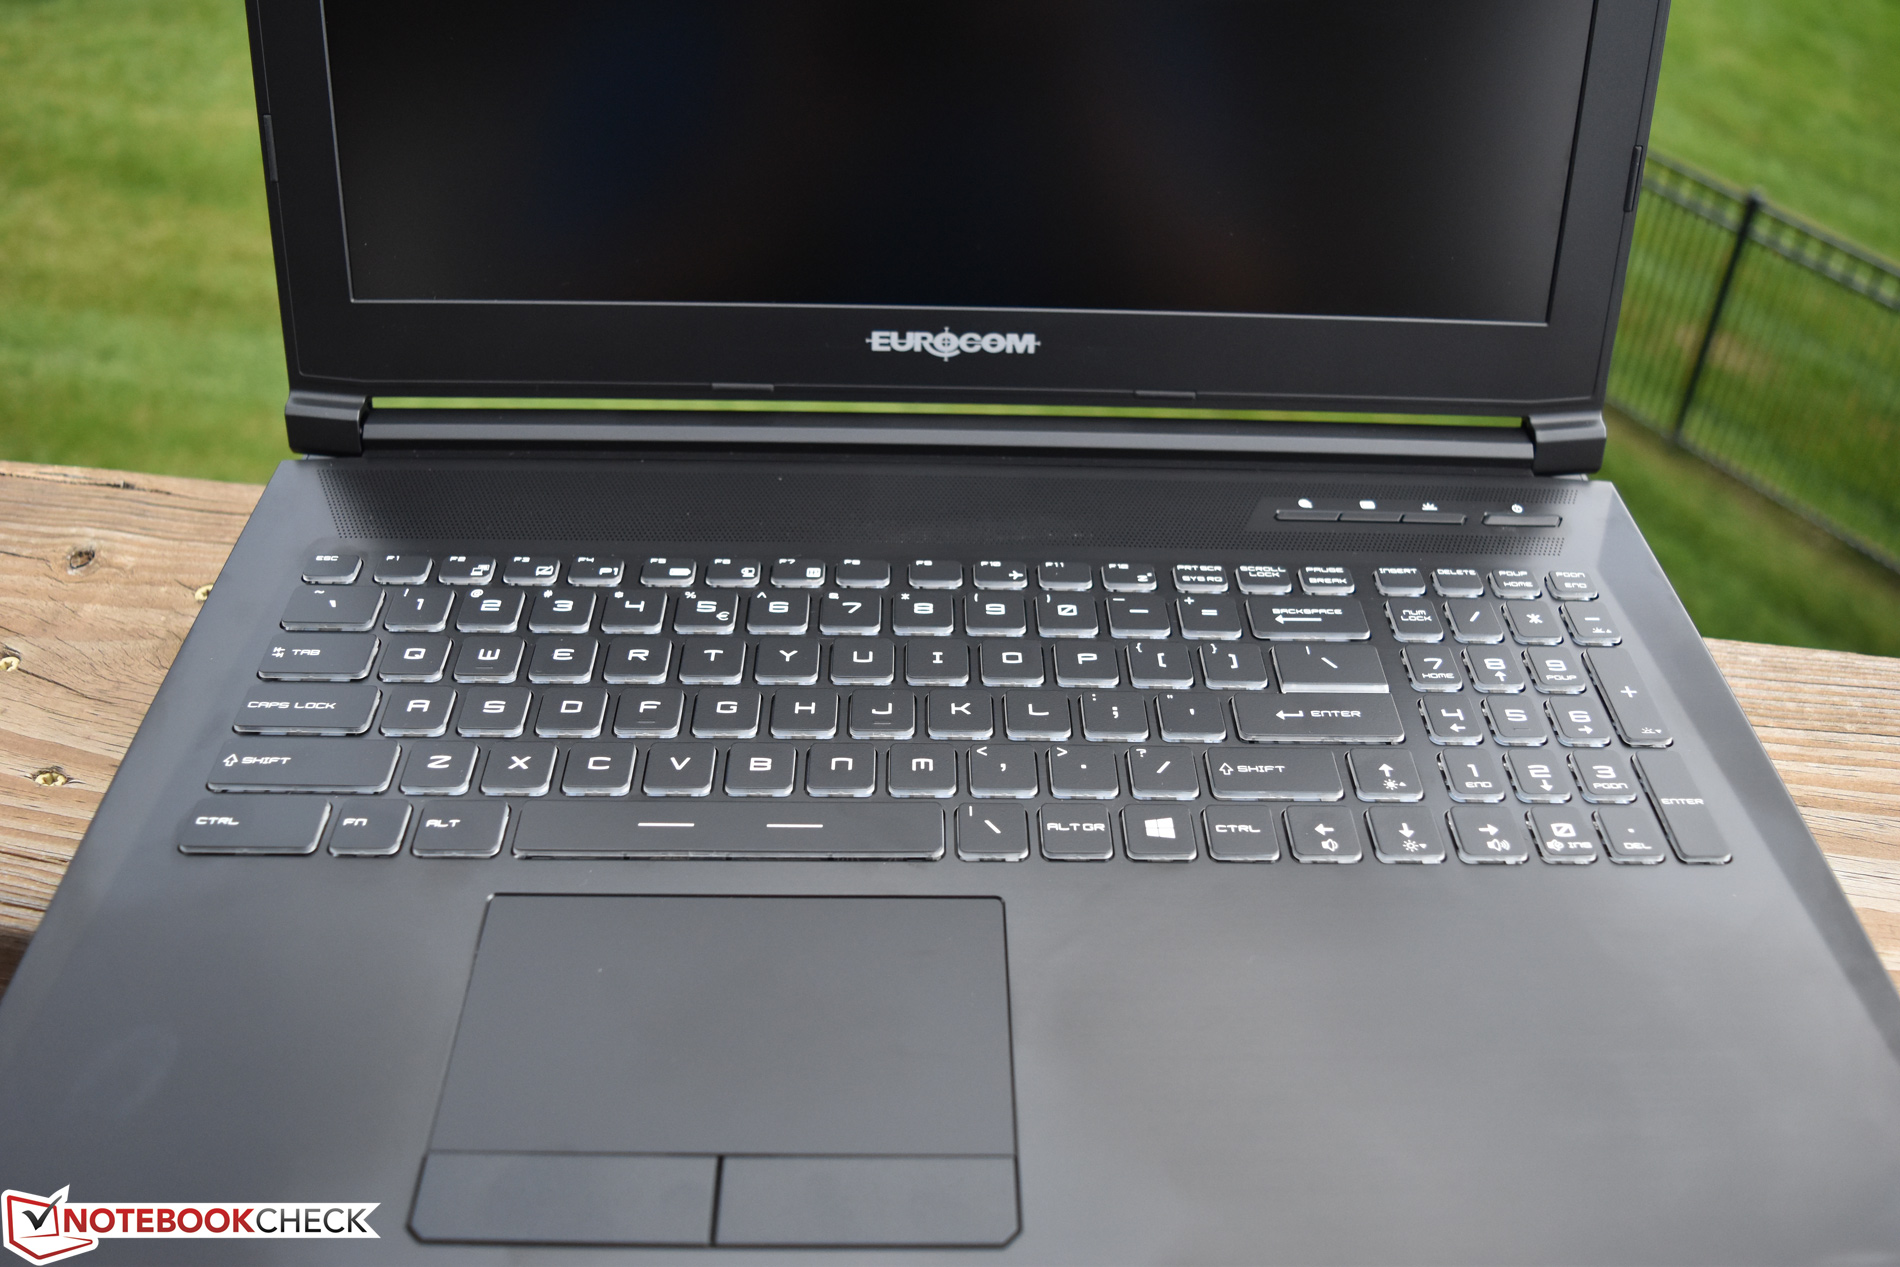
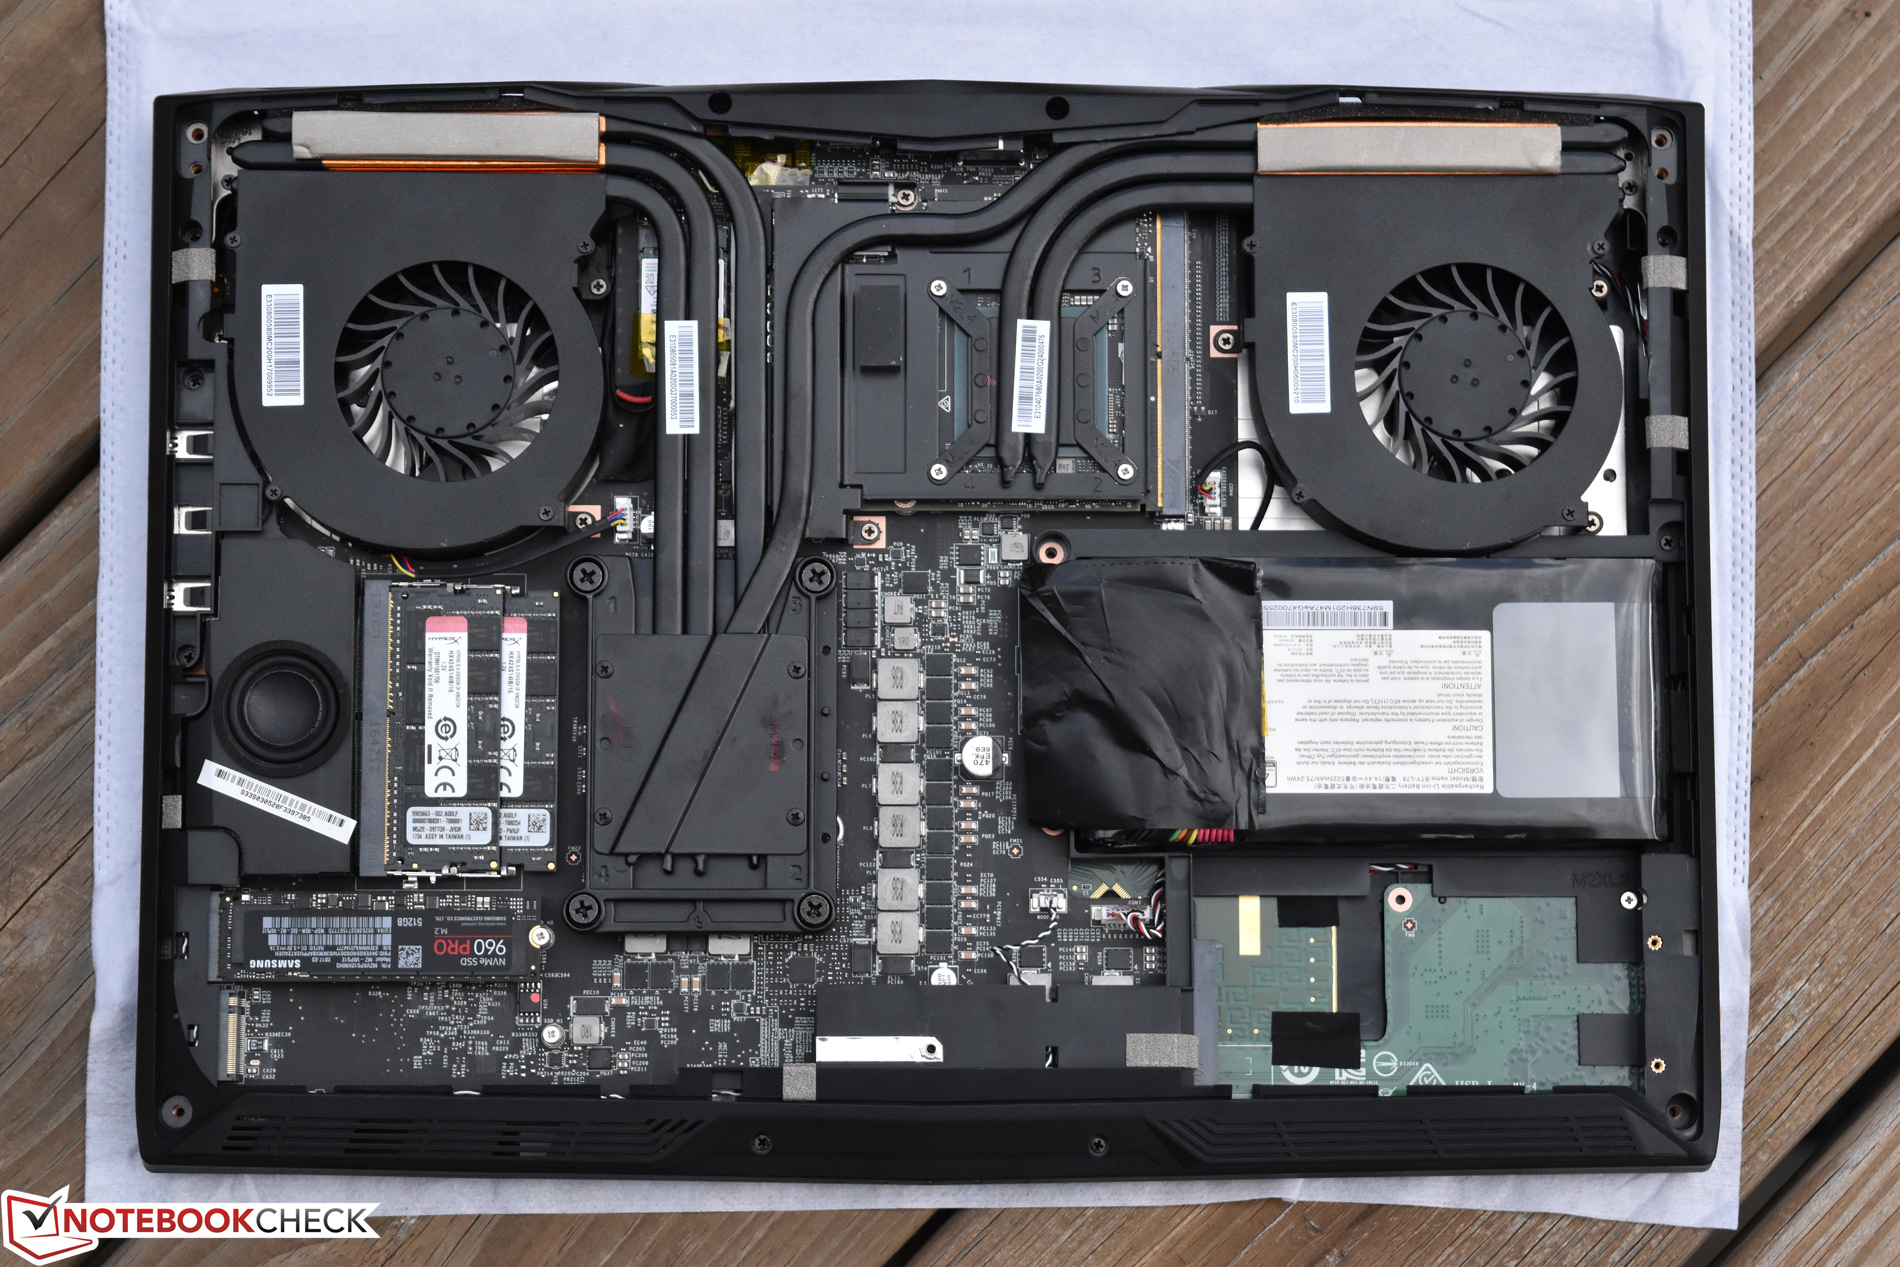
Möjliga köpare kommer att uppskatta hur lätt den är att underhålla och uppgradera; till och med CPU och GPU är utbytbara i Tornado F5W. Hastigheterna på lagringsenheter och allmän systemprestanda är också toppen, med en Samsung 960 Pro SSD (och RAID-0 konfiguration som tillval) som visar sig mer än kapabel. Ljudnivåerna från kylsystemets dubbla fläktar är också rimliga och yttemperaturerna är inget att oroa sig för. Vi imponerades inte av de inbyggda högtalarna eller maskinens batteritid, men ingen av dom två kategorierna kommer vara avgörande för en arbetsstation.
120 Hz-skärmen i vår testenhet, även om den överlag var bra, drog stor nytta av proffesionellt kalibreringsarbete och är sorgligt oexakt direkt ur lådan. Det finns dock många andra alternativ, vilket även gäller övriga komponenter — inklusive CPU och GPU, där inte mindre än ett halvdussin andra (mindre dyra) alternativ också finns med. Priset kan därför bli många tusen kronor lägre och användaren kan fortfarande få en väldigt kapabel arbetsstation.
Slutsatsen som vi ser den: om vi förlåter flyttbarhet, vikt och kostnad är Eurocom Tornado F5W en arbetsstation att räkna med, som erbjuder prestanda på desktop-nivå med väldigt få kompromisser överhuvudtaget.
Eurocom Tornado F5W
- 11/10/2017 v6 (old)
Steve Schardein
Price comparison
