Test: Dell Precision 7510 (4K IGZO) Workstation (sammanfattning)
| |||||||||||||||||||||||||
Distribution av ljusstyrkan: 83 %
Mitt på batteriet: 279.2 cd/m²
Kontrast: 1050:1 (Svärta: 0.266 cd/m²)
ΔE ColorChecker Calman: 4.14 | ∀{0.5-29.43 Ø4.71}
ΔE Greyscale Calman: 3.26 | ∀{0.09-98 Ø4.96}
99.72% sRGB (Argyll 1.6.3 3D)
85.68% AdobeRGB 1998 (Argyll 1.6.3 3D)
99% AdobeRGB 1998 (Argyll 3D)
99.7% sRGB (Argyll 3D)
86.2% Display P3 (Argyll 3D)
Gamma: 2.19
CCT: 6375 K
| Dell Precision 7510 (4K IGZO) 15.6", 3840x2160 | HP ZBook 15 G3 15.6", 1920x1080 | MSI WS60-6QJE316H11 15.6", 3840x2160 | Lenovo ThinkPad P50s-20FKS00400 15.5", 2880x1620 | Lenovo ThinkPad P50 15.6", 1920x1080 | Dell Precision 5510 15.6", 3840x2160 | |
|---|---|---|---|---|---|---|
| Display | -19% | -32% | -25% | -52% | 1% | |
| Display P3 Coverage (%) | 86.2 | 66.8 -23% | 55.1 -36% | 63.7 -26% | 39.13 -55% | 88.4 3% |
| sRGB Coverage (%) | 99.7 | 95.5 -4% | 83 -17% | 87.6 -12% | 58.5 -41% | 100 0% |
| AdobeRGB 1998 Coverage (%) | 99 | 69 -30% | 56.9 -43% | 63.8 -36% | 40.45 -59% | 99.5 1% |
| Response Times | -32% | 15% | 1% | -4% | -32% | |
| Response Time Grey 50% / Grey 80% * (ms) | 40.4 ? | 54 ? -34% | 34 ? 16% | 38 ? 6% | 46 ? -14% | 56.4 ? -40% |
| Response Time Black / White * (ms) | 27.6 ? | 35.6 ? -29% | 24 ? 13% | 28.8 ? -4% | 26 ? 6% | 34 ? -23% |
| PWM Frequency (Hz) | 198.4 ? | 198 ? | 1316 ? | 219 ? | ||
| Screen | -26% | -19% | -16% | -15% | -1% | |
| Brightness middle (cd/m²) | 279.2 | 306 10% | 237 -15% | 319 14% | 263 -6% | 391 40% |
| Brightness (cd/m²) | 271 | 289 7% | 208 -23% | 290 7% | 236 -13% | 361 33% |
| Brightness Distribution (%) | 83 | 85 2% | 77 -7% | 82 -1% | 78 -6% | 87 5% |
| Black Level * (cd/m²) | 0.266 | 0.34 -28% | 0.26 2% | 0.31 -17% | 0.34 -28% | 0.4 -50% |
| Contrast (:1) | 1050 | 900 -14% | 912 -13% | 1029 -2% | 774 -26% | 978 -7% |
| Colorchecker dE 2000 * | 4.14 | 5.1 -23% | 4.42 -7% | 4.8 -16% | 2.35 43% | 4.85 -17% |
| Colorchecker dE 2000 max. * | 6.56 | 9.9 -51% | 8.54 -30% | 7.8 -19% | ||
| Greyscale dE 2000 * | 3.26 | 7.4 -127% | 4.43 -36% | 5.7 -75% | 3.33 -2% | 4.01 -23% |
| Gamma | 2.19 100% | 2.37 93% | 2.23 99% | 2.07 106% | 2.38 92% | 2.18 101% |
| CCT | 6375 102% | 7263 89% | 6133 106% | 6260 104% | 6917 94% | 7340 89% |
| Color Space (Percent of AdobeRGB 1998) (%) | 85.68 | 63 -26% | 52.5 -39% | 56.9 -34% | 37 -57% | 96 12% |
| Color Space (Percent of sRGB) (%) | 99.72 | 95 -5% | 82.9 -17% | 87.4 -12% | 58 -42% | 100 0% |
| Totalt genomsnitt (program/inställningar) | -26% /
-25% | -12% /
-17% | -13% /
-15% | -24% /
-21% | -11% /
-5% |
* ... mindre är bättre
Visa svarstider
| ↔ Svarstid svart till vitt | ||
|---|---|---|
| 27.6 ms ... stiga ↗ och falla ↘ kombinerat | ↗ 6.8 ms stiga | 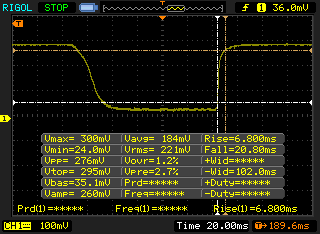 |
| ↘ 20.8 ms hösten | ||
| Skärmen visar relativt långsamma svarsfrekvenser i våra tester och kan vara för långsam för spelare. I jämförelse sträcker sig alla testade enheter från 0.1 (minst) till 240 (maximalt) ms. » 70 % av alla enheter är bättre. Detta innebär att den uppmätta svarstiden är sämre än genomsnittet av alla testade enheter (19.8 ms). | ||
| ↔ Svarstid 50 % grått till 80 % grått | ||
| 40.4 ms ... stiga ↗ och falla ↘ kombinerat | ↗ 19.6 ms stiga | 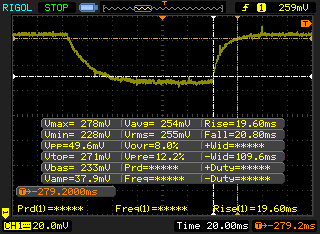 |
| ↘ 20.8 ms hösten | ||
| Skärmen visar långsamma svarsfrekvenser i våra tester och kommer att vara otillfredsställande för spelare. I jämförelse sträcker sig alla testade enheter från 0.165 (minst) till 636 (maximalt) ms. » 64 % av alla enheter är bättre. Detta innebär att den uppmätta svarstiden är sämre än genomsnittet av alla testade enheter (31 ms). | ||
Skärmflimmer / PWM (Puls-Width Modulation)
| Skärmflimmer / PWM upptäckt | 198.4 Hz | ≤ 29 % ljusstyrka inställning | 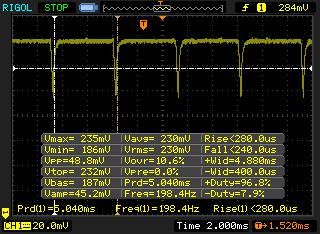 |
Displayens bakgrundsbelysning flimrar vid 198.4 Hz (i värsta fall, t.ex. med PWM) Flimrande upptäckt vid en ljusstyrkeinställning på 29 % och lägre. Det ska inte finnas något flimmer eller PWM över denna ljusstyrkeinställning. Frekvensen för 198.4 Hz är relativt låg, så känsliga användare kommer sannolikt att märka flimmer och uppleva ansträngda ögon vid den angivna ljusstyrkeinställningen och nedan. Som jämförelse: 52 % av alla testade enheter använder inte PWM för att dämpa skärmen. Om PWM upptäcktes mättes ett medelvärde av 7754 (minst: 5 - maximum: 343500) Hz. | |||
| Cinebench R11.5 | |
| CPU Single 64Bit (sortera efter värde) | |
| Dell Precision 7510 (4K IGZO) | |
| HP ZBook 15 G3 | |
| MSI WS60-6QJE316H11 | |
| Lenovo ThinkPad P50s-20FKS00400 | |
| Lenovo ThinkPad P50 | |
| Dell Precision 5510 | |
| CPU Multi 64Bit (sortera efter värde) | |
| Dell Precision 7510 (4K IGZO) | |
| HP ZBook 15 G3 | |
| MSI WS60-6QJE316H11 | |
| Lenovo ThinkPad P50s-20FKS00400 | |
| Lenovo ThinkPad P50 | |
| Dell Precision 5510 | |
| Cinebench R15 | |
| CPU Single 64Bit (sortera efter värde) | |
| Dell Precision 7510 (4K IGZO) | |
| HP ZBook 15 G3 | |
| MSI WS60-6QJE316H11 | |
| Lenovo ThinkPad P50s-20FKS00400 | |
| Lenovo ThinkPad P50 | |
| Dell Precision 5510 | |
| CPU Multi 64Bit (sortera efter värde) | |
| Dell Precision 7510 (4K IGZO) | |
| HP ZBook 15 G3 | |
| MSI WS60-6QJE316H11 | |
| Lenovo ThinkPad P50s-20FKS00400 | |
| Lenovo ThinkPad P50 | |
| Dell Precision 5510 | |
| wPrime 2.10 - 1024m (sortera efter värde) | |
| Dell Precision 7510 (4K IGZO) | |
| Dell Precision 5510 | |
| Super Pi Mod 1.5 XS 32M - 32M (sortera efter värde) | |
| Dell Precision 7510 (4K IGZO) | |
| Dell Precision 5510 | |
* ... mindre är bättre
| PCMark 8 | |
| Home Score Accelerated v2 (sortera efter värde) | |
| Dell Precision 7510 (4K IGZO) | |
| HP ZBook 15 G3 | |
| MSI WS60-6QJE316H11 | |
| Lenovo ThinkPad P50s-20FKS00400 | |
| Lenovo ThinkPad P50 | |
| Dell Precision 5510 | |
| Work Score Accelerated v2 (sortera efter värde) | |
| Dell Precision 7510 (4K IGZO) | |
| HP ZBook 15 G3 | |
| MSI WS60-6QJE316H11 | |
| Lenovo ThinkPad P50s-20FKS00400 | |
| Lenovo ThinkPad P50 | |
| Dell Precision 5510 | |
| Creative Score Accelerated v2 (sortera efter värde) | |
| Dell Precision 7510 (4K IGZO) | |
| HP ZBook 15 G3 | |
| Dell Precision 5510 | |
| PCMark 8 Home Score Accelerated v2 | 4020 poäng | |
| PCMark 8 Creative Score Accelerated v2 | 5537 poäng | |
| PCMark 8 Work Score Accelerated v2 | 4246 poäng | |
Hjälp | ||

| 3DMark 11 | |
| 1280x720 Performance GPU (sortera efter värde) | |
| Dell Precision 7510 (4K IGZO) | |
| HP ZBook 15 G3 | |
| MSI WS60-6QJE316H11 | |
| Lenovo ThinkPad P50s-20FKS00400 | |
| Lenovo ThinkPad P50 | |
| Dell Precision 5510 | |
| 1280x720 Performance Combined (sortera efter värde) | |
| Dell Precision 7510 (4K IGZO) | |
| HP ZBook 15 G3 | |
| MSI WS60-6QJE316H11 | |
| Lenovo ThinkPad P50s-20FKS00400 | |
| Lenovo ThinkPad P50 | |
| Dell Precision 5510 | |
| 3DMark | |
| 1280x720 Cloud Gate Standard Graphics (sortera efter värde) | |
| Dell Precision 7510 (4K IGZO) | |
| HP ZBook 15 G3 | |
| MSI WS60-6QJE316H11 | |
| Lenovo ThinkPad P50s-20FKS00400 | |
| Lenovo ThinkPad P50 | |
| Dell Precision 5510 | |
| 1920x1080 Fire Strike Graphics (sortera efter värde) | |
| Dell Precision 7510 (4K IGZO) | |
| HP ZBook 15 G3 | |
| MSI WS60-6QJE316H11 | |
| Lenovo ThinkPad P50s-20FKS00400 | |
| Lenovo ThinkPad P50 | |
| Dell Precision 5510 | |
| 3DMark 06 Standard Score | 27269 poäng | |
| 3DMark 11 Performance | 5419 poäng | |
| 3DMark Ice Storm Standard Score | 99266 poäng | |
| 3DMark Cloud Gate Standard Score | 17525 poäng | |
| 3DMark Fire Strike Score | 3919 poäng | |
Hjälp | ||
| låg | med. | hög | ultra | 4K | |
|---|---|---|---|---|---|
| BioShock Infinite (2013) | 219 | 139 | 123 | 45 | |
| Rise of the Tomb Raider (2016) | 72 | 49 | 28 | 23 | 16 |
| Dell Precision 7510 (4K IGZO) Quadro M2000M, E3-1535M v5, Samsung SSD SM951a 512GB M.2 PCIe 3.0 x4 NVMe (MZVKV512) | HP ZBook 15 G3 Quadro M2000M, E3-1505M v5, Samsung SM951 MZVPV512HDGL m.2 PCI-e | MSI WS60-6QJE316H11 Quadro M2000M, E3-1505M v5, Toshiba NVMe THNSN5128GP | Lenovo ThinkPad P50s-20FKS00400 Quadro M500M, 6500U, Samsung PM871 MZYLN256HCHP | Lenovo ThinkPad P50 Quadro M2000M, 6820HQ, Samsung SSD PM871 MZNLN256HCHP | Dell Precision 5510 Quadro M1000M, E3-1505M v5, SK hynix SC920 512 GB | |
|---|---|---|---|---|---|---|
| Noise | -5% | -17% | 5% | 5% | -1% | |
| av / miljö * (dB) | 28.2 | 30 -6% | ||||
| Idle Minimum * (dB) | 29.8 | 30 -1% | 37.2 -25% | 30 -1% | 30 -1% | 30 -1% |
| Idle Average * (dB) | 29.8 | 30 -1% | 37.2 -25% | 30 -1% | 30 -1% | 30 -1% |
| Idle Maximum * (dB) | 31.2 | 30 4% | 37.2 -19% | 30 4% | 30 4% | 30 4% |
| Load Average * (dB) | 37.2 | 45.3 -22% | 42.1 -13% | 33.5 10% | 34.5 7% | 42.08 -13% |
| Load Maximum * (dB) | 49.4 | 49.7 -1% | 50.7 -3% | 41.9 15% | 42.1 15% | 46.78 5% |
* ... mindre är bättre
Ljudnivå
| Låg belastning |
| 29.8 / 29.8 / 31.2 dB(A) |
| Hög belastning |
| 37.2 / 49.4 dB(A) |
 | ||
30 dB tyst 40 dB(A) hörbar 50 dB(A) högt ljud |
||
min: | ||
(±) Den maximala temperaturen på ovansidan är 43 °C / 109 F, jämfört med genomsnittet av 38.2 °C / 101 F , allt från 22.2 till 69.8 °C för klassen Workstation.
(±) Botten värms upp till maximalt 41.2 °C / 106 F, jämfört med genomsnittet av 41.1 °C / 106 F
(+) Vid tomgångsbruk är medeltemperaturen för ovansidan 26.7 °C / 80 F, jämfört med enhetsgenomsnittet på 32 °C / ### class_avg_f### F.
(+) Handledsstöden och pekplattan är kallare än hudtemperaturen med maximalt 24.8 °C / 76.6 F och är därför svala att ta på.
(+) Medeltemperaturen för handledsstödsområdet på liknande enheter var 27.8 °C / 82 F (+3 °C / 5.4 F).
| Dell Precision 7510 (4K IGZO) Quadro M2000M, E3-1535M v5, Samsung SSD SM951a 512GB M.2 PCIe 3.0 x4 NVMe (MZVKV512) | HP ZBook 15 G3 Quadro M2000M, E3-1505M v5, Samsung SM951 MZVPV512HDGL m.2 PCI-e | MSI WS60-6QJE316H11 Quadro M2000M, E3-1505M v5, Toshiba NVMe THNSN5128GP | Lenovo ThinkPad P50s-20FKS00400 Quadro M500M, 6500U, Samsung PM871 MZYLN256HCHP | Lenovo ThinkPad P50 Quadro M2000M, 6820HQ, Samsung SSD PM871 MZNLN256HCHP | Dell Precision 5510 Quadro M1000M, E3-1505M v5, SK hynix SC920 512 GB | |
|---|---|---|---|---|---|---|
| Power Consumption | 43% | 5% | 66% | 51% | 36% | |
| Idle Minimum * (Watt) | 23.9 | 5.7 76% | 18.8 21% | 4.3 82% | 5.6 77% | 8.6 64% |
| Idle Average * (Watt) | 28.9 | 12.2 58% | 29.6 -2% | 9.7 66% | 8.6 70% | 16.2 44% |
| Idle Maximum * (Watt) | 30 | 12.6 58% | 30.3 -1% | 10.2 66% | 9.3 69% | 16.7 44% |
| Load Average * (Watt) | 95.2 | 83.1 13% | 90.4 5% | 45.7 52% | 89.5 6% | 82.6 13% |
| Load Maximum * (Watt) | 157.1 | 138.2 12% | 150.2 4% | 55.8 64% | 105 33% | 131.8 16% |
* ... mindre är bättre
| Av/Standby | |
| Låg belastning | |
| Hög belastning |
|
Förklaring:
min: | |
| Dell Precision 7510 (4K IGZO) Quadro M2000M, E3-1535M v5, Samsung SSD SM951a 512GB M.2 PCIe 3.0 x4 NVMe (MZVKV512) | HP ZBook 15 G3 Quadro M2000M, E3-1505M v5, Samsung SM951 MZVPV512HDGL m.2 PCI-e | MSI WS60-6QJE316H11 Quadro M2000M, E3-1505M v5, Toshiba NVMe THNSN5128GP | Lenovo ThinkPad P50s-20FKS00400 Quadro M500M, 6500U, Samsung PM871 MZYLN256HCHP | Lenovo ThinkPad P50 Quadro M2000M, 6820HQ, Samsung SSD PM871 MZNLN256HCHP | Dell Precision 5510 Quadro M1000M, E3-1505M v5, SK hynix SC920 512 GB | |
|---|---|---|---|---|---|---|
| Batteridrifttid | 105% | -40% | 155% | 128% | 43% | |
| Reader / Idle (h) | 4.5 | 13.7 204% | 2.7 -40% | 18.5 311% | 14.3 218% | 7.1 58% |
| WiFi v1.3 (h) | 4 | 6.4 60% | 1.8 -55% | 6.8 70% | 8.3 108% | 4.8 20% |
| Load (h) | 1.2 | 1.8 50% | 0.9 -25% | 2.2 83% | 1.9 58% | 1.8 50% |
| WiFi (h) | 5 |
För
Emot
Läs originaltestet på engelska här.
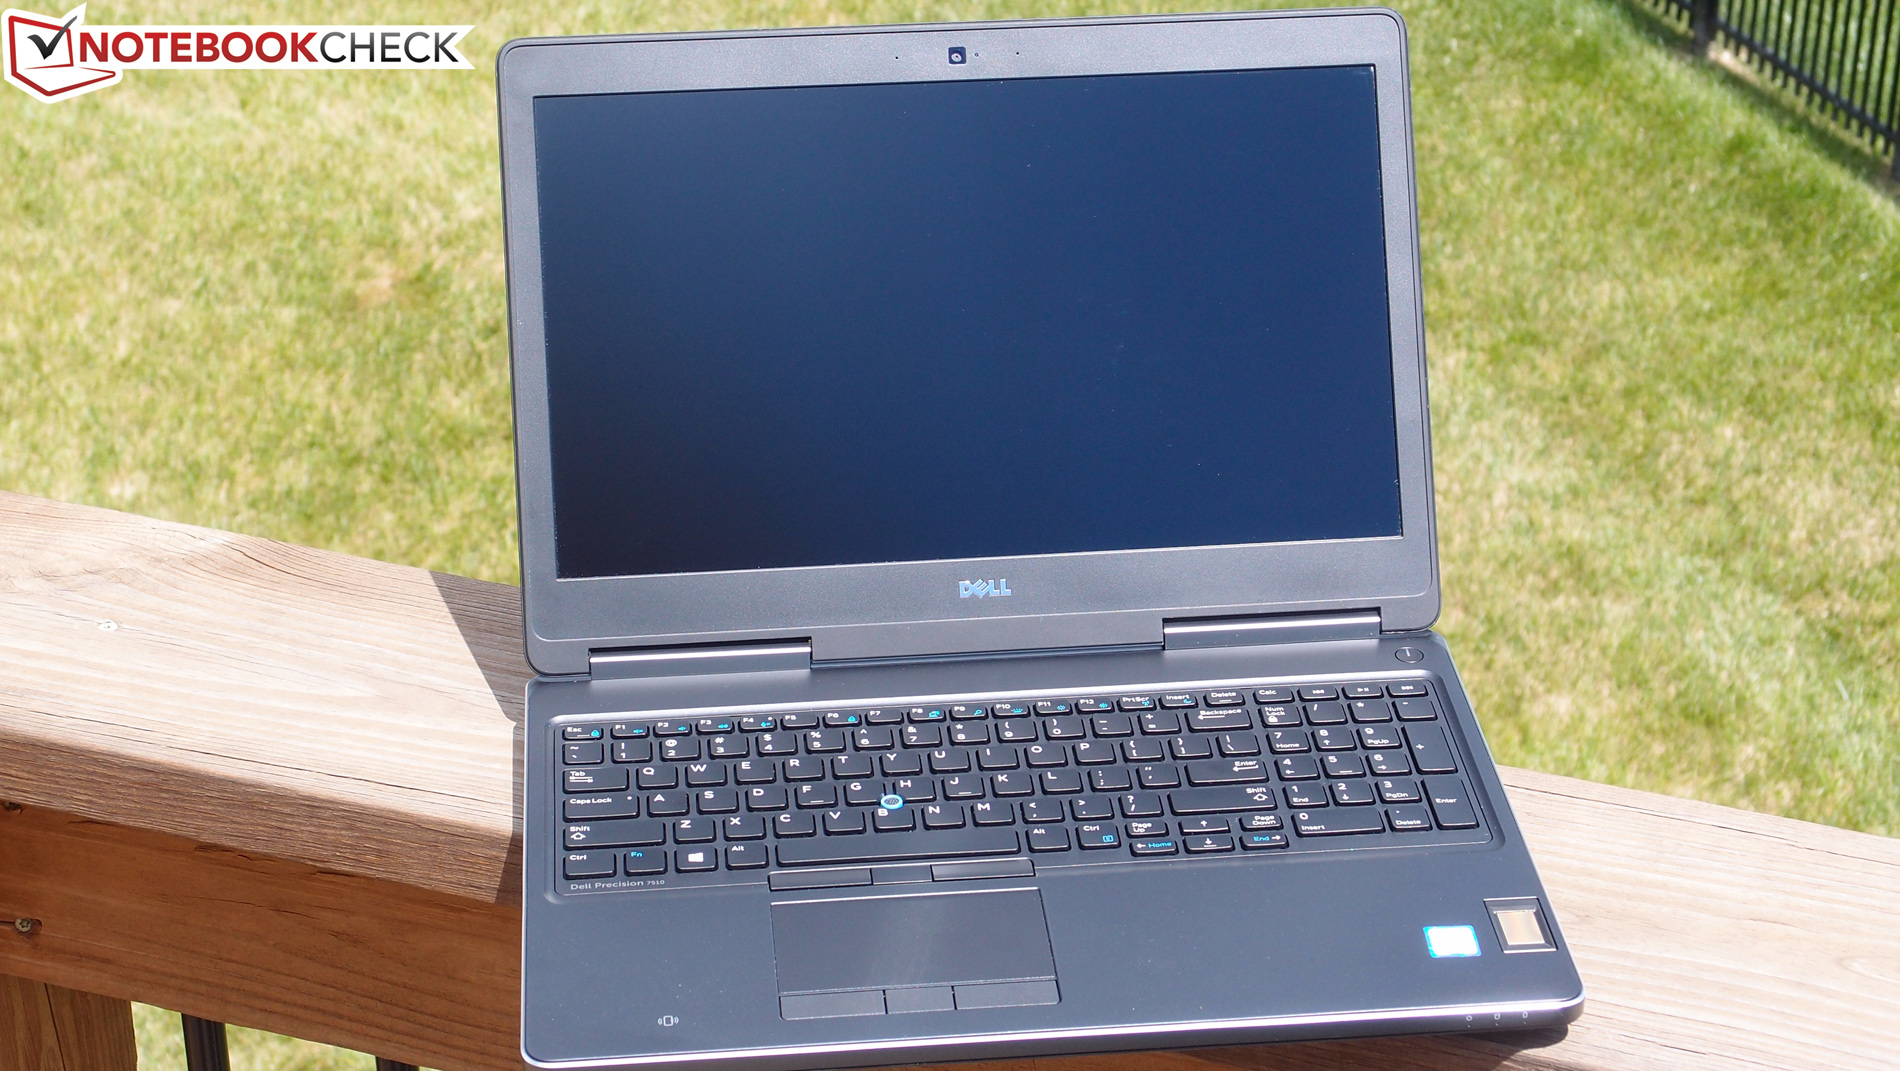
Jakten på den perfekta mobila arbetsstationen på 15,6-tum är inte lätt. Nästan alla enheter i kategorin har åtminstone en eller två betydande brister. Precision 7510 är inget undantag från regeln, men har möjligen de mest praktiska kompromisserna av de maskiner vi testat.
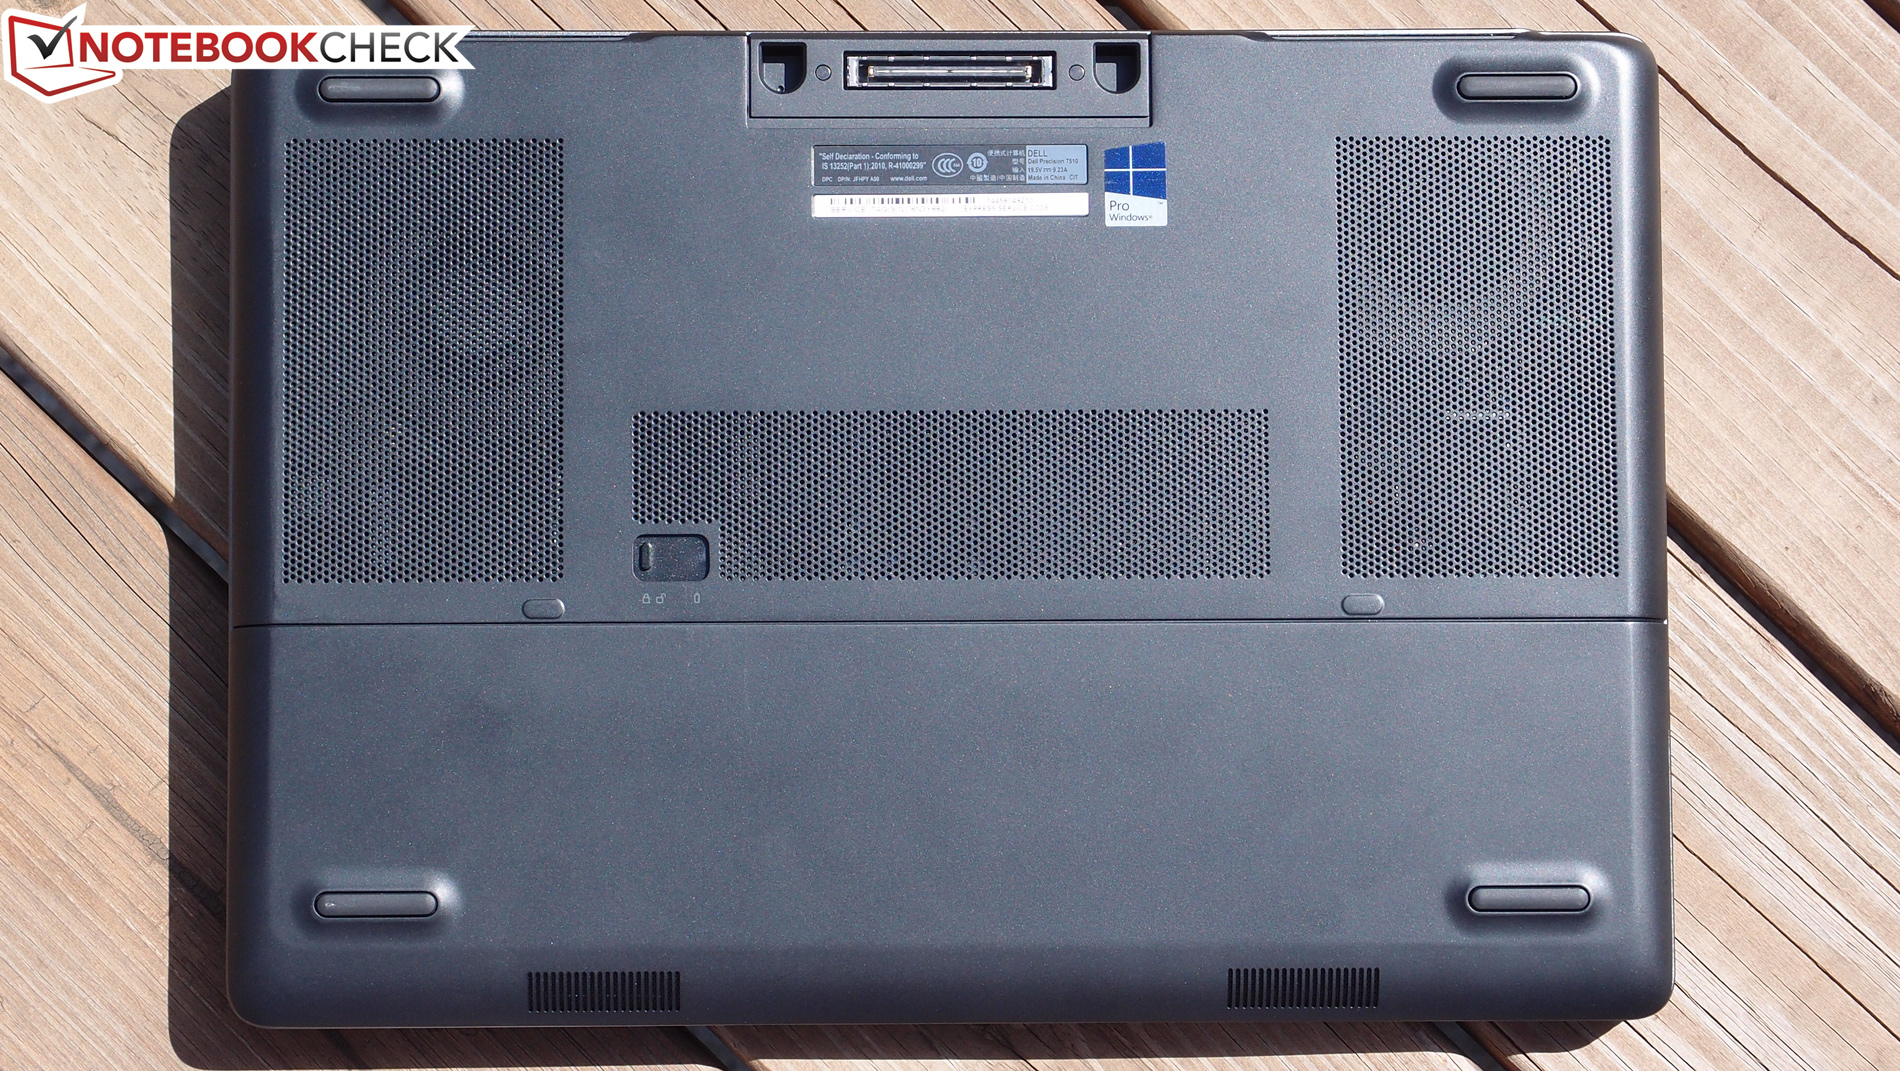
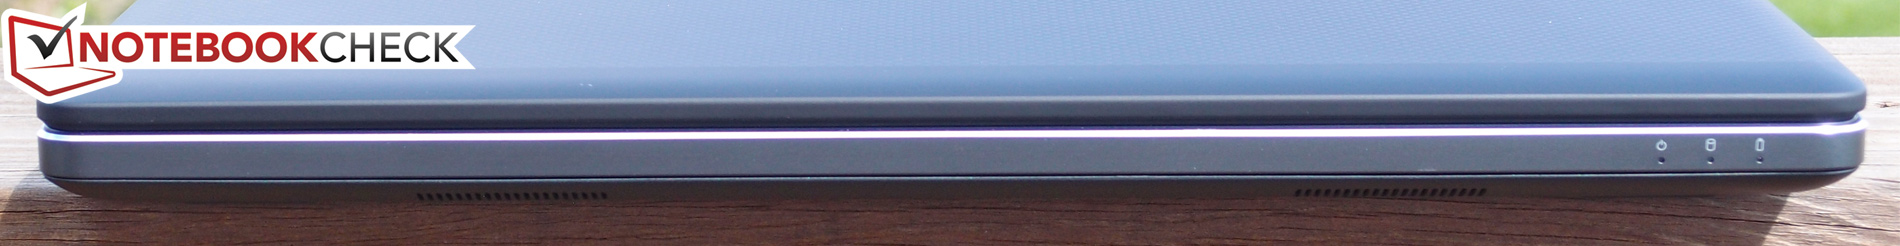
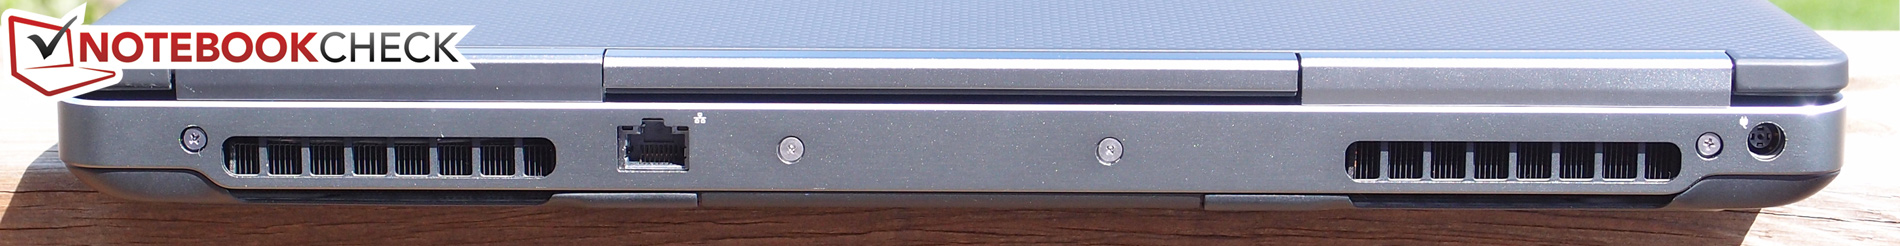
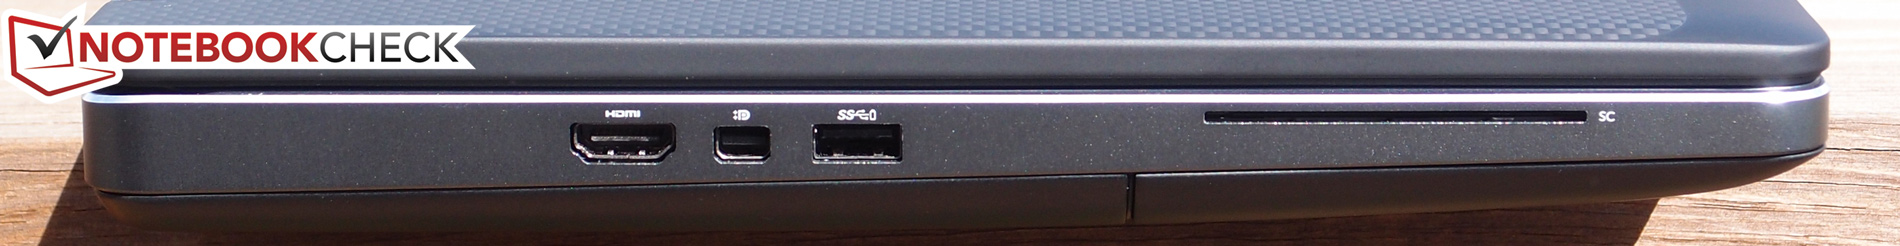
Först det positiva: 7510:ans chassi är en genomtänkt (om än konservativ) utveckling av M4800 utan några större kompromisser. Portutbudet är fortfarande bra och stabiliteten (inklusive gångjärn, vridstyvhet och upplevd hållbarhet) verkar bra, även om skärmlocket är mindre vridstyvt.
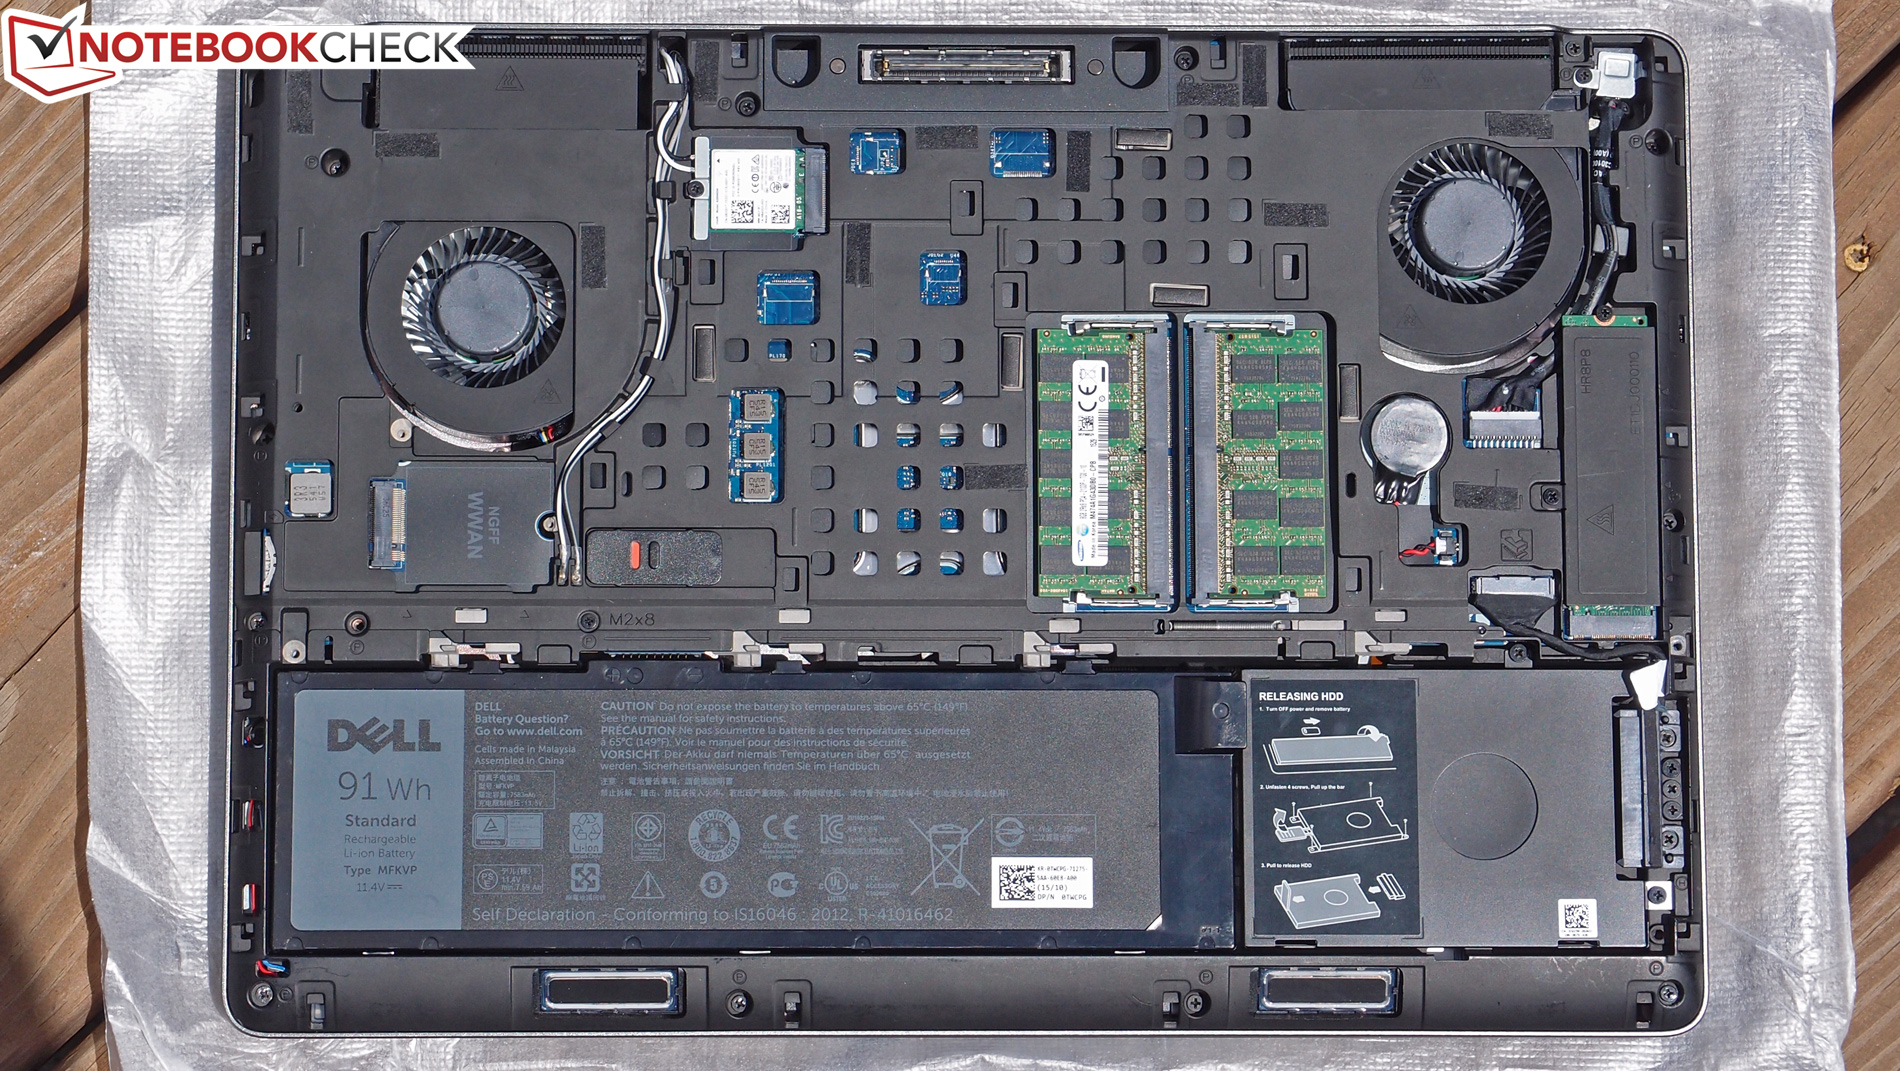
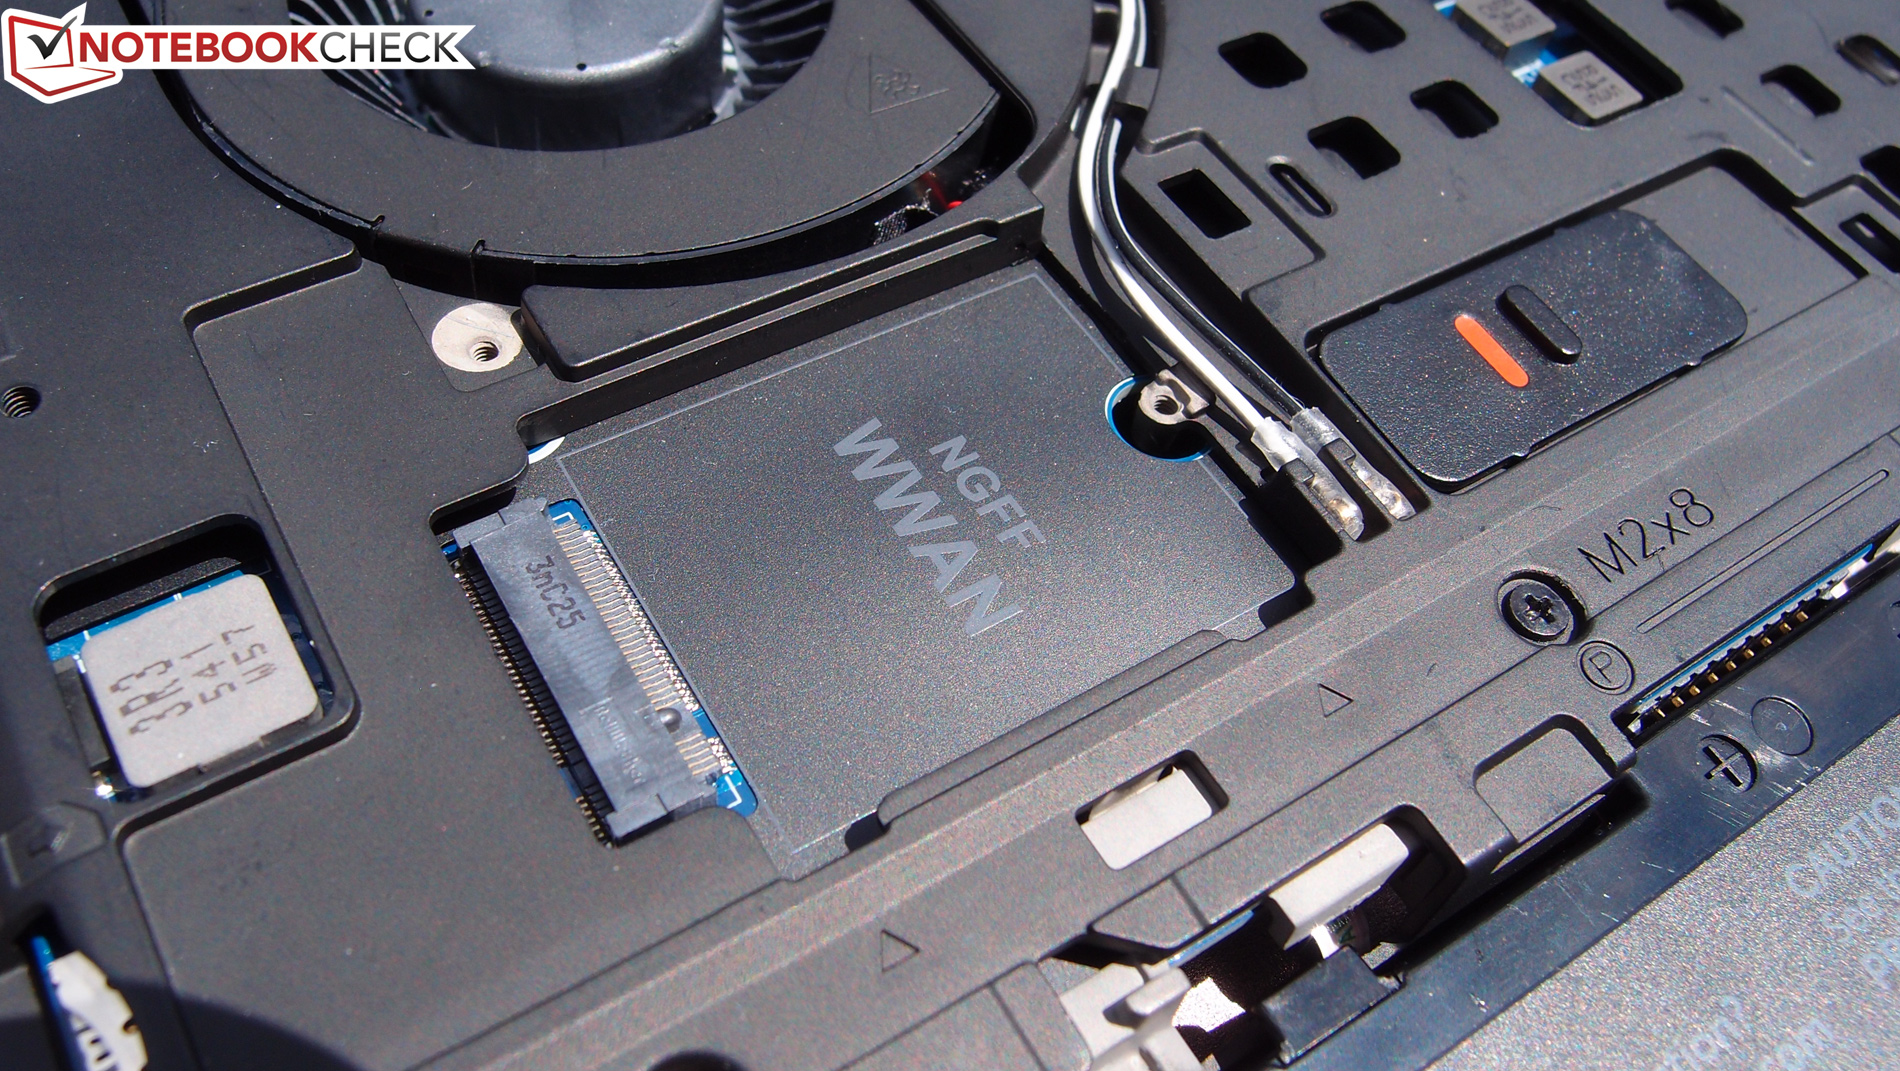
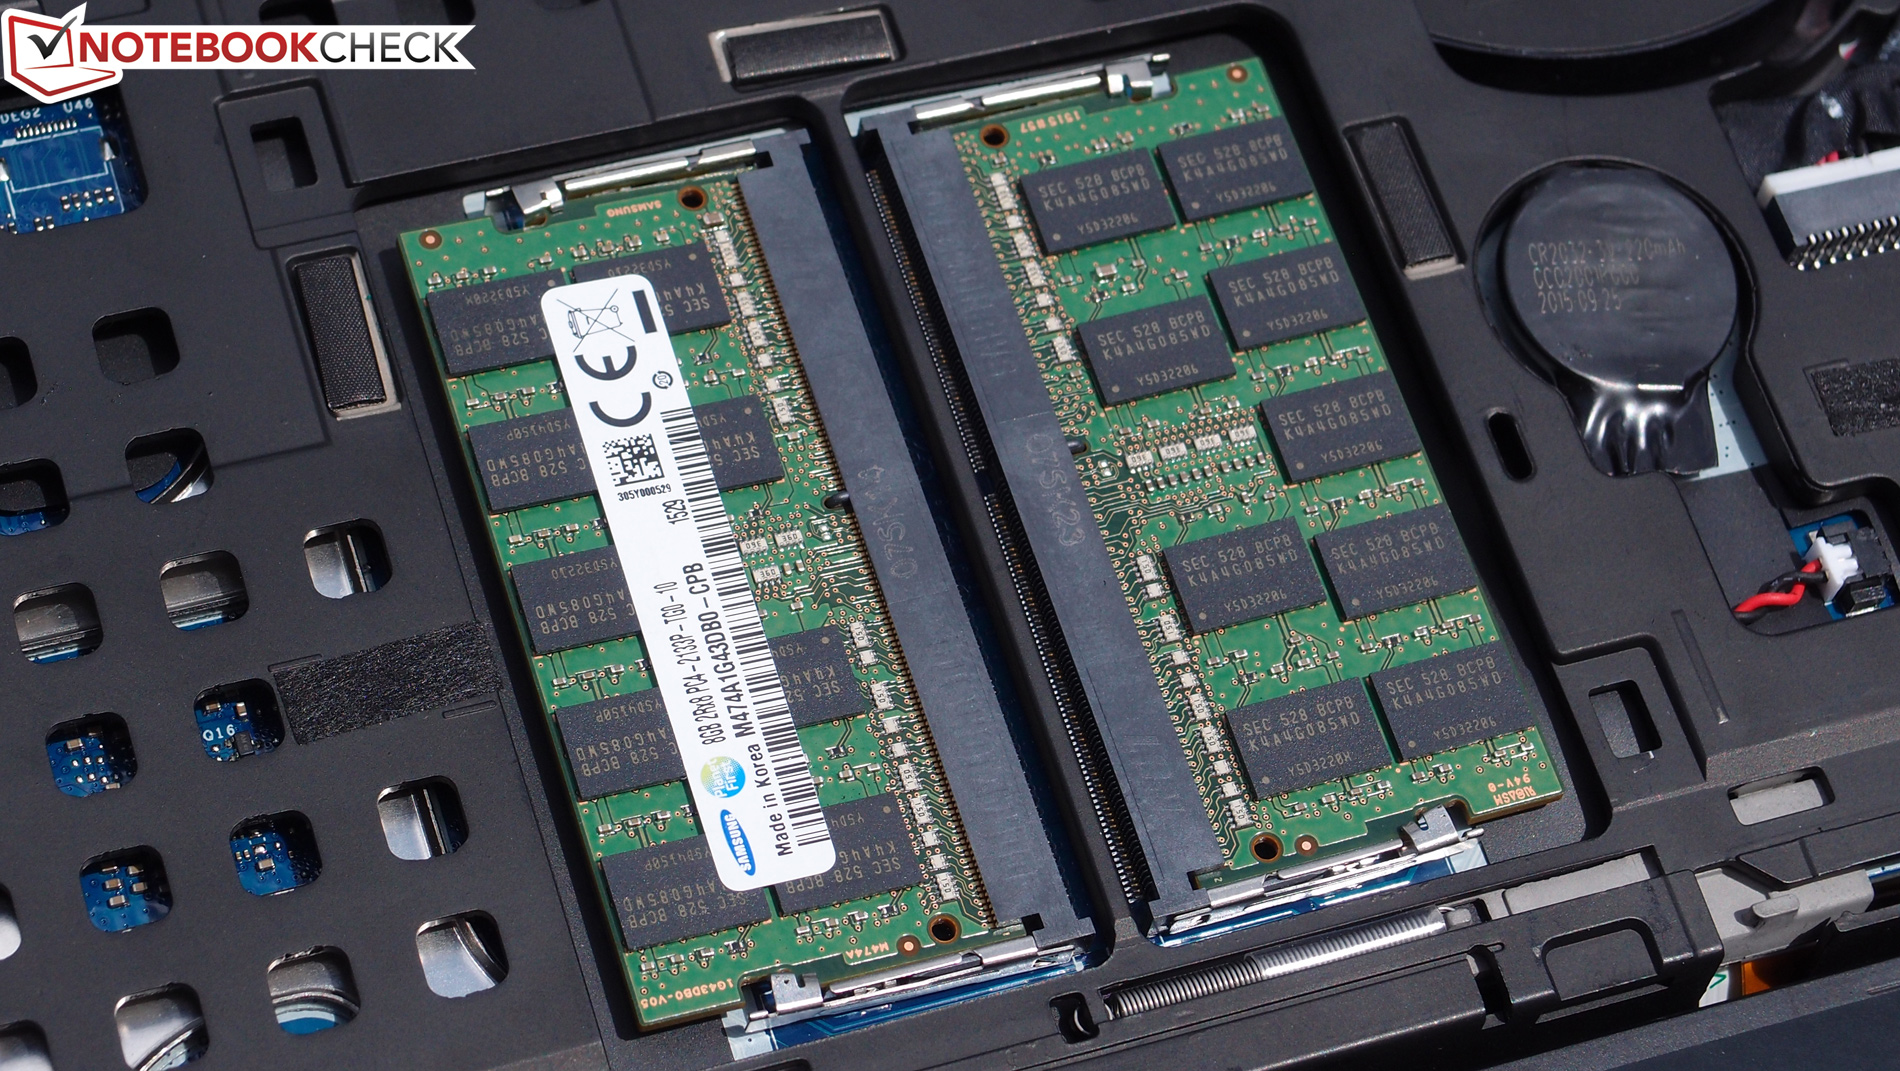
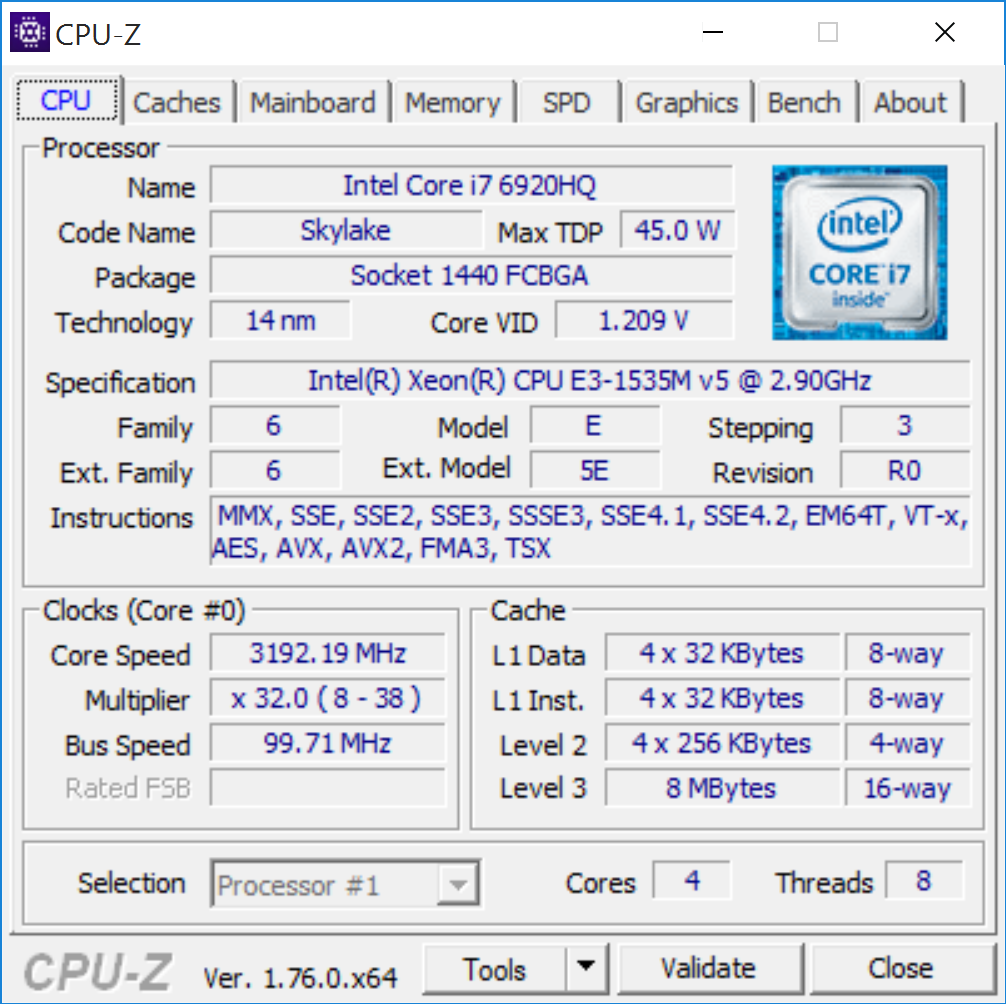
Datorn är enkel att underhålla – nästan alla viktiga komponenter kan enkelt nås via den undre luckan. Prestandan är i de flesta fall i toppklass, med maximal CPU-hastighet oavsett energisparläge, en kapabel professionell GPU i mellanklassen och fantastisk lagringsprestanda – förutsatt att AHCI-gränssnittet är aktiverat i datorns firmware. 4K-skärmen har bra kontrast och utmärkt färgåtergivning (fabrikskalibrerad), även om ljusstyrkan är något låg
De tidigare nämnda kompromisserna gäller främst batteritiden. Trots att den är utrustad med ett gigantiskt batteri på 91 Wh halkar Precision 7510 efter många av konkurrenterna. Andra nackdelar värda att notera är GPU-strypningen under kombinerad CPU/GPU-belastning och undermåliga högtalare. Slutligen är processen att byta från RAID- till AHCI-läge för att få ut maximal lagringsprestanda krångligt, men med tanke på prestandaskillnaden är det värt besväret.
Dell Precision 7510 (4K IGZO)
- 06/19/2016 v5.1 (old)
Steve Schardein
Price comparison
