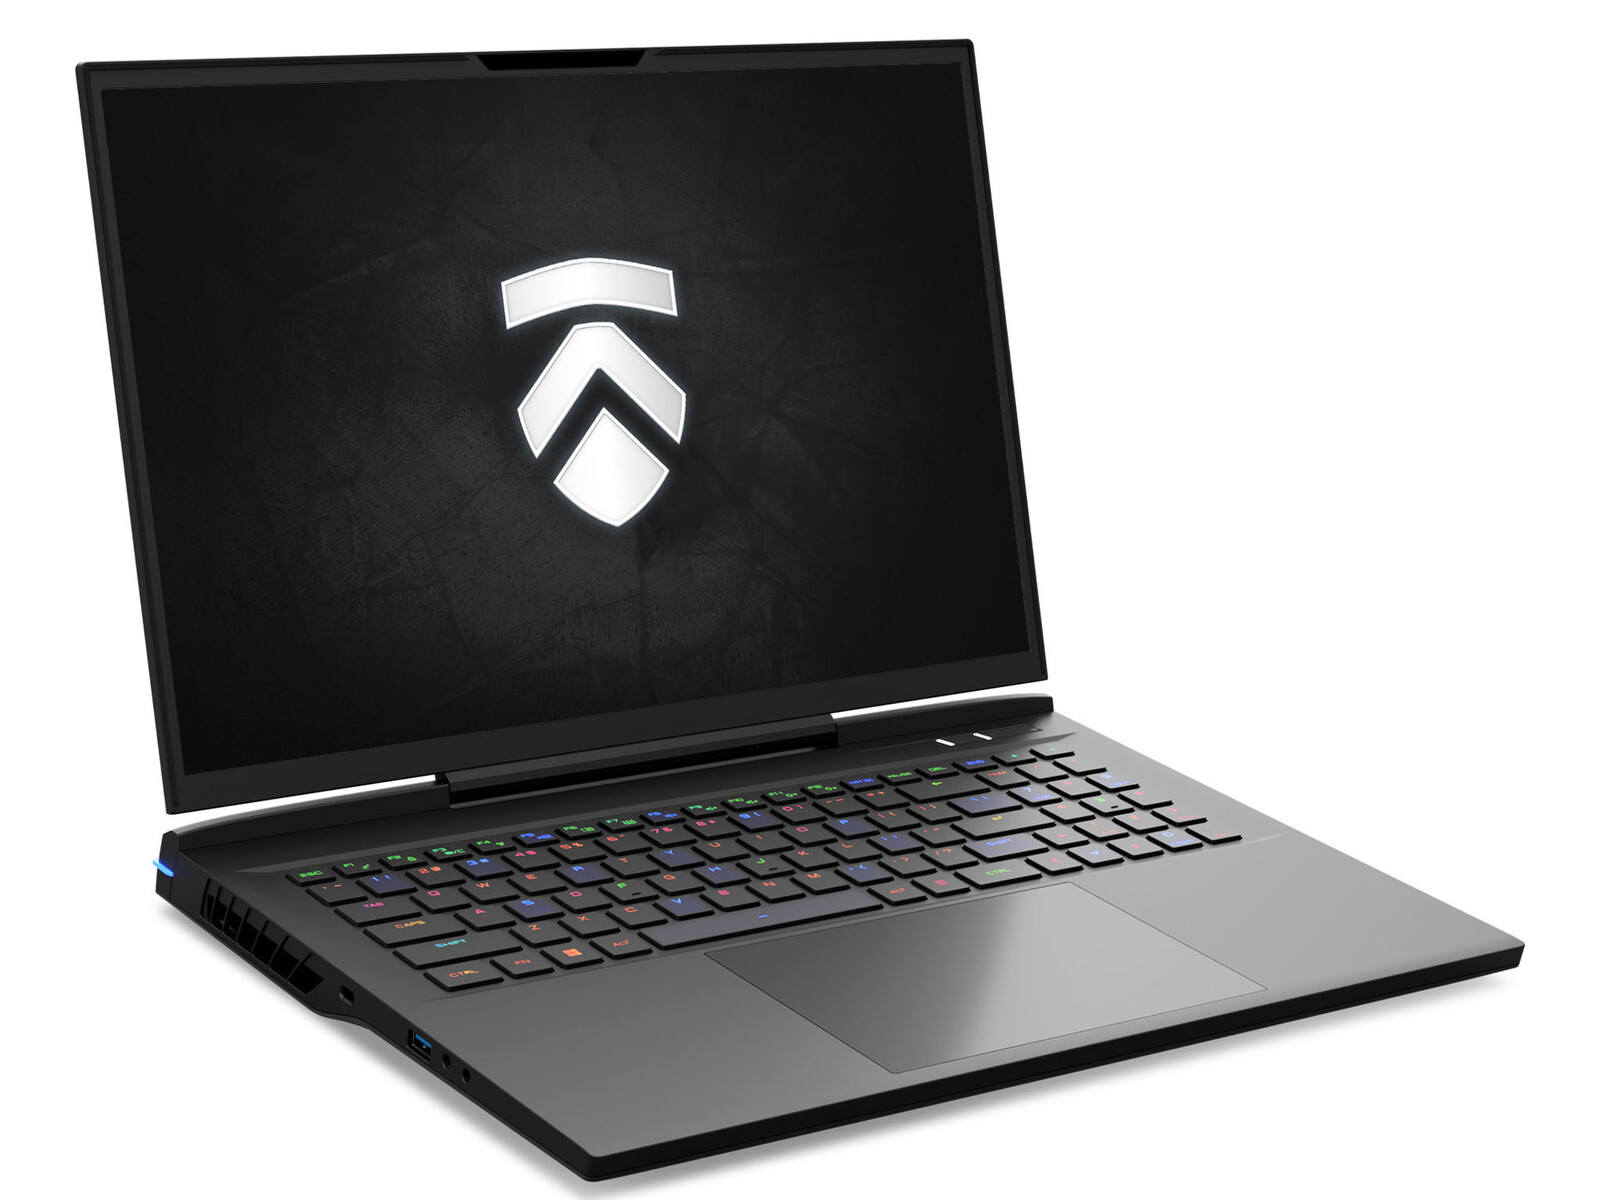
Eluktronics Mech-17 GP2 laptop recension: MSI GT77 Titan prestanda utan storlek
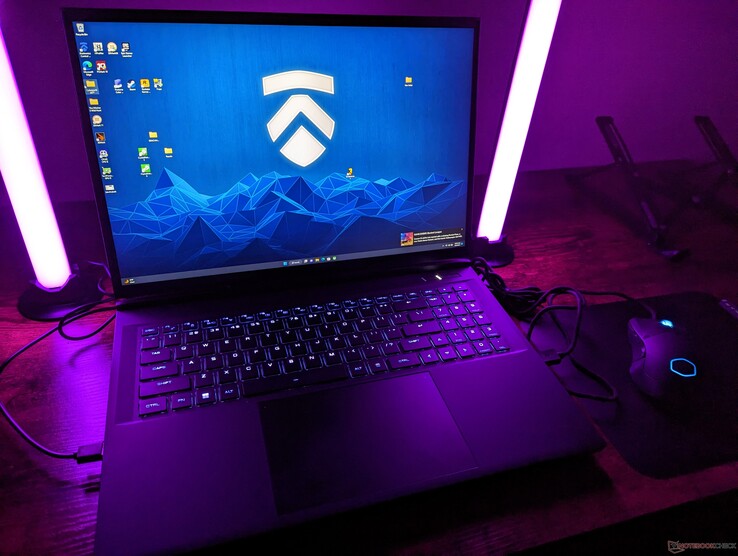
Eluktronics Mech-17 GP2 ersätter förra årets Mech-17 GP genom att byta ut Intel 12th gen och Nvidia Ampere mot Intel 13th gen respektive Nvidia Ada Lovelace. Den är anmärkningsvärd för att den erbjuder CPU:er i Core HX-serien och 175 W GeForce RTX 4090-grafik trots det lilla fotavtrycket i förhållande till andra bärbara 17-tums gamingdatorer.
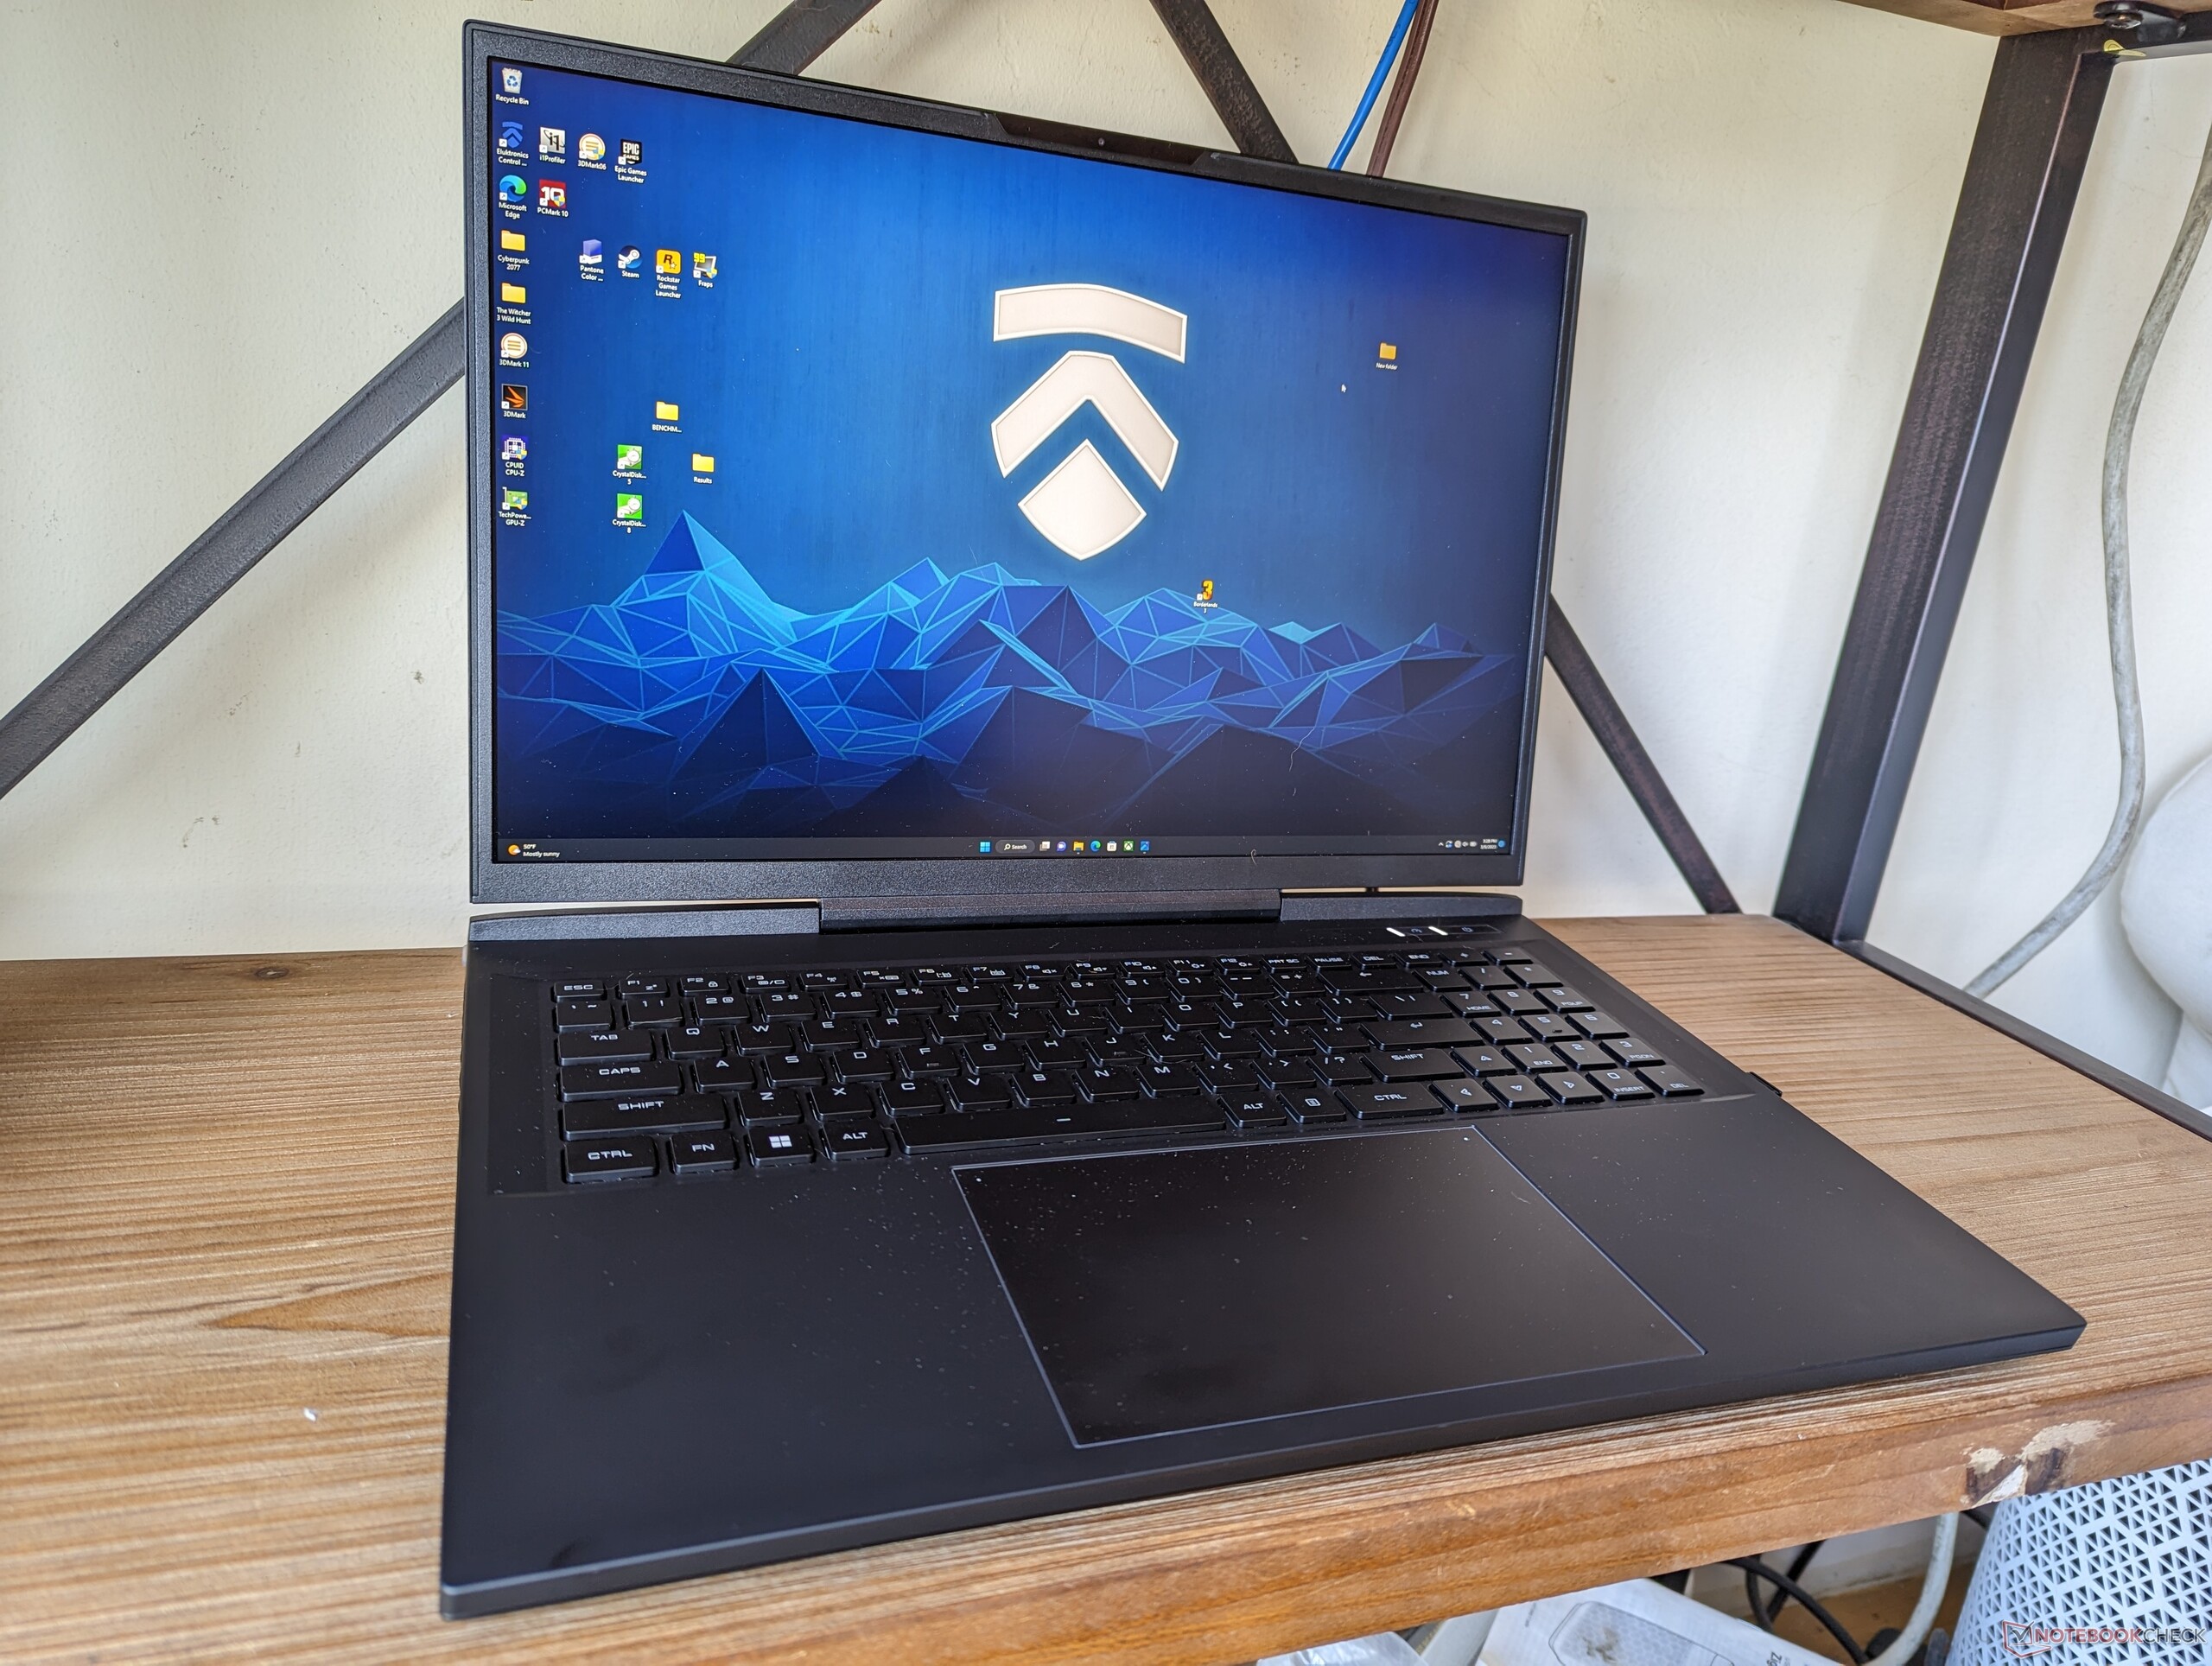
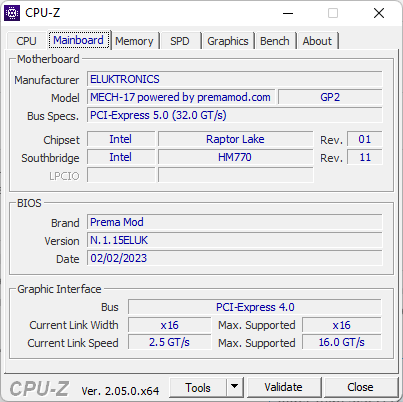
Mech-17 GP2 är baserad på en uppdaterad version av förra årets Uniwill-designade Schenker Neo 17 M22. Det är i huvudsak Neo 17 E23 fast under Eluktronics varumärke. Det finns flera viktiga förändringar på moderkortet i år som vi kommer att beskriva i detalj i våra analyser nedan. I övrigt är deras yttre design identisk och vi rekommenderar därför att du kollar in vår befintliga recension av Schenker Neo 17 M22 för att lära dig mer om de fysiska egenskaperna hos Mech-17 GP2.
Vår konfiguration i granskningen har konfigurerats fullt ut med Core i9-13900HX och RTX 4090 för cirka 3400 USD. Mindre SKU:er finns tillgängliga ner till RTX 4070, men alla alternativ kommer annars med samma CPU och 240 Hz 2560 x 1600 IPS-skärm.
Alternativ till Mech-17 GP2 inkluderar andra bärbara 17-tums gamingdatorer i toppklass som Razer Blade 17, Alienware m17 R5, Asus Zephyrus S17, eller MSI Titan GT77.
Fler recensioner av Eluktronics:
Potentiella konkurrenter i jämförelse
Gradering | Datum | Modell | Vikt | Höjd | Storlek | Upplösning | Pris |
|---|---|---|---|---|---|---|---|
| 89.9 % v7 (old) | 03/2023 | Eluktronics Mech-17 GP2 i9-13900HX, GeForce RTX 4090 Laptop GPU | 2.9 kg | 27 mm | 17.00" | 2560x1600 | |
| 87.6 % v7 (old) | 09/2022 | Schenker XMG Neo 17 M22 R9 6900HX, GeForce RTX 3080 Ti Laptop GPU | 2.8 kg | 27 mm | 17.00" | 2560x1600 | |
| 82.1 % v7 (old) | 02/2023 | MSI Katana 17 B13VFK i7-13620H, GeForce RTX 4060 Laptop GPU | 2.8 kg | 25.2 mm | 17.30" | 1920x1080 | |
| 89 % v7 (old) | 02/2023 | MSI Titan GT77 HX 13VI i9-13950HX, GeForce RTX 4090 Laptop GPU | 3.5 kg | 23 mm | 17.30" | 3840x2160 | |
| 86.1 % v7 (old) | 01/2023 | Alienware m17 R5 (R9 6900HX, RX 6850M XT) R9 6900HX, Radeon RX 6850M XT | 3.4 kg | 26.7 mm | 17.00" | 3840x2160 | |
| 91.4 % v7 (old) | 02/2023 | Razer Blade 18 RTX 4070 i9-13950HX, GeForce RTX 4070 Laptop GPU | 3 kg | 21.9 mm | 18.00" | 2560x1600 |
Fall
SD-kortläsare
SD-kortläsaren är långsam i förhållande till modellens höga pris. Razer Blade 18 och Dell XPS-serien har 2x till 3x snabbare kortläsare.
| SD Card Reader | |
| average JPG Copy Test (av. of 3 runs) | |
| Razer Blade 18 RTX 4070 (Angelibird AV Pro V60) | |
| MSI Titan GT77 HX 13VI (Angelibird AV Pro V60) | |
| Eluktronics Mech-17 GP2 (Angelibird AV Pro V60) | |
| Schenker XMG Neo 17 M22 (AV PRO microSD 128 GB V60) | |
| maximum AS SSD Seq Read Test (1GB) | |
| Razer Blade 18 RTX 4070 (Angelibird AV Pro V60) | |
| Eluktronics Mech-17 GP2 (Angelibird AV Pro V60) | |
| MSI Titan GT77 HX 13VI (Angelibird AV Pro V60) | |
Kommunikation
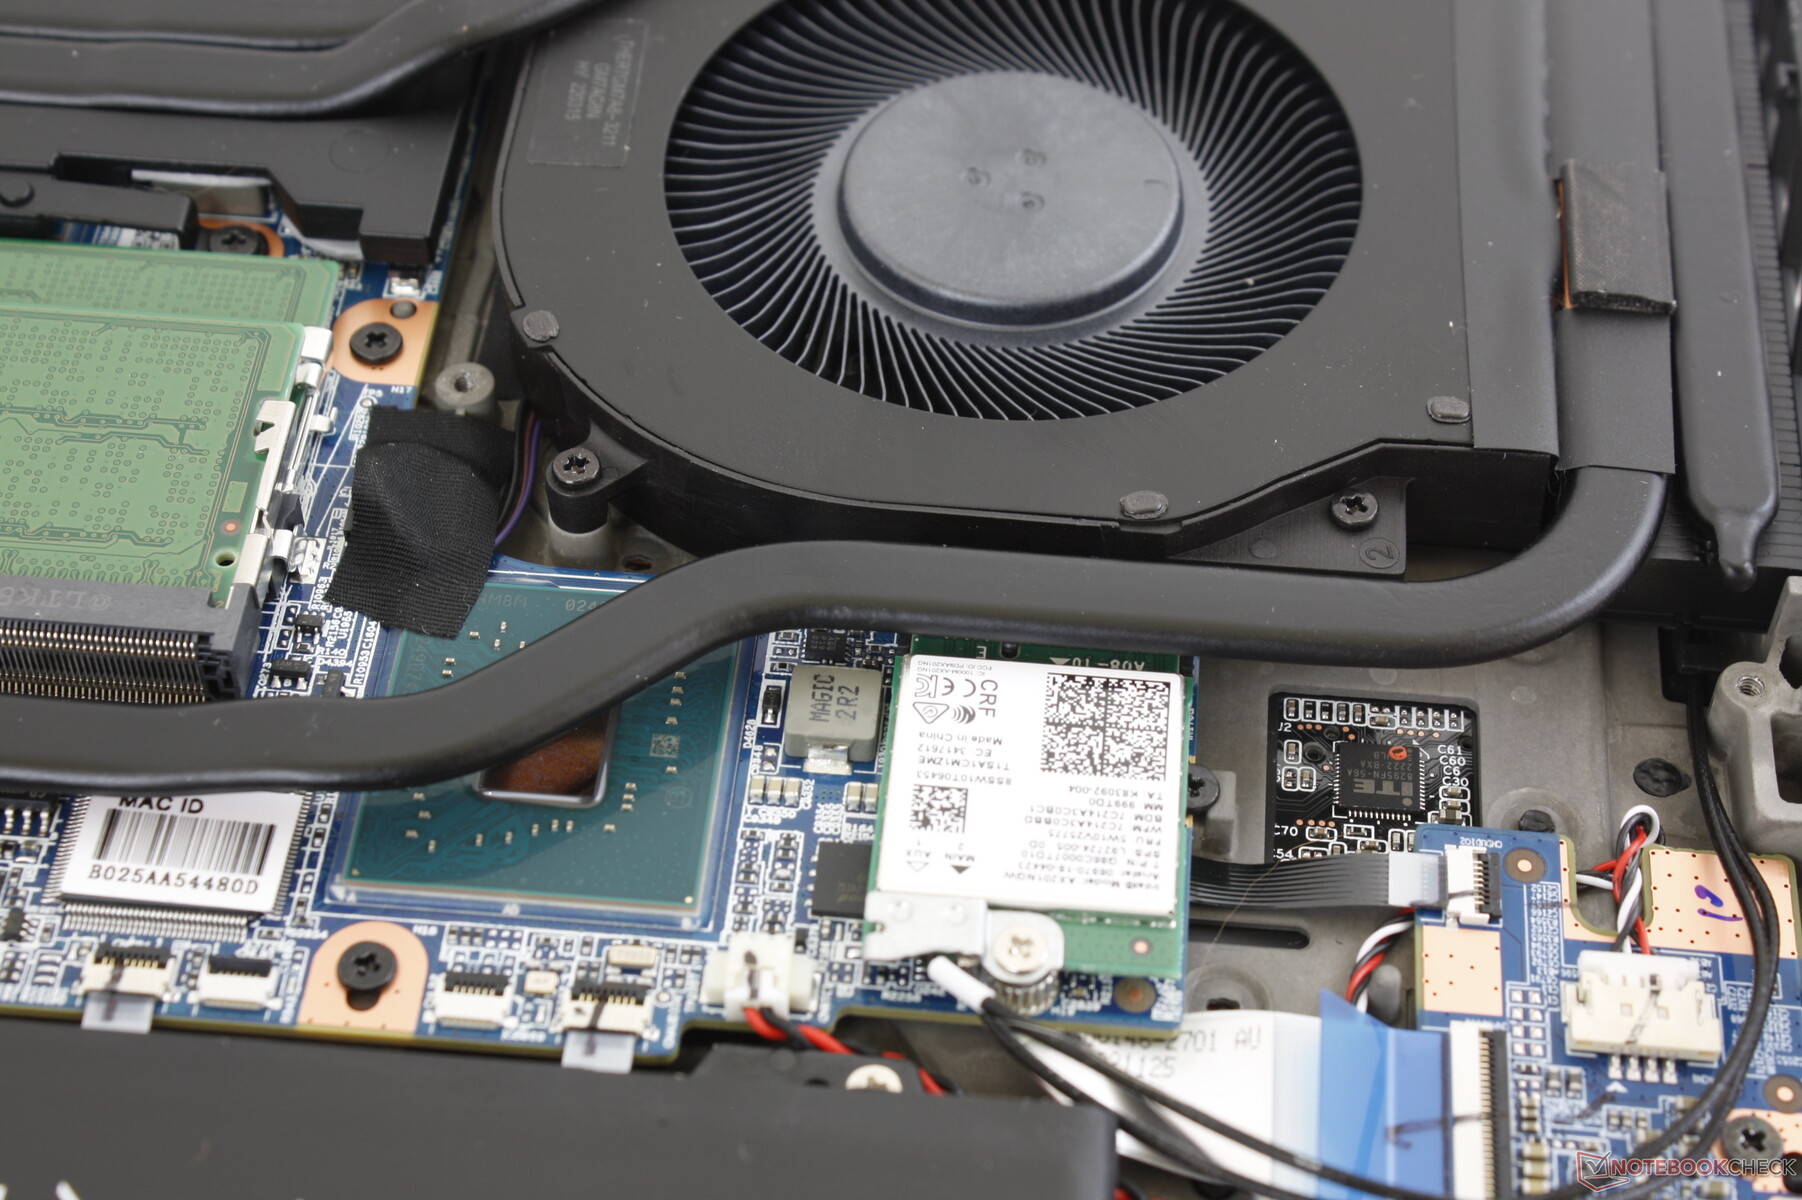
En Intel AX201 är standard för Wi-Fi 6 och Bluetooth 5.2. Vi hade dock förväntat oss en AX210/211 för snabbare Wi-Fi 6E-hastigheter med tanke på systemets pris.
| Networking | |
| iperf3 transmit AXE11000 | |
| MSI Titan GT77 HX 13VI | |
| MSI Katana 17 B13VFK | |
| Eluktronics Mech-17 GP2 | |
| Razer Blade 18 RTX 4070 | |
| Alienware m17 R5 (R9 6900HX, RX 6850M XT) | |
| Schenker XMG Neo 17 M22 | |
| iperf3 receive AXE11000 | |
| MSI Katana 17 B13VFK | |
| MSI Titan GT77 HX 13VI | |
| Razer Blade 18 RTX 4070 | |
| Eluktronics Mech-17 GP2 | |
| Alienware m17 R5 (R9 6900HX, RX 6850M XT) | |
| Schenker XMG Neo 17 M22 | |
| iperf3 transmit AXE11000 6GHz | |
| Razer Blade 18 RTX 4070 | |
| iperf3 receive AXE11000 6GHz | |
| Razer Blade 18 RTX 4070 | |
Webbkamera
Webbkameran med 2 MP FHD och IR är standard för stöd för Hello. Det finns dock ingen sekretessbrytare eller slutare.


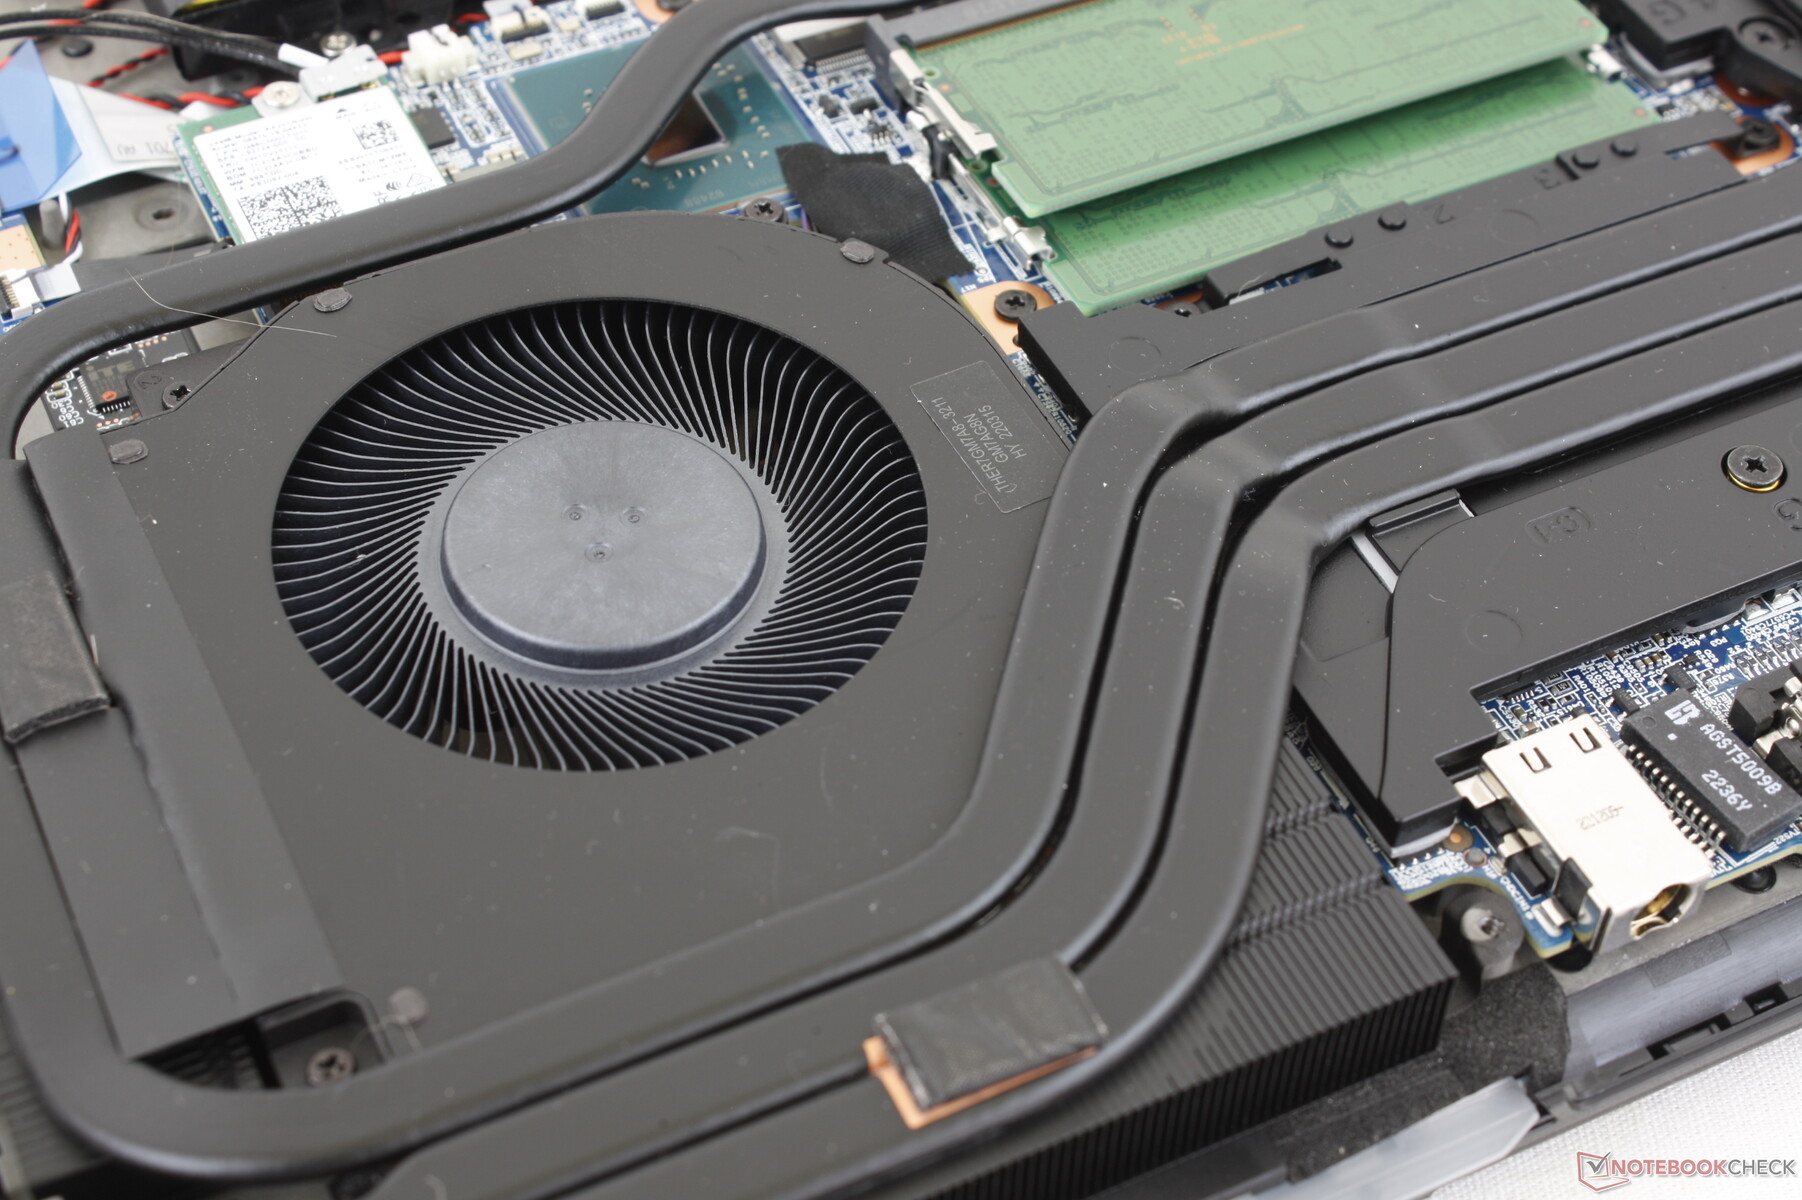
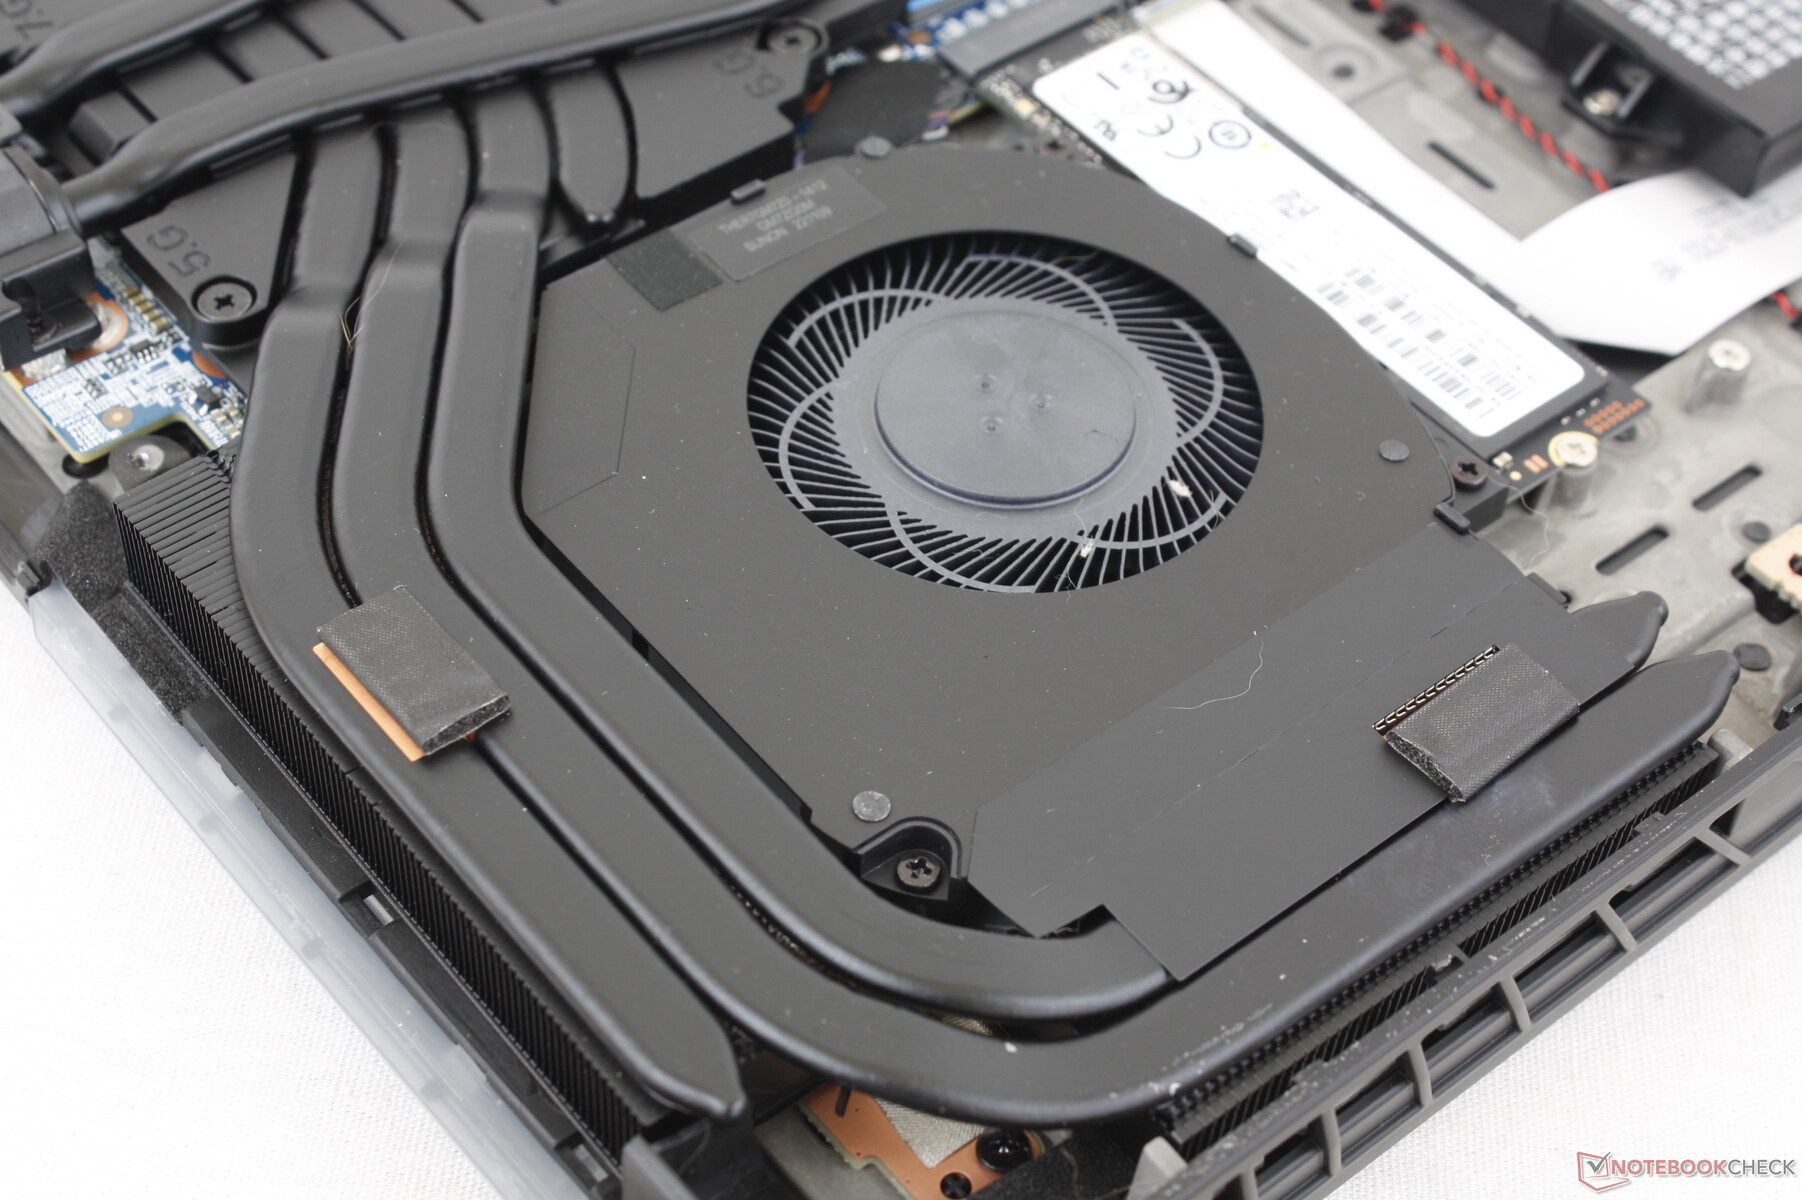
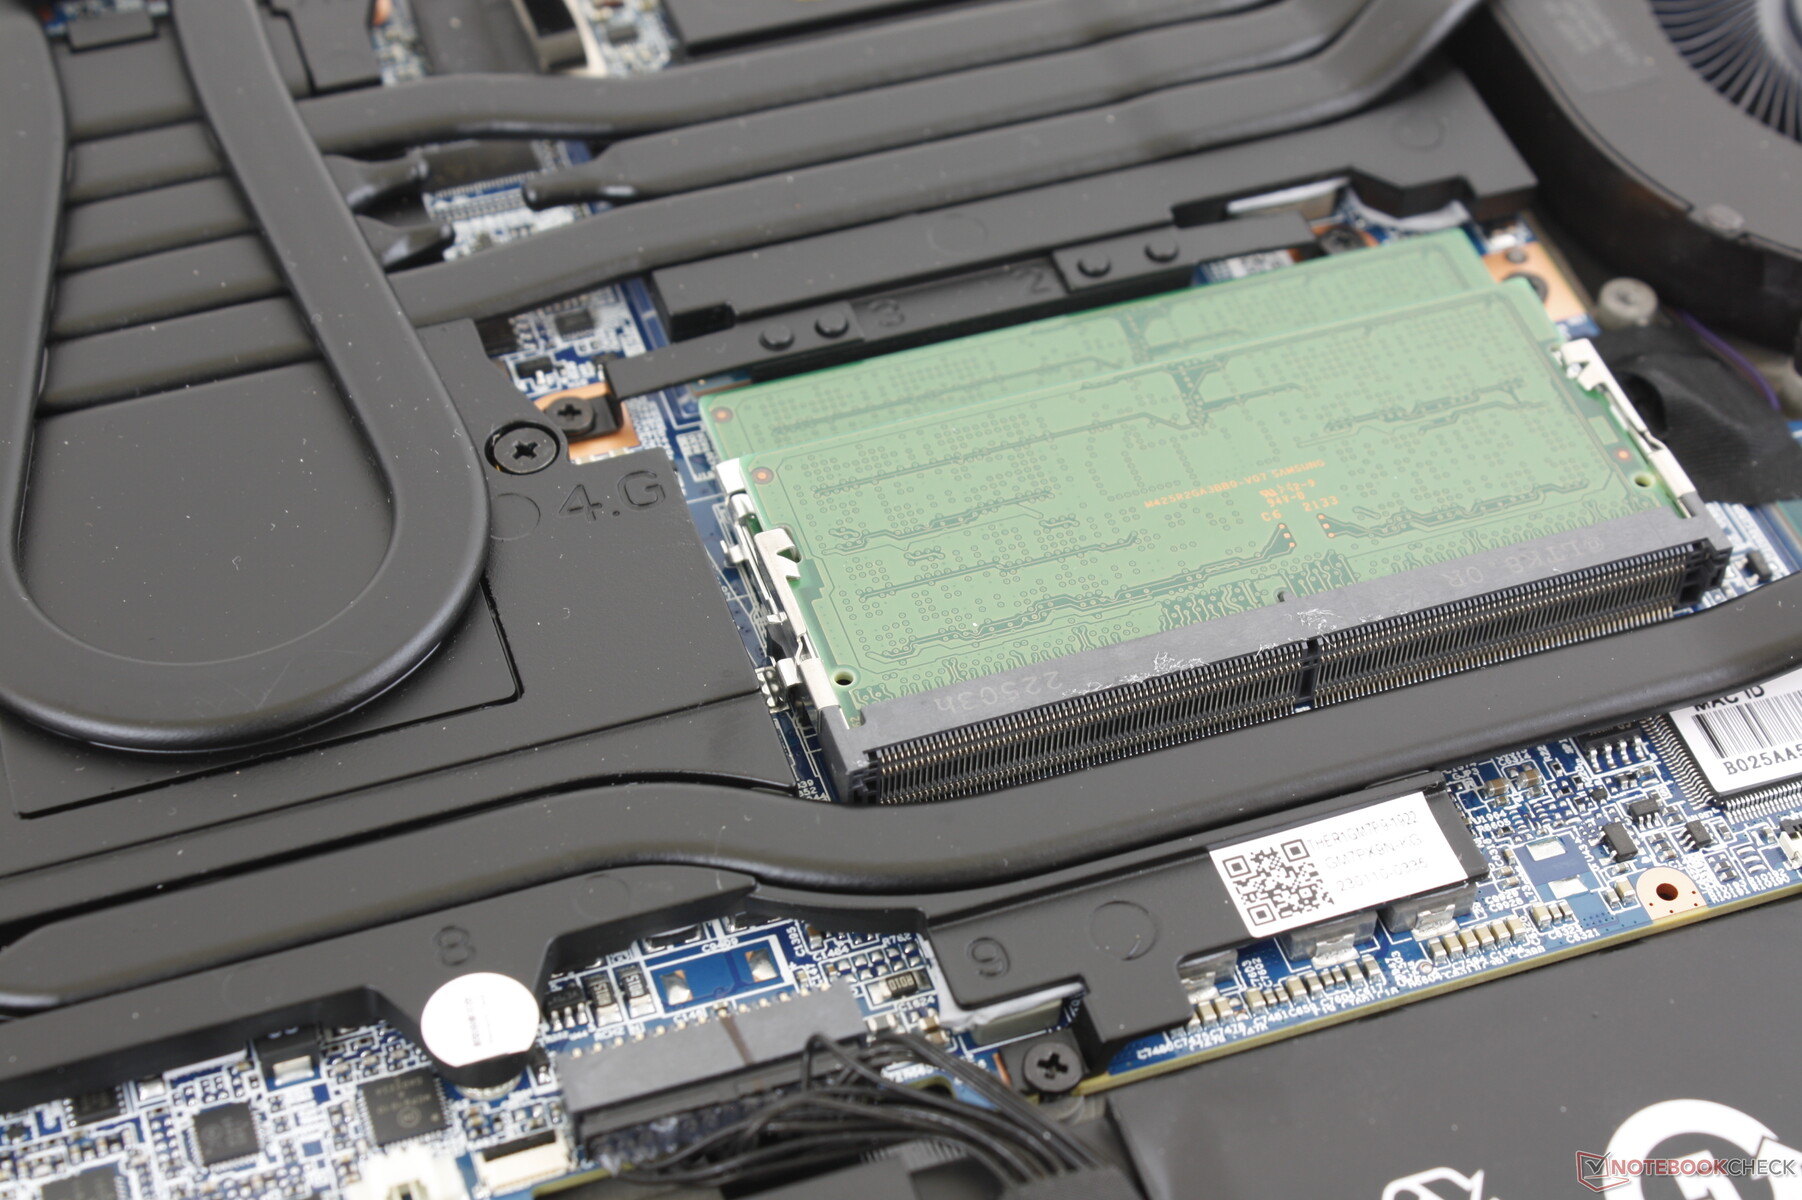
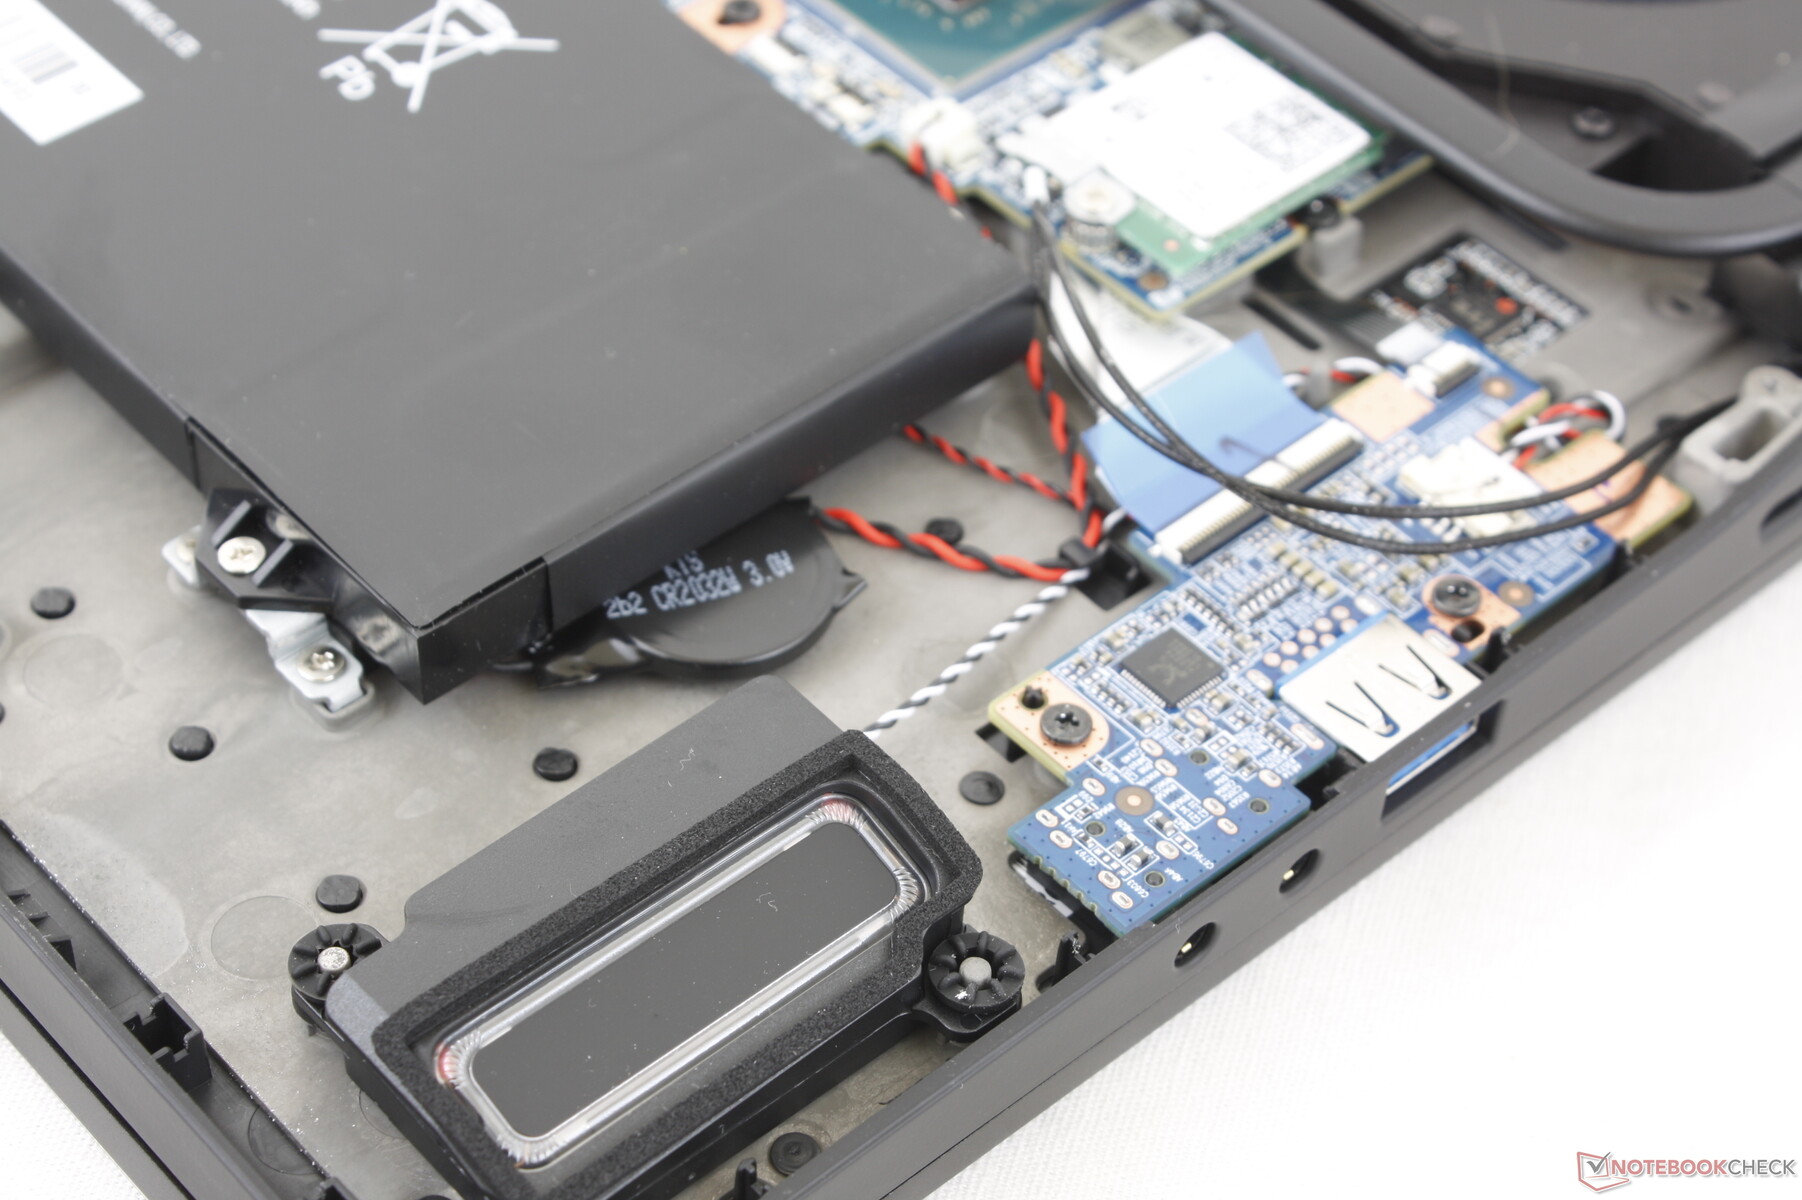
Underhåll
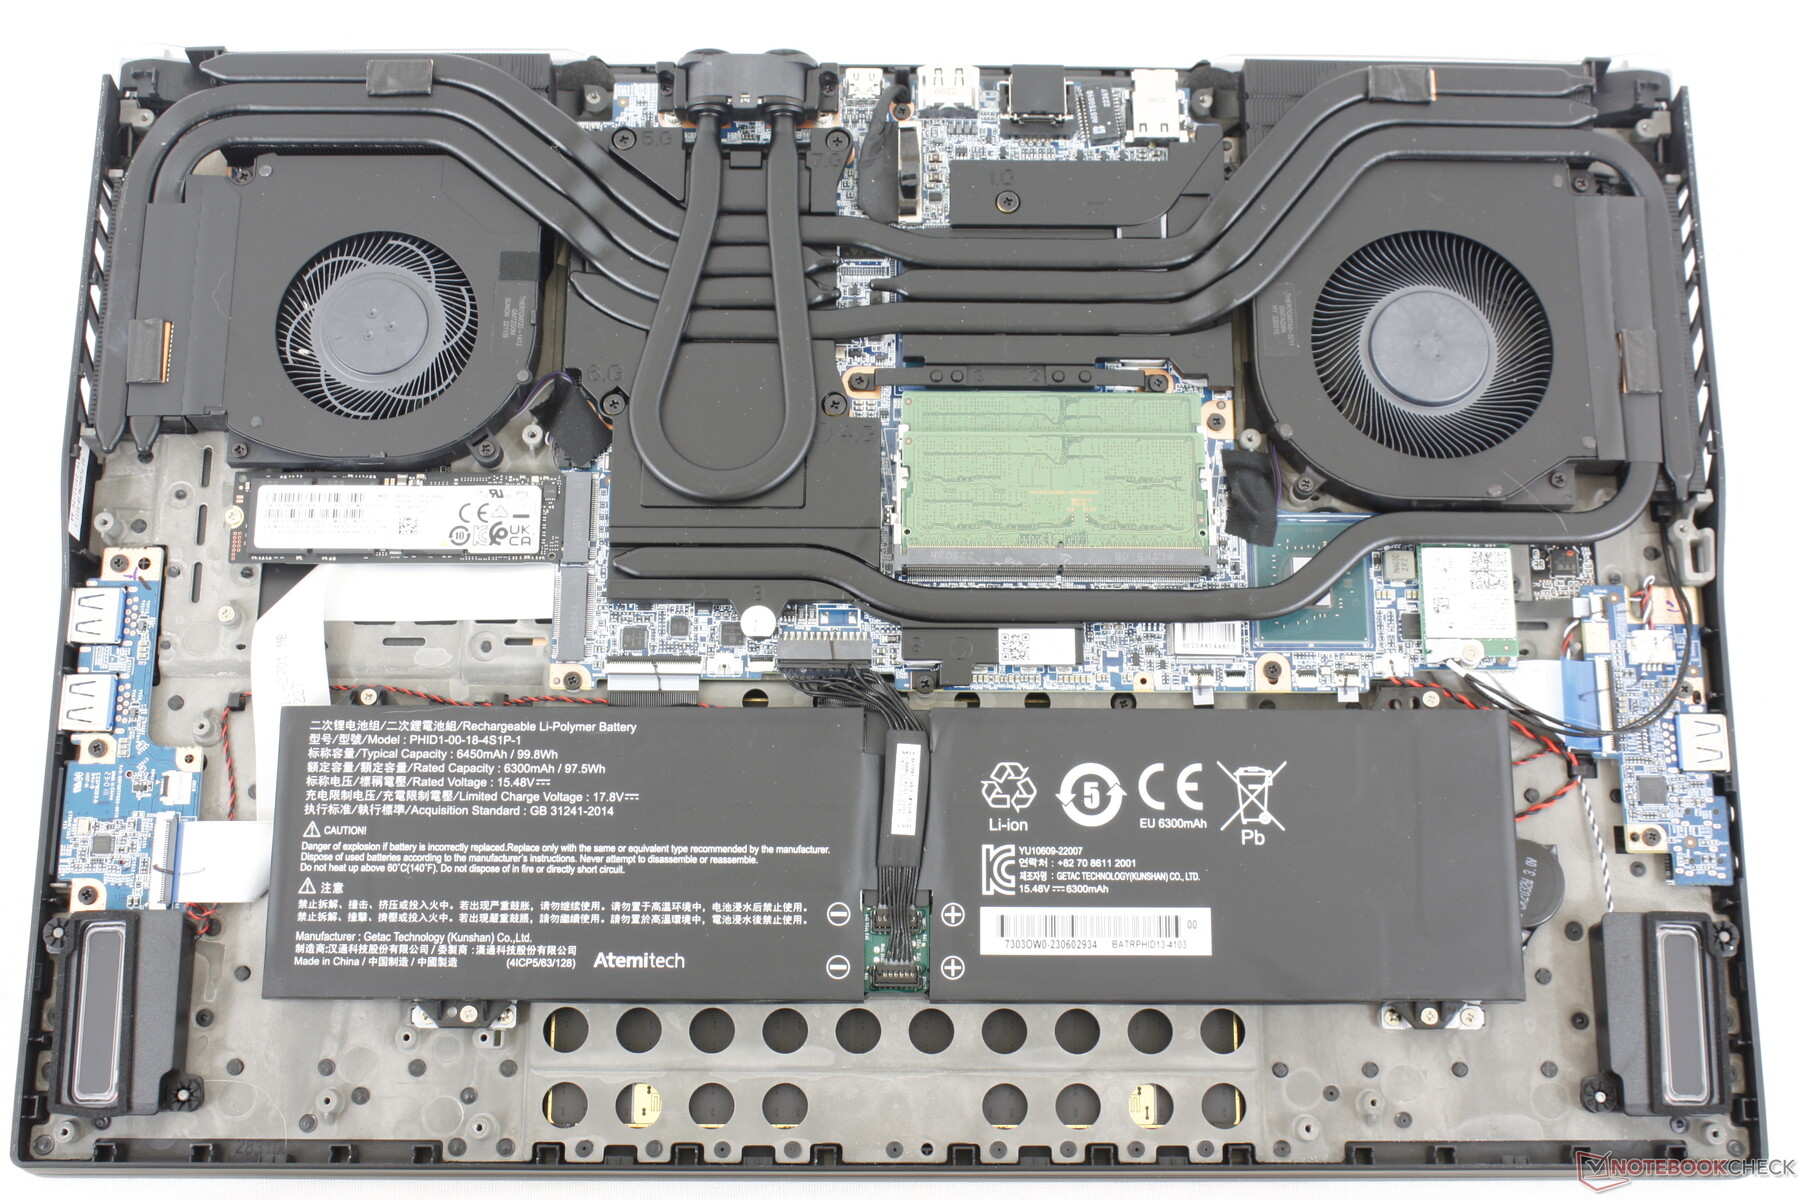
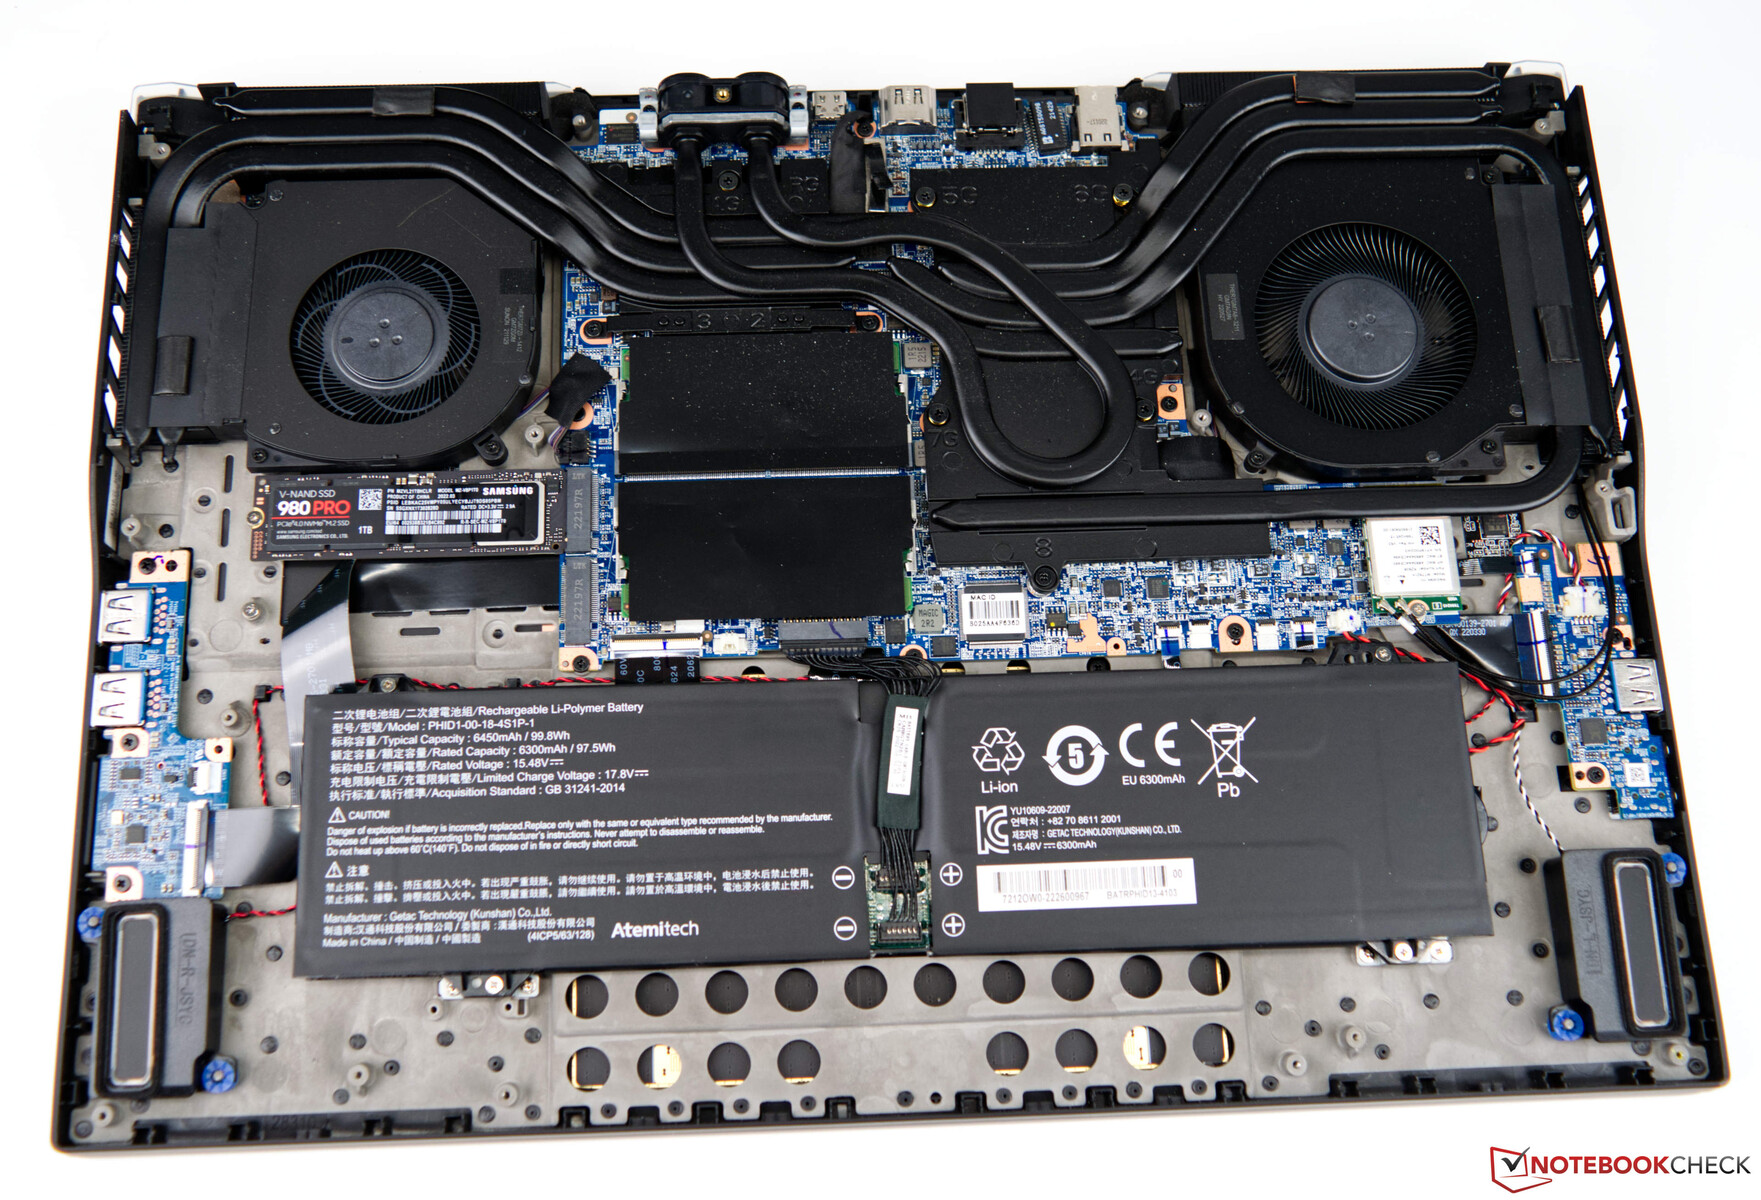
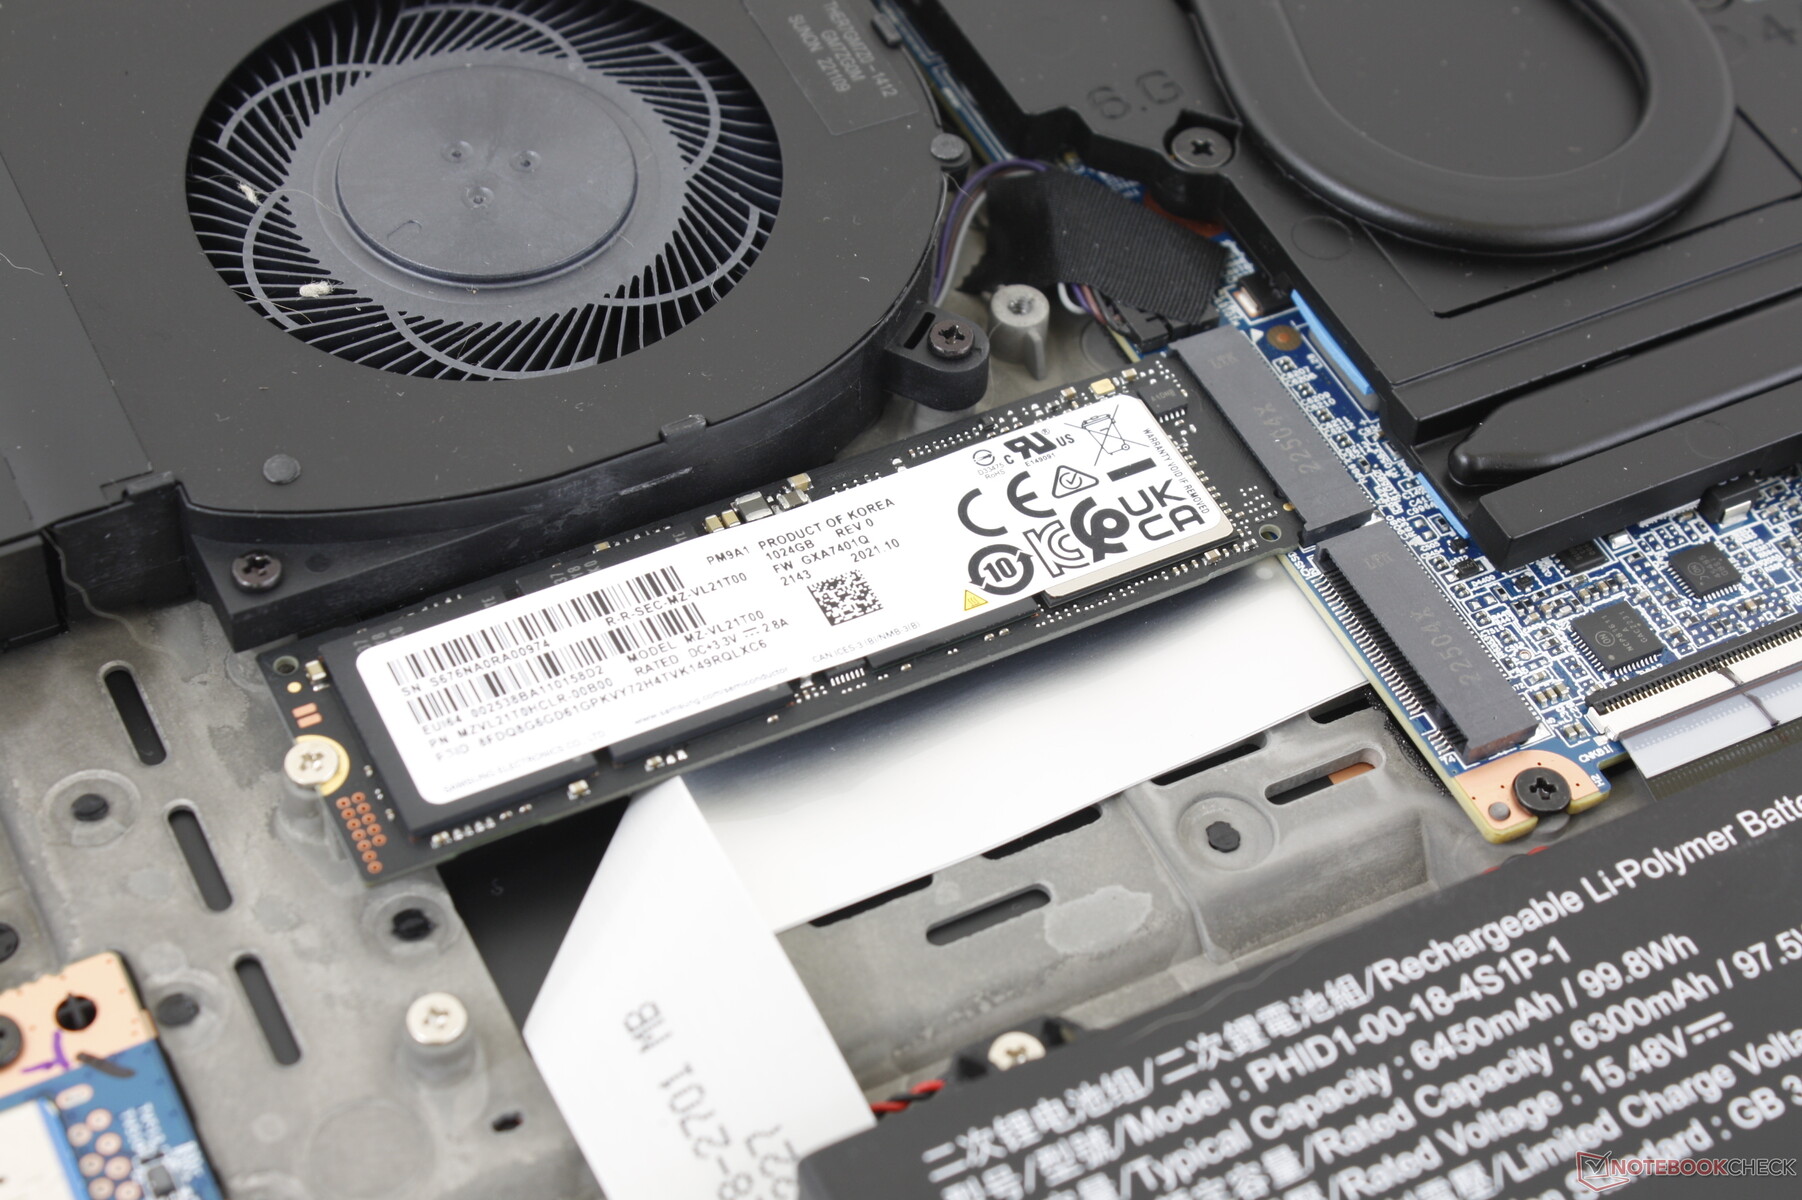
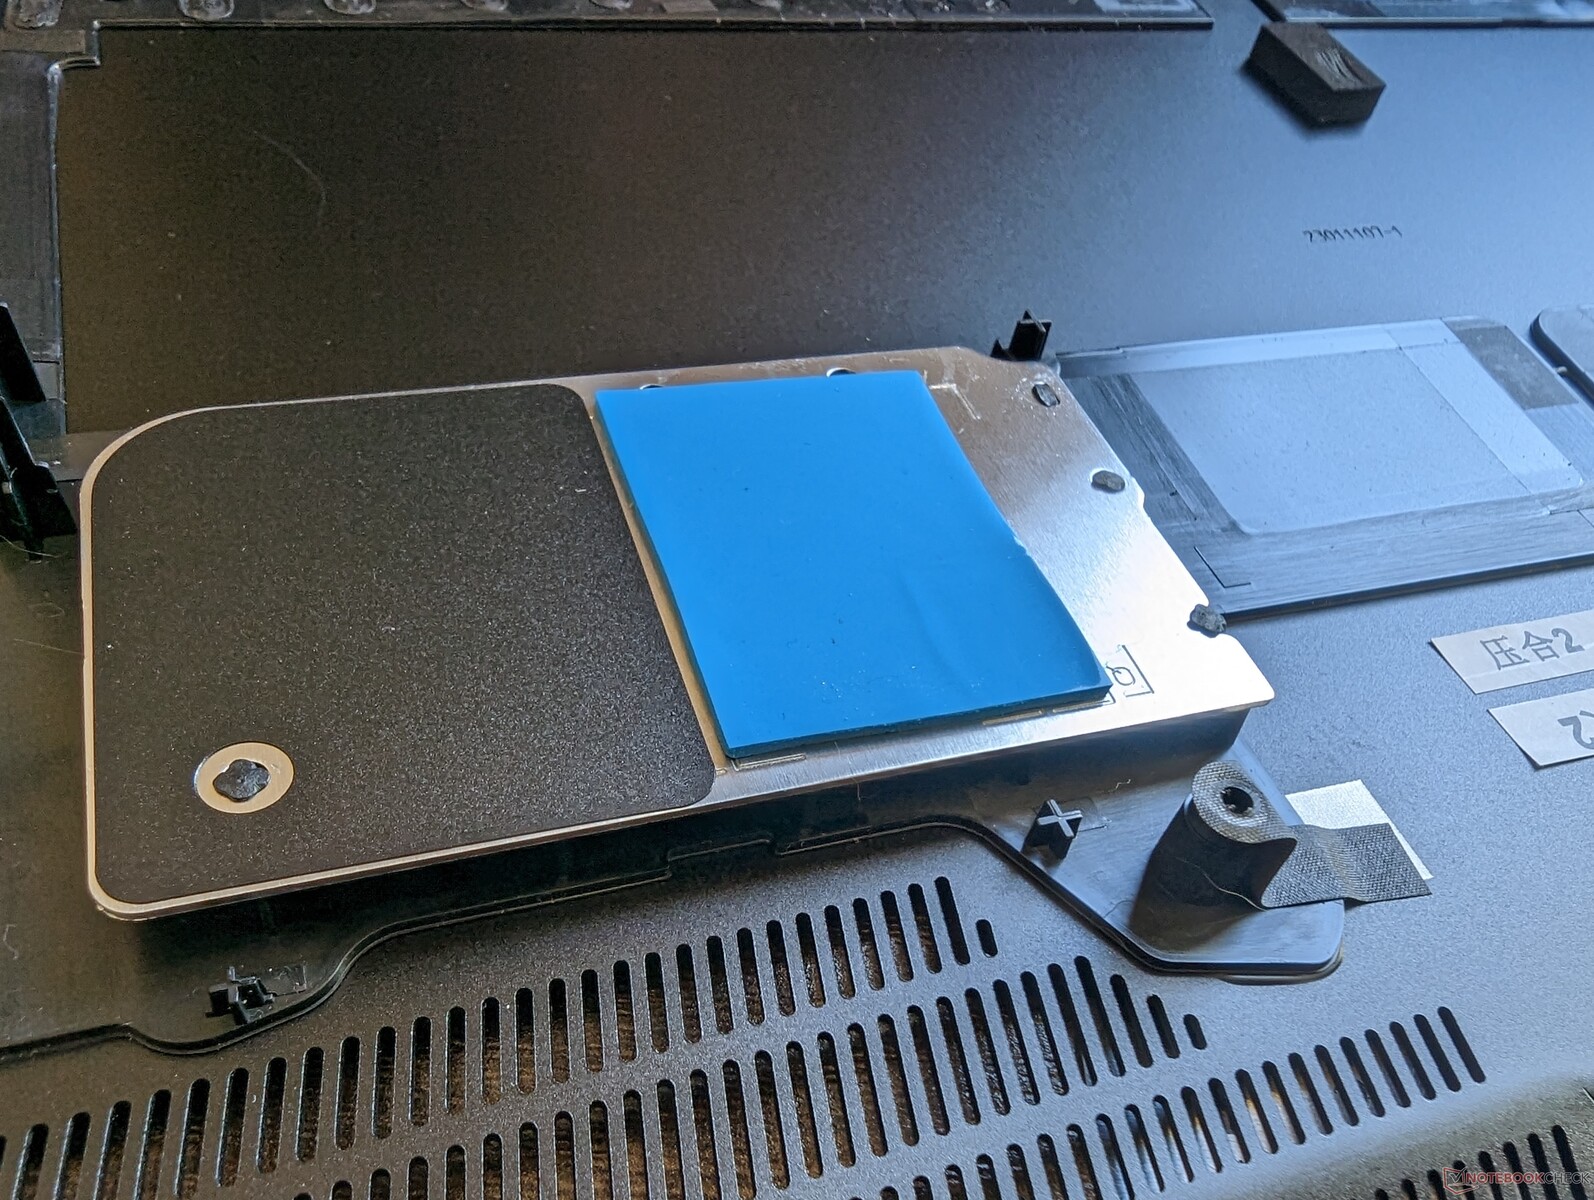
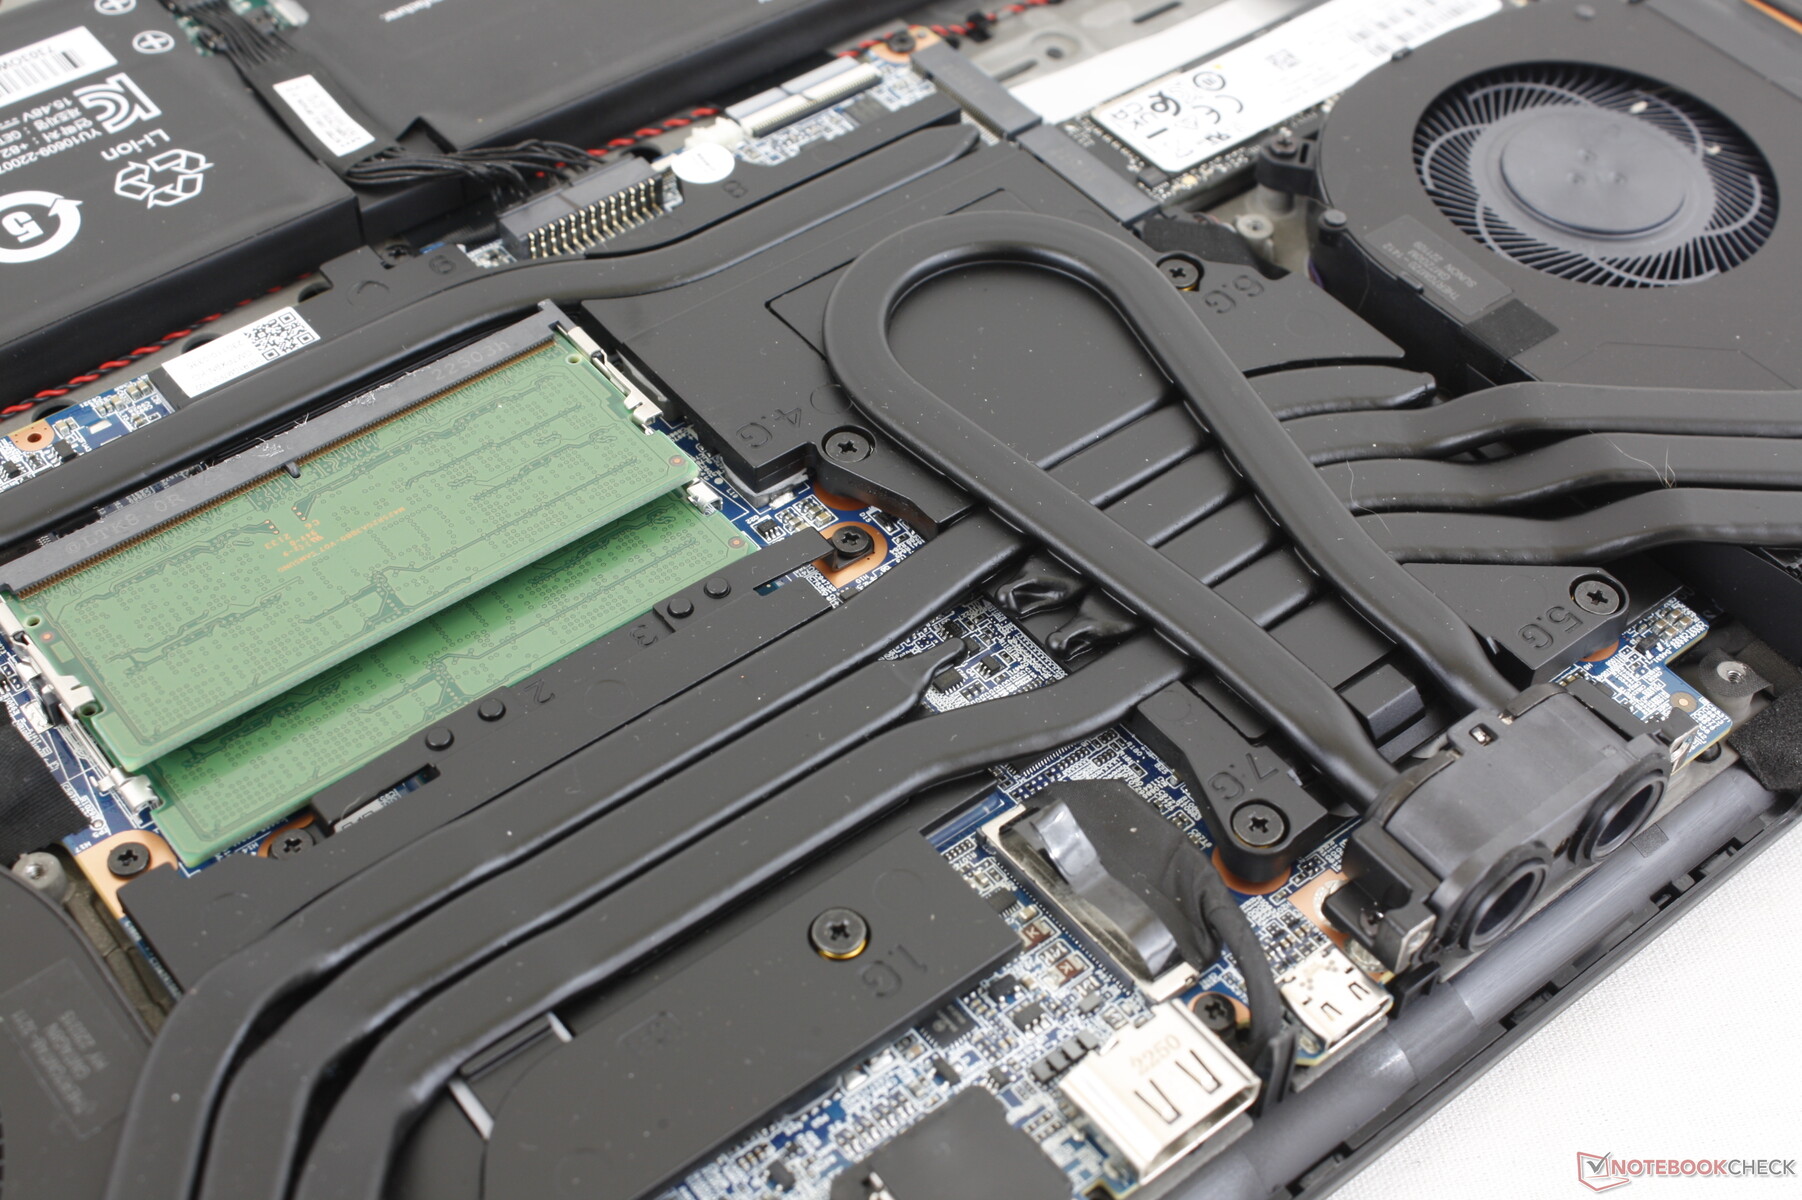
Bottenpanelen är säkrad med 14 Philips-skruvar för relativt enkel service. Tillverkaren har reviderat de inre delarna jämfört med förra årets modell, vilket visas nedan, även om den yttre utformningen är identisk. De två RAM-modulerna är nu staplade för att spara utrymme på moderkortet medan CPU och GPU har bytt plats.
Tillbehör och garanti
Det finns inga extra tillbehör i förpackningen förutom nätadapter och papper. Modellen är kompatibel med den externa kylaren LPP G2 (Liquid Propulsion Package, andra generationen) som tillval.
Den vanliga ettåriga begränsade tillverkargarantin gäller. En uppgradering till tre år är tillgänglig för ytterligare 250 dollar.
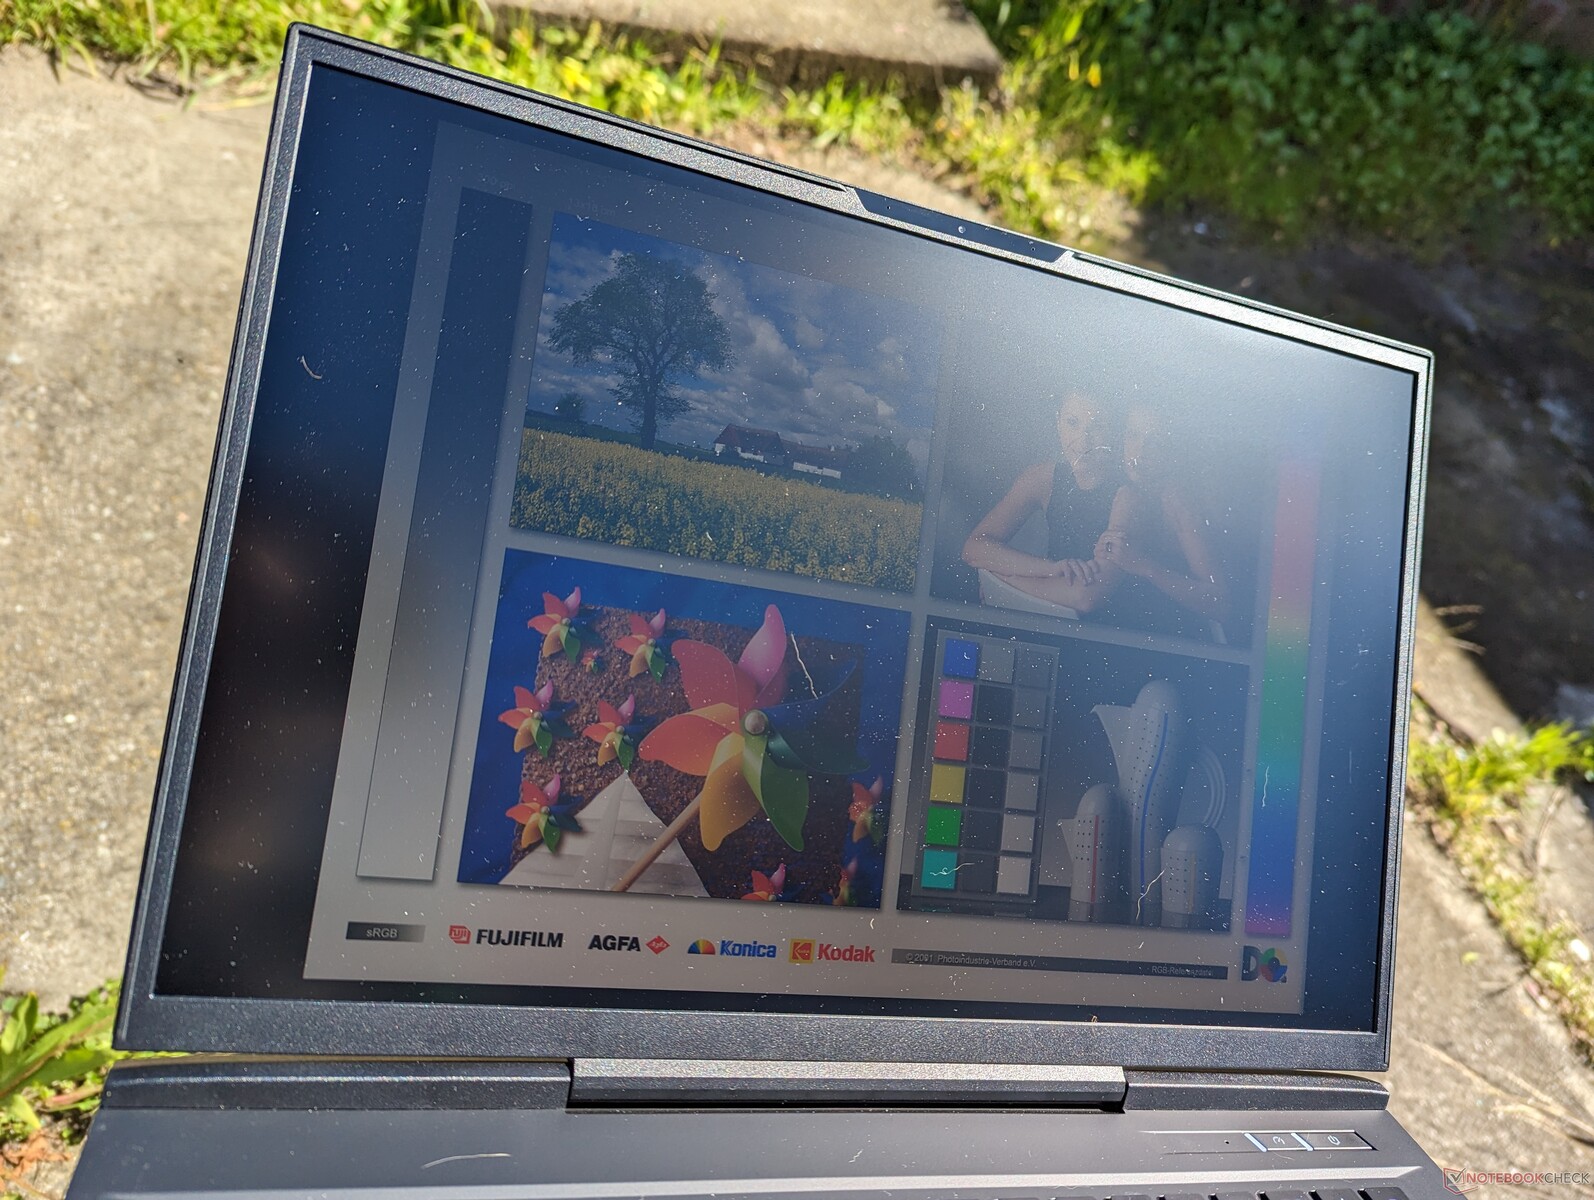
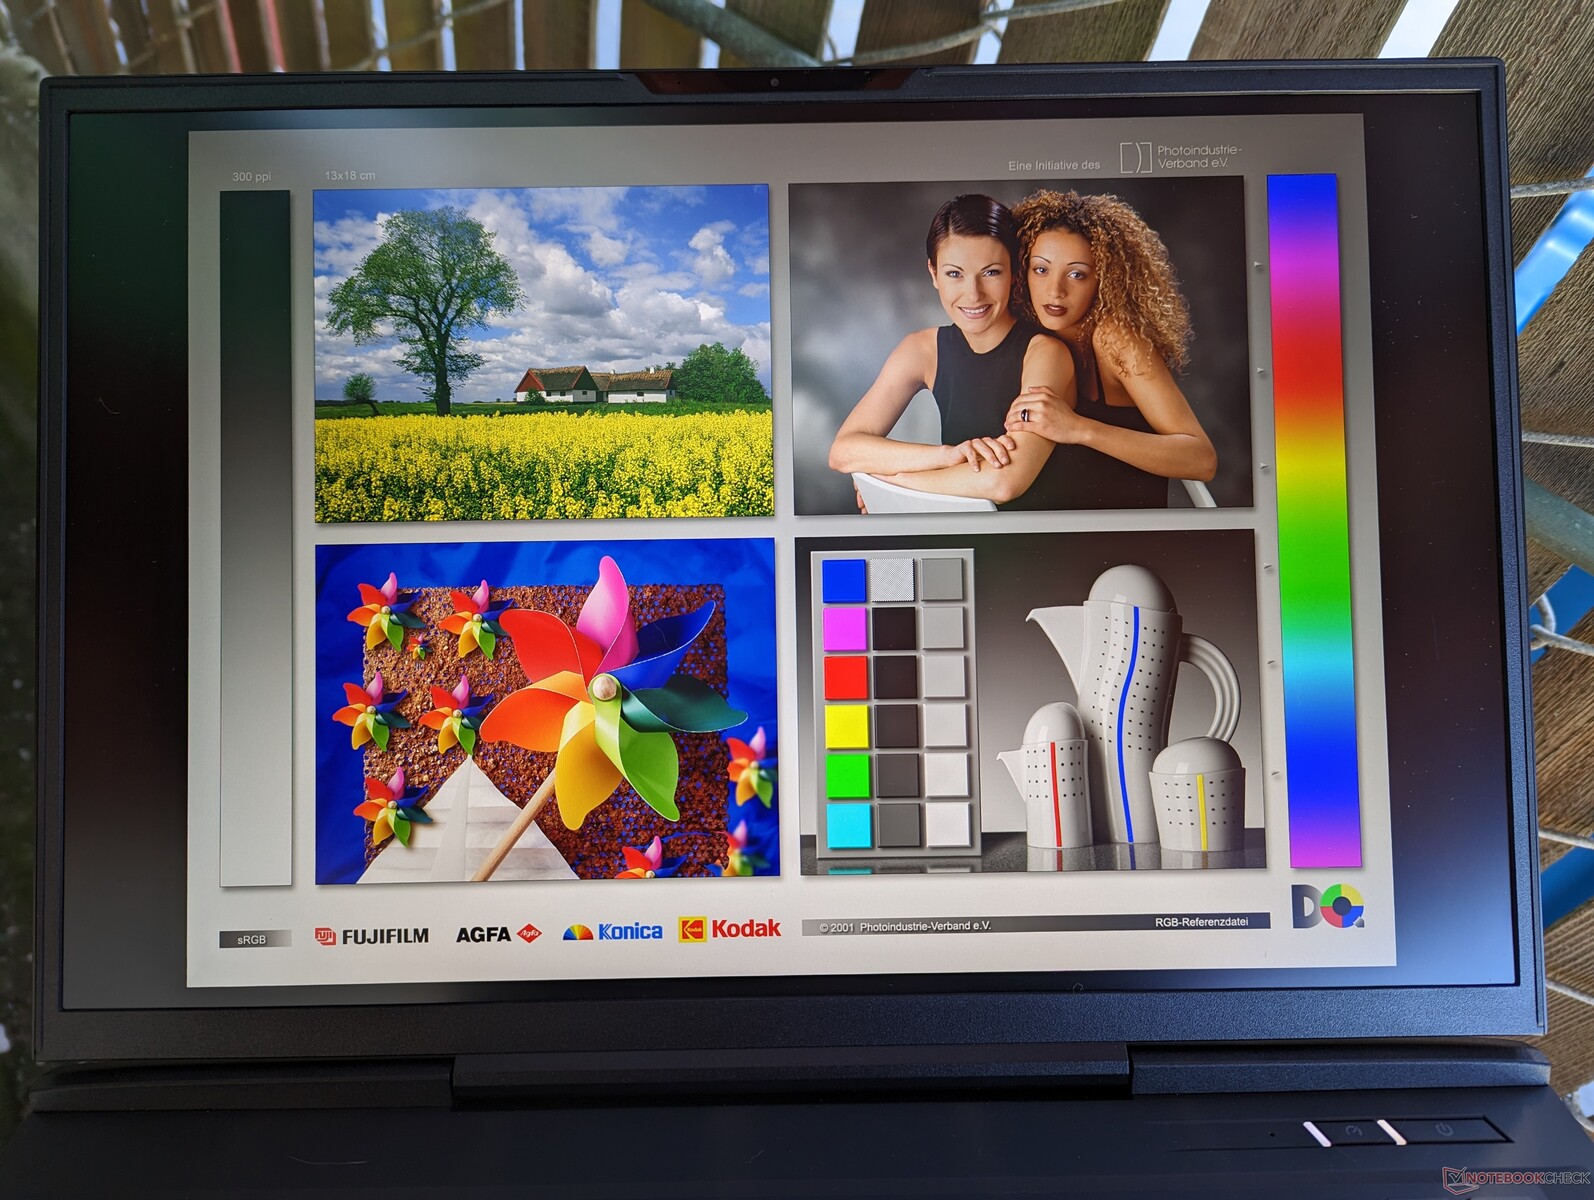
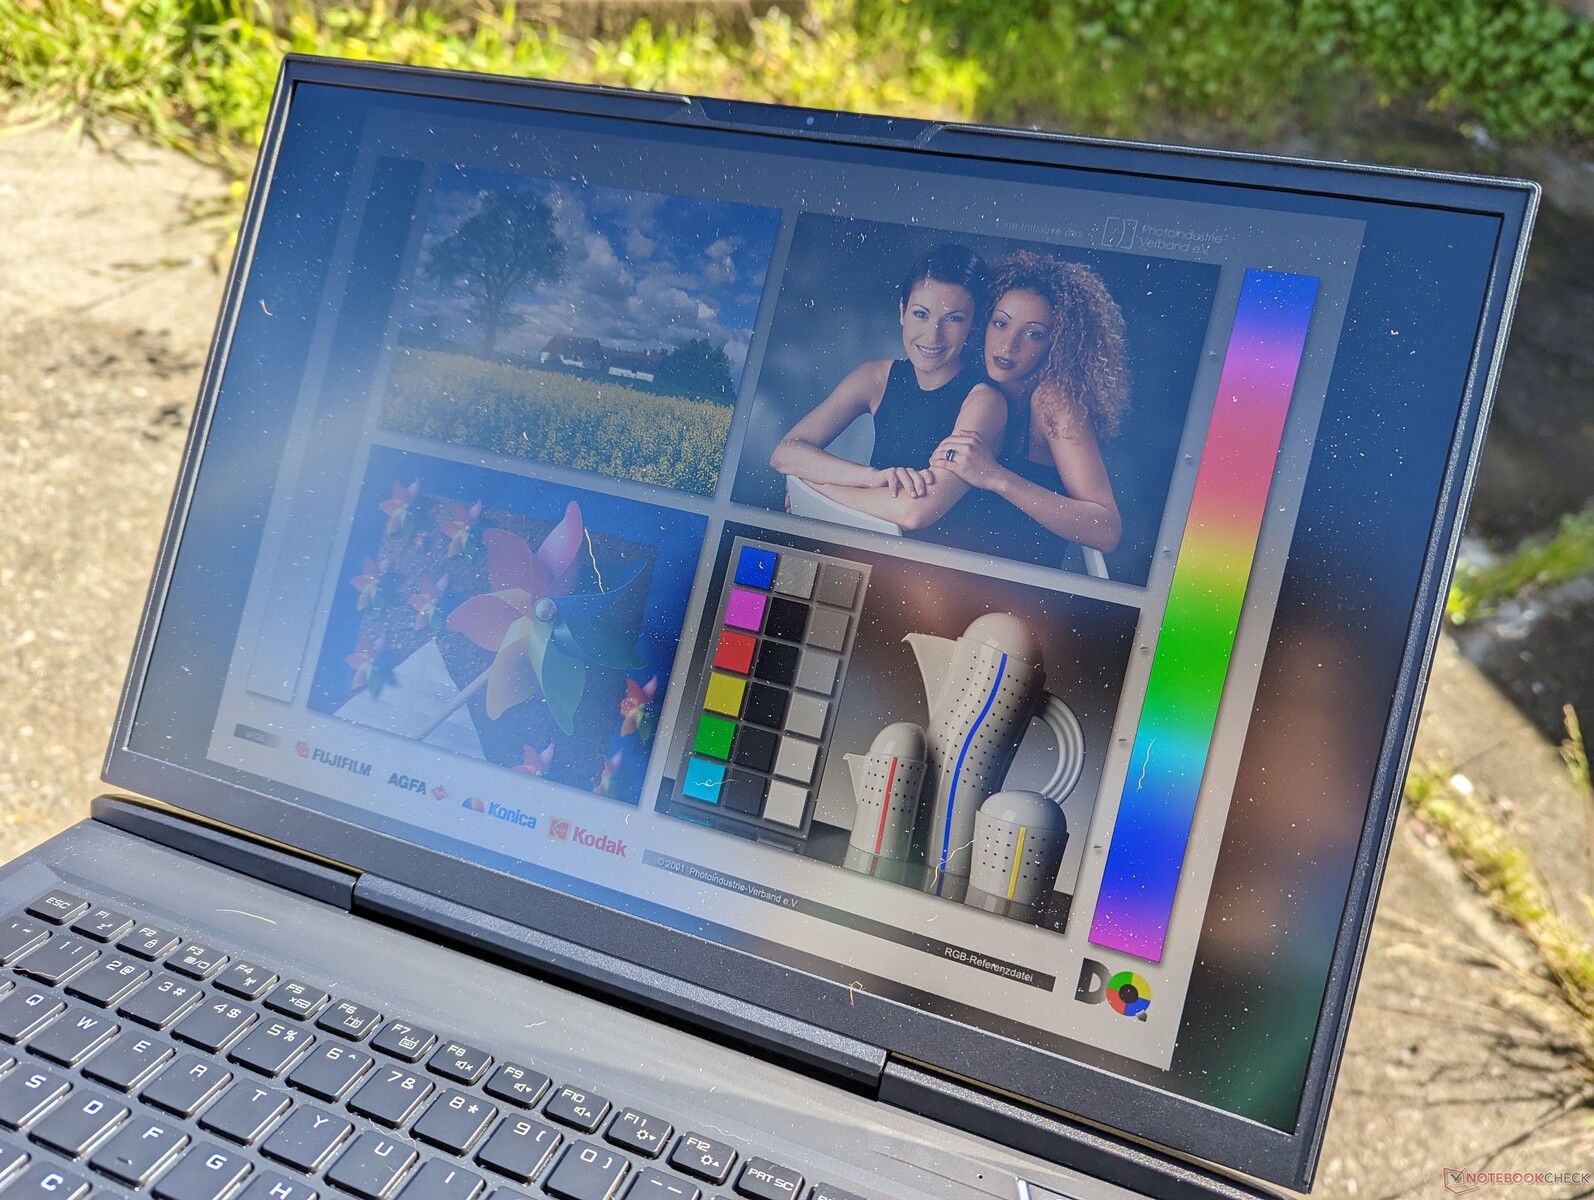
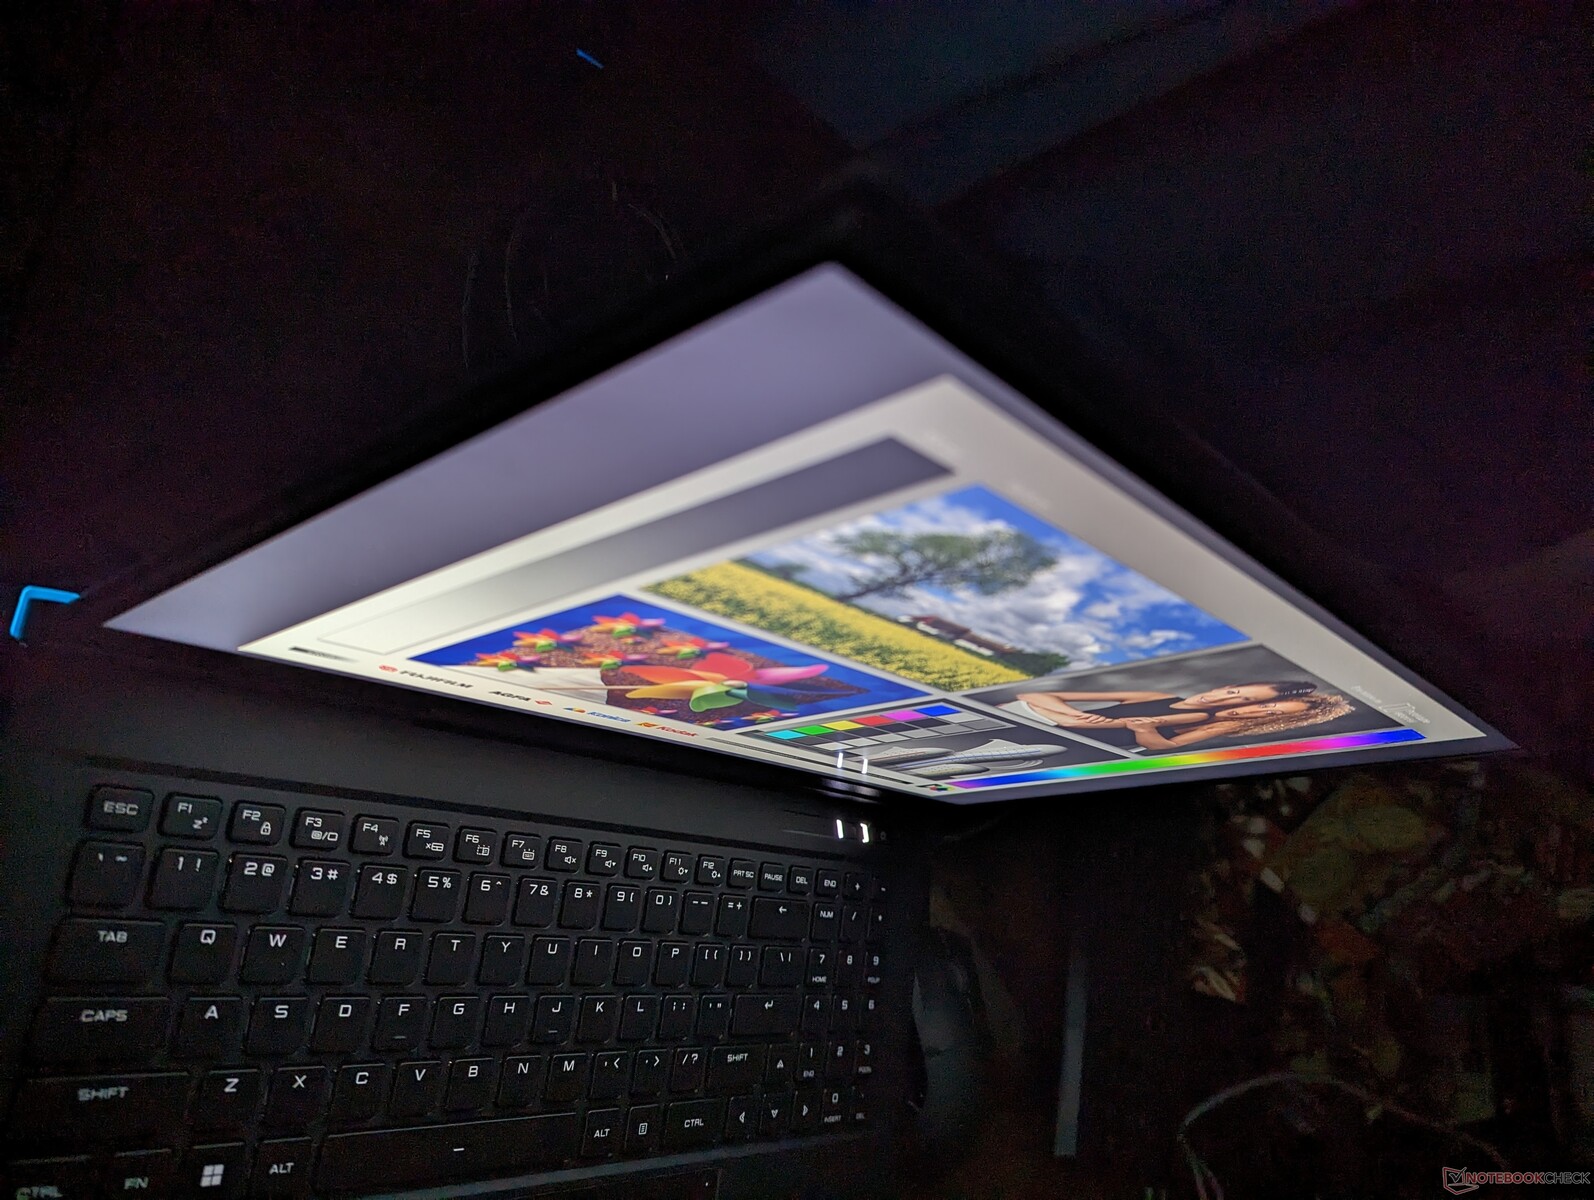
Visa
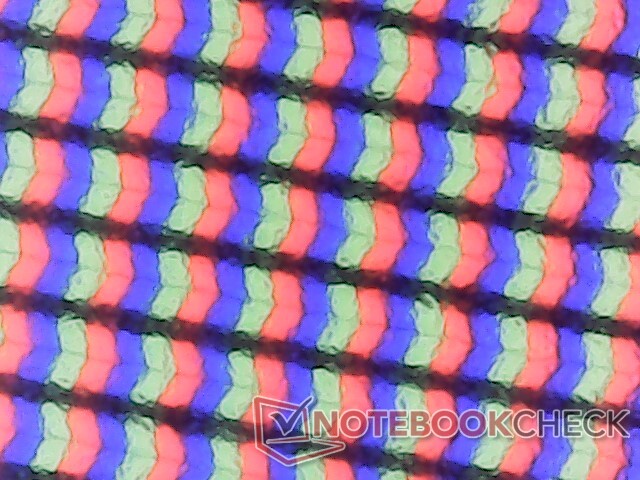
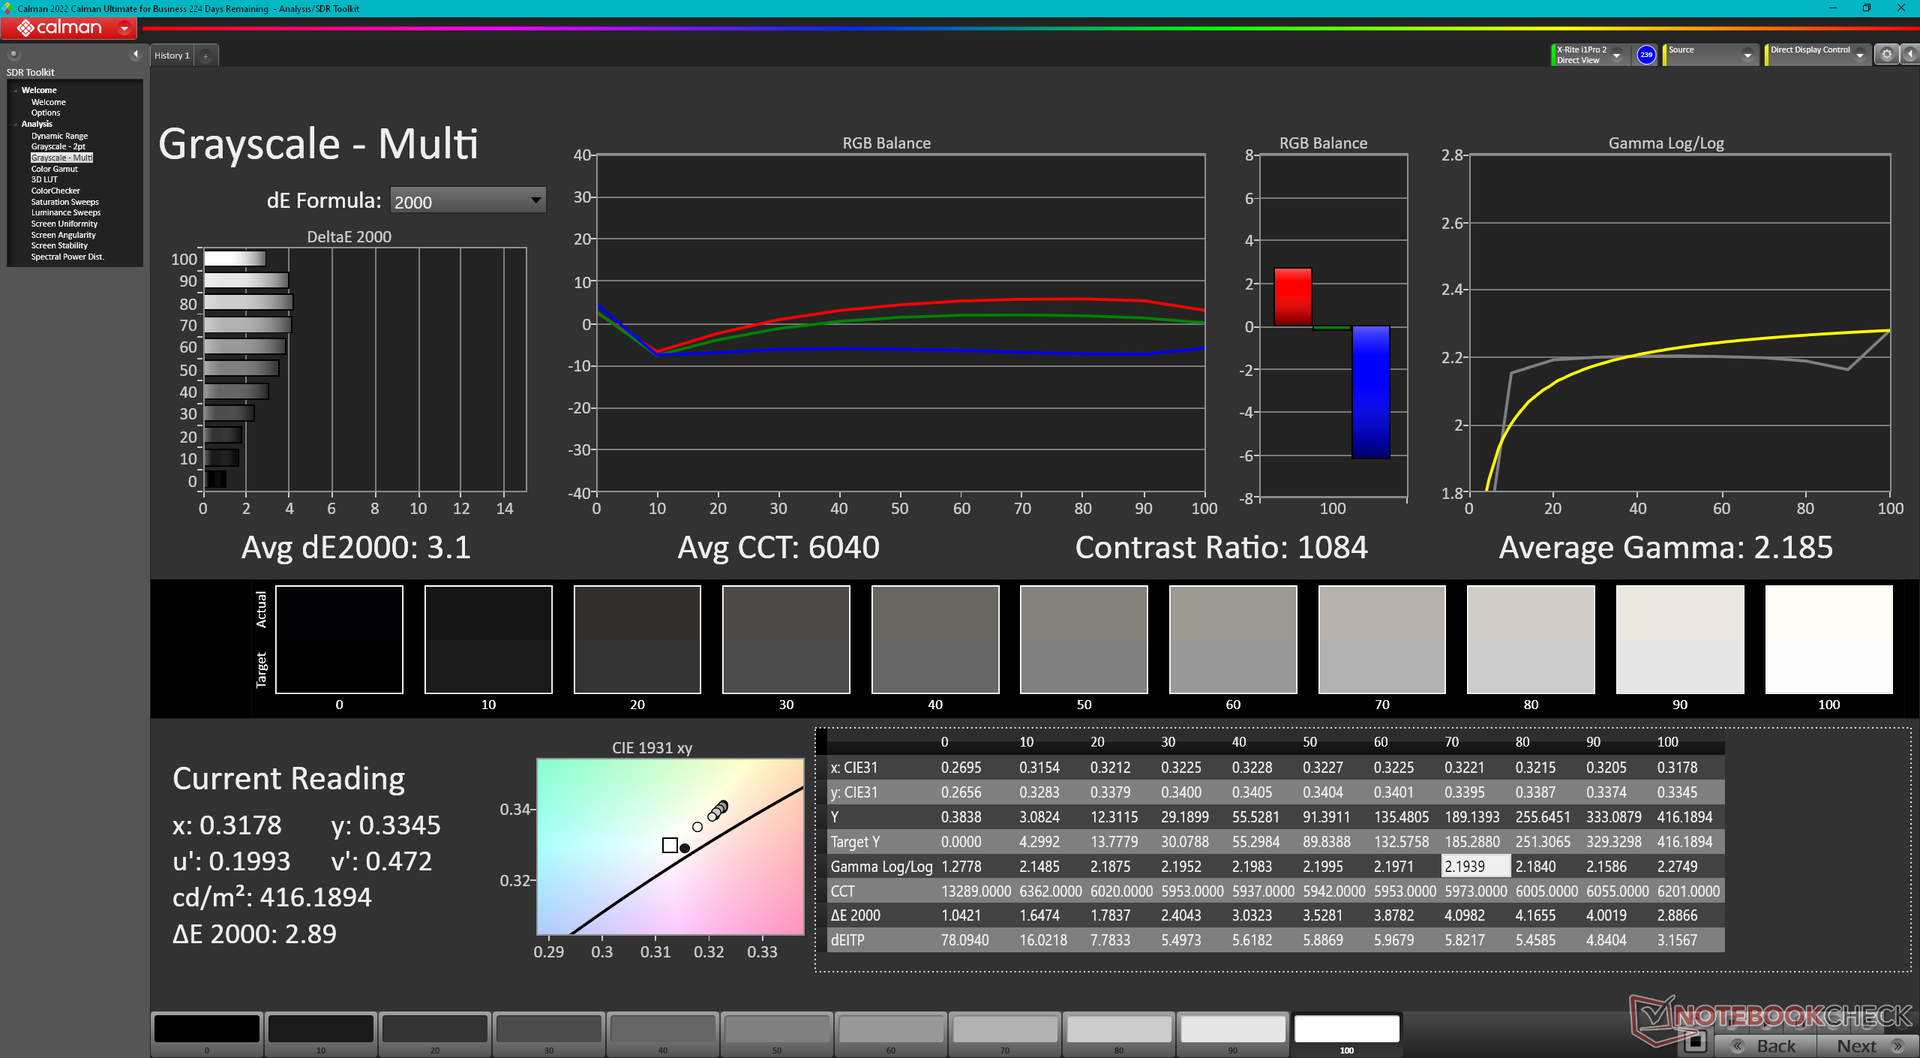
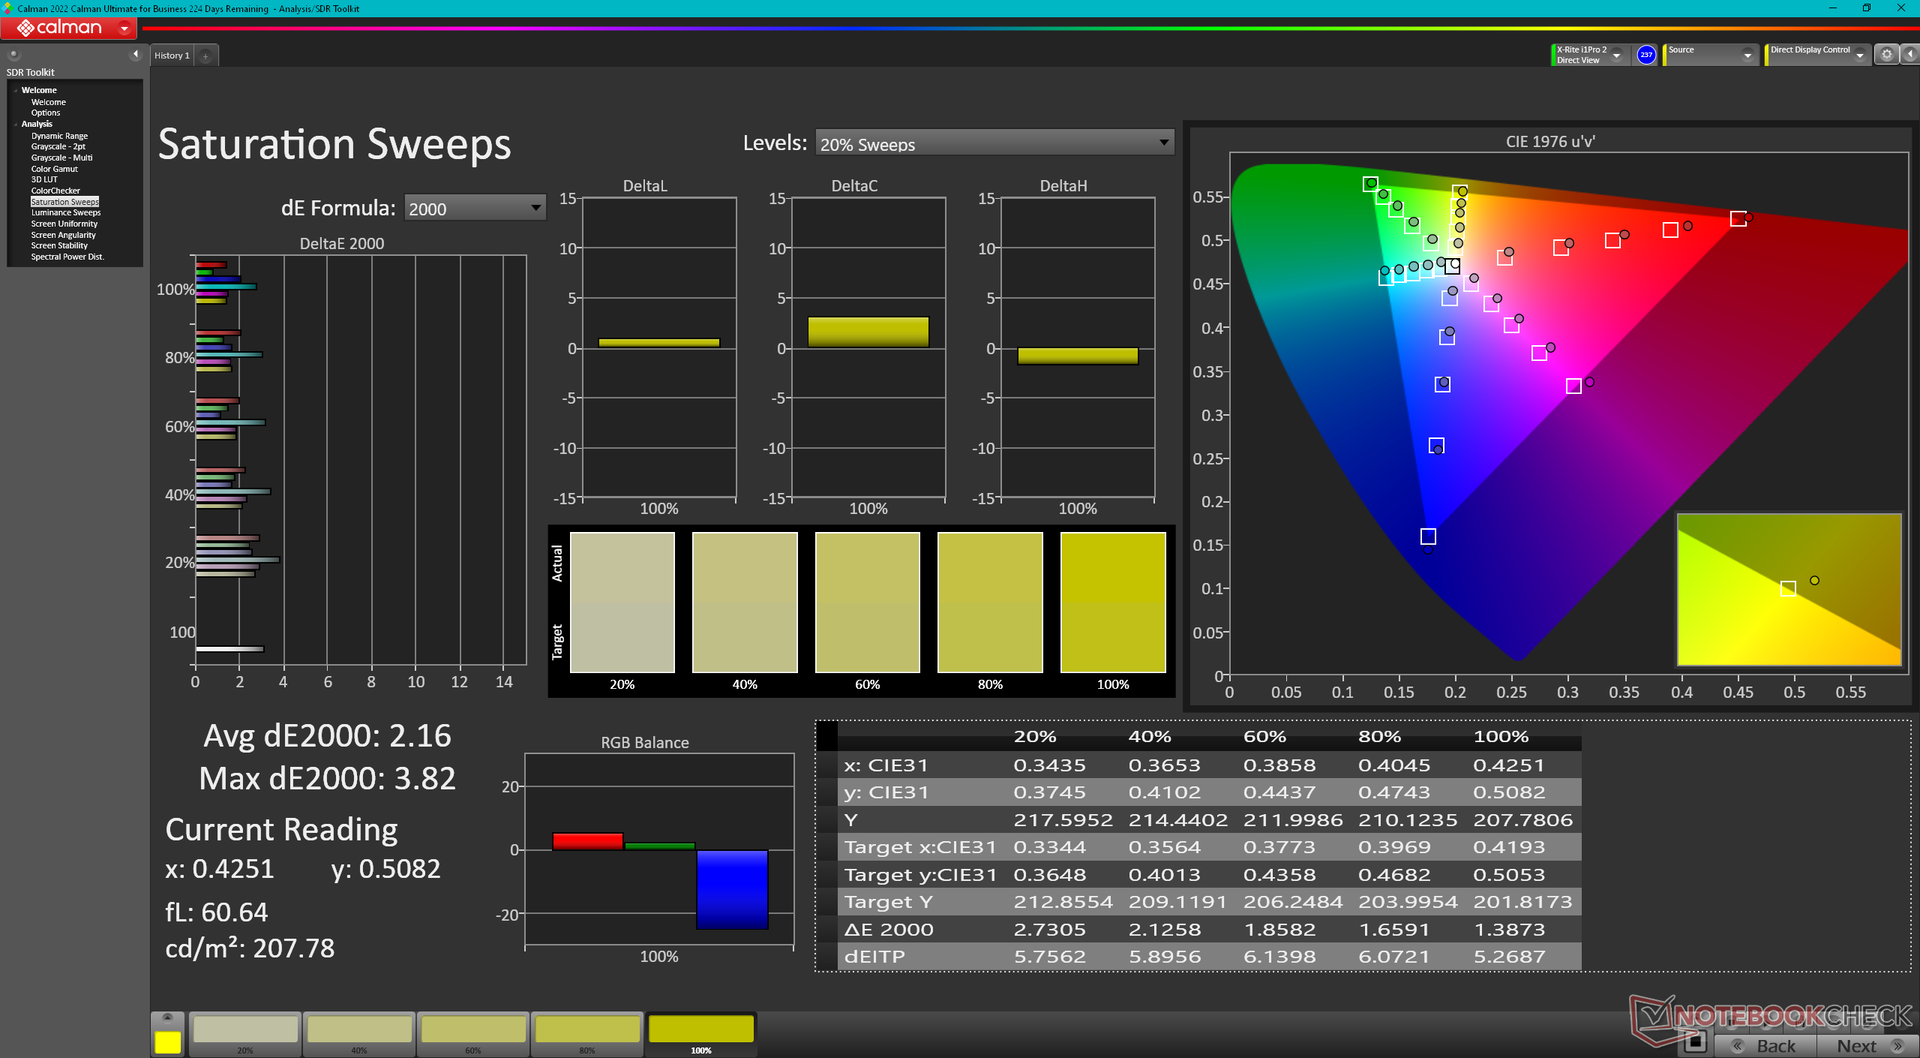
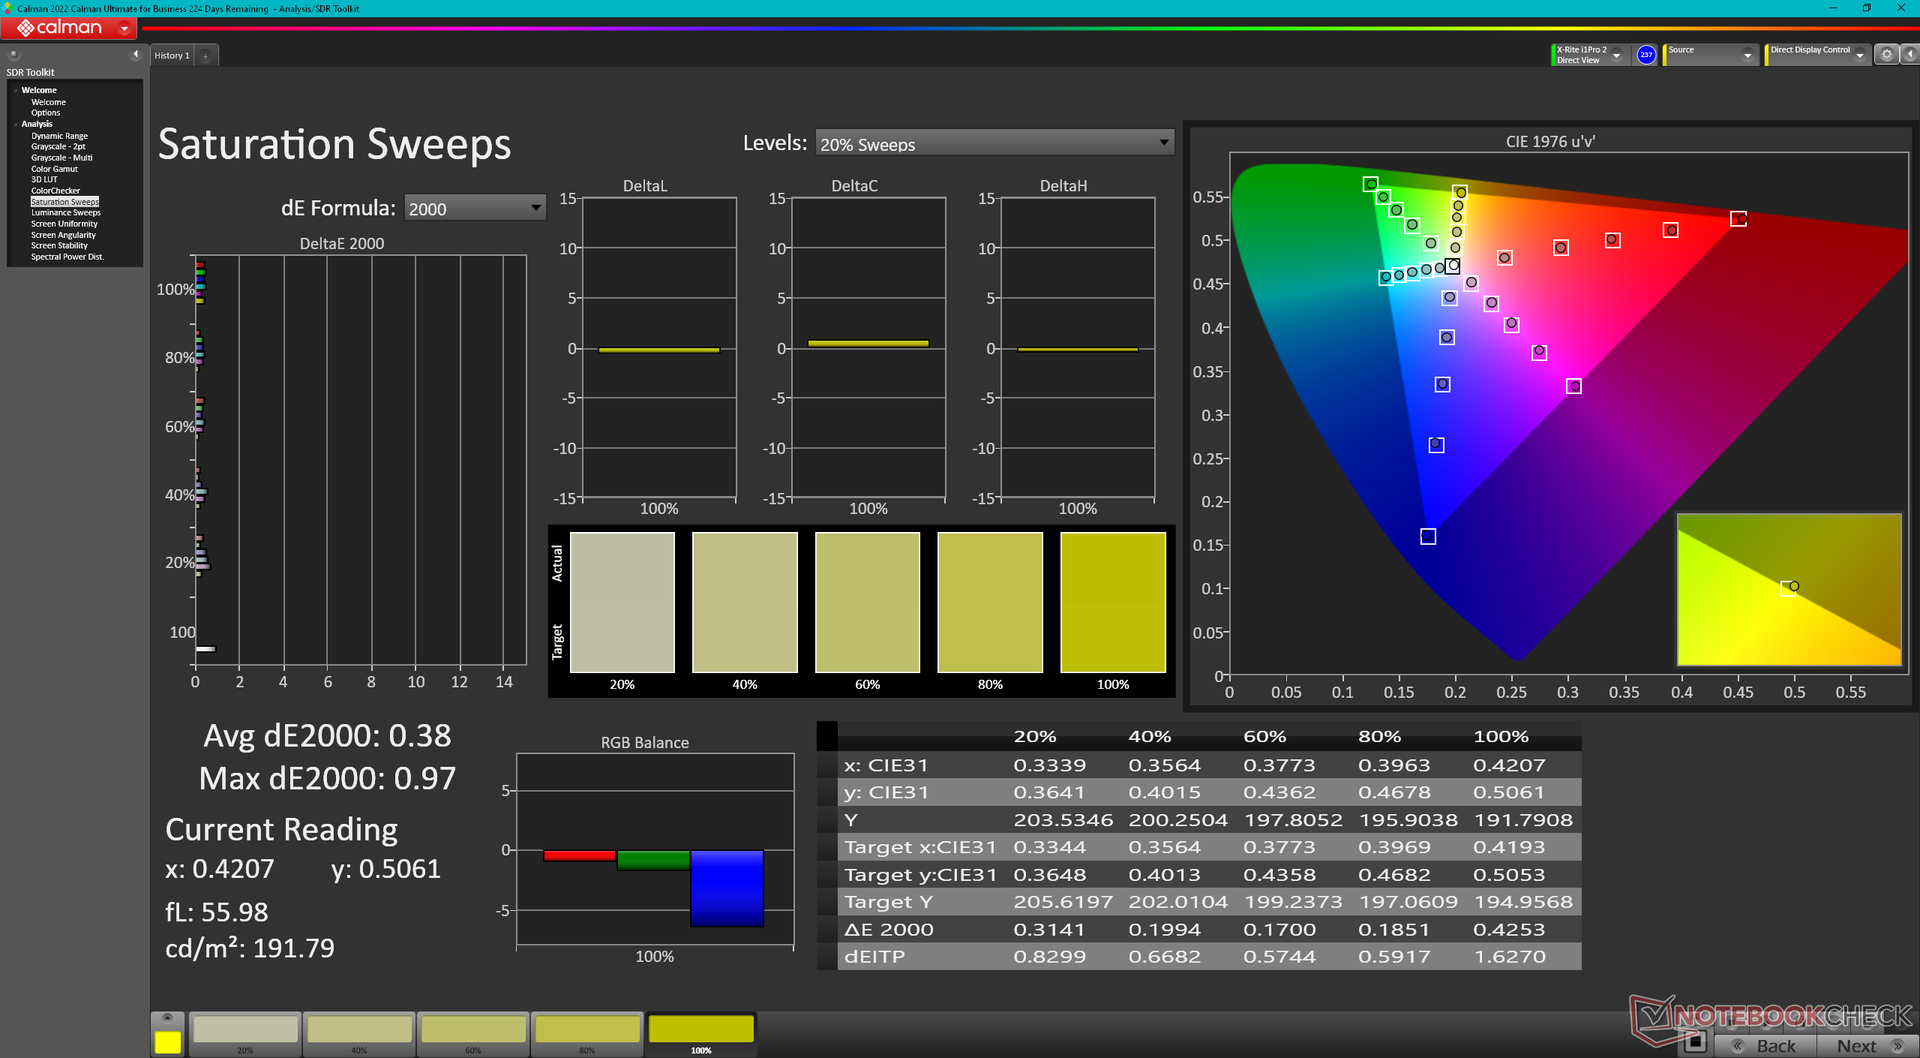
Vår tidiga 2023-modell använder samma BOE NE170QDM-NZ1-panel och BOE0A99-styrenhet som 2022-modellen, vilket innebär att den visuella upplevelsen inte skiljer sig från året innan. Våra mätningar nedan är följaktligen nästan identiska mellan 2022- och 2023-modellerna. Detta är dock knappast ett klagomål eftersom panelen erbjuder nästan allt vi förväntar oss av en bärbar dator för spel i toppklass, inklusive snabb uppdateringsfrekvens, snabba svarstider, full sRGB-täckning och G-Sync-stöd. För högre upplösningar och ännu djupare P3-färger får du dock istället leta på annat håll som MSI GT77 eller Razer Blade 18.
| |||||||||||||||||||||||||
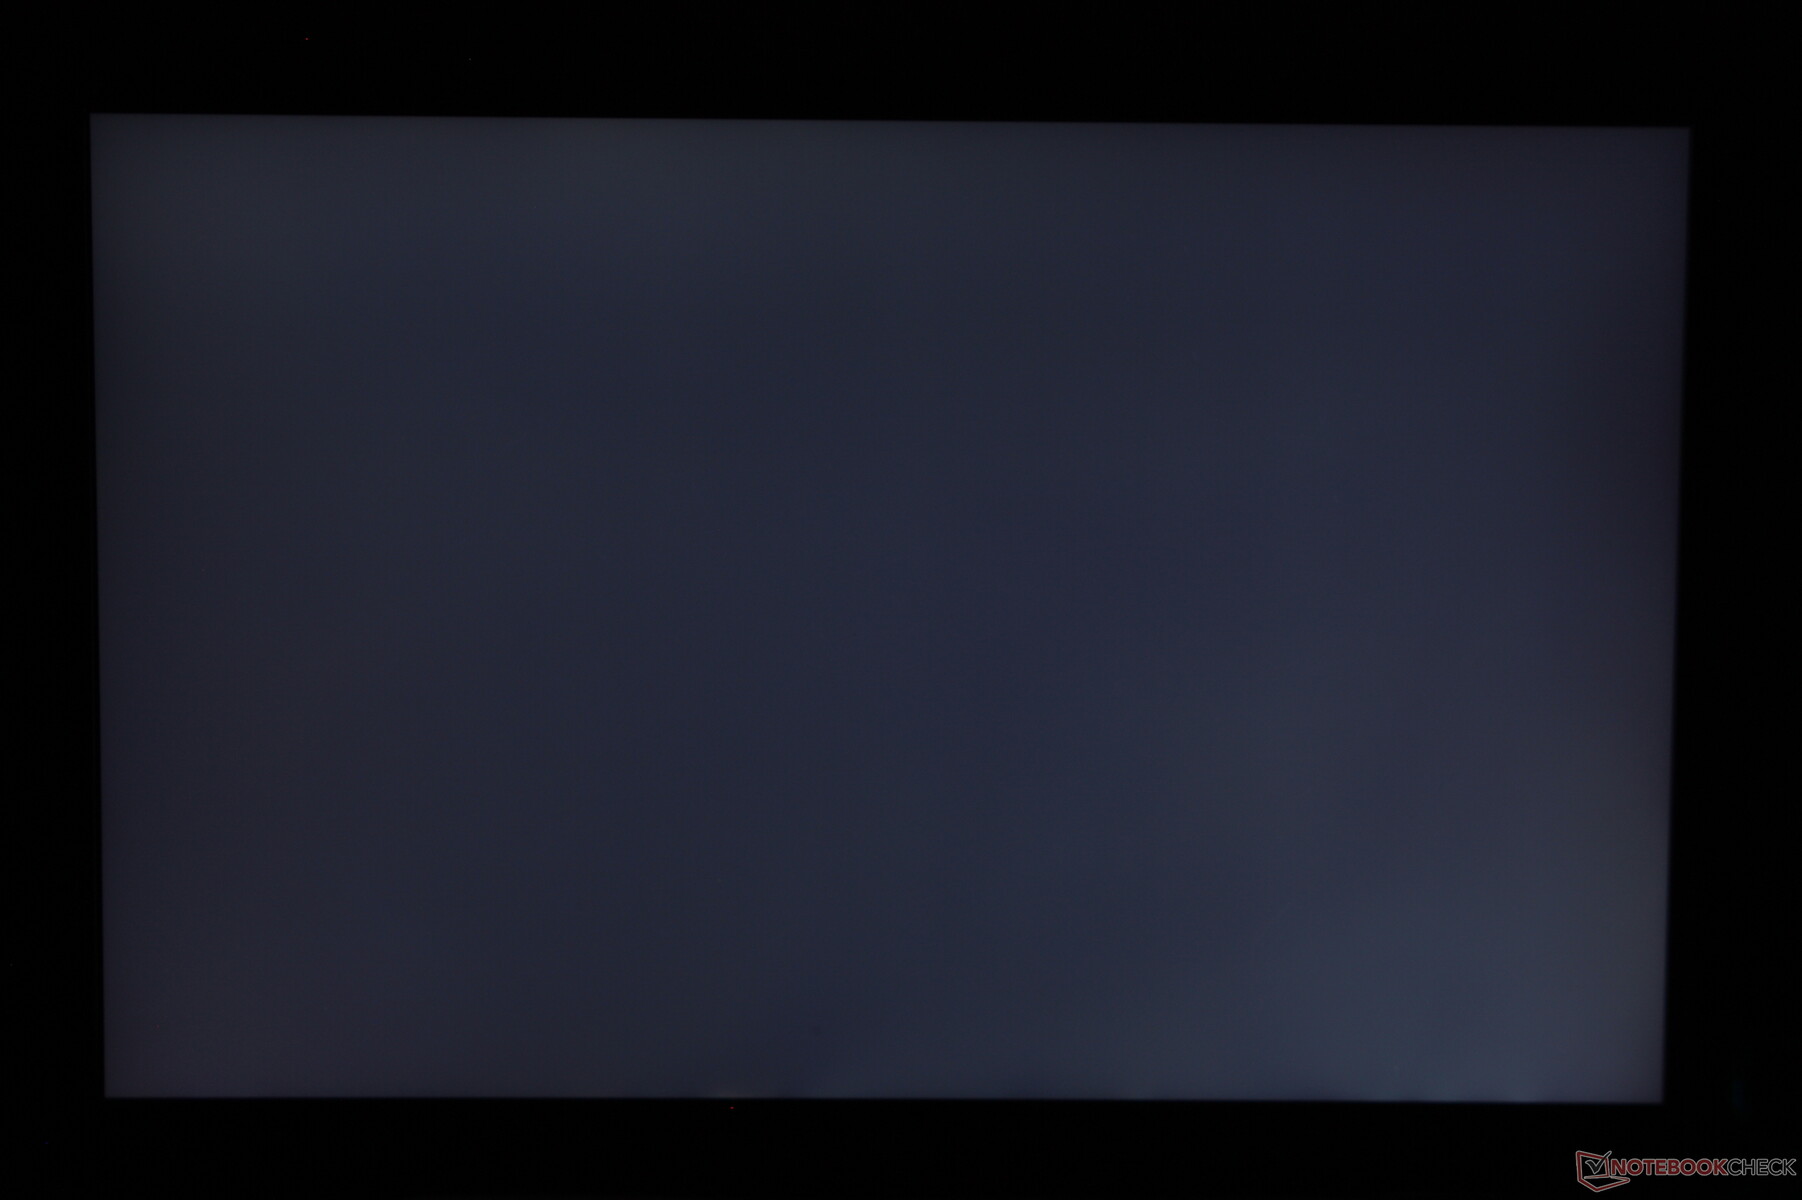
Distribution av ljusstyrkan: 87 %
Mitt på batteriet: 417.3 cd/m²
Kontrast: 994:1 (Svärta: 0.42 cd/m²)
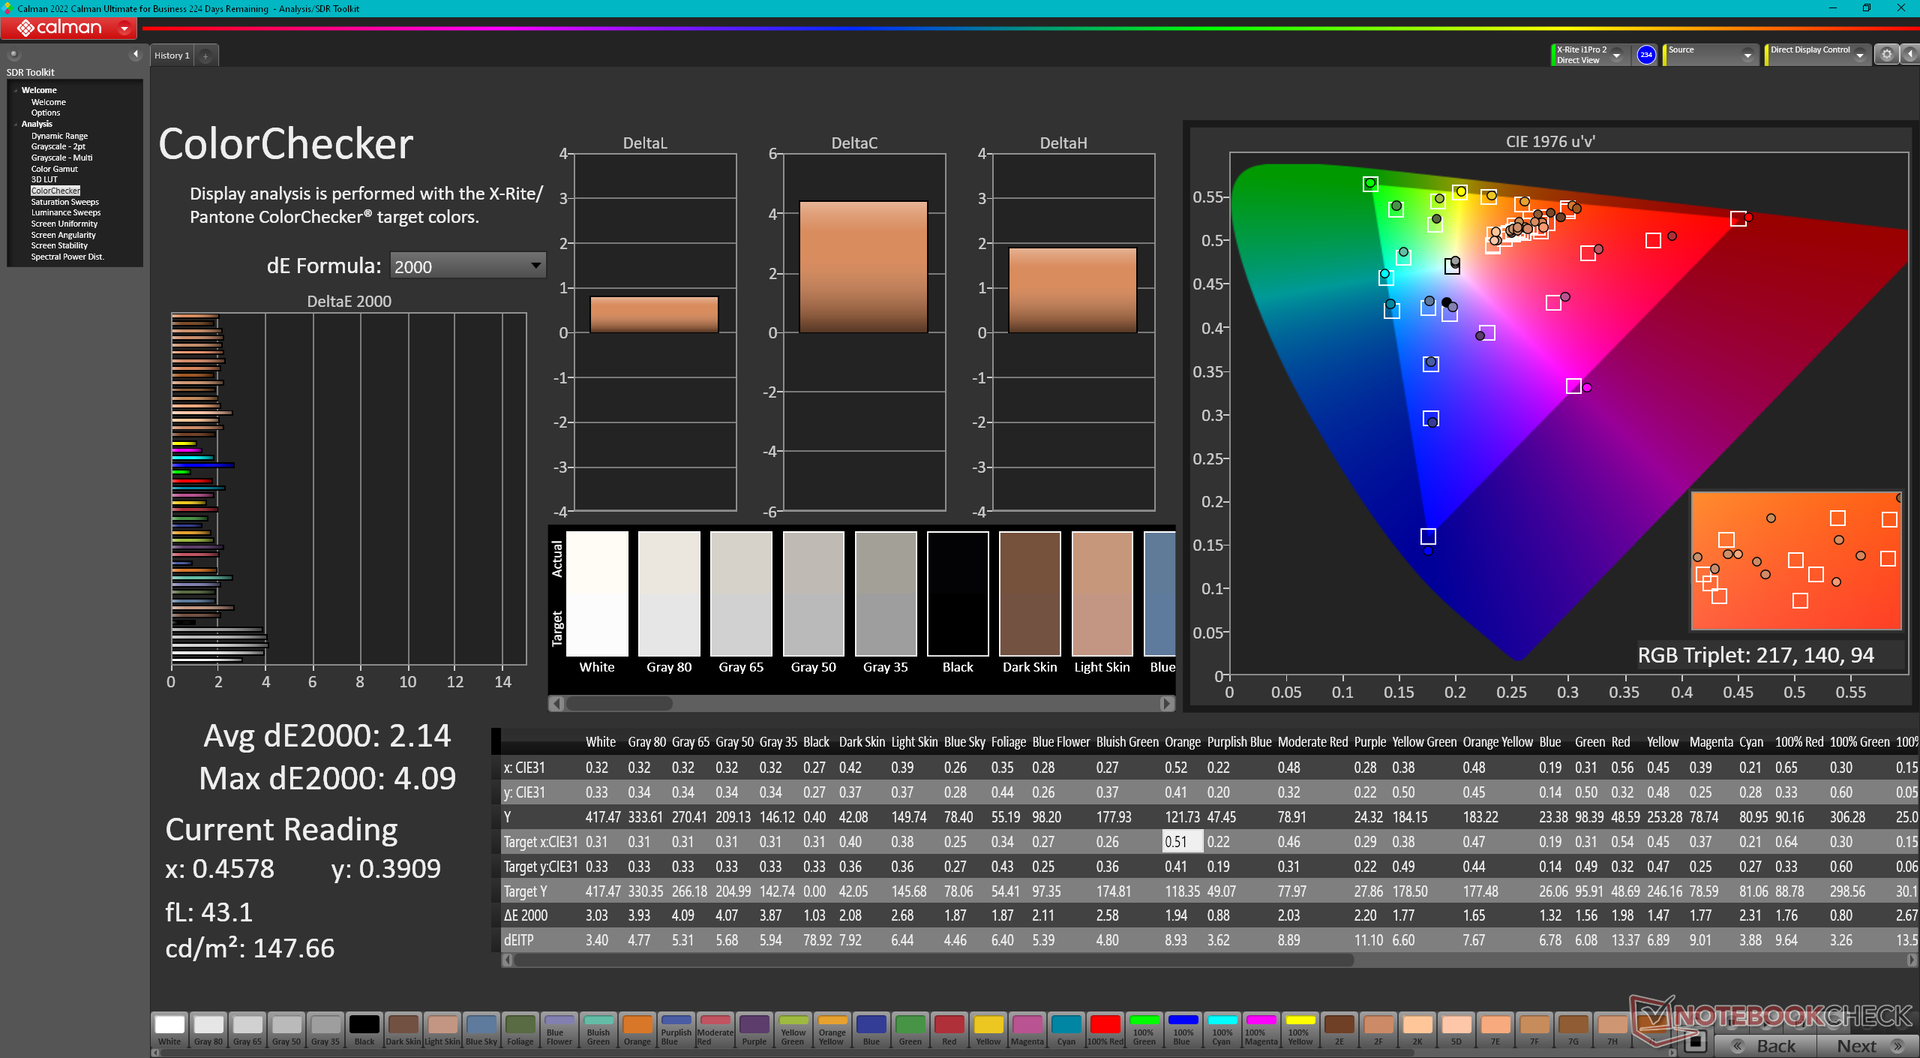
ΔE ColorChecker Calman: 2.14 | ∀{0.5-29.43 Ø4.73}
calibrated: 0.42
ΔE Greyscale Calman: 3.1 | ∀{0.09-98 Ø4.97}
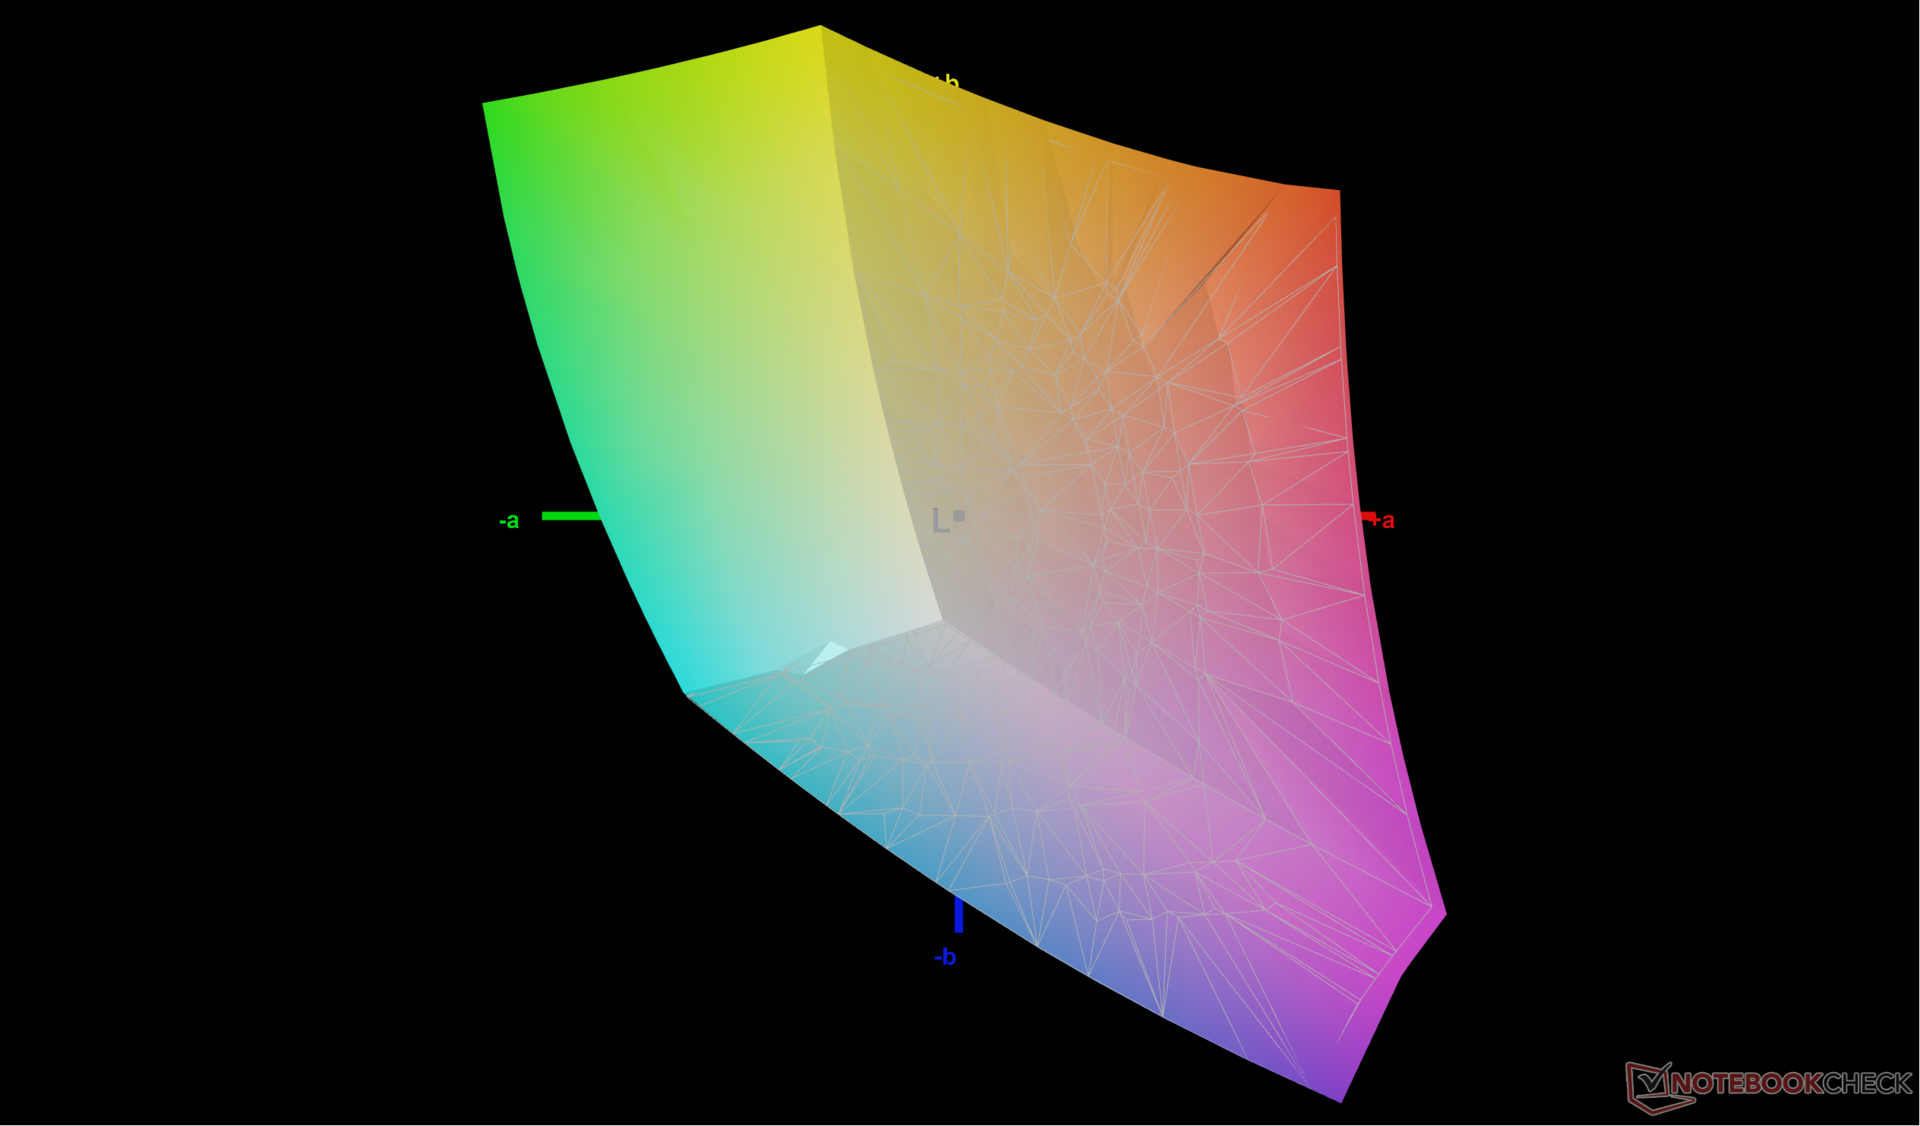
69.8% AdobeRGB 1998 (Argyll 3D)
99.7% sRGB (Argyll 3D)
69.1% Display P3 (Argyll 3D)
Gamma: 2.19
CCT: 6040 K
| Eluktronics Mech-17 GP2 BOE NE170QDM-NZ1, IPS, 2560x1600, 17" | Schenker XMG Neo 17 M22 BOE0A99, IPS, 2560x1600, 17" | MSI Katana 17 B13VFK B173HAN04.9, IPS LED, 1920x1080, 17.3" | MSI Titan GT77 HX 13VI B173ZAN06.C, Mini-LED, 3840x2160, 17.3" | Alienware m17 R5 (R9 6900HX, RX 6850M XT) AU Optronics AUODBA3, IPS, 3840x2160, 17" | Razer Blade 18 RTX 4070 AU Optronics B180QAN01.0, IPS, 2560x1600, 18" | |
|---|---|---|---|---|---|---|
| Display | 0% | -40% | 23% | 23% | 21% | |
| Display P3 Coverage (%) | 69.1 | 69 0% | 40.8 -41% | 94.9 37% | 97.2 41% | 96.9 40% |
| sRGB Coverage (%) | 99.7 | 99.8 0% | 61 -39% | 99.9 0% | 99.6 0% | 99.8 0% |
| AdobeRGB 1998 Coverage (%) | 69.8 | 69.6 0% | 42.2 -40% | 92.4 32% | 88.4 27% | 85.3 22% |
| Response Times | 23% | -176% | -202% | -30% | 40% | |
| Response Time Grey 50% / Grey 80% * (ms) | 12 ? | 10.8 ? 10% | 33 ? -175% | 38.4 ? -220% | 16.4 ? -37% | 4.2 ? 65% |
| Response Time Black / White * (ms) | 9.4 ? | 6.1 ? 35% | 26 ? -177% | 26.6 ? -183% | 11.6 ? -23% | 8 ? 15% |
| PWM Frequency (Hz) | 2380 ? | |||||
| Screen | 1% | -158% | 67678% | -147% | -64% | |
| Brightness middle (cd/m²) | 417.3 | 415 -1% | 267 -36% | 606 45% | 484 16% | 549.6 32% |
| Brightness (cd/m²) | 387 | 399 3% | 256 -34% | 602 56% | 449 16% | 524 35% |
| Brightness Distribution (%) | 87 | 90 3% | 93 7% | 93 7% | 87 0% | 89 2% |
| Black Level * (cd/m²) | 0.42 | 0.43 -2% | 0.21 50% | 0.0001 100% | 0.55 -31% | 0.53 -26% |
| Contrast (:1) | 994 | 965 -3% | 1271 28% | 6060000 609558% | 880 -11% | 1037 4% |
| Colorchecker dE 2000 * | 2.14 | 1.44 33% | 4.7 -120% | 4.8 -124% | 4.8 -124% | 3.32 -55% |
| Colorchecker dE 2000 max. * | 4.09 | 2.33 43% | 20.4 -399% | 8.2 -100% | 7.48 -83% | 6.63 -62% |
| Colorchecker dE 2000 calibrated * | 0.42 | 0.89 -112% | 4.5 -971% | 1.8 -329% | 4.74 -1029% | 2.7 -543% |
| Greyscale dE 2000 * | 3.1 | 1.8 42% | 1.5 52% | 6.5 -110% | 5.5 -77% | 2 35% |
| Gamma | 2.19 100% | 2.132 103% | 2.12 104% | 2.63 84% | 2.42 91% | 2.29 96% |
| CCT | 6040 108% | 6327 103% | 6552 99% | 6596 99% | 6148 106% | 6319 103% |
| Totalt genomsnitt (program/inställningar) | 8% /
4% | -125% /
-135% | 22500% /
43484% | -51% /
-94% | -1% /
-31% |
* ... mindre är bättre

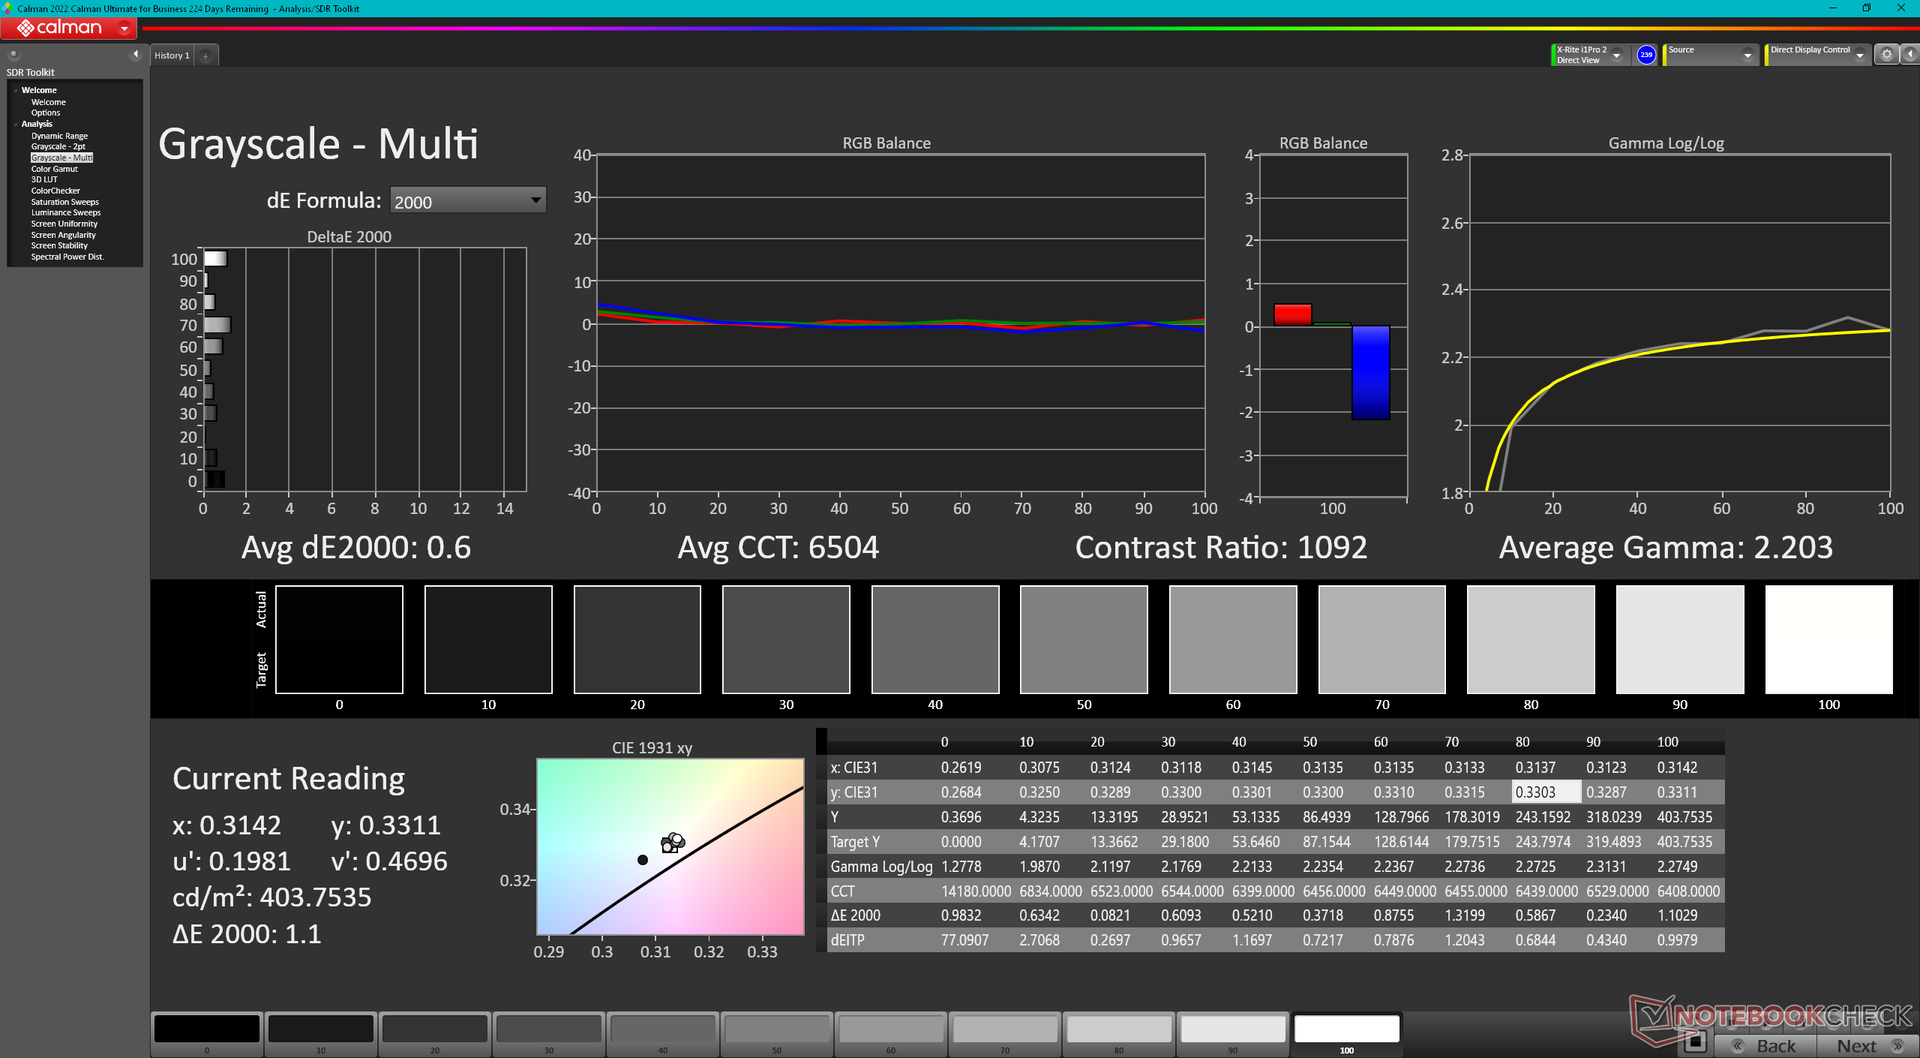
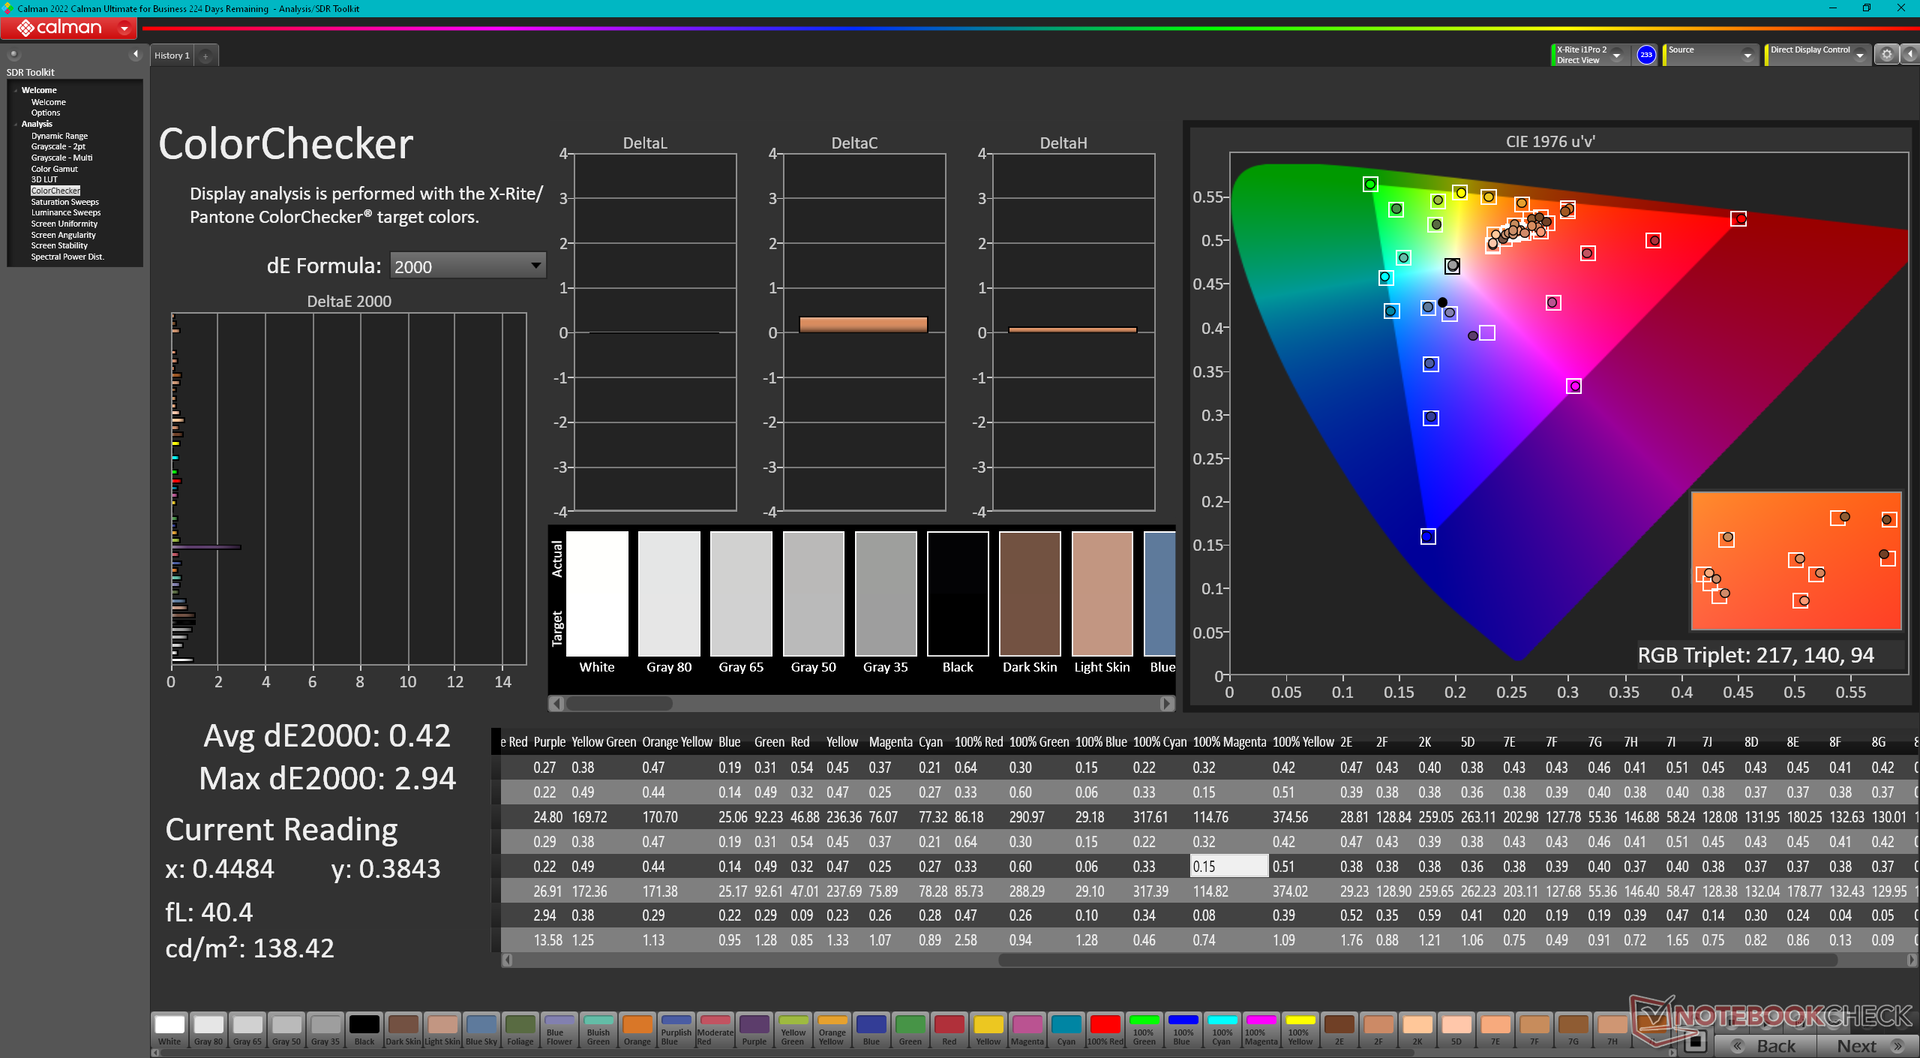
Skärmen är välkalibrerad direkt från förpackningen med genomsnittliga deltaE-värden för gråskala och färg på bara 3,1 respektive 2,14. Om vi kalibrerar den själva skulle vi förbättra deltaE-medelvärdena ytterligare till endast 0,6 och 0,42 mot sRGB-standarden. Vår kalibrerade ICM-profil ovan kan laddas ner gratis.
Visa svarstider
| ↔ Svarstid svart till vitt | ||
|---|---|---|
| 9.4 ms ... stiga ↗ och falla ↘ kombinerat | ↗ 4.9 ms stiga | 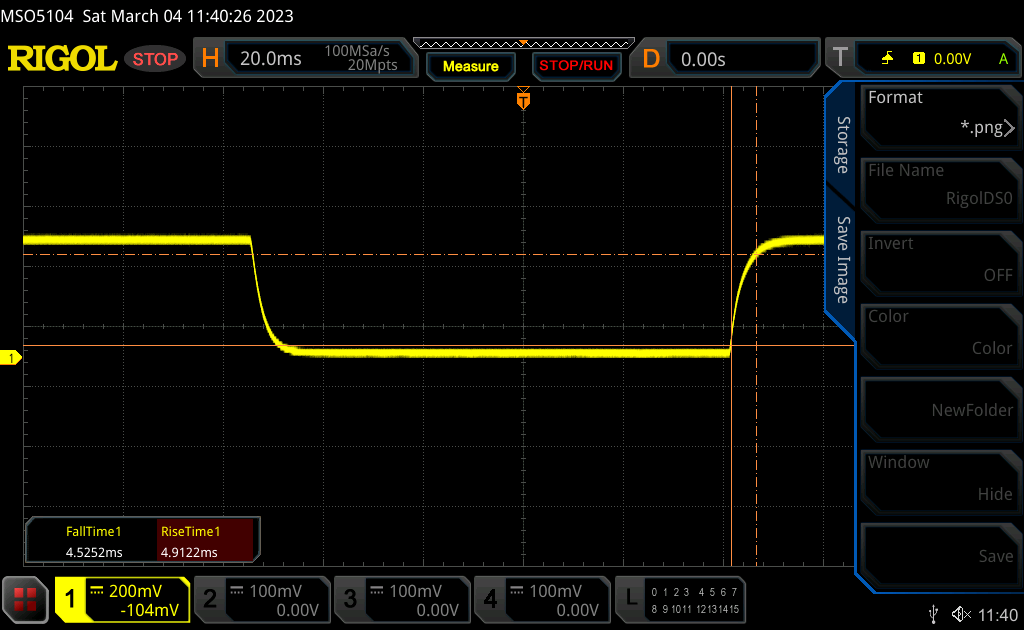 |
| ↘ 4.5 ms hösten | ||
| Skärmen visar snabba svarsfrekvenser i våra tester och bör passa för spel. I jämförelse sträcker sig alla testade enheter från 0.1 (minst) till 240 (maximalt) ms. » 26 % av alla enheter är bättre. Det betyder att den uppmätta svarstiden är bättre än genomsnittet av alla testade enheter (19.9 ms). | ||
| ↔ Svarstid 50 % grått till 80 % grått | ||
| 12 ms ... stiga ↗ och falla ↘ kombinerat | ↗ 5.4 ms stiga | 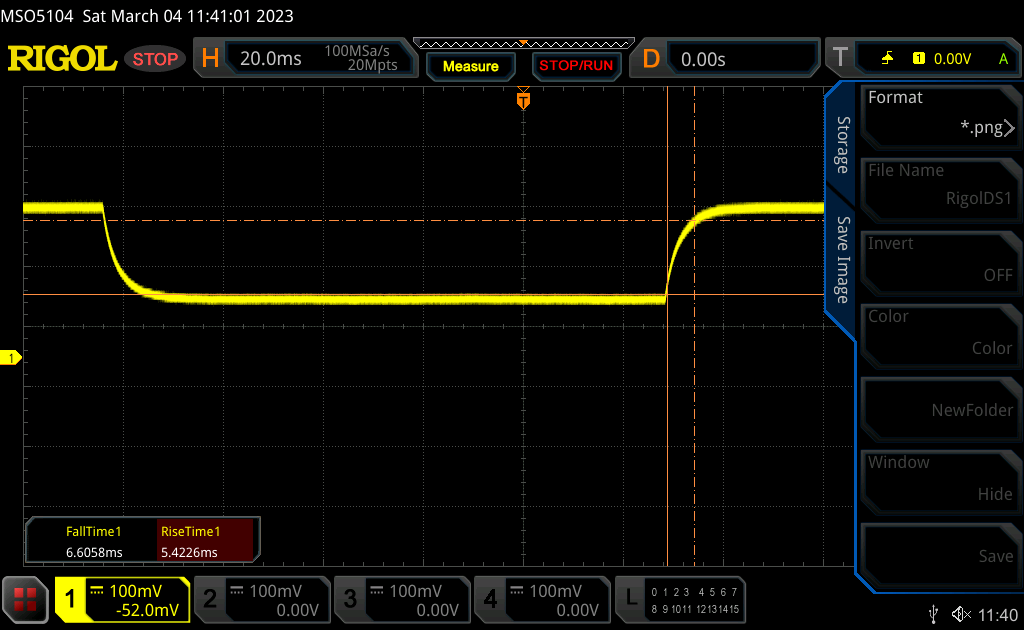 |
| ↘ 6.6 ms hösten | ||
| Skärmen visar bra svarsfrekvens i våra tester, men kan vara för långsam för konkurrenskraftiga spelare. I jämförelse sträcker sig alla testade enheter från 0.165 (minst) till 636 (maximalt) ms. » 25 % av alla enheter är bättre. Det betyder att den uppmätta svarstiden är bättre än genomsnittet av alla testade enheter (31.1 ms). | ||
Skärmflimmer / PWM (Puls-Width Modulation)
| Skärmflimmer / PWM upptäcktes inte | 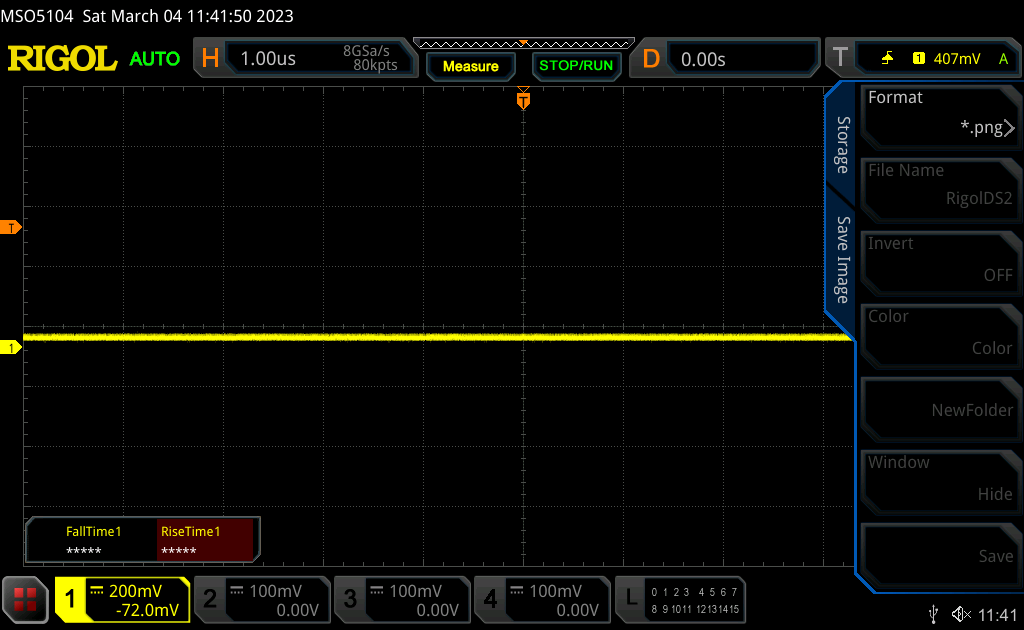 | ||
Som jämförelse: 52 % av alla testade enheter använder inte PWM för att dämpa skärmen. Om PWM upptäcktes mättes ett medelvärde av 7798 (minst: 5 - maximum: 343500) Hz. | |||
Prestanda
Provningsförhållanden
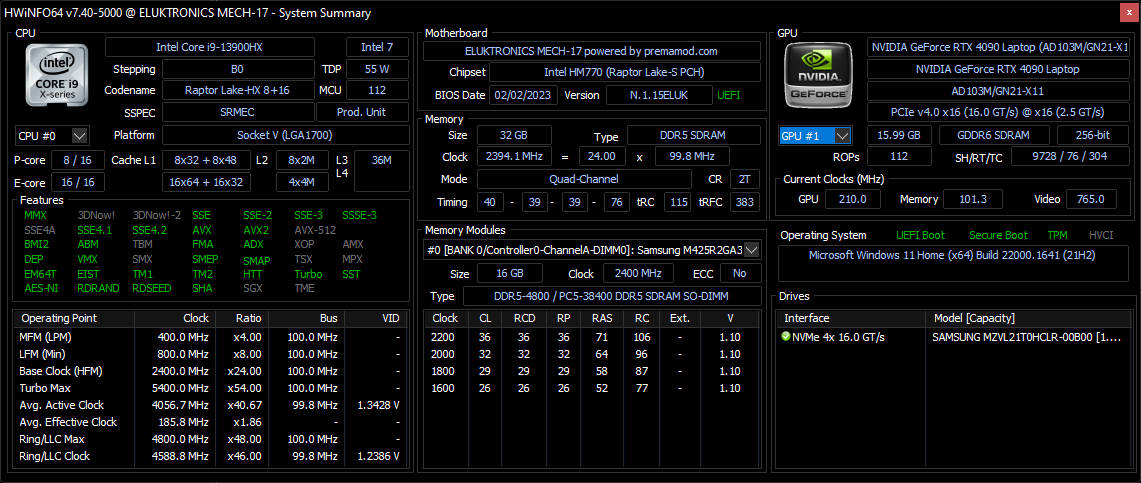
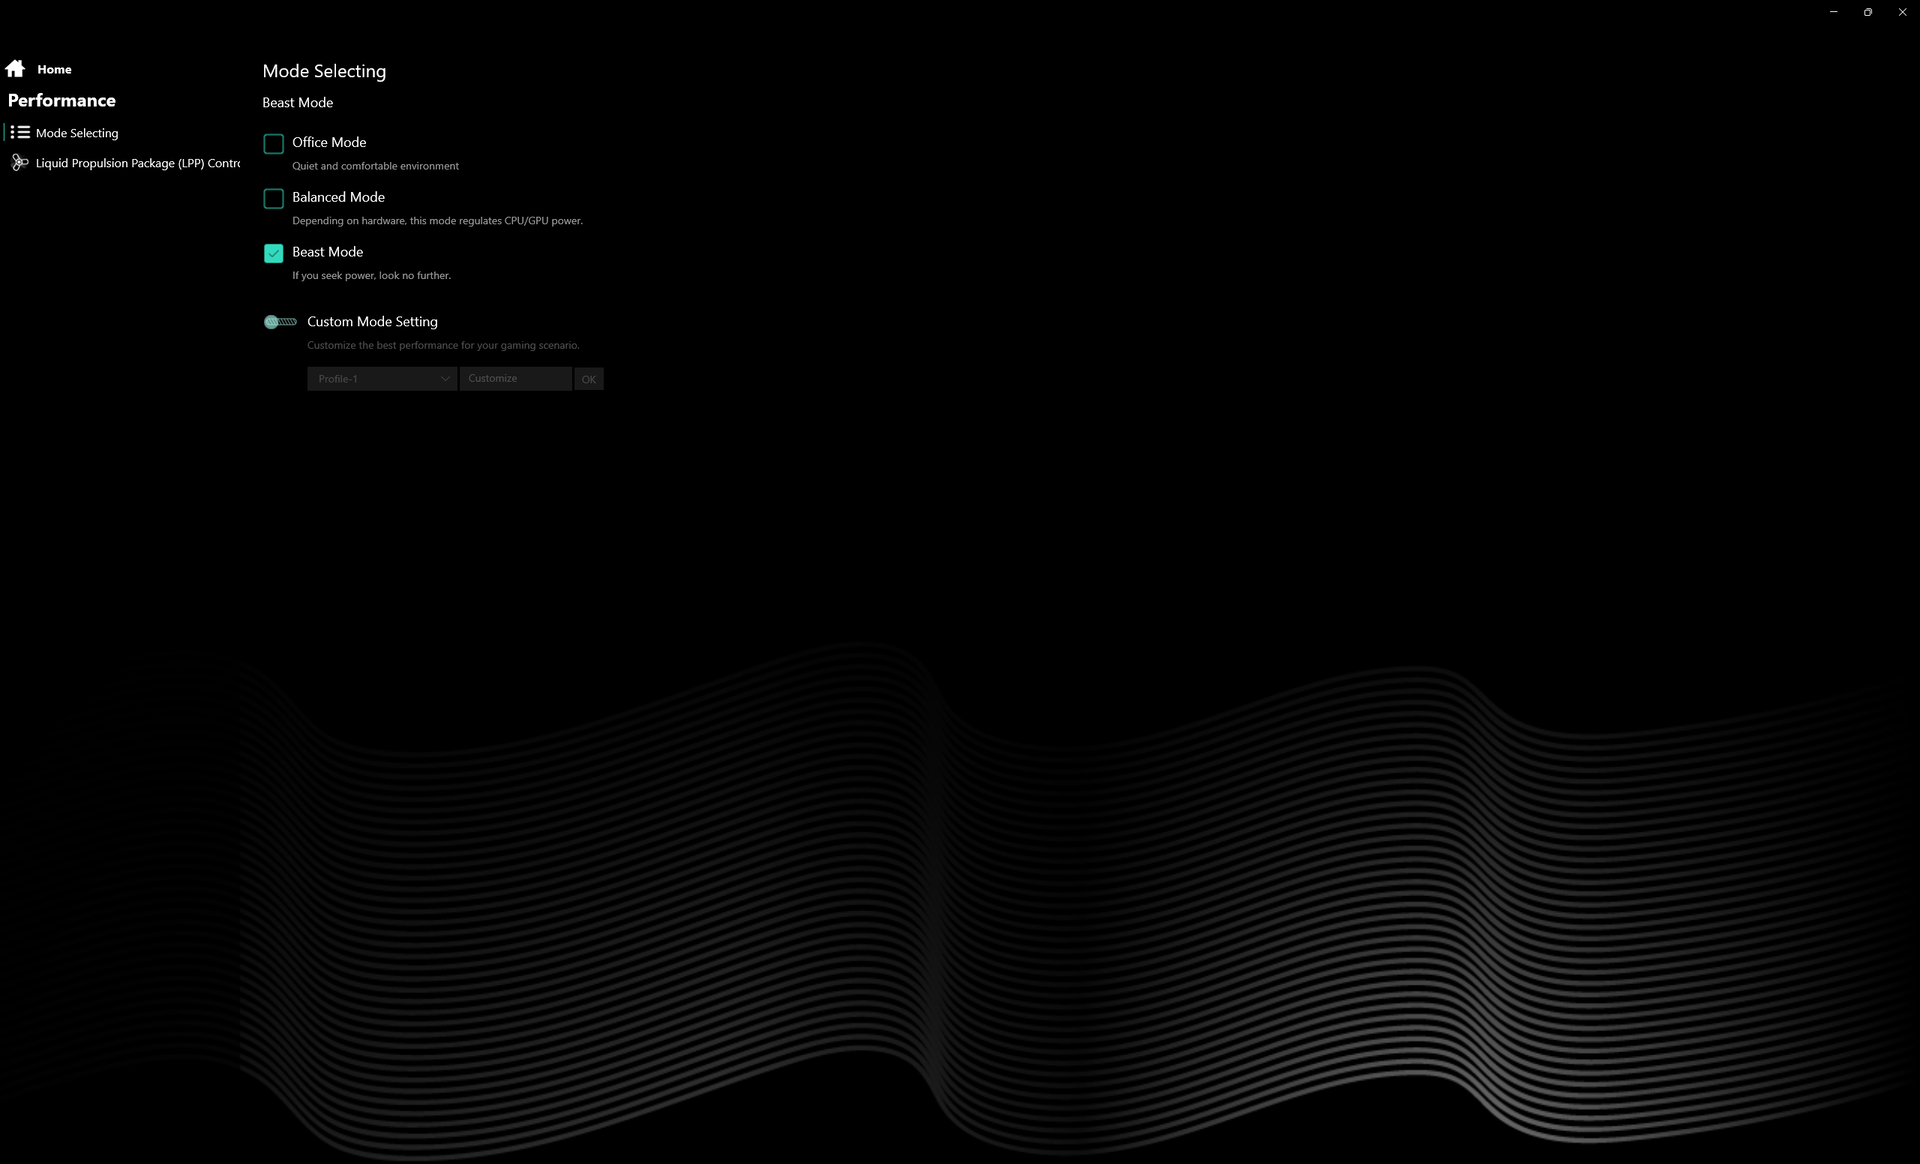
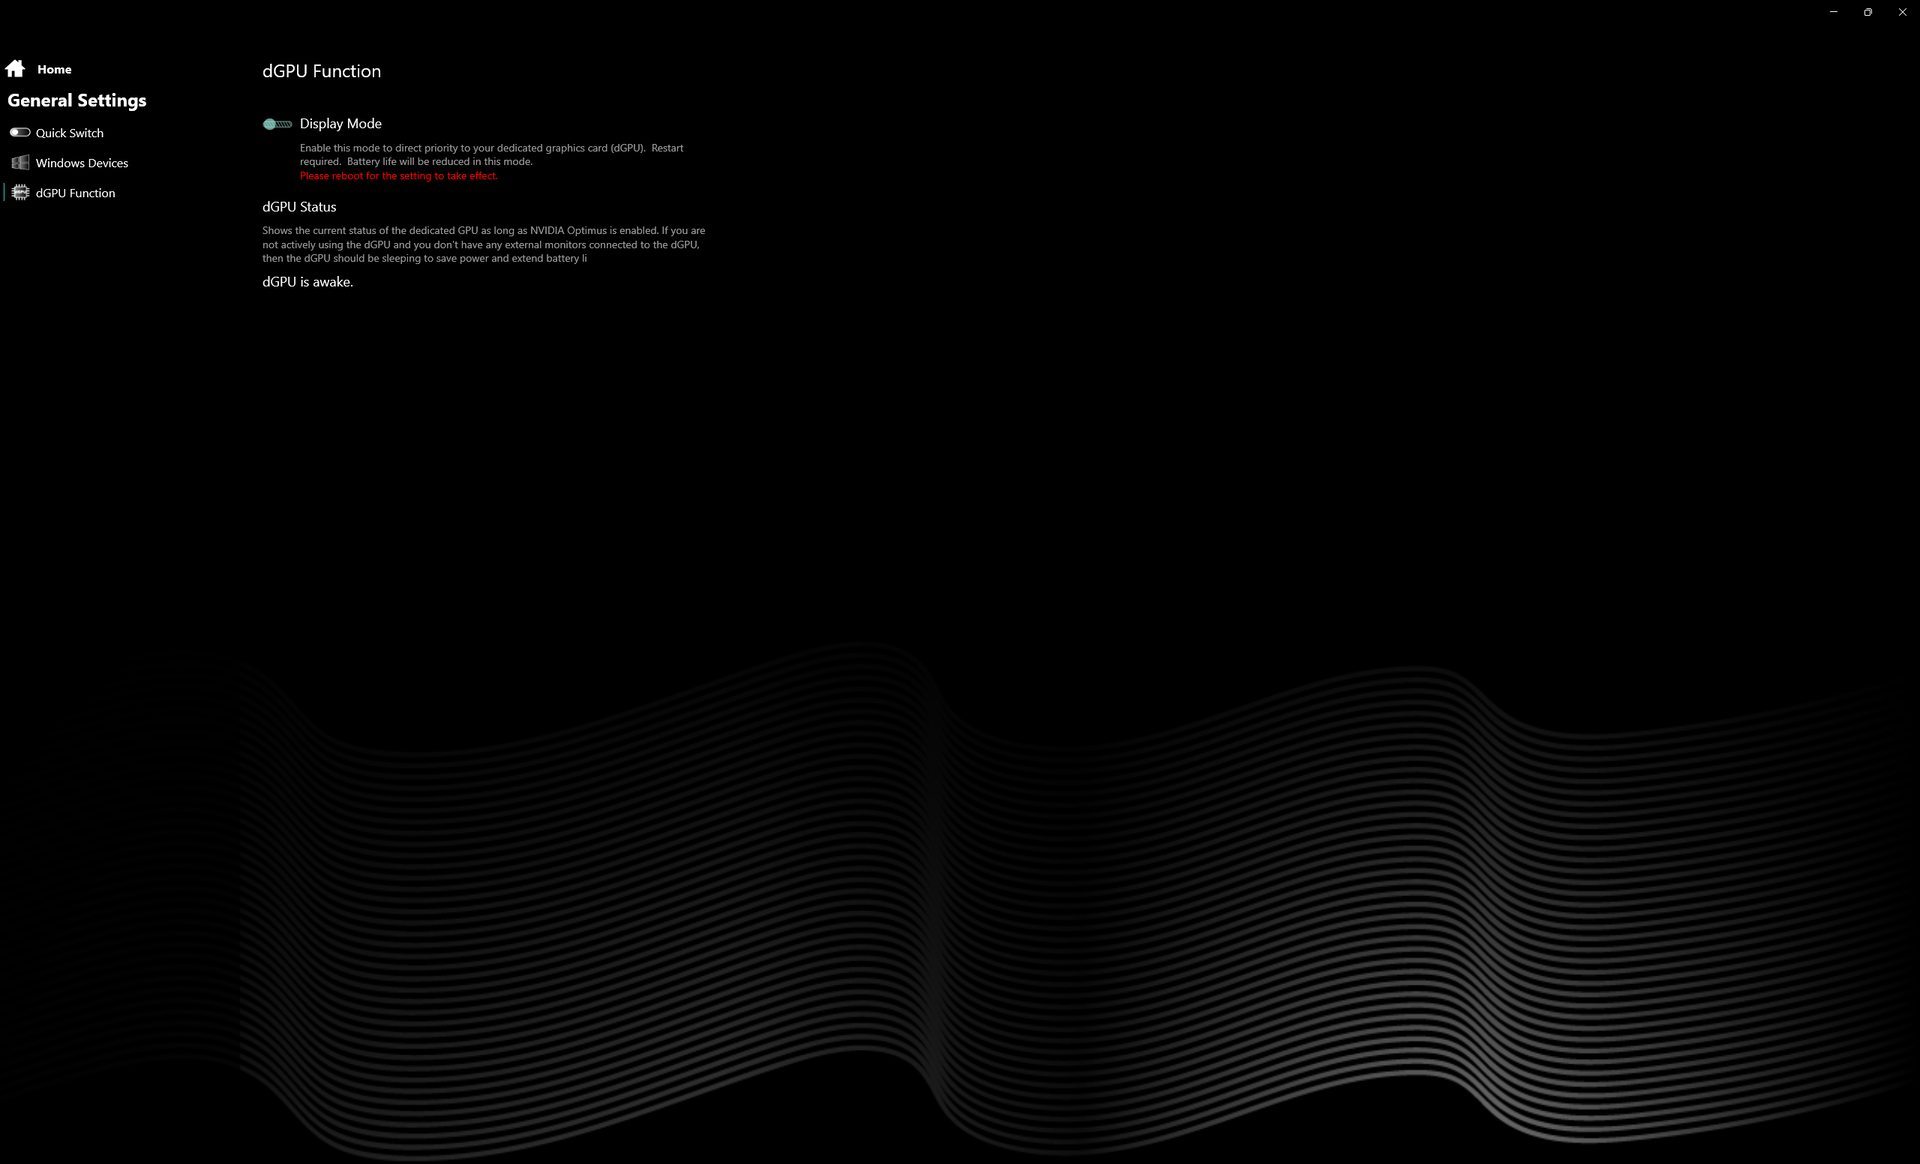
Vi ställde in vår enhet på Performance mode via Windows och "Beast Mode" via den förinstallerade programvaran Eluktronics Control Center innan vi körde några benchmarks nedan. Vi ställde också in systemet på dGPU-läge via Nvidias kontrollpanel. Ägare bör bekanta sig med Control Center eftersom det är navet för att växla modellspecifika funktioner som RGB, batteriladdningslägen, prestandalägen, vätskekylningsläge med mera. Advanced Optimus (MUX) stöds.
Vi upplevde en handfull problem på vår testenhet, bland annat tomma uppstartsskärmar, minst en systemfrysning vid spelande och automatisk omstart när CPU och GPU är maximalt utnyttjade under längre perioder. Vi löste det första problemet genom att inaktivera Quick Boot i BIOS-menyn, men sådana problem borde inte förekomma från början.
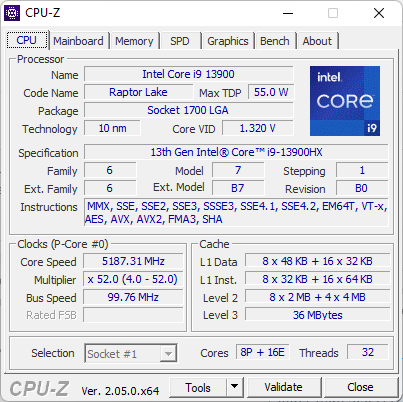
Processor
Den råa CPU-prestandan ligger bara 1-2 procent bakom den 13:e generationen Core i9-13950HX i MSI Titan GT77, så de kan lika gärna vara likvärdiga i de flesta scenarier. Att hoppa från Ryzen 9 6900HX till vår Core i9-13900HX ökar prestandan för flera trådar med extraordinära 2x till 2,5x. Den 12:e generationen Core i7-12700H, som fortfarande är vanlig på många bärbara speldatorer i övre mellanklassen, är ungefär 50 procent långsammare.
Hållbarheten i prestanda är utmärkt utan några större prestandadoppar eller cyklande beteende över tid.
Cinebench R15 Multi Loop
Cinebench R23: Multi Core | Single Core
Cinebench R20: CPU (Multi Core) | CPU (Single Core)
Cinebench R15: CPU Multi 64Bit | CPU Single 64Bit
Blender: v2.79 BMW27 CPU
7-Zip 18.03: 7z b 4 | 7z b 4 -mmt1
Geekbench 5.5: Multi-Core | Single-Core
HWBOT x265 Benchmark v2.2: 4k Preset
LibreOffice : 20 Documents To PDF
R Benchmark 2.5: Overall mean
| CPU Performance rating | |
| Eluktronics Mech-17 GP2 | |
| MSI Titan GT77 HX 13VI | |
| Razer Blade 18 RTX 4070 | |
| Genomsnitt Intel Core i9-13900HX | |
| Corsair One i300 | |
| MSI Titan GT77 12UHS | |
| MSI Pulse GL76 12UGK | |
| MSI Katana 17 B13VFK | |
| Schenker XMG Neo 17 M22 | |
| MSI GS76 Stealth 11UH | |
| HP Omen 16-n0033dx | |
| Schenker XMG Core 17 (Early 2021) | |
| Cinebench R23 / Multi Core | |
| MSI Titan GT77 HX 13VI | |
| Eluktronics Mech-17 GP2 | |
| Razer Blade 18 RTX 4070 | |
| Genomsnitt Intel Core i9-13900HX (24270 - 32623, n=23) | |
| Corsair One i300 | |
| MSI Titan GT77 12UHS | |
| MSI Pulse GL76 12UGK | |
| MSI Katana 17 B13VFK | |
| Schenker XMG Neo 17 M22 | |
| HP Omen 16-n0033dx | |
| MSI GS76 Stealth 11UH | |
| Schenker XMG Core 17 (Early 2021) | |
| Cinebench R23 / Single Core | |
| MSI Titan GT77 HX 13VI | |
| Eluktronics Mech-17 GP2 | |
| Razer Blade 18 RTX 4070 | |
| Genomsnitt Intel Core i9-13900HX (1867 - 2105, n=20) | |
| Corsair One i300 | |
| MSI Titan GT77 12UHS | |
| MSI Katana 17 B13VFK | |
| MSI Pulse GL76 12UGK | |
| MSI GS76 Stealth 11UH | |
| Schenker XMG Neo 17 M22 | |
| HP Omen 16-n0033dx | |
| Schenker XMG Core 17 (Early 2021) | |
| Cinebench R20 / CPU (Multi Core) | |
| MSI Titan GT77 HX 13VI | |
| Eluktronics Mech-17 GP2 | |
| Razer Blade 18 RTX 4070 | |
| Genomsnitt Intel Core i9-13900HX (9152 - 12541, n=21) | |
| Corsair One i300 | |
| MSI Titan GT77 12UHS | |
| MSI Pulse GL76 12UGK | |
| MSI Katana 17 B13VFK | |
| Schenker XMG Neo 17 M22 | |
| HP Omen 16-n0033dx | |
| MSI GS76 Stealth 11UH | |
| Schenker XMG Core 17 (Early 2021) | |
| Cinebench R20 / CPU (Single Core) | |
| MSI Titan GT77 HX 13VI | |
| Eluktronics Mech-17 GP2 | |
| Razer Blade 18 RTX 4070 | |
| Genomsnitt Intel Core i9-13900HX (722 - 810, n=21) | |
| Corsair One i300 | |
| MSI Titan GT77 12UHS | |
| MSI Katana 17 B13VFK | |
| MSI Pulse GL76 12UGK | |
| MSI GS76 Stealth 11UH | |
| Schenker XMG Neo 17 M22 | |
| HP Omen 16-n0033dx | |
| Schenker XMG Core 17 (Early 2021) | |
| Cinebench R15 / CPU Multi 64Bit | |
| MSI Titan GT77 HX 13VI | |
| Eluktronics Mech-17 GP2 | |
| Genomsnitt Intel Core i9-13900HX (3913 - 4970, n=22) | |
| Razer Blade 18 RTX 4070 | |
| MSI Titan GT77 12UHS | |
| Corsair One i300 | |
| MSI Pulse GL76 12UGK | |
| MSI Katana 17 B13VFK | |
| Schenker XMG Neo 17 M22 | |
| HP Omen 16-n0033dx | |
| MSI GS76 Stealth 11UH | |
| Schenker XMG Core 17 (Early 2021) | |
| Cinebench R15 / CPU Single 64Bit | |
| MSI Titan GT77 HX 13VI | |
| Eluktronics Mech-17 GP2 | |
| Razer Blade 18 RTX 4070 | |
| Corsair One i300 | |
| Genomsnitt Intel Core i9-13900HX (247 - 304, n=22) | |
| MSI Titan GT77 12UHS | |
| MSI Katana 17 B13VFK | |
| MSI Pulse GL76 12UGK | |
| Schenker XMG Neo 17 M22 | |
| HP Omen 16-n0033dx | |
| MSI GS76 Stealth 11UH | |
| Schenker XMG Core 17 (Early 2021) | |
| Blender / v2.79 BMW27 CPU | |
| Schenker XMG Core 17 (Early 2021) | |
| MSI GS76 Stealth 11UH | |
| HP Omen 16-n0033dx | |
| Schenker XMG Neo 17 M22 | |
| MSI Katana 17 B13VFK | |
| MSI Pulse GL76 12UGK | |
| MSI Titan GT77 12UHS | |
| Corsair One i300 | |
| Genomsnitt Intel Core i9-13900HX (101 - 153, n=22) | |
| Razer Blade 18 RTX 4070 | |
| Eluktronics Mech-17 GP2 | |
| MSI Titan GT77 HX 13VI | |
| 7-Zip 18.03 / 7z b 4 | |
| MSI Titan GT77 HX 13VI | |
| Eluktronics Mech-17 GP2 | |
| Razer Blade 18 RTX 4070 | |
| Genomsnitt Intel Core i9-13900HX (90675 - 127283, n=21) | |
| Corsair One i300 | |
| MSI Titan GT77 12UHS | |
| MSI Pulse GL76 12UGK | |
| Schenker XMG Neo 17 M22 | |
| MSI Katana 17 B13VFK | |
| HP Omen 16-n0033dx | |
| MSI GS76 Stealth 11UH | |
| Schenker XMG Core 17 (Early 2021) | |
| 7-Zip 18.03 / 7z b 4 -mmt1 | |
| Eluktronics Mech-17 GP2 | |
| MSI Titan GT77 HX 13VI | |
| Razer Blade 18 RTX 4070 | |
| Genomsnitt Intel Core i9-13900HX (6340 - 7177, n=21) | |
| Corsair One i300 | |
| MSI Titan GT77 12UHS | |
| Schenker XMG Neo 17 M22 | |
| MSI Katana 17 B13VFK | |
| MSI Pulse GL76 12UGK | |
| HP Omen 16-n0033dx | |
| MSI GS76 Stealth 11UH | |
| Schenker XMG Core 17 (Early 2021) | |
| Geekbench 5.5 / Multi-Core | |
| Eluktronics Mech-17 GP2 | |
| MSI Titan GT77 HX 13VI | |
| Razer Blade 18 RTX 4070 | |
| Genomsnitt Intel Core i9-13900HX (17614 - 21075, n=22) | |
| Corsair One i300 | |
| MSI Titan GT77 12UHS | |
| MSI Pulse GL76 12UGK | |
| MSI Katana 17 B13VFK | |
| Schenker XMG Neo 17 M22 | |
| MSI GS76 Stealth 11UH | |
| HP Omen 16-n0033dx | |
| Schenker XMG Core 17 (Early 2021) | |
| Geekbench 5.5 / Single-Core | |
| Eluktronics Mech-17 GP2 | |
| MSI Titan GT77 HX 13VI | |
| Razer Blade 18 RTX 4070 | |
| Genomsnitt Intel Core i9-13900HX (1345 - 2093, n=22) | |
| Corsair One i300 | |
| MSI Titan GT77 12UHS | |
| MSI Katana 17 B13VFK | |
| MSI Pulse GL76 12UGK | |
| MSI GS76 Stealth 11UH | |
| Schenker XMG Neo 17 M22 | |
| HP Omen 16-n0033dx | |
| Schenker XMG Core 17 (Early 2021) | |
| HWBOT x265 Benchmark v2.2 / 4k Preset | |
| Eluktronics Mech-17 GP2 | |
| MSI Titan GT77 HX 13VI | |
| Razer Blade 18 RTX 4070 | |
| Genomsnitt Intel Core i9-13900HX (23.5 - 34.4, n=22) | |
| Corsair One i300 | |
| MSI Titan GT77 12UHS | |
| MSI Pulse GL76 12UGK | |
| Schenker XMG Neo 17 M22 | |
| MSI Katana 17 B13VFK | |
| HP Omen 16-n0033dx | |
| MSI GS76 Stealth 11UH | |
| Schenker XMG Core 17 (Early 2021) | |
| LibreOffice / 20 Documents To PDF | |
| HP Omen 16-n0033dx | |
| MSI Katana 17 B13VFK | |
| Schenker XMG Core 17 (Early 2021) | |
| Schenker XMG Neo 17 M22 | |
| MSI GS76 Stealth 11UH | |
| MSI Titan GT77 HX 13VI | |
| MSI Pulse GL76 12UGK | |
| Razer Blade 18 RTX 4070 | |
| Genomsnitt Intel Core i9-13900HX (32.8 - 51.1, n=21) | |
| MSI Titan GT77 12UHS | |
| Corsair One i300 | |
| Eluktronics Mech-17 GP2 | |
| R Benchmark 2.5 / Overall mean | |
| Schenker XMG Core 17 (Early 2021) | |
| MSI GS76 Stealth 11UH | |
| HP Omen 16-n0033dx | |
| Schenker XMG Neo 17 M22 | |
| MSI Pulse GL76 12UGK | |
| MSI Katana 17 B13VFK | |
| MSI Titan GT77 12UHS | |
| MSI Titan GT77 HX 13VI | |
| Genomsnitt Intel Core i9-13900HX (0.375 - 0.4564, n=22) | |
| Razer Blade 18 RTX 4070 | |
| Corsair One i300 | |
| Eluktronics Mech-17 GP2 | |
* ... mindre är bättre
AIDA64: FP32 Ray-Trace | FPU Julia | CPU SHA3 | CPU Queen | FPU SinJulia | FPU Mandel | CPU AES | CPU ZLib | FP64 Ray-Trace | CPU PhotoWorxx
| Performance rating | |
| Eluktronics Mech-17 GP2 | |
| MSI Titan GT77 HX 13VI | |
| Razer Blade 18 RTX 4070 | |
| Genomsnitt Intel Core i9-13900HX | |
| Schenker XMG Neo 17 M22 | |
| Alienware m17 R5 (R9 6900HX, RX 6850M XT) | |
| MSI Katana 17 B13VFK | |
| AIDA64 / FP32 Ray-Trace | |
| MSI Titan GT77 HX 13VI | |
| Eluktronics Mech-17 GP2 | |
| Razer Blade 18 RTX 4070 | |
| Genomsnitt Intel Core i9-13900HX (17589 - 27615, n=22) | |
| Alienware m17 R5 (R9 6900HX, RX 6850M XT) | |
| Schenker XMG Neo 17 M22 | |
| MSI Katana 17 B13VFK | |
| AIDA64 / FPU Julia | |
| MSI Titan GT77 HX 13VI | |
| Eluktronics Mech-17 GP2 | |
| Razer Blade 18 RTX 4070 | |
| Genomsnitt Intel Core i9-13900HX (88686 - 137015, n=22) | |
| Alienware m17 R5 (R9 6900HX, RX 6850M XT) | |
| Schenker XMG Neo 17 M22 | |
| MSI Katana 17 B13VFK | |
| AIDA64 / CPU SHA3 | |
| MSI Titan GT77 HX 13VI | |
| Eluktronics Mech-17 GP2 | |
| Razer Blade 18 RTX 4070 | |
| Genomsnitt Intel Core i9-13900HX (4362 - 7029, n=22) | |
| Alienware m17 R5 (R9 6900HX, RX 6850M XT) | |
| Schenker XMG Neo 17 M22 | |
| MSI Katana 17 B13VFK | |
| AIDA64 / CPU Queen | |
| Eluktronics Mech-17 GP2 | |
| MSI Titan GT77 HX 13VI | |
| Razer Blade 18 RTX 4070 | |
| Genomsnitt Intel Core i9-13900HX (125644 - 141385, n=22) | |
| Alienware m17 R5 (R9 6900HX, RX 6850M XT) | |
| Schenker XMG Neo 17 M22 | |
| MSI Katana 17 B13VFK | |
| AIDA64 / FPU SinJulia | |
| Eluktronics Mech-17 GP2 | |
| MSI Titan GT77 HX 13VI | |
| Razer Blade 18 RTX 4070 | |
| Genomsnitt Intel Core i9-13900HX (12334 - 17179, n=22) | |
| Alienware m17 R5 (R9 6900HX, RX 6850M XT) | |
| Schenker XMG Neo 17 M22 | |
| MSI Katana 17 B13VFK | |
| AIDA64 / FPU Mandel | |
| MSI Titan GT77 HX 13VI | |
| Eluktronics Mech-17 GP2 | |
| Razer Blade 18 RTX 4070 | |
| Genomsnitt Intel Core i9-13900HX (43850 - 69202, n=22) | |
| Alienware m17 R5 (R9 6900HX, RX 6850M XT) | |
| Schenker XMG Neo 17 M22 | |
| MSI Katana 17 B13VFK | |
| AIDA64 / CPU AES | |
| Eluktronics Mech-17 GP2 | |
| Genomsnitt Intel Core i9-13900HX (89413 - 237881, n=22) | |
| MSI Titan GT77 HX 13VI | |
| Schenker XMG Neo 17 M22 | |
| Razer Blade 18 RTX 4070 | |
| MSI Katana 17 B13VFK | |
| Alienware m17 R5 (R9 6900HX, RX 6850M XT) | |
| AIDA64 / CPU ZLib | |
| MSI Titan GT77 HX 13VI | |
| Eluktronics Mech-17 GP2 | |
| Razer Blade 18 RTX 4070 | |
| Genomsnitt Intel Core i9-13900HX (1284 - 1958, n=22) | |
| Alienware m17 R5 (R9 6900HX, RX 6850M XT) | |
| Schenker XMG Neo 17 M22 | |
| MSI Katana 17 B13VFK | |
| AIDA64 / FP64 Ray-Trace | |
| MSI Titan GT77 HX 13VI | |
| Eluktronics Mech-17 GP2 | |
| Razer Blade 18 RTX 4070 | |
| Genomsnitt Intel Core i9-13900HX (9481 - 15279, n=22) | |
| Alienware m17 R5 (R9 6900HX, RX 6850M XT) | |
| Schenker XMG Neo 17 M22 | |
| MSI Katana 17 B13VFK | |
| AIDA64 / CPU PhotoWorxx | |
| Razer Blade 18 RTX 4070 | |
| Genomsnitt Intel Core i9-13900HX (42994 - 51994, n=22) | |
| Eluktronics Mech-17 GP2 | |
| MSI Titan GT77 HX 13VI | |
| MSI Katana 17 B13VFK | |
| Alienware m17 R5 (R9 6900HX, RX 6850M XT) | |
| Schenker XMG Neo 17 M22 | |
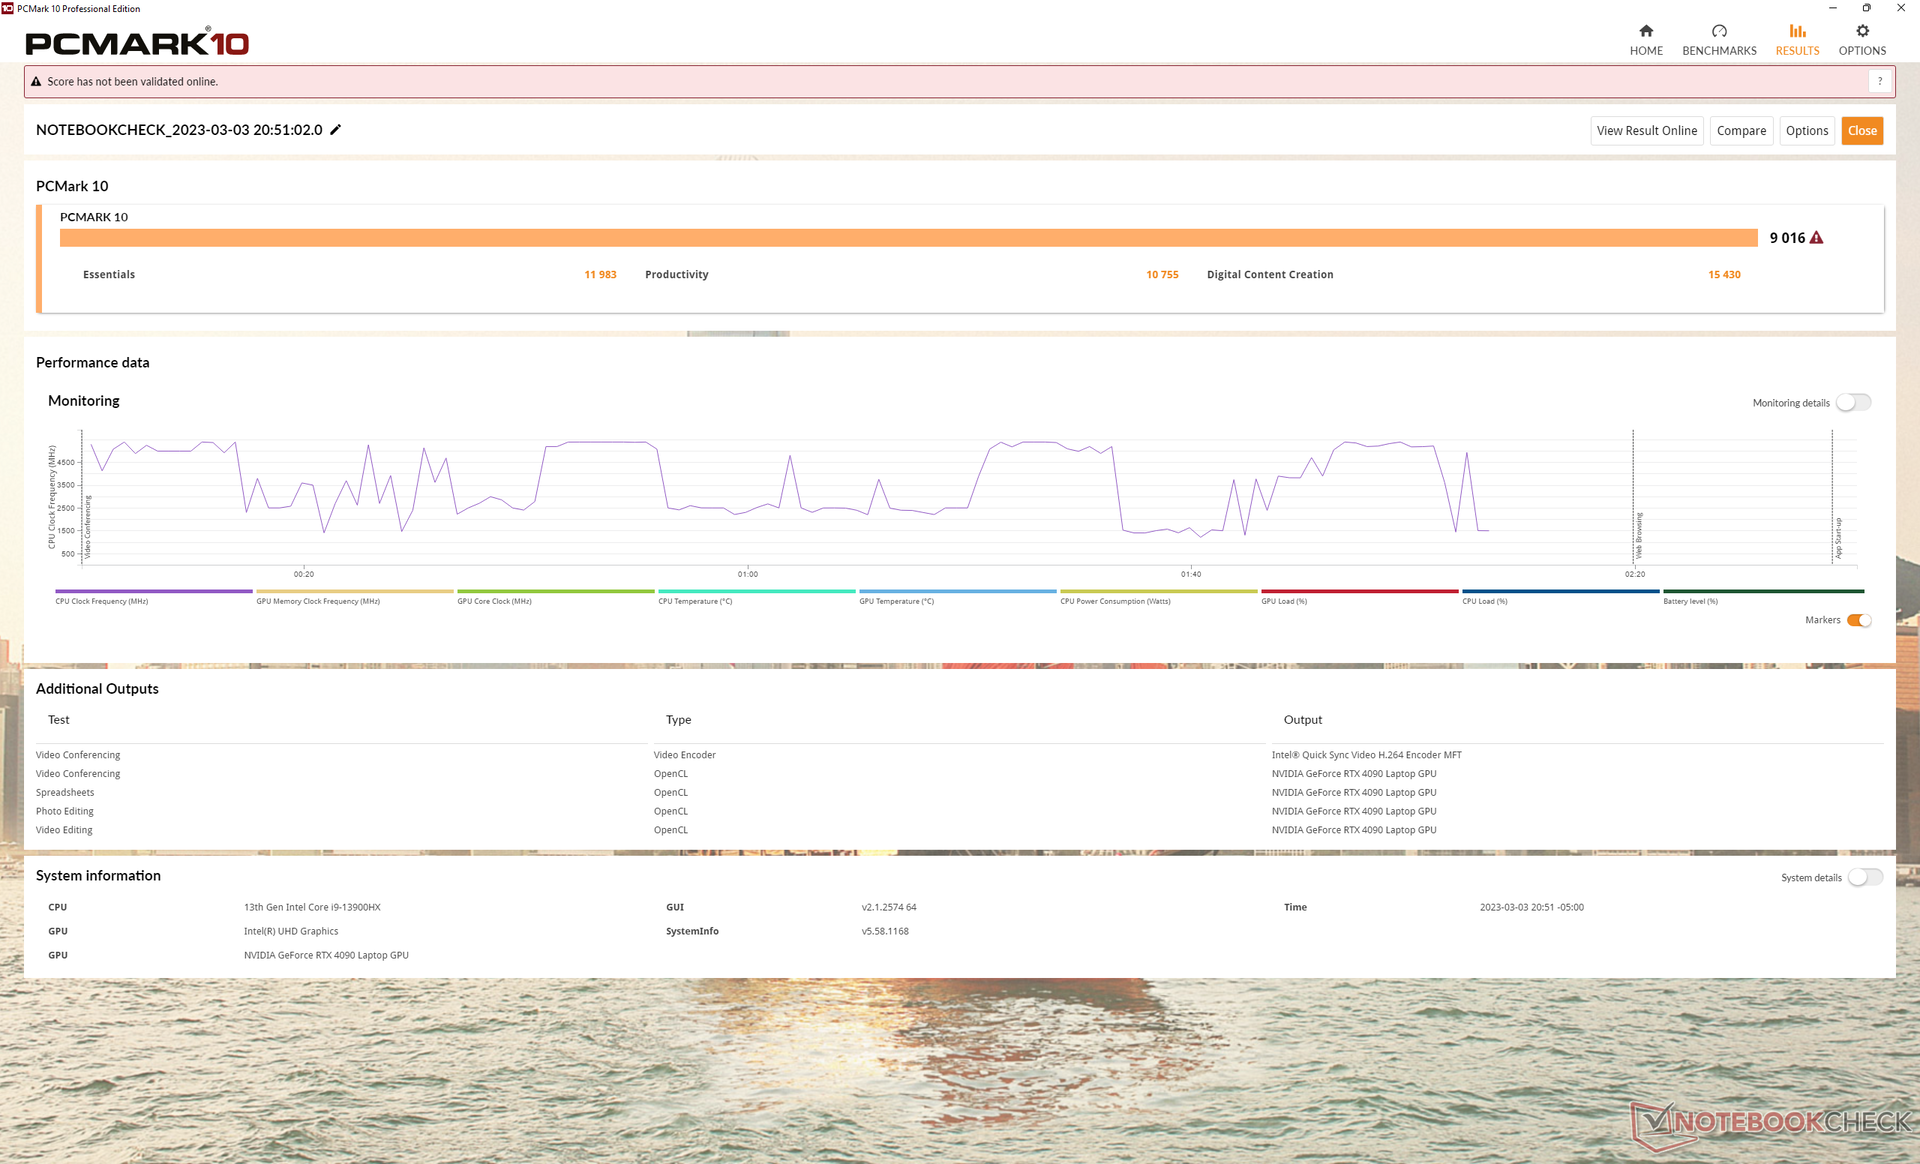
Systemets prestanda
PCMark-resultaten är några av de högsta i vår databas och konkurrerar med MSI Titan GT77. Särskilt poängen för Digital Content Creation är nästan 70 procent högre än på förra årets RTX 3080 Ti-modell på grund av den ökade grafikprestandan.
CrossMark: Overall | Productivity | Creativity | Responsiveness
| PCMark 10 / Score | |
| Eluktronics Mech-17 GP2 | |
| MSI Titan GT77 HX 13VI | |
| Genomsnitt Intel Core i9-13900HX, NVIDIA GeForce RTX 4090 Laptop GPU (7690 - 9331, n=8) | |
| Razer Blade 18 RTX 4070 | |
| Alienware m17 R5 (R9 6900HX, RX 6850M XT) | |
| MSI Katana 17 B13VFK | |
| Schenker XMG Neo 17 M22 | |
| PCMark 10 / Essentials | |
| Eluktronics Mech-17 GP2 | |
| MSI Titan GT77 HX 13VI | |
| Razer Blade 18 RTX 4070 | |
| Genomsnitt Intel Core i9-13900HX, NVIDIA GeForce RTX 4090 Laptop GPU (10972 - 11983, n=8) | |
| MSI Katana 17 B13VFK | |
| Alienware m17 R5 (R9 6900HX, RX 6850M XT) | |
| Schenker XMG Neo 17 M22 | |
| PCMark 10 / Productivity | |
| Eluktronics Mech-17 GP2 | |
| Genomsnitt Intel Core i9-13900HX, NVIDIA GeForce RTX 4090 Laptop GPU (9038 - 11680, n=8) | |
| MSI Titan GT77 HX 13VI | |
| Razer Blade 18 RTX 4070 | |
| Schenker XMG Neo 17 M22 | |
| MSI Katana 17 B13VFK | |
| Alienware m17 R5 (R9 6900HX, RX 6850M XT) | |
| PCMark 10 / Digital Content Creation | |
| MSI Titan GT77 HX 13VI | |
| Eluktronics Mech-17 GP2 | |
| Genomsnitt Intel Core i9-13900HX, NVIDIA GeForce RTX 4090 Laptop GPU (10605 - 16395, n=8) | |
| Alienware m17 R5 (R9 6900HX, RX 6850M XT) | |
| Razer Blade 18 RTX 4070 | |
| MSI Katana 17 B13VFK | |
| Schenker XMG Neo 17 M22 | |
| CrossMark / Overall | |
| Eluktronics Mech-17 GP2 | |
| MSI Titan GT77 HX 13VI | |
| Razer Blade 18 RTX 4070 | |
| Genomsnitt Intel Core i9-13900HX, NVIDIA GeForce RTX 4090 Laptop GPU (1825 - 2295, n=8) | |
| MSI Katana 17 B13VFK | |
| Schenker XMG Neo 17 M22 | |
| Alienware m17 R5 (R9 6900HX, RX 6850M XT) | |
| CrossMark / Productivity | |
| Eluktronics Mech-17 GP2 | |
| MSI Titan GT77 HX 13VI | |
| Razer Blade 18 RTX 4070 | |
| Genomsnitt Intel Core i9-13900HX, NVIDIA GeForce RTX 4090 Laptop GPU (1666 - 2166, n=8) | |
| MSI Katana 17 B13VFK | |
| Schenker XMG Neo 17 M22 | |
| Alienware m17 R5 (R9 6900HX, RX 6850M XT) | |
| CrossMark / Creativity | |
| Eluktronics Mech-17 GP2 | |
| MSI Titan GT77 HX 13VI | |
| Razer Blade 18 RTX 4070 | |
| Genomsnitt Intel Core i9-13900HX, NVIDIA GeForce RTX 4090 Laptop GPU (2162 - 2514, n=8) | |
| MSI Katana 17 B13VFK | |
| Schenker XMG Neo 17 M22 | |
| Alienware m17 R5 (R9 6900HX, RX 6850M XT) | |
| CrossMark / Responsiveness | |
| Razer Blade 18 RTX 4070 | |
| MSI Titan GT77 HX 13VI | |
| Eluktronics Mech-17 GP2 | |
| Genomsnitt Intel Core i9-13900HX, NVIDIA GeForce RTX 4090 Laptop GPU (1441 - 2275, n=8) | |
| MSI Katana 17 B13VFK | |
| Schenker XMG Neo 17 M22 | |
| Alienware m17 R5 (R9 6900HX, RX 6850M XT) | |
| PCMark 10 Score | 9016 poäng | |
Hjälp | ||
| AIDA64 / Memory Copy | |
| Razer Blade 18 RTX 4070 | |
| Genomsnitt Intel Core i9-13900HX (67716 - 79193, n=22) | |
| Eluktronics Mech-17 GP2 | |
| MSI Titan GT77 HX 13VI | |
| MSI Katana 17 B13VFK | |
| Alienware m17 R5 (R9 6900HX, RX 6850M XT) | |
| Schenker XMG Neo 17 M22 | |
| AIDA64 / Memory Read | |
| Razer Blade 18 RTX 4070 | |
| Genomsnitt Intel Core i9-13900HX (73998 - 88462, n=22) | |
| Eluktronics Mech-17 GP2 | |
| MSI Titan GT77 HX 13VI | |
| MSI Katana 17 B13VFK | |
| Schenker XMG Neo 17 M22 | |
| Alienware m17 R5 (R9 6900HX, RX 6850M XT) | |
| AIDA64 / Memory Write | |
| Razer Blade 18 RTX 4070 | |
| Genomsnitt Intel Core i9-13900HX (65472 - 77045, n=22) | |
| Eluktronics Mech-17 GP2 | |
| MSI Titan GT77 HX 13VI | |
| Schenker XMG Neo 17 M22 | |
| Alienware m17 R5 (R9 6900HX, RX 6850M XT) | |
| MSI Katana 17 B13VFK | |
| AIDA64 / Memory Latency | |
| MSI Katana 17 B13VFK | |
| Alienware m17 R5 (R9 6900HX, RX 6850M XT) | |
| MSI Titan GT77 HX 13VI | |
| Schenker XMG Neo 17 M22 | |
| Eluktronics Mech-17 GP2 | |
| Genomsnitt Intel Core i9-13900HX (75.3 - 91.1, n=22) | |
| Razer Blade 18 RTX 4070 | |
* ... mindre är bättre
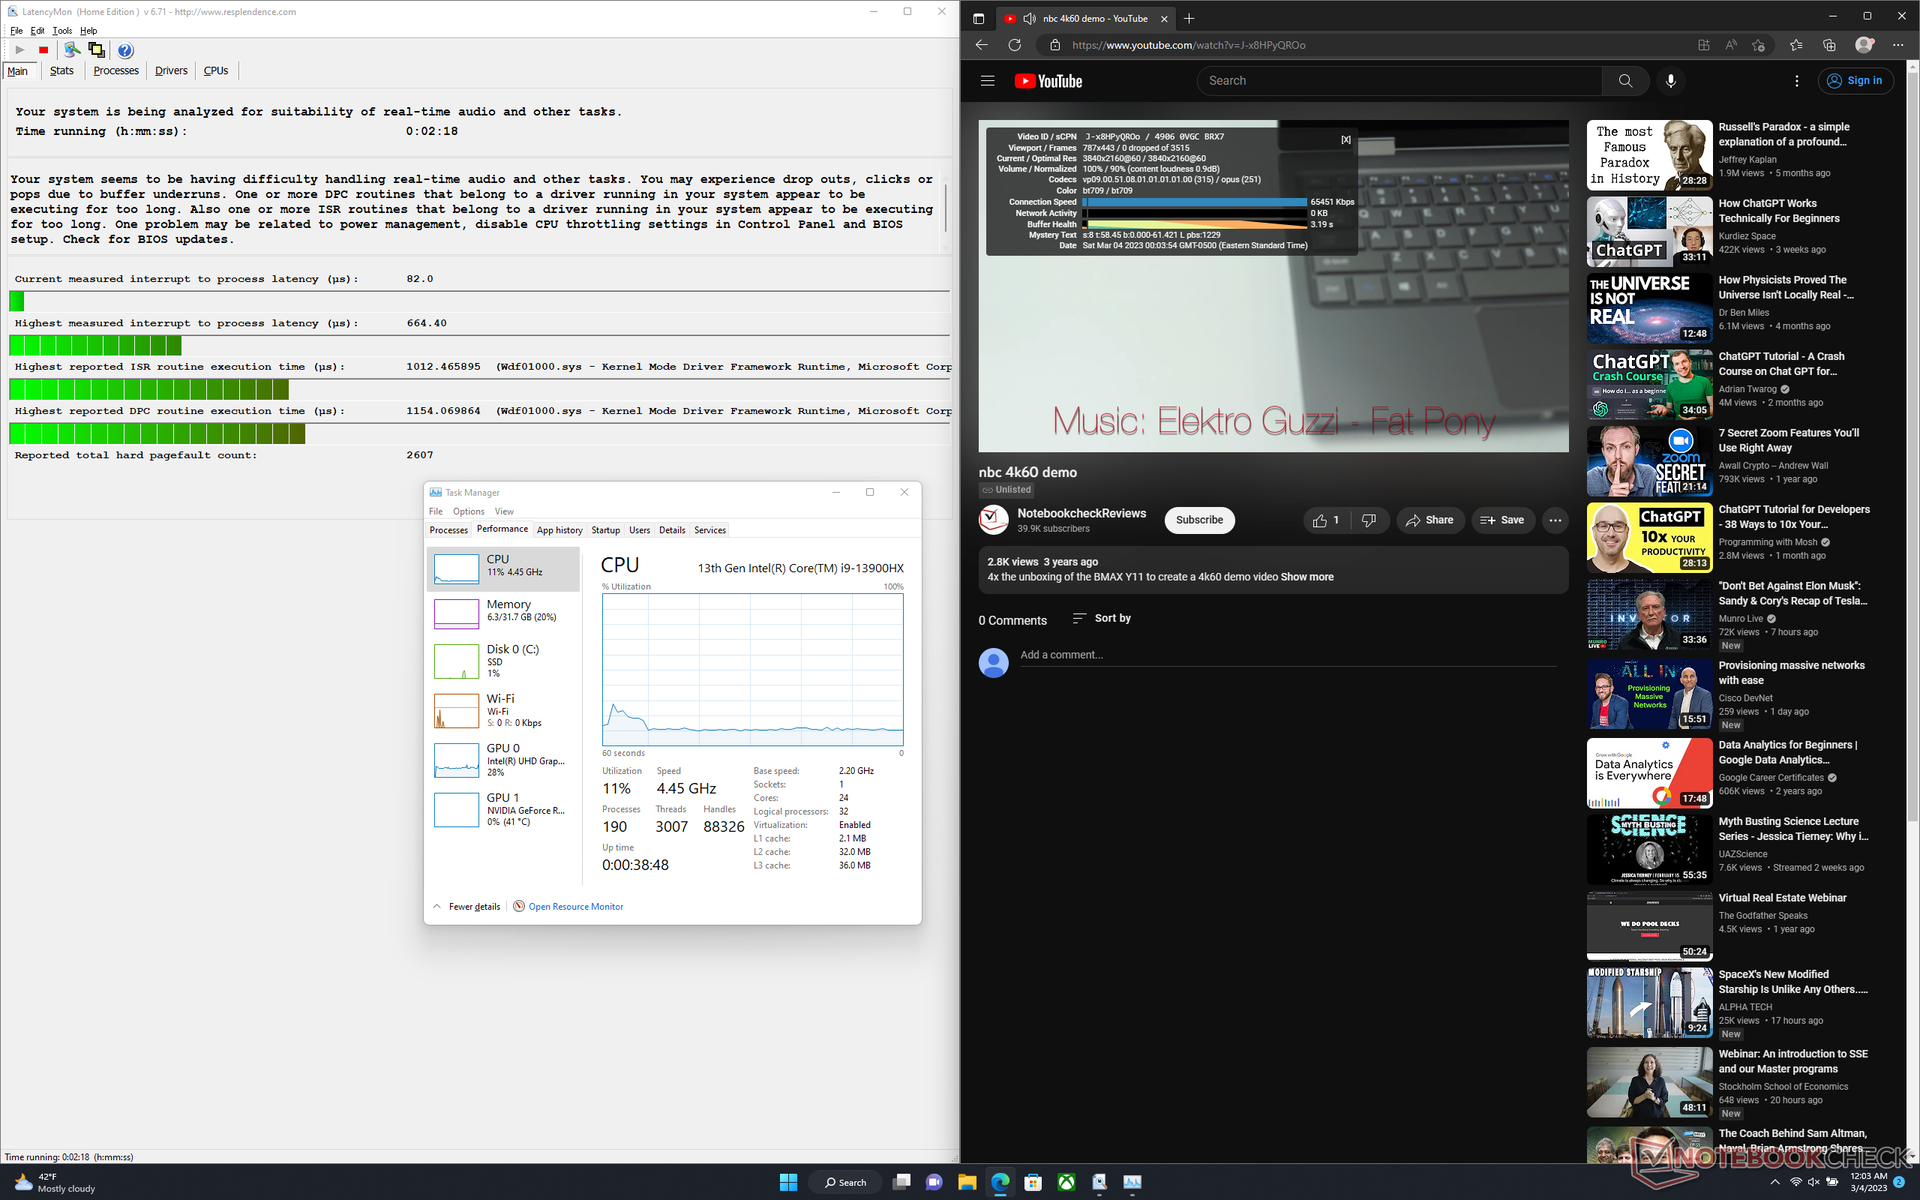
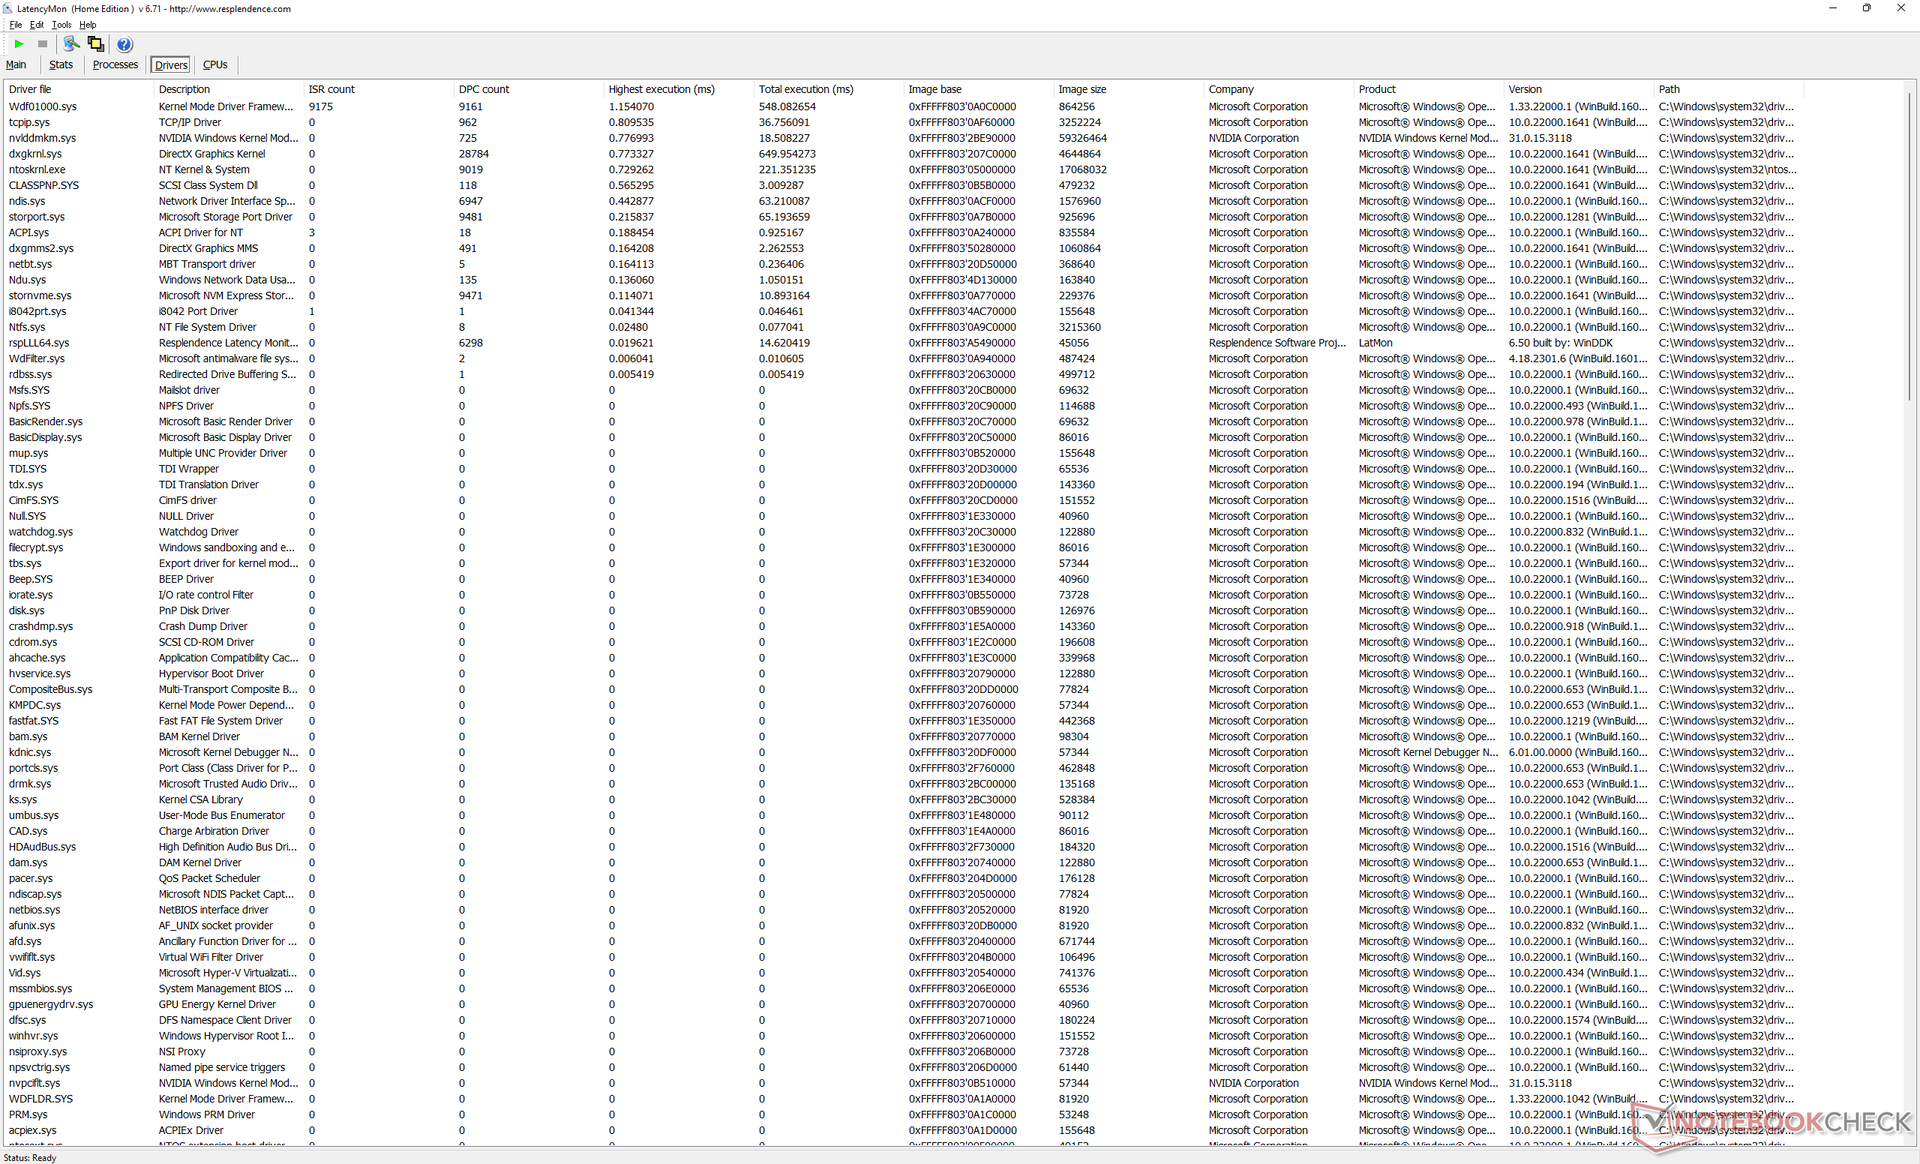
DPC-latenstid
LatencyMon avslöjar mindre DPC-problem när man öppnar flera webbläsarflikar på vår hemsida. uppspelning av 4K-video vid 60 FPS är annars perfekt utan några tappade bilder.
| DPC Latencies / LatencyMon - interrupt to process latency (max), Web, Youtube, Prime95 | |
| MSI Titan GT77 HX 13VI | |
| Schenker XMG Neo 17 M22 | |
| MSI Katana 17 B13VFK | |
| Alienware m17 R5 (R9 6900HX, RX 6850M XT) | |
| Razer Blade 18 RTX 4070 | |
| Eluktronics Mech-17 GP2 | |
* ... mindre är bättre
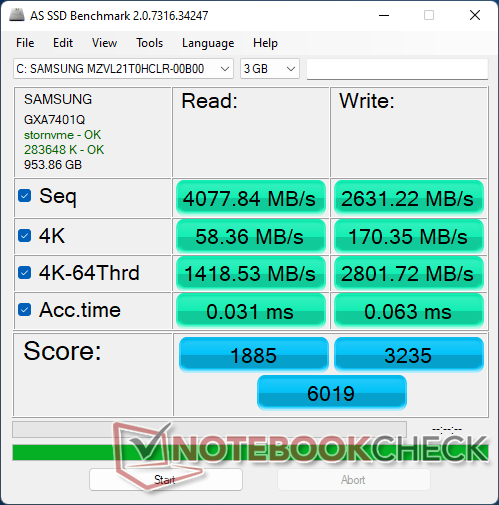
Lagringsenheter
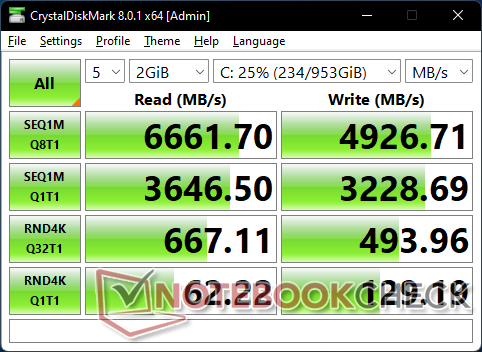
Vår enhet levereras med en 1 TB Samsung PM9A1 MZVL21T0HCLR som är en av de snabbaste konsumentbaserade PCIe4 x4 NVMe SSD-enheterna som finns tillgängliga för närvarande. Tyvärr uppvisar enheten i vår enhet problem med att upprätthålla maximal överföringshastighet under längre perioder, vilket framgår av vår stresstestdiagram nedan. Som jämförelse kan Razer Blade 15 med samma Samsung-enhet upprätthålla överföringshastigheter på 6700 MB/s utan problem.

| Drive Performance rating - Percent | |
| Schenker XMG Neo 17 M22 | |
| MSI Titan GT77 HX 13VI | |
| Razer Blade 18 RTX 4070 | |
| MSI Katana 17 B13VFK | |
| Eluktronics Mech-17 GP2 | |
| Alienware m17 R5 (R9 6900HX, RX 6850M XT) | |
* ... mindre är bättre
Disk Throttling: DiskSpd Read Loop, Queue Depth 8
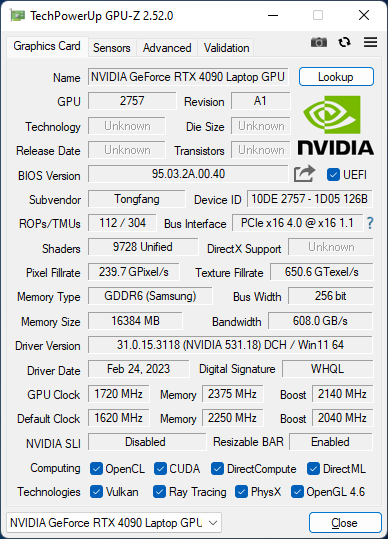
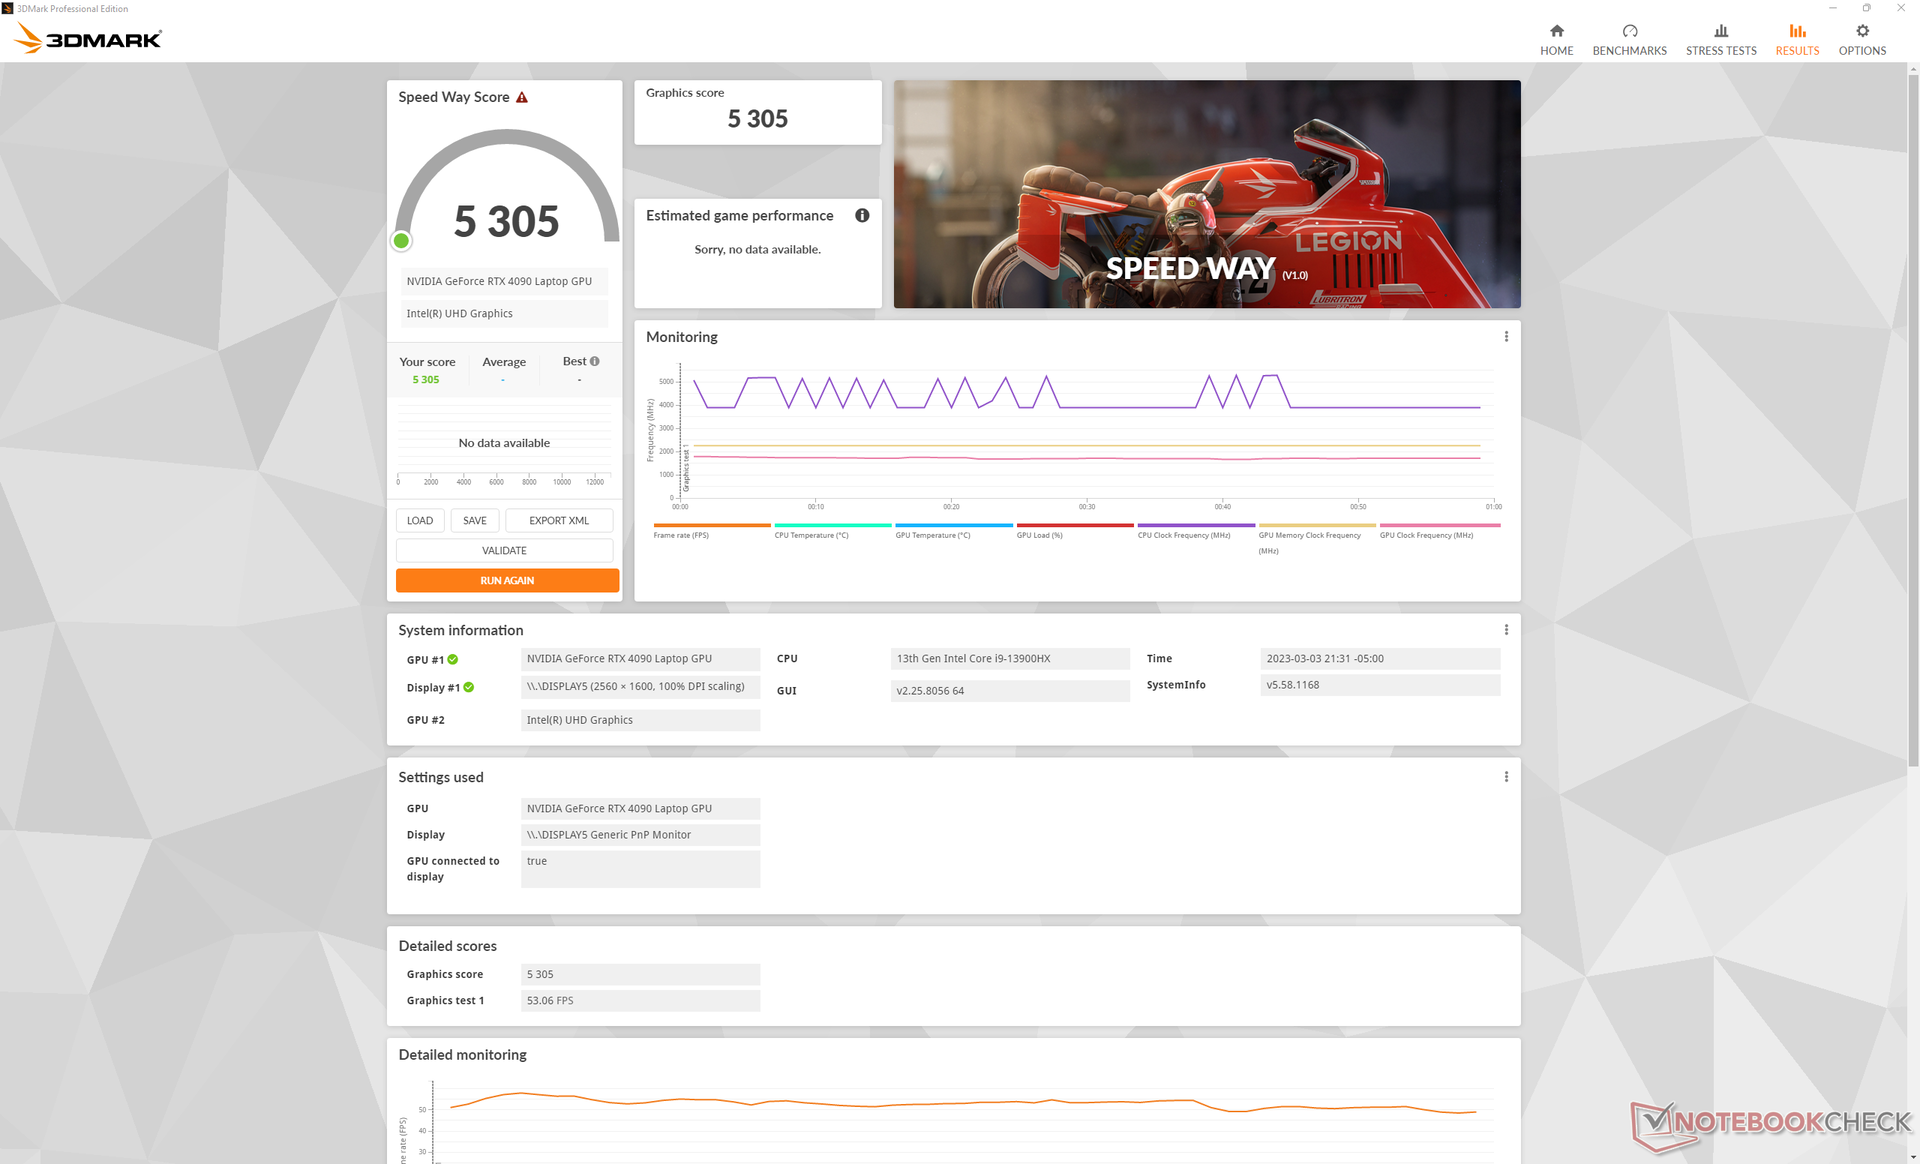
GPU-prestanda
Den totala prestandan är cirka 40-60 procent snabbare än den mobila RTX 3080 Ti för att vara ungefär på samma nivå som stationära RTX 3080 Ti. Genom att aktivera DLSS 3 på titlar som stöds ökar prestandan ännu mer med 2x till 3x, även om det kan leda till grafiska artefakter.
De flesta spel kan köras i 4K och 60 FPS om RT-effekter inte stöds eller är inaktiverade. Undantag är mycket krävande titlar som Cyberpunk 2077 eller F1 22 där bildfrekvensen i stället ligger på 40-50 FPS. I det här fallet kan G-Sync och DLSS komma väl till pass för att minska tearing respektive öka prestandan.
Att välja RTX 4080- eller RTX 4070-konfigurationen i stället för RTX 4090 minskar grafikprestandan med 10 till 15 procent respektive 40 till 45 procent. Prestandadeltat mellan 4090 och 4080 är alltså mycket mindre än prestandadeltat mellan 4080 och 4070 trots att prisskillnaden är en fast 500 dollar mellan varje steg.
| 3DMark Performance rating - Percent | |
| Schenker XMG SECTOR, i9 13900K, RTX 4090 | |
| MSI Titan GT77 HX 13VI | |
| Eluktronics Mech-17 GP2 | |
| Genomsnitt NVIDIA GeForce RTX 4090 Laptop GPU | |
| Corsair One i300 -1! | |
| Razer Blade 16 Early 2023 | |
| MSI Titan GT77 12UHS -1! | |
| Schenker XMG Neo 17 M22 -1! | |
| MSI Katana 17 B13VFK -2! | |
| Razer Blade 18 RTX 4070 | |
| MSI GS76 Stealth 11UH -2! | |
| MSI Pulse GL76 12UGK | |
| HP Omen 16-n0033dx | |
| Schenker XMG Core 17 (Early 2021) -1! | |
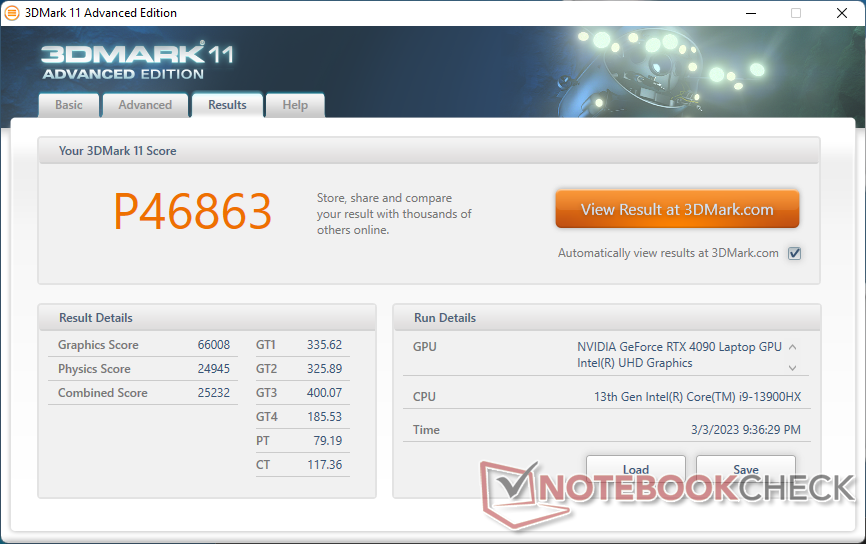
| 3DMark 11 Performance | 46863 poäng | |
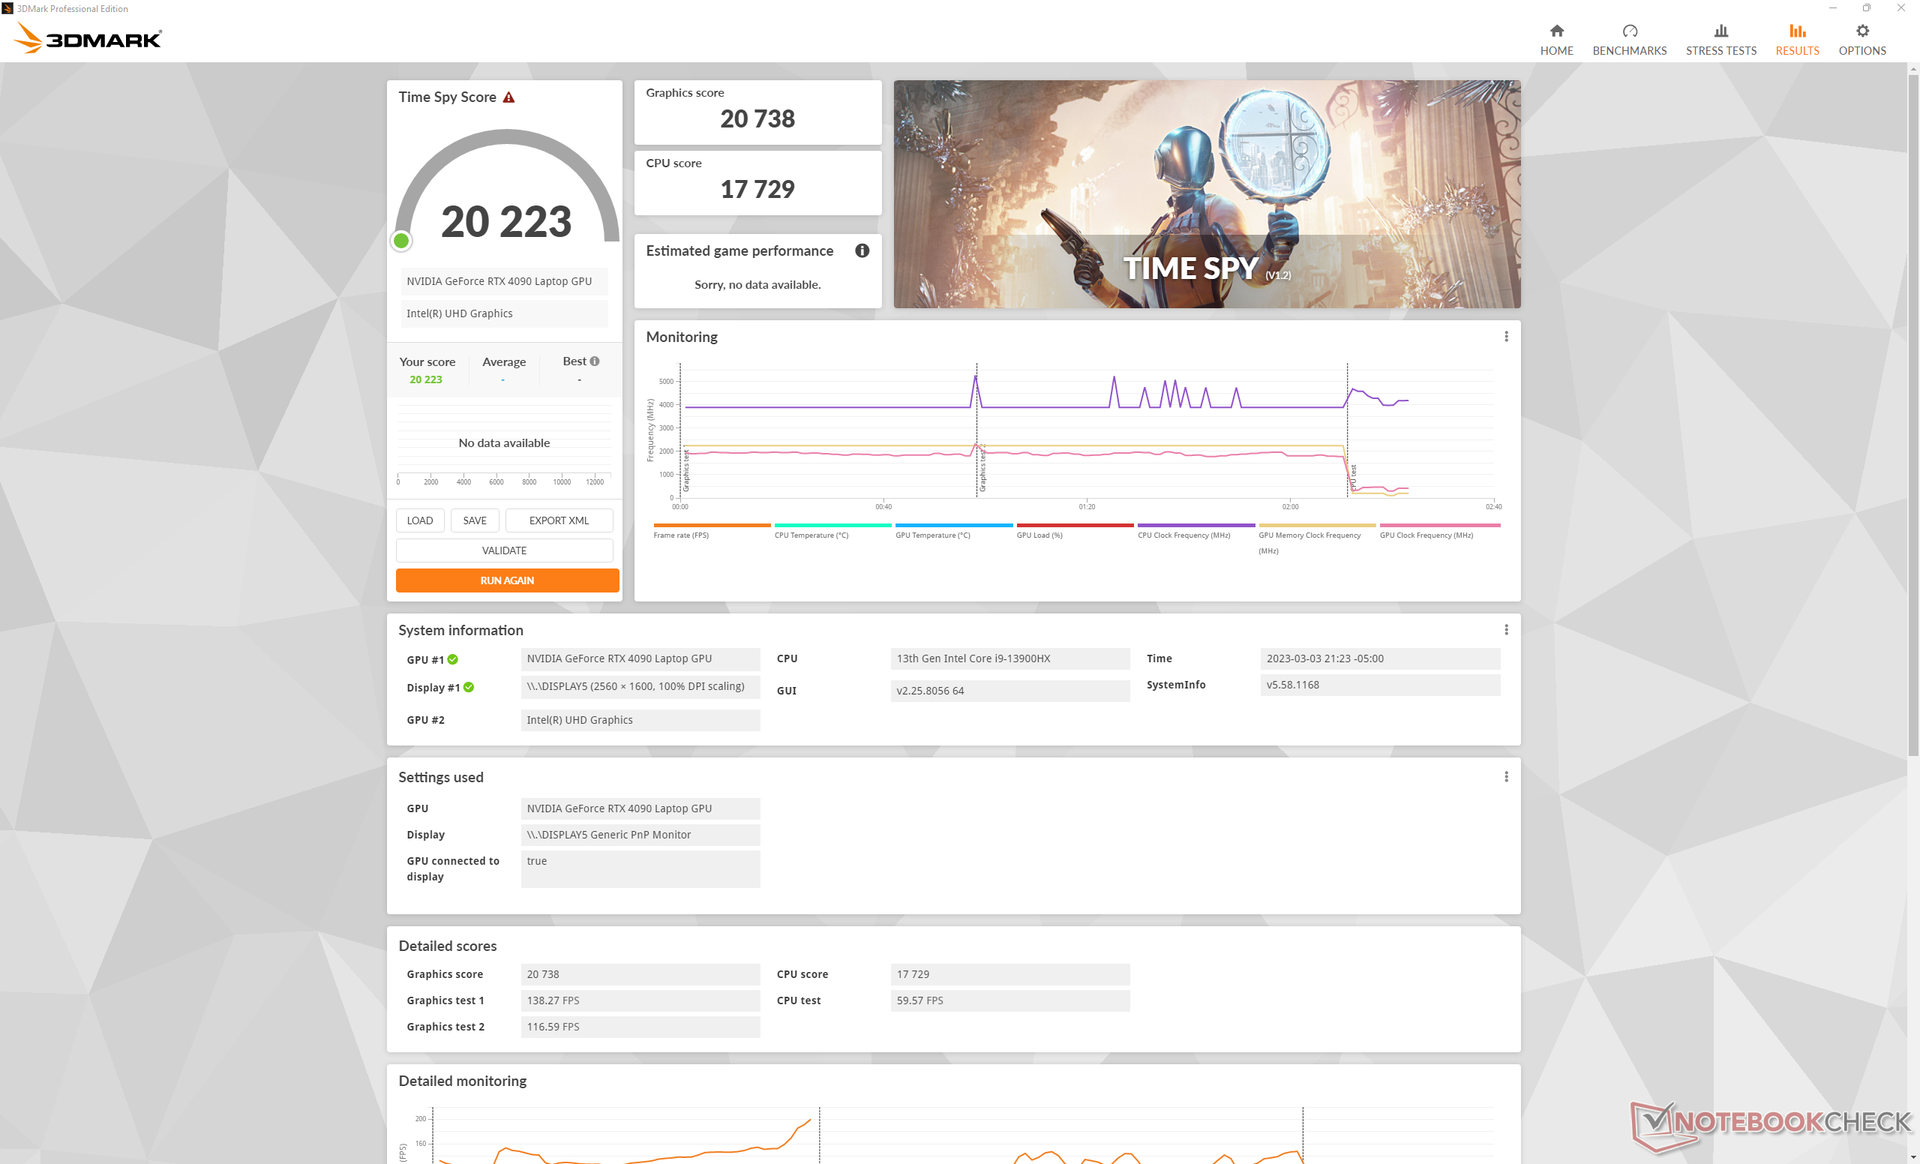
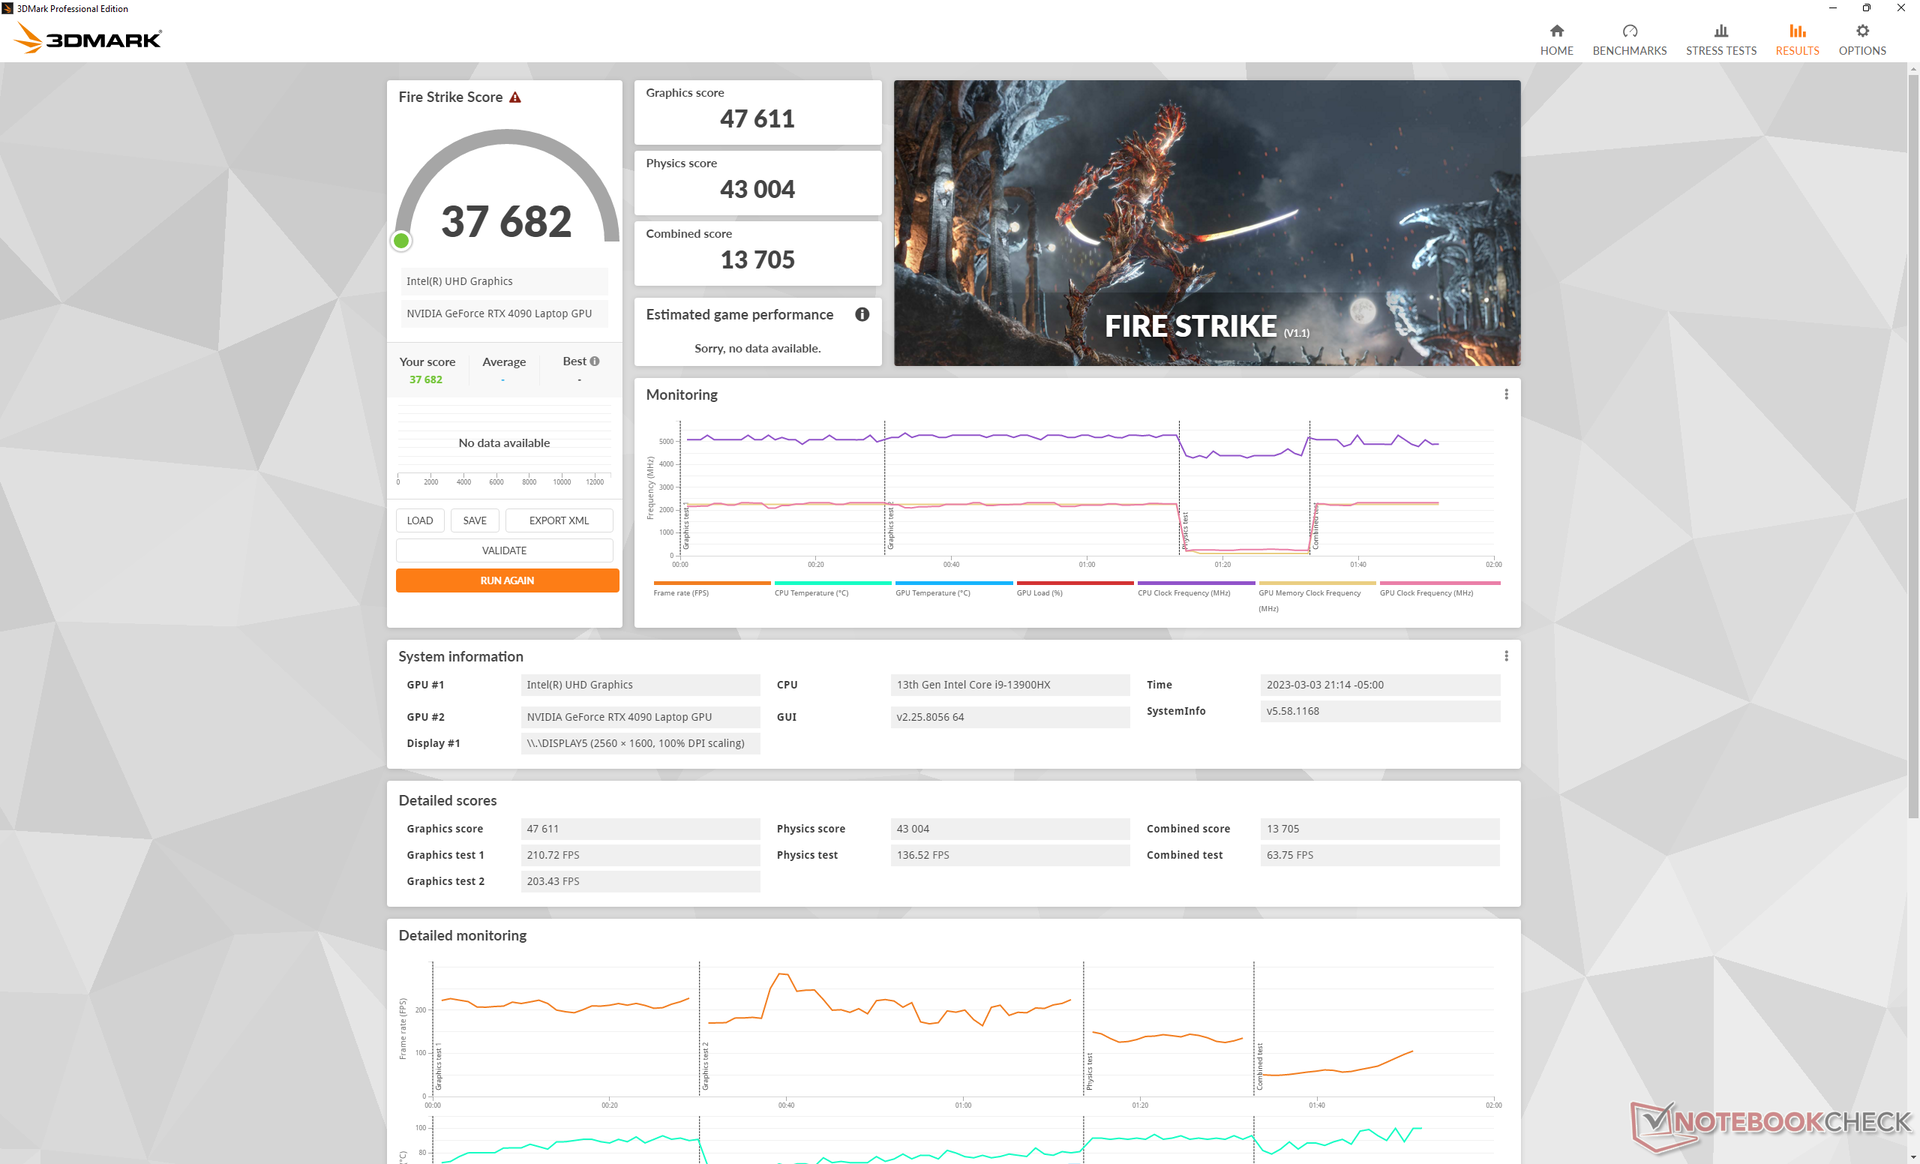
| 3DMark Fire Strike Score | 37682 poäng | |
| 3DMark Time Spy Score | 20223 poäng | |
Hjälp | ||
* ... mindre är bättre
| Performance rating - Percent | |
| Schenker XMG SECTOR, i9 13900K, RTX 4090 | |
| Eluktronics Mech-17 GP2 | |
| Corsair One i300 -1! | |
| MSI Titan GT77 12UHS | |
| Razer Blade 18 RTX 4070 | |
| MSI Katana 17 B13VFK | |
| Schenker XMG Neo 17 M22 -1! | |
| MSI Pulse GL76 12UGK | |
| MSI GS76 Stealth 11UH -1! | |
| Schenker XMG Core 17 (Early 2021) -1! | |
| HP Omen 16-n0033dx -1! | |
| The Witcher 3 - 1920x1080 Ultra Graphics & Postprocessing (HBAO+) | |
| Schenker XMG SECTOR, i9 13900K, RTX 4090 | |
| Eluktronics Mech-17 GP2 | |
| Corsair One i300 | |
| MSI Titan GT77 12UHS | |
| Schenker XMG Neo 17 M22 | |
| Razer Blade 18 RTX 4070 | |
| MSI Katana 17 B13VFK | |
| MSI GS76 Stealth 11UH | |
| MSI Pulse GL76 12UGK | |
| HP Omen 16-n0033dx | |
| Schenker XMG Core 17 (Early 2021) | |
| GTA V - 1920x1080 Highest AA:4xMSAA + FX AF:16x | |
| Schenker XMG SECTOR, i9 13900K, RTX 4090 | |
| Eluktronics Mech-17 GP2 | |
| Corsair One i300 | |
| MSI Titan GT77 12UHS | |
| Razer Blade 18 RTX 4070 | |
| MSI Katana 17 B13VFK | |
| MSI Pulse GL76 12UGK | |
| Schenker XMG Neo 17 M22 | |
| MSI GS76 Stealth 11UH | |
| Schenker XMG Core 17 (Early 2021) | |
| Final Fantasy XV Benchmark - 1920x1080 High Quality | |
| Schenker XMG SECTOR, i9 13900K, RTX 4090 | |
| Eluktronics Mech-17 GP2 | |
| Corsair One i300 | |
| MSI Titan GT77 12UHS | |
| Schenker XMG Neo 17 M22 | |
| Razer Blade 18 RTX 4070 | |
| MSI Katana 17 B13VFK | |
| MSI Pulse GL76 12UGK | |
| MSI GS76 Stealth 11UH | |
| HP Omen 16-n0033dx | |
| Schenker XMG Core 17 (Early 2021) | |
| Strange Brigade - 1920x1080 ultra AA:ultra AF:16 | |
| Schenker XMG SECTOR, i9 13900K, RTX 4090 | |
| Eluktronics Mech-17 GP2 | |
| Corsair One i300 | |
| MSI Titan GT77 12UHS | |
| Razer Blade 18 RTX 4070 | |
| Schenker XMG Neo 17 M22 | |
| MSI Katana 17 B13VFK | |
| HP Omen 16-n0033dx | |
| MSI GS76 Stealth 11UH | |
| MSI Pulse GL76 12UGK | |
| Schenker XMG Core 17 (Early 2021) | |
| Dota 2 Reborn - 1920x1080 ultra (3/3) best looking | |
| Schenker XMG SECTOR, i9 13900K, RTX 4090 | |
| Corsair One i300 | |
| Eluktronics Mech-17 GP2 | |
| Razer Blade 18 RTX 4070 | |
| MSI Titan GT77 12UHS | |
| MSI Katana 17 B13VFK | |
| MSI Pulse GL76 12UGK | |
| MSI GS76 Stealth 11UH | |
| Schenker XMG Neo 17 M22 | |
| Schenker XMG Core 17 (Early 2021) | |
| HP Omen 16-n0033dx | |
| X-Plane 11.11 - 1920x1080 high (fps_test=3) | |
| Schenker XMG SECTOR, i9 13900K, RTX 4090 | |
| Eluktronics Mech-17 GP2 | |
| Razer Blade 18 RTX 4070 | |
| Corsair One i300 | |
| MSI Titan GT77 12UHS | |
| MSI Katana 17 B13VFK | |
| MSI Pulse GL76 12UGK | |
| MSI GS76 Stealth 11UH | |
| Schenker XMG Neo 17 M22 | |
| Schenker XMG Core 17 (Early 2021) | |
| HP Omen 16-n0033dx | |
| Cyberpunk 2077 1.6 - 1920x1080 Ultra Preset | |
| Schenker XMG SECTOR, i9 13900K, RTX 4090 | |
| Eluktronics Mech-17 GP2 | |
| MSI Titan GT77 12UHS | |
| Razer Blade 18 RTX 4070 | |
| MSI Katana 17 B13VFK | |
| MSI Pulse GL76 12UGK | |
| HP Omen 16-n0033dx | |
Witcher 3 FPS Chart
| låg | med. | hög | ultra | QHD | 4K | |
|---|---|---|---|---|---|---|
| GTA V (2015) | 187.5 | 187.2 | 186.5 | 149.8 | 146.3 | 180.2 |
| The Witcher 3 (2015) | 717.7 | 617.3 | 449 | 216.3 | 167.6 | |
| Dota 2 Reborn (2015) | 243 | 216 | 205 | 192.5 | 186.7 | |
| Final Fantasy XV Benchmark (2018) | 233 | 230 | 194.9 | 157.1 | 90.8 | |
| X-Plane 11.11 (2018) | 212 | 188.8 | 146.4 | 124.7 | ||
| Strange Brigade (2018) | 656 | 508 | 465 | 421 | 315 | 163.4 |
| Metro Exodus (2019) | 240.1 | 207.1 | 173.8 | 146.5 | 127.7 | 82.1 |
| Borderlands 3 (2019) | 284.2 | 269.7 | 238.5 | 179.7 | 129.4 | 72.2 |
| Cyberpunk 2077 1.6 (2022) | 191.1 | 178.6 | 166.9 | 159.7 | 101.3 | 47.8 |
| F1 22 (2022) | 375 | 358 | 322 | 140.6 | 91.8 | 45.3 |
Utsläpp
Systembrus
Även om det har gjorts justeringar i kylningslösningen jämfört med förra årets modell är det totala fläktljudet ungefär detsamma. De interna fläktarna är alltid aktiva oavsett inställning eller belastning på skärmen. Vi rekommenderar Office-läget eller Balanced-läget om du inte kör några intensiva program eftersom fläktarna blir märkbart tystare och mer slöa.
När du spelar i läget Prestanda eller "Beast", ligger fläktljudet mellan 50 och 52 dB(A), vilket liknar Alienware m17 R5 eller Alienware m17 R5 Razer Blade 18 under liknande förhållanden. Hörlurar är nästan en nödvändighet för fläktljud över 50 dB(A) när man spelar.
Thermal Grizzly liquid metal är standard på alla konfigurationer.
Ljudnivå
| Låg belastning |
| 28 / 28 / 30.4 dB(A) |
| Hög belastning |
| 41 / 52.6 dB(A) |
 | ||
30 dB tyst 40 dB(A) hörbar 50 dB(A) högt ljud |
||
min: | ||
| Eluktronics Mech-17 GP2 GeForce RTX 4090 Laptop GPU, i9-13900HX, Samsung PM9A1 MZVL21T0HCLR | Schenker XMG Neo 17 M22 GeForce RTX 3080 Ti Laptop GPU, R9 6900HX, Samsung SSD 980 Pro 1TB MZ-V8P1T0BW | MSI Katana 17 B13VFK GeForce RTX 4060 Laptop GPU, i7-13620H, Micron 2400 MTFDKBA1T0QFM | MSI Titan GT77 HX 13VI GeForce RTX 4090 Laptop GPU, i9-13950HX, Samsung PM9A1 MZVL22T0HBLB | Alienware m17 R5 (R9 6900HX, RX 6850M XT) Radeon RX 6850M XT, R9 6900HX, SSSTC CA6-8D1024 | Razer Blade 18 RTX 4070 GeForce RTX 4070 Laptop GPU, i9-13950HX, SSSTC CA6-8D1024 | |
|---|---|---|---|---|---|---|
| Noise | -8% | -6% | -7% | 10% | 9% | |
| av / miljö * (dB) | 25.2 | 26 -3% | 24.5 3% | 24.6 2% | 23 9% | 23.5 7% |
| Idle Minimum * (dB) | 28 | 26 7% | 24.5 12% | 29.2 -4% | 23 18% | 23.8 15% |
| Idle Average * (dB) | 28 | 29 -4% | 24.5 12% | 29.2 -4% | 28.11 -0% | 23.8 15% |
| Idle Maximum * (dB) | 30.4 | 40 -32% | 40 -32% | 29.2 4% | 28.11 8% | 26.8 12% |
| Load Average * (dB) | 41 | 47 -15% | 48.3 -18% | 50.7 -24% | 30.62 25% | 37.3 9% |
| Witcher 3 ultra * (dB) | 50.7 | 52 -3% | 56 -10% | 53.3 -5% | 49.75 2% | 48 5% |
| Load Maximum * (dB) | 52.6 | 54 -3% | 59.1 -12% | 61 -16% | 50.17 5% | 53.5 -2% |
* ... mindre är bättre
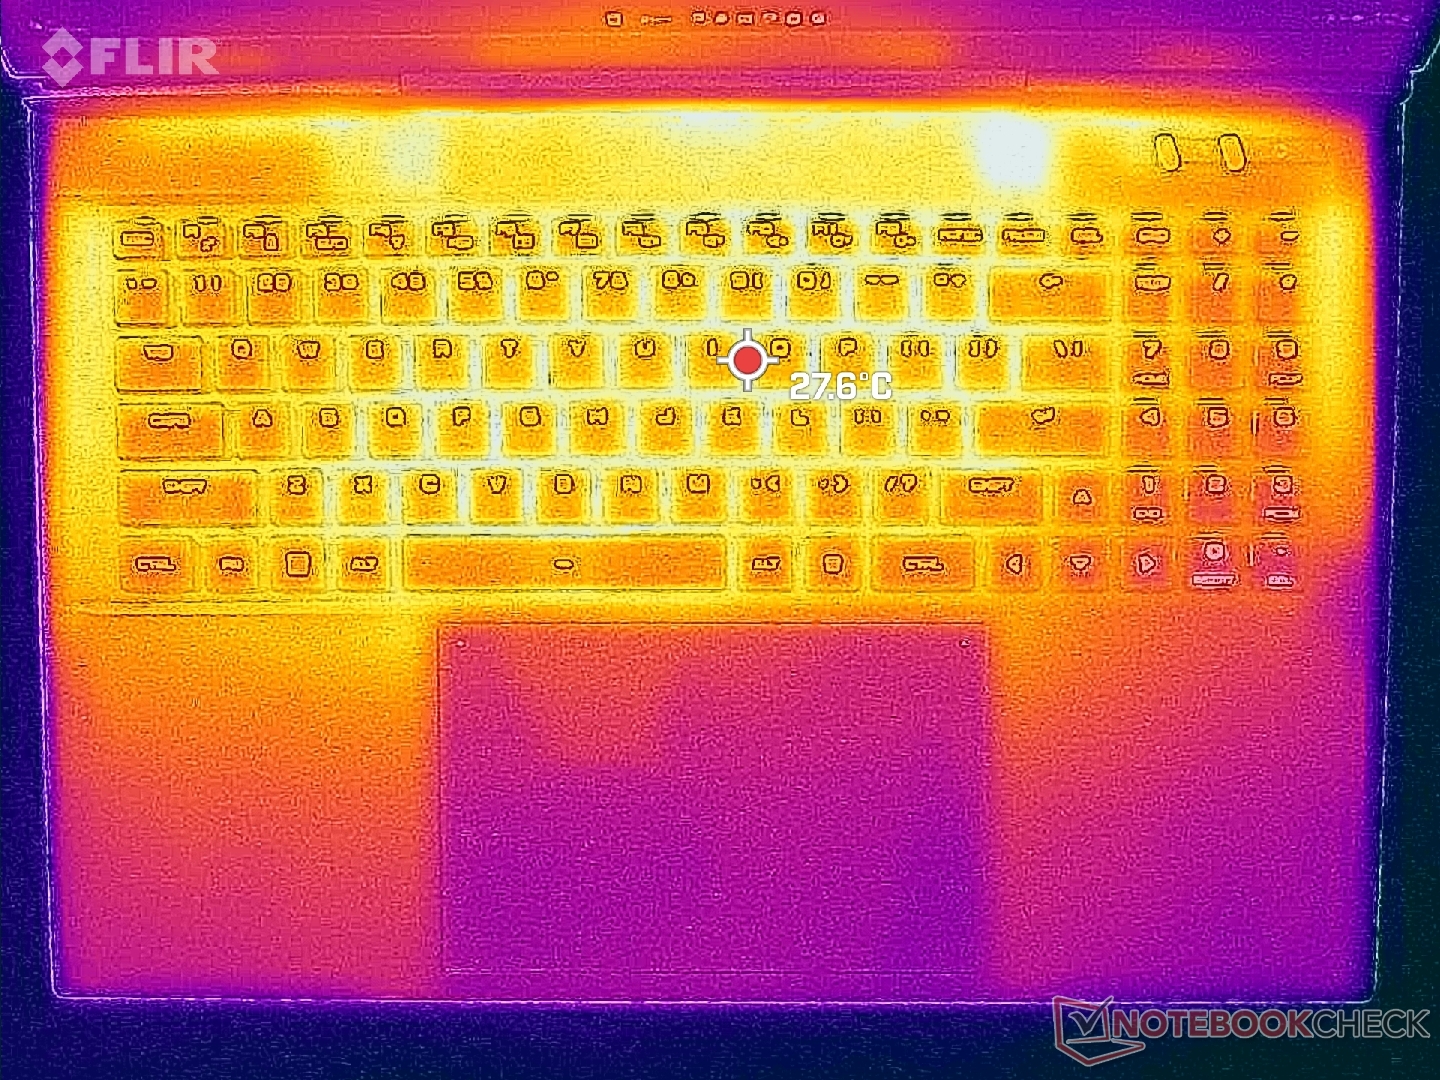
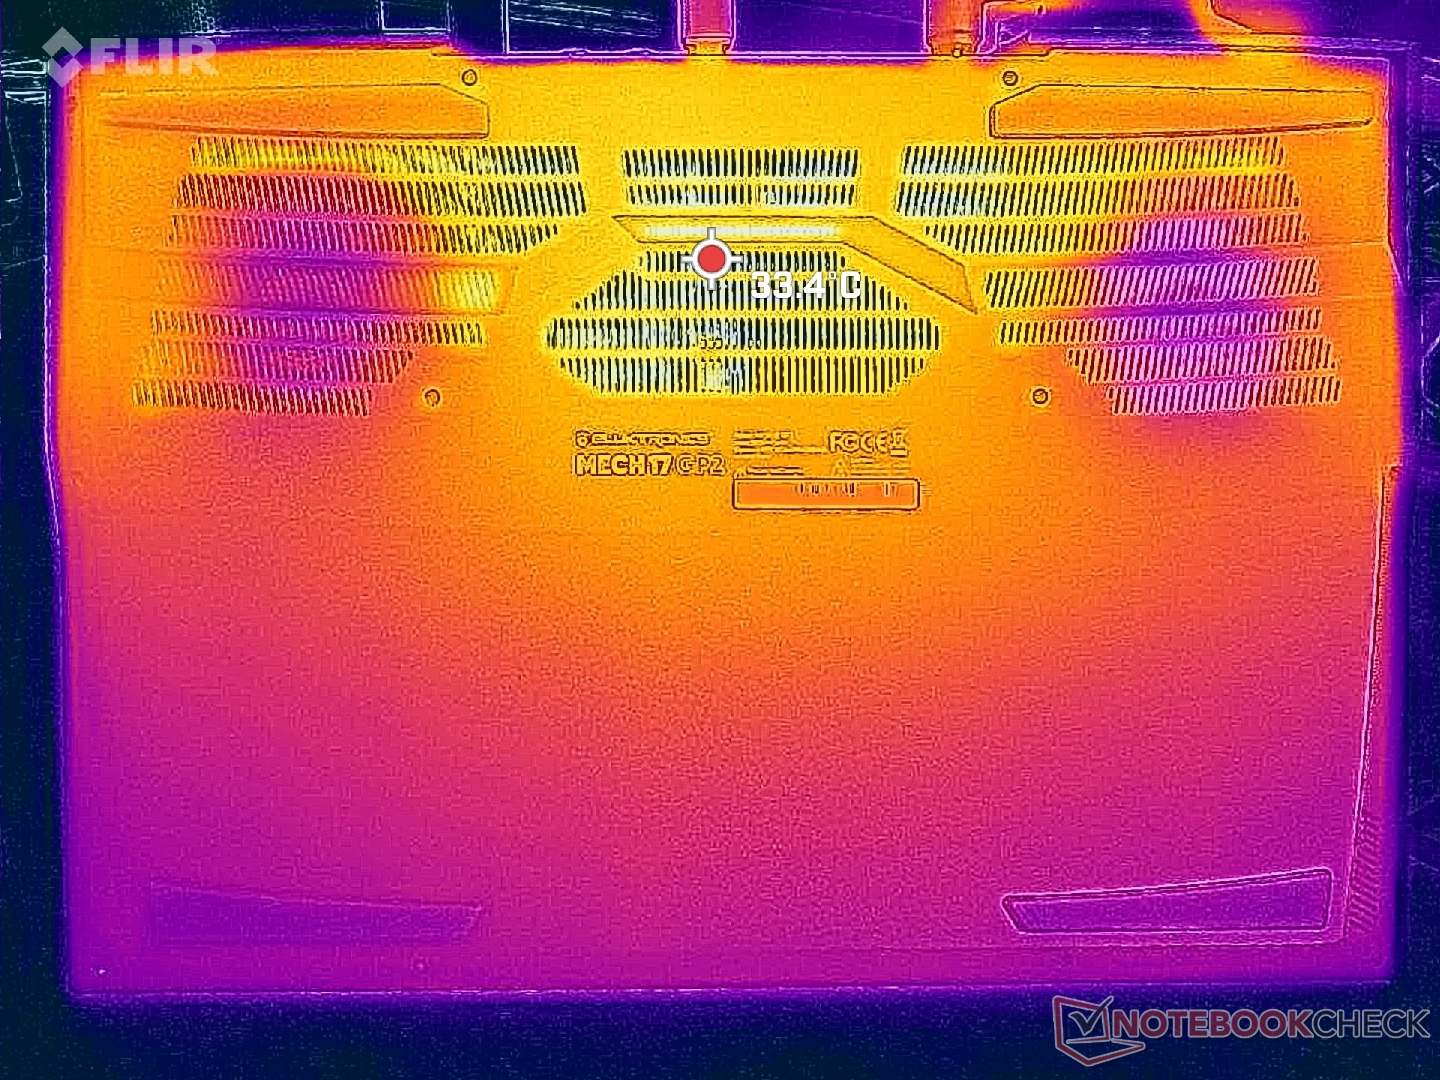
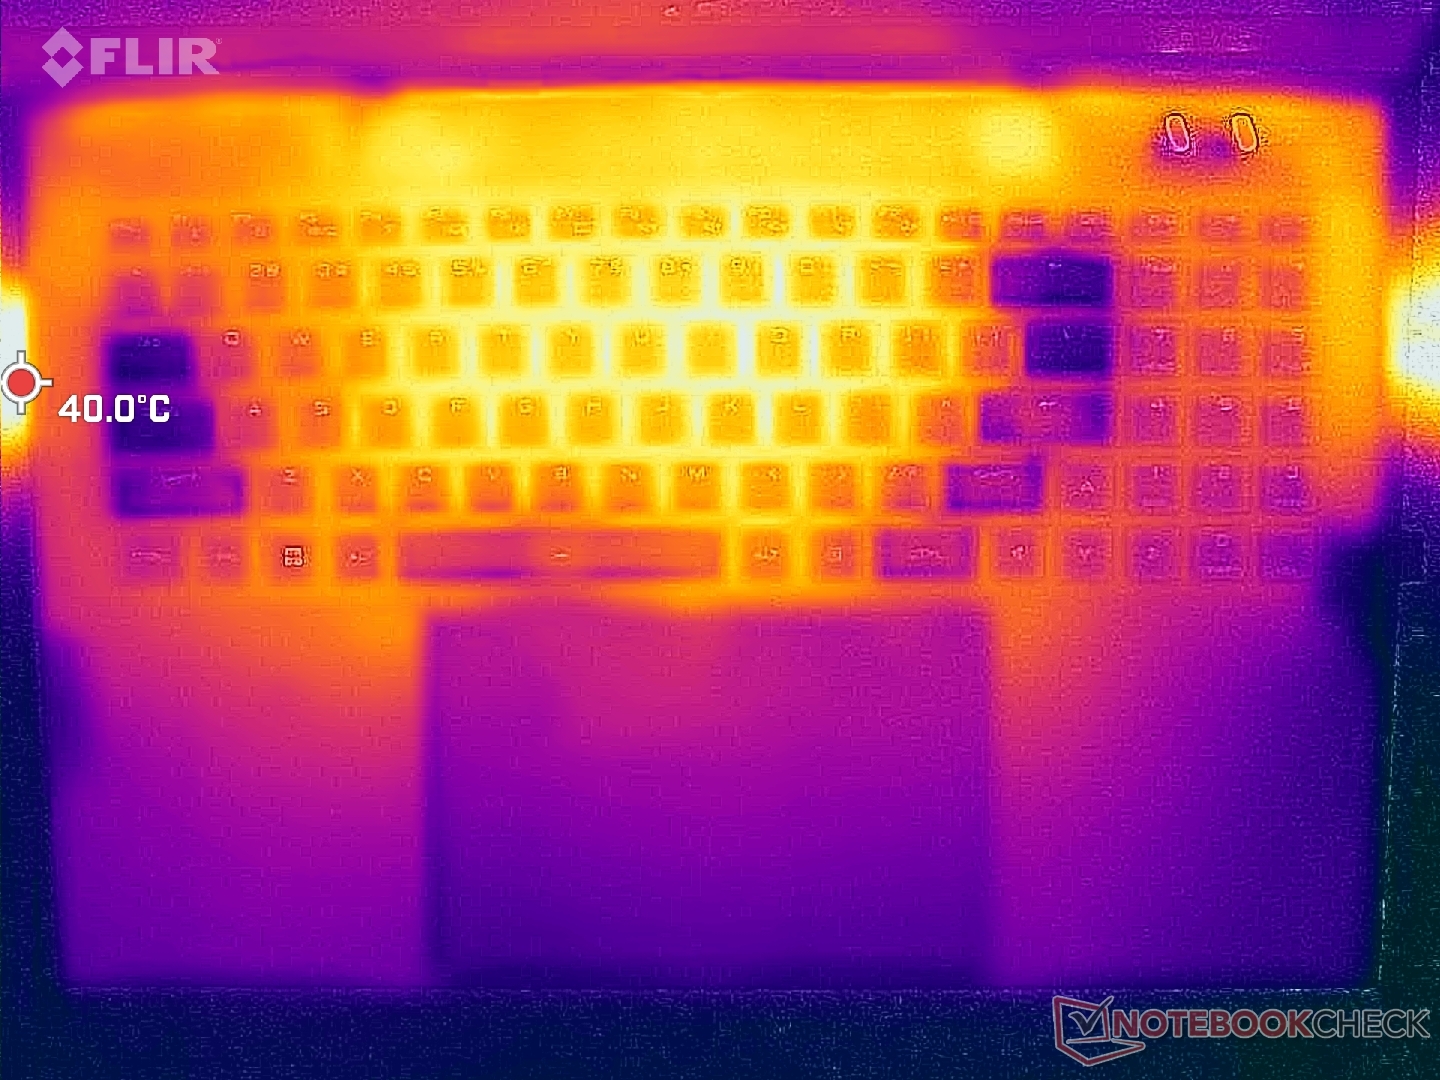
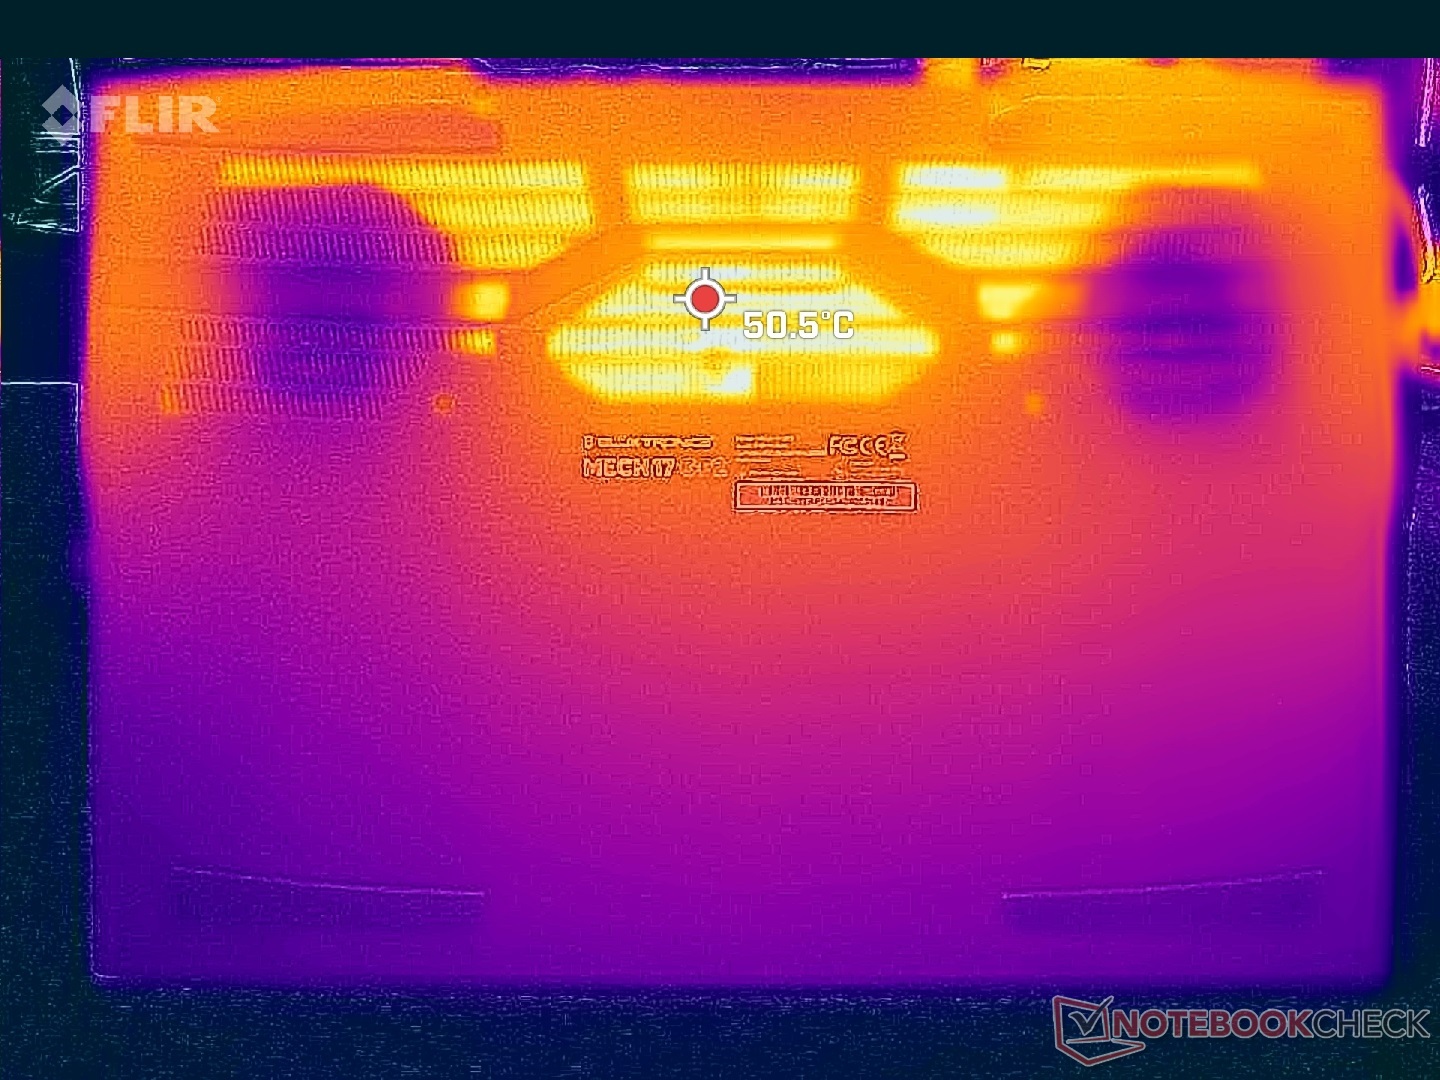
Temperatur
Yttemperaturen är varmast i mitten och svalast längs tangentbordets sidor och handflatorna. Frisk luft kommer in genom WASD-tangenterna för att hålla fingrarna svala när du spelar. De varma punkterna på 39 C till 44 C är svalare än vad vi registrerade på Alienware m17 R5 där hot spots kan nå 50 C till 57 C vid liknande spelförhållanden.
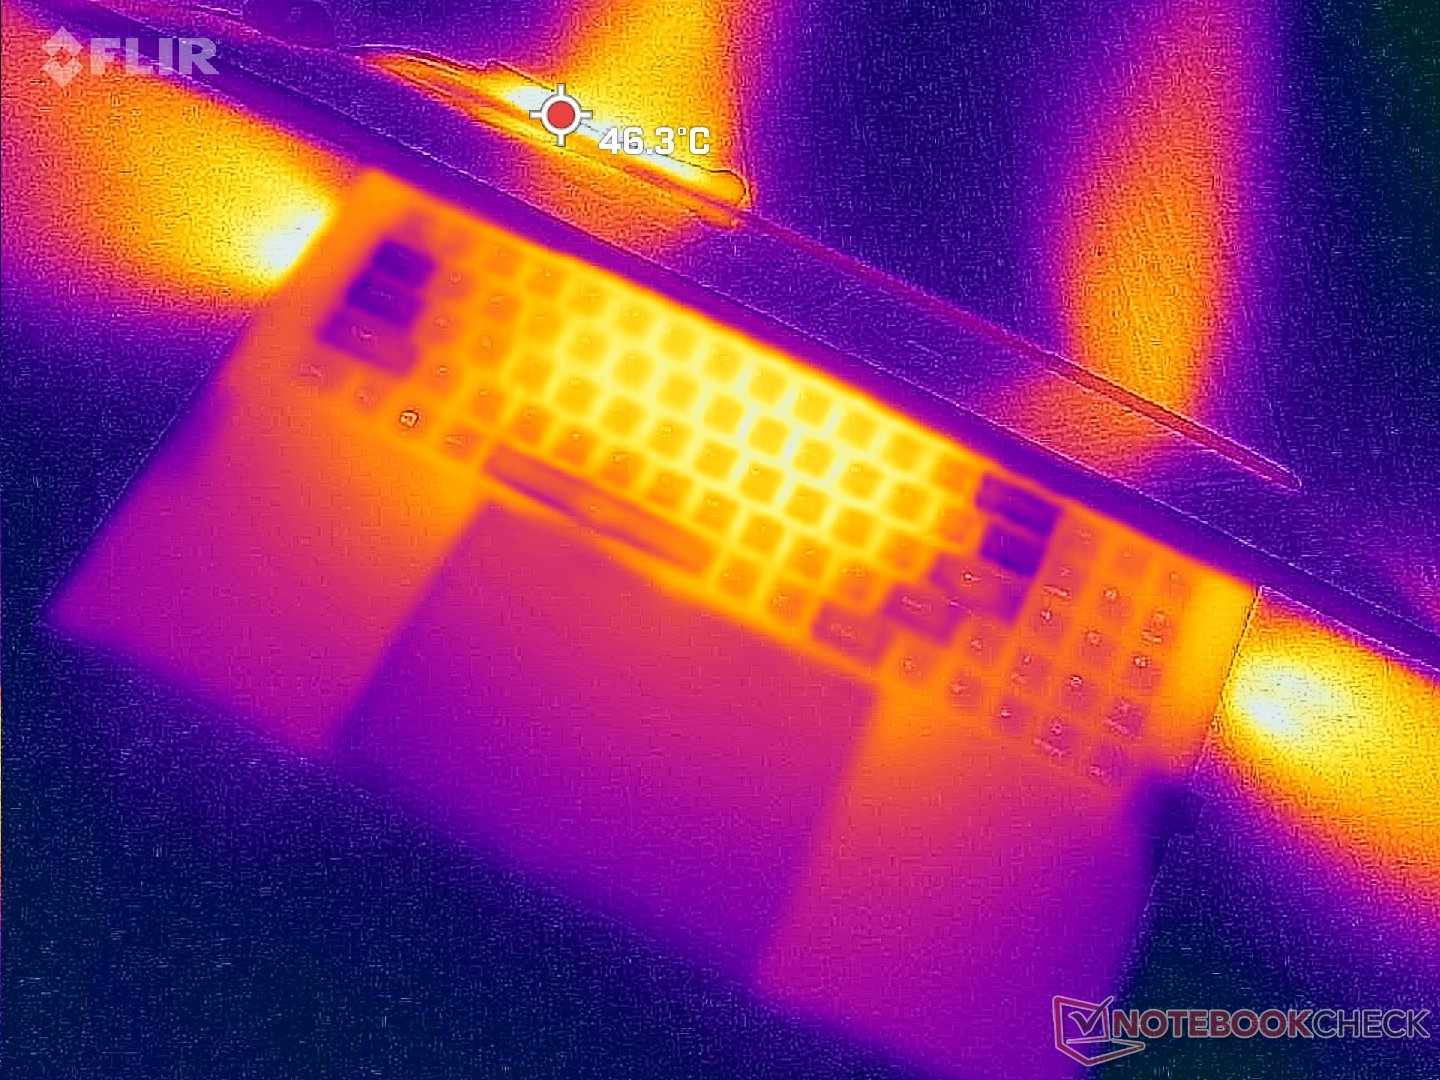
(+) Den maximala temperaturen på ovansidan är 39 °C / 102 F, jämfört med genomsnittet av 40.4 °C / 105 F , allt från 21.2 till 68.8 °C för klassen Gaming.
(±) Botten värms upp till maximalt 44 °C / 111 F, jämfört med genomsnittet av 43.2 °C / 110 F
(+) Vid tomgångsbruk är medeltemperaturen för ovansidan 27.5 °C / 82 F, jämfört med enhetsgenomsnittet på 33.9 °C / ### class_avg_f### F.
(+) Handledsstöden och pekplattan är kallare än hudtemperaturen med maximalt 25 °C / 77 F och är därför svala att ta på.
(+) Medeltemperaturen för handledsstödsområdet på liknande enheter var 28.8 °C / 83.8 F (+3.8 °C / 6.8 F).
| Eluktronics Mech-17 GP2 Intel Core i9-13900HX, NVIDIA GeForce RTX 4090 Laptop GPU | Schenker XMG Neo 17 M22 AMD Ryzen 9 6900HX, NVIDIA GeForce RTX 3080 Ti Laptop GPU | MSI Katana 17 B13VFK Intel Core i7-13620H, NVIDIA GeForce RTX 4060 Laptop GPU | MSI Titan GT77 HX 13VI Intel Core i9-13950HX, NVIDIA GeForce RTX 4090 Laptop GPU | Alienware m17 R5 (R9 6900HX, RX 6850M XT) AMD Ryzen 9 6900HX, AMD Radeon RX 6850M XT | Razer Blade 18 RTX 4070 Intel Core i9-13950HX, NVIDIA GeForce RTX 4070 Laptop GPU | |
|---|---|---|---|---|---|---|
| Heat | -13% | -7% | 4% | -14% | 1% | |
| Maximum Upper Side * (°C) | 39 | 49 -26% | 41.6 -7% | 40.6 -4% | 53 -36% | 39.2 -1% |
| Maximum Bottom * (°C) | 44 | 52 -18% | 43.1 2% | 41.1 7% | 56 -27% | 35.6 19% |
| Idle Upper Side * (°C) | 31 | 30 3% | 32 -3% | 26.2 15% | 30 3% | 31.8 -3% |
| Idle Bottom * (°C) | 29.8 | 33 -11% | 35.8 -20% | 30.3 -2% | 29 3% | 33.2 -11% |
* ... mindre är bättre
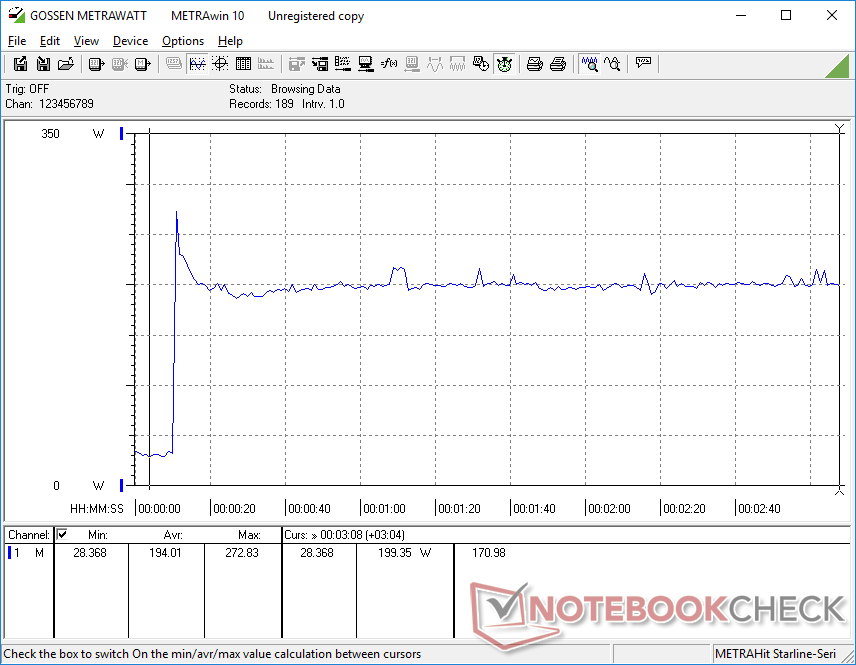
Stresstest
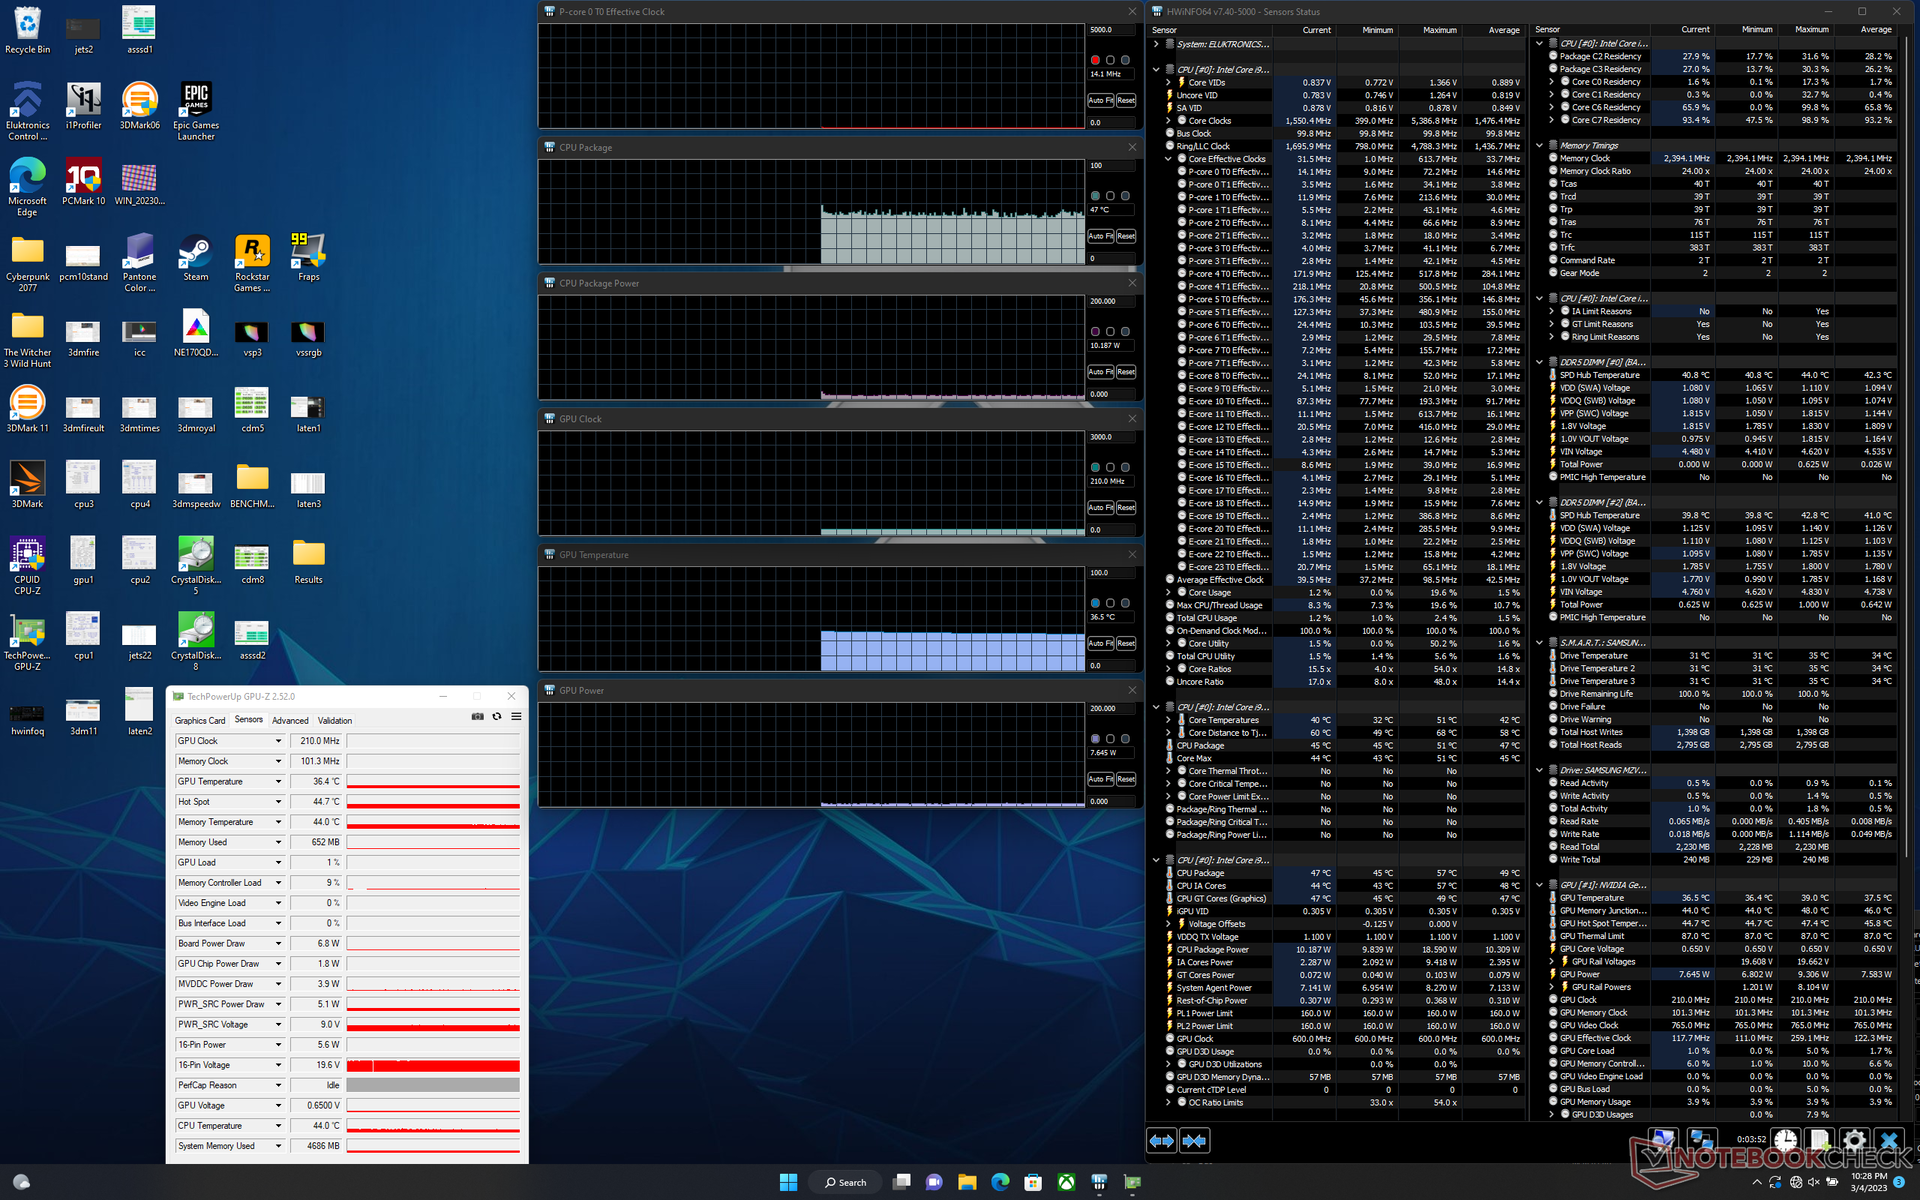
När CPU:n stressades under Prime95 ökade den till 4,7 GHz, 160 W och 96 C i bara en sekund eller två innan den omedelbart sjönk till 4,1 GHz och 107 W. Kärnans temperatur förblev dock mycket hög på 96 C. Efter ytterligare några minuter sjönk klockfrekvensen ytterligare till 3,4 GHz med bara minimala förändringar i temperatur och strömförbrukning på kortet.
GPU:s klockfrekvens, temperatur och strömförbrukning stabiliserades vid 2310 MHz, 80 C respektive 169 W när man körde Witcher 3. GPU:n är dimensionerad för en TGP på 175 W, så den verkliga effektuttaget på 169 W ligger mycket nära. CPU-temperaturen skulle tyvärr förbli hög med 96 C jämfört med 85 C eller 66 C på Razer Blade 18(RTX 4070) eller MSI GT77respektive.
Att köra Prime95 och FurMark samtidigt i mer än flera minuter gör att vår enhet kraschar varje gång. Vi misstänker att de höga kärntemperaturerna är ansvariga för den automatiska avstängningen och omstarten. De flesta andra bärbara datorer skulle strypa prestandan när de utsätts för sådana extrema belastningar för att förhindra kraschning.
Att köra på batteri begränsar prestandan kraftigt. Ett Fire Strike -test på batterier skulle ge fysik- och grafikpoäng på 11430 respektive 11496 poäng, jämfört med 43004 respektive 47611 poäng när datorn är på nätet.
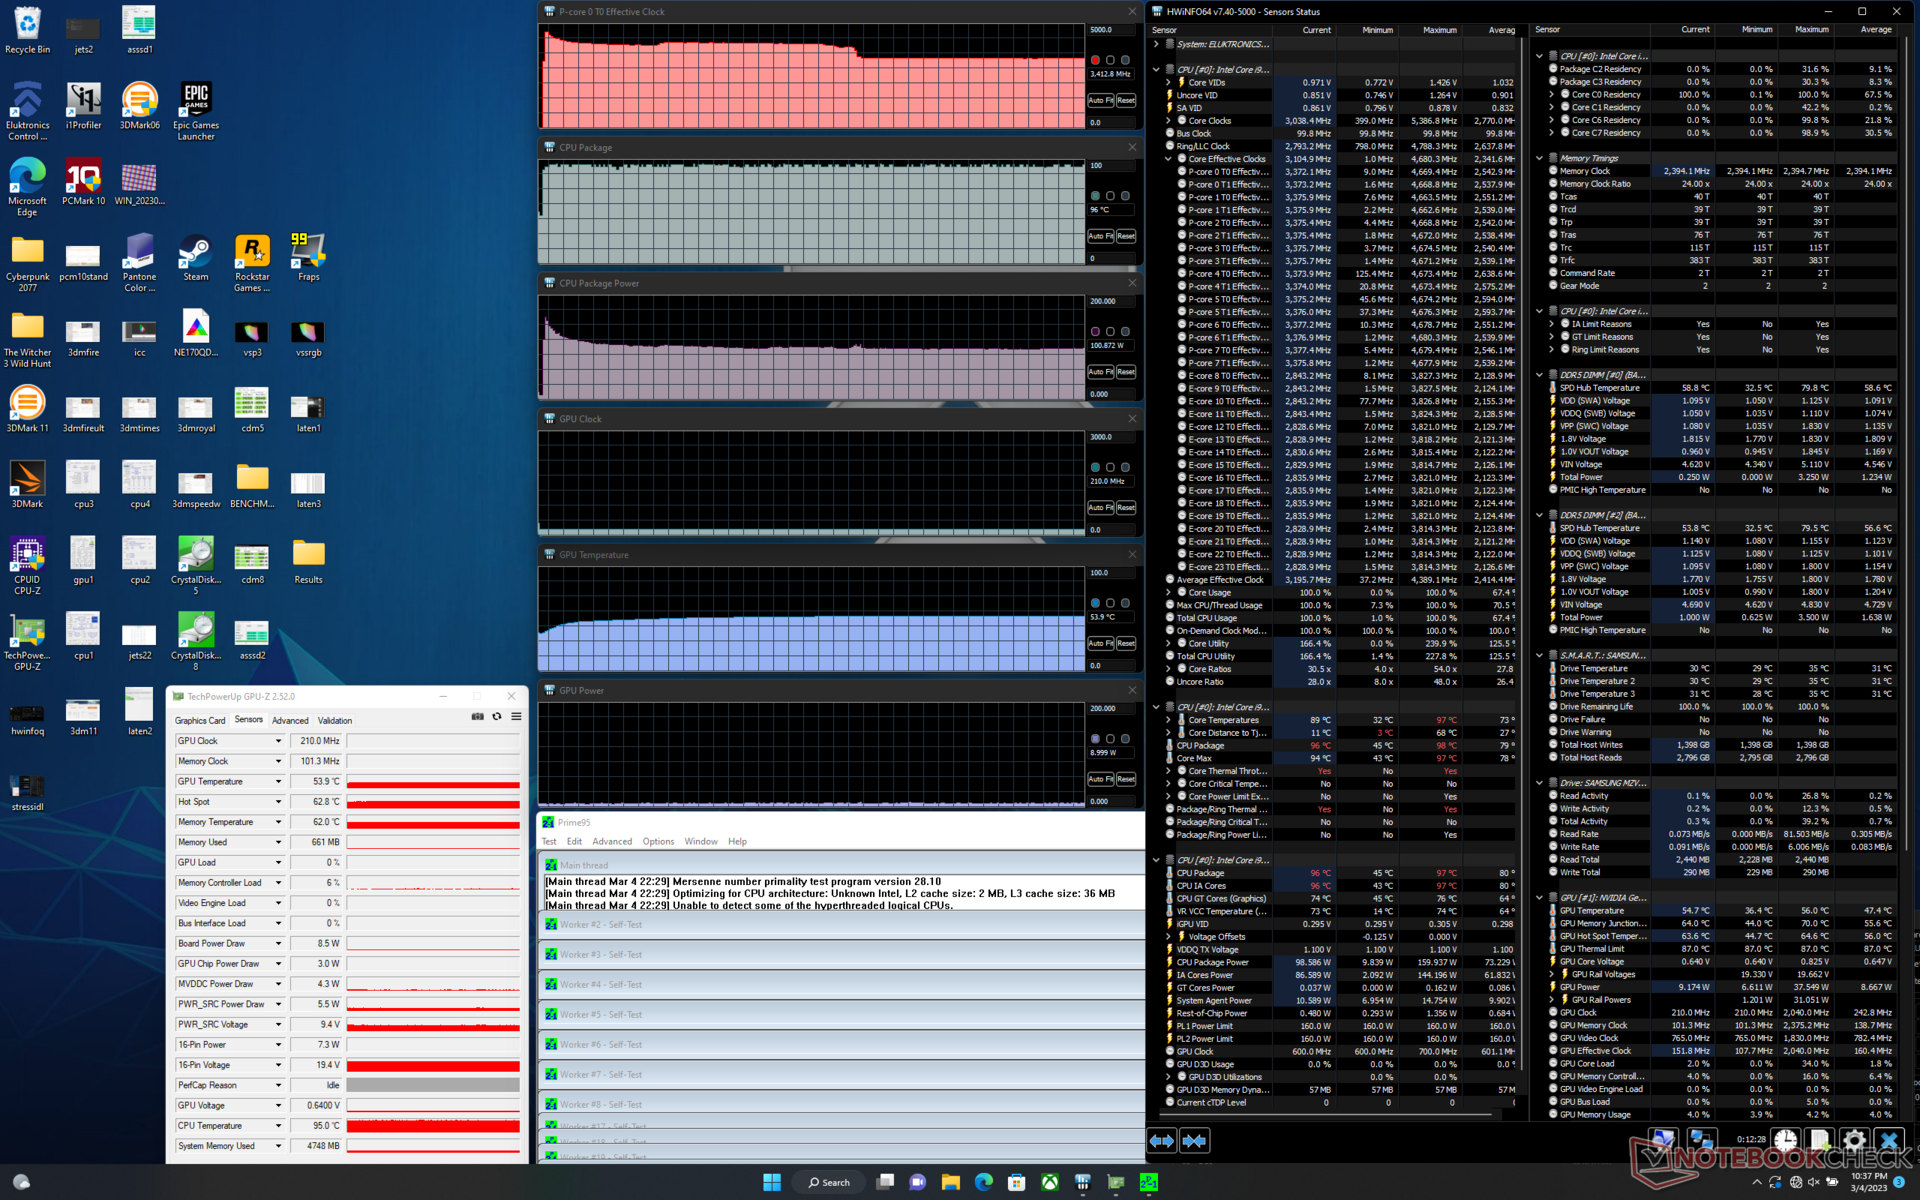
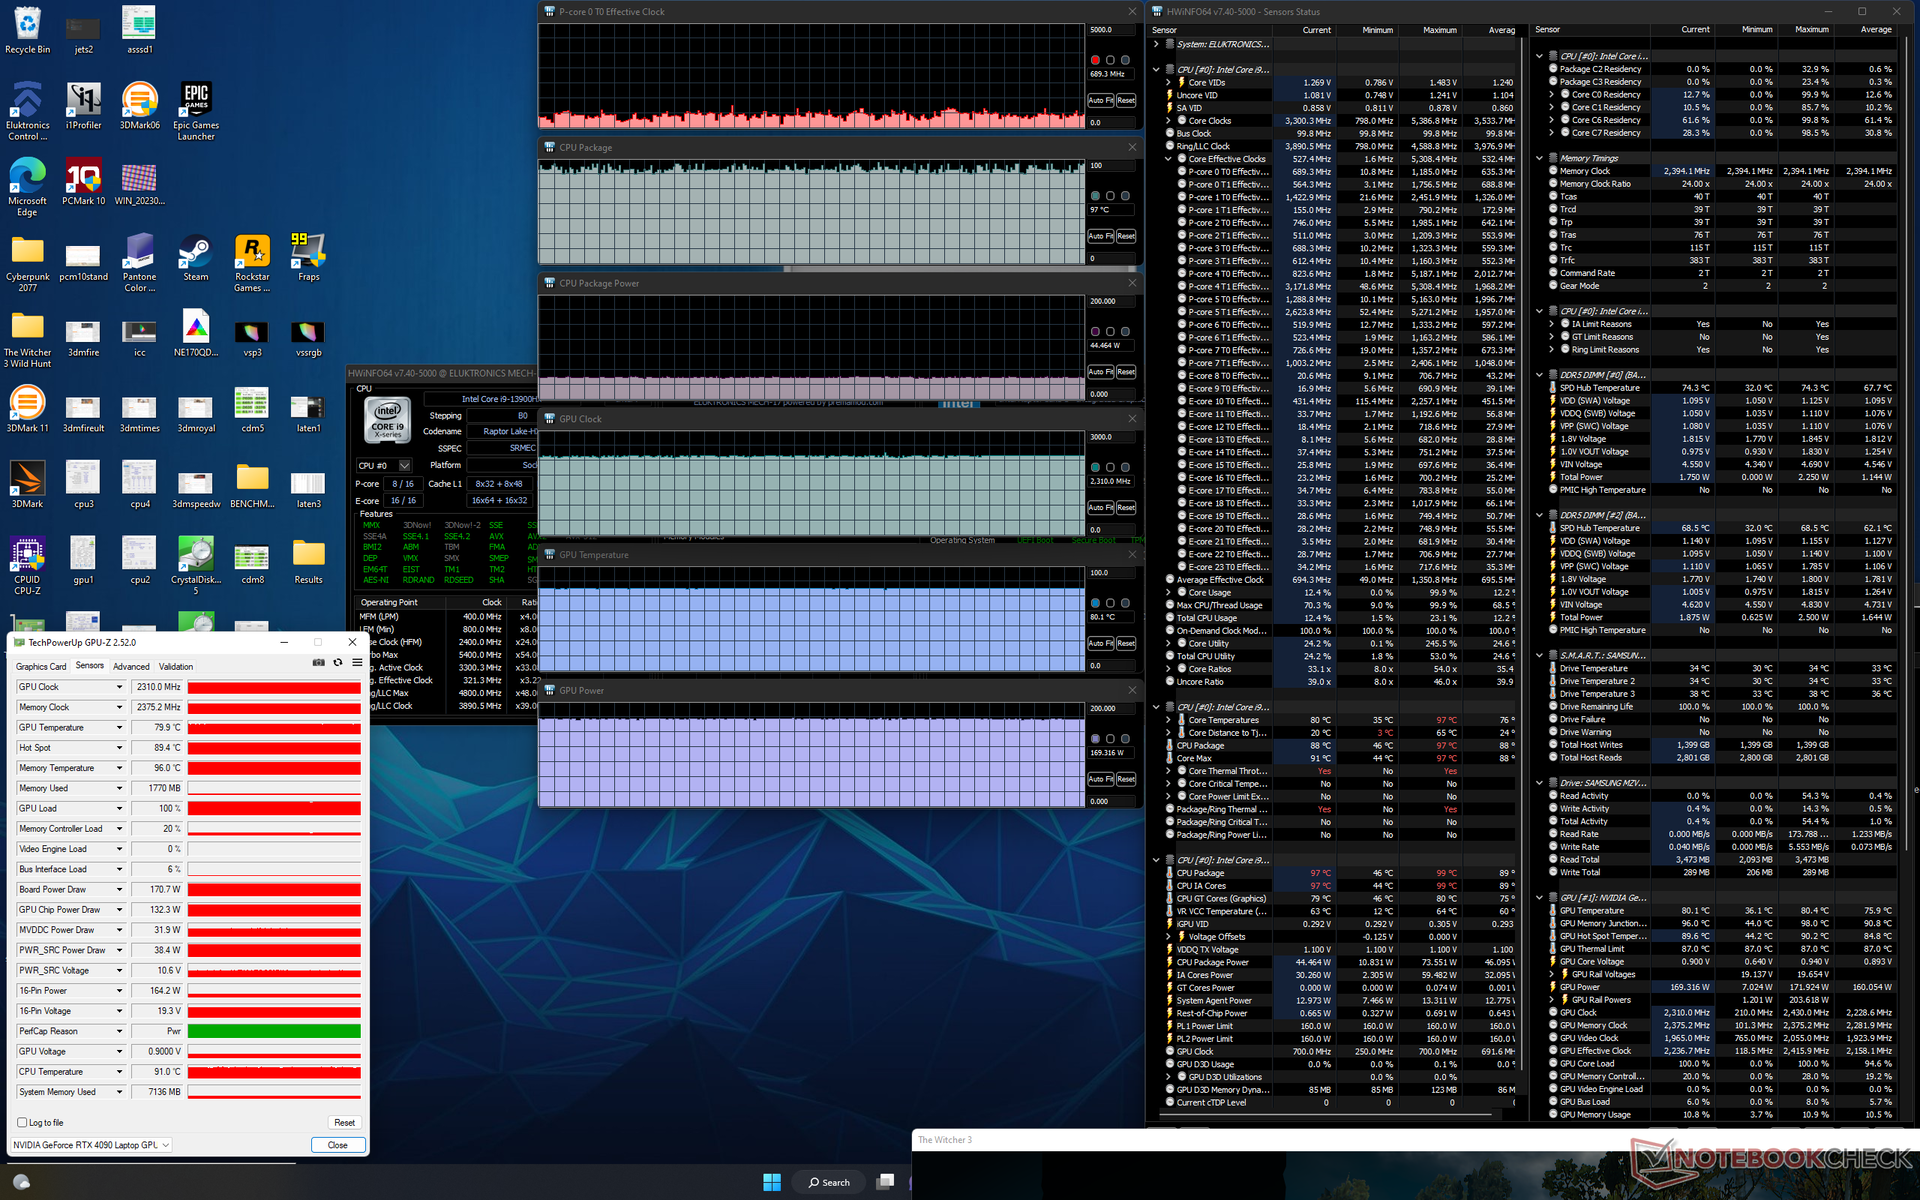
| CPU-klocka (GHz) | GPU-klocka (MHz) | Genomsnittlig CPU-temperatur (°C) | Genomsnittlig GPU-temperatur (°C) | |
| Systemets tomgång | -- | -- | 47 | 37 |
| Prime95 Stress | 3.4 | -- | 96 | 54 |
| Witcher 3 Stress | ~0,7 | 2310 | 97 | 80 |
Högtalare
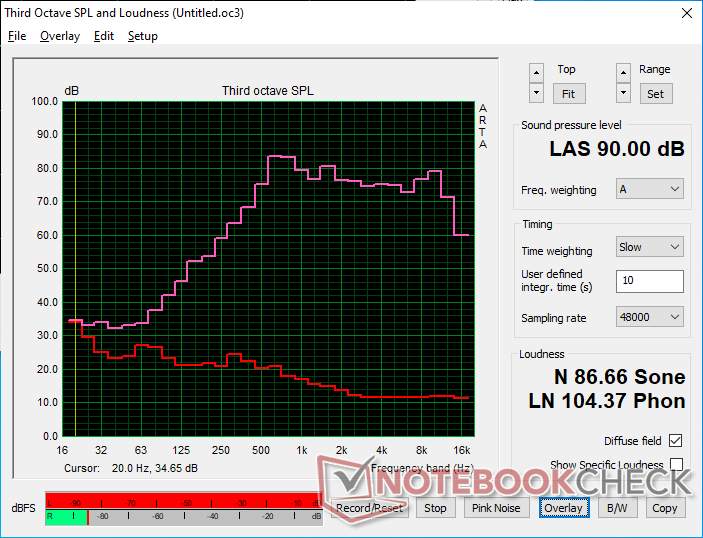
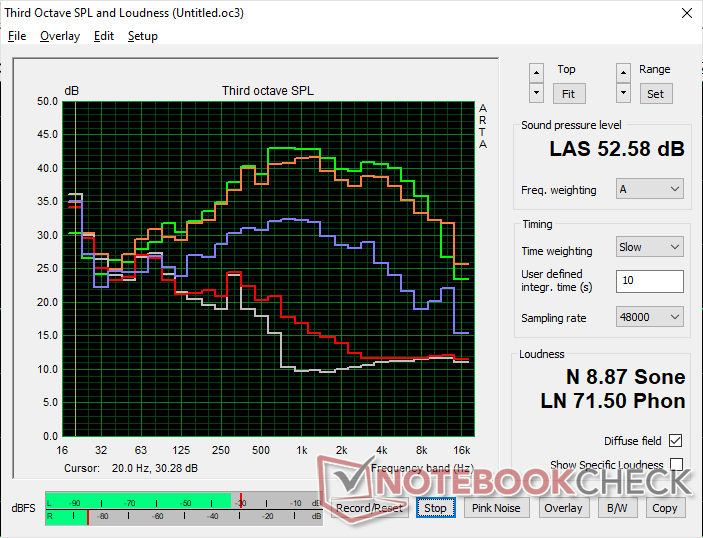
Eluktronics Mech-17 GP2 ljudanalys
(+) | högtalare kan spela relativt högt (90 dB)
Bas 100 - 315 Hz
(-) | nästan ingen bas - i genomsnitt 22.5% lägre än medianen
(±) | linjäriteten för basen är genomsnittlig (7.3% delta till föregående frekvens)
Mellan 400 - 2000 Hz
(+) | balanserad mellan - endast 4.4% från medianen
(±) | linjäriteten för mids är genomsnittlig (7.4% delta till föregående frekvens)
Högsta 2 - 16 kHz
(+) | balanserade toppar - endast 1.3% från medianen
(+) | toppar är linjära (2.7% delta till föregående frekvens)
Totalt 100 - 16 000 Hz
(±) | linjäriteten för det totala ljudet är genomsnittlig (15% skillnad mot median)
Jämfört med samma klass
» 32% av alla testade enheter i den här klassen var bättre, 6% liknande, 62% sämre
» Den bästa hade ett delta på 6%, genomsnittet var 18%, sämst var 132%
Jämfört med alla testade enheter
» 20% av alla testade enheter var bättre, 4% liknande, 75% sämre
» Den bästa hade ett delta på 4%, genomsnittet var 24%, sämst var 134%
Apple MacBook Pro 16 2021 M1 Pro ljudanalys
(+) | högtalare kan spela relativt högt (84.7 dB)
Bas 100 - 315 Hz
(+) | bra bas - bara 3.8% från medianen
(+) | basen är linjär (5.2% delta till föregående frekvens)
Mellan 400 - 2000 Hz
(+) | balanserad mellan - endast 1.3% från medianen
(+) | mids är linjära (2.1% delta till föregående frekvens)
Högsta 2 - 16 kHz
(+) | balanserade toppar - endast 1.9% från medianen
(+) | toppar är linjära (2.7% delta till föregående frekvens)
Totalt 100 - 16 000 Hz
(+) | det totala ljudet är linjärt (4.6% skillnad mot median)
Jämfört med samma klass
» 0% av alla testade enheter i den här klassen var bättre, 0% liknande, 100% sämre
» Den bästa hade ett delta på 5%, genomsnittet var 17%, sämst var 45%
Jämfört med alla testade enheter
» 0% av alla testade enheter var bättre, 0% liknande, 100% sämre
» Den bästa hade ett delta på 4%, genomsnittet var 24%, sämst var 134%
Energiförvaltning
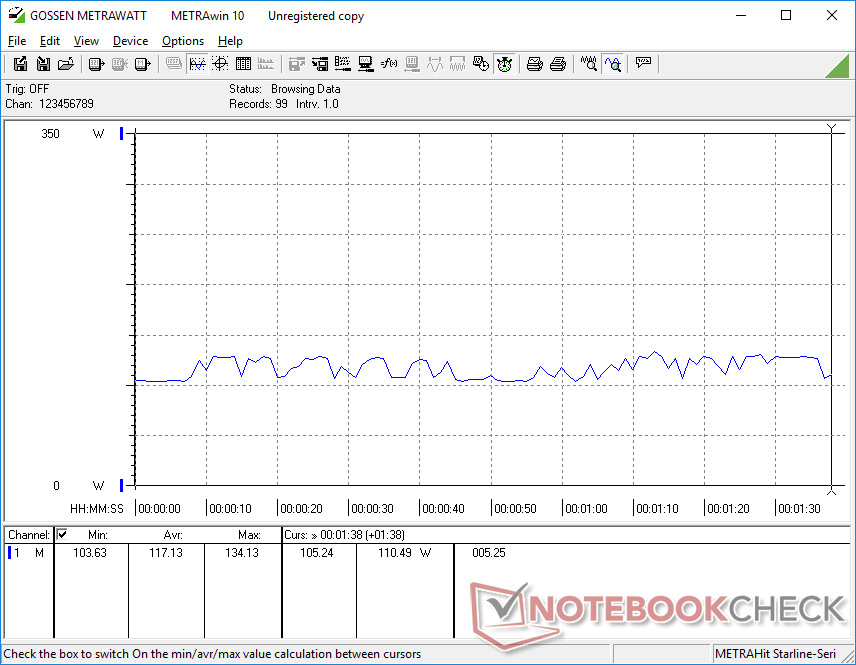
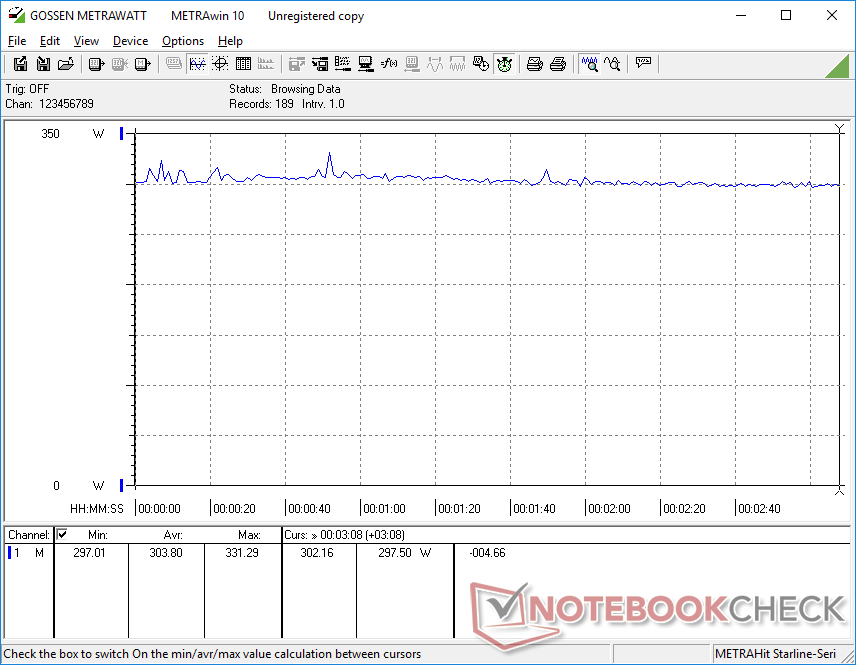
Effektförbrukning
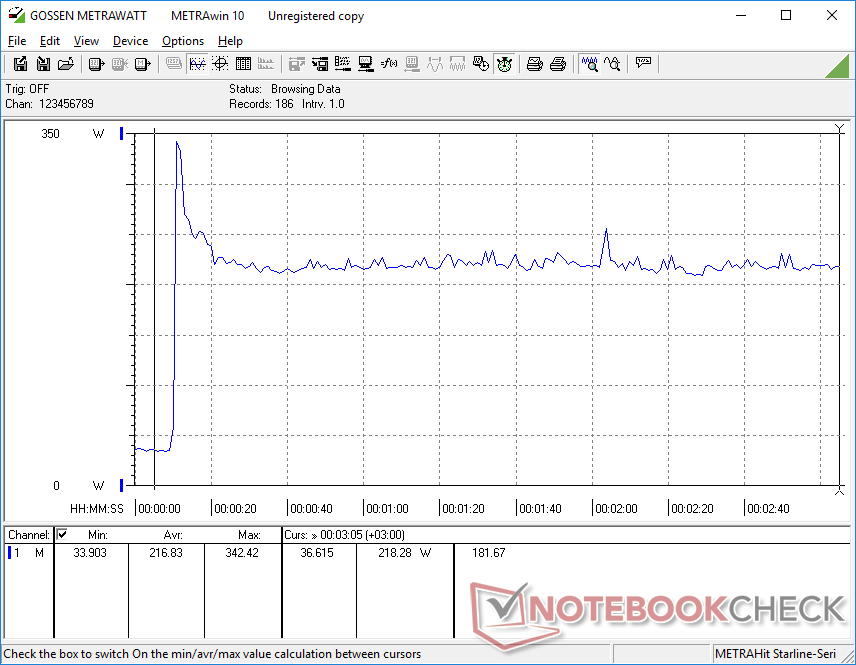
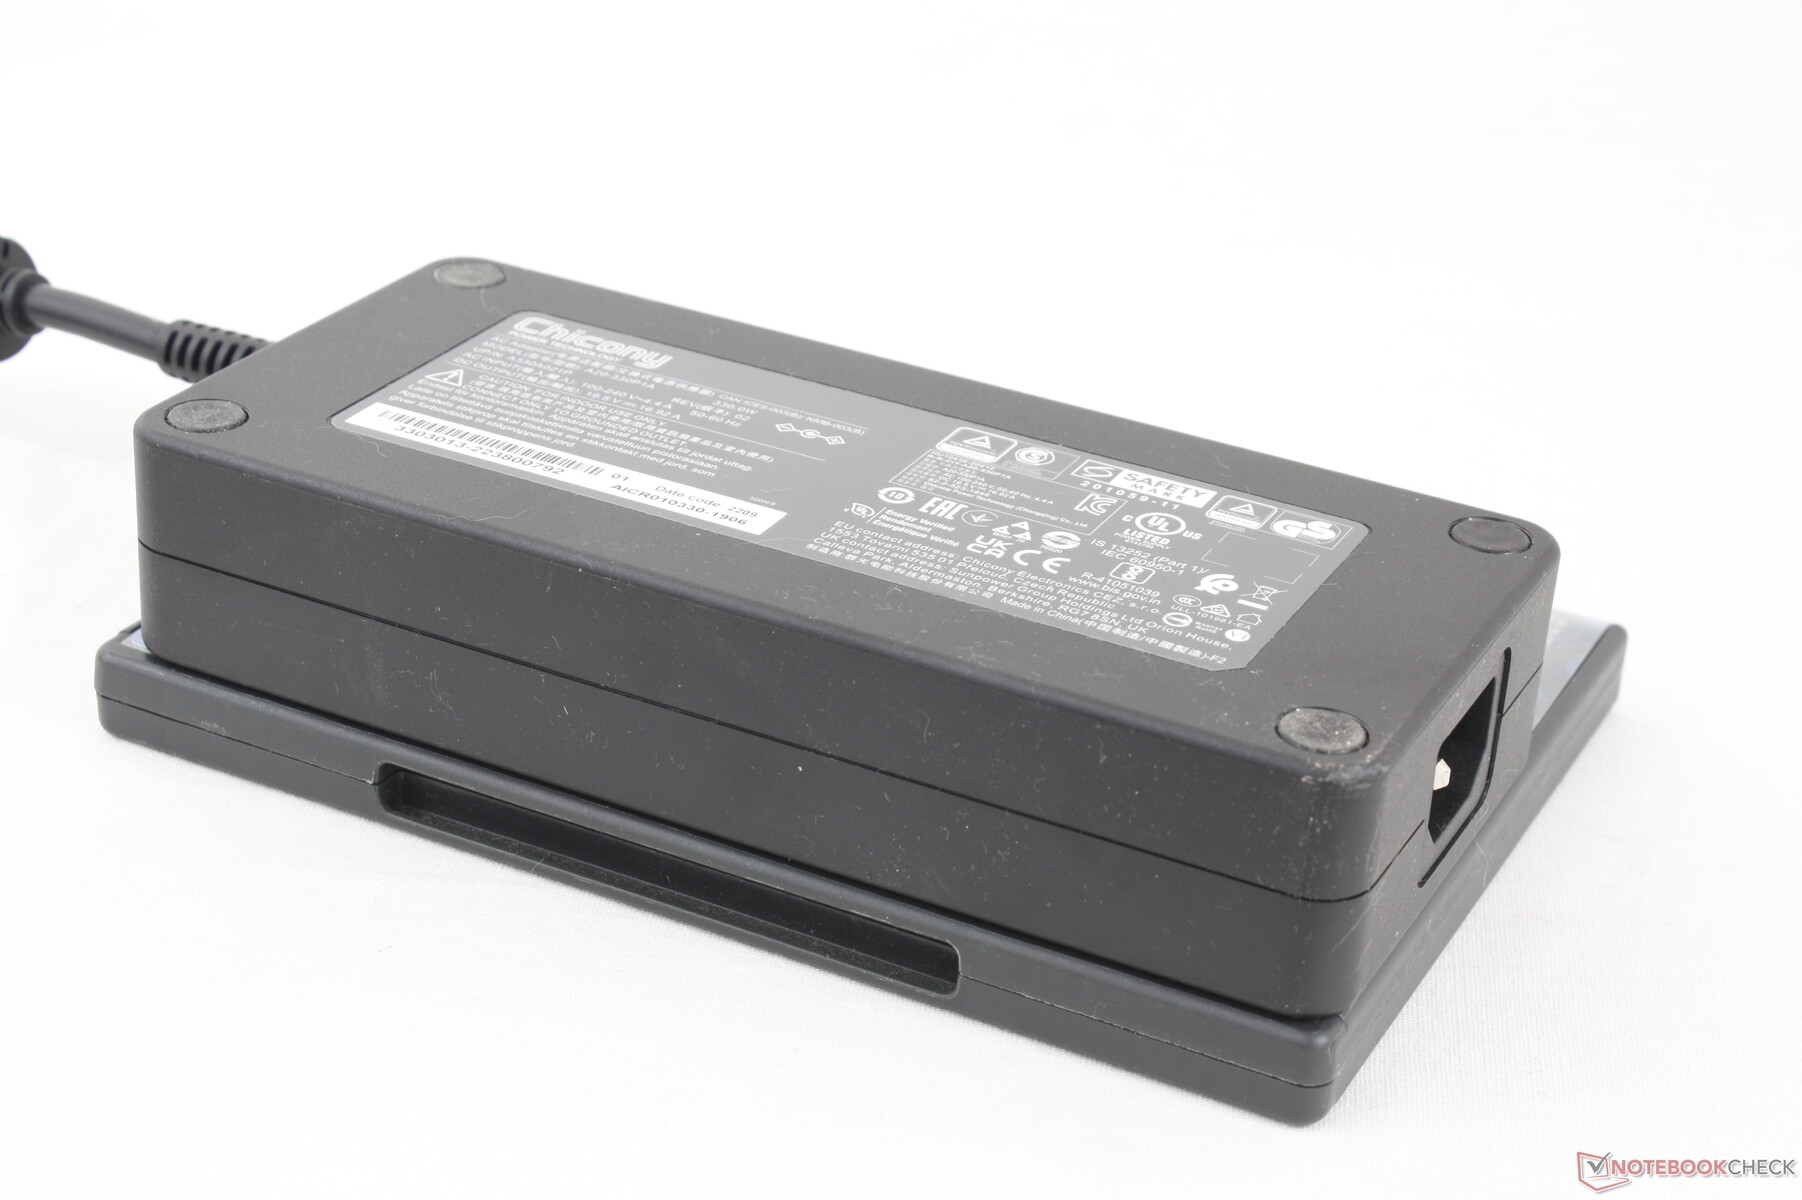
Den totala strömförbrukningen är betydligt högre över hela linjen än vad vi noterade på AMD-Ampere-modellen från 2022. Till exempel förbrukas mellan 14 W och 37 W vid tomgång på skrivbordet jämfört med endast 7 W till 17 W på 2022-versionen. Spel kräver 37 procent mer ström på vår 2023-enhet, men prestanda per watt är fortfarande mycket bra eftersom användarna får 40 till 60 procent mer grafikprestanda jämfört med den mobila RTX 3080 Ti.
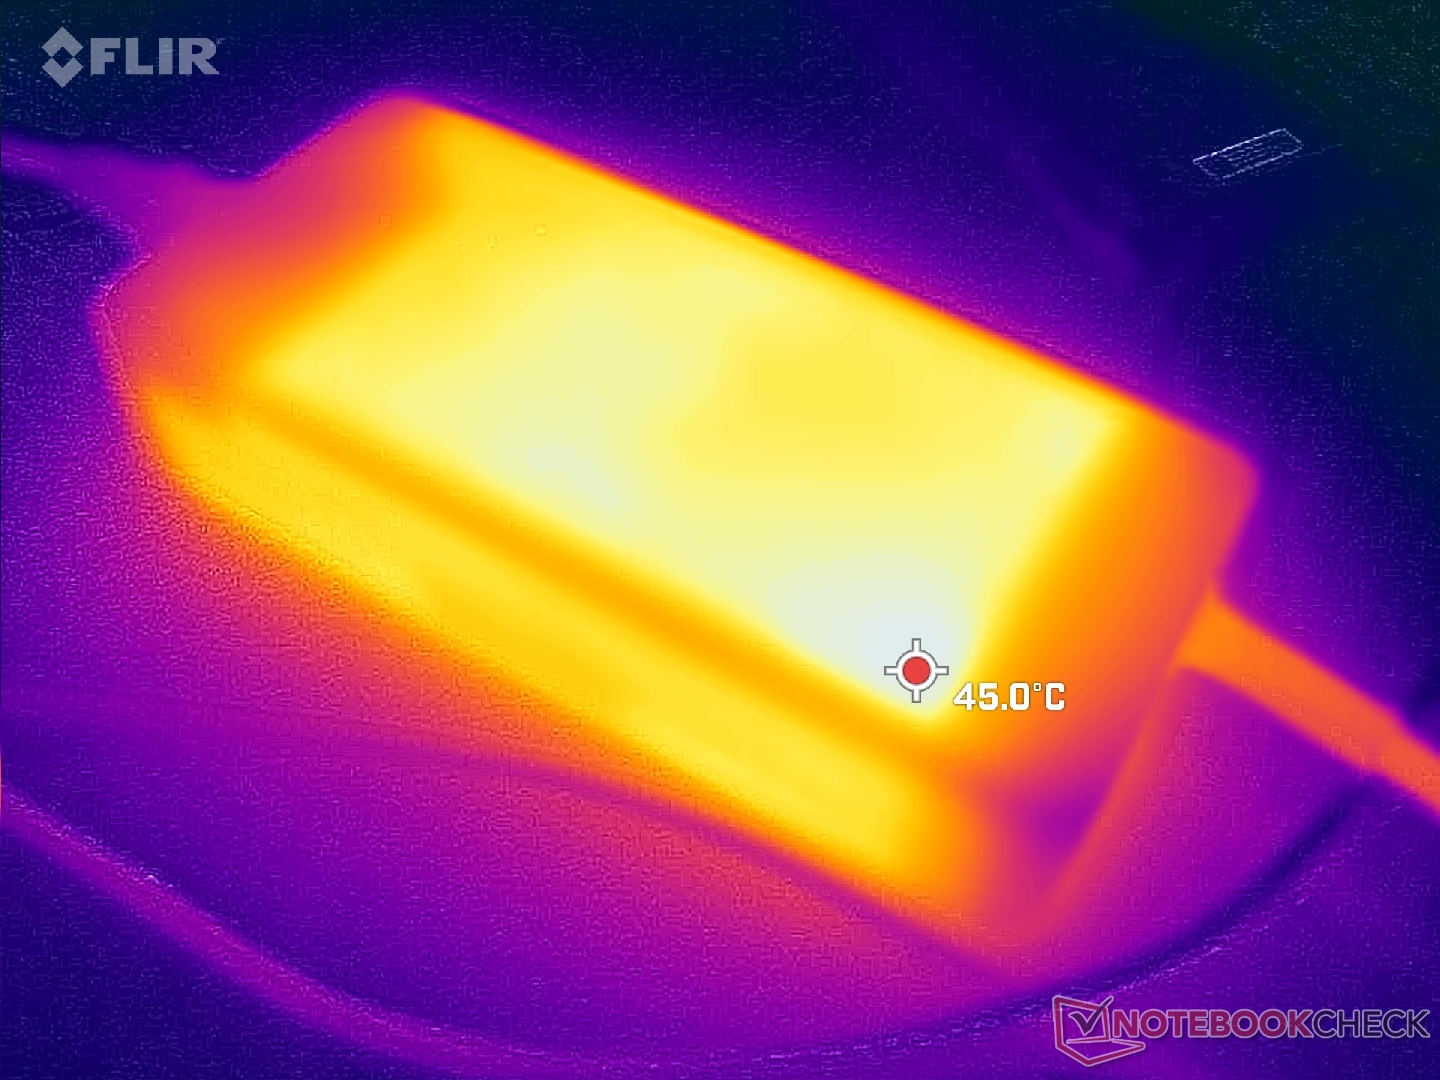
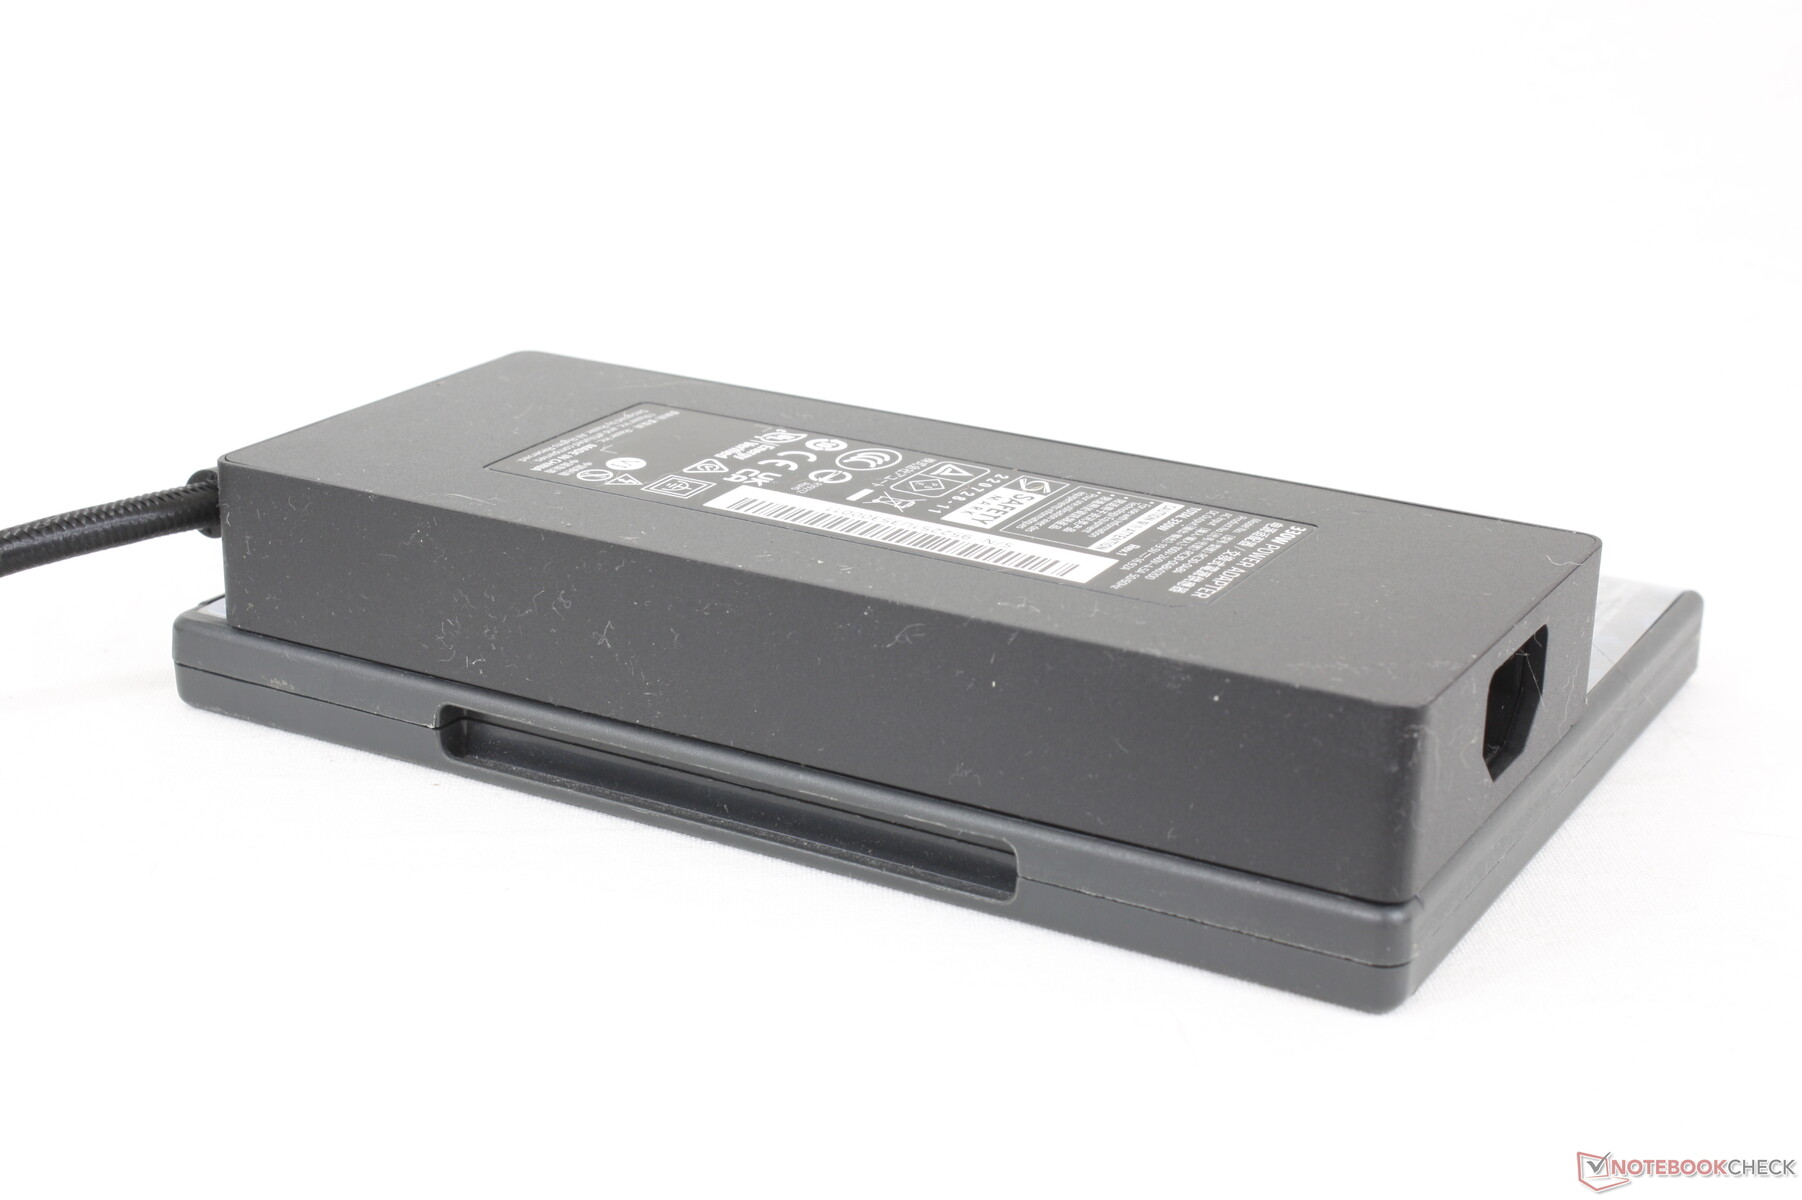
AC-adaptern på 330 W är större än AC-adaptern på 330 W för nya Razer Blade (~18,5 x 8,5 x 3,6 cm jämfört med ~18 x 7,5 x 2,5 cm) eftersom Eluktronics och Uniwill ännu inte har gått över till GaN-laddning. Vi kan registrera en tillfällig maximal förbrukning på 343 W när CPU och GPU är 100 procent utnyttjade vardera.
| Av/Standby | |
| Låg belastning | |
| Hög belastning |
|
Förklaring:
min: | |
| Eluktronics Mech-17 GP2 i9-13900HX, GeForce RTX 4090 Laptop GPU, Samsung PM9A1 MZVL21T0HCLR, IPS, 2560x1600, 17" | Schenker XMG Neo 17 M22 R9 6900HX, GeForce RTX 3080 Ti Laptop GPU, Samsung SSD 980 Pro 1TB MZ-V8P1T0BW, IPS, 2560x1600, 17" | MSI Katana 17 B13VFK i7-13620H, GeForce RTX 4060 Laptop GPU, Micron 2400 MTFDKBA1T0QFM, IPS LED, 1920x1080, 17.3" | MSI Titan GT77 HX 13VI i9-13950HX, GeForce RTX 4090 Laptop GPU, Samsung PM9A1 MZVL22T0HBLB, Mini-LED, 3840x2160, 17.3" | Alienware m17 R5 (R9 6900HX, RX 6850M XT) R9 6900HX, Radeon RX 6850M XT, SSSTC CA6-8D1024, IPS, 3840x2160, 17" | Razer Blade 18 RTX 4070 i9-13950HX, GeForce RTX 4070 Laptop GPU, SSSTC CA6-8D1024, IPS, 2560x1600, 18" | |
|---|---|---|---|---|---|---|
| Power Consumption | 35% | 35% | 1% | 24% | -24% | |
| Idle Minimum * (Watt) | 14 | 7 50% | 12.2 13% | 14 -0% | 13 7% | 24.5 -75% |
| Idle Average * (Watt) | 19.3 | 11 43% | 14.9 23% | 21.6 -12% | 16.5 15% | 34.1 -77% |
| Idle Maximum * (Watt) | 36.8 | 17 54% | 15.8 57% | 24.8 33% | 17 54% | 47.7 -30% |
| Load Average * (Watt) | 117.2 | 92 22% | 85.22 27% | 122.5 -5% | 93 21% | 140 -19% |
| Witcher 3 ultra * (Watt) | 304 | 221 27% | 151.1 50% | 265 13% | 239 21% | 202 34% |
| Load Maximum * (Watt) | 342.5 | 306 11% | 212.8 38% | 418 -22% | 251 27% | 261 24% |
* ... mindre är bättre
Power Consumption Witcher 3 / Stresstest
Power Consumption external Monitor
Batteritid
WLAN-driftstiden är flera timmar kortare än på förra årets AMD-drivna Neo 17 M22, vilket ger en total drifttid på drygt 5 timmar. Båda testenheterna skulle vara inställda på strömprofilen Balanced med Optimus aktiv på iGPU:n.
Laddning från tom till full kapacitet tar mellan 2 och 2,5 timmar. Systemet kan inte laddas via USB-C.
| Eluktronics Mech-17 GP2 i9-13900HX, GeForce RTX 4090 Laptop GPU, 99 Wh | Schenker XMG Neo 17 M22 R9 6900HX, GeForce RTX 3080 Ti Laptop GPU, 99 Wh | MSI Katana 17 B13VFK i7-13620H, GeForce RTX 4060 Laptop GPU, 53.5 Wh | MSI Titan GT77 HX 13VI i9-13950HX, GeForce RTX 4090 Laptop GPU, 99.9 Wh | Alienware m17 R5 (R9 6900HX, RX 6850M XT) R9 6900HX, Radeon RX 6850M XT, 97 Wh | Razer Blade 18 RTX 4070 i9-13950HX, GeForce RTX 4070 Laptop GPU, 91.7 Wh | |
|---|---|---|---|---|---|---|
| Batteridrifttid | 76% | -43% | 4% | -6% | -22% | |
| WiFi v1.3 (h) | 5.1 | 9 76% | 2.9 -43% | 5.3 4% | 4.8 -6% | 4 -22% |
| Reader / Idle (h) | 12 | 7 | ||||
| H.264 (h) | 6.6 | 6 | 4.9 | |||
| Load (h) | 1.8 | 1 | 1.4 | 1.8 | 1.3 |
För
Emot
Bedömning - Värmen skruvas upp lite för bokstavligt
Mech-17 GP2 är 7 procent mindre och 17 procent lättare än Mech-17 GP2 MSI GT77 HX Titan samtidigt som den erbjuder nästan samma prestanda. Den är tätt packad som ett resultat, men kanske lite för mycket. CPU-temperaturerna är extremt höga även för en bärbar dator för spel när man kör spel. Även om intervallet ~97 C tekniskt sett är "säkert" för Intel-processorn är det ändå varmare än på förra årets modell och inte direkt betryggande för slutanvändaren. Den höga kärntemperaturen kan kanske lindras genom att använda den externa vattenkylarens dockningsstation, men en bärbar dator bör inte behöva förlita sig på ett valfritt tillbehör för optimal kylning.
Hög prestanda till priset av höga kärntemperaturer.
Förutom den höga prestandan per volym är priset också en utmärkande faktor för modellen. Mech-17 GP2 är en av de få bärbara datorer GeForce 40 som levereras med ett barebones-alternativ, vilket innebär att du kan spara flera hundra dollar om du kan leverera ditt eget RAM-minne, SSD och operativsystem. 2999 USD för en av de snabbaste bärbara speldatorerna på marknaden är inte helt dåligt; se bara till att hålla ett vakande öga på kärnans temperaturer.
Pris och tillgänglighet
Amazon levererar nu mech-17 GP2 med RTX 4090 för 4400 USD komplett med RAM och lagring. Alternativt kan användare köpa direkt från Eluktronics för fler konfigurerbara alternativ.
Eluktronics Mech-17 GP2
- 03/08/2023 v7 (old)
Allen Ngo
Genomskinlighet
Valet av enheter som ska granskas görs av vår redaktion. Testprovet gavs till författaren som ett lån av tillverkaren eller återförsäljaren för denna recension. Långivaren hade inget inflytande på denna recension och inte heller fick tillverkaren en kopia av denna recension innan publiceringen. Det fanns ingen skyldighet att publicera denna recension. Som ett oberoende medieföretag är Notebookcheck inte föremål för auktoritet från tillverkare, återförsäljare eller förlag.
This is how Notebookcheck is testingEvery year, Notebookcheck independently reviews hundreds of laptops and smartphones using standardized procedures to ensure that all results are comparable. We have continuously developed our test methods for around 20 years and set industry standards in the process. In our test labs, high-quality measuring equipment is utilized by experienced technicians and editors. These tests involve a multi-stage validation process. Our complex rating system is based on hundreds of well-founded measurements and benchmarks, which maintains objectivity.
Price comparison

