Asus ROG Strix SCAR 17 X3D recension - Världens snabbaste bärbara gamingdator
ROG Strix SCAR 17 är kanske inte Asus modernaste gamingdator - men den är definitivt en av de snabbaste på marknaden. Vi har redan testat en mängd olika konfigurationer, först och främst versionen med AMD:s Zen4-processor Ryzen 9 7945HX samt Nvidia GeForce RTX 4090 Laptop. Med den helt nya ROG Strix SCAR 17 X3D har Asus samarbetat med AMD för att vara den första tillverkaren att installera den nya Ryzen 9 7945HX3D i en bärbar dator som kommer att få sin förmodligen redan goda spelprestanda ökad ännu mer genom ytterligare 3D V-Cache.
Bortsett från processorn erbjuder ROG Strix SCAR 17 X3D inget nytt, vilket innebär att vi kommer att koncentrera oss helt på dess prestanda och utsläpp i den här recensionen. För ytterligare information om dess hölje, anslutningsmöjligheter, inmatningsenheter, skärm och högtalare kan du ta en titt på vår tidigare recension. Dessutom rekommenderar vi att du tar en titt på vår analysartikel för den nya AMD Ryzen 9 7945HX3D, som innehåller all teknisk information om processorn:
Potentiella konkurrenter i jämförelse
Gradering | Datum | Modell | Vikt | Höjd | Storlek | Upplösning | Pris |
|---|---|---|---|---|---|---|---|
| 87.2 % v7 (old) | 08/2023 | Asus ROG Strix Scar 17 G733PYV-LL053X R9 7945HX3D, GeForce RTX 4090 Laptop GPU | 2.9 kg | 28.3 mm | 17.30" | 2560x1440 | |
| 88.3 % v7 (old) | 04/2023 | Asus ROG Strix Scar 17 G733PY-XS96 R9 7945HX, GeForce RTX 4090 Laptop GPU | 2.9 kg | 28.3 mm | 17.30" | 2560x1440 | |
| 90.7 % v7 (old) | 04/2023 | Alienware m18 R1 i9-13980HX, GeForce RTX 4090 Laptop GPU | 3.9 kg | 26.7 mm | 18.00" | 1920x1200 | |
| 86.6 % v7 (old) | 02/2023 | Asus ROG Strix Scar 18 2023 G834JY-N6005W i9-13980HX, GeForce RTX 4090 Laptop GPU | 3.1 kg | 30.8 mm | 18.00" | 2560x1600 | |
| 89 % v7 (old) | 02/2023 | MSI Titan GT77 HX 13VI i9-13950HX, GeForce RTX 4090 Laptop GPU | 3.5 kg | 23 mm | 17.30" | 3840x2160 | |
| 85.5 % v7 (old) | 06/2023 | Schenker Key 17 Pro (Early 23) i9-13900HX, GeForce RTX 4090 Laptop GPU | 3.4 kg | 24.9 mm | 17.30" | 3840x2160 |
Prestanda - SCAR 17 X3D med det bästa från AMD och Nvidia
Jämfört med den vanligaROG Strix SCAR 17medRyzen 9 7945HXhar den här versionen en viktig förändring när det gäller processorns kylning. På grund av den nya 7945HX3D-processorns ytstruktur i metall kan ingen flytande metall användas - istället förlitar sig enheten på vanlig termisk pasta. I allmänhet förblir TDP-klassificeringen densamma enligt Asus, men det tar ut sin rätt på den bärbara datorns prestanda.
Villkor för testning
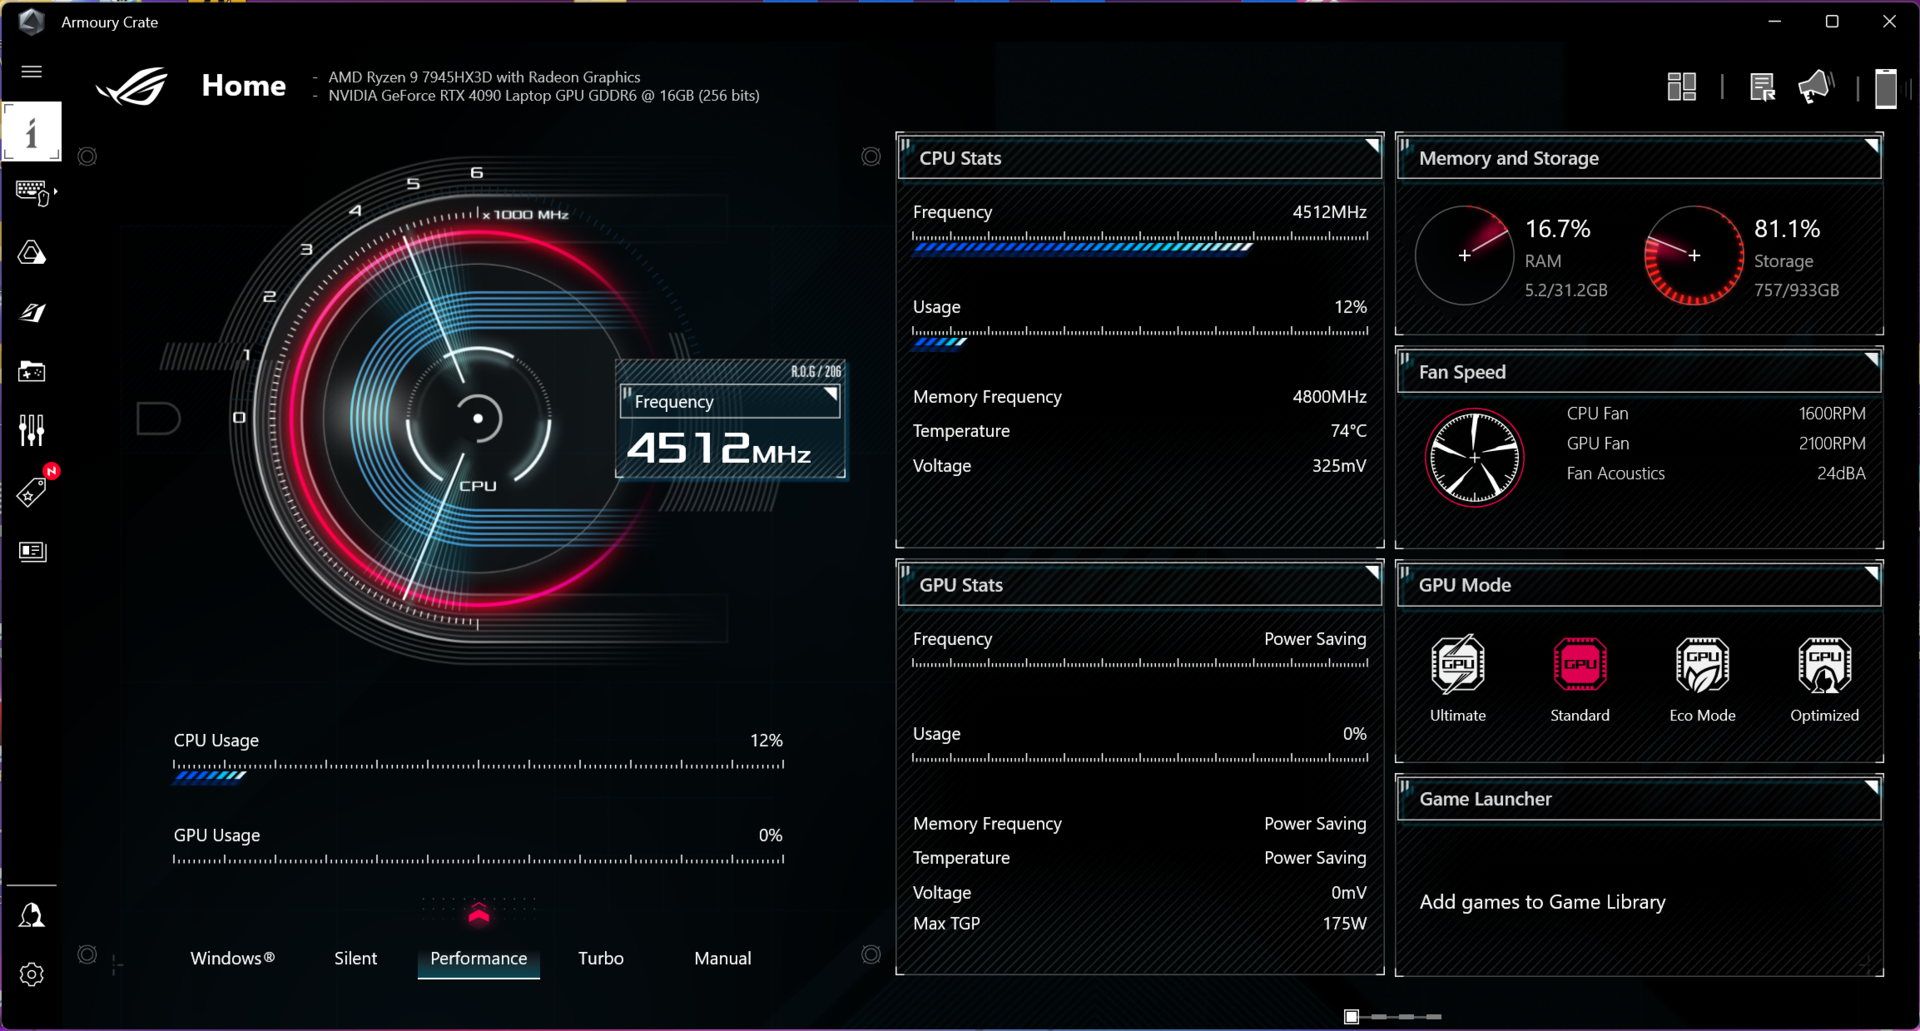
Den förinstallerade programvaran Armoury Crate ger dig tillgång till de välkända energiprofilerna Silent, Performance och Turbo. Dessutom finns det ett manuellt läge som låter dig ändra TDP/TGP-värdena för CPU/GPU. Det finns också några GPU-lägen att välja mellan - i vårt test använde vi läget Ultimate i samordning med energiprofilen Turbo. Följande tabell innehåller respektive TDP/TGP-värden i de olika energiprofilerna. I batteriläge är profilen Turbo inte tillgänglig.
| Scenario | Tyst | Prestanda | Turbo |
|---|---|---|---|
| CPU-belastning | 65/55 watt | 90/85 watt | 125/90 watt |
| GPU-belastning | D-Notify | 140 + 20 watt Dynamic Boost | 150 + 25 watt Dynamic Boost |
| Stresstest | CPU: 35 watt GPU: D-Notify |
CPU: 40 watt GPU: 150 watt |
CPU: 50 watt GPU: 175 watt |
Observera: D-Notify är en Nvidia-specifik funktion. När D-Notify-funktionen är aktiverad ökar GPU:n sin strömförbrukning baserat på applikation/belastning tills GPU:n når en temperatur på 75 °C. I detta fall är TGP begränsad till 55 watt.
Processor - Ryzen 9 7945HX3D
Den nyaAMD Ryzen 9 7945HX3D's grundläggande tekniska specifikationer är identiska med den vanligaRyzen 9 7945HX: 16 Zen4-kärnor (32 trådar) med en maximal klockfrekvens på upp till 5,4 GHz. På den nya modellen ökas dock 80-MB-cachen (16 MB L2 + 64 MB L3) med ytterligare 64-MB L3-cache. All ytterligare teknisk information om detta finns i vår analys av den nya Ryzen 9 7945HX3D.
Till skillnad från SCAR 17 med den normala Ryzen 9 7945HX, visade de riktmärken som kördes med den nya versionen lägre totala strömförbrukningsvärden. Vi noterade ett maximum på upp till 115 watt som snabbt balanserade ut på 100 watt. Här gör den saknade flytande metallen sig redan känd. Benchmarkresultaten är fortfarande fenomenala totalt sett - men när det gäller ren CPU-prestanda har de normala 7945HX-modellerna en liten fördel. Återigen är dess totala prestanda jämförbar med Intel HX-processorerna, som bara gjorde bättre ifrån sig i vissa enkelkärniga tester. Samtidigt får du inte glömma att Intel-chipen använder betydligt mer ström - i single-core-användning och särskilt när alla kärnor är laddade. För att jämföra: Ryzen 9 7945HX3D med 100 watt var betydligt snabbare i flerkärniga tester jämfört med Core i9-13980HX med 170 watt.
Vid batterianvändning använder processorn maximalt 85 watt under en kort tid, varefter den snabbt balanseras till 55 watt. I Cinebench R23 Multi-testet var detta tillräckligt för att säkra 24 127 poäng, vilket motsvarar ett underskott på 26 %. Dess single-core-användning var inte begränsad. Ytterligare CPU-benchmarks hittar du i vårt teknikavsnitt Mobile Processors - Benchmark List .
Cinebench R15 Multi continuous test
Cinebench R23: Multi Core | Single Core
Cinebench R20: CPU (Multi Core) | CPU (Single Core)
Cinebench R15: CPU Multi 64Bit | CPU Single 64Bit
Blender: v2.79 BMW27 CPU
7-Zip 18.03: 7z b 4 | 7z b 4 -mmt1
Geekbench 5.5: Multi-Core | Single-Core
HWBOT x265 Benchmark v2.2: 4k Preset
LibreOffice : 20 Documents To PDF
R Benchmark 2.5: Overall mean
| CPU Performance rating | |
| Asus ROG Strix Scar 17 G733PY-XS96 | |
| Asus ROG Strix Scar 17 G733PYV-LL053X | |
| Genomsnitt AMD Ryzen 9 7945HX3D | |
| Asus ROG Strix Scar 18 2023 G834JY-N6005W | |
| Alienware m18 R1 | |
| MSI Titan GT77 HX 13VI | |
| Lenovo Legion Pro 7 RTX4090 | |
| Schenker Key 17 Pro (Early 23) | |
| Genomsnitt av klass Gaming | |
| Lenovo Legion Pro 5 16ARX8 | |
| Asus ROG Zephyrus M16 GU604VY-NM042X | |
| Cinebench R23 / Multi Core | |
| Asus ROG Strix Scar 17 G733PY-XS96 | |
| MSI Titan GT77 HX 13VI | |
| Asus ROG Strix Scar 17 G733PYV-LL053X | |
| Genomsnitt AMD Ryzen 9 7945HX3D (n=1) | |
| Alienware m18 R1 | |
| Asus ROG Strix Scar 18 2023 G834JY-N6005W | |
| Lenovo Legion Pro 7 RTX4090 | |
| Schenker Key 17 Pro (Early 23) | |
| Genomsnitt av klass Gaming (10488 - 40970, n=112, senaste 2 åren) | |
| Asus ROG Zephyrus M16 GU604VY-NM042X | |
| Lenovo Legion Pro 5 16ARX8 | |
| Cinebench R23 / Single Core | |
| Asus ROG Strix Scar 18 2023 G834JY-N6005W | |
| Alienware m18 R1 | |
| MSI Titan GT77 HX 13VI | |
| Lenovo Legion Pro 7 RTX4090 | |
| Schenker Key 17 Pro (Early 23) | |
| Genomsnitt av klass Gaming (1166 - 2356, n=112, senaste 2 åren) | |
| Asus ROG Zephyrus M16 GU604VY-NM042X | |
| Asus ROG Strix Scar 17 G733PYV-LL053X | |
| Genomsnitt AMD Ryzen 9 7945HX3D (n=1) | |
| Asus ROG Strix Scar 17 G733PY-XS96 | |
| Lenovo Legion Pro 5 16ARX8 | |
| Cinebench R20 / CPU (Multi Core) | |
| Asus ROG Strix Scar 17 G733PY-XS96 | |
| Asus ROG Strix Scar 17 G733PYV-LL053X | |
| Genomsnitt AMD Ryzen 9 7945HX3D (n=1) | |
| MSI Titan GT77 HX 13VI | |
| Alienware m18 R1 | |
| Asus ROG Strix Scar 18 2023 G834JY-N6005W | |
| Lenovo Legion Pro 7 RTX4090 | |
| Schenker Key 17 Pro (Early 23) | |
| Genomsnitt av klass Gaming (4029 - 16108, n=111, senaste 2 åren) | |
| Asus ROG Zephyrus M16 GU604VY-NM042X | |
| Lenovo Legion Pro 5 16ARX8 | |
| Cinebench R20 / CPU (Single Core) | |
| Asus ROG Strix Scar 18 2023 G834JY-N6005W | |
| Alienware m18 R1 | |
| MSI Titan GT77 HX 13VI | |
| Schenker Key 17 Pro (Early 23) | |
| Lenovo Legion Pro 7 RTX4090 | |
| Genomsnitt av klass Gaming (442 - 895, n=111, senaste 2 åren) | |
| Asus ROG Strix Scar 17 G733PYV-LL053X | |
| Genomsnitt AMD Ryzen 9 7945HX3D (n=1) | |
| Asus ROG Zephyrus M16 GU604VY-NM042X | |
| Asus ROG Strix Scar 17 G733PY-XS96 | |
| Lenovo Legion Pro 5 16ARX8 | |
| Cinebench R15 / CPU Multi 64Bit | |
| Asus ROG Strix Scar 17 G733PYV-LL053X | |
| Genomsnitt AMD Ryzen 9 7945HX3D (n=1) | |
| Asus ROG Strix Scar 17 G733PY-XS96 | |
| MSI Titan GT77 HX 13VI | |
| Alienware m18 R1 | |
| Asus ROG Strix Scar 18 2023 G834JY-N6005W | |
| Lenovo Legion Pro 7 RTX4090 | |
| Schenker Key 17 Pro (Early 23) | |
| Genomsnitt av klass Gaming (1578 - 6271, n=111, senaste 2 åren) | |
| Asus ROG Zephyrus M16 GU604VY-NM042X | |
| Lenovo Legion Pro 5 16ARX8 | |
| Cinebench R15 / CPU Single 64Bit | |
| Asus ROG Strix Scar 18 2023 G834JY-N6005W | |
| Asus ROG Strix Scar 17 G733PYV-LL053X | |
| Genomsnitt AMD Ryzen 9 7945HX3D (n=1) | |
| Asus ROG Strix Scar 17 G733PY-XS96 | |
| Alienware m18 R1 | |
| MSI Titan GT77 HX 13VI | |
| Genomsnitt av klass Gaming (188.8 - 343, n=111, senaste 2 åren) | |
| Lenovo Legion Pro 5 16ARX8 | |
| Asus ROG Zephyrus M16 GU604VY-NM042X | |
| Schenker Key 17 Pro (Early 23) | |
| Lenovo Legion Pro 7 RTX4090 | |
| Blender / v2.79 BMW27 CPU | |
| Lenovo Legion Pro 5 16ARX8 | |
| Asus ROG Zephyrus M16 GU604VY-NM042X | |
| Genomsnitt av klass Gaming (80 - 330, n=109, senaste 2 åren) | |
| Schenker Key 17 Pro (Early 23) | |
| Lenovo Legion Pro 7 RTX4090 | |
| Asus ROG Strix Scar 18 2023 G834JY-N6005W | |
| MSI Titan GT77 HX 13VI | |
| Alienware m18 R1 | |
| Asus ROG Strix Scar 17 G733PYV-LL053X | |
| Genomsnitt AMD Ryzen 9 7945HX3D (n=1) | |
| Asus ROG Strix Scar 17 G733PY-XS96 | |
| 7-Zip 18.03 / 7z b 4 | |
| Asus ROG Strix Scar 17 G733PY-XS96 | |
| Asus ROG Strix Scar 17 G733PYV-LL053X | |
| Genomsnitt AMD Ryzen 9 7945HX3D (n=1) | |
| Alienware m18 R1 | |
| MSI Titan GT77 HX 13VI | |
| Asus ROG Strix Scar 18 2023 G834JY-N6005W | |
| Lenovo Legion Pro 7 RTX4090 | |
| Schenker Key 17 Pro (Early 23) | |
| Genomsnitt av klass Gaming (33491 - 148086, n=110, senaste 2 åren) | |
| Asus ROG Zephyrus M16 GU604VY-NM042X | |
| Lenovo Legion Pro 5 16ARX8 | |
| 7-Zip 18.03 / 7z b 4 -mmt1 | |
| Asus ROG Strix Scar 17 G733PY-XS96 | |
| Asus ROG Strix Scar 17 G733PYV-LL053X | |
| Genomsnitt AMD Ryzen 9 7945HX3D (n=1) | |
| Lenovo Legion Pro 5 16ARX8 | |
| Asus ROG Strix Scar 18 2023 G834JY-N6005W | |
| Lenovo Legion Pro 7 RTX4090 | |
| MSI Titan GT77 HX 13VI | |
| Alienware m18 R1 | |
| Schenker Key 17 Pro (Early 23) | |
| Genomsnitt av klass Gaming (4199 - 7436, n=110, senaste 2 åren) | |
| Asus ROG Zephyrus M16 GU604VY-NM042X | |
| Geekbench 5.5 / Multi-Core | |
| Alienware m18 R1 | |
| Asus ROG Strix Scar 18 2023 G834JY-N6005W | |
| MSI Titan GT77 HX 13VI | |
| Lenovo Legion Pro 7 RTX4090 | |
| Asus ROG Strix Scar 17 G733PYV-LL053X | |
| Genomsnitt AMD Ryzen 9 7945HX3D (n=1) | |
| Schenker Key 17 Pro (Early 23) | |
| Asus ROG Strix Scar 17 G733PY-XS96 | |
| Genomsnitt av klass Gaming (6460 - 27010, n=110, senaste 2 åren) | |
| Asus ROG Zephyrus M16 GU604VY-NM042X | |
| Lenovo Legion Pro 5 16ARX8 | |
| Geekbench 5.5 / Single-Core | |
| Asus ROG Strix Scar 17 G733PYV-LL053X | |
| Genomsnitt AMD Ryzen 9 7945HX3D (n=1) | |
| Asus ROG Strix Scar 18 2023 G834JY-N6005W | |
| Alienware m18 R1 | |
| Asus ROG Strix Scar 17 G733PY-XS96 | |
| Genomsnitt av klass Gaming (986 - 2474, n=110, senaste 2 åren) | |
| MSI Titan GT77 HX 13VI | |
| Lenovo Legion Pro 5 16ARX8 | |
| Lenovo Legion Pro 7 RTX4090 | |
| Asus ROG Zephyrus M16 GU604VY-NM042X | |
| Schenker Key 17 Pro (Early 23) | |
| HWBOT x265 Benchmark v2.2 / 4k Preset | |
| Asus ROG Strix Scar 17 G733PY-XS96 | |
| Asus ROG Strix Scar 17 G733PYV-LL053X | |
| Genomsnitt AMD Ryzen 9 7945HX3D (n=1) | |
| Asus ROG Strix Scar 18 2023 G834JY-N6005W | |
| Alienware m18 R1 | |
| MSI Titan GT77 HX 13VI | |
| Lenovo Legion Pro 7 RTX4090 | |
| Genomsnitt av klass Gaming (11.5 - 44.3, n=110, senaste 2 åren) | |
| Schenker Key 17 Pro (Early 23) | |
| Lenovo Legion Pro 5 16ARX8 | |
| Asus ROG Zephyrus M16 GU604VY-NM042X | |
| LibreOffice / 20 Documents To PDF | |
| Asus ROG Zephyrus M16 GU604VY-NM042X | |
| Genomsnitt av klass Gaming (19 - 88.8, n=110, senaste 2 åren) | |
| Alienware m18 R1 | |
| MSI Titan GT77 HX 13VI | |
| Schenker Key 17 Pro (Early 23) | |
| Lenovo Legion Pro 7 RTX4090 | |
| Asus ROG Strix Scar 17 G733PYV-LL053X | |
| Genomsnitt AMD Ryzen 9 7945HX3D (n=1) | |
| Lenovo Legion Pro 5 16ARX8 | |
| Asus ROG Strix Scar 17 G733PY-XS96 | |
| Asus ROG Strix Scar 18 2023 G834JY-N6005W | |
| R Benchmark 2.5 / Overall mean | |
| Genomsnitt av klass Gaming (0.3439 - 0.759, n=111, senaste 2 åren) | |
| Lenovo Legion Pro 5 16ARX8 | |
| Asus ROG Strix Scar 17 G733PYV-LL053X | |
| Genomsnitt AMD Ryzen 9 7945HX3D (n=1) | |
| Asus ROG Zephyrus M16 GU604VY-NM042X | |
| Asus ROG Strix Scar 17 G733PY-XS96 | |
| MSI Titan GT77 HX 13VI | |
| Lenovo Legion Pro 7 RTX4090 | |
| Schenker Key 17 Pro (Early 23) | |
| Alienware m18 R1 | |
| Asus ROG Strix Scar 18 2023 G834JY-N6005W | |
* ... mindre är bättre
AIDA64: FP32 Ray-Trace | FPU Julia | CPU SHA3 | CPU Queen | FPU SinJulia | FPU Mandel | CPU AES | CPU ZLib | FP64 Ray-Trace | CPU PhotoWorxx
| Performance rating | |
| Asus ROG Strix Scar 17 G733PYV-LL053X | |
| Genomsnitt AMD Ryzen 9 7945HX3D | |
| Asus ROG Strix Scar 17 G733PY-XS96 | |
| Alienware m18 R1 | |
| Asus ROG Strix Scar 18 2023 G834JY-N6005W | |
| MSI Titan GT77 HX 13VI | |
| Lenovo Legion Pro 7 RTX4090 | |
| Schenker Key 17 Pro (Early 23) | |
| Genomsnitt av klass Gaming | |
| Lenovo Legion Pro 5 16ARX8 | |
| Asus ROG Zephyrus M16 GU604VY-NM042X | |
| AIDA64 / FP32 Ray-Trace | |
| Asus ROG Strix Scar 17 G733PY-XS96 | |
| Asus ROG Strix Scar 17 G733PYV-LL053X | |
| Genomsnitt AMD Ryzen 9 7945HX3D (n=1) | |
| Genomsnitt av klass Gaming (10227 - 85542, n=109, senaste 2 åren) | |
| Lenovo Legion Pro 5 16ARX8 | |
| Alienware m18 R1 | |
| MSI Titan GT77 HX 13VI | |
| Asus ROG Strix Scar 18 2023 G834JY-N6005W | |
| Lenovo Legion Pro 7 RTX4090 | |
| Schenker Key 17 Pro (Early 23) | |
| Asus ROG Zephyrus M16 GU604VY-NM042X | |
| AIDA64 / FPU Julia | |
| Asus ROG Strix Scar 17 G733PY-XS96 | |
| Asus ROG Strix Scar 17 G733PYV-LL053X | |
| Genomsnitt AMD Ryzen 9 7945HX3D (n=1) | |
| Alienware m18 R1 | |
| MSI Titan GT77 HX 13VI | |
| Asus ROG Strix Scar 18 2023 G834JY-N6005W | |
| Lenovo Legion Pro 7 RTX4090 | |
| Genomsnitt av klass Gaming (51376 - 238426, n=109, senaste 2 åren) | |
| Lenovo Legion Pro 5 16ARX8 | |
| Schenker Key 17 Pro (Early 23) | |
| Asus ROG Zephyrus M16 GU604VY-NM042X | |
| AIDA64 / CPU SHA3 | |
| Asus ROG Strix Scar 17 G733PY-XS96 | |
| Asus ROG Strix Scar 17 G733PYV-LL053X | |
| Genomsnitt AMD Ryzen 9 7945HX3D (n=1) | |
| Alienware m18 R1 | |
| MSI Titan GT77 HX 13VI | |
| Asus ROG Strix Scar 18 2023 G834JY-N6005W | |
| Lenovo Legion Pro 7 RTX4090 | |
| Genomsnitt av klass Gaming (2180 - 9817, n=109, senaste 2 åren) | |
| Schenker Key 17 Pro (Early 23) | |
| Lenovo Legion Pro 5 16ARX8 | |
| Asus ROG Zephyrus M16 GU604VY-NM042X | |
| AIDA64 / CPU Queen | |
| Asus ROG Strix Scar 17 G733PY-XS96 | |
| Asus ROG Strix Scar 17 G733PYV-LL053X | |
| Genomsnitt AMD Ryzen 9 7945HX3D (n=1) | |
| Alienware m18 R1 | |
| Asus ROG Strix Scar 18 2023 G834JY-N6005W | |
| MSI Titan GT77 HX 13VI | |
| Schenker Key 17 Pro (Early 23) | |
| Lenovo Legion Pro 7 RTX4090 | |
| Lenovo Legion Pro 5 16ARX8 | |
| Asus ROG Zephyrus M16 GU604VY-NM042X | |
| Genomsnitt av klass Gaming (49785 - 173351, n=100, senaste 2 åren) | |
| AIDA64 / FPU SinJulia | |
| Asus ROG Strix Scar 17 G733PY-XS96 | |
| Asus ROG Strix Scar 17 G733PYV-LL053X | |
| Genomsnitt AMD Ryzen 9 7945HX3D (n=1) | |
| Asus ROG Strix Scar 18 2023 G834JY-N6005W | |
| MSI Titan GT77 HX 13VI | |
| Alienware m18 R1 | |
| Lenovo Legion Pro 5 16ARX8 | |
| Lenovo Legion Pro 7 RTX4090 | |
| Schenker Key 17 Pro (Early 23) | |
| Genomsnitt av klass Gaming (4424 - 33636, n=109, senaste 2 åren) | |
| Asus ROG Zephyrus M16 GU604VY-NM042X | |
| AIDA64 / FPU Mandel | |
| Asus ROG Strix Scar 17 G733PY-XS96 | |
| Asus ROG Strix Scar 17 G733PYV-LL053X | |
| Genomsnitt AMD Ryzen 9 7945HX3D (n=1) | |
| Alienware m18 R1 | |
| MSI Titan GT77 HX 13VI | |
| Genomsnitt av klass Gaming (25115 - 128721, n=109, senaste 2 åren) | |
| Asus ROG Strix Scar 18 2023 G834JY-N6005W | |
| Lenovo Legion Pro 7 RTX4090 | |
| Lenovo Legion Pro 5 16ARX8 | |
| Schenker Key 17 Pro (Early 23) | |
| Asus ROG Zephyrus M16 GU604VY-NM042X | |
| AIDA64 / CPU AES | |
| Asus ROG Strix Scar 17 G733PYV-LL053X | |
| Genomsnitt AMD Ryzen 9 7945HX3D (n=1) | |
| Schenker Key 17 Pro (Early 23) | |
| Asus ROG Strix Scar 17 G733PY-XS96 | |
| MSI Titan GT77 HX 13VI | |
| Alienware m18 R1 | |
| Asus ROG Strix Scar 18 2023 G834JY-N6005W | |
| Lenovo Legion Pro 7 RTX4090 | |
| Genomsnitt av klass Gaming (39258 - 247074, n=109, senaste 2 åren) | |
| Asus ROG Zephyrus M16 GU604VY-NM042X | |
| Lenovo Legion Pro 5 16ARX8 | |
| AIDA64 / CPU ZLib | |
| Asus ROG Strix Scar 17 G733PY-XS96 | |
| MSI Titan GT77 HX 13VI | |
| Asus ROG Strix Scar 17 G733PYV-LL053X | |
| Genomsnitt AMD Ryzen 9 7945HX3D (n=1) | |
| Asus ROG Strix Scar 18 2023 G834JY-N6005W | |
| Alienware m18 R1 | |
| Lenovo Legion Pro 7 RTX4090 | |
| Schenker Key 17 Pro (Early 23) | |
| Genomsnitt av klass Gaming (574 - 2531, n=109, senaste 2 åren) | |
| Asus ROG Zephyrus M16 GU604VY-NM042X | |
| Lenovo Legion Pro 5 16ARX8 | |
| AIDA64 / FP64 Ray-Trace | |
| Asus ROG Strix Scar 17 G733PY-XS96 | |
| Asus ROG Strix Scar 17 G733PYV-LL053X | |
| Genomsnitt AMD Ryzen 9 7945HX3D (n=1) | |
| Genomsnitt av klass Gaming (5509 - 45446, n=109, senaste 2 åren) | |
| Alienware m18 R1 | |
| Lenovo Legion Pro 5 16ARX8 | |
| MSI Titan GT77 HX 13VI | |
| Asus ROG Strix Scar 18 2023 G834JY-N6005W | |
| Lenovo Legion Pro 7 RTX4090 | |
| Schenker Key 17 Pro (Early 23) | |
| Asus ROG Zephyrus M16 GU604VY-NM042X | |
| AIDA64 / CPU PhotoWorxx | |
| Alienware m18 R1 | |
| Lenovo Legion Pro 7 RTX4090 | |
| Schenker Key 17 Pro (Early 23) | |
| Asus ROG Zephyrus M16 GU604VY-NM042X | |
| Genomsnitt av klass Gaming (12271 - 89891, n=109, senaste 2 åren) | |
| Asus ROG Strix Scar 18 2023 G834JY-N6005W | |
| MSI Titan GT77 HX 13VI | |
| Asus ROG Strix Scar 17 G733PYV-LL053X | |
| Genomsnitt AMD Ryzen 9 7945HX3D (n=1) | |
| Asus ROG Strix Scar 17 G733PY-XS96 | |
| Lenovo Legion Pro 5 16ARX8 | |
Systemets prestanda
Nya ROG Strix SCAR 17 X3D klarade sig också bättre än konkurrenterna i det syntetiska PCMark 10-testet - även om skillnaderna inte var stora och i vardaglig användning är alla jämförelseenheter extremt snabba. AMD-testenheten kom bara strax bakom sina snabbaste Intel-konkurrenter i det plattformsövergripande CrossMark-testet.
CrossMark: Overall | Productivity | Creativity | Responsiveness
| PCMark 10 / Score | |
| Asus ROG Strix Scar 17 G733PYV-LL053X | |
| Genomsnitt AMD Ryzen 9 7945HX3D, NVIDIA GeForce RTX 4090 Laptop GPU (n=1) | |
| Schenker Key 17 Pro (Early 23) | |
| MSI Titan GT77 HX 13VI | |
| Asus ROG Strix Scar 18 2023 G834JY-N6005W | |
| Alienware m18 R1 | |
| Asus ROG Strix Scar 17 G733PY-XS96 | |
| Genomsnitt av klass Gaming (5828 - 11574, n=95, senaste 2 åren) | |
| Asus ROG Zephyrus M16 GU604VY-NM042X | |
| Lenovo Legion Pro 5 16ARX8 | |
| Lenovo Legion Pro 7 RTX4090 | |
| PCMark 10 / Essentials | |
| MSI Titan GT77 HX 13VI | |
| Asus ROG Zephyrus M16 GU604VY-NM042X | |
| Asus ROG Strix Scar 17 G733PYV-LL053X | |
| Genomsnitt AMD Ryzen 9 7945HX3D, NVIDIA GeForce RTX 4090 Laptop GPU (n=1) | |
| Schenker Key 17 Pro (Early 23) | |
| Alienware m18 R1 | |
| Asus ROG Strix Scar 17 G733PY-XS96 | |
| Lenovo Legion Pro 7 RTX4090 | |
| Lenovo Legion Pro 5 16ARX8 | |
| Genomsnitt av klass Gaming (8810 - 12600, n=99, senaste 2 åren) | |
| PCMark 10 / Productivity | |
| Schenker Key 17 Pro (Early 23) | |
| Asus ROG Zephyrus M16 GU604VY-NM042X | |
| Asus ROG Strix Scar 17 G733PYV-LL053X | |
| Genomsnitt AMD Ryzen 9 7945HX3D, NVIDIA GeForce RTX 4090 Laptop GPU (n=1) | |
| Genomsnitt av klass Gaming (6845 - 18766, n=97, senaste 2 åren) | |
| Asus ROG Strix Scar 17 G733PY-XS96 | |
| Lenovo Legion Pro 5 16ARX8 | |
| Alienware m18 R1 | |
| MSI Titan GT77 HX 13VI | |
| Lenovo Legion Pro 7 RTX4090 | |
| PCMark 10 / Digital Content Creation | |
| MSI Titan GT77 HX 13VI | |
| Asus ROG Strix Scar 17 G733PYV-LL053X | |
| Genomsnitt AMD Ryzen 9 7945HX3D, NVIDIA GeForce RTX 4090 Laptop GPU (n=1) | |
| Alienware m18 R1 | |
| Asus ROG Strix Scar 17 G733PY-XS96 | |
| Schenker Key 17 Pro (Early 23) | |
| Lenovo Legion Pro 7 RTX4090 | |
| Genomsnitt av klass Gaming (7602 - 19657, n=97, senaste 2 åren) | |
| Lenovo Legion Pro 5 16ARX8 | |
| Asus ROG Zephyrus M16 GU604VY-NM042X | |
| CrossMark / Overall | |
| Schenker Key 17 Pro (Early 23) | |
| Alienware m18 R1 | |
| MSI Titan GT77 HX 13VI | |
| Asus ROG Strix Scar 17 G733PYV-LL053X | |
| Genomsnitt AMD Ryzen 9 7945HX3D, NVIDIA GeForce RTX 4090 Laptop GPU (n=1) | |
| Asus ROG Strix Scar 18 2023 G834JY-N6005W | |
| Lenovo Legion Pro 5 16ARX8 | |
| Asus ROG Strix Scar 17 G733PY-XS96 | |
| Genomsnitt av klass Gaming (1366 - 2409, n=97, senaste 2 åren) | |
| Asus ROG Zephyrus M16 GU604VY-NM042X | |
| CrossMark / Productivity | |
| Schenker Key 17 Pro (Early 23) | |
| Alienware m18 R1 | |
| MSI Titan GT77 HX 13VI | |
| Asus ROG Strix Scar 17 G733PYV-LL053X | |
| Genomsnitt AMD Ryzen 9 7945HX3D, NVIDIA GeForce RTX 4090 Laptop GPU (n=1) | |
| Lenovo Legion Pro 5 16ARX8 | |
| Asus ROG Strix Scar 18 2023 G834JY-N6005W | |
| Genomsnitt av klass Gaming (1386 - 2254, n=97, senaste 2 åren) | |
| Asus ROG Zephyrus M16 GU604VY-NM042X | |
| Asus ROG Strix Scar 17 G733PY-XS96 | |
| CrossMark / Creativity | |
| Alienware m18 R1 | |
| Asus ROG Strix Scar 18 2023 G834JY-N6005W | |
| Schenker Key 17 Pro (Early 23) | |
| MSI Titan GT77 HX 13VI | |
| Asus ROG Strix Scar 17 G733PYV-LL053X | |
| Genomsnitt AMD Ryzen 9 7945HX3D, NVIDIA GeForce RTX 4090 Laptop GPU (n=1) | |
| Asus ROG Strix Scar 17 G733PY-XS96 | |
| Asus ROG Zephyrus M16 GU604VY-NM042X | |
| Genomsnitt av klass Gaming (1343 - 2729, n=97, senaste 2 åren) | |
| Lenovo Legion Pro 5 16ARX8 | |
| CrossMark / Responsiveness | |
| Schenker Key 17 Pro (Early 23) | |
| Alienware m18 R1 | |
| MSI Titan GT77 HX 13VI | |
| Lenovo Legion Pro 5 16ARX8 | |
| Genomsnitt av klass Gaming (1226 - 2334, n=97, senaste 2 åren) | |
| Asus ROG Zephyrus M16 GU604VY-NM042X | |
| Asus ROG Strix Scar 17 G733PYV-LL053X | |
| Genomsnitt AMD Ryzen 9 7945HX3D, NVIDIA GeForce RTX 4090 Laptop GPU (n=1) | |
| Asus ROG Strix Scar 18 2023 G834JY-N6005W | |
| Asus ROG Strix Scar 17 G733PY-XS96 | |
| PCMark 10 Score | 9117 poäng | |
Hjälp | ||
| AIDA64 / Memory Copy | |
| Alienware m18 R1 | |
| Schenker Key 17 Pro (Early 23) | |
| Lenovo Legion Pro 7 RTX4090 | |
| Genomsnitt av klass Gaming (21750 - 129946, n=109, senaste 2 åren) | |
| Asus ROG Zephyrus M16 GU604VY-NM042X | |
| Asus ROG Strix Scar 18 2023 G834JY-N6005W | |
| MSI Titan GT77 HX 13VI | |
| Asus ROG Strix Scar 17 G733PYV-LL053X | |
| Genomsnitt AMD Ryzen 9 7945HX3D (n=1) | |
| Lenovo Legion Pro 5 16ARX8 | |
| Asus ROG Strix Scar 17 G733PY-XS96 | |
| AIDA64 / Memory Read | |
| Alienware m18 R1 | |
| Lenovo Legion Pro 7 RTX4090 | |
| Schenker Key 17 Pro (Early 23) | |
| Asus ROG Strix Scar 18 2023 G834JY-N6005W | |
| Genomsnitt av klass Gaming (22956 - 118858, n=109, senaste 2 åren) | |
| Asus ROG Zephyrus M16 GU604VY-NM042X | |
| MSI Titan GT77 HX 13VI | |
| Asus ROG Strix Scar 17 G733PYV-LL053X | |
| Genomsnitt AMD Ryzen 9 7945HX3D (n=1) | |
| Asus ROG Strix Scar 17 G733PY-XS96 | |
| Lenovo Legion Pro 5 16ARX8 | |
| AIDA64 / Memory Write | |
| Alienware m18 R1 | |
| Schenker Key 17 Pro (Early 23) | |
| Lenovo Legion Pro 7 RTX4090 | |
| Genomsnitt av klass Gaming (22297 - 135096, n=109, senaste 2 åren) | |
| Asus ROG Zephyrus M16 GU604VY-NM042X | |
| Asus ROG Strix Scar 18 2023 G834JY-N6005W | |
| MSI Titan GT77 HX 13VI | |
| Asus ROG Strix Scar 17 G733PY-XS96 | |
| Asus ROG Strix Scar 17 G733PYV-LL053X | |
| Genomsnitt AMD Ryzen 9 7945HX3D (n=1) | |
| Lenovo Legion Pro 5 16ARX8 | |
| AIDA64 / Memory Latency | |
| Genomsnitt av klass Gaming (75.3 - 259, n=109, senaste 2 åren) | |
| MSI Titan GT77 HX 13VI | |
| Asus ROG Strix Scar 18 2023 G834JY-N6005W | |
| Schenker Key 17 Pro (Early 23) | |
| Asus ROG Strix Scar 17 G733PYV-LL053X | |
| Genomsnitt AMD Ryzen 9 7945HX3D (n=1) | |
| Asus ROG Zephyrus M16 GU604VY-NM042X | |
| Lenovo Legion Pro 5 16ARX8 | |
| Lenovo Legion Pro 7 RTX4090 | |
| Asus ROG Strix Scar 17 G733PY-XS96 | |
| Alienware m18 R1 | |
* ... mindre är bättre
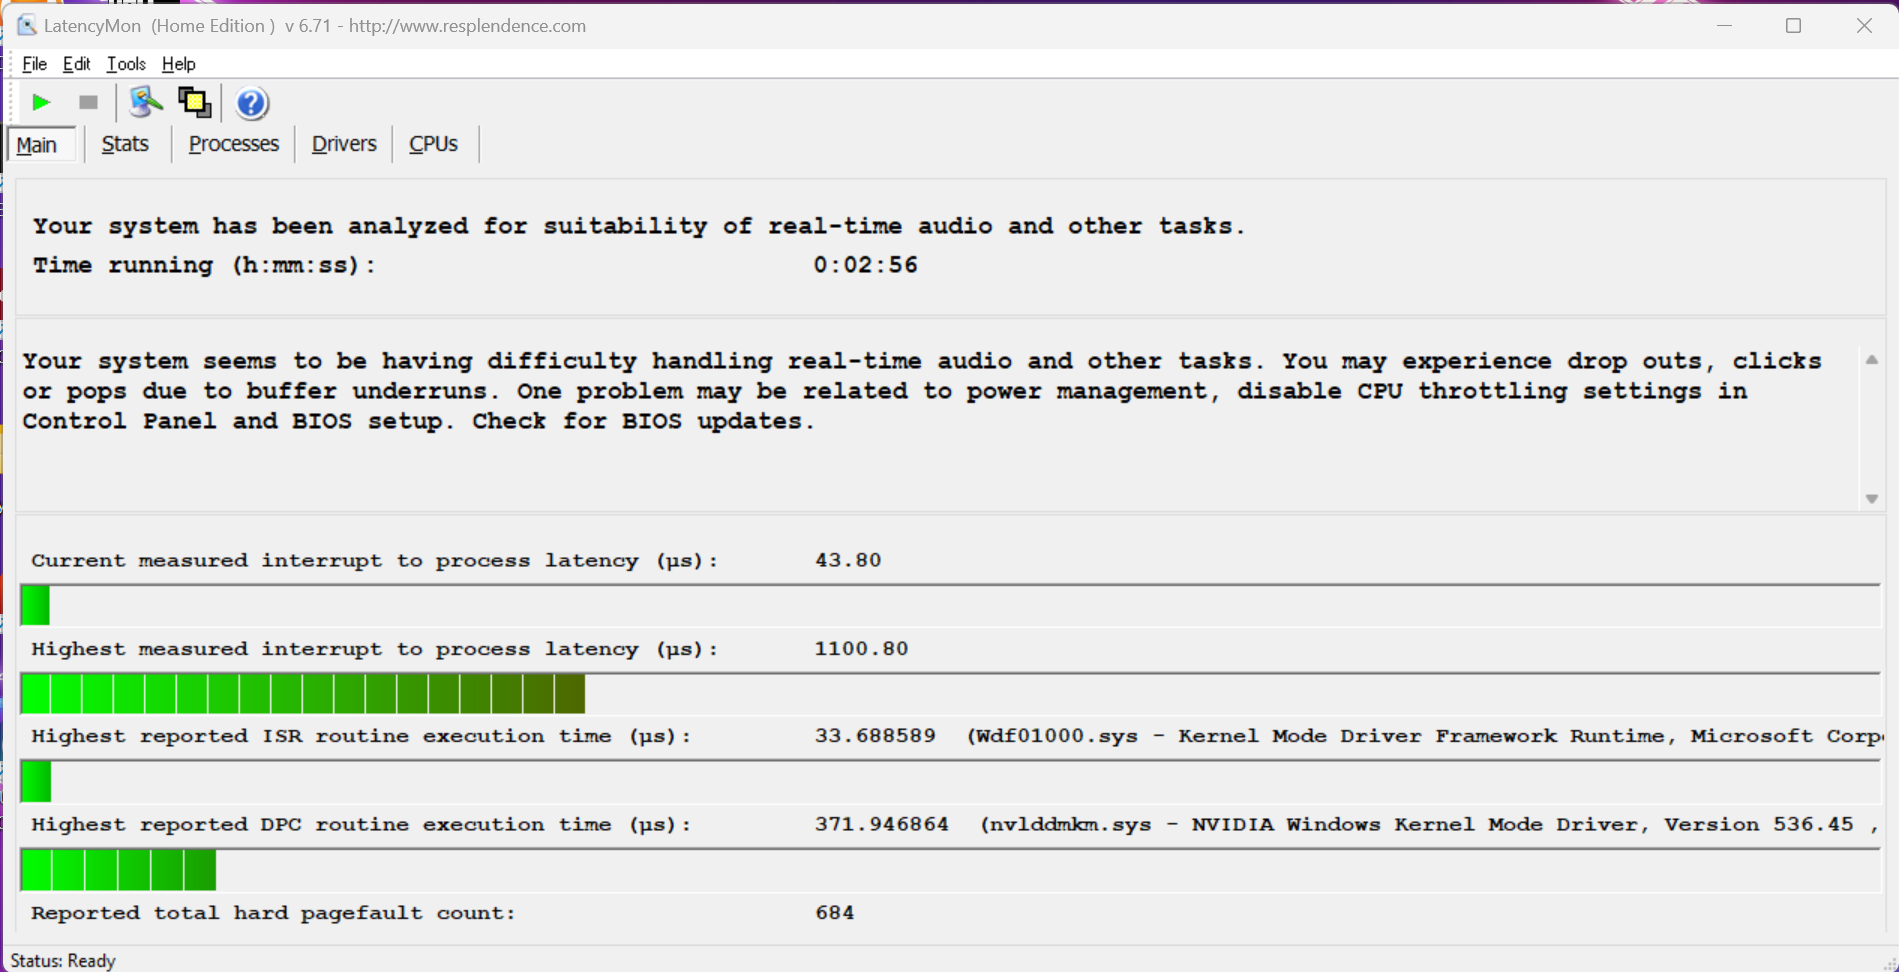
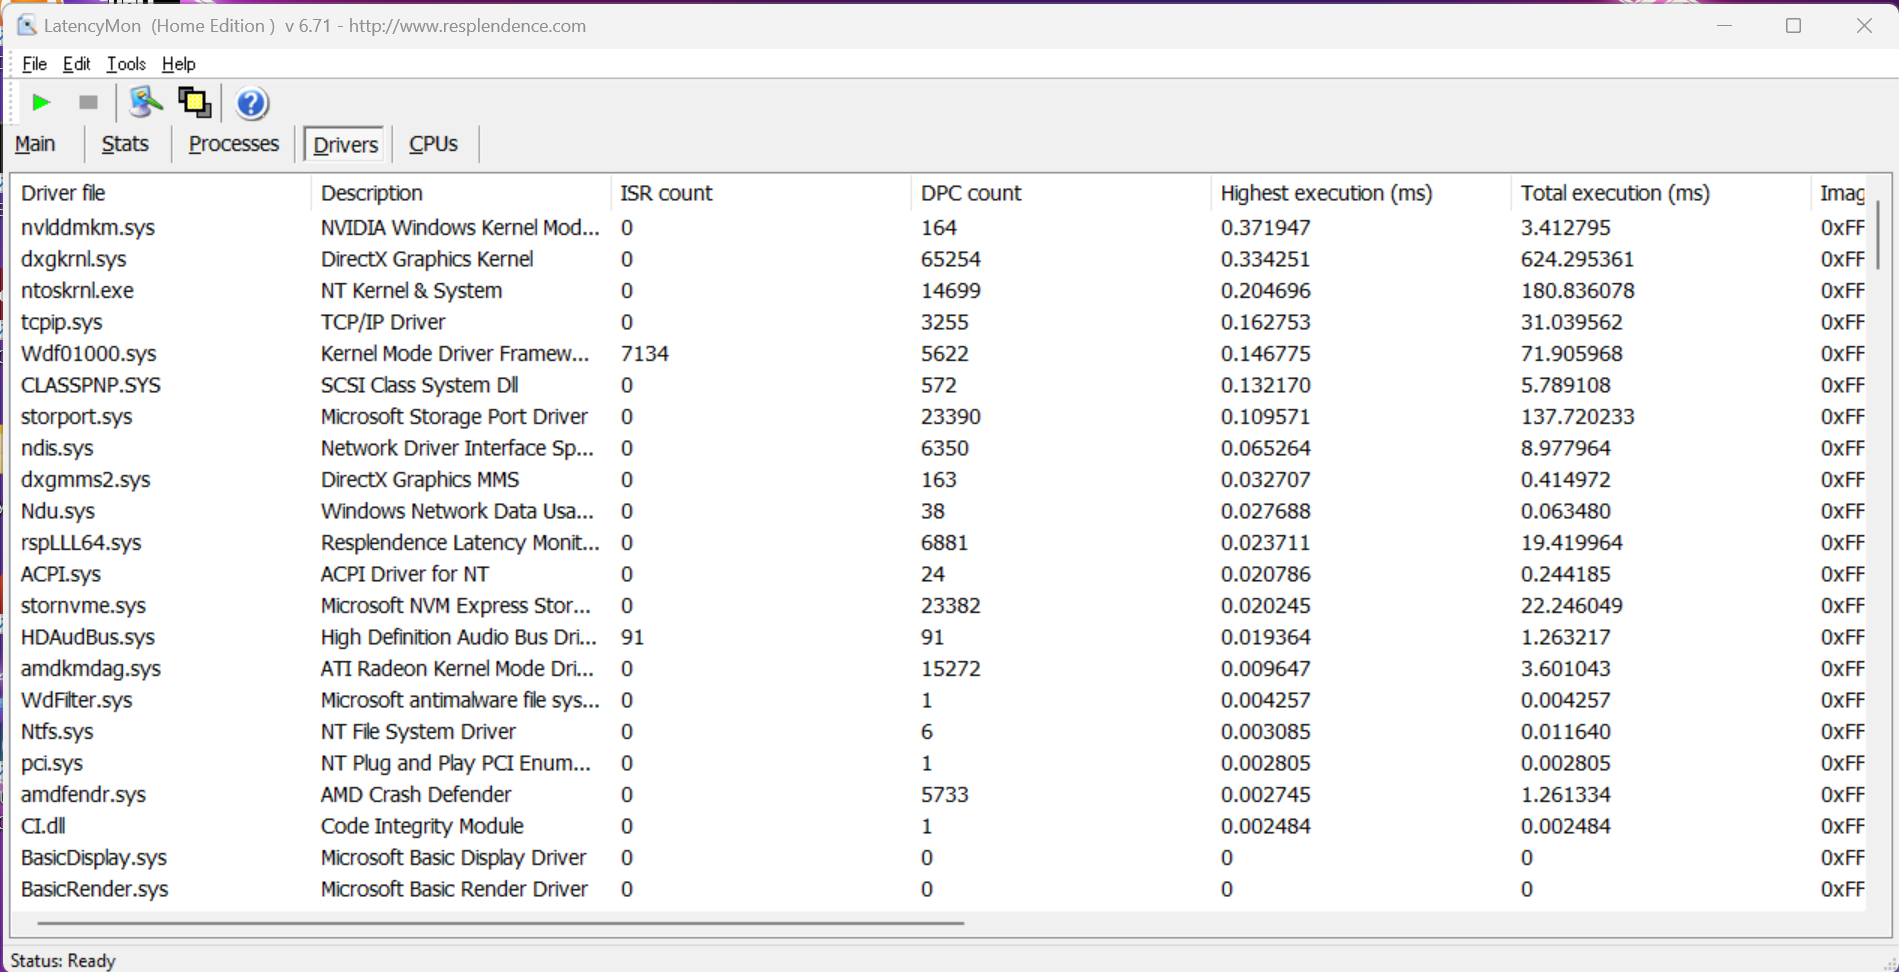
DPC-fördröjning
I vårt standardiserade latens-test (webbsurfning, 4K YouTube-uppspelning, CPU-belastning) visade vår testenhet små begränsningar vid användning av ljudapplikationer i realtid med den aktuella BIOS-versionen.
| DPC Latencies / LatencyMon - interrupt to process latency (max), Web, Youtube, Prime95 | |
| Asus ROG Strix Scar 17 G733PYV-LL053X | |
* ... mindre är bättre
Lagringsenheter
En 1-TB SSD från SK Hynix (PC801) är installerad i ROG Strix SCAR 17 X3D. M.2 2280 SSD är ansluten via det snabba PCIe 4.0-gränssnittet och levererar mycket bra överföringshastigheter. Dessutom förblir dess prestanda stabil även under permanent belastning. Efter den första uppstarten har användarna 868 GB tillgängligt - men tack vare den andra M.2-platsen (även M.2 2280, PCIe 4.0) kan lagringsutrymmet utökas vid behov. Fler SSD-riktmärken listas här.

Reading continuous performance: DiskSpd Read Loop, Queue Depth 8
Grafikkort - GeForce RTX 4090 Laptop
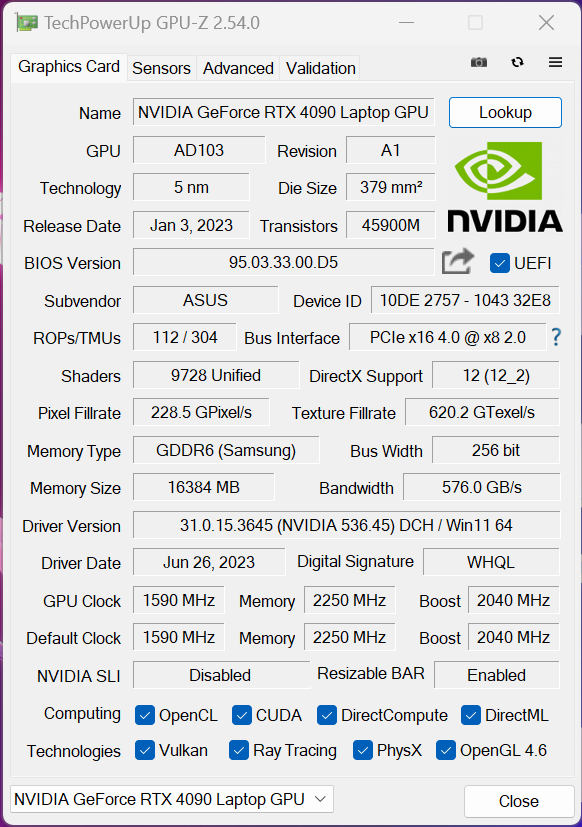
ROG Strix SCAR 17 X3D har stöd för Nvidias Advanced Optimus-teknik. När du utför enkla uppgifter kan processorns integreradeRadeon 610Mgrafikbearbetningen och för mer krävande uppgifter (t.ex. spel) växlar den bärbara datorn automatiskt till den dedikeradeGeForce RTX 4090 bärbar dator. Tack vare en integrerad MUX-omkopplare kan iGPU:n avaktiveras utan att den bärbara datorn behöver startas om helt. Med en maximal strömförbrukning på 175 watt (150 watt TGP + 25 watt Dynamic Boost) är detta en av de snabbaste versionerna av RTX 4090 Laptop.
Det kan ha funnits en eller två skillnader i riktmärkena, men totalt sett fungerar de bärbara datorerna utrustade med RTX 4090 Laptop praktiskt taget likadant. Vid batterianvändning kunde GeForce RTX 4090 Laptop förbruka maximalt 55 watt, vilket var tillräckligt för att säkra en grafikpoäng på 5 590 poäng i vårt Time Spy -test. Detta motsvarar ett underskott på hela 75 %. Ytterligare GPU-benchmarks hittar du här.
| 3DMark 11 Performance | 47621 poäng | |
| 3DMark Fire Strike Score | 41279 poäng | |
| 3DMark Time Spy Score | 19832 poäng | |
| 3DMark Steel Nomad Score | 5139 poäng | |
Hjälp | ||
| Blender / v3.3 Classroom OPTIX/RTX | |
| Lenovo Legion Pro 5 16ARX8 | |
| Genomsnitt av klass Gaming (9 - 32, n=111, senaste 2 åren) | |
| Asus ROG Zephyrus M16 GU604VY-NM042X | |
| Genomsnitt NVIDIA GeForce RTX 4090 Laptop GPU (9 - 19, n=39) | |
| Lenovo Legion Pro 7 RTX4090 | |
| MSI Titan GT77 HX 13VI | |
| Asus ROG Strix Scar 17 G733PY-XS96 | |
| Schenker Key 17 Pro (Early 23) | |
| Asus ROG Strix Scar 17 G733PYV-LL053X | |
| Asus ROG Strix Scar 18 2023 G834JY-N6005W | |
| Blender / v3.3 Classroom CUDA | |
| Lenovo Legion Pro 5 16ARX8 | |
| Genomsnitt av klass Gaming (15 - 228, n=111, senaste 2 åren) | |
| Schenker Key 17 Pro (Early 23) | |
| Genomsnitt NVIDIA GeForce RTX 4090 Laptop GPU (16 - 24, n=39) | |
| Asus ROG Strix Scar 18 2023 G834JY-N6005W | |
| Asus ROG Strix Scar 18 2023 G834JY-N6005W | |
| Asus ROG Zephyrus M16 GU604VY-NM042X | |
| Lenovo Legion Pro 7 RTX4090 | |
| Asus ROG Strix Scar 17 G733PYV-LL053X | |
| MSI Titan GT77 HX 13VI | |
| Alienware m18 R1 | |
| Asus ROG Strix Scar 17 G733PY-XS96 | |
| Blender / v3.3 Classroom CPU | |
| Asus ROG Zephyrus M16 GU604VY-NM042X | |
| Lenovo Legion Pro 5 16ARX8 | |
| Genomsnitt av klass Gaming (122 - 565, n=107, senaste 2 åren) | |
| Schenker Key 17 Pro (Early 23) | |
| Genomsnitt NVIDIA GeForce RTX 4090 Laptop GPU (144 - 305, n=39) | |
| Lenovo Legion Pro 7 RTX4090 | |
| Asus ROG Strix Scar 18 2023 G834JY-N6005W | |
| MSI Titan GT77 HX 13VI | |
| Alienware m18 R1 | |
| Asus ROG Strix Scar 17 G733PYV-LL053X | |
| Asus ROG Strix Scar 17 G733PY-XS96 | |
* ... mindre är bättre
Spelprestanda
Nu är det dags att ta en titt på riktmärkena för spel. Först och främst kommer vi att titta på Full HD-upplösning. Här är den nyaRyzen 9 7945HX3Dtydligt visa sina styrkor i vissa spel och vi noterade ofta tvåsiffriga procentuella fördelar; i Far Cry 5 uppmätte vi till och med en fördel på hela 36 % jämfört med den vanliga Ryzen 9 7945HX samt Intels HX-processorer. Men det fanns inte heller någon fördel i några få spel, till exempel The Witcher 3 eller Call of Duty Modern Warfare 2.
| The Witcher 3 - 1920x1080 Ultra Graphics & Postprocessing (HBAO+) | |
| Alienware m18 R1 | |
| Asus ROG Strix Scar 17 G733PYV-LL053X | |
| Schenker Key 17 Pro (Early 23) | |
| Asus ROG Strix Scar 17 G733PY-XS96 | |
| Lenovo Legion Pro 7 RTX4090 | |
| MSI Titan GT77 HX 13VI | |
| Genomsnitt av klass Gaming (95 - 240, n=8, senaste 2 åren) | |
| Lenovo Legion Pro 5 16ARX8 | |
| Shadow of the Tomb Raider - 1920x1080 Highest Preset AA:T | |
| Asus ROG Strix Scar 17 G733PYV-LL053X | |
| Asus ROG Strix Scar 17 G733PY-XS96 | |
| MSI Titan GT77 HX 13VI | |
| Lenovo Legion Pro 5 16ARX8 | |
| Asus ROG Strix Scar 18 2023 G834JY-N6005W | |
| Genomsnitt av klass Gaming (96 - 116, n=2, senaste 2 åren) | |
| Far Cry 6 - 1920x1080 Ultra Graphics Quality + HD Textures AA:T | |
| Asus ROG Strix Scar 17 G733PYV-LL053X | |
| MSI Titan GT77 HX 13VI | |
| Genomsnitt av klass Gaming (96.3 - 135.7, n=3, senaste 2 åren) | |
| Asus ROG Strix Scar 17 G733PY-XS96 | |
| Lenovo Legion Pro 5 16ARX8 | |
| Call of Duty Modern Warfare 2 2022 - 1920x1080 Extreme Quality Preset AA:T2X Filmic SM | |
| Asus ROG Strix Scar 17 G733PYV-LL053X | |
| Asus ROG Strix Scar 17 G733PY-XS96 | |
| MSI Titan GT77 HX 13VI | |
| Asus ROG Strix Scar 18 2023 G834JY-N6005W | |
| Lenovo Legion Pro 5 16ARX8 | |
| Cyberpunk 2077 1.6 - 1920x1080 Ultra Preset | |
| Asus ROG Strix Scar 17 G733PYV-LL053X | |
| MSI Titan GT77 HX 13VI | |
| Asus ROG Strix Scar 17 G733PY-XS96 | |
| Alienware m18 R1 | |
| Asus ROG Strix Scar 18 2023 G834JY-N6005W | |
| Lenovo Legion Pro 5 16ARX8 | |
I QHD-upplösning visade den nya processorn också sina fördelar, även om skillnaden inte var riktigt lika stor här jämfört med 1080p-inställningarna. Totalt sett kan Ryzen 9 7945HX3D fortfarande erbjuda bättre prestanda än sina konkurrenter - ibland fortfarande tillräckligt för att säkra sig en tvåsiffrig procentuell fördel.
| Shadow of the Tomb Raider - 2560x1440 Highest Preset AA:T | |
| Asus ROG Strix Scar 17 G733PYV-LL053X | |
| Asus ROG Strix Scar 17 G733PY-XS96 | |
| MSI Titan GT77 HX 13VI | |
| Lenovo Legion Pro 7 RTX4090 | |
| Far Cry 5 - 2560x1440 Ultra Preset AA:T | |
| Asus ROG Strix Scar 17 G733PYV-LL053X | |
| MSI Titan GT77 HX 13VI | |
| Asus ROG Strix Scar 17 G733PY-XS96 | |
| Far Cry 6 - 2560x1440 Ultra Graphics Quality + HD Textures AA:T | |
| Asus ROG Strix Scar 17 G733PYV-LL053X | |
| MSI Titan GT77 HX 13VI | |
| Asus ROG Strix Scar 17 G733PY-XS96 | |
| Final Fantasy XV Benchmark - 2560x1440 High Quality | |
| MSI Titan GT77 HX 13VI | |
| Alienware m18 R1 | |
| Schenker Key 17 Pro (Early 23) | |
| Lenovo Legion Pro 7 RTX4090 | |
| Asus ROG Strix Scar 17 G733PYV-LL053X | |
| Asus ROG Strix Scar 17 G733PY-XS96 | |
| GTA V - 2560x1440 Highest AA:4xMSAA + FX AF:16x | |
| Asus ROG Strix Scar 17 G733PYV-LL053X | |
| Alienware m18 R1 | |
| Schenker Key 17 Pro (Early 23) | |
| MSI Titan GT77 HX 13VI | |
| Lenovo Legion Pro 7 RTX4090 | |
| Asus ROG Strix Scar 17 G733PY-XS96 | |
| F1 22 - 2560x1440 Ultra High Preset AA:T AF:16x | |
| Alienware m18 R1 | |
| Asus ROG Strix Scar 17 G733PY-XS96 | |
| Asus ROG Strix Scar 17 G733PYV-LL053X | |
| MSI Titan GT77 HX 13VI | |
| Lenovo Legion Pro 7 RTX4090 | |
| Call of Duty Modern Warfare 2 2022 - 2560x1440 Extreme Quality Preset AA:T2X Filmic SM | |
| Asus ROG Strix Scar 17 G733PYV-LL053X | |
| MSI Titan GT77 HX 13VI | |
| Asus ROG Strix Scar 17 G733PY-XS96 | |
| Lenovo Legion Pro 7 RTX4090 | |
| Cyberpunk 2077 1.6 - 2560x1440 Ultra Preset | |
| Asus ROG Strix Scar 17 G733PYV-LL053X | |
| Asus ROG Strix Scar 17 G733PY-XS96 | |
| Alienware m18 R1 | |
| Lenovo Legion Pro 7 RTX4090 | |
| MSI Titan GT77 HX 13VI | |
I 4K-upplösning har den nya Ryzen 9 7945HX3D inte någon fördel jämfört med den vanliga Ryzen 9 7945HX eller Intels mobila HX-processorer - även om alla modellerna ligger på en jämförbar nivå.
| Shadow of the Tomb Raider - 3840x2160 Highest Preset AA:T | |
| Lenovo Legion Pro 7 RTX4090 | |
| Asus ROG Strix Scar 17 G733PY-XS96 | |
| Asus ROG Strix Scar 17 G733PYV-LL053X | |
| MSI Titan GT77 HX 13VI | |
| Far Cry 5 - 3840x2160 Ultra Preset AA:T | |
| MSI Titan GT77 HX 13VI | |
| Asus ROG Strix Scar 17 G733PYV-LL053X | |
| Asus ROG Strix Scar 17 G733PY-XS96 | |
| Far Cry 6 - 3840x2160 Ultra Graphics Quality + HD Textures AA:T | |
| MSI Titan GT77 HX 13VI | |
| Asus ROG Strix Scar 17 G733PYV-LL053X | |
| Asus ROG Strix Scar 17 G733PY-XS96 | |
| Final Fantasy XV Benchmark - 3840x2160 High Quality | |
| MSI Titan GT77 HX 13VI | |
| Asus ROG Strix Scar 17 G733PY-XS96 | |
| Alienware m18 R1 | |
| Schenker Key 17 Pro (Early 23) | |
| Lenovo Legion Pro 7 RTX4090 | |
| Asus ROG Strix Scar 17 G733PYV-LL053X | |
| GTA V - 3840x2160 High/On (Advanced Graphics Off) AA:FX AF:8x | |
| Asus ROG Strix Scar 17 G733PYV-LL053X | |
| Alienware m18 R1 | |
| MSI Titan GT77 HX 13VI | |
| Lenovo Legion Pro 7 RTX4090 | |
| Asus ROG Strix Scar 17 G733PY-XS96 | |
| Schenker Key 17 Pro (Early 23) | |
| F1 22 - 3840x2160 Ultra High Preset AA:T AF:16x | |
| Lenovo Legion Pro 7 RTX4090 | |
| Asus ROG Strix Scar 17 G733PY-XS96 | |
| Alienware m18 R1 | |
| Asus ROG Strix Scar 17 G733PYV-LL053X | |
| MSI Titan GT77 HX 13VI | |
| Call of Duty Modern Warfare 2 2022 - 3840x2160 Extreme Quality Preset AA:T2X Filmic SM | |
| MSI Titan GT77 HX 13VI | |
| Asus ROG Strix Scar 17 G733PYV-LL053X | |
| Asus ROG Strix Scar 17 G733PY-XS96 | |
| Lenovo Legion Pro 7 RTX4090 | |
| Cyberpunk 2077 1.6 - 3840x2160 Ultra Preset | |
| MSI Titan GT77 HX 13VI | |
| Asus ROG Strix Scar 17 G733PYV-LL053X | |
| Lenovo Legion Pro 7 RTX4090 | |
| Alienware m18 R1 | |
| Asus ROG Strix Scar 17 G733PY-XS96 | |
| låg | med. | hög | ultra | QHD DLSS | QHD | 4K DLSS | 4K | |
|---|---|---|---|---|---|---|---|---|
| GTA V (2015) | 187.1 | 167.7 | 160.6 | 182.7 | ||||
| The Witcher 3 (2015) | 414 | 207 | 163 | 155 | ||||
| Dota 2 Reborn (2015) | 288 | 255 | 244 | 220 | 205 | |||
| Final Fantasy XV Benchmark (2018) | 229 | 180 | 151.2 | 85 | ||||
| X-Plane 11.11 (2018) | 196.3 | 190.3 | 166.2 | 139.5 | ||||
| Far Cry 5 (2018) | 248 | 232 | 218 | 194 | 110 | |||
| Strange Brigade (2018) | 460 | 420 | 318 | 161 | ||||
| Shadow of the Tomb Raider (2018) | 293 | 271 | 199 | 104 | ||||
| Assassin´s Creed Valhalla (2020) | 195 | 178 | 138 | 80 | ||||
| F1 2021 (2021) | 685 | 616 | 470 | 271 | 204 | 115.1 | ||
| Far Cry 6 (2021) | 182 | 167 | 146 | 88 | ||||
| Cyberpunk 2077 1.6 (2022) | 205 | 157 | 116 | 51 | ||||
| F1 22 (2022) | 281 | 135.9 | 91.8 | 45 | ||||
| Call of Duty Modern Warfare 2 2022 (2022) | 190 | 182 | 136 | 83 | ||||
| Star Wars Jedi Survivor (2023) | 106 | 103 | 71 | 39 | ||||
| F1 23 (2023) | 374 | 132 | 85.1 | 73.5 | 42.2 | |||
| Baldur's Gate 3 (2023) | 178.8 | 133.3 | 114 | 74.6 | ||||
| Cyberpunk 2077 (2023) | 158 | 99.5 | 44.2 | |||||
| Alan Wake 2 (2023) | 116.1 | 82 | 43.4 | |||||
| F1 24 (2024) | 144.9 | 150.4 | 96.8 | 83.2 | 48.4 | |||
| Call of Duty Black Ops 6 (2024) | 150 | 129 | 119 | 78 | 76 | |||
| Indiana Jones and the Great Circle (2024) | 128.4 | 117.9 | 100.5 | 60.6 | ||||
| Monster Hunter Wilds (2025) | 85.6 | 81.7 | 69.4 | 58.5 | 42.8 | |||
| Assassin's Creed Shadows (2025) | 55 | 56 | 47 | 46 | 34 |
Utsläpp - SCAR 17 har ett irriterande spolgnissel
Utsläpp av buller
Naturligtvis måste du förvänta dig att kunna höra fläktarna på en så kraftfull enhet som denna - men ändå har den bärbara datorn ett tyst läge som helt avaktiverar fläktarna vid daglig användning. Detta är verkligen praktiskt om du surfar på webben, skriver e-post eller tittar på videor. Gaming är inte möjligt i det här läget och i det här fallet noterade vi relativt anständiga bullervärden på cirka 41 dB(A). Vi noterade dock tyvärr några riktigt irriterande vinande ljud under våra speltester (och aldrig under någon annan användning). Fläktarna är betydligt högre i Performance- och Turbo-läge (~48 dB(A) & 54 dB(A)), vilket till och med överröstar spolens vinande. Vi rekommenderar ändå att du använder hörlurar i något av dessa lägen. I följande tabell visas fläktens bulleremissioner i olika tillämpningar och energiprofiler.
| Scenario | Tyst | Prestanda | Turbo |
|---|---|---|---|
| 3DMark 06 | 30 dB(A) | 35,5 dB(A) | 53,4 dB(A) |
| The Witcher 3 (Ultra-inställningar) | 40,9 dB(A) | 48,5 dB(A) | 53,4 dB(A) |
| Cyberpunk 2077 (Ultra-inställningar) | 40,9 dB(A) | 48,5 dB(A) | 53,4 dB(A) |
| Stresstest | 40,9 dB(A) | 48,5 dB(A) | 53,4 dB(A) |
Ljudnivå
| Låg belastning |
| 23 / 27.7 / 34.7 dB(A) |
| Hög belastning |
| 53.4 / 53.4 dB(A) |
 | ||
30 dB tyst 40 dB(A) hörbar 50 dB(A) högt ljud |
||
min: | ||
| Asus ROG Strix Scar 17 G733PYV-LL053X GeForce RTX 4090 Laptop GPU, R9 7945HX3D, SK hynix PC801 HFS001TEJ9X101N | Asus ROG Strix Scar 17 G733PY-XS96 GeForce RTX 4090 Laptop GPU, R9 7945HX, SK hynix PC801 HFS001TEJ9X101N | Alienware m18 R1 GeForce RTX 4090 Laptop GPU, i9-13980HX, SK hynix PC801 HFS001TEJ9X101N | Asus ROG Strix Scar 18 2023 G834JY-N6005W GeForce RTX 4090 Laptop GPU, i9-13980HX, 2x Samsung PM9A1 MZVL21T0HCLR (RAID 0) | MSI Titan GT77 HX 13VI GeForce RTX 4090 Laptop GPU, i9-13950HX, Samsung PM9A1 MZVL22T0HBLB | Schenker Key 17 Pro (Early 23) GeForce RTX 4090 Laptop GPU, i9-13900HX, Samsung 990 Pro 2 TB MZVL72T0HDLB | |
|---|---|---|---|---|---|---|
| Noise | 9% | 12% | 2% | -5% | -17% | |
| av / miljö * (dB) | 23 | 22.7 1% | 22.8 1% | 23.9 -4% | 24.6 -7% | 26 -13% |
| Idle Minimum * (dB) | 23 | 23.5 -2% | 23 -0% | 23.9 -4% | 29.2 -27% | 26 -13% |
| Idle Average * (dB) | 27.7 | 27.7 -0% | 23 17% | 32.6 -18% | 29.2 -5% | 33 -19% |
| Idle Maximum * (dB) | 34.7 | 27.7 20% | 23 34% | 32.6 6% | 29.2 16% | 46 -33% |
| Load Average * (dB) | 53.4 | 30.5 43% | 35.6 33% | 35.9 33% | 50.7 5% | 56 -5% |
| Witcher 3 ultra * (dB) | 53.4 | 51.4 4% | 51.3 4% | 53.3 -0% | 62 -16% | |
| Load Maximum * (dB) | 53.4 | 54.1 -1% | 56.7 -6% | 55.8 -4% | 61 -14% | 64 -20% |
* ... mindre är bättre
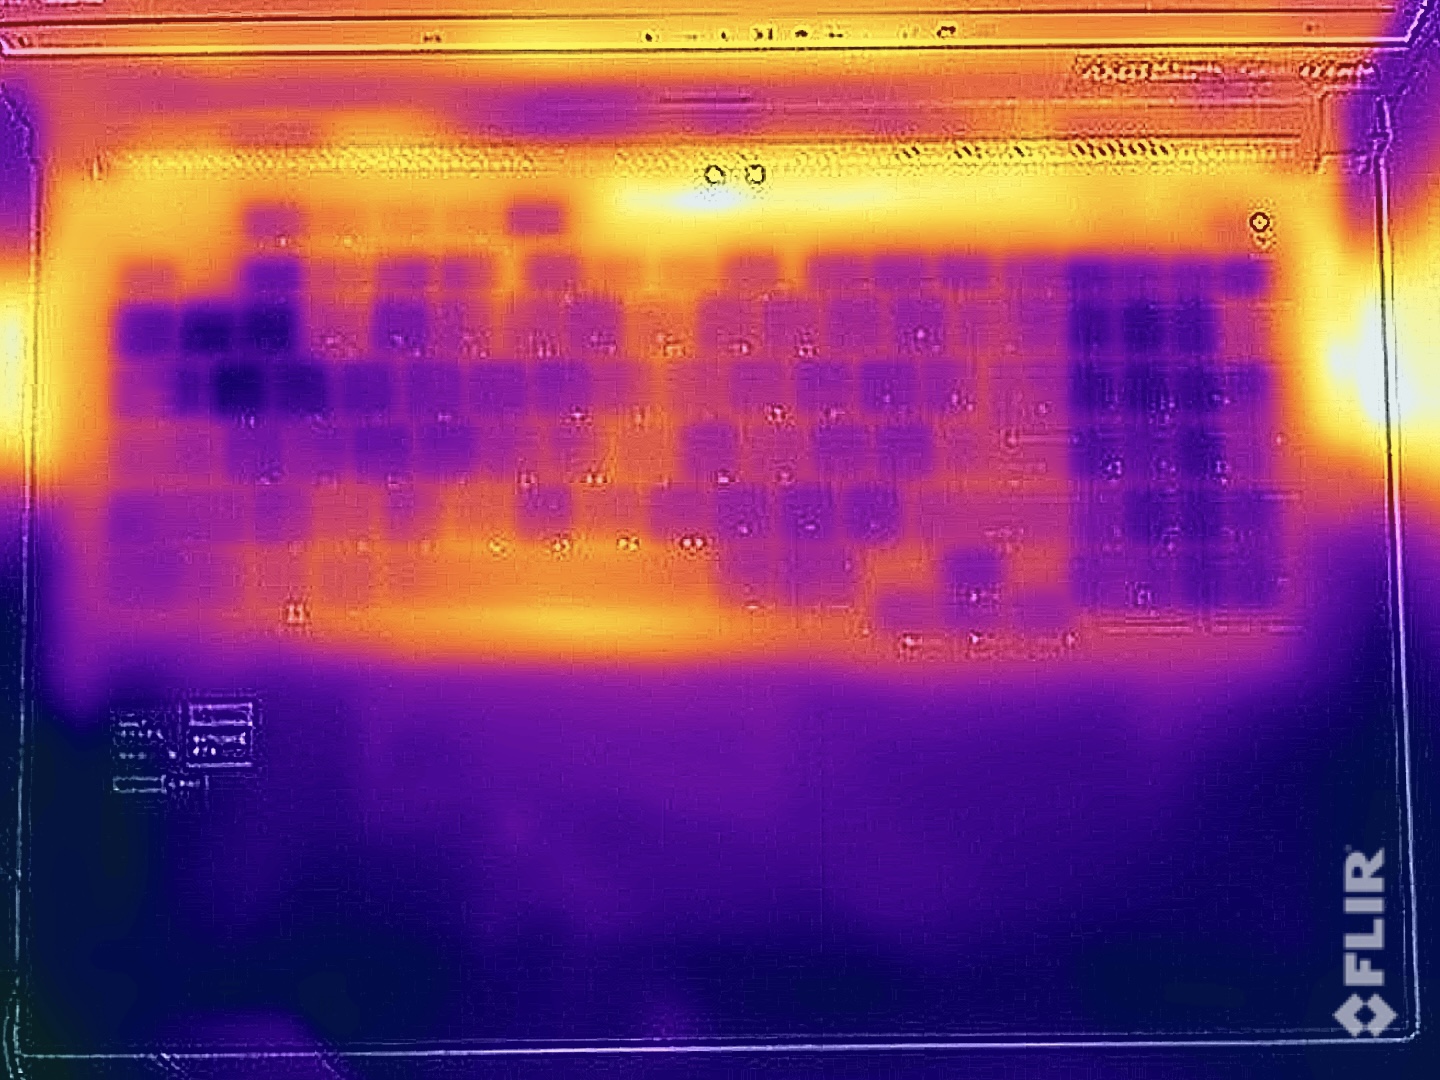
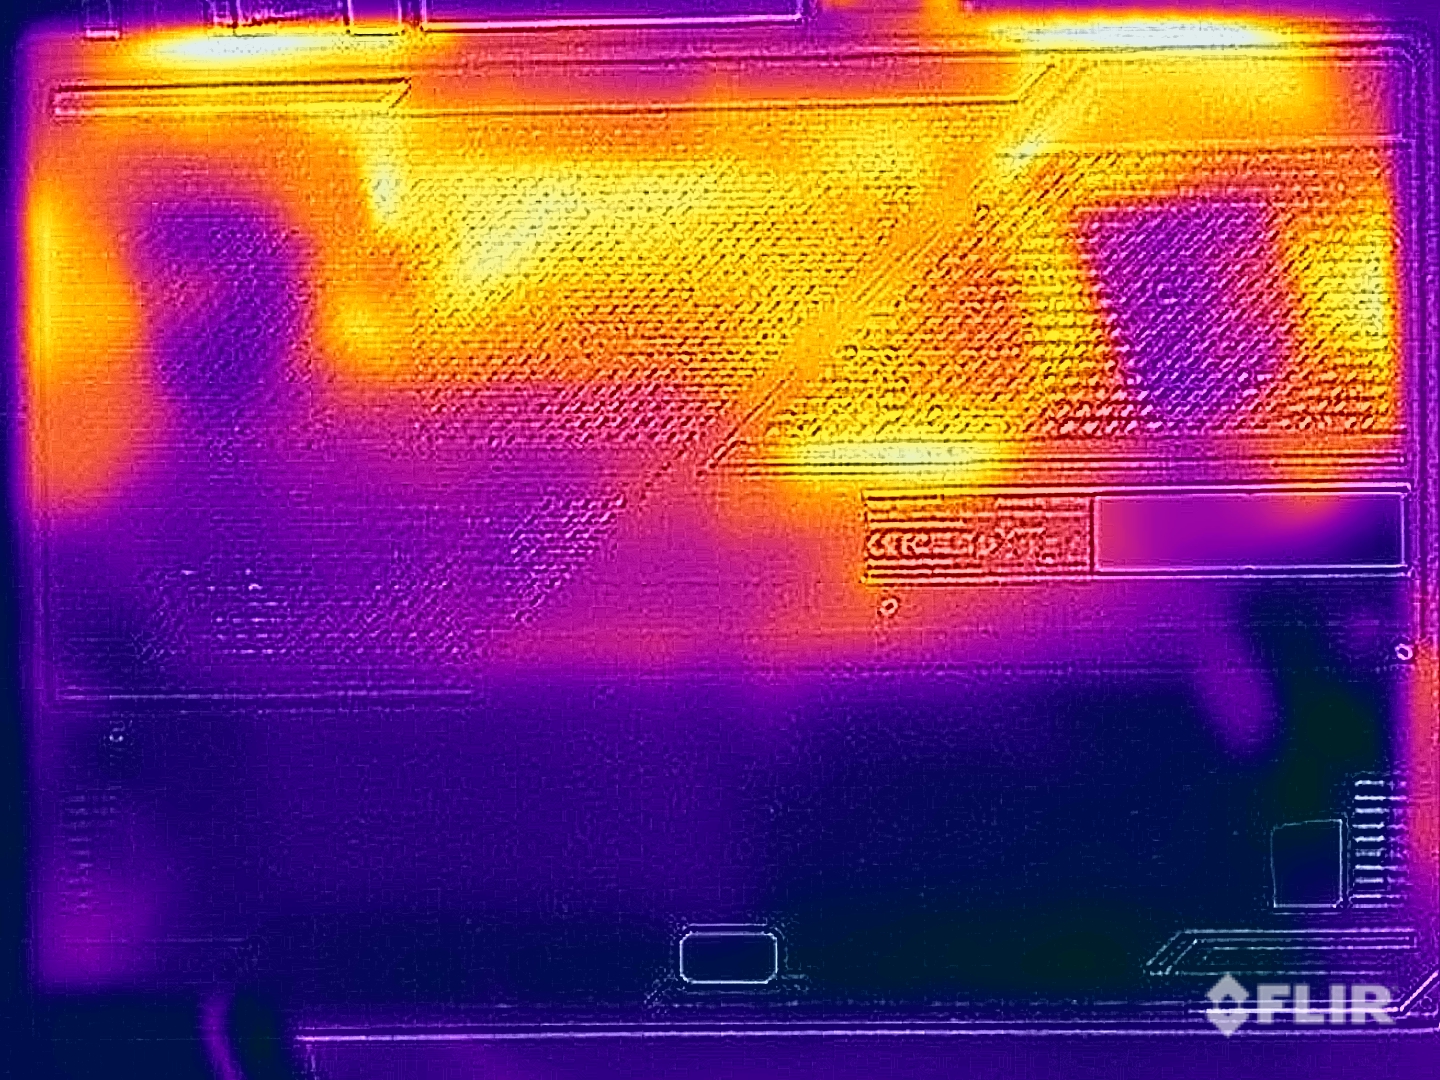
Temperatur
Även under belastning visade sig datorns yttemperaturer vara helt okej - du kan enkelt fortfarande placera SCAR 17 på dina lår medan du spelar utan några klagomål (även om du förmodligen inte kommer att vilja göra det på grund av dess storlek). Under stresstestet gynnades GPU:n, vilket redan var tydligt när man tittade på TDP/TGP-konfigurationerna. I början av testet förbrukade processorn 85 watt och GPU hade en förbrukning på 120 watt - efter några minuter balanserade processorn ut på 50 watt och grafikkortet förbrukade 175 watt.
(±) Den maximala temperaturen på ovansidan är 40.1 °C / 104 F, jämfört med genomsnittet av 40.4 °C / 105 F , allt från 21.2 till 68.8 °C för klassen Gaming.
(-) Botten värms upp till maximalt 46.7 °C / 116 F, jämfört med genomsnittet av 43.2 °C / 110 F
(+) Vid tomgångsbruk är medeltemperaturen för ovansidan 25.8 °C / 78 F, jämfört med enhetsgenomsnittet på 33.9 °C / ### class_avg_f### F.
(±) När du spelar The Witcher 3 är medeltemperaturen för ovansidan 33.3 °C / 92 F, jämfört med enhetsgenomsnittet på 33.9 °C / ## #class_avg_f### F.
(+) Handledsstöden och pekplattan är kallare än hudtemperaturen med maximalt 25.6 °C / 78.1 F och är därför svala att ta på.
(+) Medeltemperaturen för handledsstödsområdet på liknande enheter var 28.8 °C / 83.8 F (+3.2 °C / 5.7 F).
| Asus ROG Strix Scar 17 G733PYV-LL053X AMD Ryzen 9 7945HX3D, NVIDIA GeForce RTX 4090 Laptop GPU | Asus ROG Strix Scar 17 G733PY-XS96 AMD Ryzen 9 7945HX, NVIDIA GeForce RTX 4090 Laptop GPU | Alienware m18 R1 Intel Core i9-13980HX, NVIDIA GeForce RTX 4090 Laptop GPU | Asus ROG Strix Scar 18 2023 G834JY-N6005W Intel Core i9-13980HX, NVIDIA GeForce RTX 4090 Laptop GPU | MSI Titan GT77 HX 13VI Intel Core i9-13950HX, NVIDIA GeForce RTX 4090 Laptop GPU | Schenker Key 17 Pro (Early 23) Intel Core i9-13900HX, NVIDIA GeForce RTX 4090 Laptop GPU | |
|---|---|---|---|---|---|---|
| Heat | 7% | 4% | -15% | 1% | -29% | |
| Maximum Upper Side * (°C) | 40.1 | 34.6 14% | 39 3% | 54 -35% | 40.6 -1% | 57 -42% |
| Maximum Bottom * (°C) | 46.7 | 35.6 24% | 36.4 22% | 46 1% | 41.1 12% | 60 -28% |
| Idle Upper Side * (°C) | 26.5 | 27.2 -3% | 29.2 -10% | 30 -13% | 26.2 1% | 32 -21% |
| Idle Bottom * (°C) | 27.7 | 30 -8% | 27.8 -0% | 31 -12% | 30.3 -9% | 34 -23% |
* ... mindre är bättre
Strömhantering - En gaminglaptop med liten uthållighet
Strömförbrukning
Föga förvånande drar SCAR 17 X3D en hel del ström och under början av stresstestet uppmätte vi cirka 328 watt. Efter en kort stund utjämnades detta till 300 watt - medan spelet förbrukade det mellan 260 - 300 watt. Som ett resultat är den medföljande strömanslutningen tillräckligt stor.
| Av/Standby | |
| Låg belastning | |
| Hög belastning |
|
Förklaring:
min: | |
| Asus ROG Strix Scar 17 G733PYV-LL053X R9 7945HX3D, GeForce RTX 4090 Laptop GPU, SK hynix PC801 HFS001TEJ9X101N, IPS, 2560x1440, 17.3" | Asus ROG Strix Scar 17 G733PY-XS96 R9 7945HX, GeForce RTX 4090 Laptop GPU, SK hynix PC801 HFS001TEJ9X101N, IPS, 2560x1440, 17.3" | Alienware m18 R1 i9-13980HX, GeForce RTX 4090 Laptop GPU, SK hynix PC801 HFS001TEJ9X101N, IPS, 1920x1200, 18" | Asus ROG Strix Scar 18 2023 G834JY-N6005W i9-13980HX, GeForce RTX 4090 Laptop GPU, 2x Samsung PM9A1 MZVL21T0HCLR (RAID 0), IPS, 2560x1600, 18" | MSI Titan GT77 HX 13VI i9-13950HX, GeForce RTX 4090 Laptop GPU, Samsung PM9A1 MZVL22T0HBLB, Mini-LED, 3840x2160, 17.3" | Schenker Key 17 Pro (Early 23) i9-13900HX, GeForce RTX 4090 Laptop GPU, Samsung 990 Pro 2 TB MZVL72T0HDLB, IPS, 3840x2160, 17.3" | Genomsnitt NVIDIA GeForce RTX 4090 Laptop GPU | Genomsnitt av klass Gaming | |
|---|---|---|---|---|---|---|---|---|
| Power Consumption | -13% | -46% | -32% | -6% | -10% | -15% | 9% | |
| Idle Minimum * (Watt) | 15.4 | 14.5 6% | 21.6 -40% | 17.3 -12% | 14 9% | 18 -17% | 16.2 ? -5% | 13.2 ? 14% |
| Idle Average * (Watt) | 21.6 | 21.1 2% | 25.2 -17% | 27 -25% | 21.6 -0% | 20 7% | 23.1 ? -7% | 18.9 ? 13% |
| Idle Maximum * (Watt) | 22.2 | 42.8 -93% | 56.7 -155% | 46 -107% | 24.8 -12% | 25 -13% | 34.2 ? -54% | 24.3 ? -9% |
| Load Average * (Watt) | 116.7 | 116.7 -0% | 164.1 -41% | 133 -14% | 122.5 -5% | 136 -17% | 130.5 ? -12% | 108 ? 7% |
| Witcher 3 ultra * (Watt) | 262 | 278 -6% | 311 -19% | 265 -1% | 292 -11% | |||
| Cyberpunk 2077 ultra external monitor * (Watt) | 272 | |||||||
| Load Maximum * (Watt) | 327.1 | 279.6 15% | 338.9 -4% | 329 -1% | 418 -28% | 358 -9% | 324 ? 1% | 254 ? 22% |
* ... mindre är bättre
Power consumption Witcher 3 / stress test
Power consumption with external monitor
Körtider
Batteriet på 90 Wh matchade sin tomgångsförbrukning och tillät körtider på mellan 4 och 5 timmar i 60 Hz WLAN- och videotesterna (beroende på ljusstyrka). Detta är inte särskilt mycket och vissa rivaler erbjuder mer uthållighet. Även jämfört med dess föregångarehar den bärbara datorns uthållighet åtminstone förbättrats lite.
| Asus ROG Strix Scar 17 G733PYV-LL053X R9 7945HX3D, GeForce RTX 4090 Laptop GPU, 90 Wh | Asus ROG Strix Scar 17 G733PY-XS96 R9 7945HX, GeForce RTX 4090 Laptop GPU, 90 Wh | Alienware m18 R1 i9-13980HX, GeForce RTX 4090 Laptop GPU, 97 Wh | Asus ROG Strix Scar 18 2023 G834JY-N6005W i9-13980HX, GeForce RTX 4090 Laptop GPU, 90 Wh | MSI Titan GT77 HX 13VI i9-13950HX, GeForce RTX 4090 Laptop GPU, 99.9 Wh | Schenker Key 17 Pro (Early 23) i9-13900HX, GeForce RTX 4090 Laptop GPU, 99 Wh | Genomsnitt av klass Gaming | |
|---|---|---|---|---|---|---|---|
| Batteridrifttid | -15% | -16% | 29% | 29% | 44% | 58% | |
| H.264 (h) | 5 | 7 40% | 6 20% | 8.26 ? 65% | |||
| WiFi v1.3 (h) | 4.8 | 4.1 -15% | 4.3 -10% | 7.1 48% | 5.3 10% | 6.9 44% | 7.02 ? 46% |
| Load (h) | 0.9 | 0.7 -22% | 0.9 0% | 1.4 56% | 1.47 ? 63% | ||
| Witcher 3 ultra (h) | 0.9 |
För
Emot
Dom - ROG Strix SCAR 17 X3D är nu ännu snabbare
Tack vare den nyaAMD Ryzen 9 9745HX3Där ROG Strix SCAR 17 X3D från Asus nu ännu snabbare, vilket gör den till en av de snabbaste bärbara speldatorerna som finns. Den nya processorn kan, tack vare sin extra 3D V-Cache, visa upp tvåsiffriga procentuella prestandaökningar - i synnerhet vid spel i 1080p. I högre QHD-upplösningar är fördelarna inte lika stora och i 4K är det verkligen ingen större skillnad jämfört med den vanliga Ryzen 9 7945HX.
Eftersom den nya Ryzen 9 7945HX3D inte är kompatibel med flytande metall är dess maximala CPU-prestanda för flera kärnor faktiskt lite sämre än den vanliga Ryzen 9 7945HX som ett direkt resultat av dess svagare kylning. I slutändan är deras prestanda jämförbara vid daglig användning, och chipen fortsätter att vara mycket mer effektiva än Intels HX-processorer.
Tack vare AMD Ryzen 9 7945HX3D är den nya ROG Strix SCAR 17 3DX ännu snabbare när det kommer till spel i Full HD/QHD-upplösning. Som ett resultat marknadsförs den som den för närvarande snabbaste bärbara speldatorn på marknaden.
Dess välkända brister kvarstår på denna modell, för även om dess prestanda är bra, känns den bärbara datorns design med sin 16:9-panel lite föråldrad vid denna tidpunkt. Dessutom skulle vi gärna ha sett en mer reserverad version av ProArt som du också kan använda diskret som en arbetsstation. Dess normalt praktiska tysta läge kan knappt användas under spel, eftersom du konsekvent hör ett irriterande spolande ljud och vi skulle definitivt rekommendera att du använder hörlurar för någon annan energiprofil. Spolens gnisslande ljud och den högljudda kylenheten står också i vägen för att denna bärbara dator ska få ett bättre betyg.
Pris och tillgänglighet
Den nya Asus ROG Strix SCAR 17 X3D är tillgänglig från den 22 augusti. Så snart vi har officiell prisinformation kommer vi att uppdatera den här artikeln.
Asus ROG Strix Scar 17 G733PYV-LL053X
- 08/22/2023 v7 (old)
Andreas Osthoff
Genomskinlighet
Valet av enheter som ska granskas görs av vår redaktion. Testprovet gavs till författaren som ett lån av tillverkaren eller återförsäljaren för denna recension. Långivaren hade inget inflytande på denna recension och inte heller fick tillverkaren en kopia av denna recension innan publiceringen. Det fanns ingen skyldighet att publicera denna recension. Som ett oberoende medieföretag är Notebookcheck inte föremål för auktoritet från tillverkare, återförsäljare eller förlag.
This is how Notebookcheck is testingEvery year, Notebookcheck independently reviews hundreds of laptops and smartphones using standardized procedures to ensure that all results are comparable. We have continuously developed our test methods for around 20 years and set industry standards in the process. In our test labs, high-quality measuring equipment is utilized by experienced technicians and editors. These tests involve a multi-stage validation process. Our complex rating system is based on hundreds of well-founded measurements and benchmarks, which maintains objectivity.
Price comparison

