Test: HP Pavilion Gaming 17 - Äntligen en tyst spellaptop
| SD Card Reader | |
| average JPG Copy Test (av. of 3 runs) | |
| Dell XPS 15 9570 Core i9 UHD (Toshiba Exceria Pro SDXC 64 GB UHS-II) | |
| HP Omen 17t-3AW55AV_1 (Toshiba Exceria Pro SDXC 64 GB UHS-II) | |
| HP Pavilion Gaming 17-cd0085cl (Toshiba Exceria Pro SDXC 64 GB UHS-II) | |
| MSI GP75 Leopard 9SD (Toshiba Exceria Pro SDXC 64 GB UHS-II) | |
| maximum AS SSD Seq Read Test (1GB) | |
| Dell XPS 15 9570 Core i9 UHD (Toshiba Exceria Pro SDXC 64 GB UHS-II) | |
| HP Omen 17t-3AW55AV_1 (Toshiba Exceria Pro SDXC 64 GB UHS-II) | |
| HP Pavilion Gaming 17-cd0085cl (Toshiba Exceria Pro SDXC 64 GB UHS-II) | |
| MSI GP75 Leopard 9SD (Toshiba Exceria Pro SDXC 64 GB UHS-II) | |
| |||||||||||||||||||||||||
Distribution av ljusstyrkan: 86 %
Mitt på batteriet: 299.6 cd/m²
Kontrast: 908:1 (Svärta: 0.33 cd/m²)
ΔE ColorChecker Calman: 3.68 | ∀{0.5-29.43 Ø4.73}
calibrated: 3.15
ΔE Greyscale Calman: 3.8 | ∀{0.09-98 Ø4.97}
89.8% sRGB (Argyll 1.6.3 3D)
58.1% AdobeRGB 1998 (Argyll 1.6.3 3D)
64.3% AdobeRGB 1998 (Argyll 3D)
90.2% sRGB (Argyll 3D)
63.3% Display P3 (Argyll 3D)
Gamma: 2.12
CCT: 7240 K
| HP Pavilion Gaming 17-cd0085cl BOE0825, IPS, 17.3", 1920x1080 | Lenovo Legion Y740-17ICH AU Optronics B173HAN03.2, IPS, 17.3", 1920x1080 | HP Omen 17t-3AW55AV_1 AU Optronics AUO309D, IPS, 17.3", 1920x1080 | Asus TUF FX705DT-AU068T AU Optronics B173HAN04.2, IPS, 17.3", 1920x1080 | MSI GP75 Leopard 9SD Chi Mei N173HCE-G33 (CMN175C), IPS, 17.3", 1920x1080 | Razer Blade Pro 17 RTX 2080 Max-Q AU Optronics B173HAN04.0, IPS, 17.3", 1920x1080 | |
|---|---|---|---|---|---|---|
| Display | 1% | 2% | -1% | 2% | -3% | |
| Display P3 Coverage (%) | 63.3 | 64 1% | 65.4 3% | 62.3 -2% | 63.4 0% | 60.6 -4% |
| sRGB Coverage (%) | 90.2 | 90.4 0% | 90 0% | 89.1 -1% | 94.9 5% | 89 -1% |
| AdobeRGB 1998 Coverage (%) | 64.3 | 64.8 1% | 65.8 2% | 63.7 -1% | 65.1 1% | 62.1 -3% |
| Response Times | 43% | 47% | -42% | 65% | 65% | |
| Response Time Grey 50% / Grey 80% * (ms) | 31.6 ? | 15.6 ? 51% | 17.6 ? 44% | 41 ? -30% | 8 ? 75% | 6.8 ? 78% |
| Response Time Black / White * (ms) | 19.6 ? | 12.8 ? 35% | 10 ? 49% | 30 ? -53% | 8.8 ? 55% | 9.6 ? 51% |
| PWM Frequency (Hz) | 25510 ? | |||||
| Screen | -11% | 5% | 8% | 22% | 11% | |
| Brightness middle (cd/m²) | 299.6 | 299.1 0% | 343.6 15% | 316 5% | 420 40% | 299.3 0% |
| Brightness (cd/m²) | 285 | 273 -4% | 320 12% | 294 3% | 393 38% | 294 3% |
| Brightness Distribution (%) | 86 | 81 -6% | 87 1% | 84 -2% | 91 6% | 94 9% |
| Black Level * (cd/m²) | 0.33 | 0.27 18% | 0.34 -3% | 0.32 3% | 0.32 3% | 0.29 12% |
| Contrast (:1) | 908 | 1108 22% | 1011 11% | 988 9% | 1313 45% | 1032 14% |
| Colorchecker dE 2000 * | 3.68 | 5.07 -38% | 3.74 -2% | 3.39 8% | 3.04 17% | 2.55 31% |
| Colorchecker dE 2000 max. * | 8.05 | 10.55 -31% | 5.33 34% | 5.56 31% | 7.22 10% | 4.73 41% |
| Colorchecker dE 2000 calibrated * | 3.15 | 3.31 -5% | 3.49 -11% | 2.14 32% | 0.89 72% | 2.9 8% |
| Greyscale dE 2000 * | 3.8 | 6.8 -79% | 3.7 3% | 3.17 17% | 3.91 -3% | 3.5 8% |
| Gamma | 2.12 104% | 2.46 89% | 2.36 93% | 2.39 92% | 2.26 97% | 2.28 96% |
| CCT | 7240 90% | 7805 83% | 6388 102% | 7098 92% | 7138 91% | 7101 92% |
| Color Space (Percent of AdobeRGB 1998) (%) | 58.1 | 58.5 1% | 58 0% | 51 -12% | 60 3% | 57 -2% |
| Color Space (Percent of sRGB) (%) | 89.8 | 89.9 0% | 90 0% | 89 -1% | 95 6% | 88.7 -1% |
| Totalt genomsnitt (program/inställningar) | 11% /
-2% | 18% /
10% | -12% /
0% | 30% /
23% | 24% /
15% |
* ... mindre är bättre
Visa svarstider
| ↔ Svarstid svart till vitt | ||
|---|---|---|
| 19.6 ms ... stiga ↗ och falla ↘ kombinerat | ↗ 10.8 ms stiga | 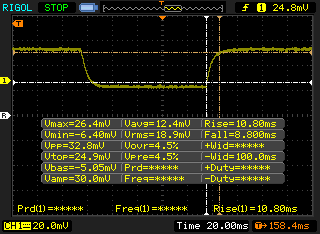 |
| ↘ 8.8 ms hösten | ||
| Skärmen visar bra svarsfrekvens i våra tester, men kan vara för långsam för konkurrenskraftiga spelare. I jämförelse sträcker sig alla testade enheter från 0.1 (minst) till 240 (maximalt) ms. » 43 % av alla enheter är bättre. Det betyder att den uppmätta svarstiden liknar genomsnittet av alla testade enheter (19.9 ms). | ||
| ↔ Svarstid 50 % grått till 80 % grått | ||
| 31.6 ms ... stiga ↗ och falla ↘ kombinerat | ↗ 14 ms stiga | 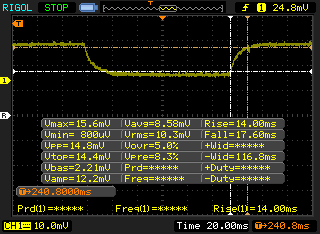 |
| ↘ 17.6 ms hösten | ||
| Skärmen visar långsamma svarsfrekvenser i våra tester och kommer att vara otillfredsställande för spelare. I jämförelse sträcker sig alla testade enheter från 0.165 (minst) till 636 (maximalt) ms. » 42 % av alla enheter är bättre. Det betyder att den uppmätta svarstiden liknar genomsnittet av alla testade enheter (31.1 ms). | ||
Skärmflimmer / PWM (Puls-Width Modulation)
| Skärmflimmer / PWM upptäcktes inte | 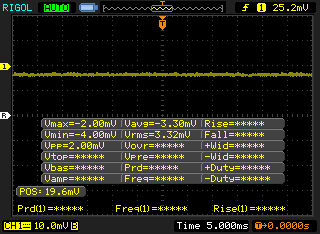 | ||
Som jämförelse: 52 % av alla testade enheter använder inte PWM för att dämpa skärmen. Om PWM upptäcktes mättes ett medelvärde av 7798 (minst: 5 - maximum: 343500) Hz. | |||
| Cinebench R10 | |
| Rendering Multiple CPUs 32Bit | |
| Schenker XMG Ultra 15 Turing | |
| MSI GE75 9SG | |
| HP Omen 17t-3AW55AV_1 | |
| Genomsnitt Intel Core i7-9750H (28251 - 36304, n=13) | |
| HP Omen 15-dc1020ng | |
| Dell G5 15 5587 | |
| Asus FX503VM-EH73 | |
| Asus ROG Zephyrus G15 GA502DU | |
| Rendering Single 32Bit | |
| Schenker XMG Ultra 15 Turing | |
| MSI GE75 9SG | |
| Genomsnitt Intel Core i7-9750H (6659 - 7214, n=13) | |
| HP Omen 17t-3AW55AV_1 | |
| HP Omen 15-dc1020ng | |
| Dell G5 15 5587 | |
| Asus FX503VM-EH73 | |
| Asus ROG Zephyrus G15 GA502DU | |
| wPrime 2.10 - 1024m | |
| Asus FX503VM-EH73 | |
| Asus ROG Zephyrus G15 GA502DU | |
| Genomsnitt Intel Core i7-9750H (n=1) | |
| HP Omen 17t-3AW55AV_1 | |
| MSI GE75 9SG | |
* ... mindre är bättre
| PCMark 8 Home Score Accelerated v2 | 4148 poäng | |
| PCMark 8 Work Score Accelerated v2 | 5222 poäng | |
| PCMark 10 Score | 5429 poäng | |
Hjälp | ||
| HP Pavilion Gaming 17-cd0085cl Samsung SSD PM981 MZVLB256HAHQ | HP Omen 17t-3AW55AV_1 Samsung SSD PM981 MZVLB512HAJQ | Asus TUF FX705DT-AU068T WDC PC SN520 SDAPNUW-256G | Asus ROG Zephyrus G15 GA502DU Intel SSD 660p SSDPEKNW512G8 | Schenker XMG Ultra 15 Turing Samsung SSD 970 EVO Plus 1TB | |
|---|---|---|---|---|---|
| AS SSD | 8% | -35% | -30% | 51% | |
| Seq Read (MB/s) | 1709 | 1473 -14% | 1546 -10% | 907 -47% | 2739 60% |
| Seq Write (MB/s) | 1345 | 1962 46% | 1182 -12% | 926 -31% | 2650 97% |
| 4K Read (MB/s) | 49.73 | 31.66 -36% | 36.54 -27% | 47.26 -5% | 27.86 -44% |
| 4K Write (MB/s) | 108.2 | 84.4 -22% | 109.2 1% | 98.7 -9% | 134.7 24% |
| 4K-64 Read (MB/s) | 731 | 1125 54% | 612 -16% | 321.5 -56% | 1651 126% |
| 4K-64 Write (MB/s) | 1233 | 1866 51% | 436.6 -65% | 736 -40% | 2190 78% |
| Access Time Read * (ms) | 0.073 | 0.071 3% | 0.113 -55% | 0.064 12% | 0.031 58% |
| Access Time Write * (ms) | 0.034 | 0.047 -38% | 0.034 -0% | 0.045 -32% | 0.028 18% |
| Score Read (Points) | 951 | 1304 37% | 803 -16% | 459 -52% | 1953 105% |
| Score Write (Points) | 1476 | 2147 45% | 664 -55% | 927 -37% | 2590 75% |
| Score Total (Points) | 2909 | 4142 42% | 1869 -36% | 1641 -44% | 5529 90% |
| Copy ISO MB/s (MB/s) | 1284 | 1080 -16% | 698 -46% | 905 -30% | 2031 58% |
| Copy Program MB/s (MB/s) | 589 | 481.1 -18% | 114.1 -81% | 496.9 -16% | 452.1 -23% |
| Copy Game MB/s (MB/s) | 1107 | 875 -21% | 379.6 -66% | 819 -26% | 1043 -6% |
* ... mindre är bättre

| 3DMark 11 | |
| 1280x720 Performance GPU | |
| Razer Blade Pro 17 RTX 2080 Max-Q | |
| Eurocom Nightsky RX17 | |
| Alienware 17 R5 | |
| Zotac GeForce GTX 1660 Ti 6 GB | |
| Aorus 15 W9 | |
| MSI GP75 Leopard 9SD | |
| HP Omen 15-dc0015ng | |
| HP Pavilion Gaming 17-cd0085cl | |
| Asus ROG Zephyrus G15 GA502DU | |
| Dell G5 15 5587 | |
| Asus TUF FX705DT-AU068T | |
| MSI GT72S-6QEG16SR421BW | |
| 1280x720 Performance Combined | |
| Zotac GeForce GTX 1660 Ti 6 GB | |
| Eurocom Nightsky RX17 | |
| MSI GP75 Leopard 9SD | |
| HP Pavilion Gaming 17-cd0085cl | |
| Razer Blade Pro 17 RTX 2080 Max-Q | |
| HP Omen 15-dc0015ng | |
| Alienware 17 R5 | |
| Aorus 15 W9 | |
| MSI GT72S-6QEG16SR421BW | |
| Dell G5 15 5587 | |
| Asus ROG Zephyrus G15 GA502DU | |
| Asus TUF FX705DT-AU068T | |
| 3DMark 11 Performance | 16005 poäng | |
| 3DMark Cloud Gate Standard Score | 35562 poäng | |
| 3DMark Fire Strike Score | 11904 poäng | |
| 3DMark Time Spy Score | 5245 poäng | |
Hjälp | ||
| Shadow of the Tomb Raider | |
| 1920x1080 Highest Preset AA:T | |
| MSI GE75 9SG | |
| Zotac GeForce GTX 1660 Ti 6 GB | |
| Asus ROG Strix G GL731GU-RB74 | |
| HP Pavilion Gaming 17-cd0085cl | |
| HP Omen 15-dc0015ng | |
| Asus ROG Zephyrus G15 GA502DU | |
| MSI GF75 Thin 9SC | |
| Acer Aspire Nitro 5 AN515-54-53Z2 | |
| 1280x720 Lowest Preset | |
| MSI GE75 9SG | |
| Asus ROG Strix G GL731GU-RB74 | |
| HP Omen 15-dc0015ng | |
| MSI GF75 Thin 9SC | |
| Zotac GeForce GTX 1660 Ti 6 GB | |
| HP Pavilion Gaming 17-cd0085cl | |
| Asus ROG Zephyrus G15 GA502DU | |
| låg | med. | hög | ultra | |
|---|---|---|---|---|
| BioShock Infinite (2013) | 331.3 | 282 | 259.9 | 130 |
| The Witcher 3 (2015) | 256.8 | 173.3 | 92.1 | 48.5 |
| Shadow of the Tomb Raider (2018) | 126 | 83 | 74 | 64 |
| HP Pavilion Gaming 17-cd0085cl GeForce GTX 1660 Ti Max-Q, i7-9750H, Samsung SSD PM981 MZVLB256HAHQ | Lenovo Legion Y740-17ICH GeForce RTX 2080 Max-Q, i7-8750H, Samsung SSD PM981 MZVLB256HAHQ | HP Omen 17t-3AW55AV_1 GeForce GTX 1070 Mobile, i7-8750H, Samsung SSD PM981 MZVLB512HAJQ | Asus TUF FX705DT-AU068T GeForce GTX 1650 Mobile, R5 3550H, WDC PC SN520 SDAPNUW-256G | MSI GP75 Leopard 9SD GeForce GTX 1660 Ti Mobile, i7-9750H, Kingston RBUSNS8154P3256GJ1 | Eurocom Nightsky RX17 GeForce RTX 2070 Mobile, i7-9750H, 2x Samsung SSD 970 Pro 512GB (RAID 0) | |
|---|---|---|---|---|---|---|
| Noise | -6% | -11% | -6% | -24% | -15% | |
| av / miljö * (dB) | 28.2 | 28.3 -0% | 27.8 1% | 30.8 -9% | 29 -3% | 28 1% |
| Idle Minimum * (dB) | 30.1 | 31.5 -5% | 31.1 -3% | 30.8 -2% | 29 4% | 28 7% |
| Idle Average * (dB) | 30.1 | 31.6 -5% | 31.1 -3% | 30.8 -2% | 34 -13% | 28.4 6% |
| Idle Maximum * (dB) | 30.1 | 31.6 -5% | 35 -16% | 32.2 -7% | 37 -23% | 32.9 -9% |
| Load Average * (dB) | 34.2 | 32.3 6% | 42 -23% | 38.6 -13% | 53 -55% | 45 -32% |
| Witcher 3 ultra * (dB) | 34.2 | 43 -26% | 44.5 -30% | 51 -49% | 53.2 -56% | |
| Load Maximum * (dB) | 43.8 | 45.5 -4% | 46.5 -6% | 44.8 -2% | 55 -26% | 53.2 -21% |
* ... mindre är bättre
Ljudnivå
| Låg belastning |
| 30.1 / 30.1 / 30.1 dB(A) |
| Hög belastning |
| 34.2 / 43.8 dB(A) |
 | ||
30 dB tyst 40 dB(A) hörbar 50 dB(A) högt ljud |
||
min: | ||
(±) Den maximala temperaturen på ovansidan är 42.6 °C / 109 F, jämfört med genomsnittet av 40.4 °C / 105 F , allt från 21.2 till 68.8 °C för klassen Gaming.
(-) Botten värms upp till maximalt 49 °C / 120 F, jämfört med genomsnittet av 43.2 °C / 110 F
(+) Vid tomgångsbruk är medeltemperaturen för ovansidan 29.8 °C / 86 F, jämfört med enhetsgenomsnittet på 33.9 °C / ### class_avg_f### F.
(±) När du spelar The Witcher 3 är medeltemperaturen för ovansidan 33.7 °C / 93 F, jämfört med enhetsgenomsnittet på 33.9 °C / ## #class_avg_f### F.
(+) Handledsstöden och pekplattan är kallare än hudtemperaturen med maximalt 29.2 °C / 84.6 F och är därför svala att ta på.
(±) Medeltemperaturen för handledsstödsområdet på liknande enheter var 28.8 °C / 83.8 F (-0.4 °C / -0.8 F).
HP Pavilion Gaming 17-cd0085cl ljudanalys
(±) | högtalarljudstyrkan är genomsnittlig men bra (74.3 dB)
Analysis not possible as minimum curve is missing or too high
Apple MacBook 12 (Early 2016) 1.1 GHz ljudanalys
(+) | högtalare kan spela relativt högt (83.6 dB)
Bas 100 - 315 Hz
(±) | reducerad bas - i genomsnitt 11.3% lägre än medianen
(±) | linjäriteten för basen är genomsnittlig (14.2% delta till föregående frekvens)
Mellan 400 - 2000 Hz
(+) | balanserad mellan - endast 2.4% från medianen
(+) | mids är linjära (5.5% delta till föregående frekvens)
Högsta 2 - 16 kHz
(+) | balanserade toppar - endast 2% från medianen
(+) | toppar är linjära (4.5% delta till föregående frekvens)
Totalt 100 - 16 000 Hz
(+) | det totala ljudet är linjärt (10.2% skillnad mot median)
Jämfört med samma klass
» 7% av alla testade enheter i den här klassen var bättre, 2% liknande, 91% sämre
» Den bästa hade ett delta på 5%, genomsnittet var 18%, sämst var 53%
Jämfört med alla testade enheter
» 5% av alla testade enheter var bättre, 1% liknande, 94% sämre
» Den bästa hade ett delta på 4%, genomsnittet var 24%, sämst var 134%
| Av/Standby | |
| Låg belastning | |
| Hög belastning |
|
Förklaring:
min: | |
| HP Pavilion Gaming 17-cd0085cl i7-9750H, GeForce GTX 1660 Ti Max-Q, Samsung SSD PM981 MZVLB256HAHQ, IPS, 1920x1080, 17.3" | Lenovo Legion Y740-17ICH i7-8750H, GeForce RTX 2080 Max-Q, Samsung SSD PM981 MZVLB256HAHQ, IPS, 1920x1080, 17.3" | HP Omen 17t-3AW55AV_1 i7-8750H, GeForce GTX 1070 Mobile, Samsung SSD PM981 MZVLB512HAJQ, IPS, 1920x1080, 17.3" | MSI GP75 Leopard 9SD i7-9750H, GeForce GTX 1660 Ti Mobile, Kingston RBUSNS8154P3256GJ1, IPS, 1920x1080, 17.3" | Eurocom Nightsky RX17 i7-9750H, GeForce RTX 2070 Mobile, 2x Samsung SSD 970 Pro 512GB (RAID 0), IPS, 1920x1080, 17.3" | Asus ROG Zephyrus G15 GA502DU R7 3750H, GeForce GTX 1660 Ti Max-Q, Intel SSD 660p SSDPEKNW512G8, IPS, 1920x1080, 15.6" | |
|---|---|---|---|---|---|---|
| Power Consumption | -105% | -101% | -48% | -96% | -31% | |
| Idle Minimum * (Watt) | 5.4 | 20.2 -274% | 17.8 -230% | 10 -85% | 18.6 -244% | 7.4 -37% |
| Idle Average * (Watt) | 9.2 | 27.2 -196% | 24.7 -168% | 15 -63% | 22.6 -146% | 8.6 7% |
| Idle Maximum * (Watt) | 13 | 28.7 -121% | 29.6 -128% | 22 -69% | 23 -77% | 39.1 -201% |
| Load Average * (Watt) | 85.9 | 90.8 -6% | 110 -28% | 92 -7% | 93.4 -9% | 65.9 23% |
| Witcher 3 ultra * (Watt) | 107.9 | 152.1 -41% | 167.8 -56% | 153 -42% | 186.4 -73% | 106.9 1% |
| Load Maximum * (Watt) | 182.2 | 165.4 9% | 178.6 2% | 216 -19% | 233.6 -28% | 141.3 22% |
* ... mindre är bättre
| HP Pavilion Gaming 17-cd0085cl i7-9750H, GeForce GTX 1660 Ti Max-Q, 52.5 Wh | Lenovo Legion Y740-17ICH i7-8750H, GeForce RTX 2080 Max-Q, 76 Wh | HP Omen 17t-3AW55AV_1 i7-8750H, GeForce GTX 1070 Mobile, 86 Wh | Asus TUF FX705DT-AU068T R5 3550H, GeForce GTX 1650 Mobile, 64 Wh | MSI GP75 Leopard 9SD i7-9750H, GeForce GTX 1660 Ti Mobile, 51 Wh | Razer Blade Pro 17 RTX 2080 Max-Q i7-9750H, GeForce RTX 2080 Max-Q, 70 Wh | Eurocom Nightsky RX17 i7-9750H, GeForce RTX 2070 Mobile, 62 Wh | |
|---|---|---|---|---|---|---|---|
| Batteridrifttid | -44% | -9% | 55% | -48% | -12% | -36% | |
| Reader / Idle (h) | 11.6 | 4.5 -61% | 13.6 17% | 4.8 -59% | 4.9 -58% | 4.2 -64% | |
| WiFi v1.3 (h) | 5.7 | 3.2 -44% | 4.2 -26% | 7.8 37% | 3.2 -44% | 4.7 -18% | 2 -65% |
| Load (h) | 1 | 1.6 60% | 2.1 110% | 0.6 -40% | 1.4 40% | 1.2 20% |
För
Emot
Läs den fullständiga versionen av den här recensionen på engelska här.
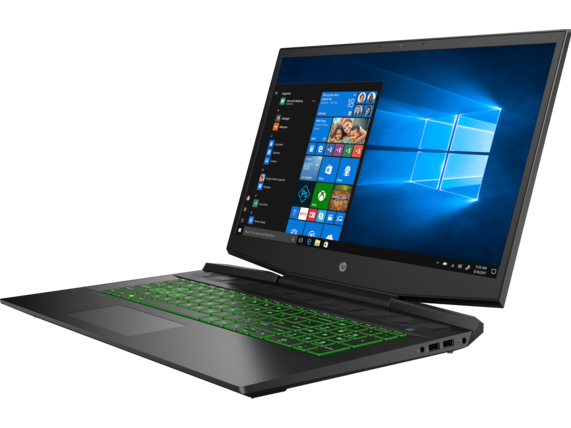
En ord beskriver vår upplevelse av Pavilion Gaming 17: förvånad. Pavilion-serien är HP:s enklaste alternativ designad för användare som behöver tänka på budgeten, så vi brukar alltid justera våra förväntningar därefter. Den här modellen överraskade oss genom att vara en av de tystaste bärbara speldatorerna som vi testat och den är dessutom en av de mest eleganta och ordentligt designade Pavilion-modellerna hittills. Det verkar som att HP har börjat lägga mer tid och energi på sina instegsmodeller och det syns verkligen på Pavilion Gaming 17.
Det finns fortfarande en del "budget"-karaktärsdrag som dröjer kvar och som hade behövt lite mer arbete. Den trånga klickplattan, det böjliga locket, de medelmåttiga högtalarna och det sköra ventilgallret på baksidan känns snarare som att de hör hemma på en ännu billigare laptop.
Den största asterisken här är att Pavilion Gaming 17 med en i9-9750H och GTX 1660 Ti Max-Q grafik inte är särskilt mycket billigare än tävlande system med motsvarande specifikationer. För 13.000 kronor är den bara runt 1.000 - 2.000 kronor billigare än MSI GL73, MSI GP75, Asus TUF FX705 eller Asus ROG GL731GU, beroende på konfigurationen av RAM, lagring och skärm. Men vi tycker ändå att Pavilion är ett bättre alternativ helt enkelt för att den är så mycket tystare när man spelar.
En Pavilion som slår över sin budgetkategori. Den är inte bara relativt tyst för en spellaptop utan den starka designen höjer ribban för vad framtida Pavilion-modeller kan tänkas vara kapabla till.
HP Pavilion Gaming 17-cd0085cl
- 09/20/2019 v7 (old)
Allen Ngo
Price comparison
