Test: HP Spectre x360 15 (Core i7-8750H, GTX 1050 Ti Max-Q, 2 TB SSD, 4K) Omvandlingsbar (Sammanfattning)
| SD Card Reader | |
| average JPG Copy Test (av. of 3 runs) | |
| HP Spectre x360 15-ch000 (Toshiba Exceria Pro SDXC 64 GB UHS-II) | |
| Dell XPS 15 9570 i7 UHD (Toshiba Exceria Pro SDXC 64 GB UHS-II) | |
| HP Spectre x360 15-ch011nr (Toshiba Exceria Pro SDXC 64 GB UHS-II) | |
| HP Spectre x360 15-df0126ng (Toshiba Exceria Pro M501 microSDXC 64GB) | |
| Genomsnitt av klass Multimedia (23 - 531, n=43, senaste 2 åren) | |
| Asus ZenBook Flip 15 UX561UD (Toshiba Exceria Pro SDXC 64 GB UHS-II) | |
| Acer Spin 5 SP515-51GN-80A3 (Toshiba Exceria Pro SDXC 64 GB UHS-II) | |
| maximum AS SSD Seq Read Test (1GB) | |
| HP Spectre x360 15-ch011nr (Toshiba Exceria Pro SDXC 64 GB UHS-II) | |
| HP Spectre x360 15-ch000 (Toshiba Exceria Pro SDXC 64 GB UHS-II) | |
| HP Spectre x360 15-df0126ng (Toshiba Exceria Pro M501 microSDXC 64GB) | |
| Dell XPS 15 9570 i7 UHD (Toshiba Exceria Pro SDXC 64 GB UHS-II) | |
| Genomsnitt av klass Multimedia (27.9 - 1455, n=42, senaste 2 åren) | |
| Asus ZenBook Flip 15 UX561UD (Toshiba Exceria Pro SDXC 64 GB UHS-II) | |
| Acer Spin 5 SP515-51GN-80A3 (Toshiba Exceria Pro SDXC 64 GB UHS-II) | |
| |||||||||||||||||||||||||
Distribution av ljusstyrkan: 87 %
Mitt på batteriet: 282 cd/m²
Kontrast: 892:1 (Svärta: 0.37 cd/m²)
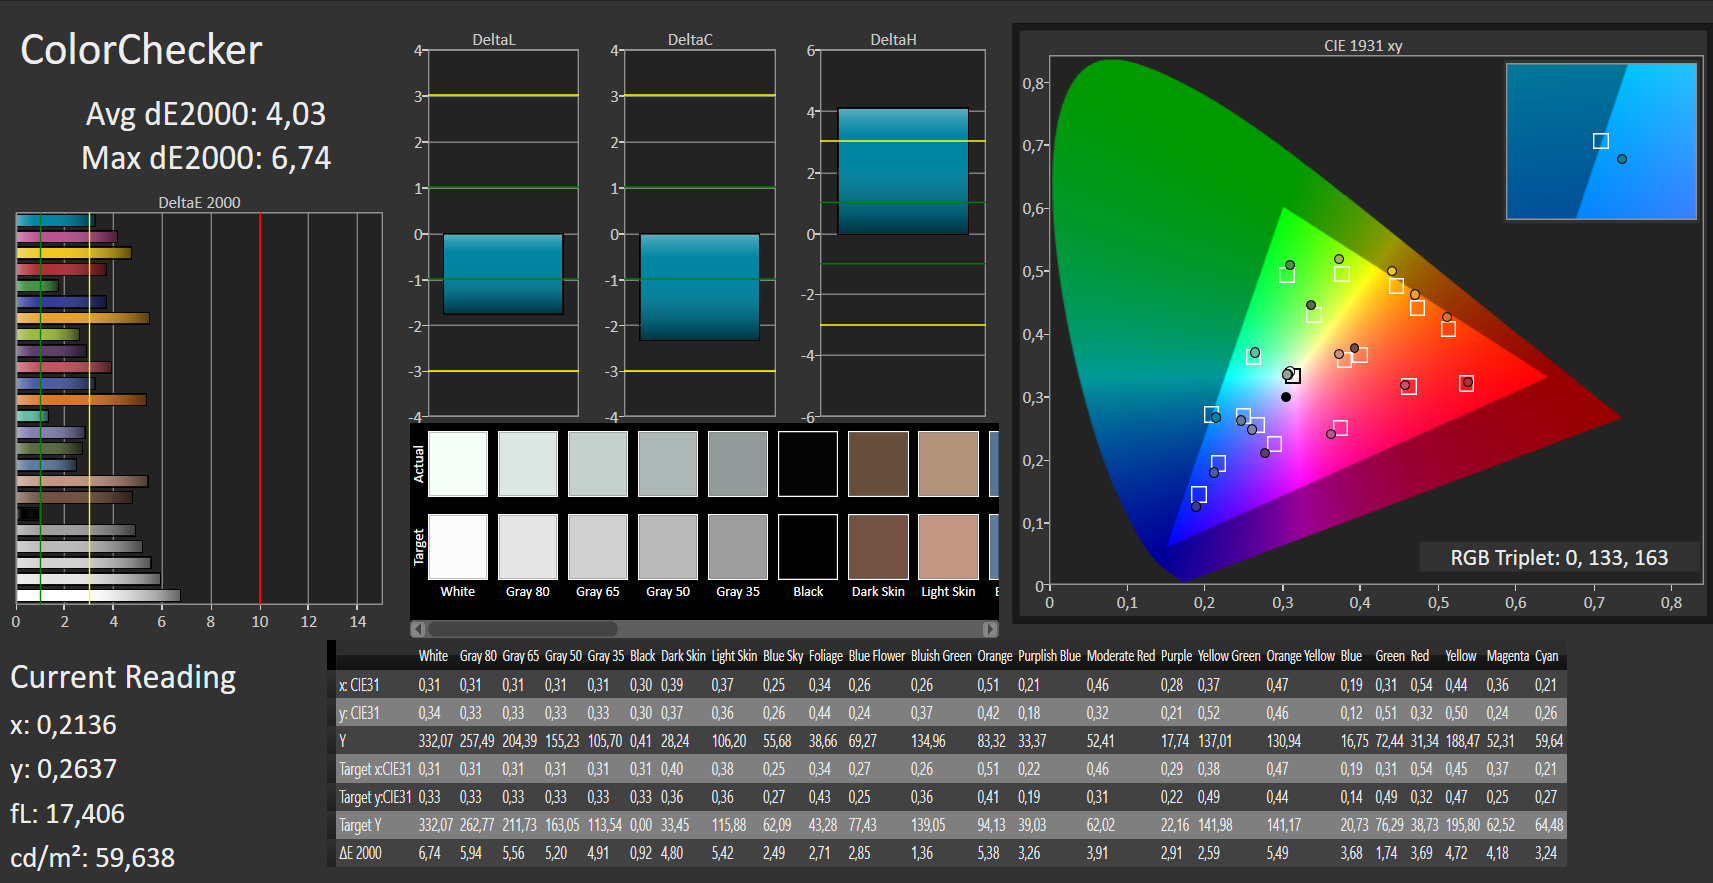
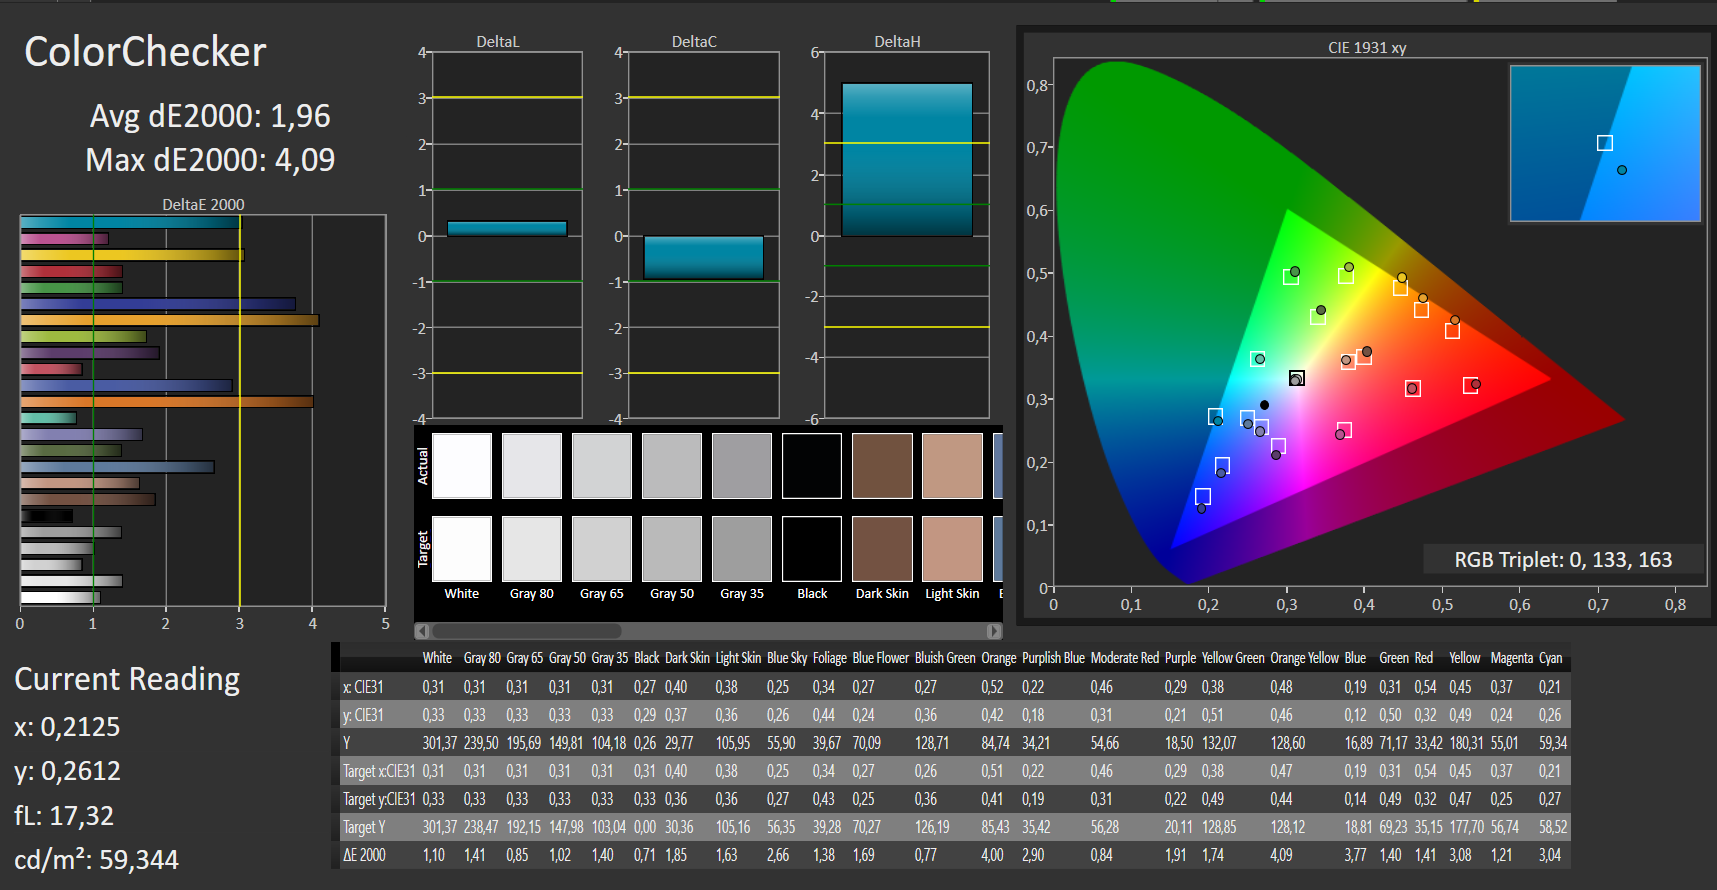
ΔE ColorChecker Calman: 4.03 | ∀{0.5-29.43 Ø4.73}
calibrated: 1.96
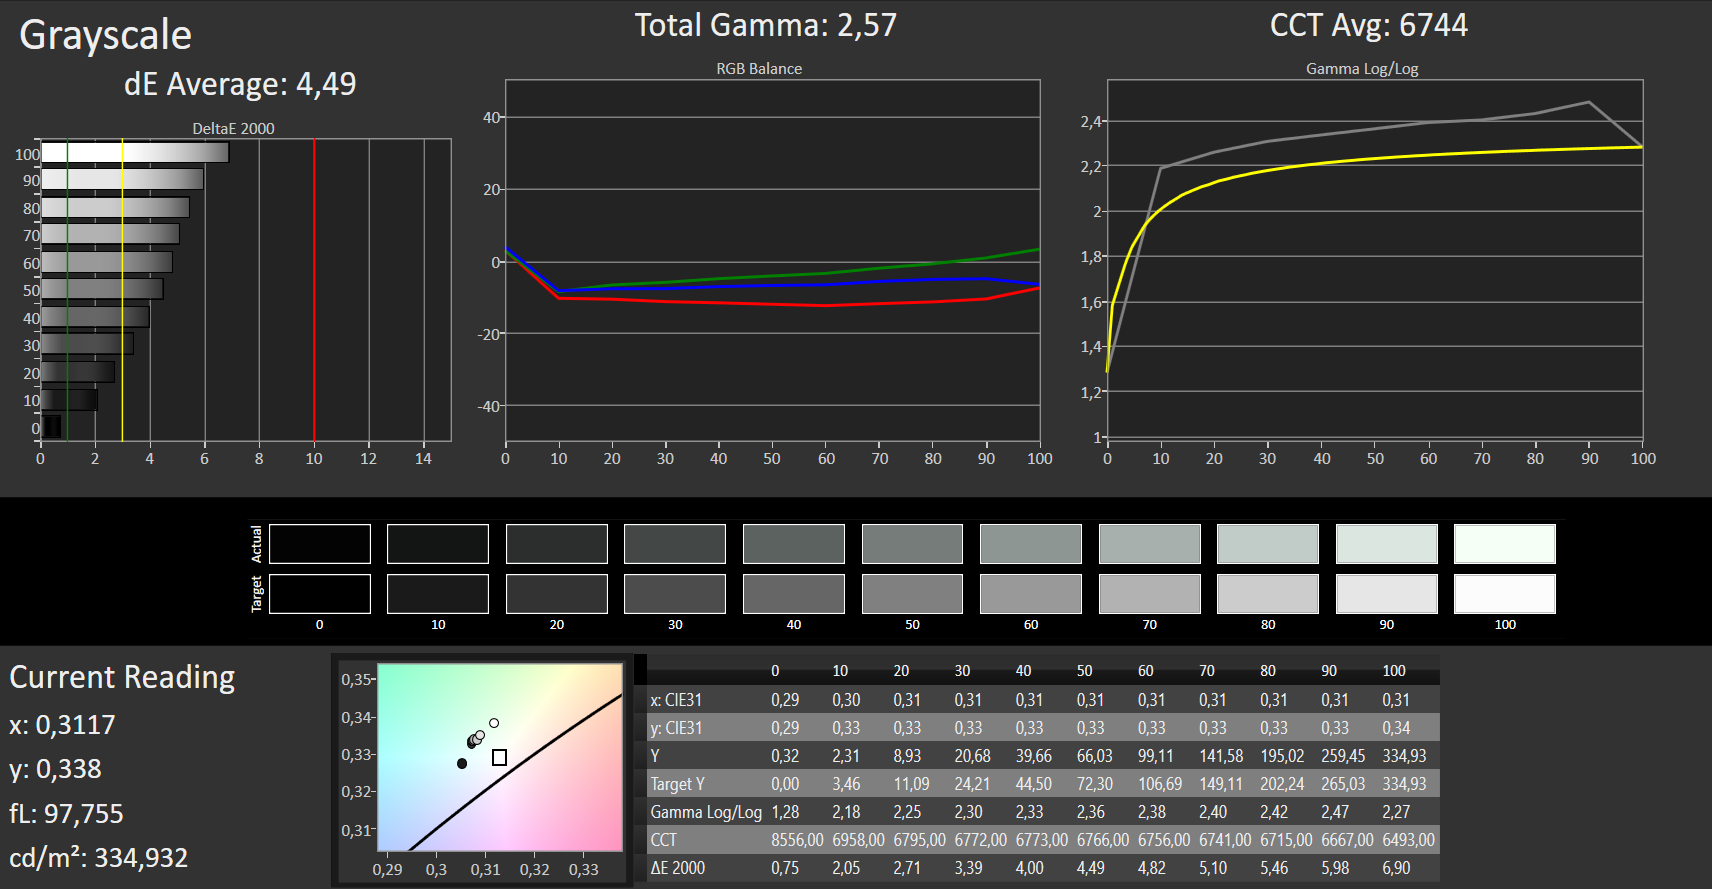
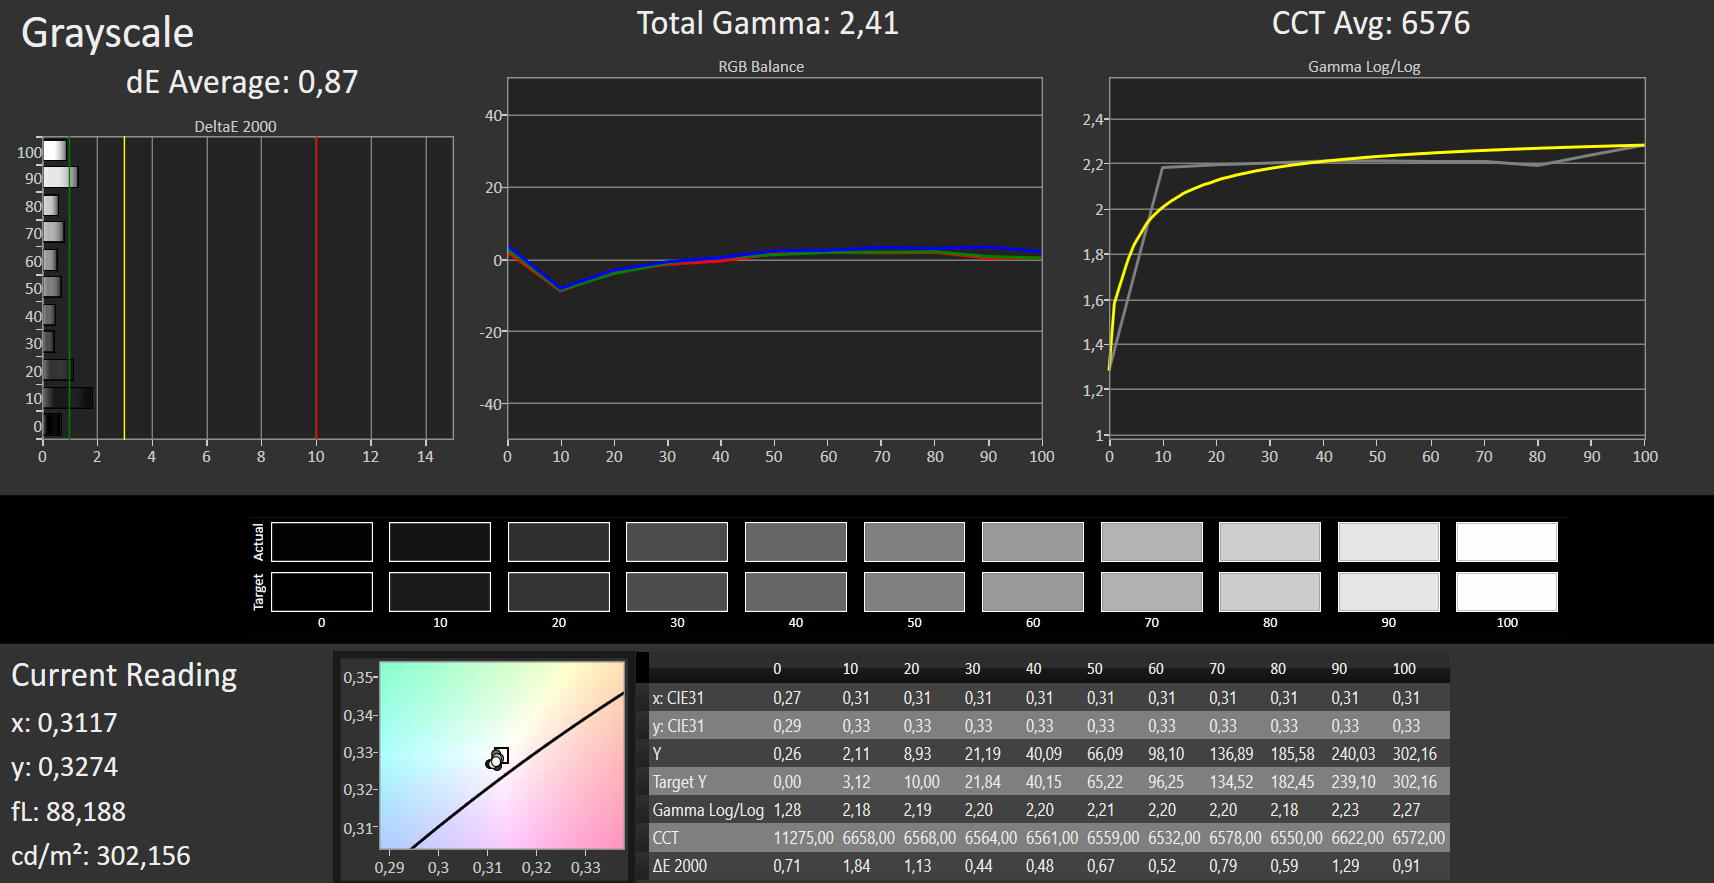
ΔE Greyscale Calman: 4.49 | ∀{0.09-98 Ø4.97}
94% sRGB (Argyll 1.6.3 3D)
61% AdobeRGB 1998 (Argyll 1.6.3 3D)
68.4% AdobeRGB 1998 (Argyll 3D)
94.2% sRGB (Argyll 3D)
68.1% Display P3 (Argyll 3D)
Gamma: 2.57
CCT: 6744 K
| HP Spectre x360 15-df0126ng IPS, 3840x2160, 15.6" | HP Spectre x360 15-ch000 IPS, 3840x2160, 15.6" | HP Spectre x360 15-ch011nr IPS, 3840x2160, 15.6" | Lenovo Yoga 730-15IKB IPS, 3840x2160, 15.6" | Asus ZenBook Flip 15 UX561UD IPS, 3840x2160, 15.6" | Acer Spin 5 SP515-51GN-80A3 a-Si TFT-LCD, LCM, IPS, 1920x1080, 15.6" | Dell XPS 15 9570 i7 UHD IPS, 3840x2160, 15.6" | |
|---|---|---|---|---|---|---|---|
| Display | -5% | -2% | -2% | 26% | -41% | 12% | |
| Display P3 Coverage (%) | 68.1 | 66.7 -2% | 68.5 1% | 68.7 1% | 86.6 27% | 38.73 -43% | 79.1 16% |
| sRGB Coverage (%) | 94.2 | 87.4 -7% | 90.7 -4% | 90 -4% | 100 6% | 58.3 -38% | 98.8 5% |
| AdobeRGB 1998 Coverage (%) | 68.4 | 63.8 -7% | 66.3 -3% | 65.8 -4% | 99.5 45% | 40.02 -41% | 79.2 16% |
| Response Times | 31% | 22% | 30% | 8% | 16% | 8% | |
| Response Time Grey 50% / Grey 80% * (ms) | 57 ? | 36 ? 37% | 38 ? 33% | 34 ? 40% | 52 ? 9% | 42 ? 26% | 46.4 ? 19% |
| Response Time Black / White * (ms) | 31 ? | 23.6 ? 24% | 27.6 ? 11% | 25 ? 19% | 29 ? 6% | 29 ? 6% | 32 ? -3% |
| PWM Frequency (Hz) | 943 ? | 943 ? | 961 ? | 980 ? | |||
| Screen | -6% | -20% | -2% | 16% | 7% | 4% | |
| Brightness middle (cd/m²) | 330 | 349.5 6% | 329.3 0% | 309 -6% | 380 15% | 221 -33% | 494 50% |
| Brightness (cd/m²) | 310 | 330 6% | 316 2% | 299 -4% | 371 20% | 224 -28% | 457 47% |
| Brightness Distribution (%) | 87 | 90 3% | 84 -3% | 84 -3% | 87 0% | 89 2% | 88 1% |
| Black Level * (cd/m²) | 0.37 | 0.29 22% | 0.31 16% | 0.29 22% | 0.28 24% | 0.12 68% | 0.34 8% |
| Contrast (:1) | 892 | 1205 35% | 1062 19% | 1066 20% | 1357 52% | 1842 107% | 1453 63% |
| Colorchecker dE 2000 * | 4.03 | 4.06 -1% | 4.78 -19% | 3.9 3% | 4.38 -9% | 4.12 -2% | 5.2 -29% |
| Colorchecker dE 2000 max. * | 6.74 | 7.68 -14% | 11.75 -74% | 7.5 -11% | 7.59 -13% | 6.41 5% | 17.5 -160% |
| Colorchecker dE 2000 calibrated * | 1.96 | 4.22 -115% | 3.51 -79% | ||||
| Greyscale dE 2000 * | 4.49 | 4.4 2% | 7.9 -76% | 4.58 -2% | 3.6 20% | 3.4 24% | 2.7 40% |
| Gamma | 2.57 86% | 2.11 104% | 2.24 98% | 2.43 91% | 2.32 95% | 2.54 87% | 2.1 105% |
| CCT | 6744 96% | 7422 88% | 8323 78% | 7344 89% | 6860 95% | 6893 94% | 7038 92% |
| Color Space (Percent of AdobeRGB 1998) (%) | 61 | 56.5 -7% | 58.8 -4% | 39 -36% | 88 44% | 37 -39% | 71.2 17% |
| Color Space (Percent of sRGB) (%) | 94 | 86.9 -8% | 90.4 -4% | 90 -4% | 100 6% | 58 -38% | 98.8 5% |
| Totalt genomsnitt (program/inställningar) | 7% /
-2% | 0% /
-12% | 9% /
2% | 17% /
17% | -6% /
-2% | 8% /
6% |
* ... mindre är bättre

Visa svarstider
| ↔ Svarstid svart till vitt | ||
|---|---|---|
| 31 ms ... stiga ↗ och falla ↘ kombinerat | ↗ 16 ms stiga | 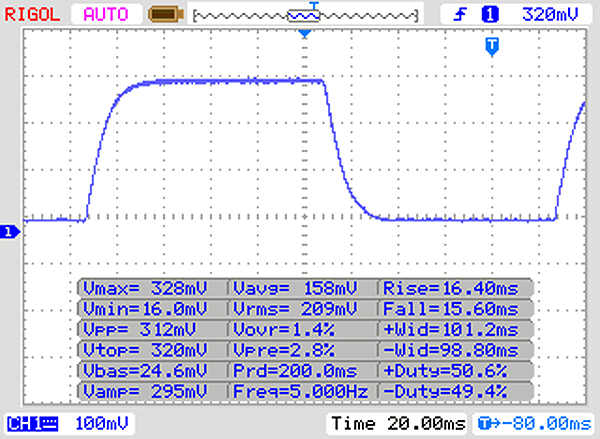 |
| ↘ 15 ms hösten | ||
| Skärmen visar långsamma svarsfrekvenser i våra tester och kommer att vara otillfredsställande för spelare. I jämförelse sträcker sig alla testade enheter från 0.1 (minst) till 240 (maximalt) ms. » 84 % av alla enheter är bättre. Detta innebär att den uppmätta svarstiden är sämre än genomsnittet av alla testade enheter (19.9 ms). | ||
| ↔ Svarstid 50 % grått till 80 % grått | ||
| 57 ms ... stiga ↗ och falla ↘ kombinerat | ↗ 26 ms stiga | 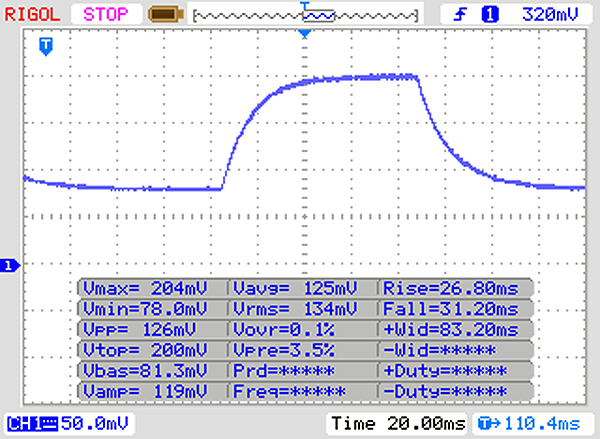 |
| ↘ 31 ms hösten | ||
| Skärmen visar långsamma svarsfrekvenser i våra tester och kommer att vara otillfredsställande för spelare. I jämförelse sträcker sig alla testade enheter från 0.165 (minst) till 636 (maximalt) ms. » 94 % av alla enheter är bättre. Detta innebär att den uppmätta svarstiden är sämre än genomsnittet av alla testade enheter (31.1 ms). | ||
Skärmflimmer / PWM (Puls-Width Modulation)
| Skärmflimmer / PWM upptäcktes inte |  | ||
Som jämförelse: 52 % av alla testade enheter använder inte PWM för att dämpa skärmen. Om PWM upptäcktes mättes ett medelvärde av 7798 (minst: 5 - maximum: 343500) Hz. | |||
| Geekbench 3 | |
| 32 Bit Multi-Core Score | |
| Genomsnitt Intel Core i7-8750H (20725 - 22665, n=13) | |
| HP Spectre x360 15-df0126ng | |
| Lenovo Yoga 730-15IKB | |
| 32 Bit Single-Core Score | |
| HP Spectre x360 15-df0126ng | |
| Genomsnitt Intel Core i7-8750H (3734 - 4163, n=13) | |
| Lenovo Yoga 730-15IKB | |
| Geekbench 4.4 | |
| 64 Bit Multi-Core Score | |
| Genomsnitt av klass Multimedia (n=1senaste 2 åren) | |
| Genomsnitt Intel Core i7-8750H (17709 - 23313, n=17) | |
| Lenovo Yoga 730-15IKB | |
| 64 Bit Single-Core Score | |
| Genomsnitt av klass Multimedia (n=1senaste 2 åren) | |
| Genomsnitt Intel Core i7-8750H (4669 - 5146, n=17) | |
| Lenovo Yoga 730-15IKB | |
| Mozilla Kraken 1.1 - Total | |
| Dell XPS 15 9570 i7 UHD (Edge 42.17134.1.0) | |
| HP Spectre x360 15-ch000 (Edge 42.17134.1.0) | |
| Lenovo Yoga 730-15IKB (Edge 42) | |
| HP Spectre x360 15-df0126ng (Edge 44) | |
| Genomsnitt Intel Core i7-8750H (695 - 1272, n=50) | |
| Asus ZenBook Flip 15 UX561UD | |
| HP Spectre x360 15-ch011nr (Edge 41.16299.15.0) | |
| Acer Spin 5 SP515-51GN-80A3 (Edge 41.16299.15.0) | |
| Genomsnitt av klass Multimedia (228 - 835, n=74, senaste 2 åren) | |
| Octane V2 - Total Score | |
| Genomsnitt av klass Multimedia (64079 - 153175, n=35, senaste 2 åren) | |
| Acer Spin 5 SP515-51GN-80A3 (Edge 41.16299.15.0) | |
| Asus ZenBook Flip 15 UX561UD | |
| HP Spectre x360 15-df0126ng (Edge 44) | |
| Dell XPS 15 9570 i7 UHD (Edge 42.17134.1.0) | |
| Genomsnitt Intel Core i7-8750H (27460 - 44549, n=47) | |
| Lenovo Yoga 730-15IKB (Edge 42) | |
| HP Spectre x360 15-ch011nr (Edge 41.16299.15.0) | |
| HP Spectre x360 15-ch000 (Edge 42.17134.1.0) | |
| JetStream 1.1 - 1.1 Total | |
| Genomsnitt av klass Multimedia (482 - 711, n=2, senaste 2 åren) | |
| Acer Spin 5 SP515-51GN-80A3 (Edge 41.16299.15.0) | |
| Dell XPS 15 9570 i7 UHD (Edge 42.17134.1.0) | |
| Asus ZenBook Flip 15 UX561UD | |
| Genomsnitt Intel Core i7-8750H (205 - 299, n=49) | |
| HP Spectre x360 15-df0126ng (Edge 44) | |
| Lenovo Yoga 730-15IKB (Edge 42) | |
| HP Spectre x360 15-ch011nr (Edge 41.16299.15.0) | |
| HP Spectre x360 15-ch000 (Edge 42.17134.1.0) | |
* ... mindre är bättre
| PCMark 7 Score | 6350 poäng | |
| PCMark 8 Home Score Accelerated v2 | 3494 poäng | |
| PCMark 8 Creative Score Accelerated v2 | 4685 poäng | |
| PCMark 8 Work Score Accelerated v2 | 4316 poäng | |
| PCMark 10 Score | 4636 poäng | |
Hjälp | ||

| HP Spectre x360 15-df0126ng Toshiba XG5-P KXG50PNV2T04 | HP Spectre x360 15-ch000 Toshiba XG5-P KXG50PNV2T04 | HP Spectre x360 15-ch011nr SK hynix PC401 NVMe 500 GB | Lenovo Yoga 730-15IKB SK Hynix PC401 512GB M.2 (HFS512GD9TNG) | Asus ZenBook Flip 15 UX561UD Micron 1100 MTFDDAV256TBN | Acer Spin 5 SP515-51GN-80A3 Intel SSD 600p SSDPEKKW256G7 | Dell XPS 15 9570 i7 UHD Toshiba XG5 KXG50ZNV512G | Genomsnitt Toshiba XG5-P KXG50PNV2T04 | |
|---|---|---|---|---|---|---|---|---|
| CrystalDiskMark 5.2 / 6 | 30% | 8% | 48% | -35% | -10% | 7% | 10% | |
| Write 4K (MB/s) | 84.7 | 127.3 50% | 108.5 28% | 164.9 95% | 112.6 33% | 132.3 56% | 79.1 -7% | 105.8 ? 25% |
| Read 4K (MB/s) | 24.32 | 16.29 -33% | 37.67 55% | 50.5 108% | 29.67 22% | 35.38 45% | 37.89 56% | 23.7 ? -3% |
| Write Seq (MB/s) | 1033 | 288.2 -72% | 1120 8% | 1262 22% | 432.1 -58% | 592 -43% | 1119 8% | 845 ? -18% |
| Read Seq (MB/s) | 1664 | 344 -79% | 1300 -22% | 2054 23% | 479.9 -71% | 1186 -29% | 1852 11% | 1322 ? -21% |
| Write 4K Q32T1 (MB/s) | 433 | 1037 139% | 243.9 -44% | 477.6 10% | 191 -56% | 323 -25% | 361.1 -17% | 531 ? 23% |
| Read 4K Q32T1 (MB/s) | 269.5 | 894 232% | 311.6 16% | 550 104% | 246.5 -9% | 289.2 7% | 257.9 -4% | 474 ? 76% |
| Write Seq Q32T1 (MB/s) | 1036 | 1046 1% | 1395 35% | 1400 35% | 450.3 -57% | 593 -43% | 1131 9% | 1034 ? 0% |
| Read Seq Q32T1 (MB/s) | 3062 | 3040 -1% | 2667 -13% | 2672 -13% | 522 -83% | 1569 -49% | 3096 1% | 3072 ? 0% |
| 3DMark 06 Standard Score | 30798 poäng | |
| 3DMark 11 Performance | 9106 poäng | |
| 3DMark Ice Storm Standard Score | 58769 poäng | |
| 3DMark Cloud Gate Standard Score | 24021 poäng | |
| 3DMark Fire Strike Score | 6700 poäng | |
| 3DMark Time Spy Score | 2485 poäng | |
Hjälp | ||
| låg | med. | hög | ultra | 4K | |
|---|---|---|---|---|---|
| StarCraft 2 (2010) | 433.4 | 200.4 | 186.7 | 126.7 | |
| Diablo III (2012) | 228.2 | 202.6 | 202.1 | 170.1 | |
| BioShock Infinite (2013) | 299 | 209.3 | 183.5 | 72.2 | |
| GTA V (2015) | 150.4 | 143.3 | 78.9 | 34.5 | |
| The Witcher 3 (2015) | 131.3 | 76.6 | 44.2 | 25.4 | 15.9 |
| Dota 2 Reborn (2015) | 111.9 | 104.2 | 98.1 | 93.5 | 46 |
| World of Warships (2015) | 168.6 | 143.9 | 112.7 | 101 | 34.4 |
| Ashes of the Singularity (2016) | 63 | 41.3 | 35.8 | 15.7 | |
| Overwatch (2016) | 285.4 | 233.9 | 117.7 | 70.5 | 37 |
| Prey (2017) | 142.4 | 85.6 | 68.3 | 58.9 | 21.7 |
| Rocket League (2017) | 249.1 | 169.1 | 112.5 | 42.3 | |
| Team Fortress 2 (2017) | 129.8 | 123.6 | 115.7 | 112.6 | 65.2 |
| Middle-earth: Shadow of War (2017) | 105 | 55 | 41 | 31 | 13 |
| Destiny 2 (2017) | 119.5 | 69.4 | 64.3 | 57.9 | 18.9 |
| Final Fantasy XV Benchmark (2018) | 61.5 | 36.6 | 23.3 | 9.2 | |
| X-Plane 11.11 (2018) | 92.7 | 80.3 | 69.4 | 39.5 | |
| Far Cry 5 (2018) | 76 | 45 | 41 | 38 | 14 |
| Monster Hunter World (2018) | 100.3 | 39.2 | 34.9 | 26.8 | 8.3 |
| Forza Horizon 4 (2018) | 122 | 67 | 61 | 47 | 20 |
| Assassin´s Creed Odyssey (2018) | 67 | 43 | 34 | 18 | 7 |
| Call of Duty Black Ops 4 (2018) | 118.7 | 46.3 | 45 | 37.5 | 10.1 |
| Hitman 2 (2018) | 64.8 | 41 | 37.5 | 35.9 | 11.3 |
| Battlefield V (2018) | 100.1 | 57.3 | 47.9 | 44.8 | 17.3 |
| Farming Simulator 19 (2018) | 193.6 | 128.7 | 80.5 | 61 | 22 |
| Darksiders III (2018) | 134.5 | 87.4 | 73.7 | 65 | 13.2 |
| Just Cause 4 (2018) | 73.2 | 47.9 | 36.1 | 35.3 | 12.9 |
| Far Cry New Dawn (2019) | 83 | 47 | 43 | 40 | 14 |
| Metro Exodus (2019) | 55.5 | 49.8 | 36.5 | 28.3 | 4.7 |
| Anthem (2019) | 67.1 | 40.5 | 34 | 30.4 | 9 |
| Dirt Rally 2.0 (2019) | 133.2 | 56.7 | 44.3 | 27.2 | 11.3 |
| The Witcher 3 - 1920x1080 High Graphics & Postprocessing (Nvidia HairWorks Off) | |
| Genomsnitt av klass Multimedia (22 - 224, n=13, senaste 2 åren) | |
| Dell XPS 15 9570 i7 UHD | |
| Genomsnitt NVIDIA GeForce GTX 1050 Ti Max-Q (42.6 - 60, n=6) | |
| Lenovo ThinkPad X1 Extreme-20MF000XGE | |
| HP Spectre x360 15-df0126ng | |
| HP Spectre x360 15-ch000 | |
| Rocket League - 1920x1080 High Quality AA:High FX | |
| HP Spectre x360 15-df0126ng | |
| Genomsnitt NVIDIA GeForce GTX 1050 Ti Max-Q (n=1) | |
| Lenovo Yoga 730-15IKB | |
| Middle-earth: Shadow of War - 1920x1080 Medium Preset AA:T | |
| HP Spectre x360 15-df0126ng | |
| Genomsnitt NVIDIA GeForce GTX 1050 Ti Max-Q (n=1) | |
| Lenovo Yoga 730-15IKB | |
Ljudnivå
| Låg belastning |
| 30.4 / 30.4 / 31.6 dB(A) |
| Hög belastning |
| 43.2 / 38.3 dB(A) |
 | ||
30 dB tyst 40 dB(A) hörbar 50 dB(A) högt ljud |
||
min: | ||
| HP Spectre x360 15-df0126ng i7-8750H, GeForce GTX 1050 Ti Max-Q | HP Spectre x360 15-ch000 i7-8705G, Vega M GL / 870 | HP Spectre x360 15-ch011nr i5-8550U, GeForce MX150 | Lenovo Yoga 730-15IKB i5-8550U, GeForce GTX 1050 Mobile | Asus ZenBook Flip 15 UX561UD i5-8550U, GeForce GTX 1050 Mobile | Acer Spin 5 SP515-51GN-80A3 i5-8550U, GeForce GTX 1050 Mobile | Dell XPS 15 9570 i7 UHD i7-8750H, GeForce GTX 1050 Ti Max-Q | Genomsnitt NVIDIA GeForce GTX 1050 Ti Max-Q | Genomsnitt av klass Multimedia | |
|---|---|---|---|---|---|---|---|---|---|
| Noise | 3% | 6% | 3% | 2% | -2% | 4% | 3% | 11% | |
| av / miljö * (dB) | 30.4 | 28.1 8% | 28.6 6% | 30.5 -0% | 30.4 -0% | 30.2 1% | 29.9 2% | 29.6 ? 3% | 24.2 ? 20% |
| Idle Minimum * (dB) | 30.4 | 30.8 -1% | 29.2 4% | 30.5 -0% | 31.3 -3% | 30.2 1% | 29.9 2% | 29.8 ? 2% | 24.4 ? 20% |
| Idle Average * (dB) | 30.4 | 30.9 -2% | 29.2 4% | 30.5 -0% | 31.3 -3% | 30.2 1% | 29.9 2% | 29.8 ? 2% | 24.8 ? 18% |
| Idle Maximum * (dB) | 31.6 | 30.9 2% | 29.2 8% | 30.5 3% | 31.3 1% | 30.9 2% | 30.3 4% | 30.7 ? 3% | 26.5 ? 16% |
| Load Average * (dB) | 43.2 | 31.8 26% | 29.2 32% | 37.5 13% | 36.4 16% | 42.4 2% | 36.5 16% | 37.4 ? 13% | 37.6 ? 13% |
| Load Maximum * (dB) | 38.3 | 44.2 -15% | 45.7 -19% | 37.5 2% | 37.1 3% | 44.8 -17% | 40.4 -5% | 40.7 ? -6% | 45.9 ? -20% |
| Witcher 3 ultra * (dB) | 48.1 | 38.4 | 40.4 |
* ... mindre är bättre
(±) Den maximala temperaturen på ovansidan är 44.8 °C / 113 F, jämfört med genomsnittet av 36.8 °C / 98 F , allt från 21 till 71 °C för klassen Multimedia.
(-) Botten värms upp till maximalt 49 °C / 120 F, jämfört med genomsnittet av 39.1 °C / 102 F
(+) Vid tomgångsbruk är medeltemperaturen för ovansidan 26 °C / 79 F, jämfört med enhetsgenomsnittet på 31.3 °C / ### class_avg_f### F.
(+) Handledsstöden och pekplattan når maximal hudtemperatur (33.3 °C / 91.9 F) och är därför inte varma.
(-) Medeltemperaturen för handledsstödsområdet på liknande enheter var 28.7 °C / 83.7 F (-4.6 °C / -8.2 F).
| HP Spectre x360 15-df0126ng i7-8750H, GeForce GTX 1050 Ti Max-Q | HP Spectre x360 15-ch000 i7-8705G, Vega M GL / 870 | HP Spectre x360 15-ch011nr i5-8550U, GeForce MX150 | Lenovo Yoga 730-15IKB i5-8550U, GeForce GTX 1050 Mobile | Asus ZenBook Flip 15 UX561UD i5-8550U, GeForce GTX 1050 Mobile | Acer Spin 5 SP515-51GN-80A3 i5-8550U, GeForce GTX 1050 Mobile | Dell XPS 15 9570 i7 UHD i7-8750H, GeForce GTX 1050 Ti Max-Q | Genomsnitt NVIDIA GeForce GTX 1050 Ti Max-Q | Genomsnitt av klass Multimedia | |
|---|---|---|---|---|---|---|---|---|---|
| Heat | -11% | -13% | 4% | 6% | -1% | -2% | -3% | 3% | |
| Maximum Upper Side * (°C) | 44.8 | 46.4 -4% | 46.4 -4% | 40.9 9% | 41.9 6% | 50.9 -14% | 55.7 -24% | 48.8 ? -9% | 41.5 ? 7% |
| Maximum Bottom * (°C) | 49 | 49.2 -0% | 49 -0% | 43 12% | 40.6 17% | 44.2 10% | 48.5 1% | 49.9 ? -2% | 44.1 ? 10% |
| Idle Upper Side * (°C) | 26.6 | 31 -17% | 32 -20% | 27.3 -3% | 26.6 -0% | 26.3 1% | 24.4 8% | 26.2 ? 2% | 27.1 ? -2% |
| Idle Bottom * (°C) | 26.6 | 33 -24% | 34.2 -29% | 27.4 -3% | 26 2% | 27.1 -2% | 24.8 7% | 26.9 ? -1% | 28 ? -5% |
* ... mindre är bättre
HP Spectre x360 15-df0126ng ljudanalys
(-) | inte särskilt höga högtalare (70.3 dB)
Bas 100 - 315 Hz
(±) | reducerad bas - i genomsnitt 14.9% lägre än medianen
(±) | linjäriteten för basen är genomsnittlig (13.3% delta till föregående frekvens)
Mellan 400 - 2000 Hz
(+) | balanserad mellan - endast 3.4% från medianen
(±) | linjäriteten för mids är genomsnittlig (9.3% delta till föregående frekvens)
Högsta 2 - 16 kHz
(+) | balanserade toppar - endast 1.4% från medianen
(+) | toppar är linjära (5.5% delta till föregående frekvens)
Totalt 100 - 16 000 Hz
(±) | linjäriteten för det totala ljudet är genomsnittlig (15.8% skillnad mot median)
Jämfört med samma klass
» 40% av alla testade enheter i den här klassen var bättre, 5% liknande, 55% sämre
» Den bästa hade ett delta på 5%, genomsnittet var 17%, sämst var 45%
Jämfört med alla testade enheter
» 24% av alla testade enheter var bättre, 5% liknande, 71% sämre
» Den bästa hade ett delta på 4%, genomsnittet var 24%, sämst var 134%
HP Spectre x360 15t-bl100 ljudanalys
(-) | inte särskilt höga högtalare (66.3 dB)
Bas 100 - 315 Hz
(±) | reducerad bas - i genomsnitt 14% lägre än medianen
(±) | linjäriteten för basen är genomsnittlig (14.7% delta till föregående frekvens)
Mellan 400 - 2000 Hz
(+) | balanserad mellan - endast 3.7% från medianen
(+) | mids är linjära (4.5% delta till föregående frekvens)
Högsta 2 - 16 kHz
(+) | balanserade toppar - endast 2.8% från medianen
(±) | linjäriteten för toppar är genomsnittlig (7% delta till föregående frekvens)
Totalt 100 - 16 000 Hz
(±) | linjäriteten för det totala ljudet är genomsnittlig (19.5% skillnad mot median)
Jämfört med samma klass
» 64% av alla testade enheter i den här klassen var bättre, 7% liknande, 29% sämre
» Den bästa hade ett delta på 5%, genomsnittet var 17%, sämst var 45%
Jämfört med alla testade enheter
» 48% av alla testade enheter var bättre, 7% liknande, 44% sämre
» Den bästa hade ett delta på 4%, genomsnittet var 24%, sämst var 134%
Lenovo Yoga 730-15IKB ljudanalys
(±) | högtalarljudstyrkan är genomsnittlig men bra (73.3 dB)
Bas 100 - 315 Hz
(-) | nästan ingen bas - i genomsnitt 16.9% lägre än medianen
(±) | linjäriteten för basen är genomsnittlig (12.2% delta till föregående frekvens)
Mellan 400 - 2000 Hz
(+) | balanserad mellan - endast 4% från medianen
(±) | linjäriteten för mids är genomsnittlig (7.7% delta till föregående frekvens)
Högsta 2 - 16 kHz
(+) | balanserade toppar - endast 2.6% från medianen
(+) | toppar är linjära (6.1% delta till föregående frekvens)
Totalt 100 - 16 000 Hz
(±) | linjäriteten för det totala ljudet är genomsnittlig (16.6% skillnad mot median)
Jämfört med samma klass
» 31% av alla testade enheter i den här klassen var bättre, 4% liknande, 66% sämre
» Den bästa hade ett delta på 6%, genomsnittet var 20%, sämst var 57%
Jämfört med alla testade enheter
» 29% av alla testade enheter var bättre, 6% liknande, 66% sämre
» Den bästa hade ett delta på 4%, genomsnittet var 24%, sämst var 134%
| Av/Standby | |
| Låg belastning | |
| Hög belastning |
|
Förklaring:
min: | |
| HP Spectre x360 15-df0126ng i7-8750H, GeForce GTX 1050 Ti Max-Q | HP Spectre x360 15-ch000 i7-8705G, Vega M GL / 870 | HP Spectre x360 15-ch011nr i5-8550U, GeForce MX150 | Lenovo Yoga 730-15IKB i5-8550U, GeForce GTX 1050 Mobile | Asus ZenBook Flip 15 UX561UD i5-8550U, GeForce GTX 1050 Mobile | Acer Spin 5 SP515-51GN-80A3 i5-8550U, GeForce GTX 1050 Mobile | Dell XPS 15 9570 i7 UHD i7-8750H, GeForce GTX 1050 Ti Max-Q | Genomsnitt NVIDIA GeForce GTX 1050 Ti Max-Q | Genomsnitt av klass Multimedia | |
|---|---|---|---|---|---|---|---|---|---|
| Power Consumption | -130% | -33% | -21% | -50% | -3% | -112% | -53% | -40% | |
| Idle Minimum * (Watt) | 2.1 | 11.7 -457% | 5.3 -152% | 4.8 -129% | 5.4 -157% | 3.9 -86% | 9.48 -351% | 5.8 ? -176% | 5.71 ? -172% |
| Idle Average * (Watt) | 6.7 | 16.8 -151% | 9.8 -46% | 10.1 -51% | 10.8 -61% | 6.7 -0% | 16.1 -140% | 11.2 ? -67% | 10.1 ? -51% |
| Idle Maximum * (Watt) | 11.4 | 18.9 -66% | 12.6 -11% | 10.7 6% | 13.9 -22% | 8.7 24% | 16.9 -48% | 13.5 ? -18% | 12.4 ? -9% |
| Load Average * (Watt) | 77.7 | 82.3 -6% | 73 6% | 44 43% | 94 -21% | 74 5% | 90.8 -17% | 86.9 ? -12% | 65 ? 16% |
| Load Maximum * (Watt) | 131.5 | 94.9 28% | 80 39% | 94.7 28% | 116.6 11% | 79 40% | 134.4 -2% | 122.4 ? 7% | 112.2 ? 15% |
| Witcher 3 ultra * (Watt) | 87.2 | 67.6 |
* ... mindre är bättre
| HP Spectre x360 15-df0126ng i7-8750H, GeForce GTX 1050 Ti Max-Q, 84 Wh | HP Spectre x360 15-ch000 i7-8705G, Vega M GL / 870, 84 Wh | HP Spectre x360 15-ch011nr i5-8550U, GeForce MX150, 84 Wh | Lenovo Yoga 730-15IKB i5-8550U, GeForce GTX 1050 Mobile, 51.5 Wh | Asus ZenBook Flip 15 UX561UD i5-8550U, GeForce GTX 1050 Mobile, 52 Wh | Acer Spin 5 SP515-51GN-80A3 i5-8550U, GeForce GTX 1050 Mobile, 48 Wh | Dell XPS 15 9570 i7 UHD i7-8750H, GeForce GTX 1050 Ti Max-Q, 97 Wh | Genomsnitt av klass Multimedia | |
|---|---|---|---|---|---|---|---|---|
| Batteridrifttid | -46% | 0% | -41% | -44% | -32% | 9% | 39% | |
| Reader / Idle (h) | 18.8 | 9 -52% | 15.5 -18% | 11.6 -38% | 9.3 -51% | 12.7 -32% | 25.2 ? 34% | |
| H.264 (h) | 7.7 | 5.4 -30% | 4.4 -43% | 5.5 -29% | 12.3 60% | 16.4 ? 113% | ||
| WiFi v1.3 (h) | 8.8 | 5.7 -35% | 10.4 18% | 6.2 -30% | 5.2 -41% | 6.2 -30% | 9.6 9% | 12 ? 36% |
| Load (h) | 2.3 | 1.1 -52% | 2.3 0% | 0.8 -65% | 1.4 -39% | 1.5 -35% | 1.3 -43% | 1.675 ? -27% |
| Witcher 3 ultra (h) | 1 |
För
Emot
Läs den fullständiga versionen av den här recensionen på engelska här.
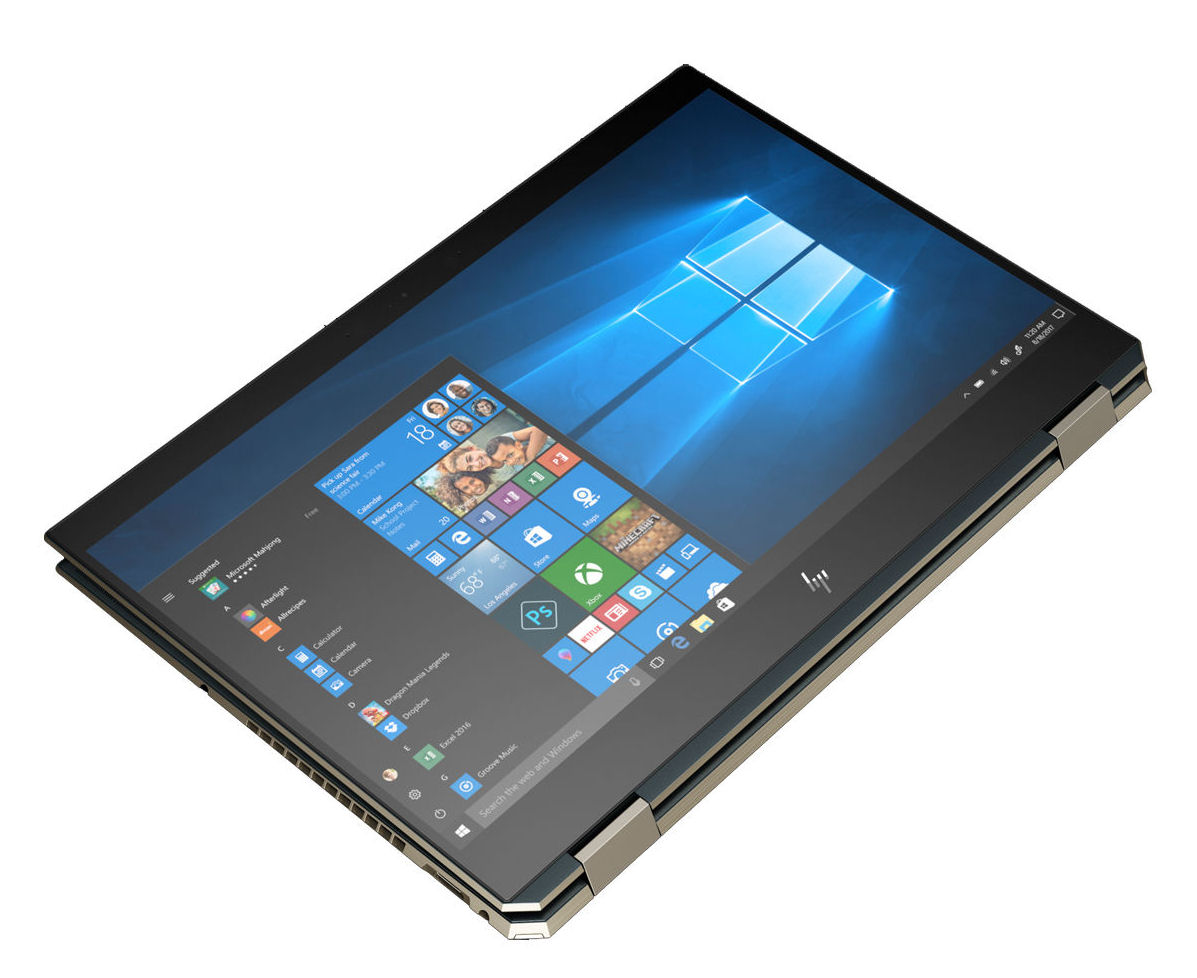
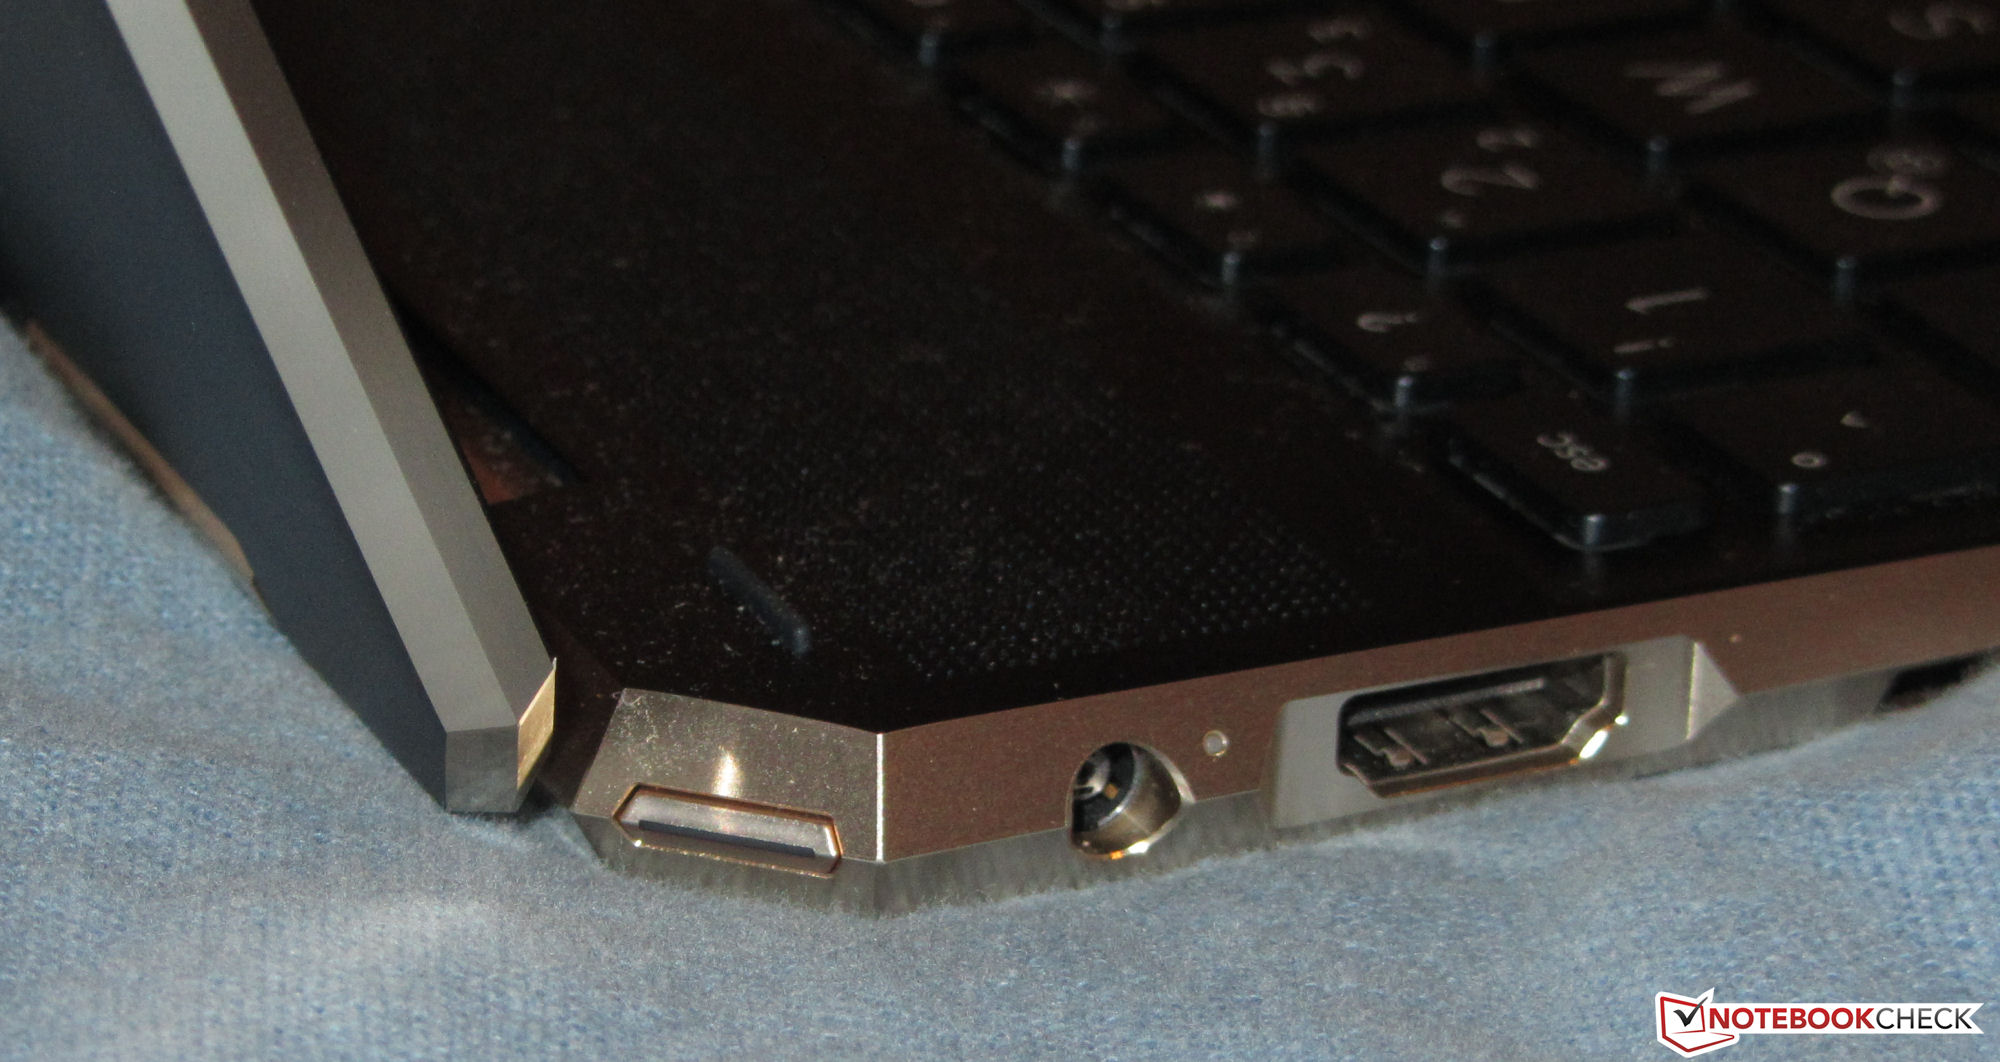
HP Spectre x360 15-df0126ng är en utmärkt omvandlingsbar på 15 tum som i huvudsak är en värd uppgradering från sin föregångare. Den sexkärniga processorn är ett steg upp från förra årets chipp från U-serien vilket även gäller den betyldigt kraftigare GPU:n. Systemet råkar heller inte ut för värmestrypning trots det tunna höljet, vilket är bra.
HP Spectre x360 15-df0126ng är en välutrustad omvandlingsbar multimediaenhet på 15.6 tum som levererar på nästan alla områden.
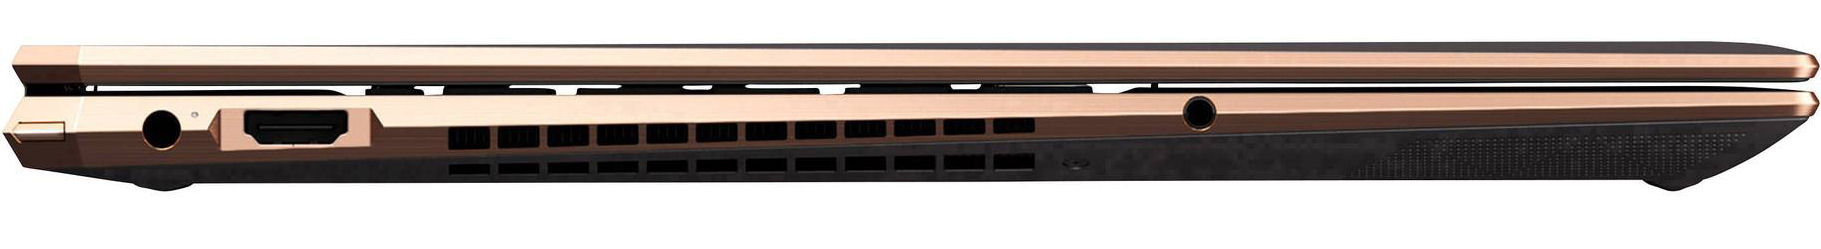
Den är tillräckligt kraftfull för de flesta uppgifter och kan till och med hantera moderna spel i 1080p. Du kan också ansluta en extern GPU om du behöver kraftigare grafik.
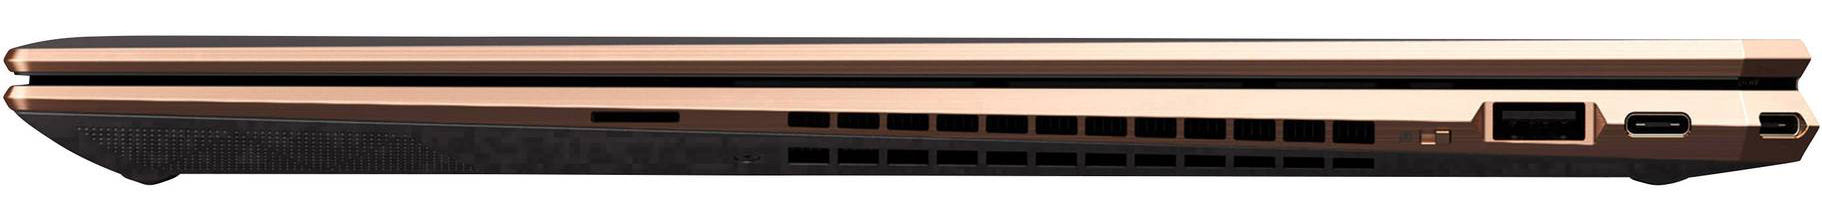
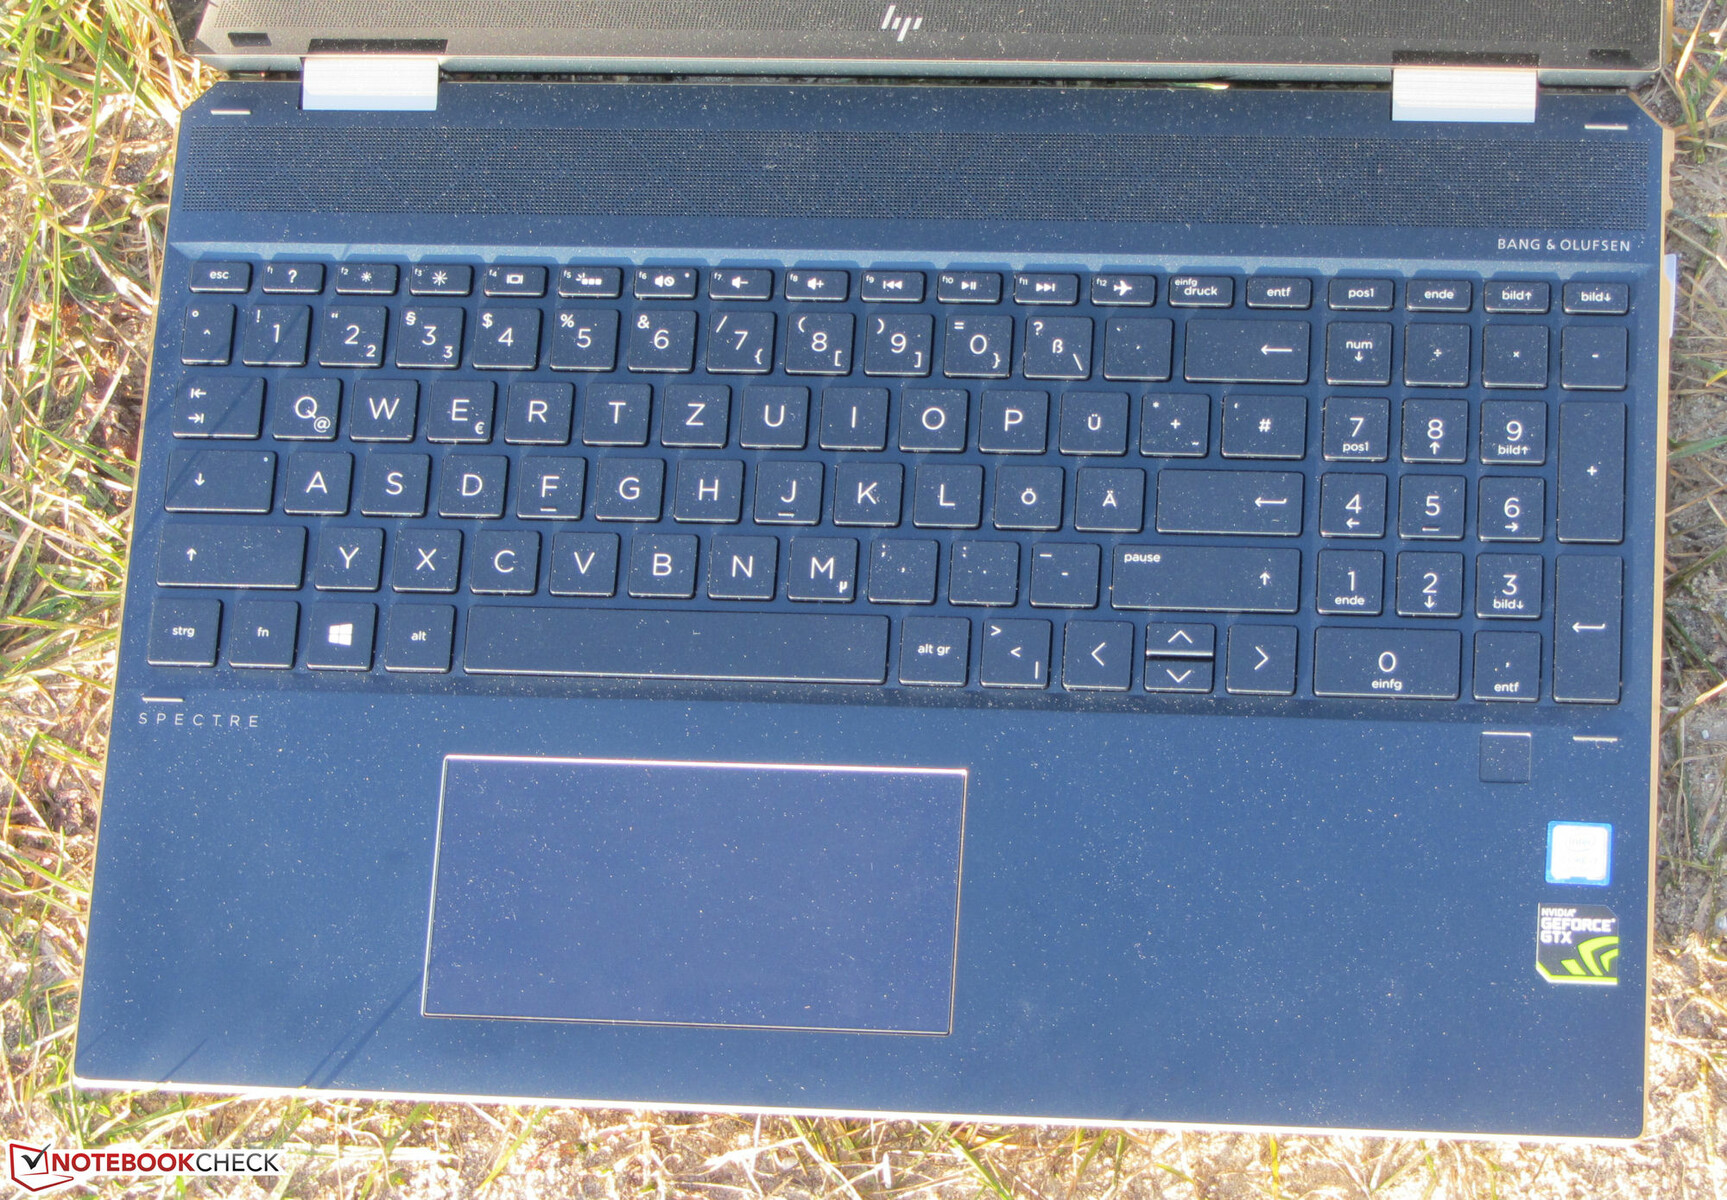
SSD-enheten är lämpligt snabb och vi misstänker att de flesta användare inte kommer att använda upp den rikliga mängden lagring på 2 TB. Men att byta ut enheten är krångligare än det bör vara då HP verkar ha gjort sitt yttersta för att avhålla användaren från att öppna enheten. Det bakgrundsbelysta tangentbordet och den tryckkänsliga skärmen är skapliga, men det känns lite snålt att HP inte inkluderar sin Tilt Pen i förpackningen.
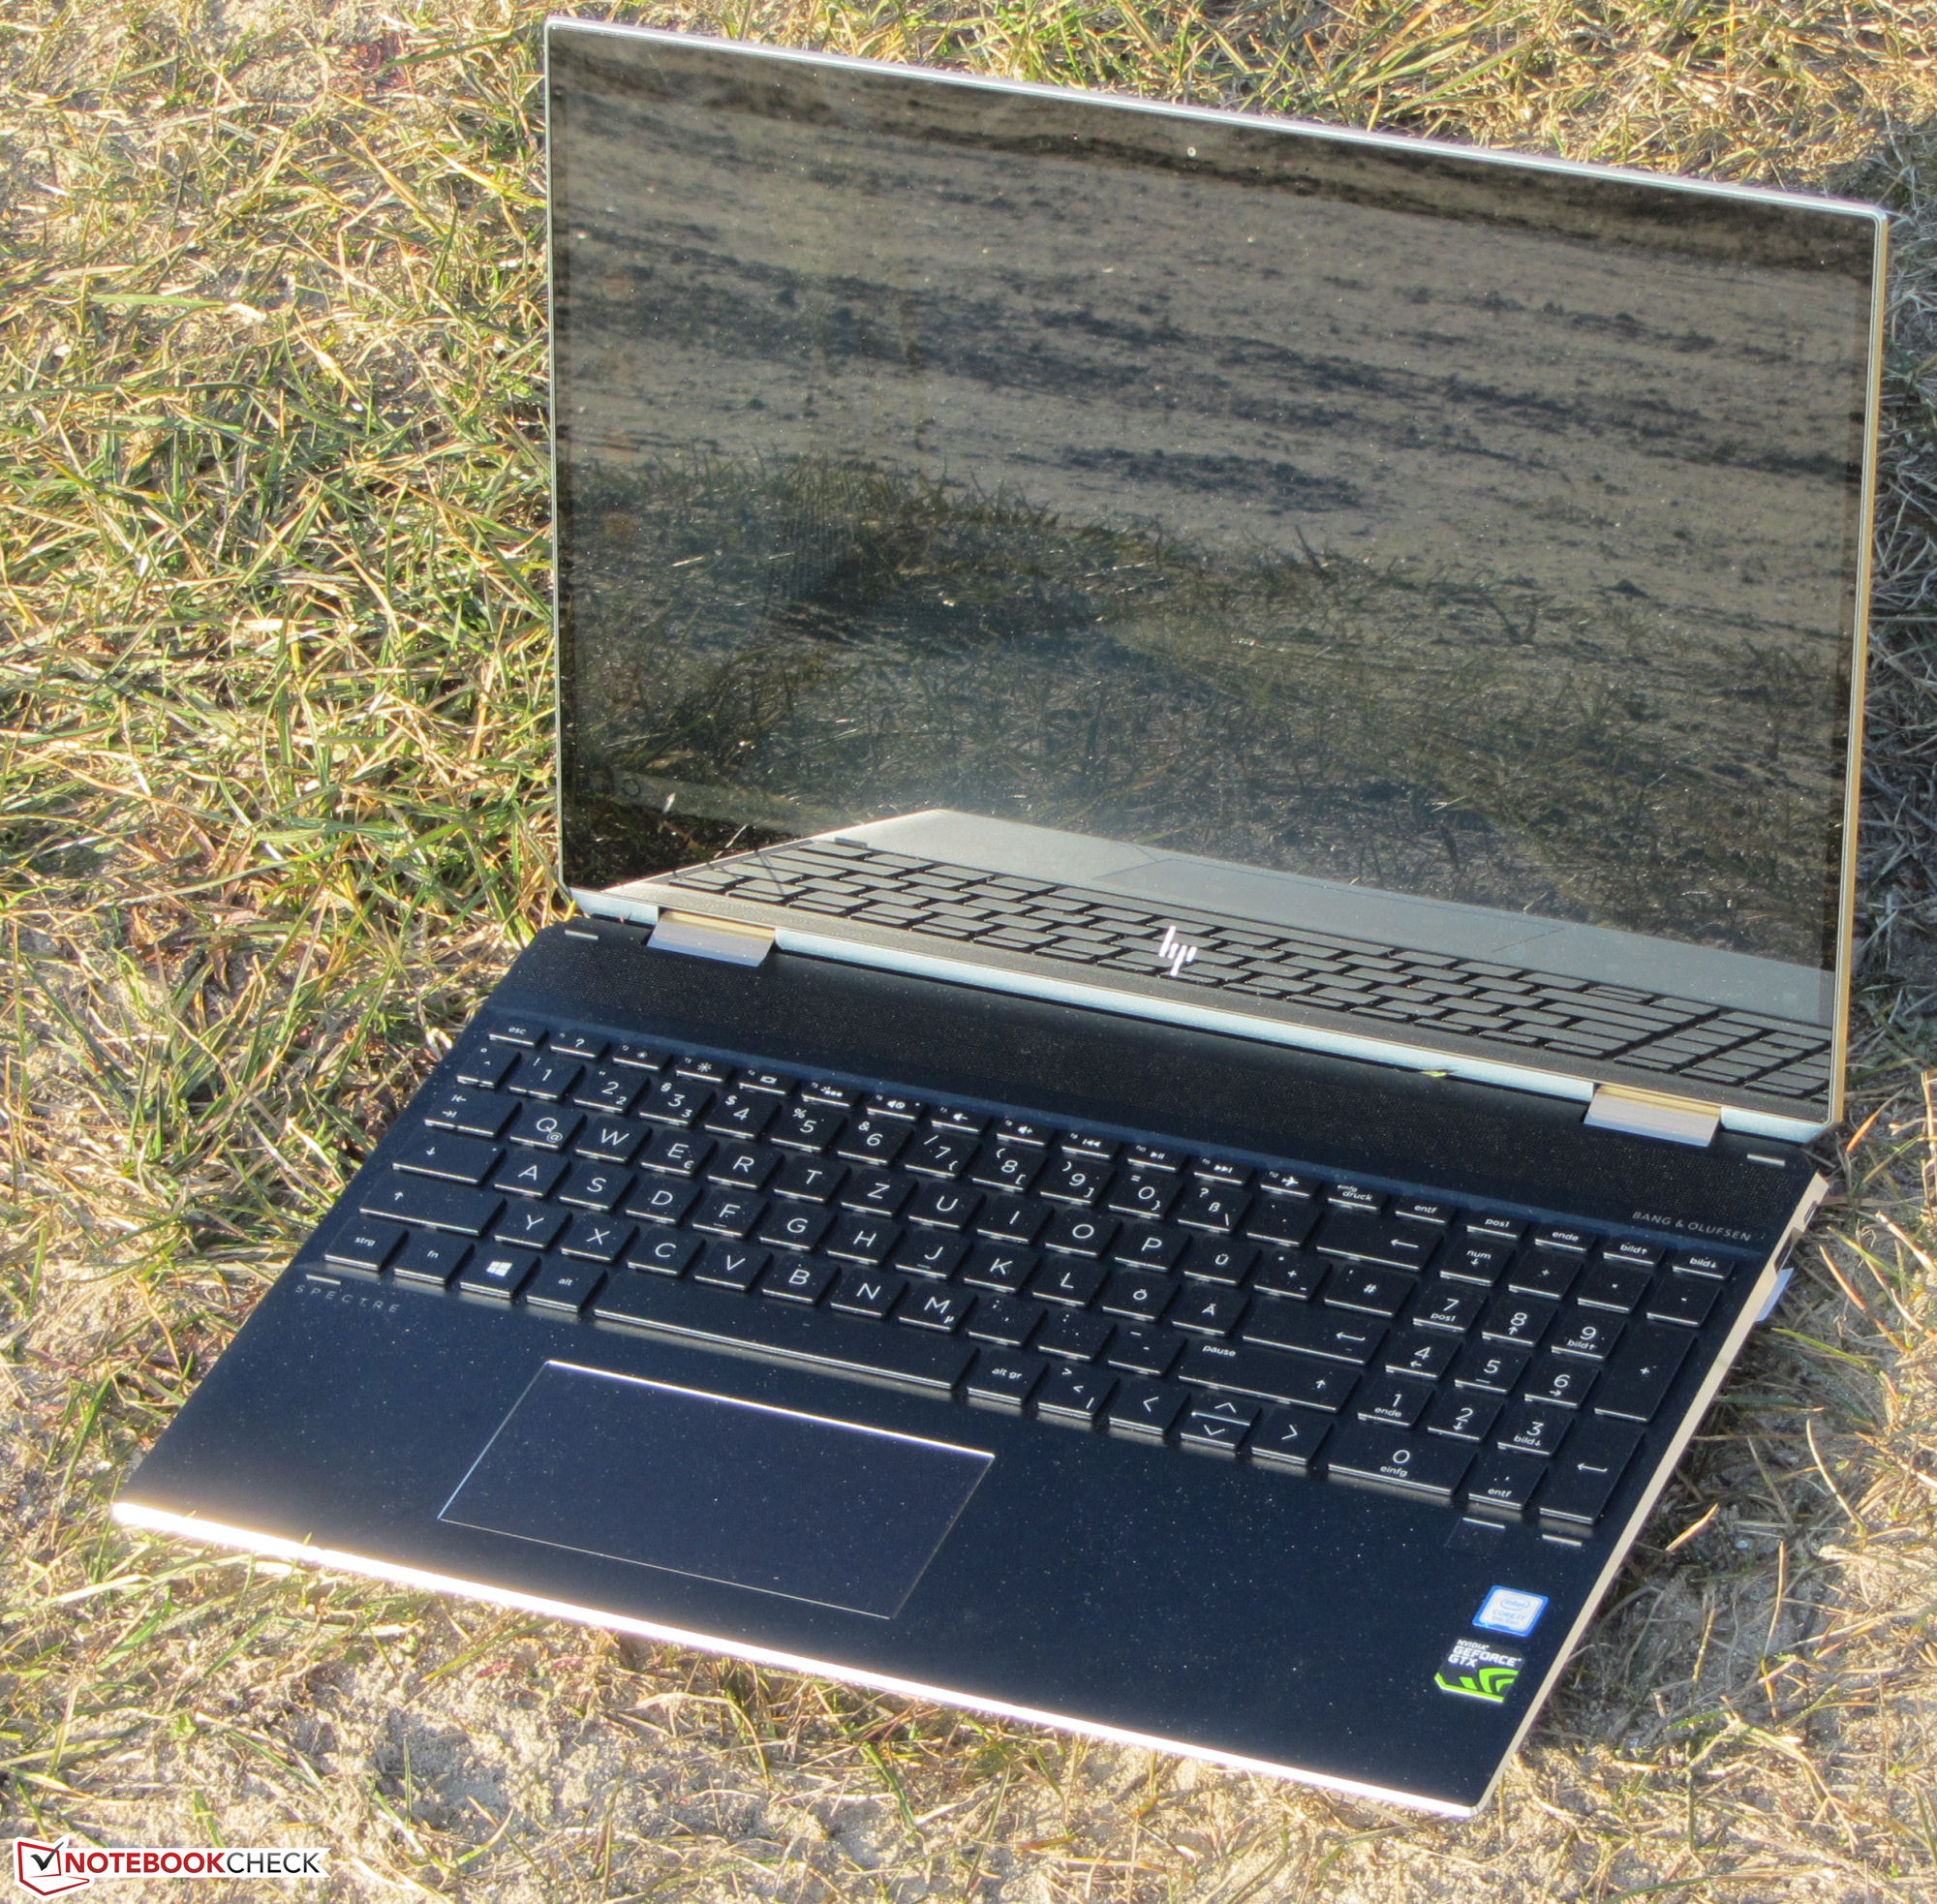
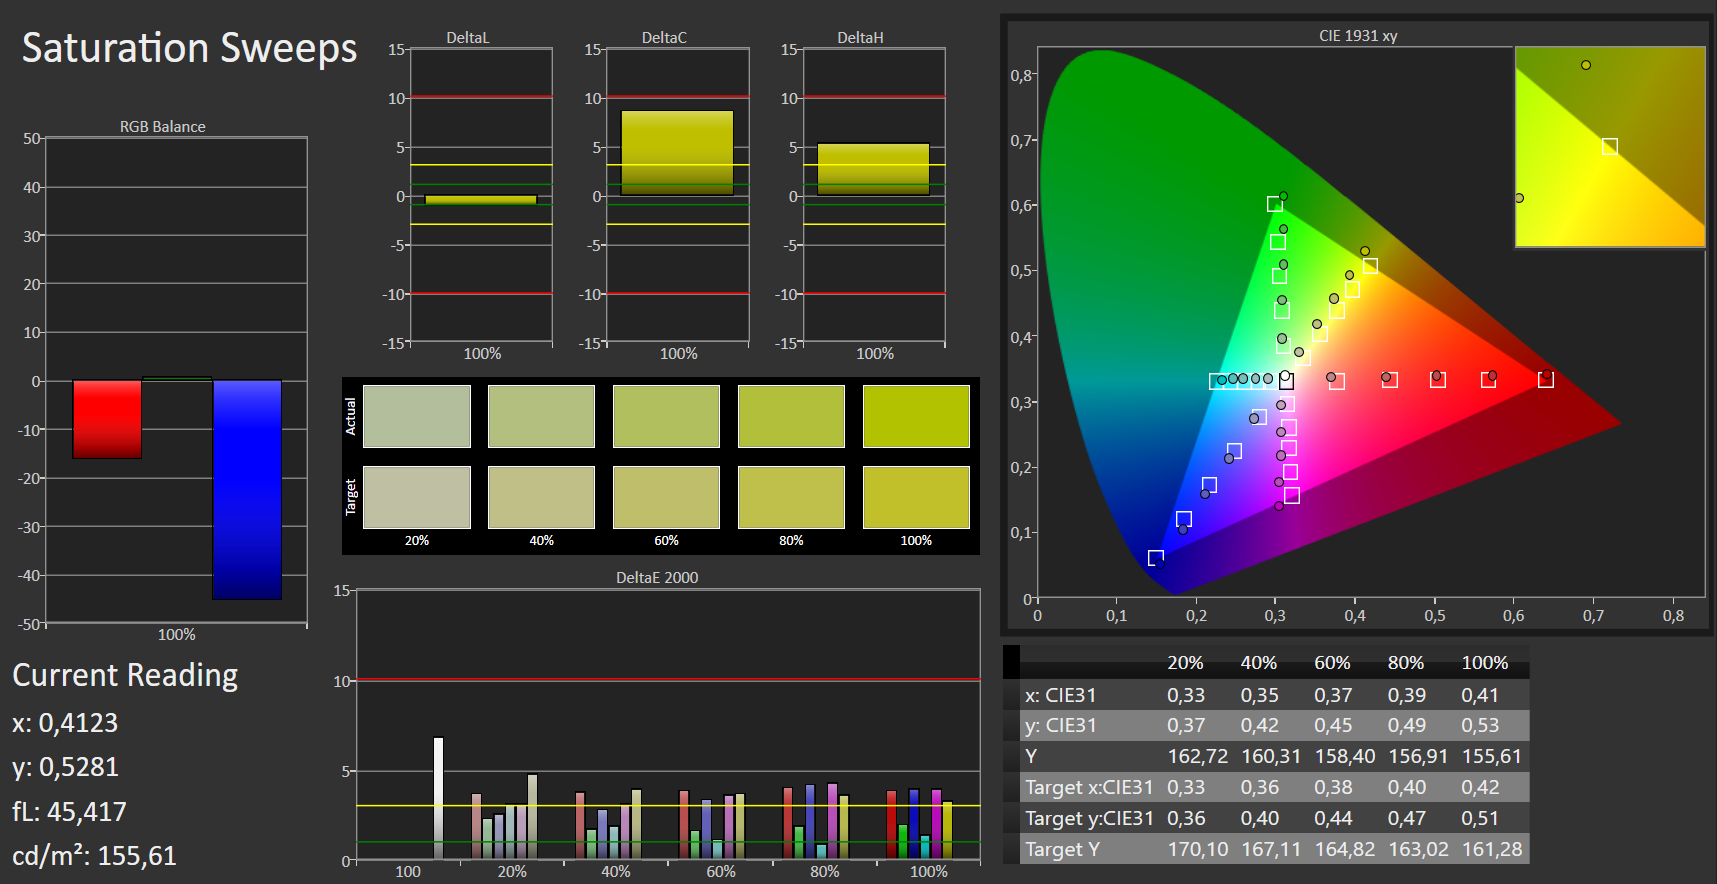
Skärmen är i stort sett bra med stabila betraktningsvinklar och god färgprecision, men den hålls tillbaka av otillräcklig ljusstyrka och ett halvdant kontrastförhållande. Vi hade förväntat oss en mer ljusstark och levande skärm på en såpass dyr enhet.
Totalt sett är Spectre x360 15-df0126ng en stor och imponerande omvandlingsbar, men dess instegs-syskon kommer med en betydligt mindre kraftfull Core i7-8565U processor och en GeForce MX150 GPU, så var noggrann med vilken modell du köper.
HP Spectre x360 15-df0126ng
- 10/25/2019 v7 (old)
Sascha Mölck
Price comparison
