Test: Alienware 13 R3 (sammanfattning)
| Networking | |
| iperf3 transmit AX12 | |
| Razer Blade (2016) | |
| Alienware 13 R3 | |
| iperf3 receive AX12 | |
| Alienware 13 R3 | |
| Razer Blade (2016) | |
| |||||||||||||||||||||||||
Distribution av ljusstyrkan: 87 %
Mitt på batteriet: 313 cd/m²
Kontrast: ∞:1 (Svärta: 0 cd/m²)
ΔE ColorChecker Calman: 2.54 | ∀{0.5-29.43 Ø4.71}
ΔE Greyscale Calman: 1.43 | ∀{0.09-98 Ø4.96}
97% sRGB (Argyll 1.6.3 3D)
78% AdobeRGB 1998 (Argyll 1.6.3 3D)
Gamma: 2.3
CCT: 6337 K
| Alienware 13 R3 JJT6C_133KL05 (SDCA029), 2560x1440, 13.3" | Razer Blade (2016) Sharp LQ140Z1JW01 (SHP1401), 3200x1800, 14" | MSI GS43VR 6RE-006US Name: LG Philips LP140WF3-SPD1, ID: LGD046D, 1920x1080, 14" | Schenker XMG P406 LG Philips 140WF1 (LGD040A), 1920x1080, 14" | Aorus X3 Plus v5 3200x1800, 13.9" | |
|---|---|---|---|---|---|
| Display | |||||
| Display P3 Coverage (%) | 66.9 | 65.5 | 66.2 | 67.9 | |
| sRGB Coverage (%) | 96.8 | 86.4 | 82.8 | 98.2 | |
| AdobeRGB 1998 Coverage (%) | 68.2 | 63.1 | 60.5 | 69.2 | |
| Response Times | -1221% | -771% | -971% | -1586% | |
| Response Time Grey 50% / Grey 80% * (ms) | 41 ? | 31.6 ? | 56 ? | 52.4 ? | |
| Response Time Black / White * (ms) | 2.8 ? | 37 ? -1221% | 24.4 ? -771% | 30 ? -971% | 47.2 ? -1586% |
| PWM Frequency (Hz) | 240 ? | 200 ? | 198 ? | ||
| Screen | -1% | -17% | -65% | -46% | |
| Brightness middle (cd/m²) | 313 | 328 5% | 288.4 -8% | 282 -10% | 394.8 26% |
| Brightness (cd/m²) | 310 | 328 6% | 282 -9% | 266 -14% | 370 19% |
| Brightness Distribution (%) | 87 | 69 -21% | 83 -5% | 81 -7% | 79 -9% |
| Black Level * (cd/m²) | 0.22 | 0.35 | 0.22 | 0.293 | |
| Colorchecker dE 2000 * | 2.54 | 1.91 25% | 2.61 -3% | 4.98 -96% | 4.8 -89% |
| Colorchecker dE 2000 max. * | 3.94 | 3.23 18% | 7.34 -86% | 10.2 -159% | |
| Greyscale dE 2000 * | 1.43 | 1.69 -18% | 1.18 17% | 4.08 -185% | 5.04 -252% |
| Gamma | 2.3 96% | 2.3 96% | 2.24 98% | 2.51 88% | 2.26 97% |
| CCT | 6337 103% | 6418 101% | 6506 100% | 5877 111% | 7343 89% |
| Color Space (Percent of AdobeRGB 1998) (%) | 78 | 63 -19% | 56.4 -28% | 54 -31% | 63.4 -19% |
| Color Space (Percent of sRGB) (%) | 97 | 97 0% | 86.4 -11% | 83 -14% | 98.1 1% |
| Contrast (:1) | 1491 | 824 | 1282 | 1347 | |
| Totalt genomsnitt (program/inställningar) | -611% /
-136% | -394% /
-100% | -518% /
-165% | -816% /
-239% |
* ... mindre är bättre
Visa svarstider
| ↔ Svarstid svart till vitt | ||
|---|---|---|
| 2.8 ms ... stiga ↗ och falla ↘ kombinerat | ↗ 1.2 ms stiga | 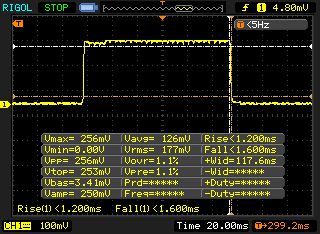 |
| ↘ 1.6 ms hösten | ||
| Skärmen visar väldigt snabba svarsfrekvenser i våra tester och borde vara mycket väl lämpad för fartfyllt spel. I jämförelse sträcker sig alla testade enheter från 0.1 (minst) till 240 (maximalt) ms. » 14 % av alla enheter är bättre. Det betyder att den uppmätta svarstiden är bättre än genomsnittet av alla testade enheter (19.8 ms). | ||
Skärmflimmer / PWM (Puls-Width Modulation)
| Skärmflimmer / PWM upptäckt | 240 Hz | ≤ 100 % ljusstyrka inställning | 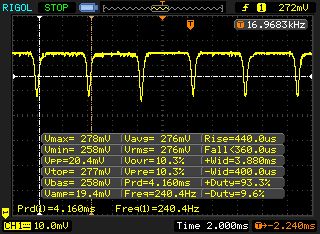 |
Displayens bakgrundsbelysning flimrar vid 240 Hz (i värsta fall, t.ex. med PWM) Flimrande upptäckt vid en ljusstyrkeinställning på 100 % och lägre. Det ska inte finnas något flimmer eller PWM över denna ljusstyrkeinställning. Frekvensen för 240 Hz är relativt låg, så känsliga användare kommer sannolikt att märka flimmer och uppleva ansträngda ögon vid den angivna ljusstyrkeinställningen och nedan. Som jämförelse: 52 % av alla testade enheter använder inte PWM för att dämpa skärmen. Om PWM upptäcktes mättes ett medelvärde av 7754 (minst: 5 - maximum: 343500) Hz. | |||
| Cinebench R15 | |
| CPU Single 64Bit | |
| Alienware 13 R3 | |
| Razer Blade (2016) | |
| Schenker XMG P406 | |
| Aorus X3 Plus v5 | |
| MSI GS43VR 6RE-006US | |
| CPU Multi 64Bit | |
| Alienware 13 R3 | |
| Aorus X3 Plus v5 | |
| Schenker XMG P406 | |
| MSI GS43VR 6RE-006US | |
| Razer Blade (2016) | |
| Cinebench R11.5 | |
| CPU Single 64Bit | |
| Alienware 13 R3 | |
| Aorus X3 Plus v5 | |
| Schenker XMG P406 | |
| MSI GS43VR 6RE-006US | |
| CPU Multi 64Bit | |
| Alienware 13 R3 | |
| Aorus X3 Plus v5 | |
| Schenker XMG P406 | |
| MSI GS43VR 6RE-006US | |
| PCMark 8 | |
| Home Score Accelerated v2 | |
| Aorus X3 Plus v5 | |
| MSI GS43VR 6RE-006US | |
| Alienware 13 R3 | |
| Razer Blade (2016) | |
| Schenker XMG P406 | |
| Work Score Accelerated v2 | |
| Schenker XMG P406 | |
| Alienware 13 R3 | |
| MSI GS43VR 6RE-006US | |
| Aorus X3 Plus v5 | |
| Razer Blade (2016) | |
| PCMark 7 - Score | |
| Schenker XMG P406 | |
| Alienware 13 R3 | |
| Aorus X3 Plus v5 | |
| PCMark 7 Score | 5482 poäng | |
| PCMark 8 Home Score Accelerated v2 | 3894 poäng | |
| PCMark 8 Creative Score Accelerated v2 | 5200 poäng | |
| PCMark 8 Work Score Accelerated v2 | 4799 poäng | |
Hjälp | ||
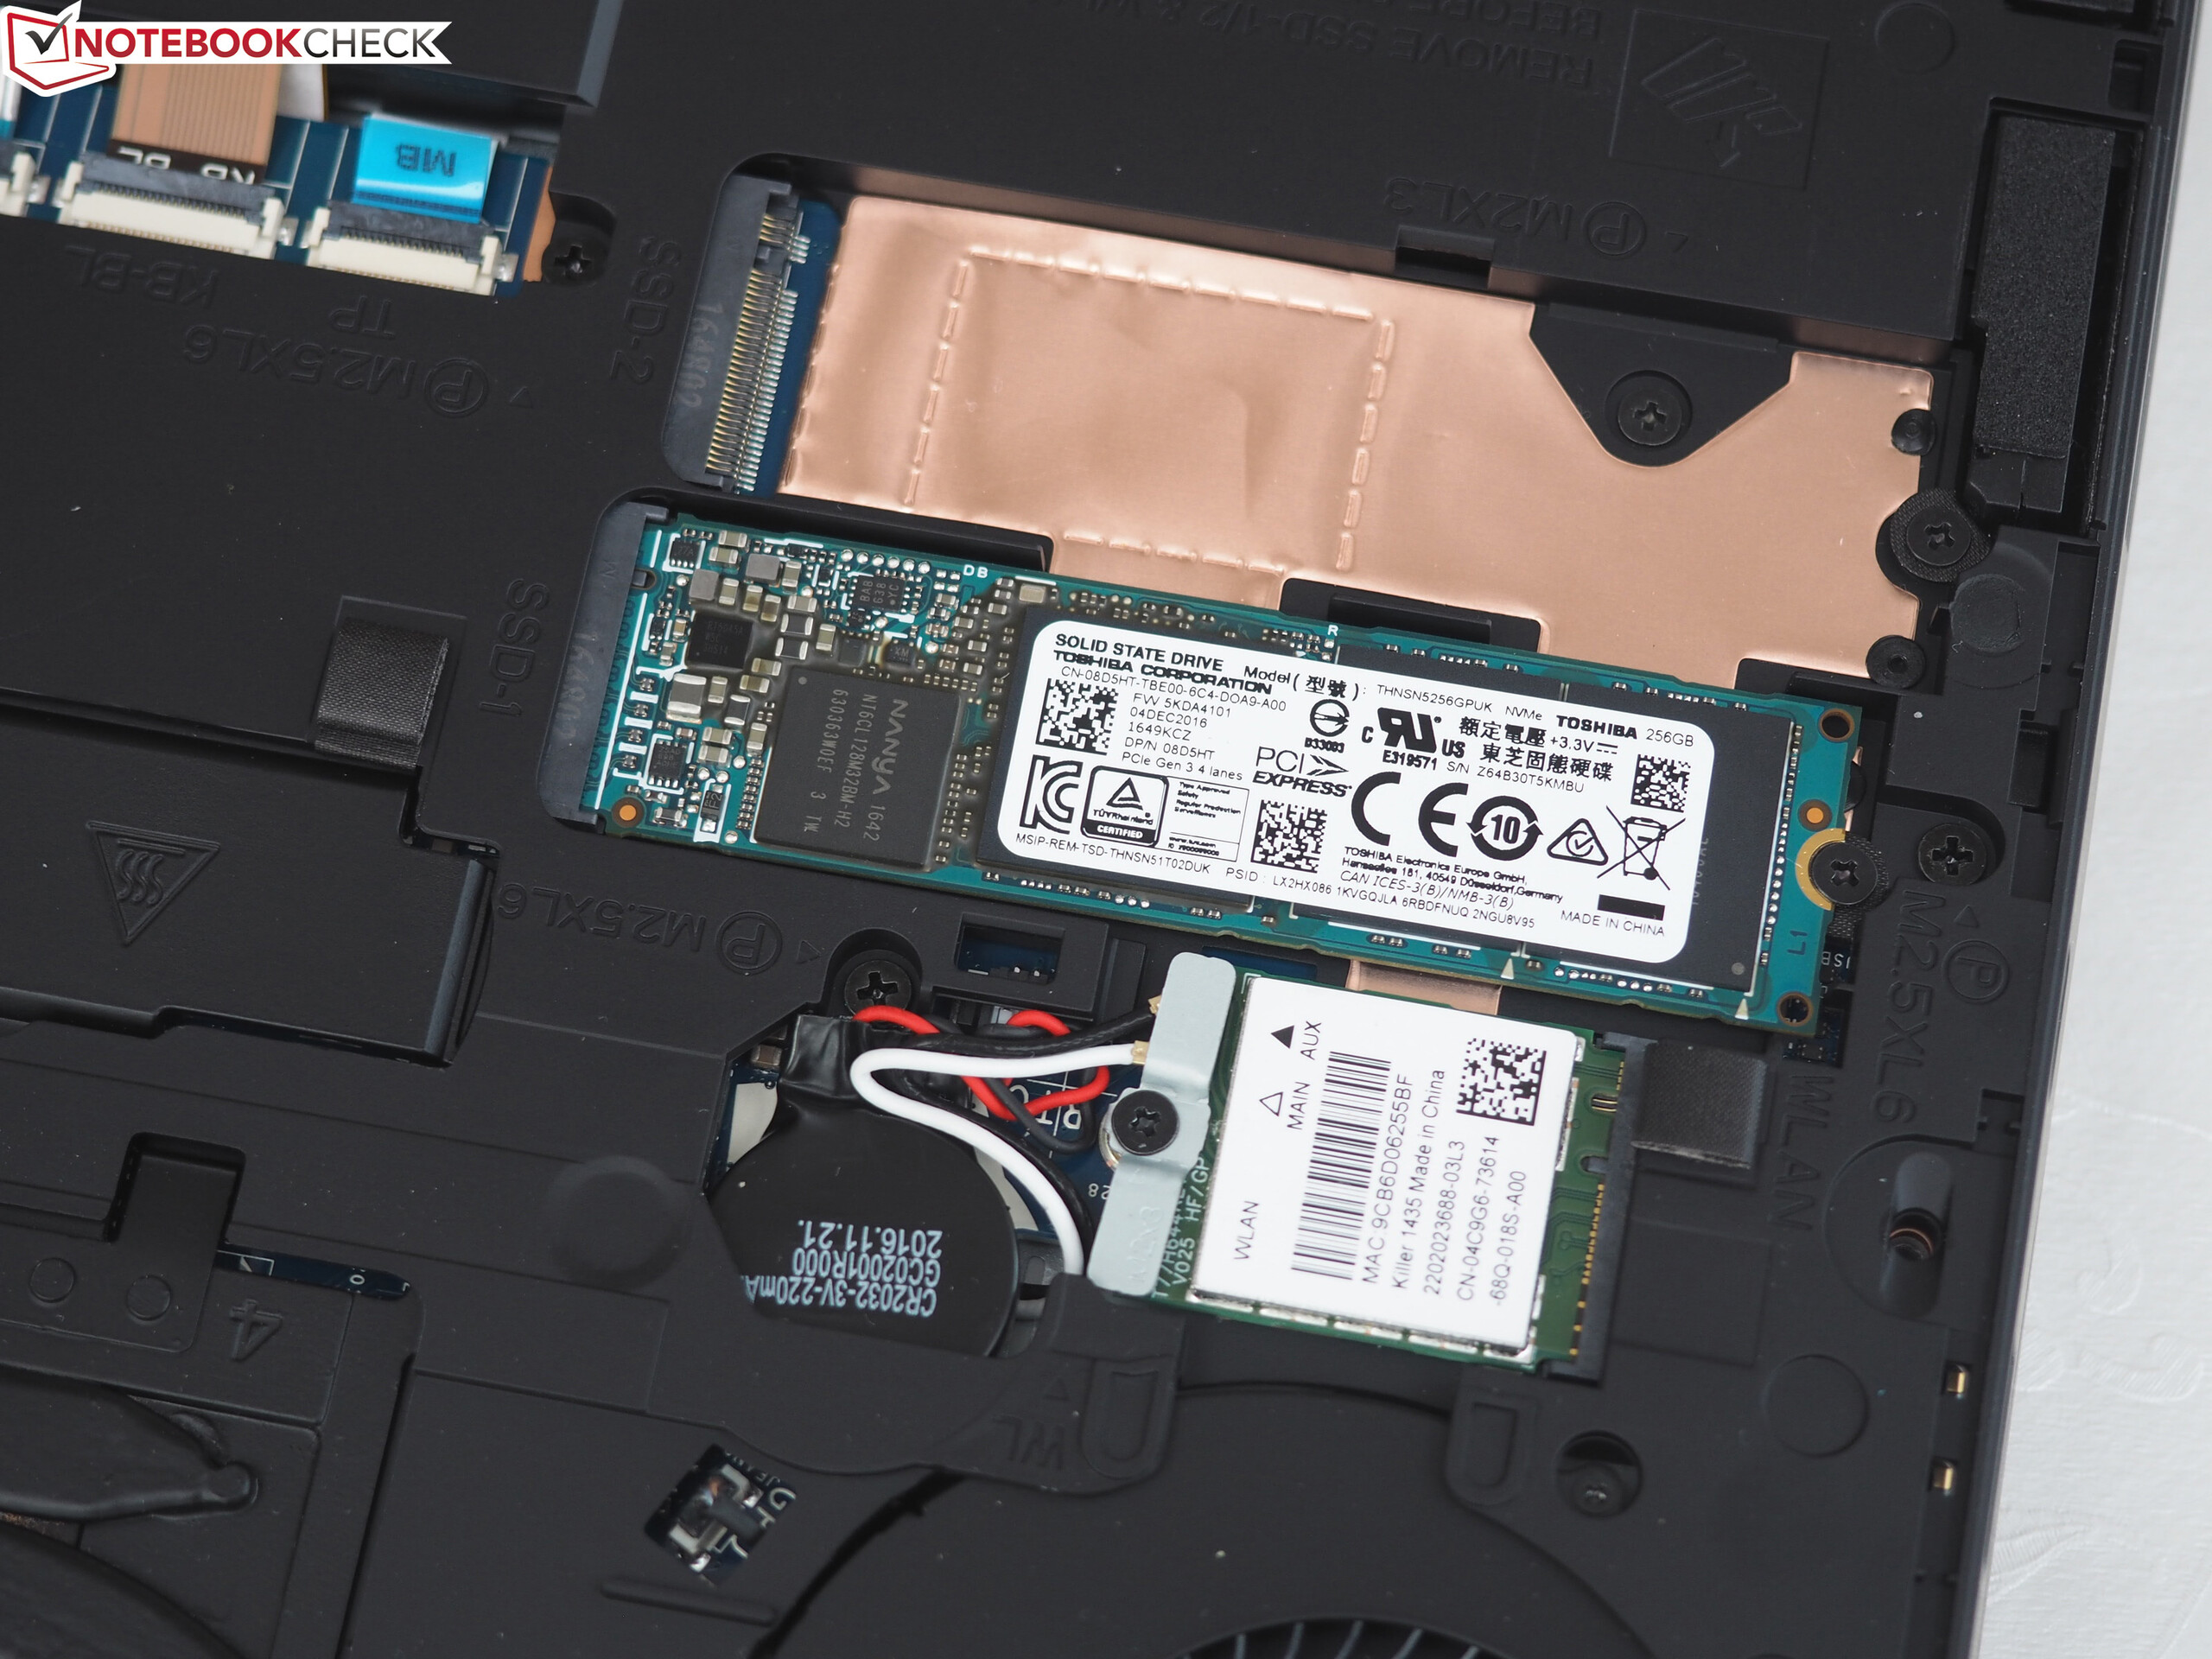
| Alienware 13 R3 Toshiba NVMe THNSN5256GPUK | Razer Blade (2016) Samsung PM951 NVMe MZVLV512 | MSI GS43VR 6RE-006US SanDisk SD8SN8U1T001122 | Schenker XMG P406 Samsung SM951 MZHPV256HDGL m.2 PCI-e | Aorus X3 Plus v5 Samsung SM951 MZVPV512HDGL m.2 PCI-e | |
|---|---|---|---|---|---|
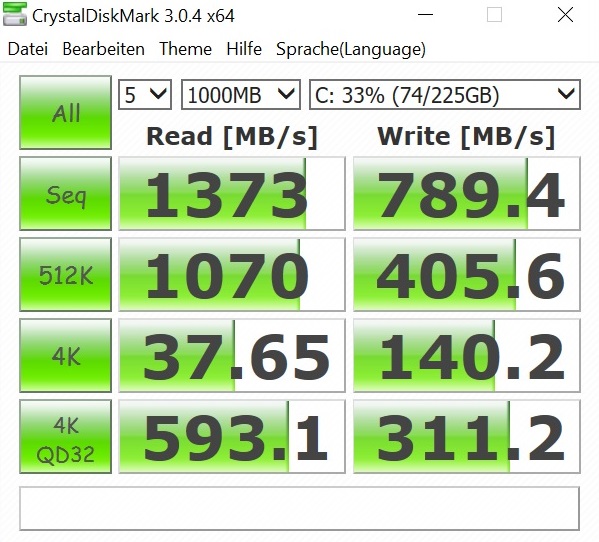
| CrystalDiskMark 3.0 | 5% | -62% | 31% | 57% | |
| Read Seq (MB/s) | 1373 | 1296 -6% | 335.3 -76% | 1634 19% | 1529 11% |
| Write Seq (MB/s) | 789 | 603 -24% | 299 -62% | 1290 63% | 1565 98% |
| Read 512 (MB/s) | 1070 | 655 -39% | 223 -79% | 1149 7% | 929 -13% |
| Write 512 (MB/s) | 405.6 | 604 49% | 246.7 -39% | 1285 217% | 1536 279% |
| Read 4k (MB/s) | 37.65 | 42.22 12% | 17.68 -53% | 43.82 16% | 51.7 37% |
| Write 4k (MB/s) | 140.2 | 139.6 0% | 35.31 -75% | 110.3 -21% | 147.2 5% |
| Read 4k QD32 (MB/s) | 593 | 573 -3% | 247.4 -58% | 320.5 -46% | 636 7% |
| Write 4k QD32 (MB/s) | 311.2 | 480 54% | 156.3 -50% | 287.3 -8% | 421.4 35% |

| 3DMark | |
| 2560x1440 Time Spy Graphics | |
| Alienware 13 R3 | |
| 1920x1080 Fire Strike Graphics | |
| MSI GS43VR 6RE-006US | |
| Alienware 13 R3 | |
| Razer Blade (2016) | |
| Schenker XMG P406 | |
| Aorus X3 Plus v5 | |
| 3DMark 11 - 1280x720 Performance GPU | |
| MSI GS43VR 6RE-006US | |
| Alienware 13 R3 | |
| Razer Blade (2016) | |
| Schenker XMG P406 | |
| Aorus X3 Plus v5 | |
| Unigine Heaven 4.0 - Extreme Preset DX11 | |
| Alienware 13 R3 | |
| 3DMark 11 Performance | 12319 poäng | |
| 3DMark Cloud Gate Standard Score | 21924 poäng | |
| 3DMark Fire Strike Score | 9584 poäng | |
| 3DMark Time Spy Score | 3630 poäng | |
Hjälp | ||
| The Division | |
| 1920x1080 Ultra Preset AF:16x | |
| Alienware 13 R3 | |
| Razer Blade (2016) FHD | |
| 1920x1080 High Preset AF:8x | |
| Alienware 13 R3 | |
| Razer Blade (2016) FHD | |
| XCOM 2 | |
| 1920x1080 Maximum Preset (8xMSAA instead of FXAA) AA:8xMS AF:16x | |
| Alienware 13 R3 | |
| Razer Blade (2016) FHD | |
| 1920x1080 High Preset AA:FX AF:8x | |
| Alienware 13 R3 | |
| Razer Blade (2016) FHD | |
| Battlefield 1 | |
| 1920x1080 Ultra Preset AA:T | |
| Alienware 13 R3 | |
| 1920x1080 High Preset AA:T | |
| Alienware 13 R3 | |
| Mirror's Edge Catalyst | |
| 1920x1080 Ultra Preset AF:16x | |
| Alienware 13 R3 | |
| 1920x1080 High Preset AF:16x | |
| Alienware 13 R3 | |
| Resident Evil 7 | |
| 1920x1080 Very High / On AA:FXAA+T | |
| Alienware 13 R3 | |
| 1920x1080 High / On AA:FXAA+T | |
| Alienware 13 R3 | |
| Watch Dogs 2 | |
| 1920x1080 Ultra Preset | |
| Alienware 13 R3 | |
| 1920x1080 High Preset | |
| Alienware 13 R3 | |
| Call of Duty Infinite Warfare | |
| 1920x1080 Ultra / On AA:T2X SM | |
| Alienware 13 R3 | |
| 1920x1080 High / On AA:FX | |
| Alienware 13 R3 | |
| Mafia 3 - 1920x1080 High Preset | |
| Alienware 13 R3 | |
| låg | med. | hög | ultra | |
|---|---|---|---|---|
| XCOM 2 (2016) | 56.8 | 29.1 | ||
| The Division (2016) | 67.4 | 52.2 | ||
| Need for Speed 2016 (2016) | 80 | 63.1 | ||
| Mirror's Edge Catalyst (2016) | 69.7 | 63.9 | ||
| Mafia 3 (2016) | 40.1 | |||
| Battlefield 1 (2016) | 77.7 | 72.9 | ||
| Farming Simulator 17 (2016) | 144 | 139 | ||
| Call of Duty Infinite Warfare (2016) | 94.7 | 84.4 | ||
| Watch Dogs 2 (2016) | 58.1 | 41.7 | ||
| Resident Evil 7 (2017) | 101 | 82 |
Ljudnivå
| Låg belastning |
| 29 / 30 / 31 dB(A) |
| Hög belastning |
| 36 / 49 dB(A) |
 | ||
30 dB tyst 40 dB(A) hörbar 50 dB(A) högt ljud |
||
min: | ||
| Alienware 13 R3 GeForce GTX 1060 Mobile, i7-7700HQ | Razer Blade (2016) GeForce GTX 1060 Mobile, 6700HQ | MSI GS43VR 6RE-006US GeForce GTX 1060 Mobile, 6700HQ | Schenker XMG P406 GeForce GTX 970M, 6700HQ | Aorus X3 Plus v5 GeForce GTX 970M, 6700HQ | |
|---|---|---|---|---|---|
| Noise | -8% | -12% | -15% | -9% | |
| av / miljö * (dB) | 29 | 30 -3% | 29.1 -0% | ||
| Idle Minimum * (dB) | 29 | 31 -7% | 32 -10% | 30 -3% | 32.1 -11% |
| Idle Average * (dB) | 30 | 33 -10% | 32 -7% | 32 -7% | 32.4 -8% |
| Idle Maximum * (dB) | 31 | 35 -13% | 33.5 -8% | 40 -29% | 32.5 -5% |
| Load Average * (dB) | 36 | 39 -8% | 50 -39% | 47 -31% | 40.1 -11% |
| Load Maximum * (dB) | 49 | 51 -4% | 51.5 -5% | 51 -4% | 54.6 -11% |
* ... mindre är bättre
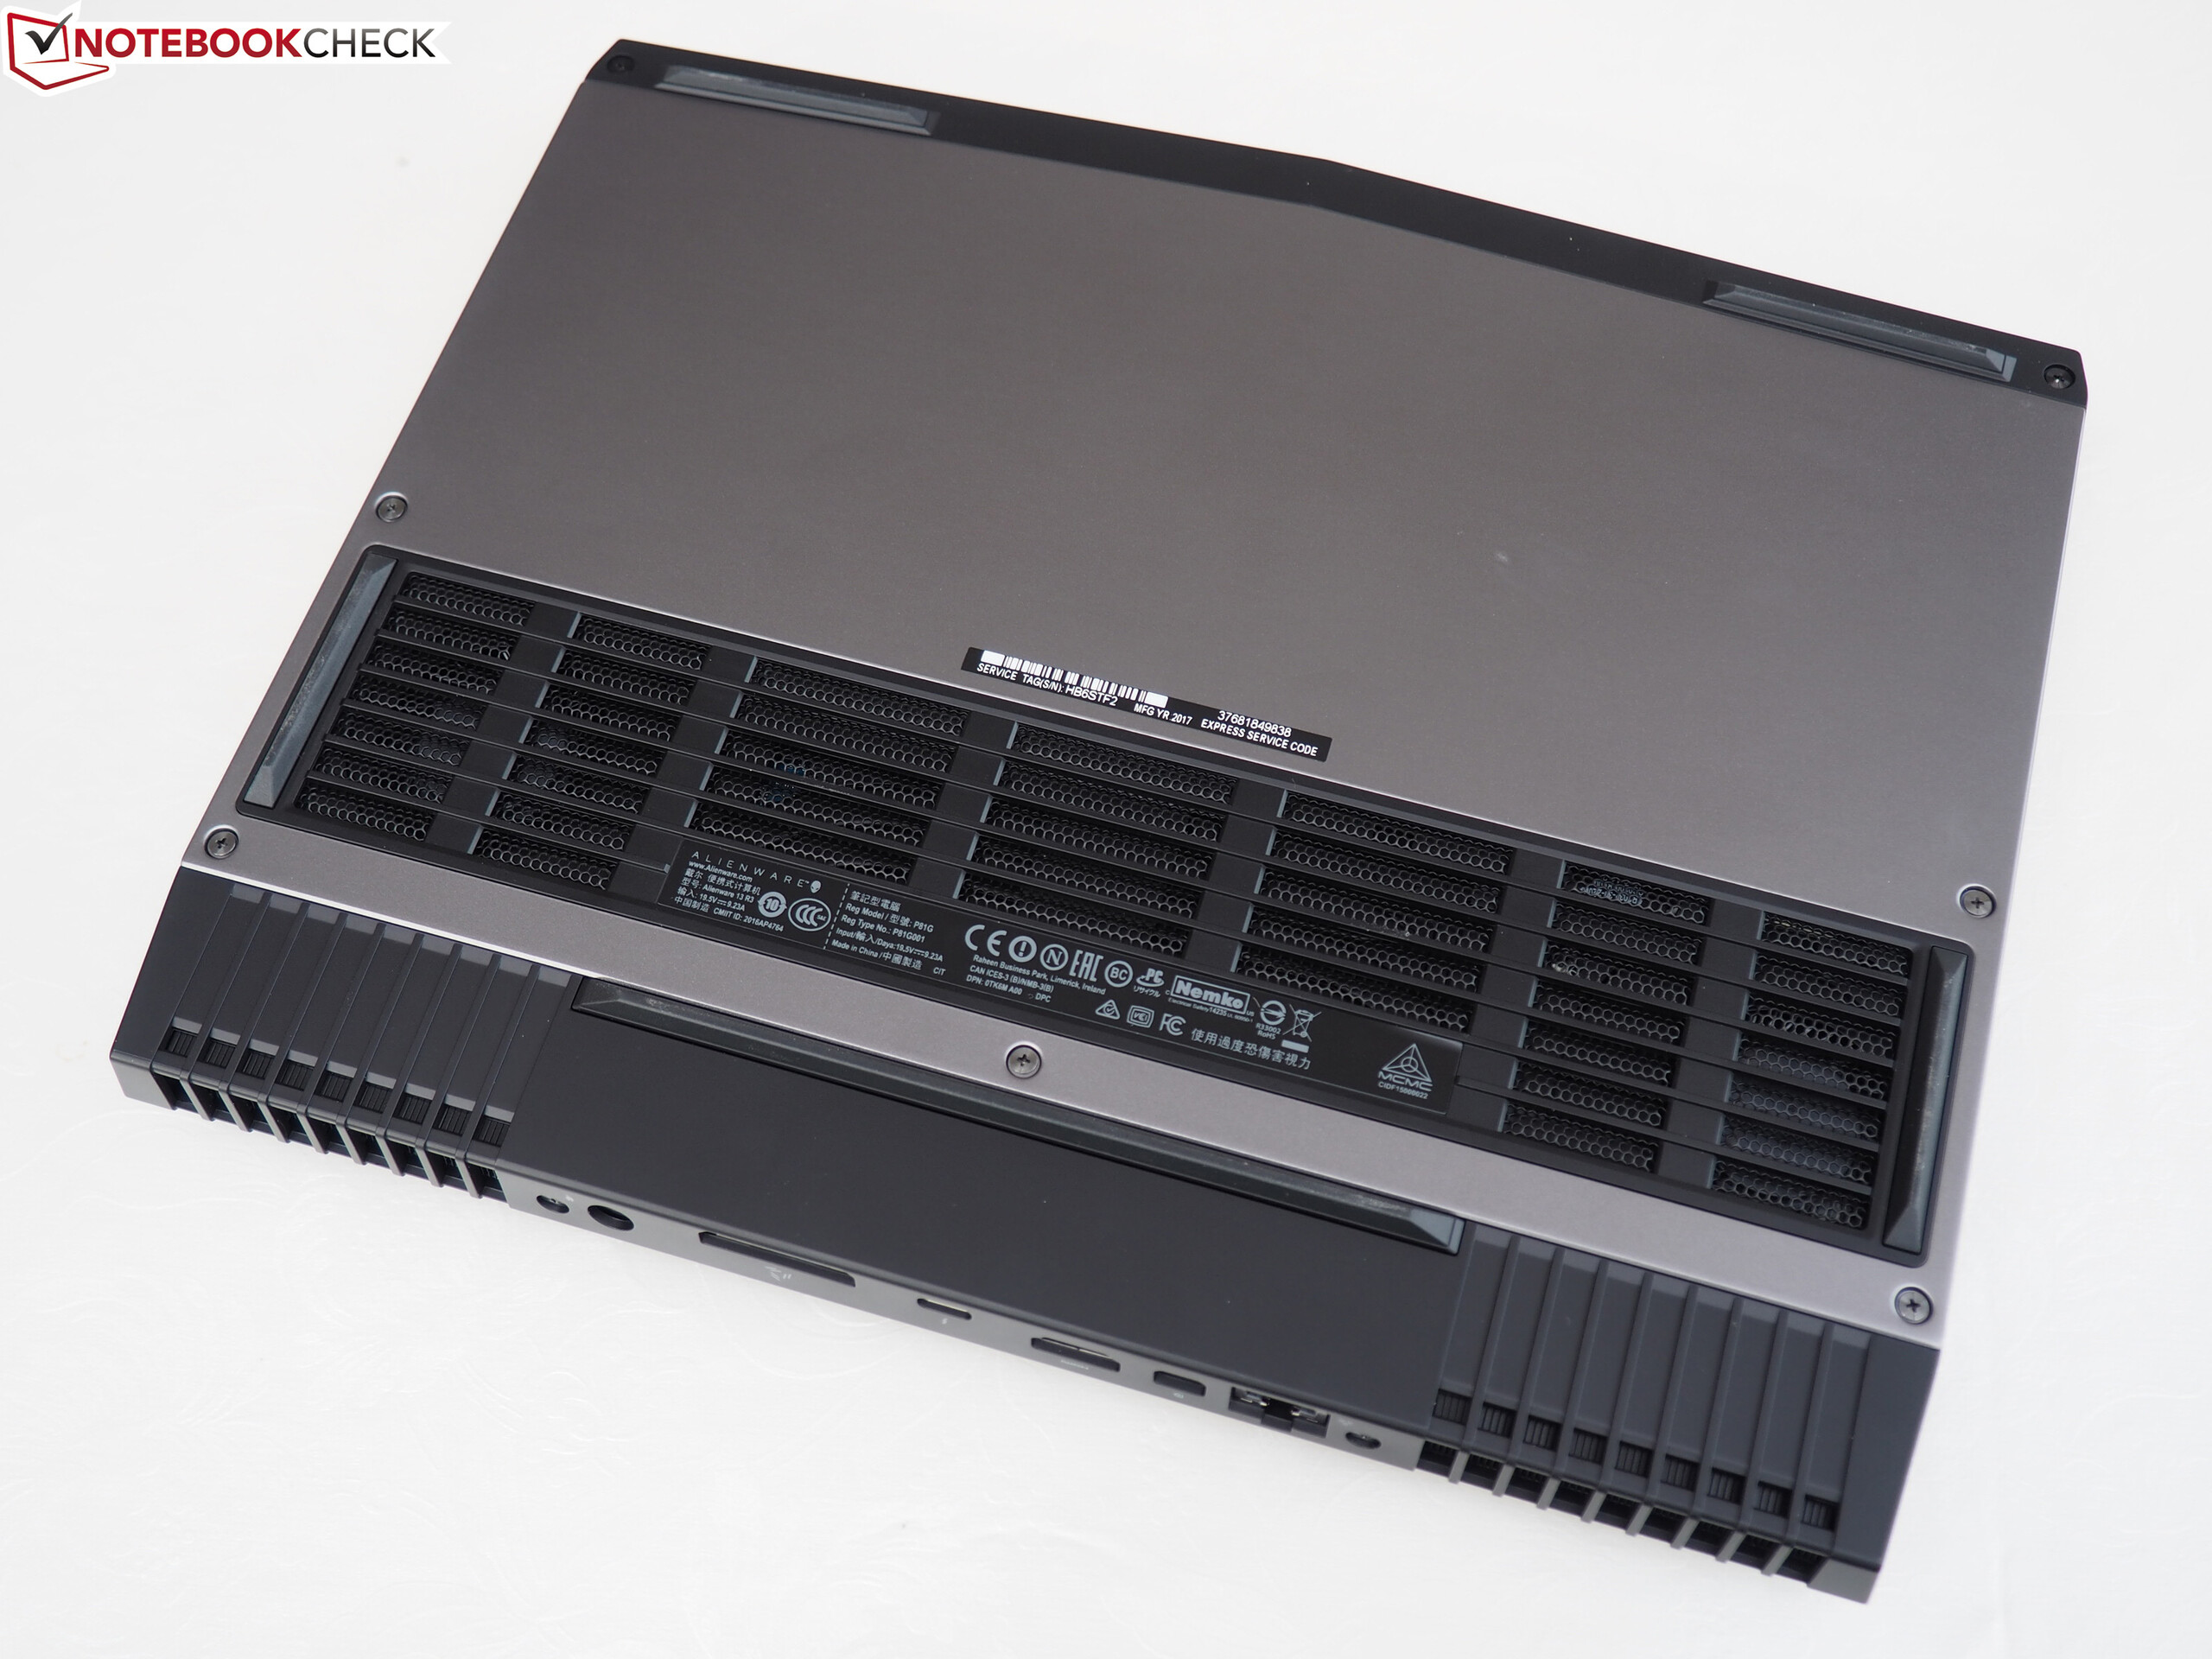
(-) Den maximala temperaturen på ovansidan är 48.8 °C / 120 F, jämfört med genomsnittet av 40.4 °C / 105 F , allt från 21.2 till 68.8 °C för klassen Gaming.
(-) Botten värms upp till maximalt 60.4 °C / 141 F, jämfört med genomsnittet av 43.2 °C / 110 F
(+) Vid tomgångsbruk är medeltemperaturen för ovansidan 28.2 °C / 83 F, jämfört med enhetsgenomsnittet på 33.9 °C / ### class_avg_f### F.
(+) Handledsstöden och pekplattan når maximal hudtemperatur (34.5 °C / 94.1 F) och är därför inte varma.
(-) Medeltemperaturen för handledsstödsområdet på liknande enheter var 28.8 °C / 83.8 F (-5.7 °C / -10.3 F).
| Alienware 13 R3 GeForce GTX 1060 Mobile, i7-7700HQ | Razer Blade (2016) GeForce GTX 1060 Mobile, 6700HQ | MSI GS43VR 6RE-006US GeForce GTX 1060 Mobile, 6700HQ | Schenker XMG P406 GeForce GTX 970M, 6700HQ | Aorus X3 Plus v5 GeForce GTX 970M, 6700HQ | |
|---|---|---|---|---|---|
| Heat | 7% | -10% | -15% | 18% | |
| Maximum Upper Side * (°C) | 48.8 | 52.7 -8% | 55.6 -14% | 55 -13% | 44.6 9% |
| Maximum Bottom * (°C) | 60.4 | 48.4 20% | 62.4 -3% | 58.7 3% | 49.8 18% |
| Idle Upper Side * (°C) | 33.1 | 29.3 11% | 33.2 -0% | 36.9 -11% | 24.8 25% |
| Idle Bottom * (°C) | 30.1 | 28.4 6% | 37.2 -24% | 41.7 -39% | 24.8 18% |
* ... mindre är bättre
Alienware 13 R3 ljudanalys
(±) | högtalarljudstyrkan är genomsnittlig men bra (79 dB)
Bas 100 - 315 Hz
(±) | reducerad bas - i genomsnitt 14.8% lägre än medianen
(±) | linjäriteten för basen är genomsnittlig (10% delta till föregående frekvens)
Mellan 400 - 2000 Hz
(+) | balanserad mellan - endast 3.8% från medianen
(+) | mids är linjära (6.2% delta till föregående frekvens)
Högsta 2 - 16 kHz
(+) | balanserade toppar - endast 3.6% från medianen
(+) | toppar är linjära (6.9% delta till föregående frekvens)
Totalt 100 - 16 000 Hz
(±) | linjäriteten för det totala ljudet är genomsnittlig (18.4% skillnad mot median)
Jämfört med samma klass
» 59% av alla testade enheter i den här klassen var bättre, 9% liknande, 32% sämre
» Den bästa hade ett delta på 6%, genomsnittet var 18%, sämst var 132%
Jämfört med alla testade enheter
» 41% av alla testade enheter var bättre, 8% liknande, 51% sämre
» Den bästa hade ett delta på 4%, genomsnittet var 23%, sämst var 134%
Razer Blade (2016) ljudanalys
(±) | högtalarljudstyrkan är genomsnittlig men bra (79 dB)
Bas 100 - 315 Hz
(±) | reducerad bas - i genomsnitt 8.4% lägre än medianen
(±) | linjäriteten för basen är genomsnittlig (11.2% delta till föregående frekvens)
Mellan 400 - 2000 Hz
(+) | balanserad mellan - endast 4.6% från medianen
(+) | mids är linjära (4.3% delta till föregående frekvens)
Högsta 2 - 16 kHz
(+) | balanserade toppar - endast 4.3% från medianen
(+) | toppar är linjära (5.5% delta till föregående frekvens)
Totalt 100 - 16 000 Hz
(±) | linjäriteten för det totala ljudet är genomsnittlig (17.1% skillnad mot median)
Jämfört med samma klass
» 46% av alla testade enheter i den här klassen var bättre, 12% liknande, 43% sämre
» Den bästa hade ett delta på 6%, genomsnittet var 18%, sämst var 132%
Jämfört med alla testade enheter
» 31% av alla testade enheter var bättre, 8% liknande, 61% sämre
» Den bästa hade ett delta på 4%, genomsnittet var 23%, sämst var 134%
| Av/Standby | |
| Låg belastning | |
| Hög belastning |
|
Förklaring:
min: | |
| Alienware 13 R3 GeForce GTX 1060 Mobile, i7-7700HQ | Razer Blade (2016) GeForce GTX 1060 Mobile, 6700HQ | MSI GS43VR 6RE-006US GeForce GTX 1060 Mobile, 6700HQ | Schenker XMG P406 GeForce GTX 970M, 6700HQ | Aorus X3 Plus v5 GeForce GTX 970M, 6700HQ | |
|---|---|---|---|---|---|
| Power Consumption | -8% | -36% | -30% | ||
| Idle Minimum * (Watt) | 7 | 9 -29% | 12.1 -73% | 12 -71% | |
| Idle Average * (Watt) | 12 | 14 -17% | 19 -58% | 16 -33% | |
| Idle Maximum * (Watt) | 18 | 22 -22% | 19.5 -8% | 22 -22% | |
| Load Average * (Watt) | 76 | 72 5% | 106.7 -40% | 90 -18% | |
| Load Maximum * (Watt) | 161 | 124 23% | 159 1% | 170 -6% |
* ... mindre är bättre
| Alienware 13 R3 GeForce GTX 1060 Mobile, i7-7700HQ, 76 Wh | Razer Blade (2016) GeForce GTX 1060 Mobile, 6700HQ, 70 Wh | MSI GS43VR 6RE-006US GeForce GTX 1060 Mobile, 6700HQ, 61 Wh | Schenker XMG P406 GeForce GTX 970M, 6700HQ, 45 Wh | Aorus X3 Plus v5 GeForce GTX 970M, 6700HQ, 73 Wh | |
|---|---|---|---|---|---|
| Batteridrifttid | -23% | -7% | -35% | -17% | |
| Reader / Idle (h) | 8.7 | 9.6 10% | 4.6 -47% | 8 -8% | |
| H.264 (h) | 6 | ||||
| WiFi v1.3 (h) | 5.3 | 4.1 -23% | 4.4 -17% | 3.3 -38% | 5.1 -4% |
| Load (h) | 1.5 | 1.3 -13% | 1.2 -20% | 0.9 -40% |
För
Emot
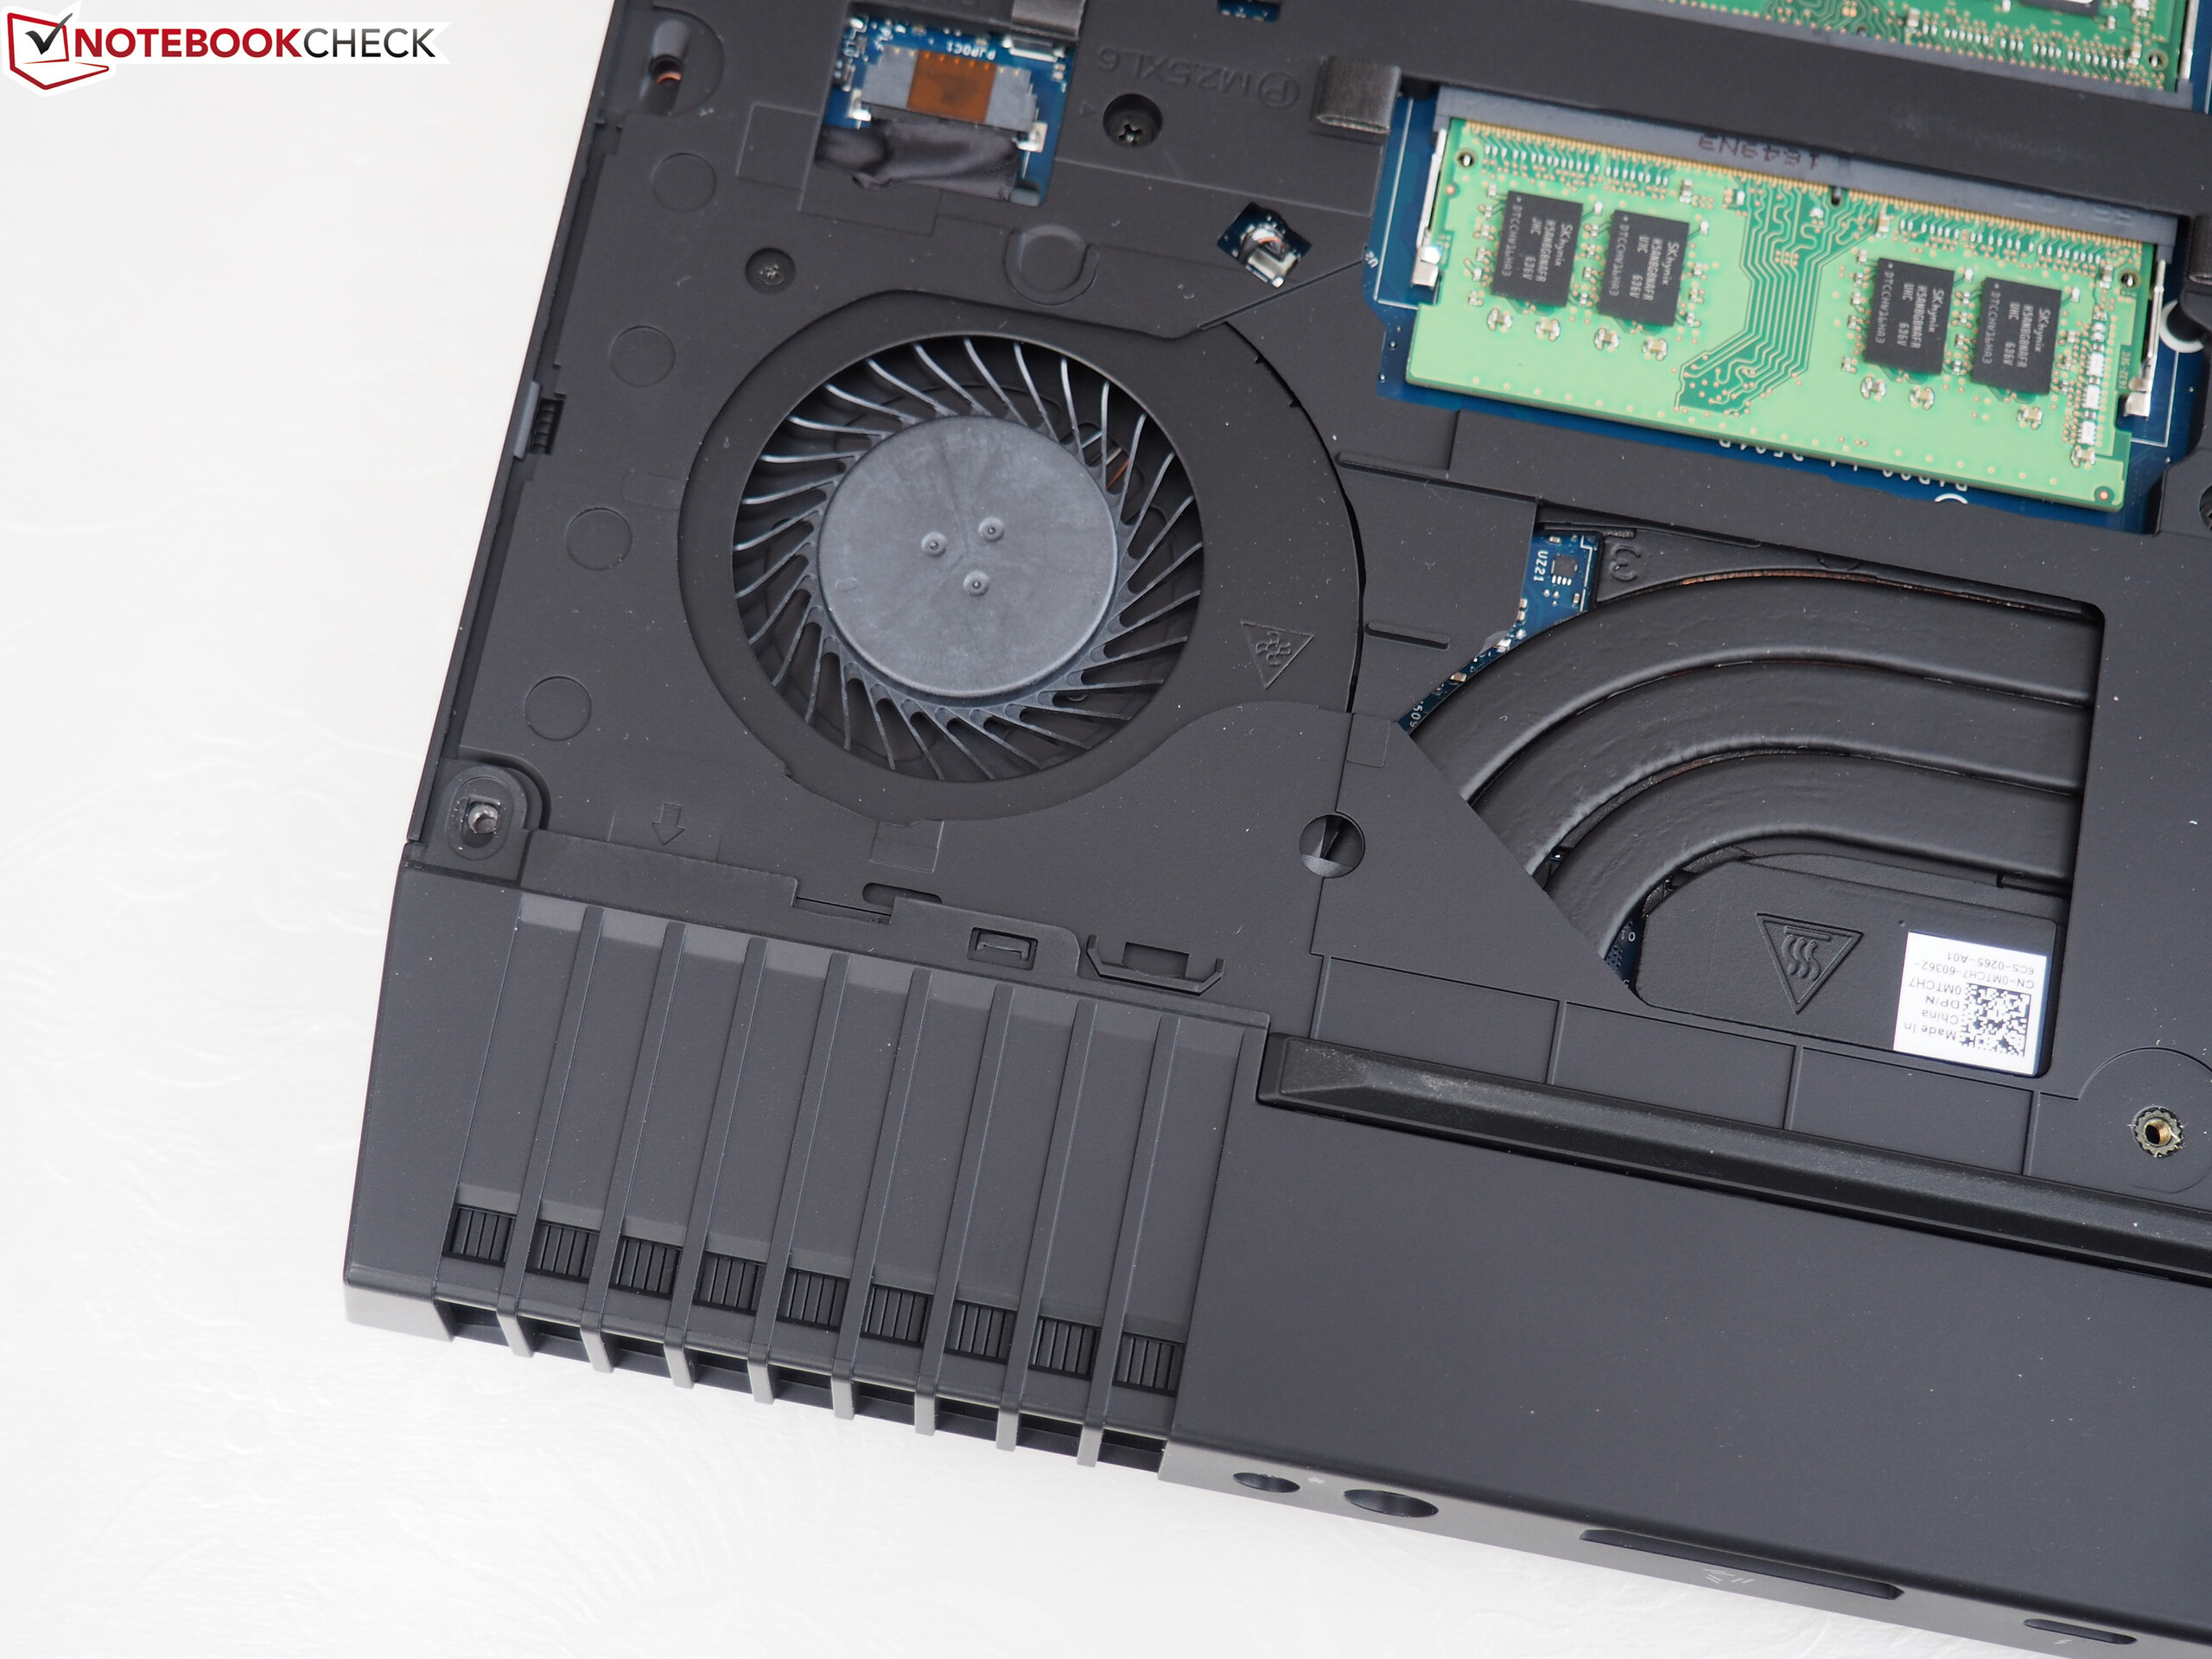
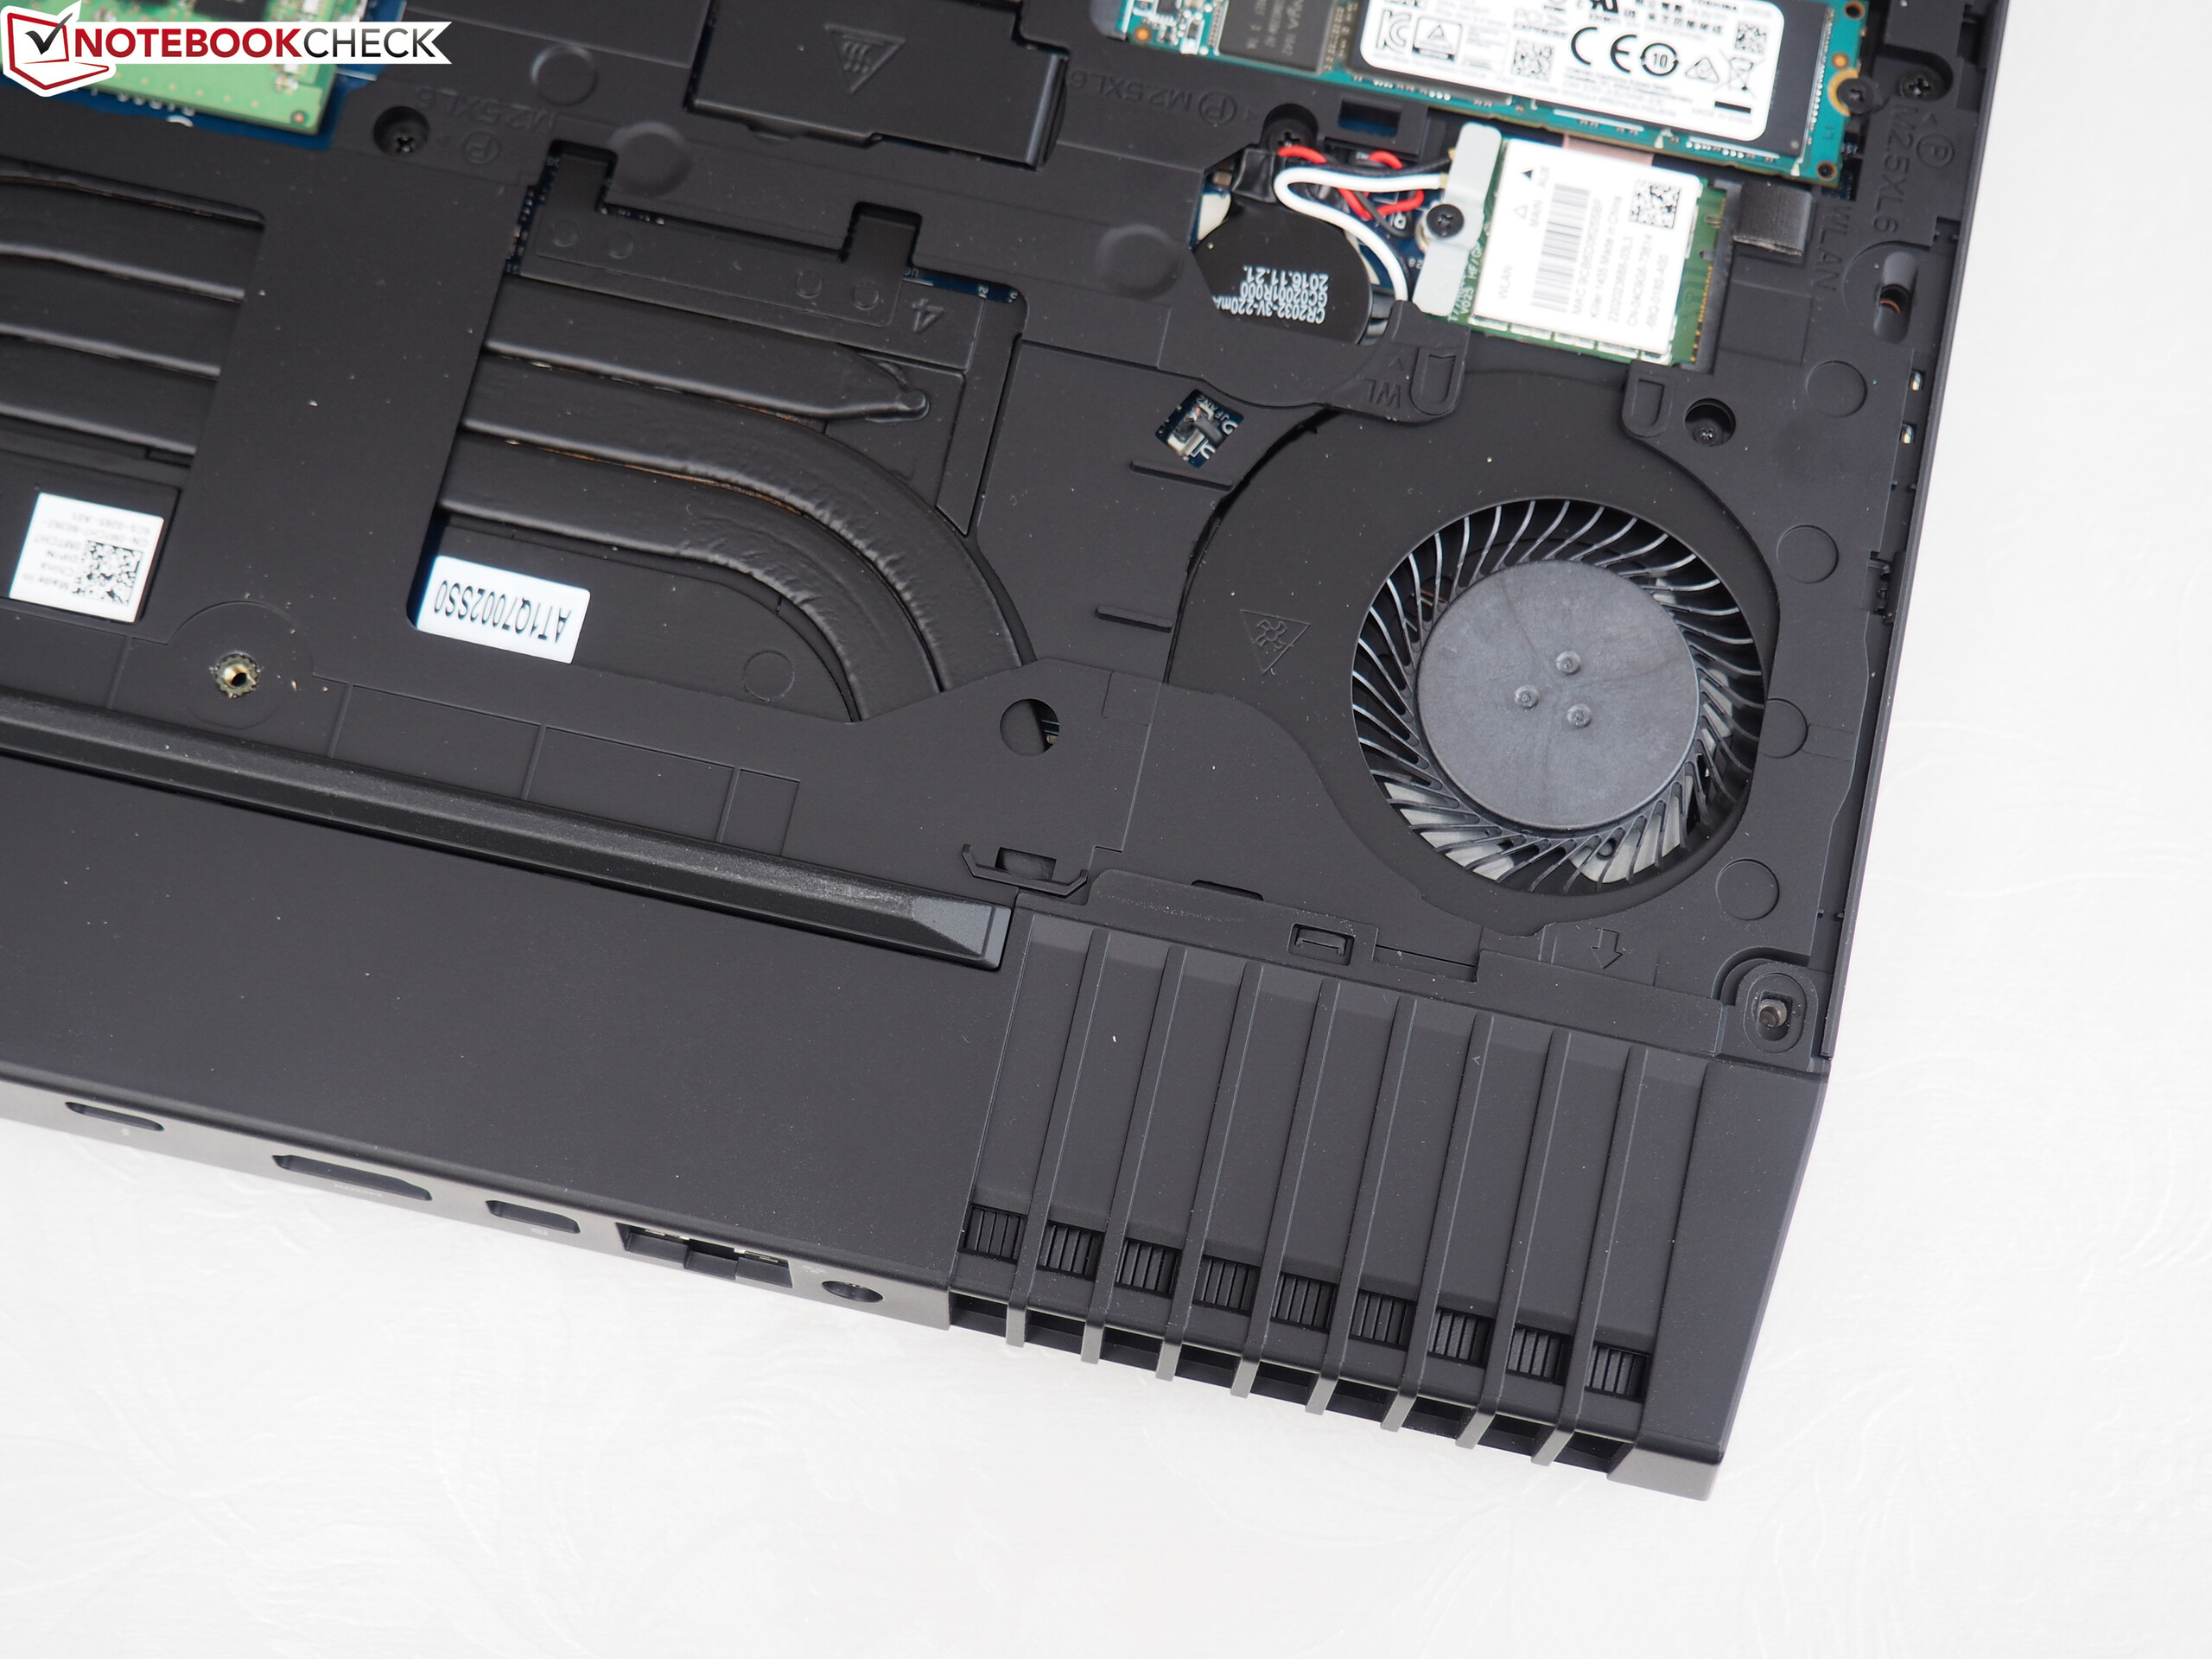
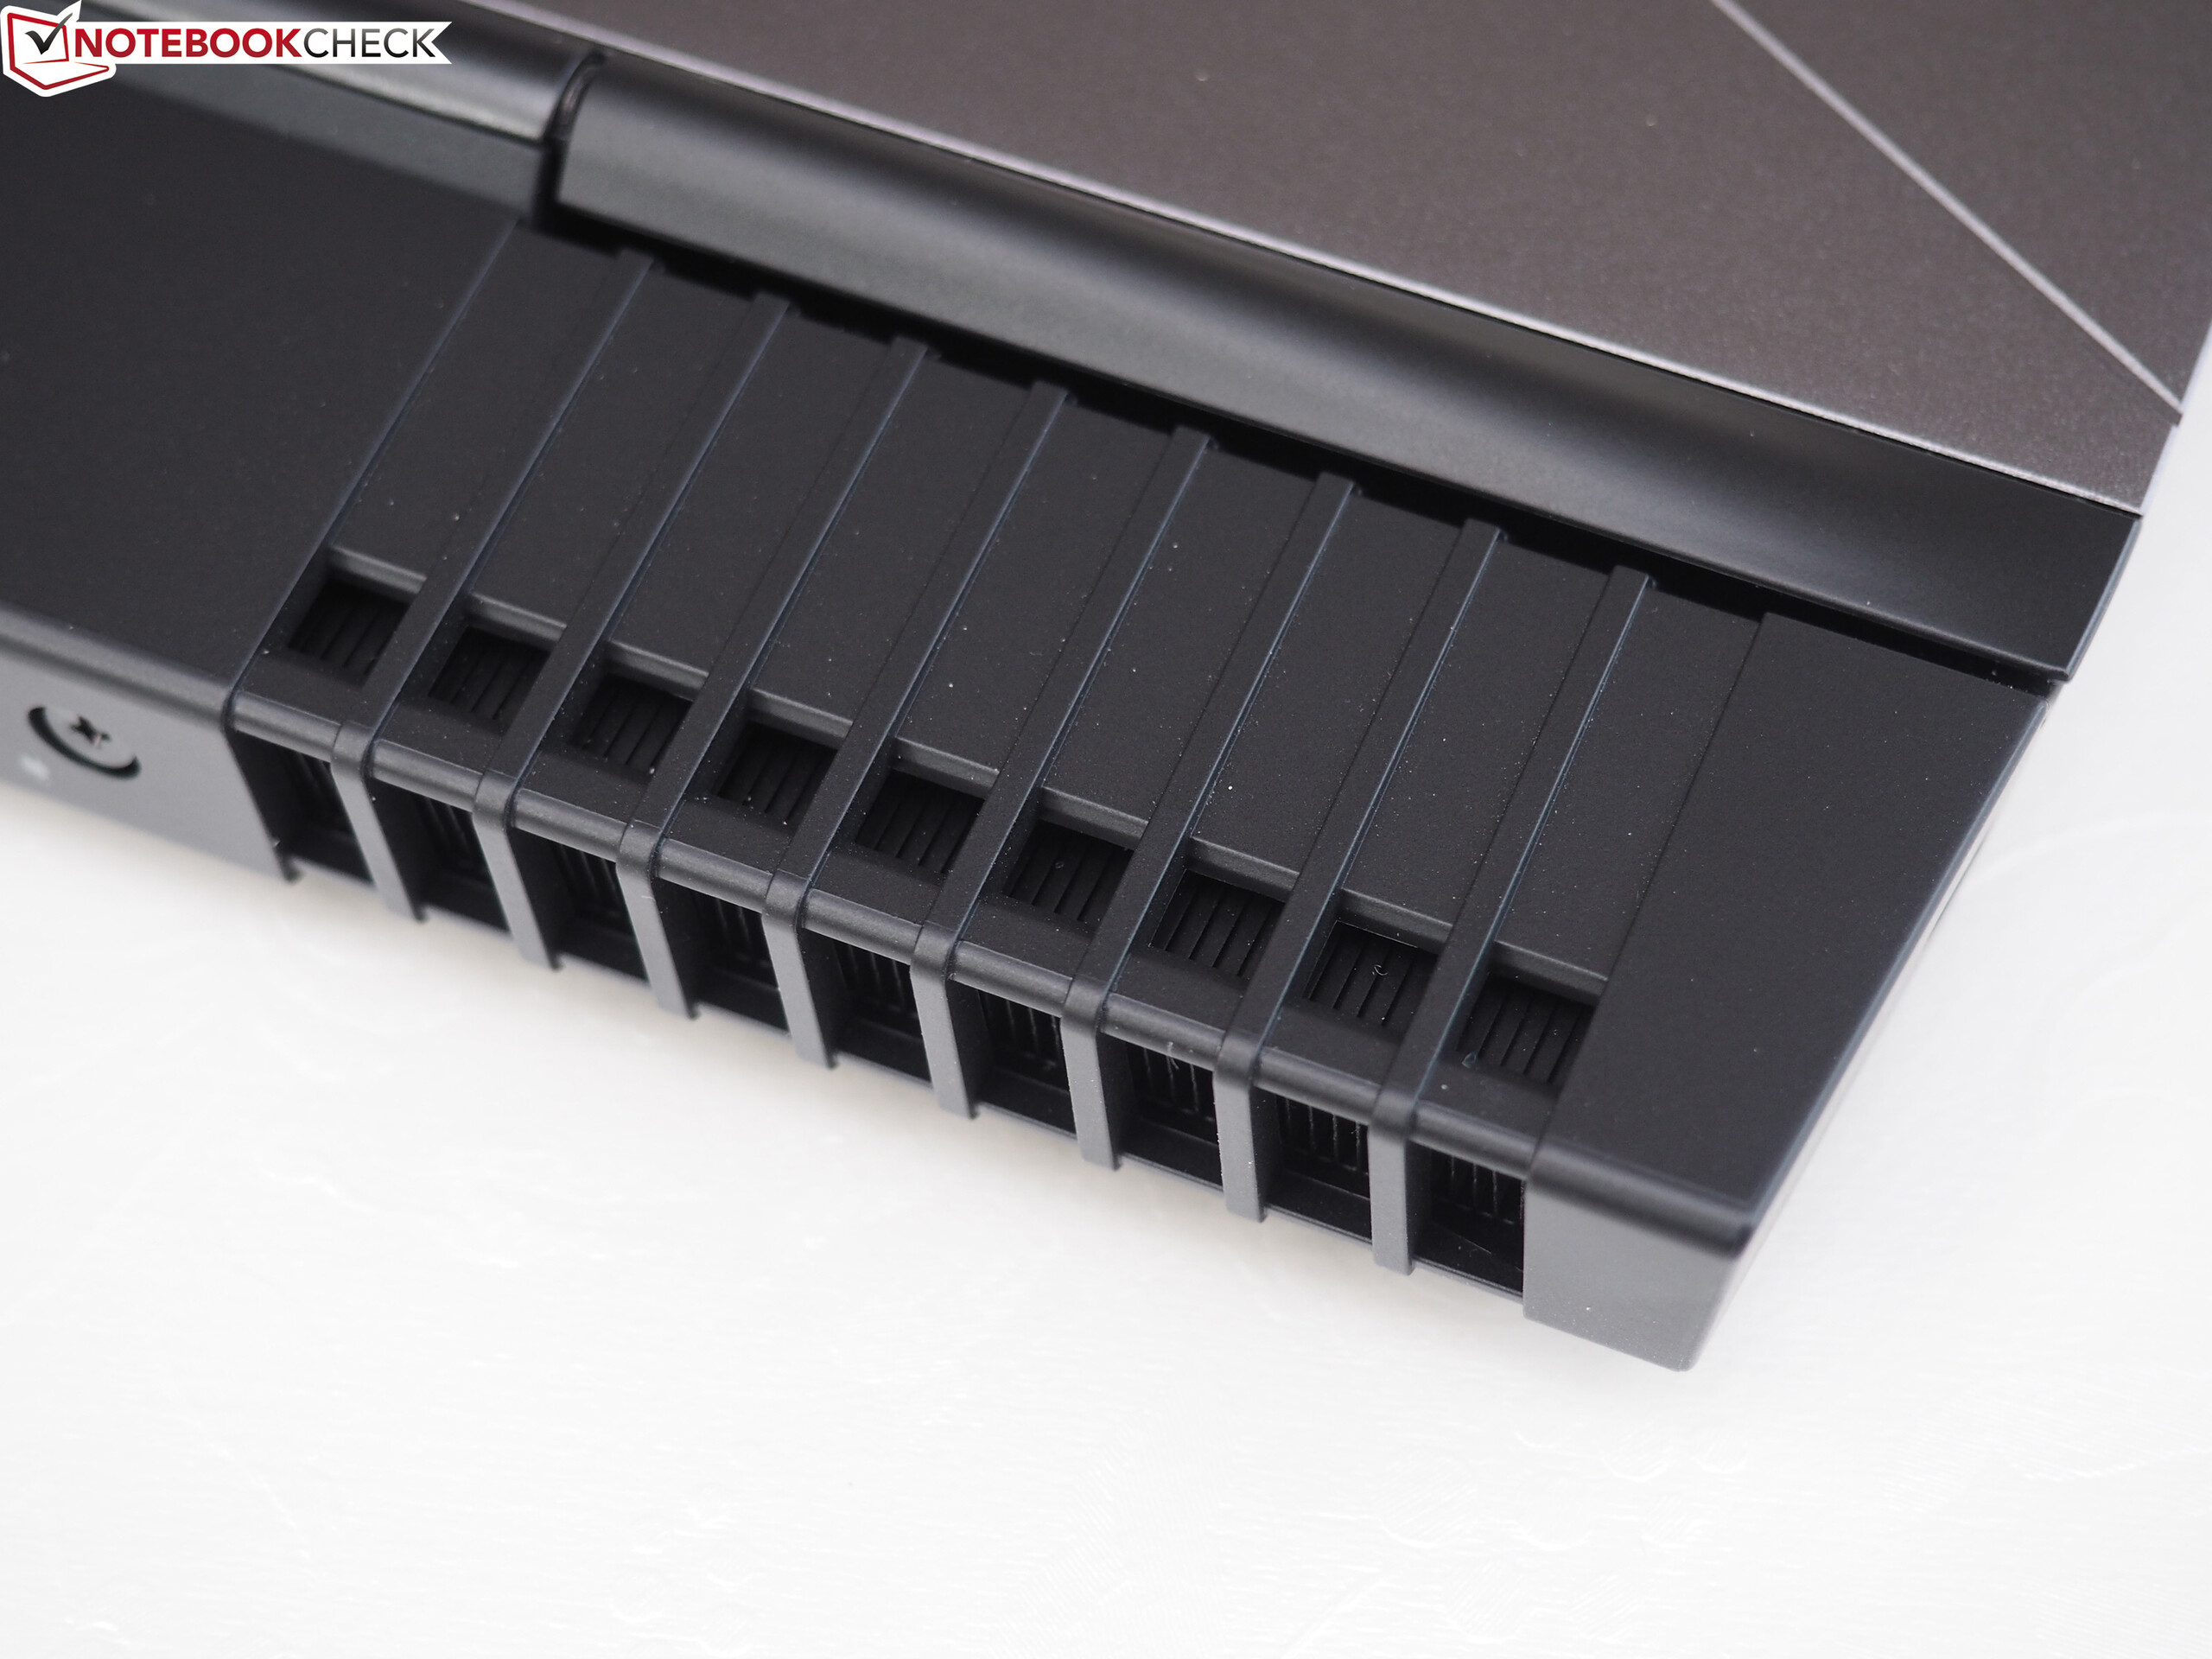
Although the test model of the larger Alienware 15 R3 had problems with the cooling performance (fluctuating and very high CPU temperatures, unnecessary fan pulsating while idling, high noise development under load), the test sample of the more compact 13-inch system did not have any problems. Sure, the Alienware 13 R3 can also be pretty hot and loud in extreme scenarios, but the system is otherwise conveniently quiet and cool.
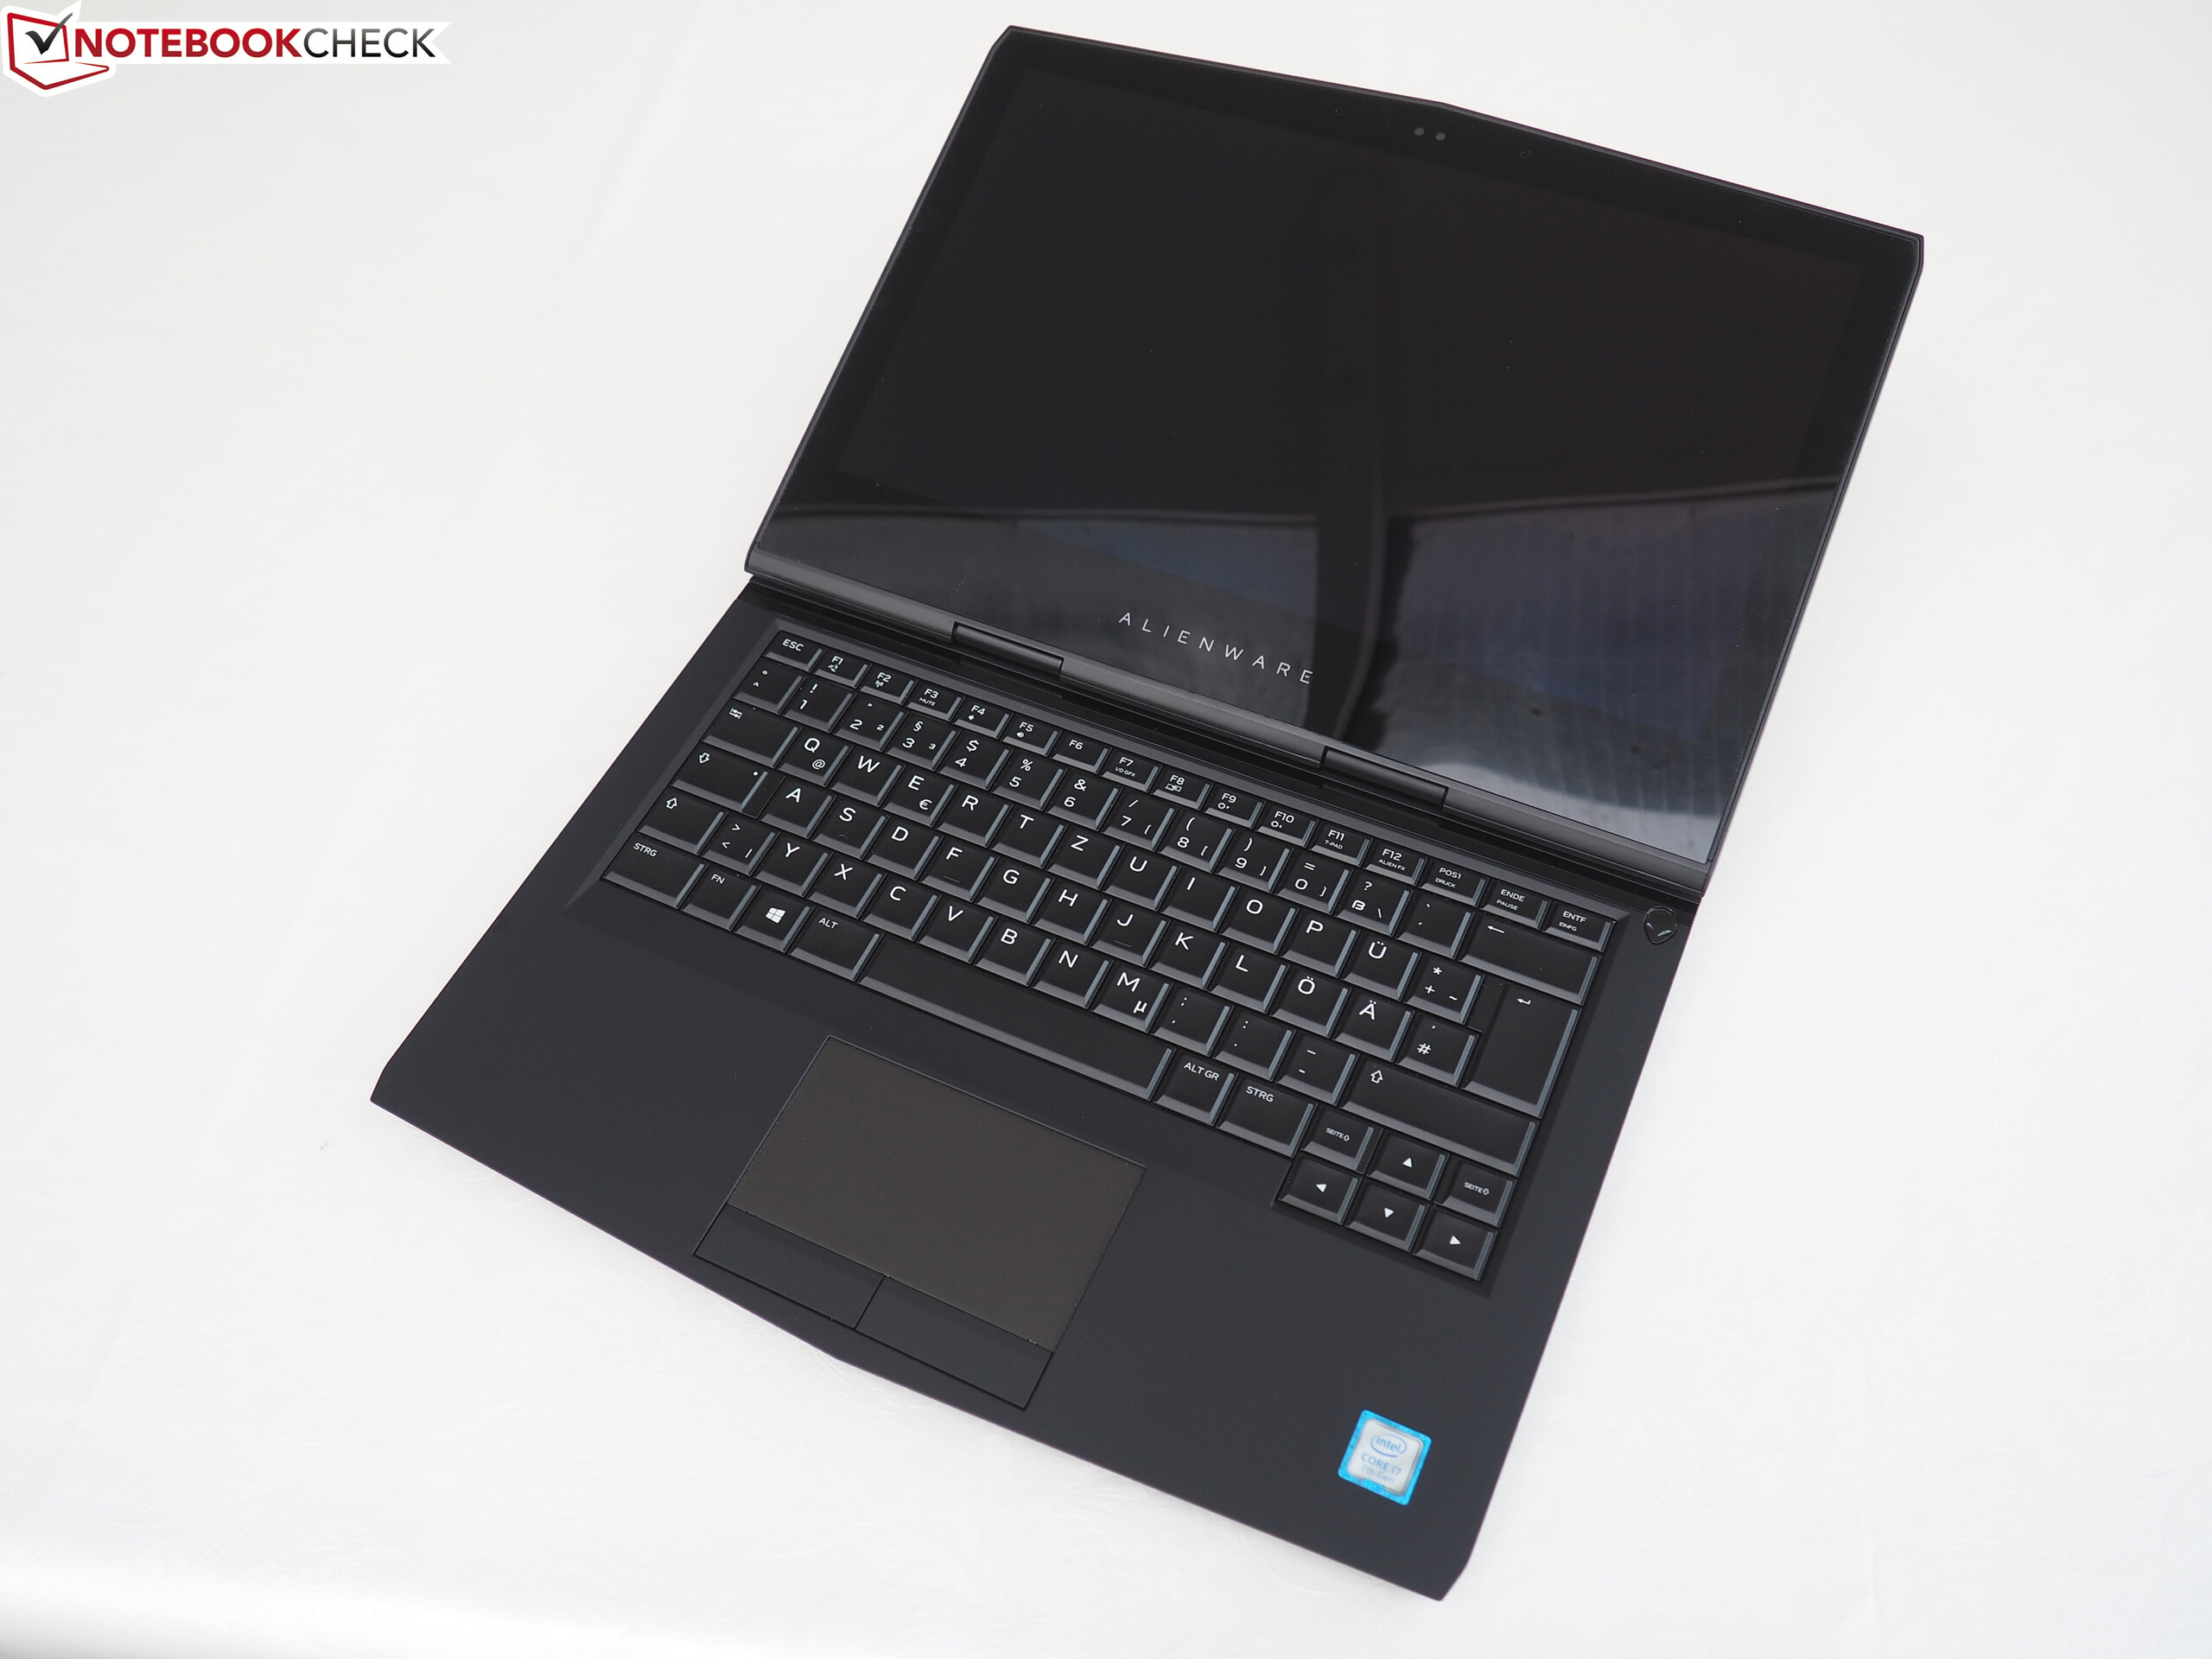
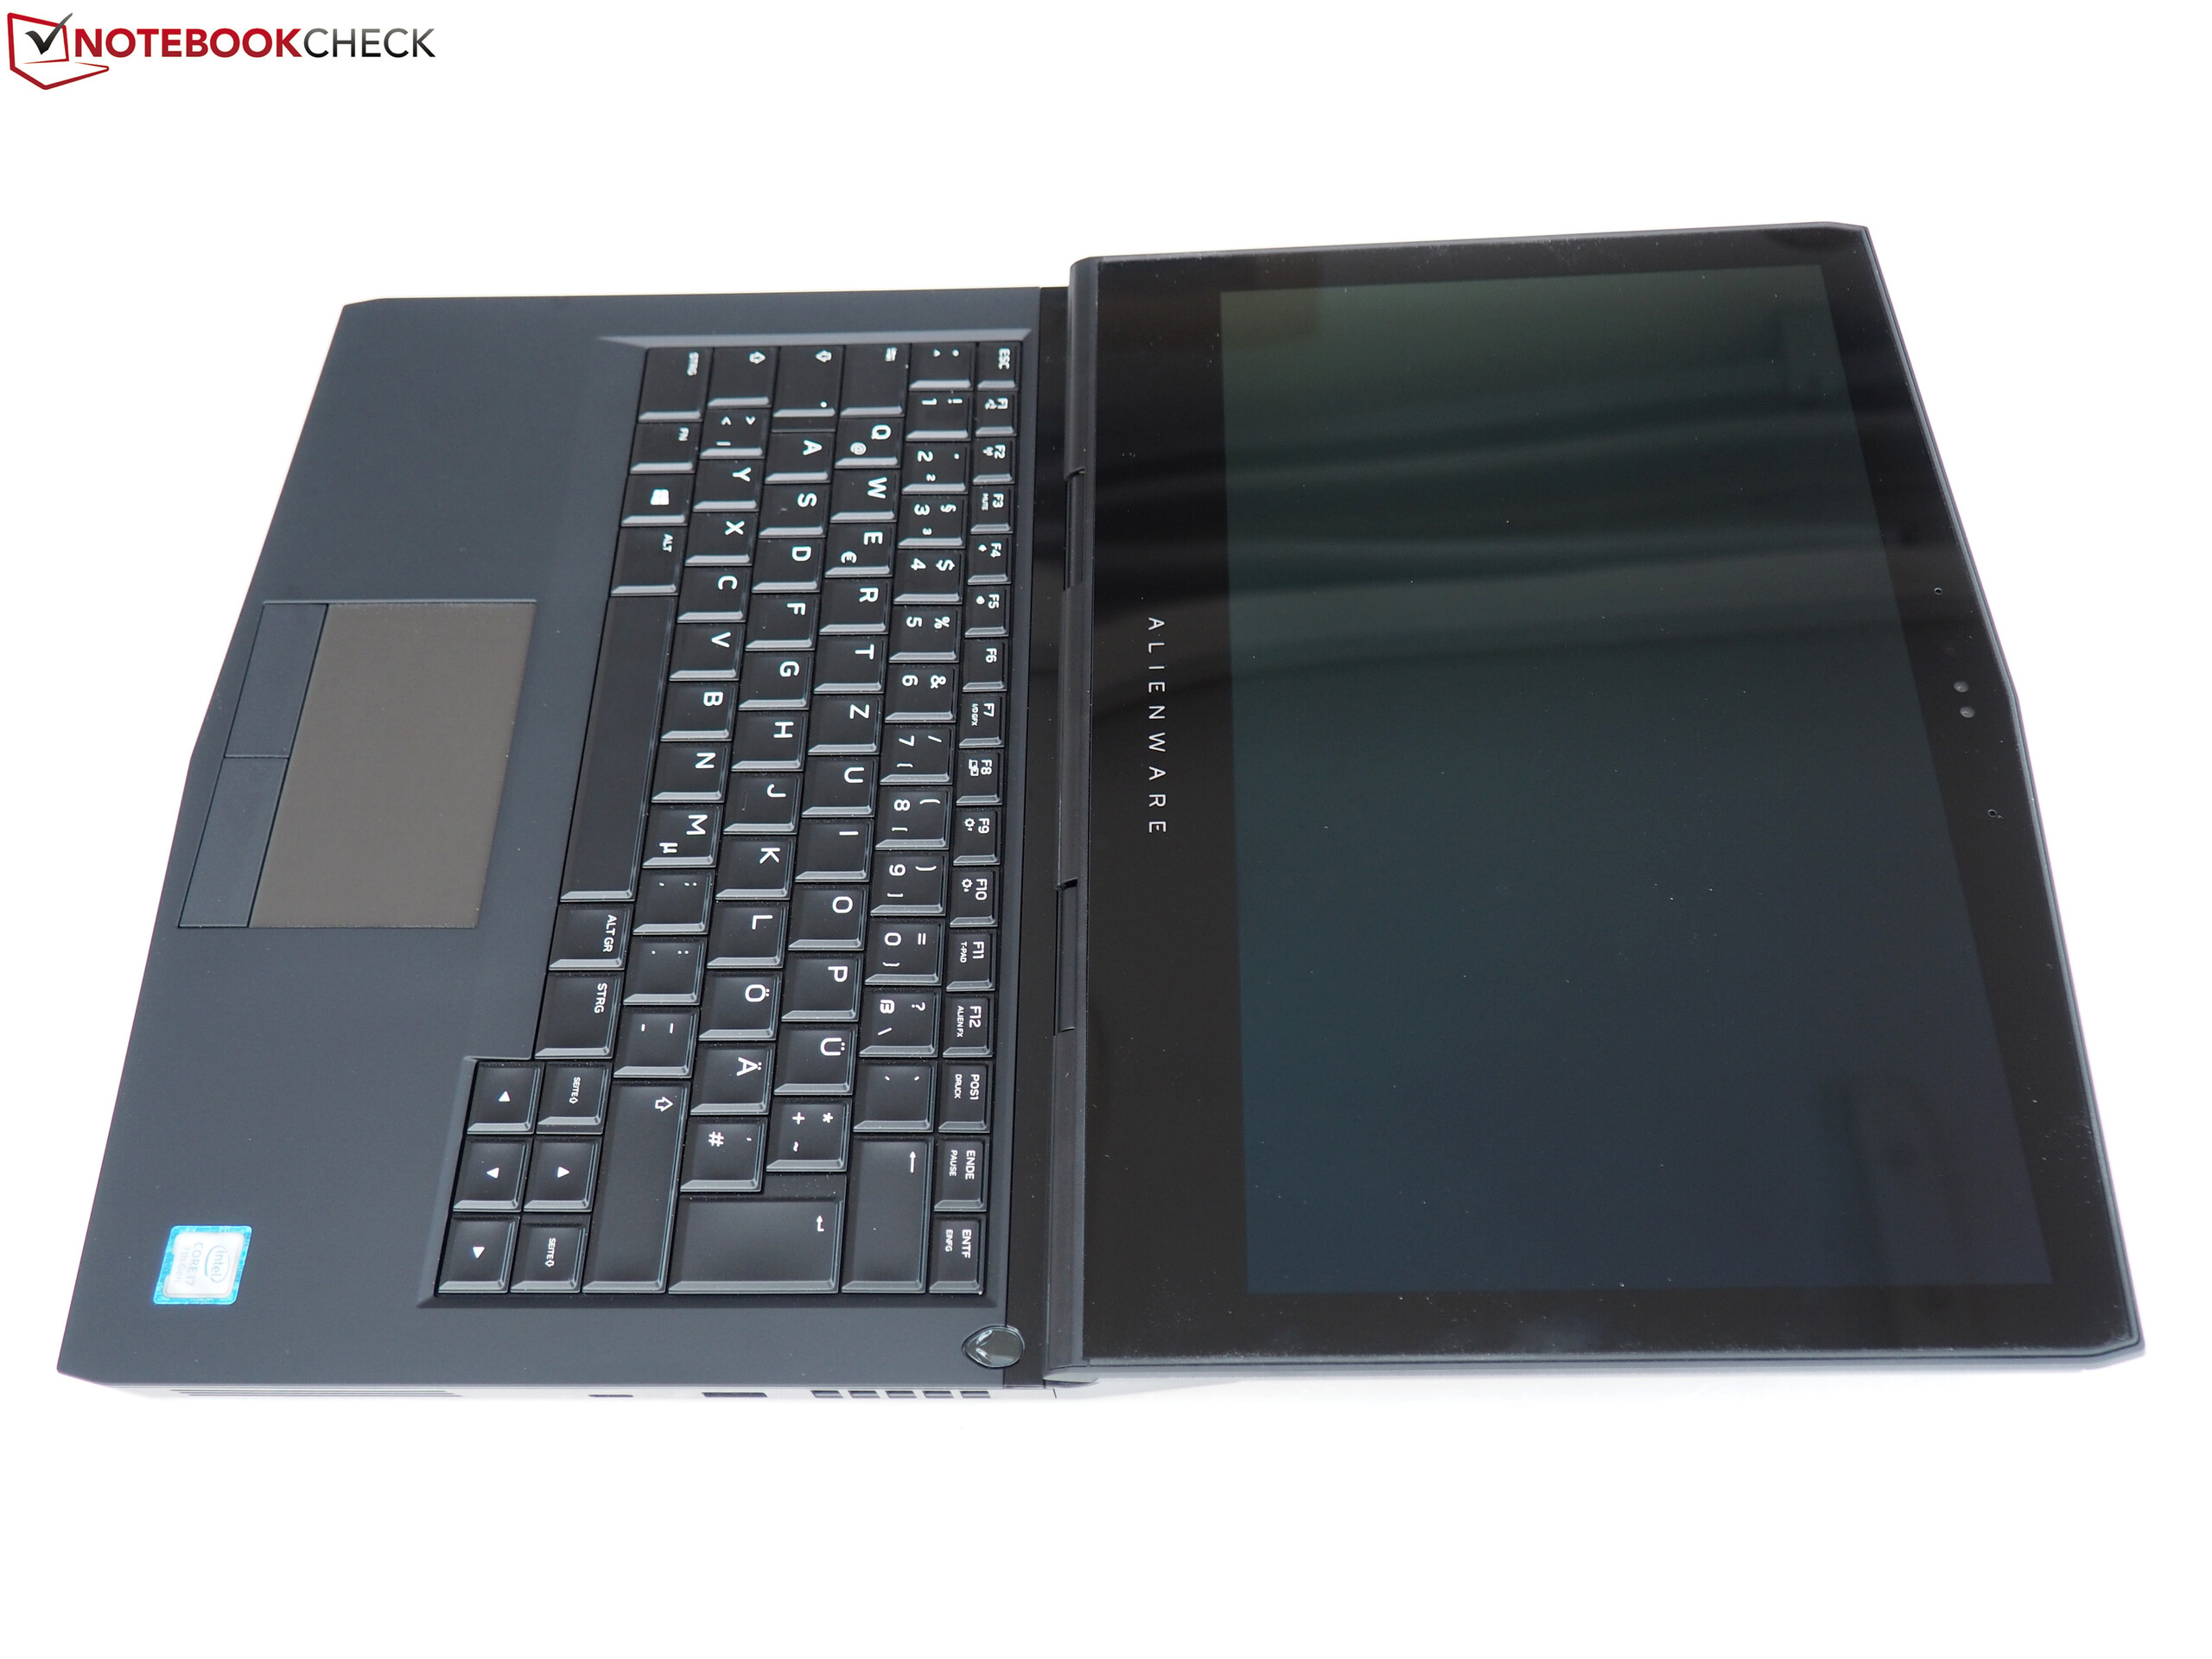
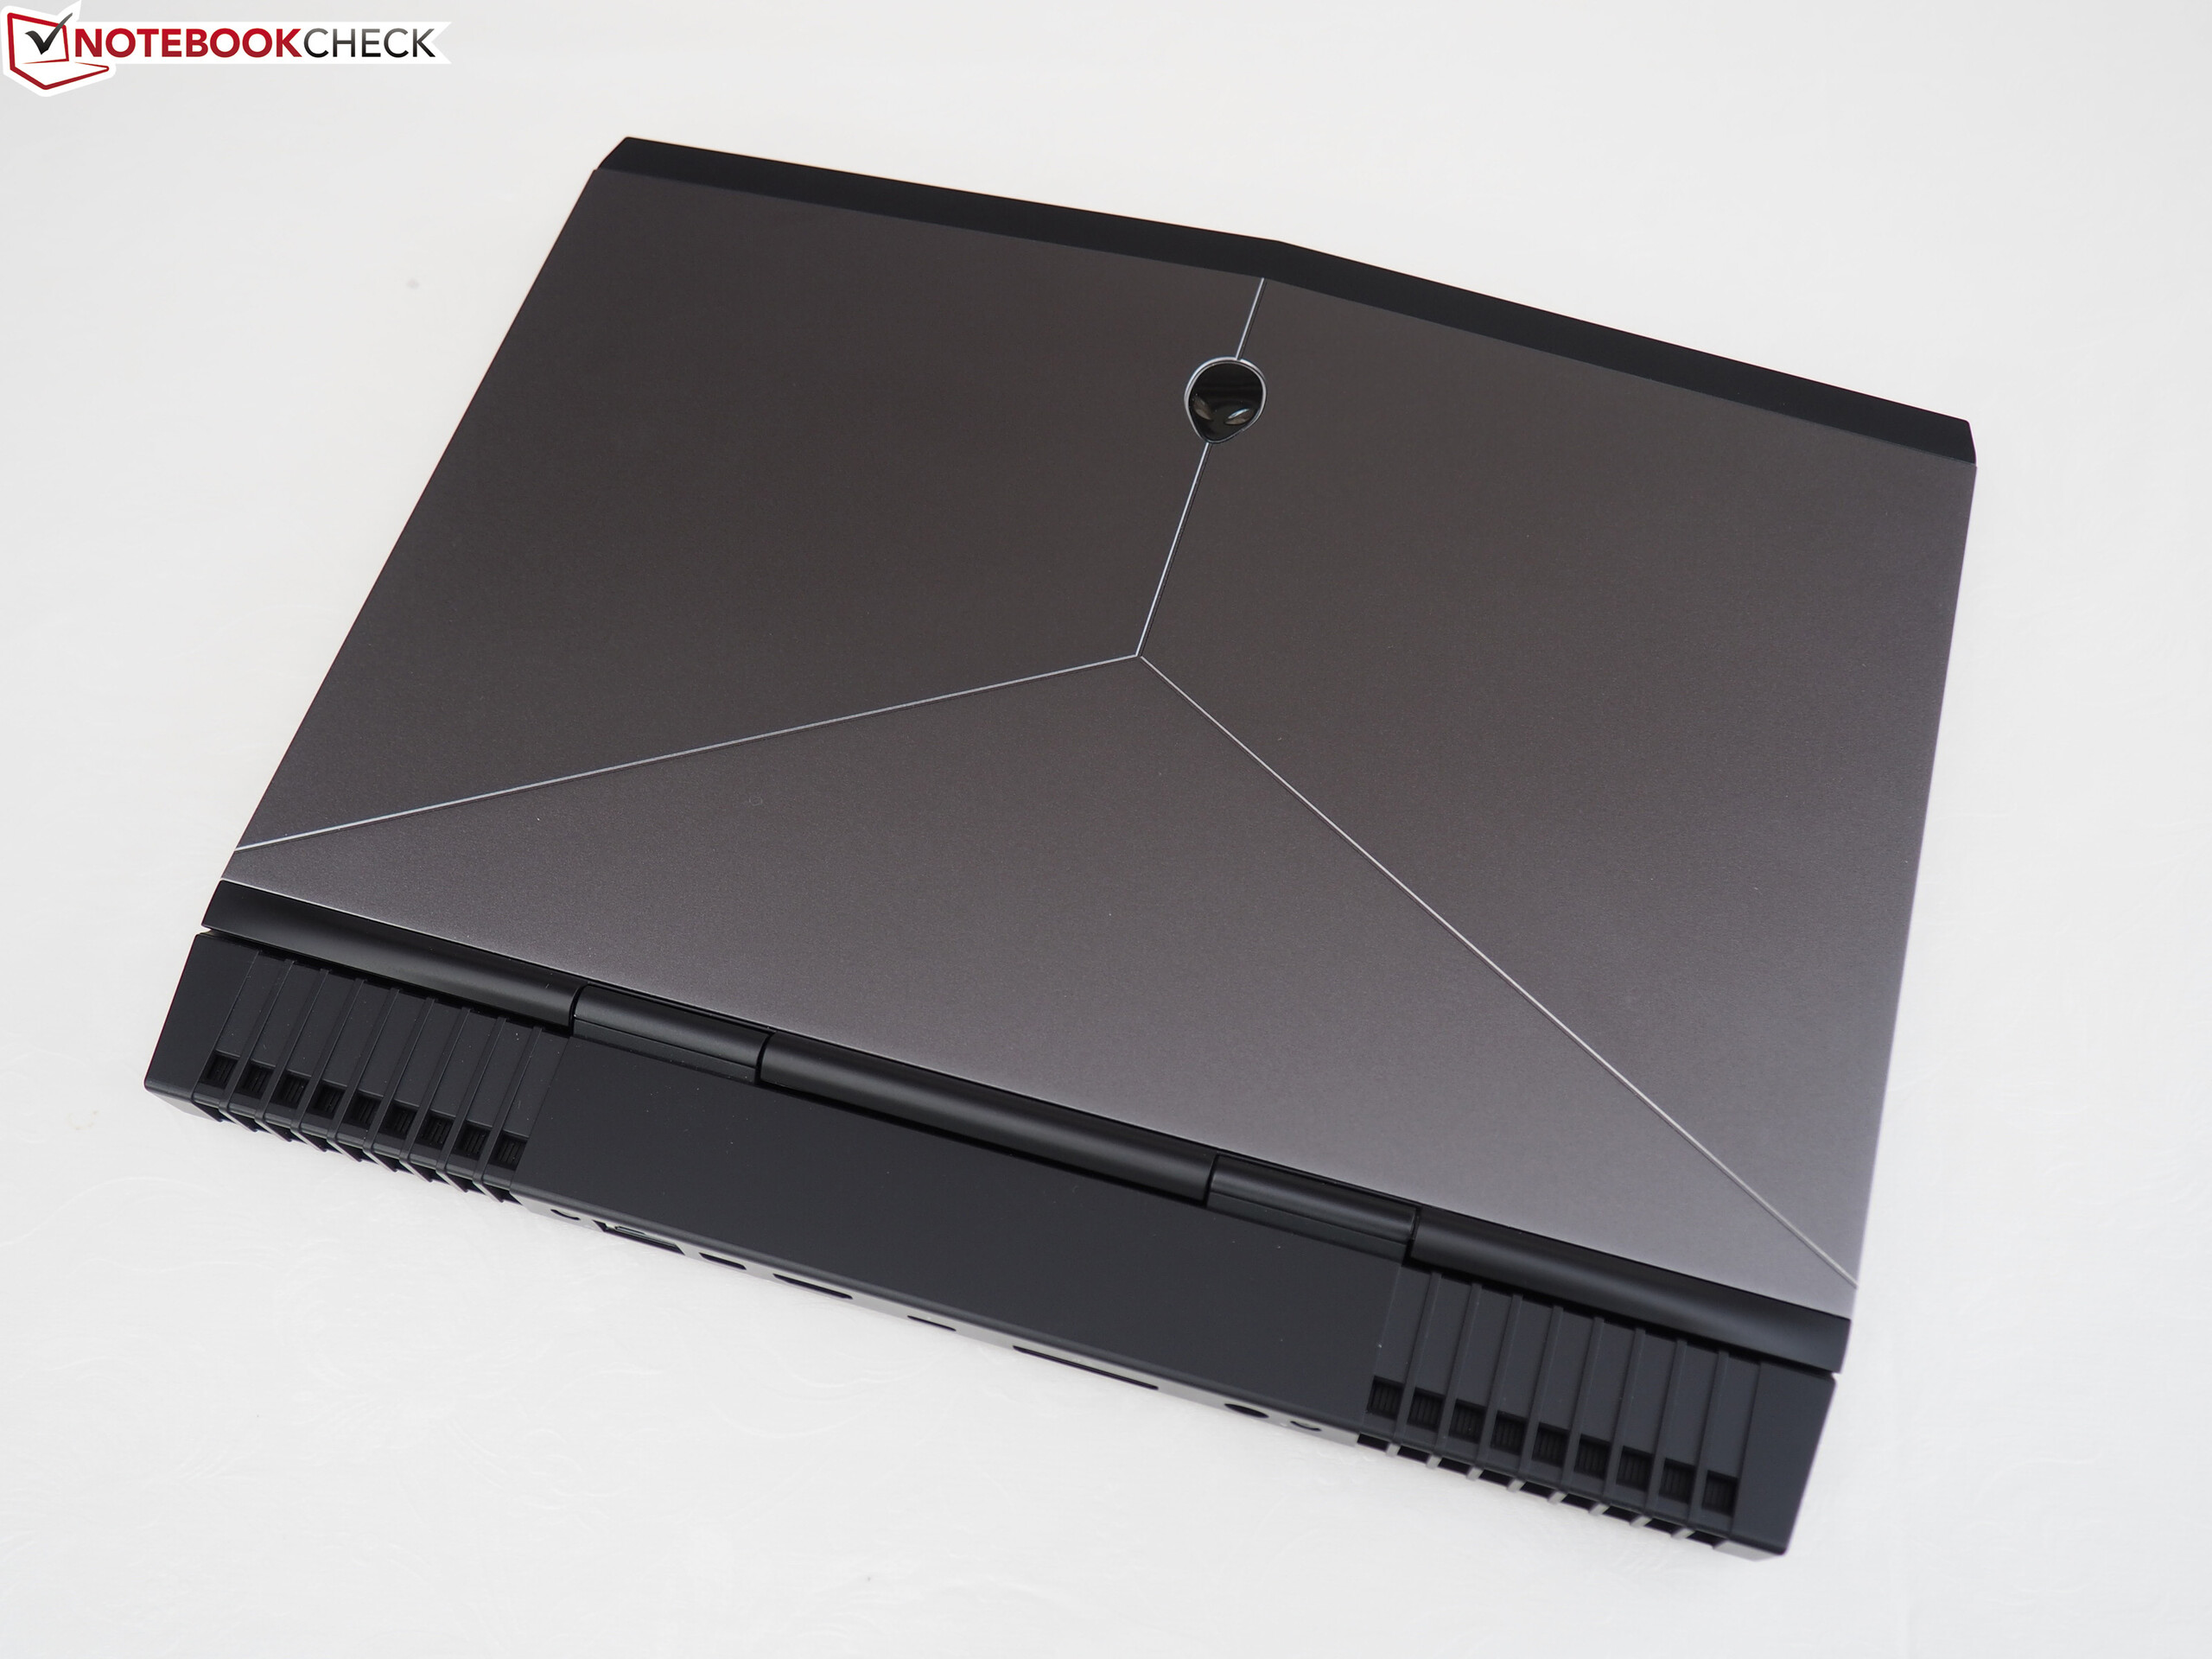
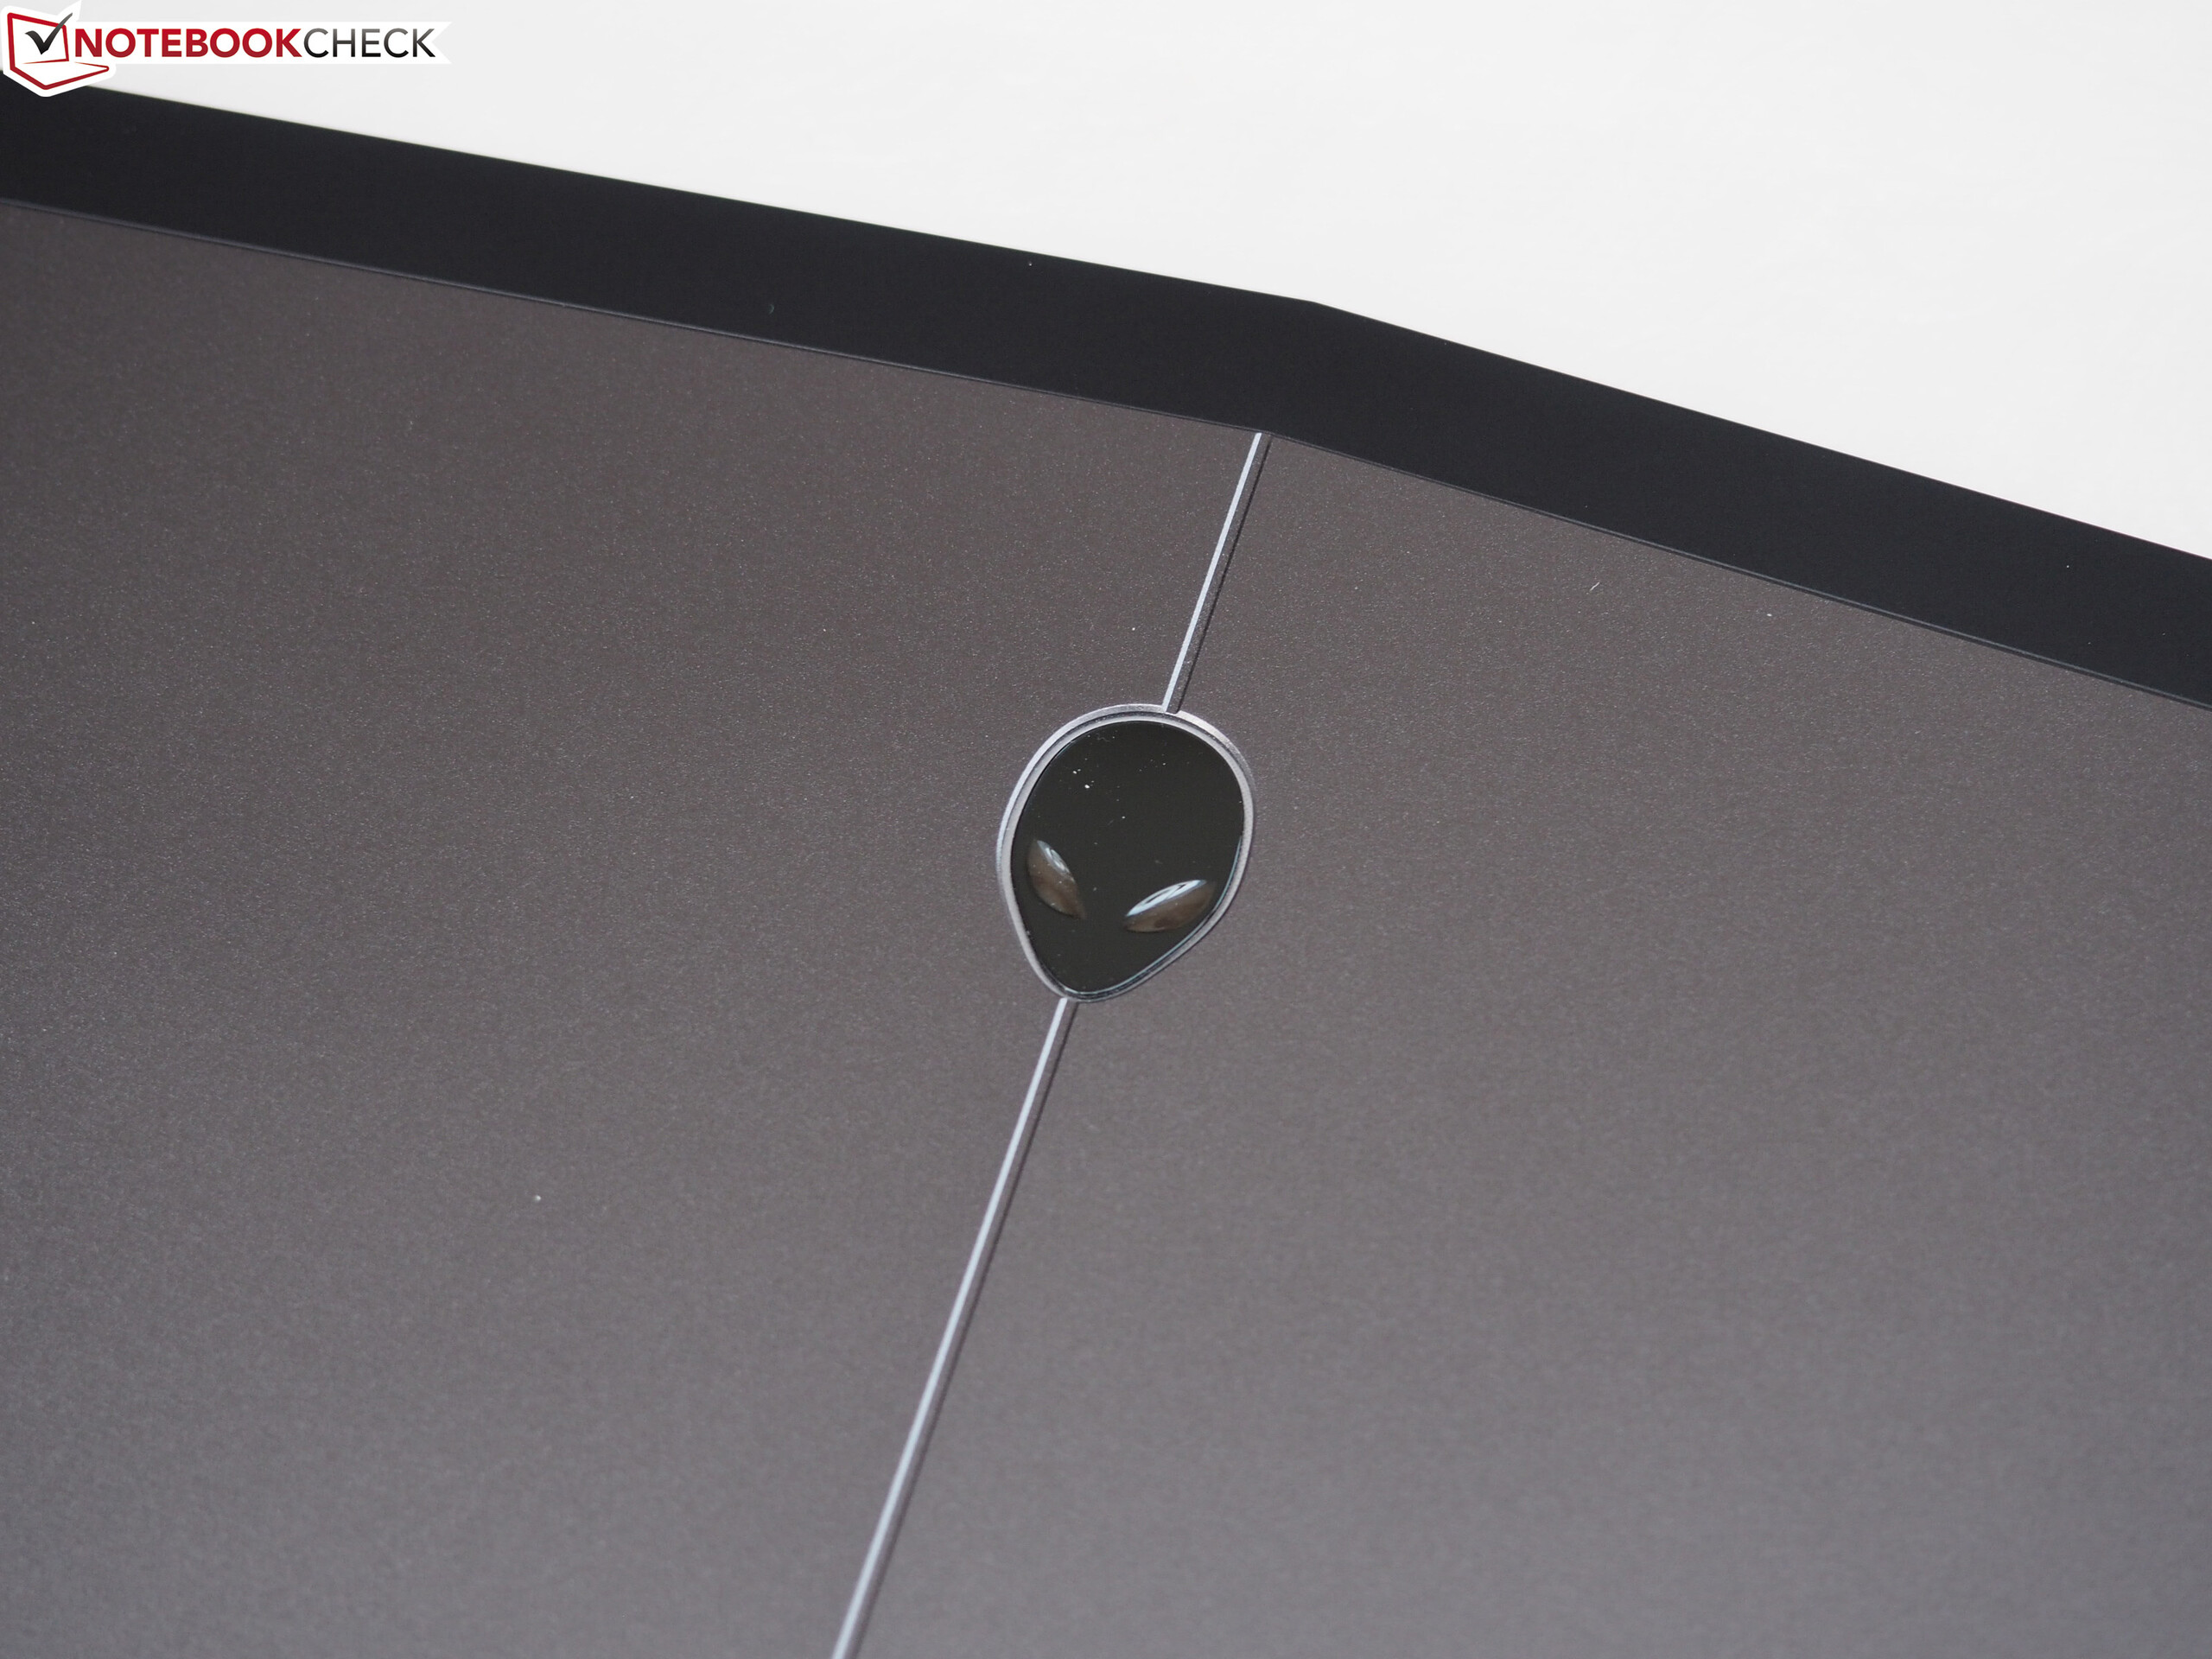
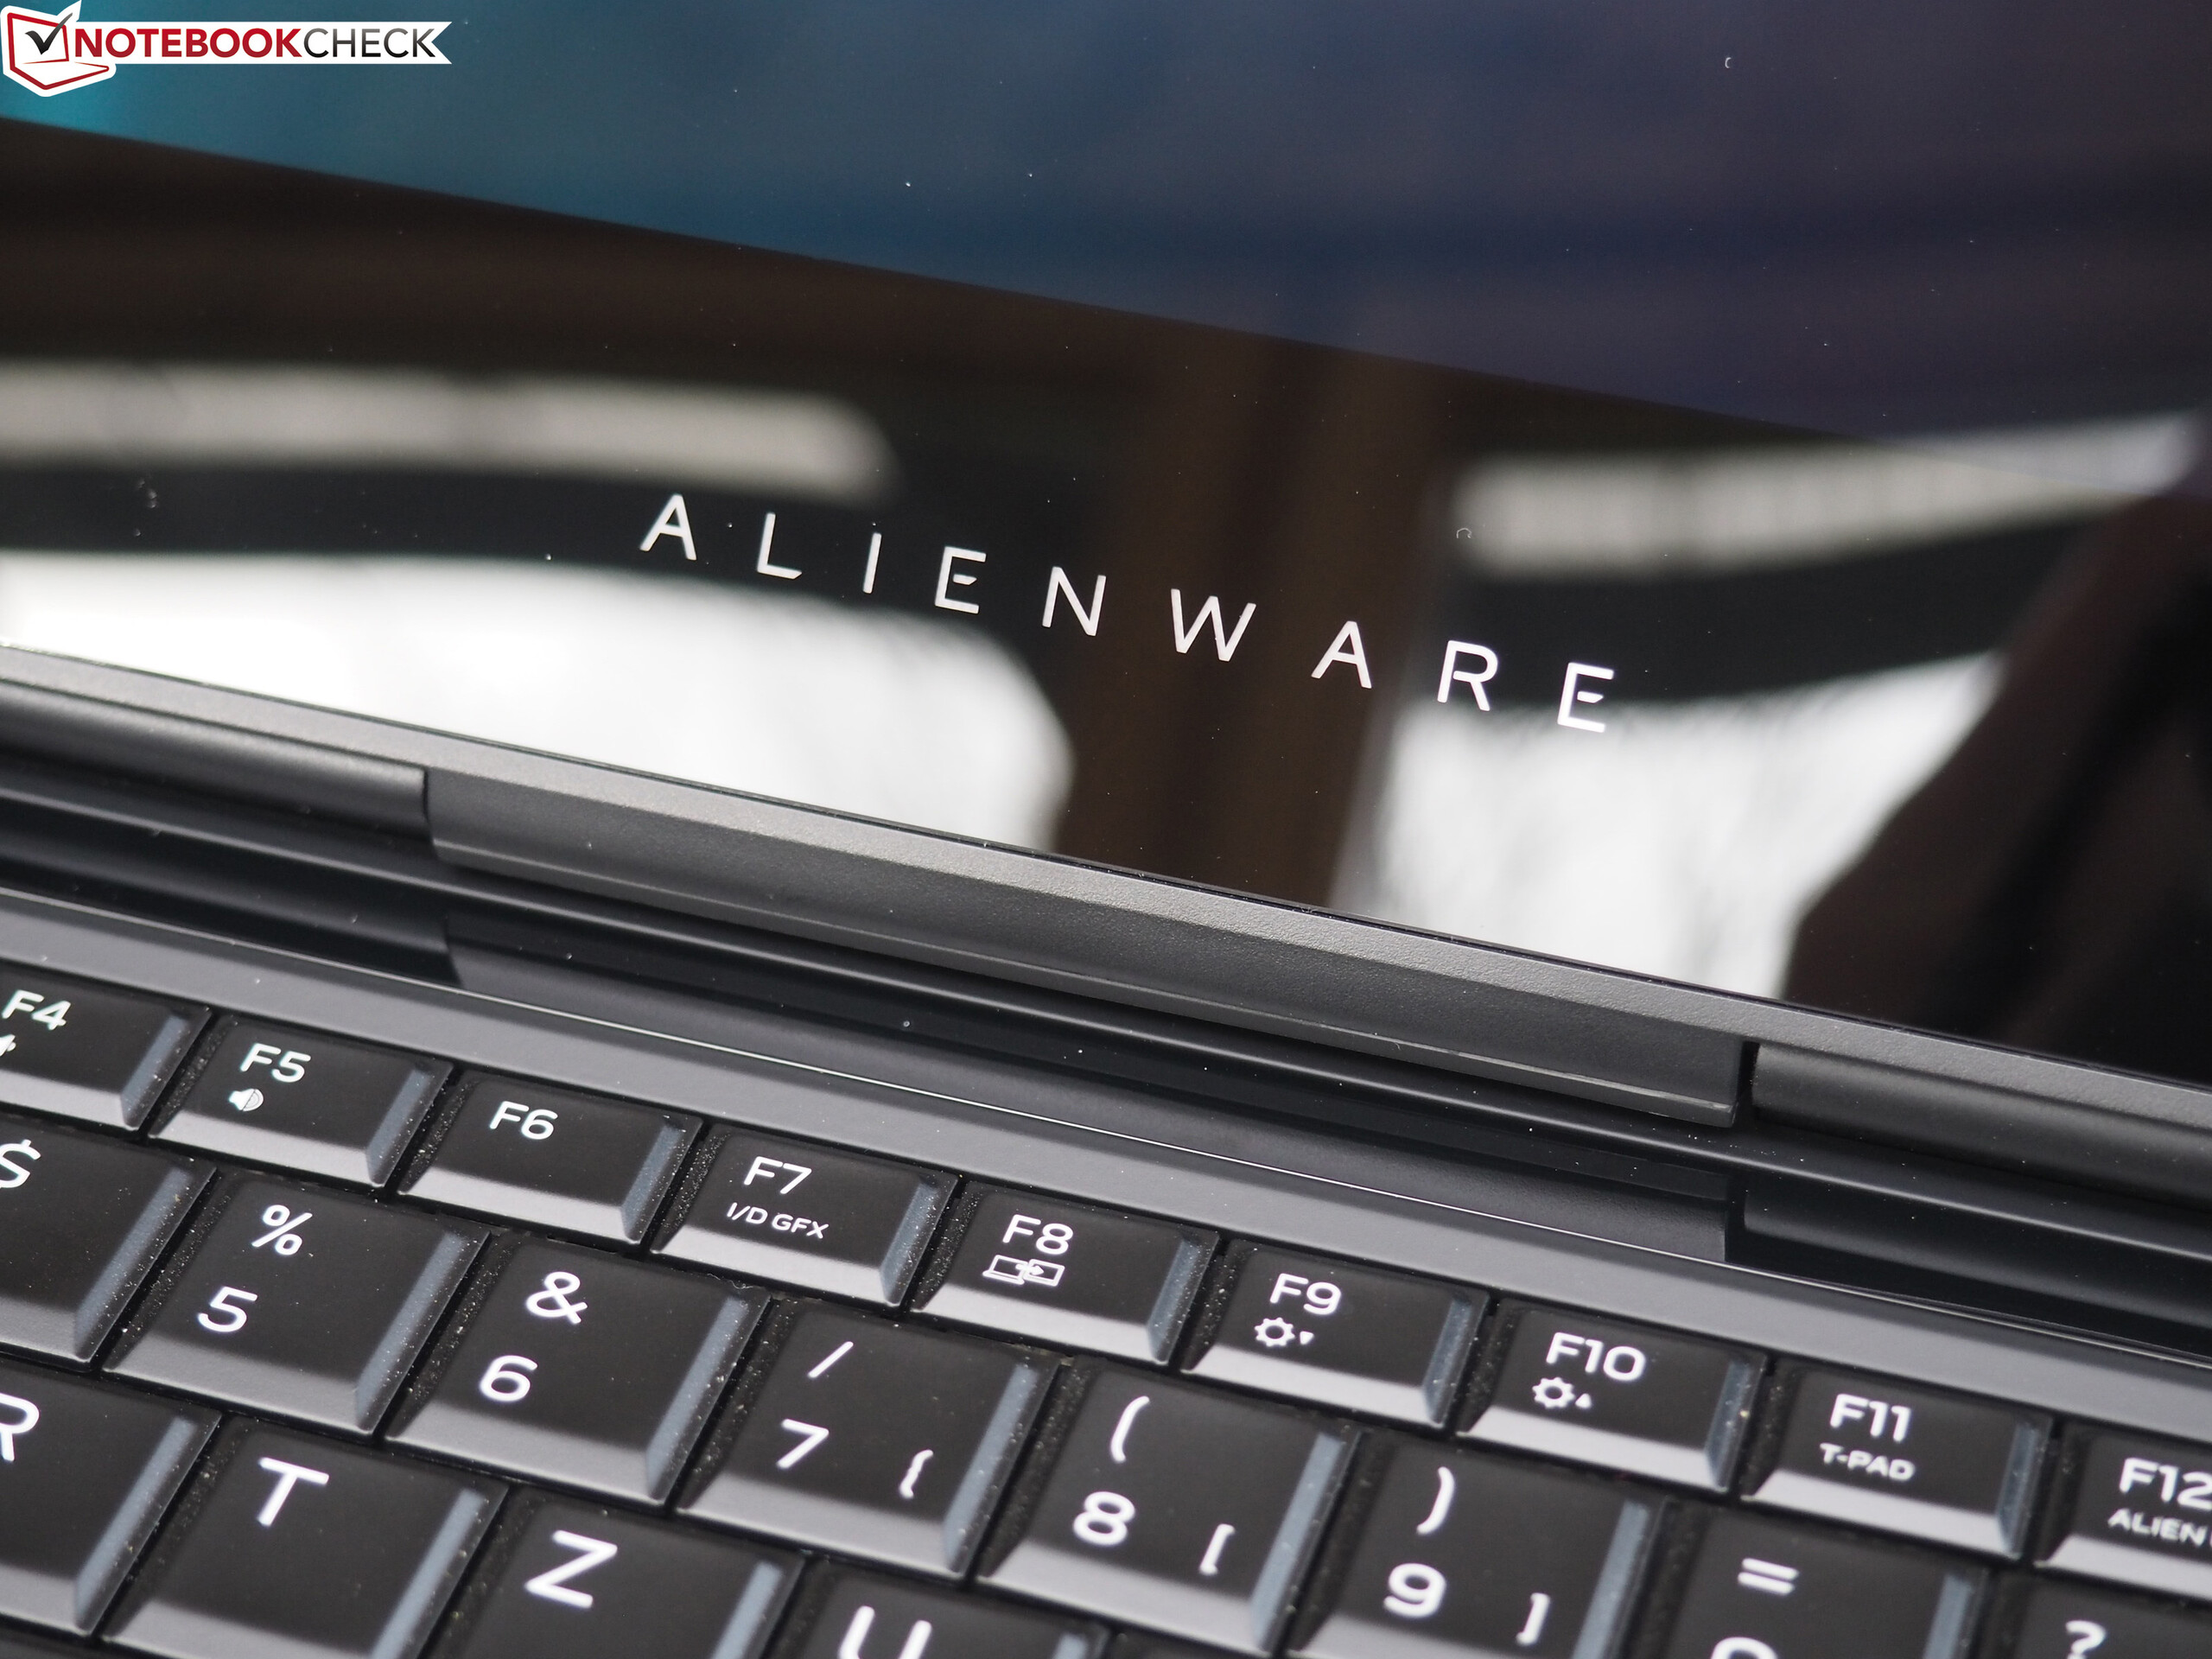
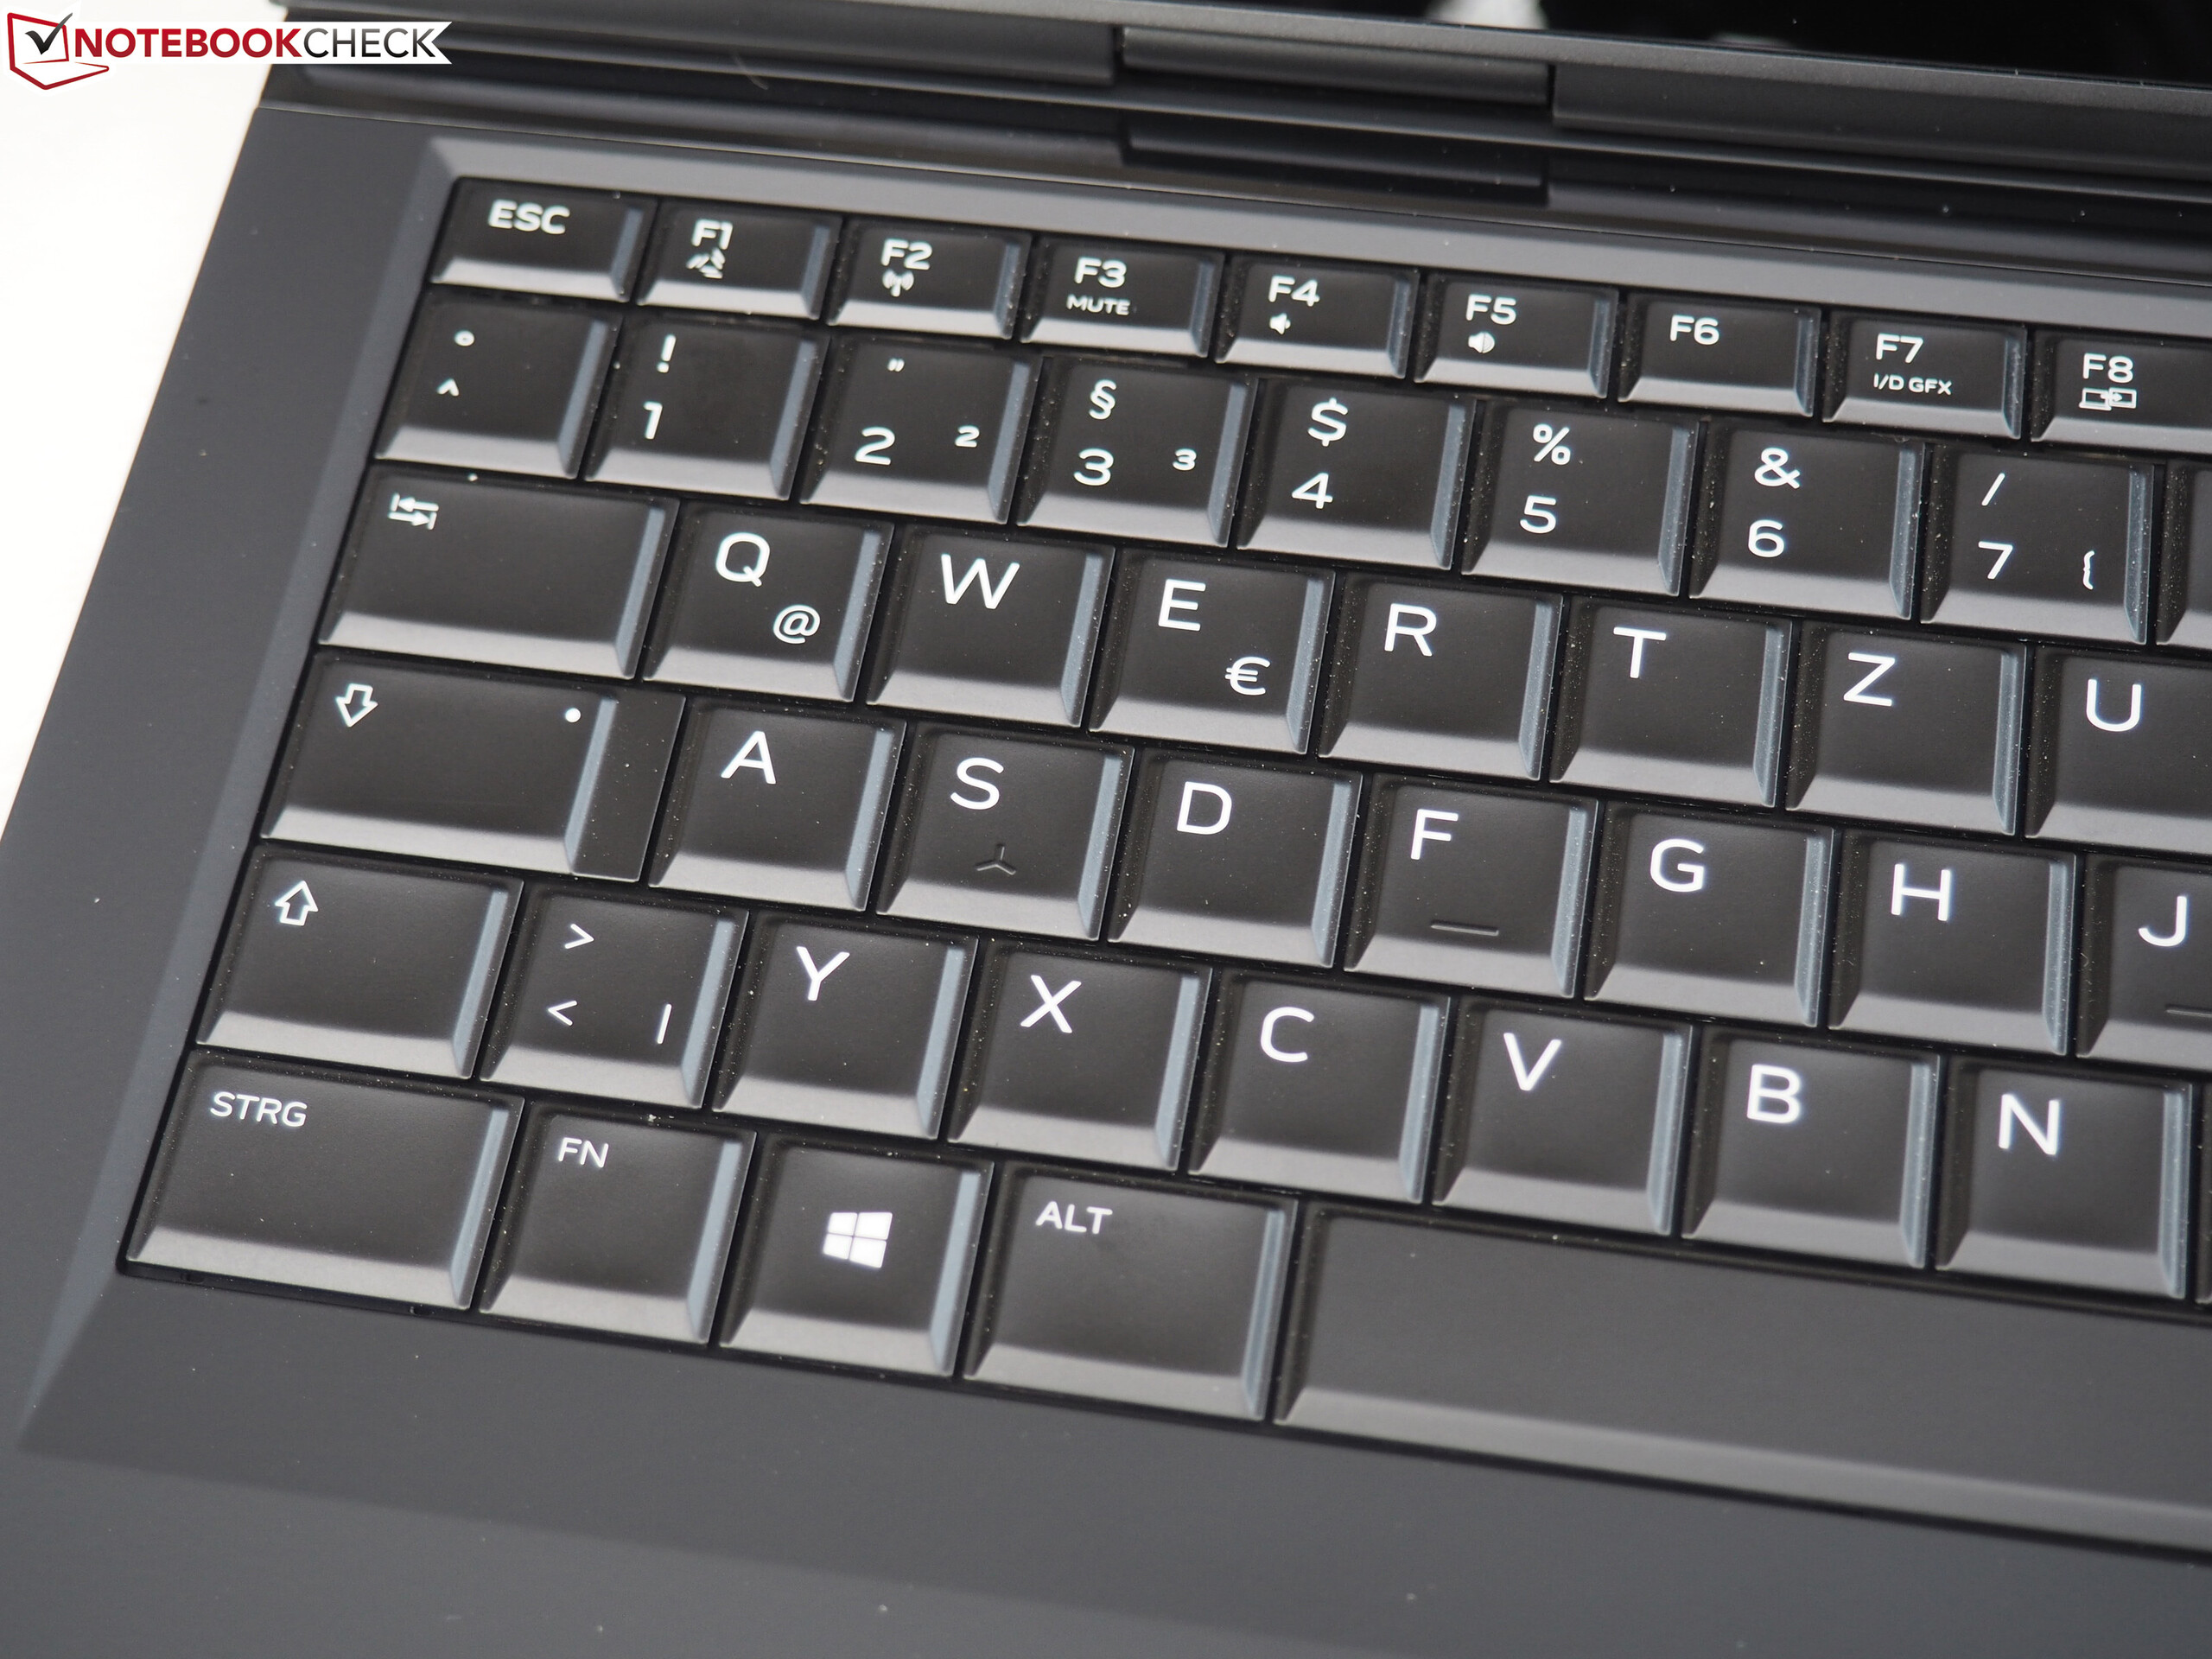
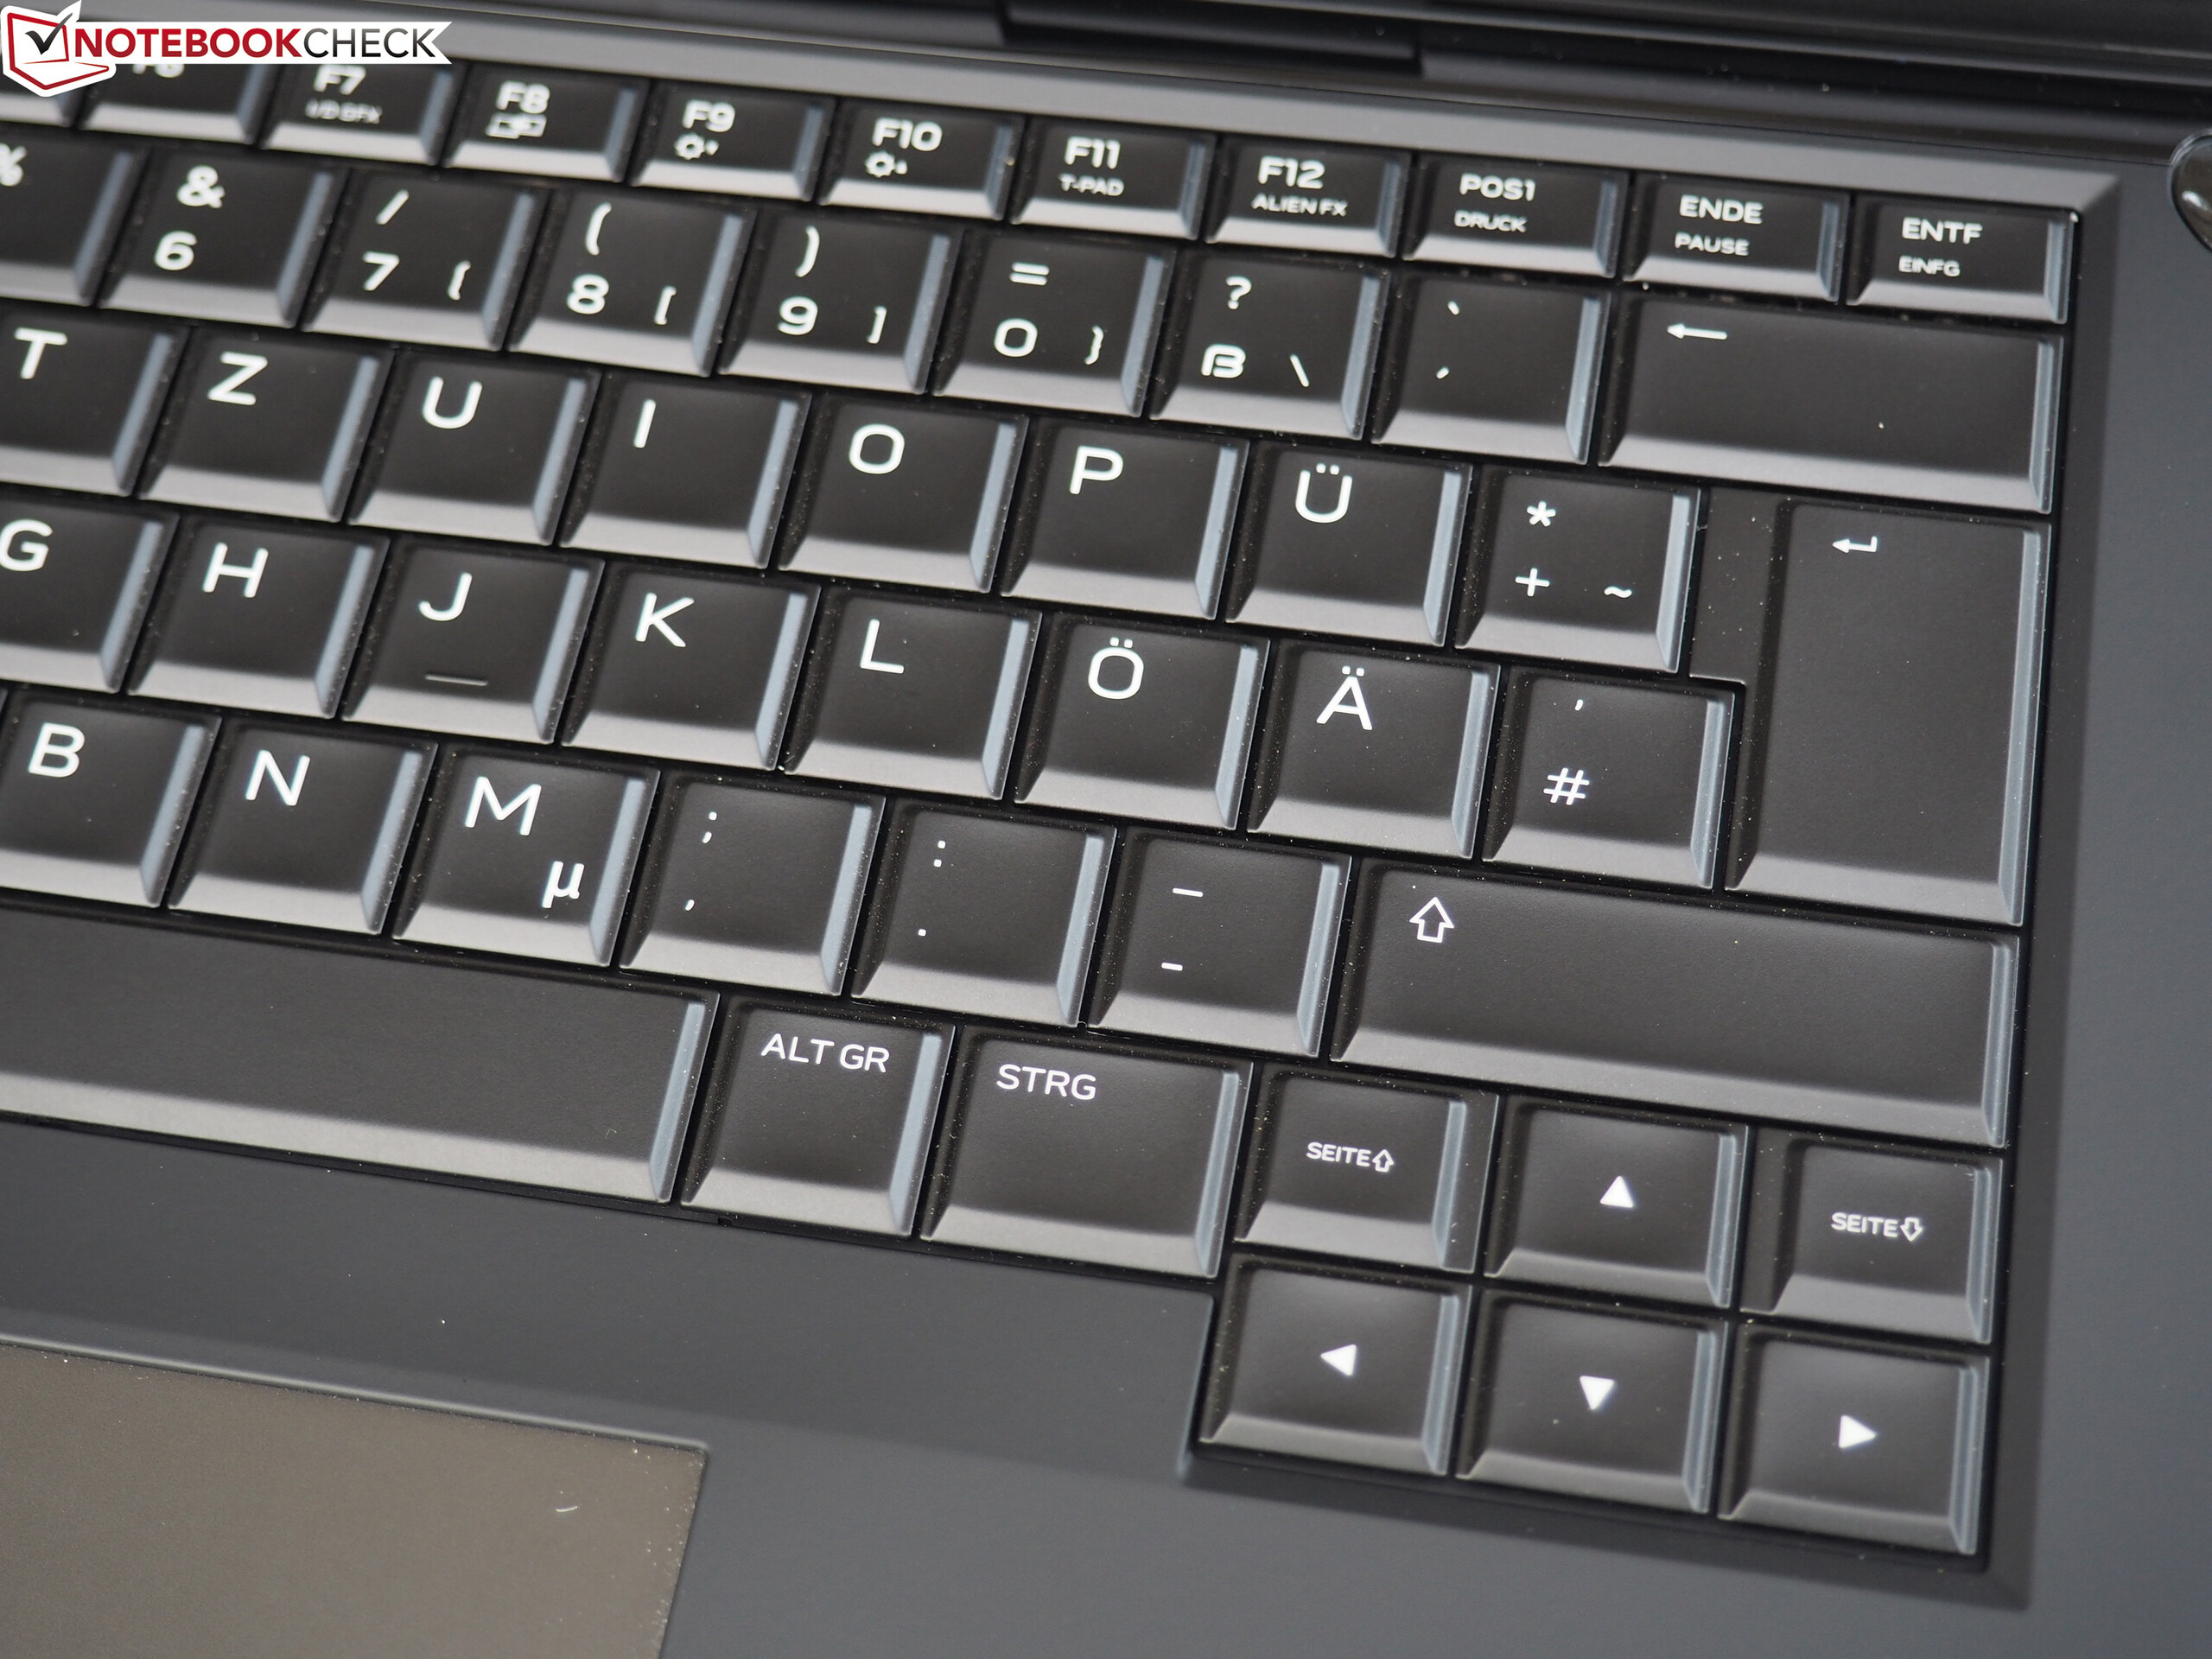
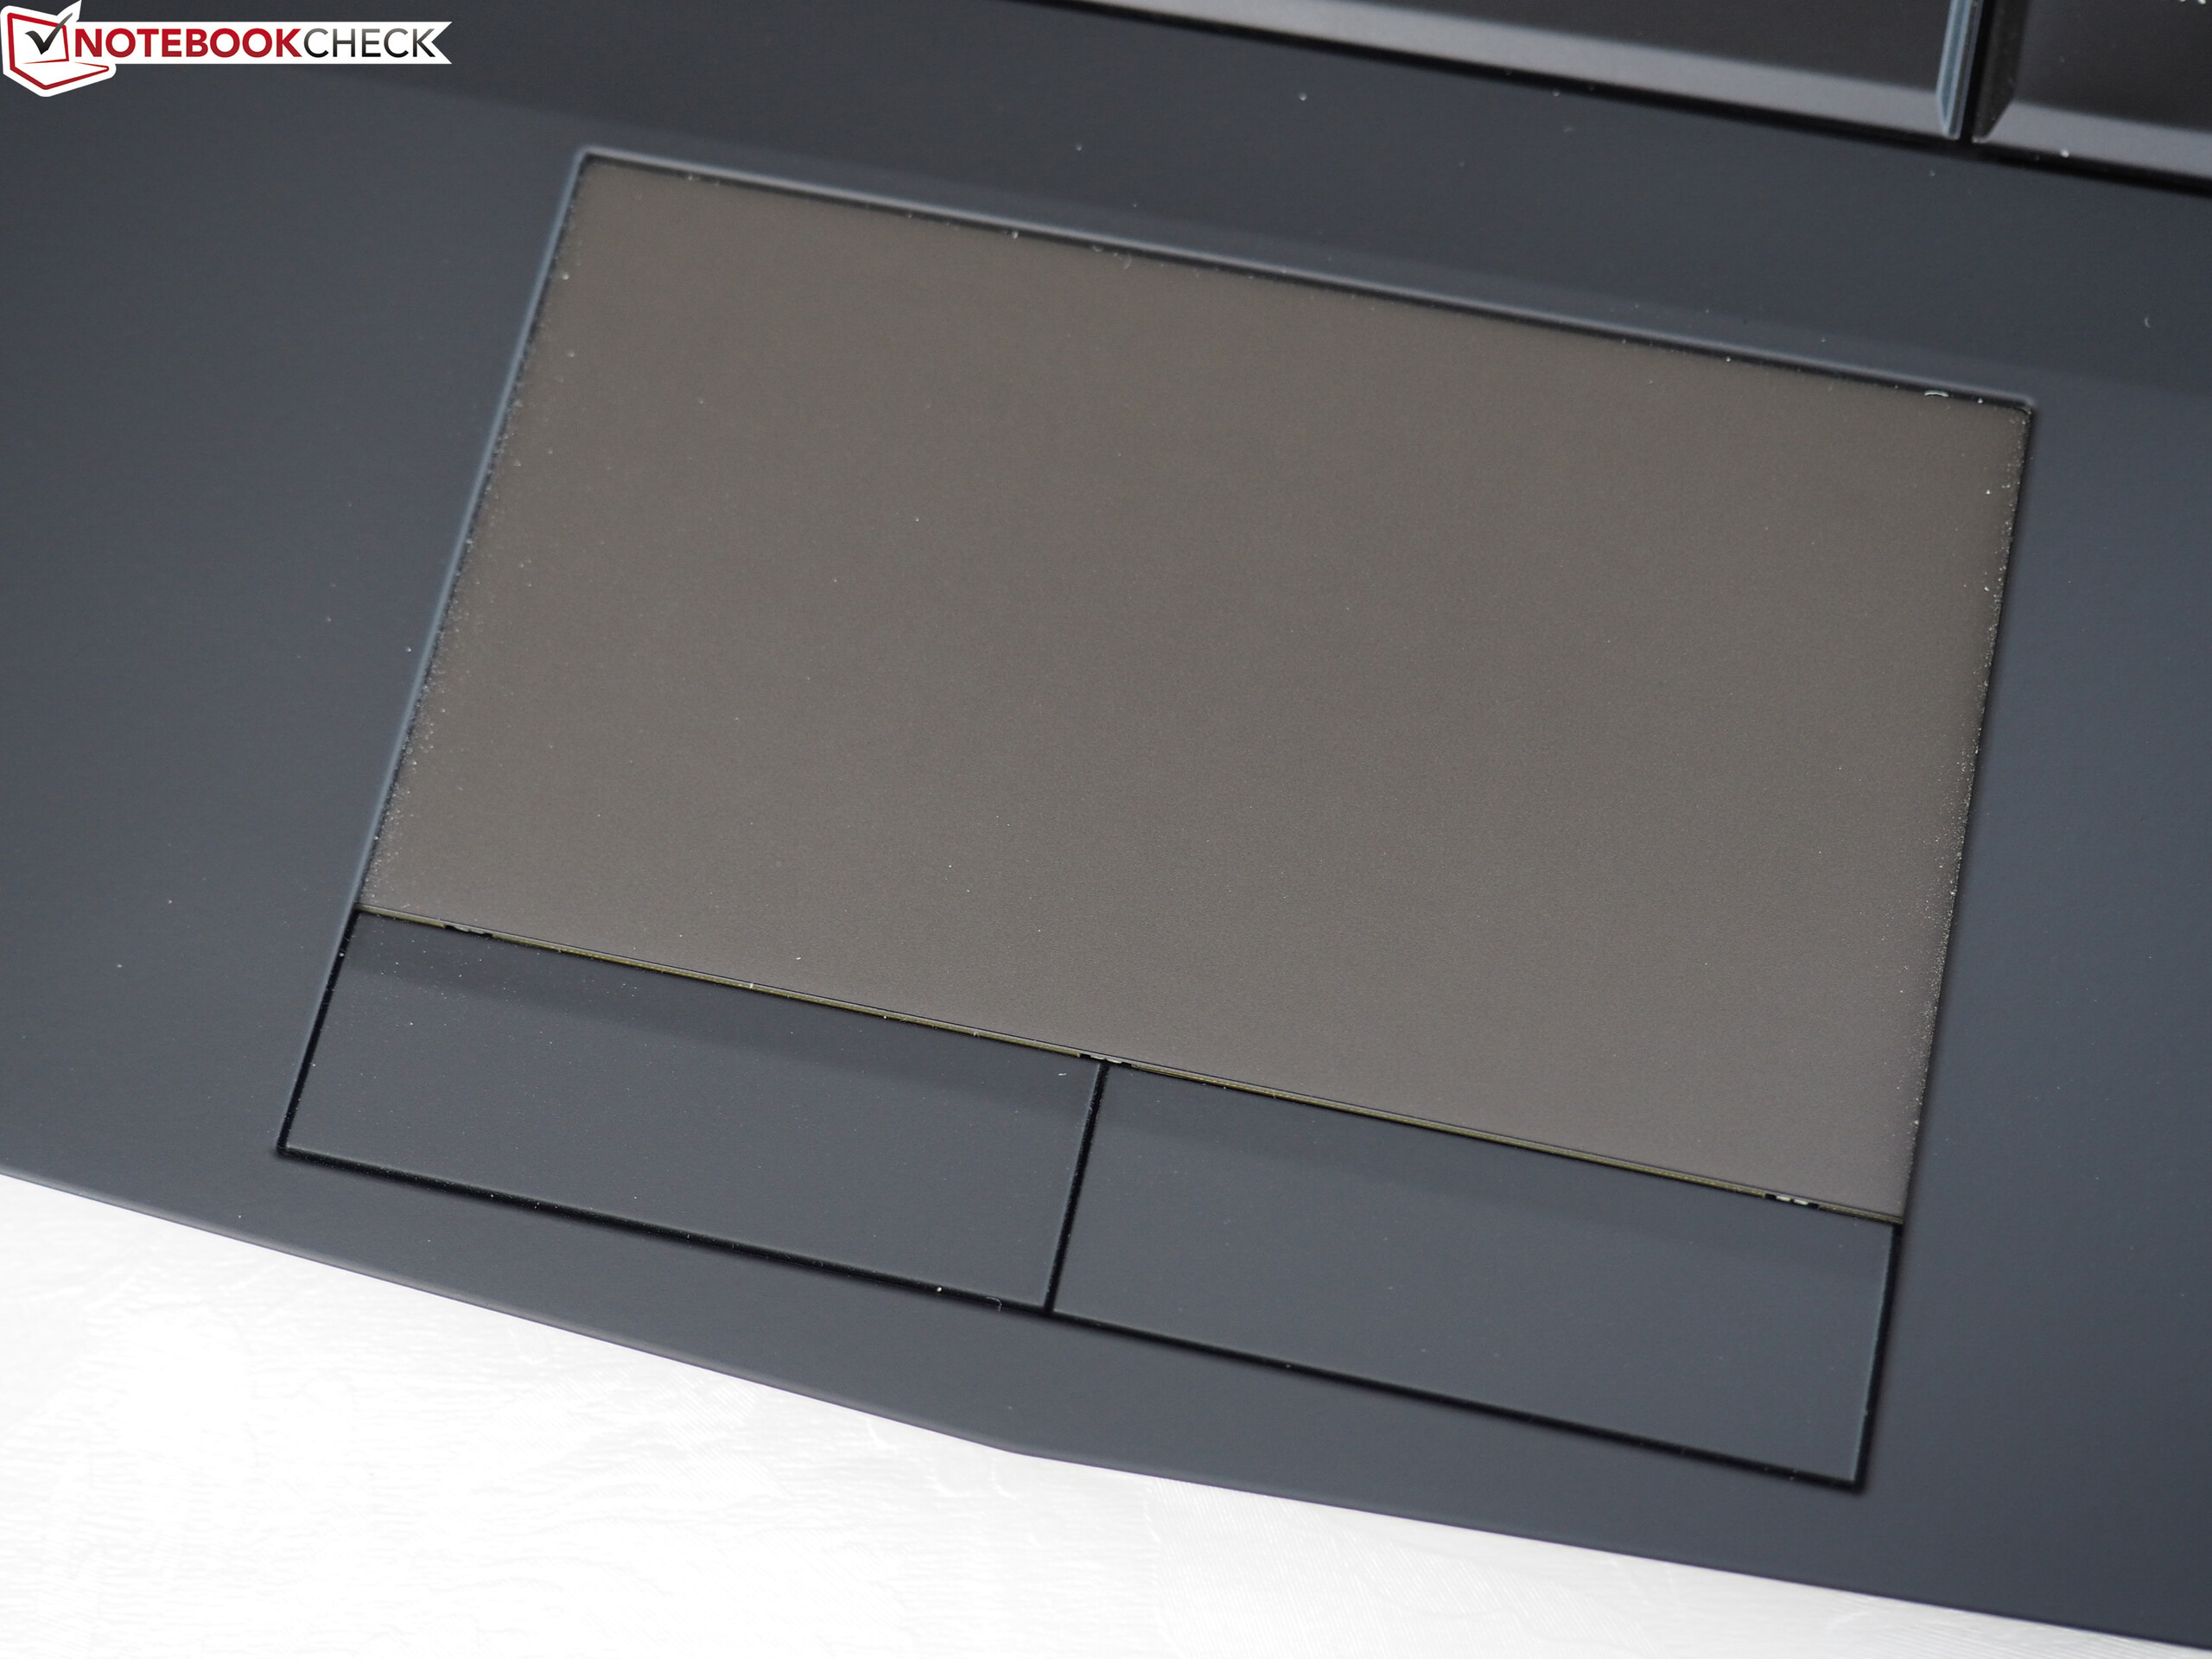
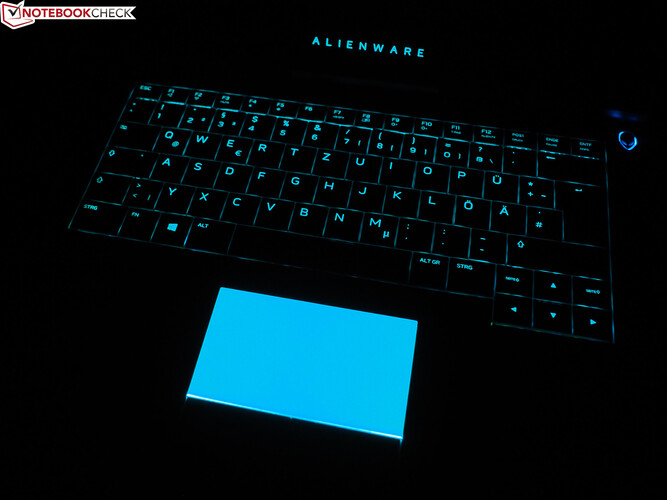
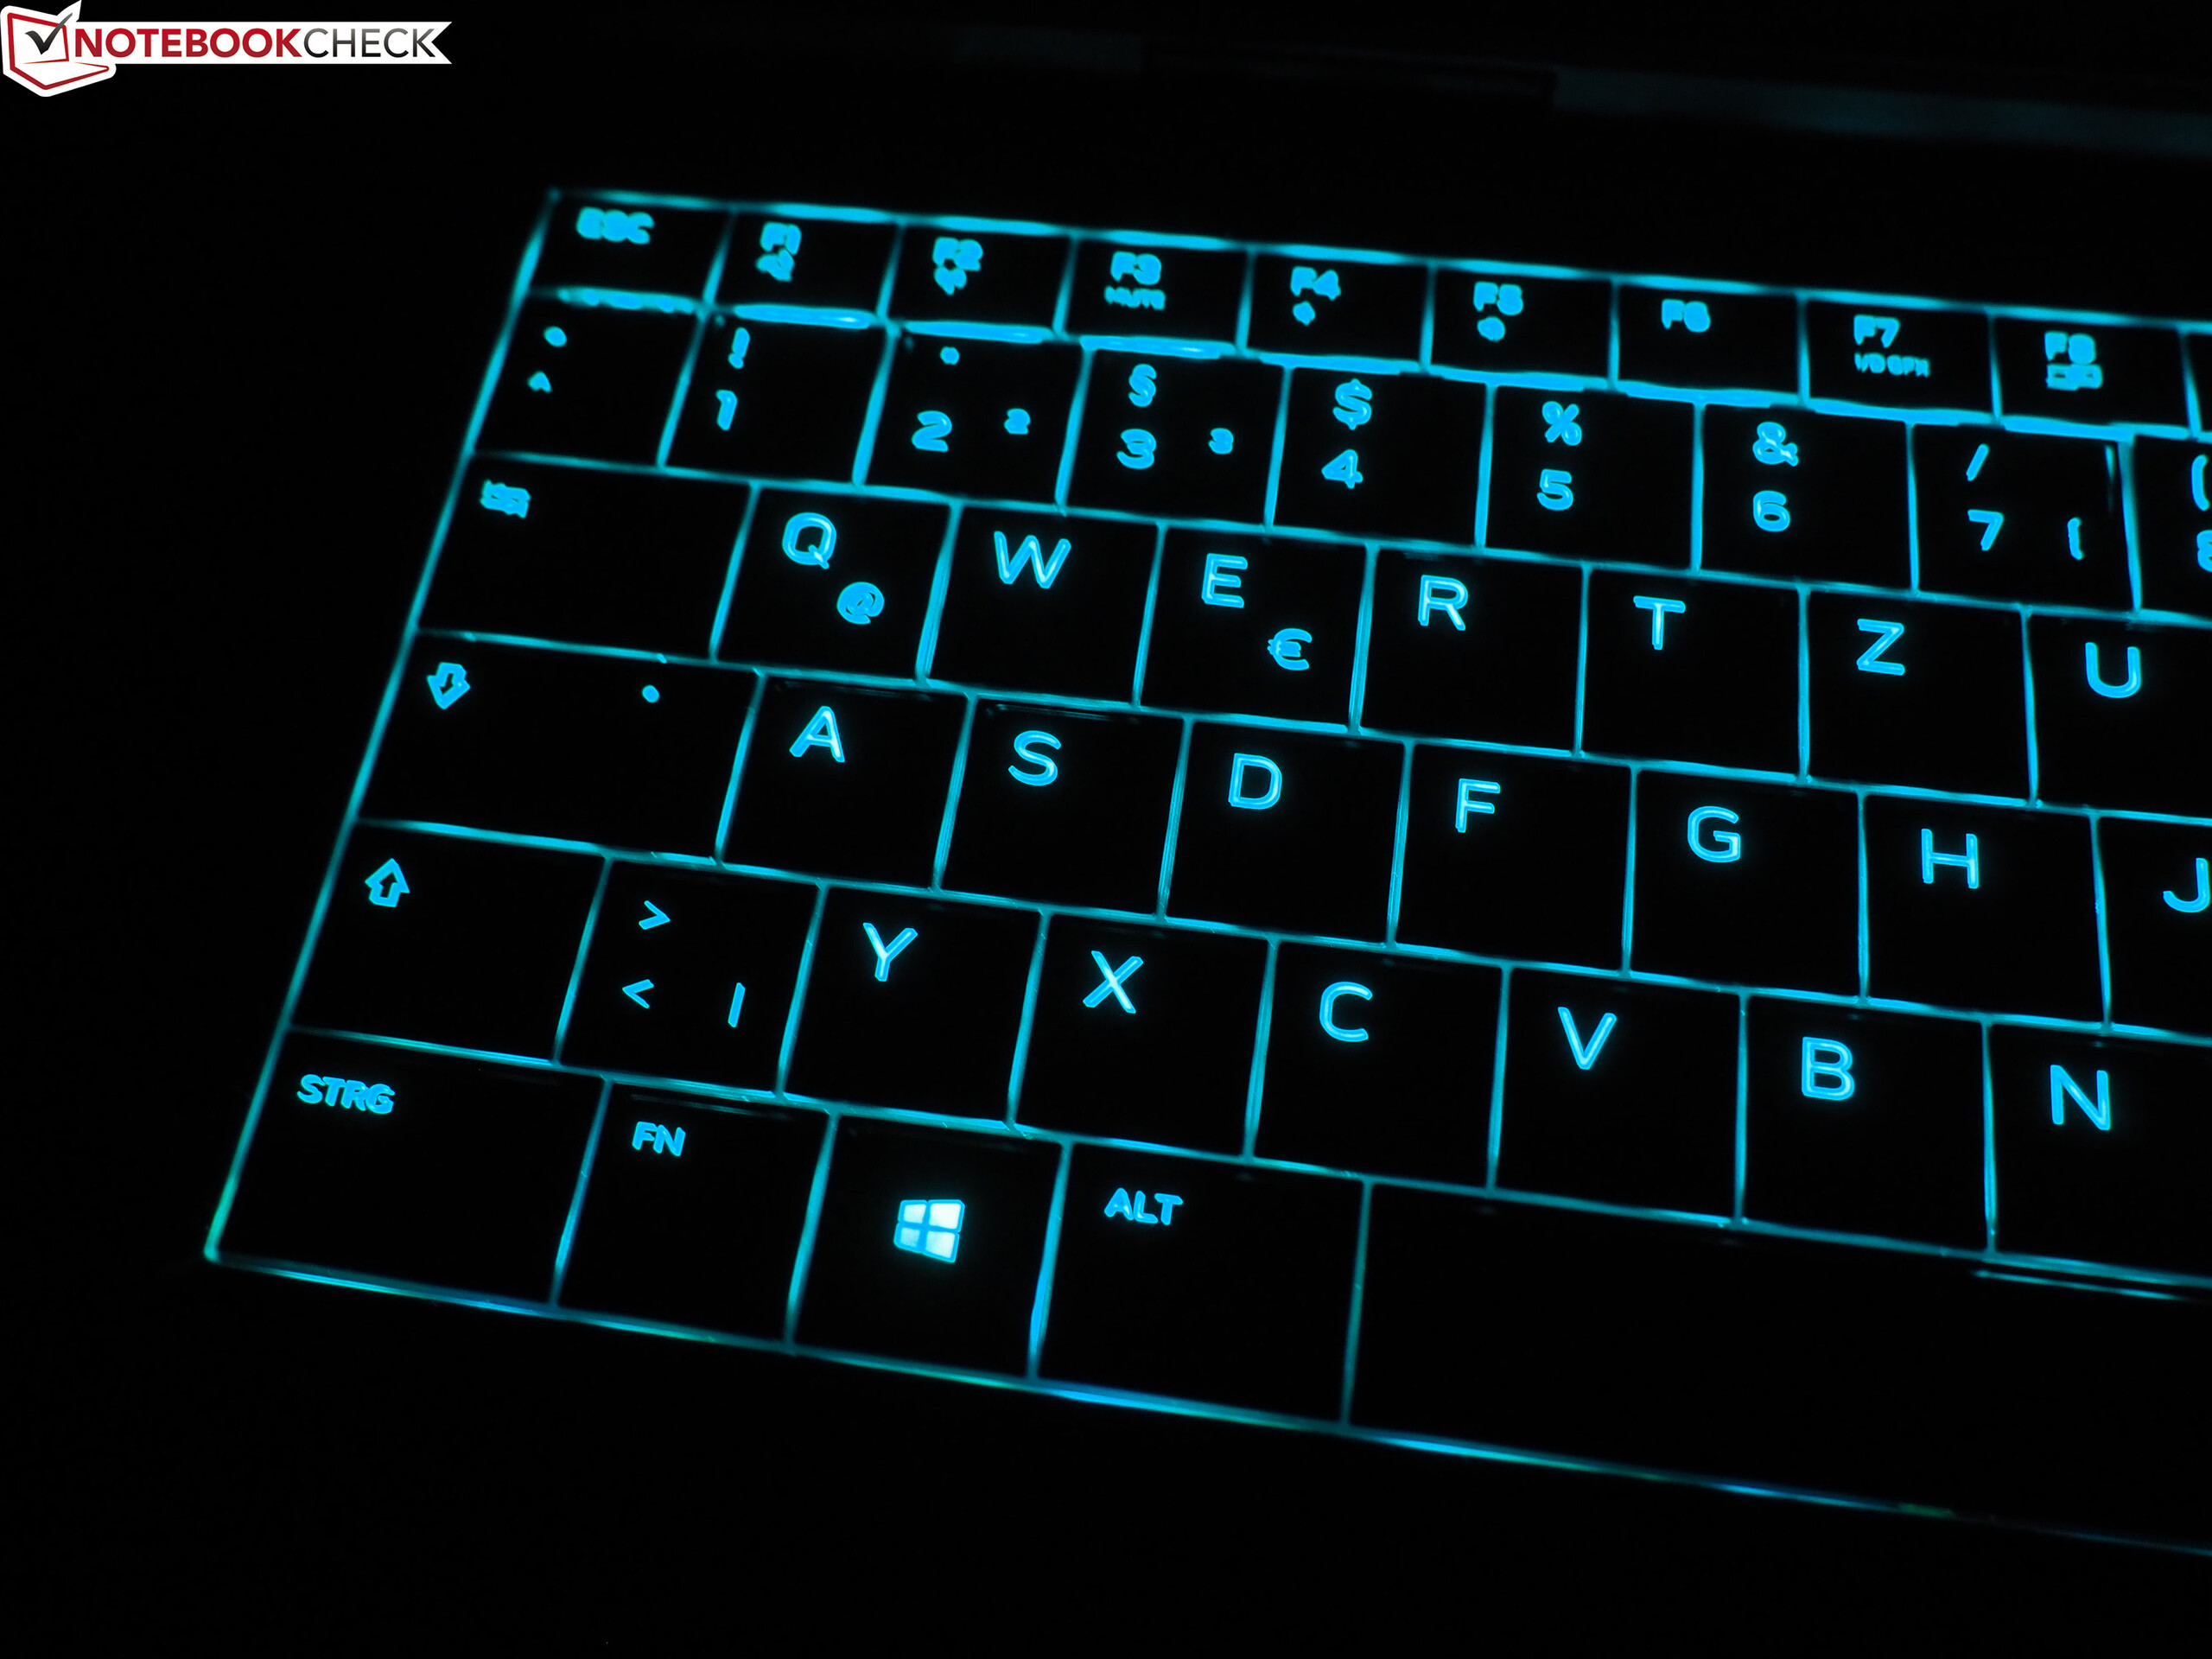
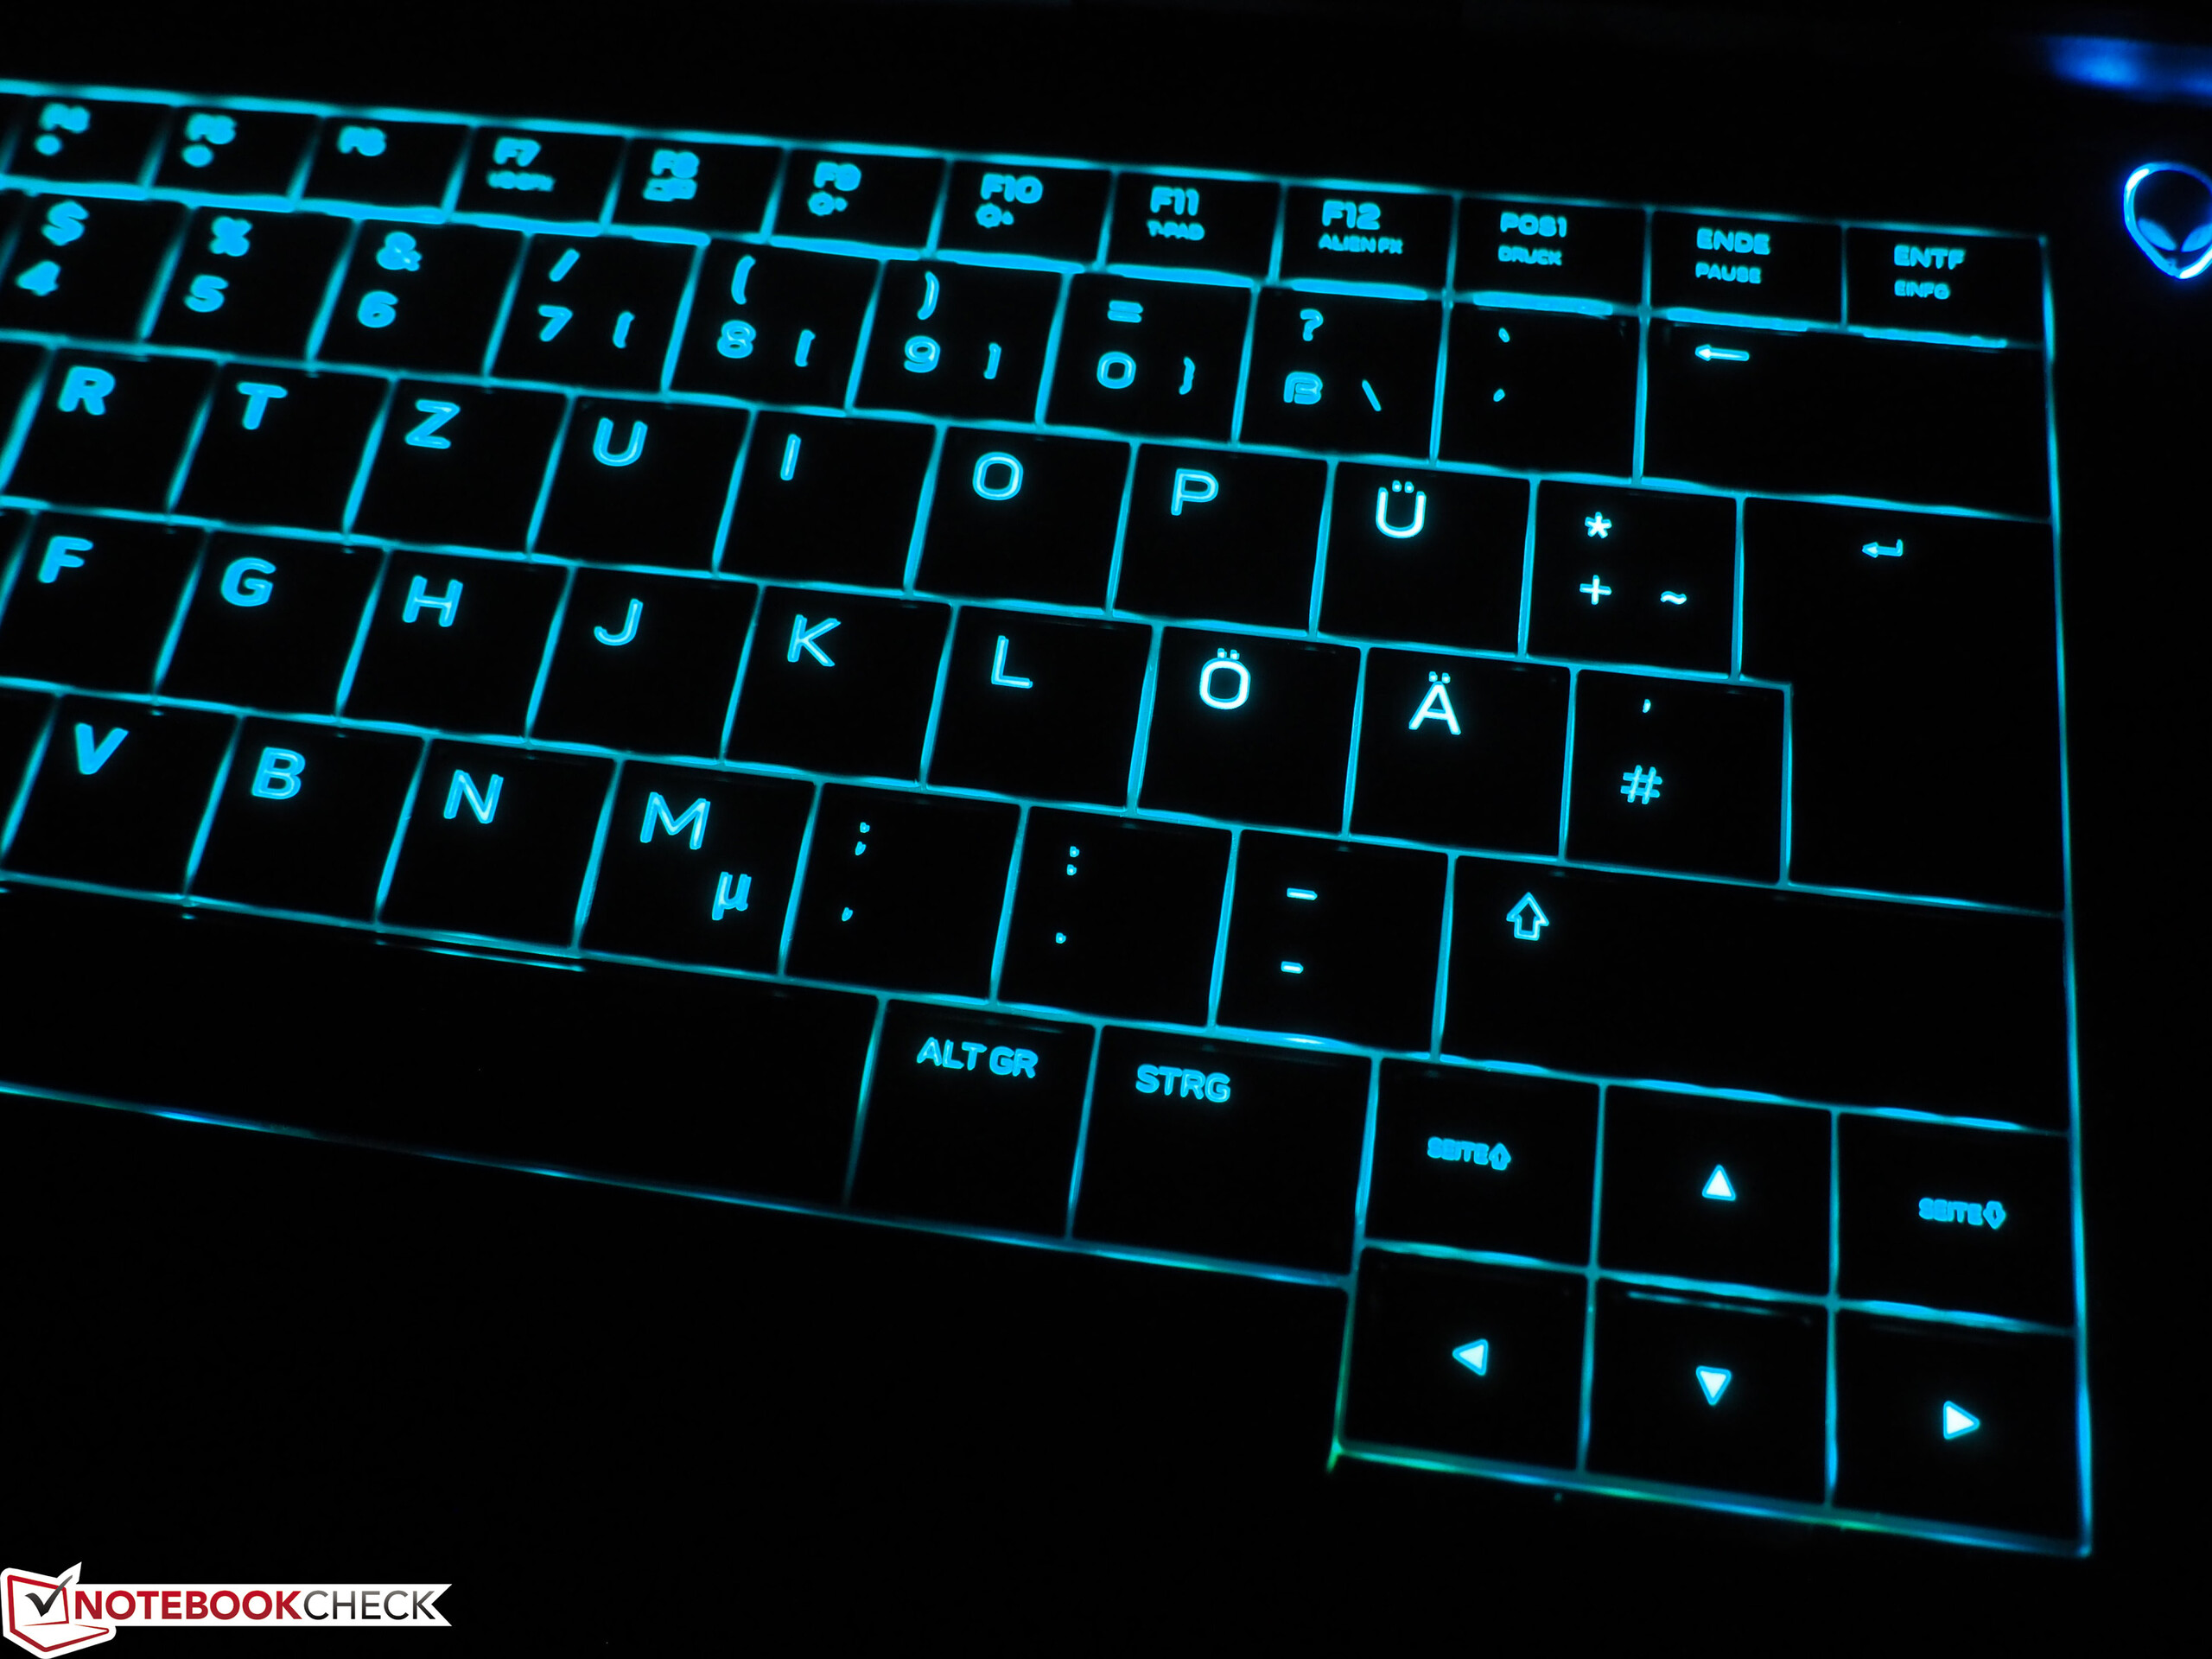
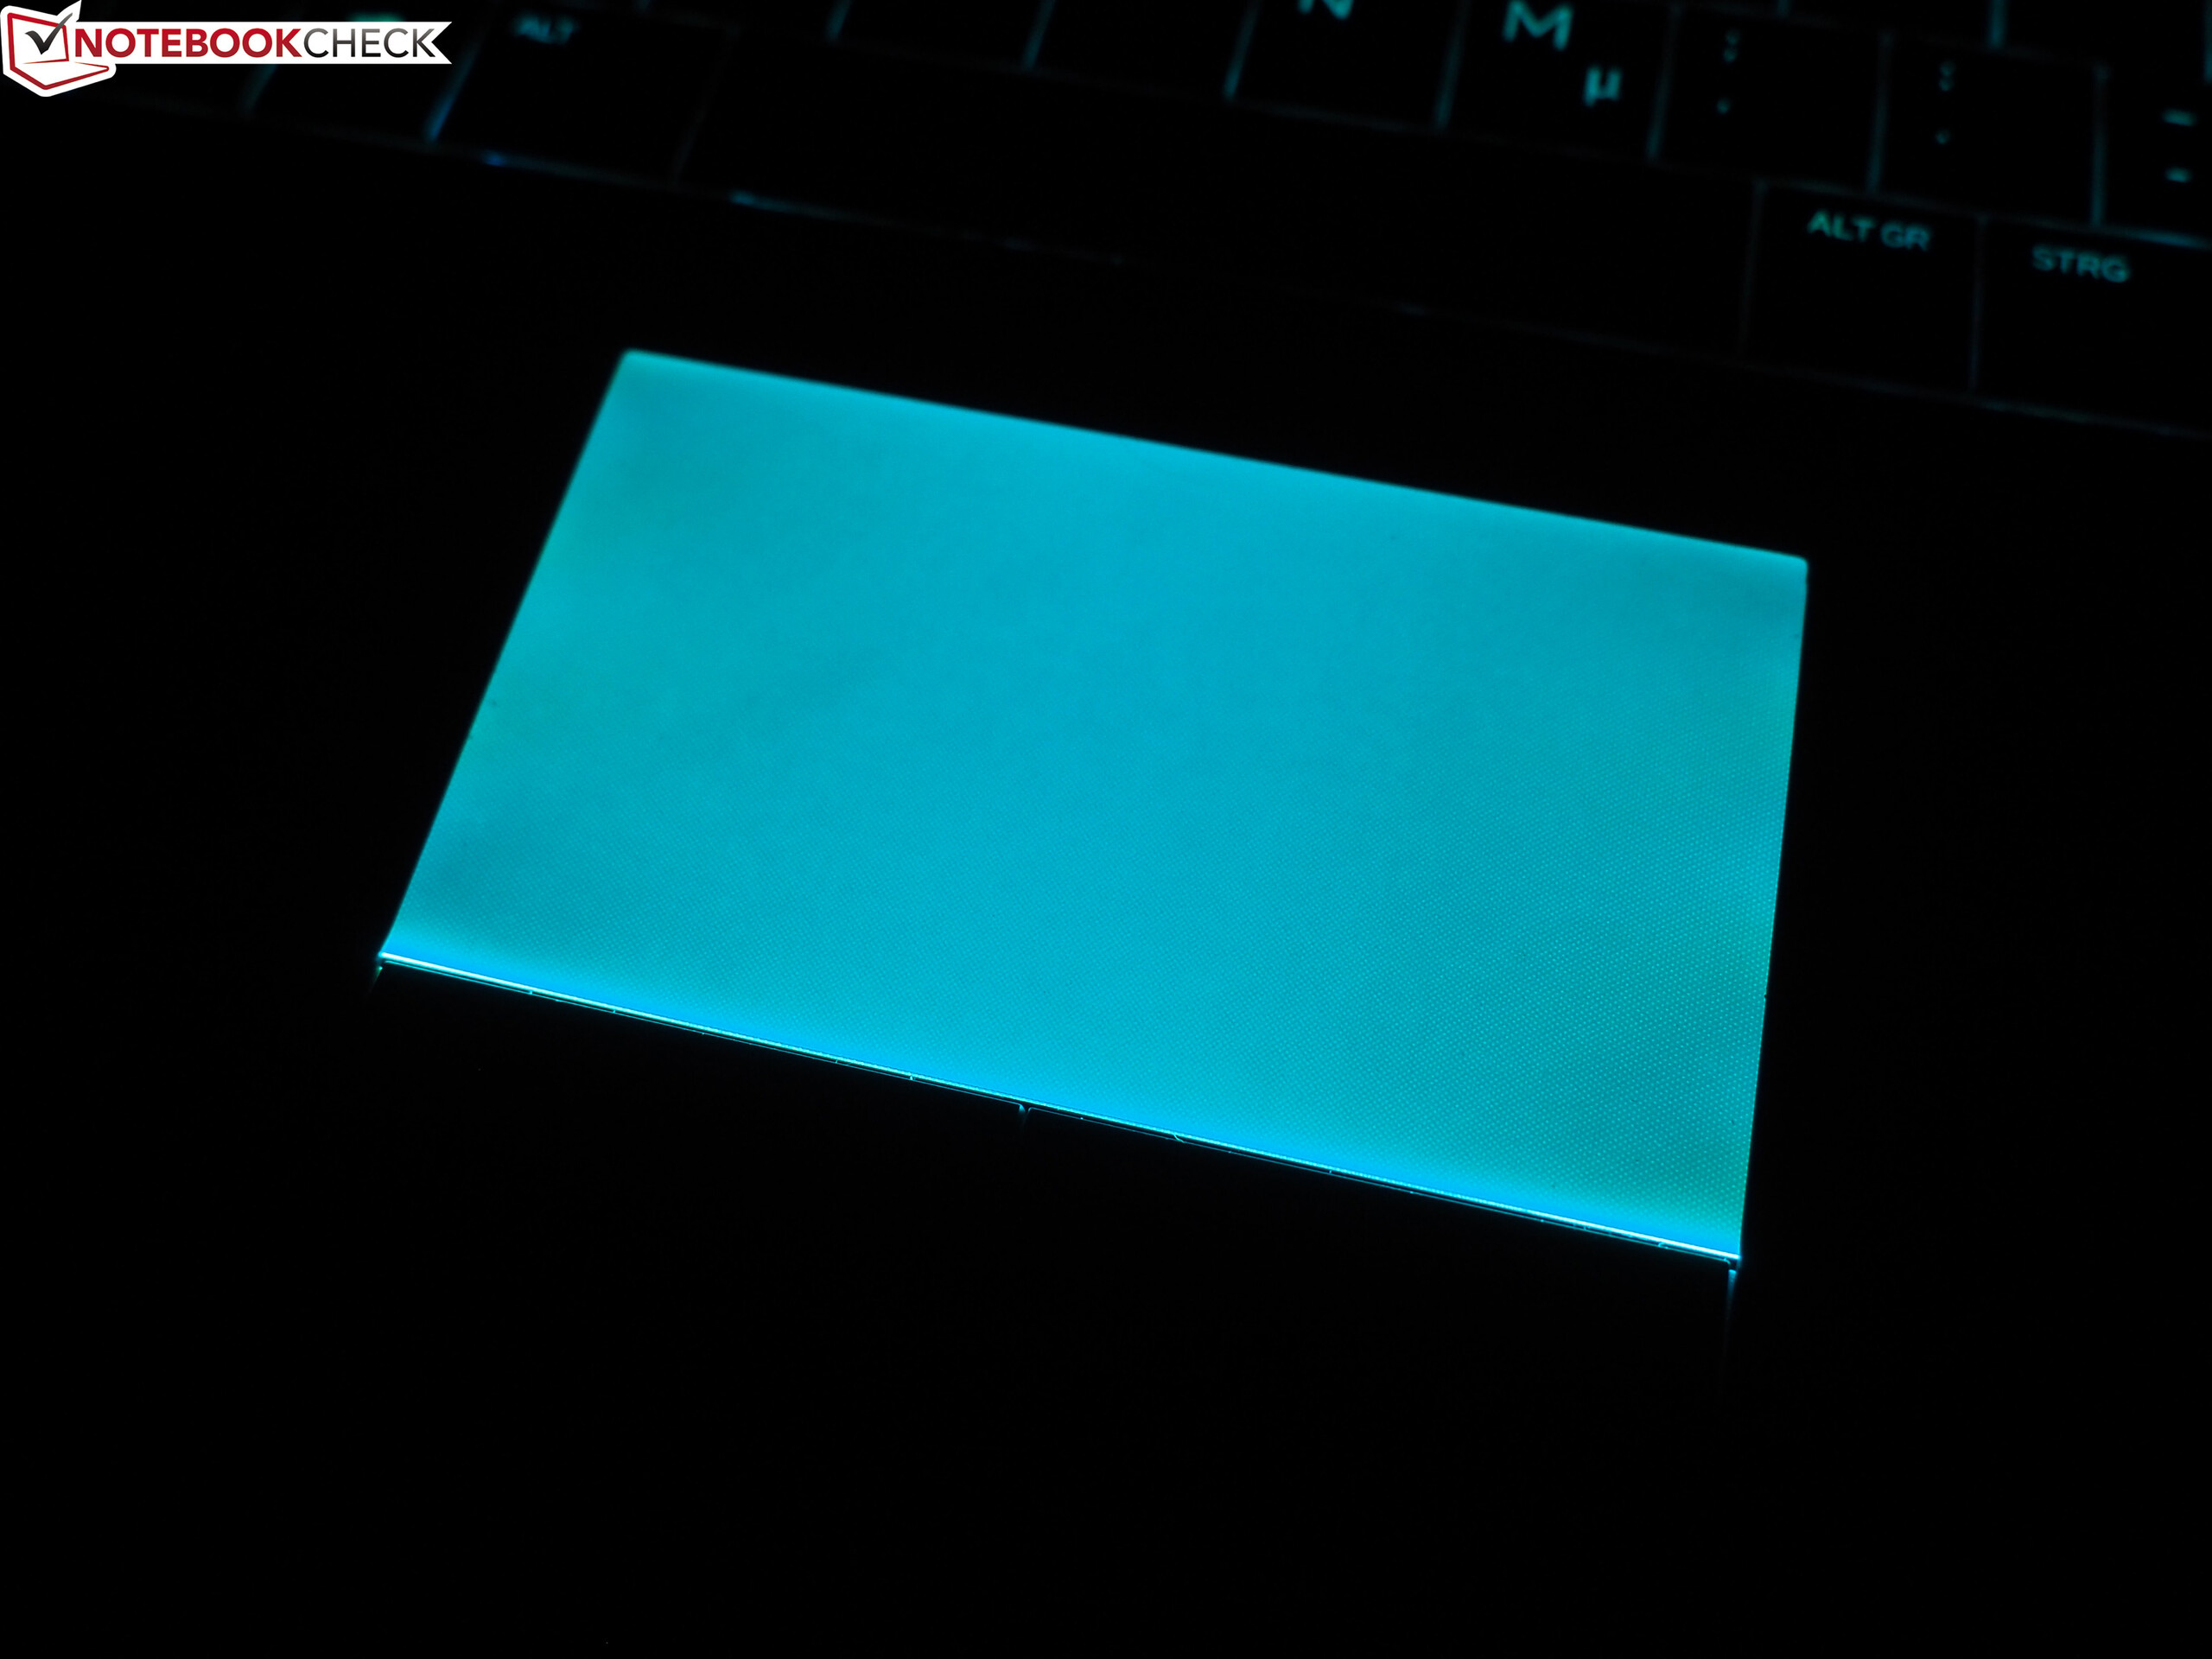
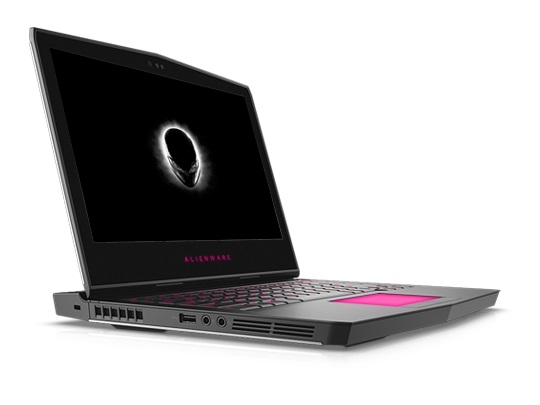
The chassis in particular deserves praise. As with old Alienware systems, it is very stylish, sophisticated, stable and well-built. You also get many lighting elements, which make it easy to use in the dark. Keyboard and touchpad can also meet the premium expectations for the most part. However, the QHD OLED panel (2560x1440 pixels) of the high-end SKU was the most impressive component. It does not matter if you look at the viewing angles, colors, black value, contrast or response times: Typical TN and IPS panels are beaten in all respects. However, you should know that the glossy surface with touch functionality creates a lot of reflections.
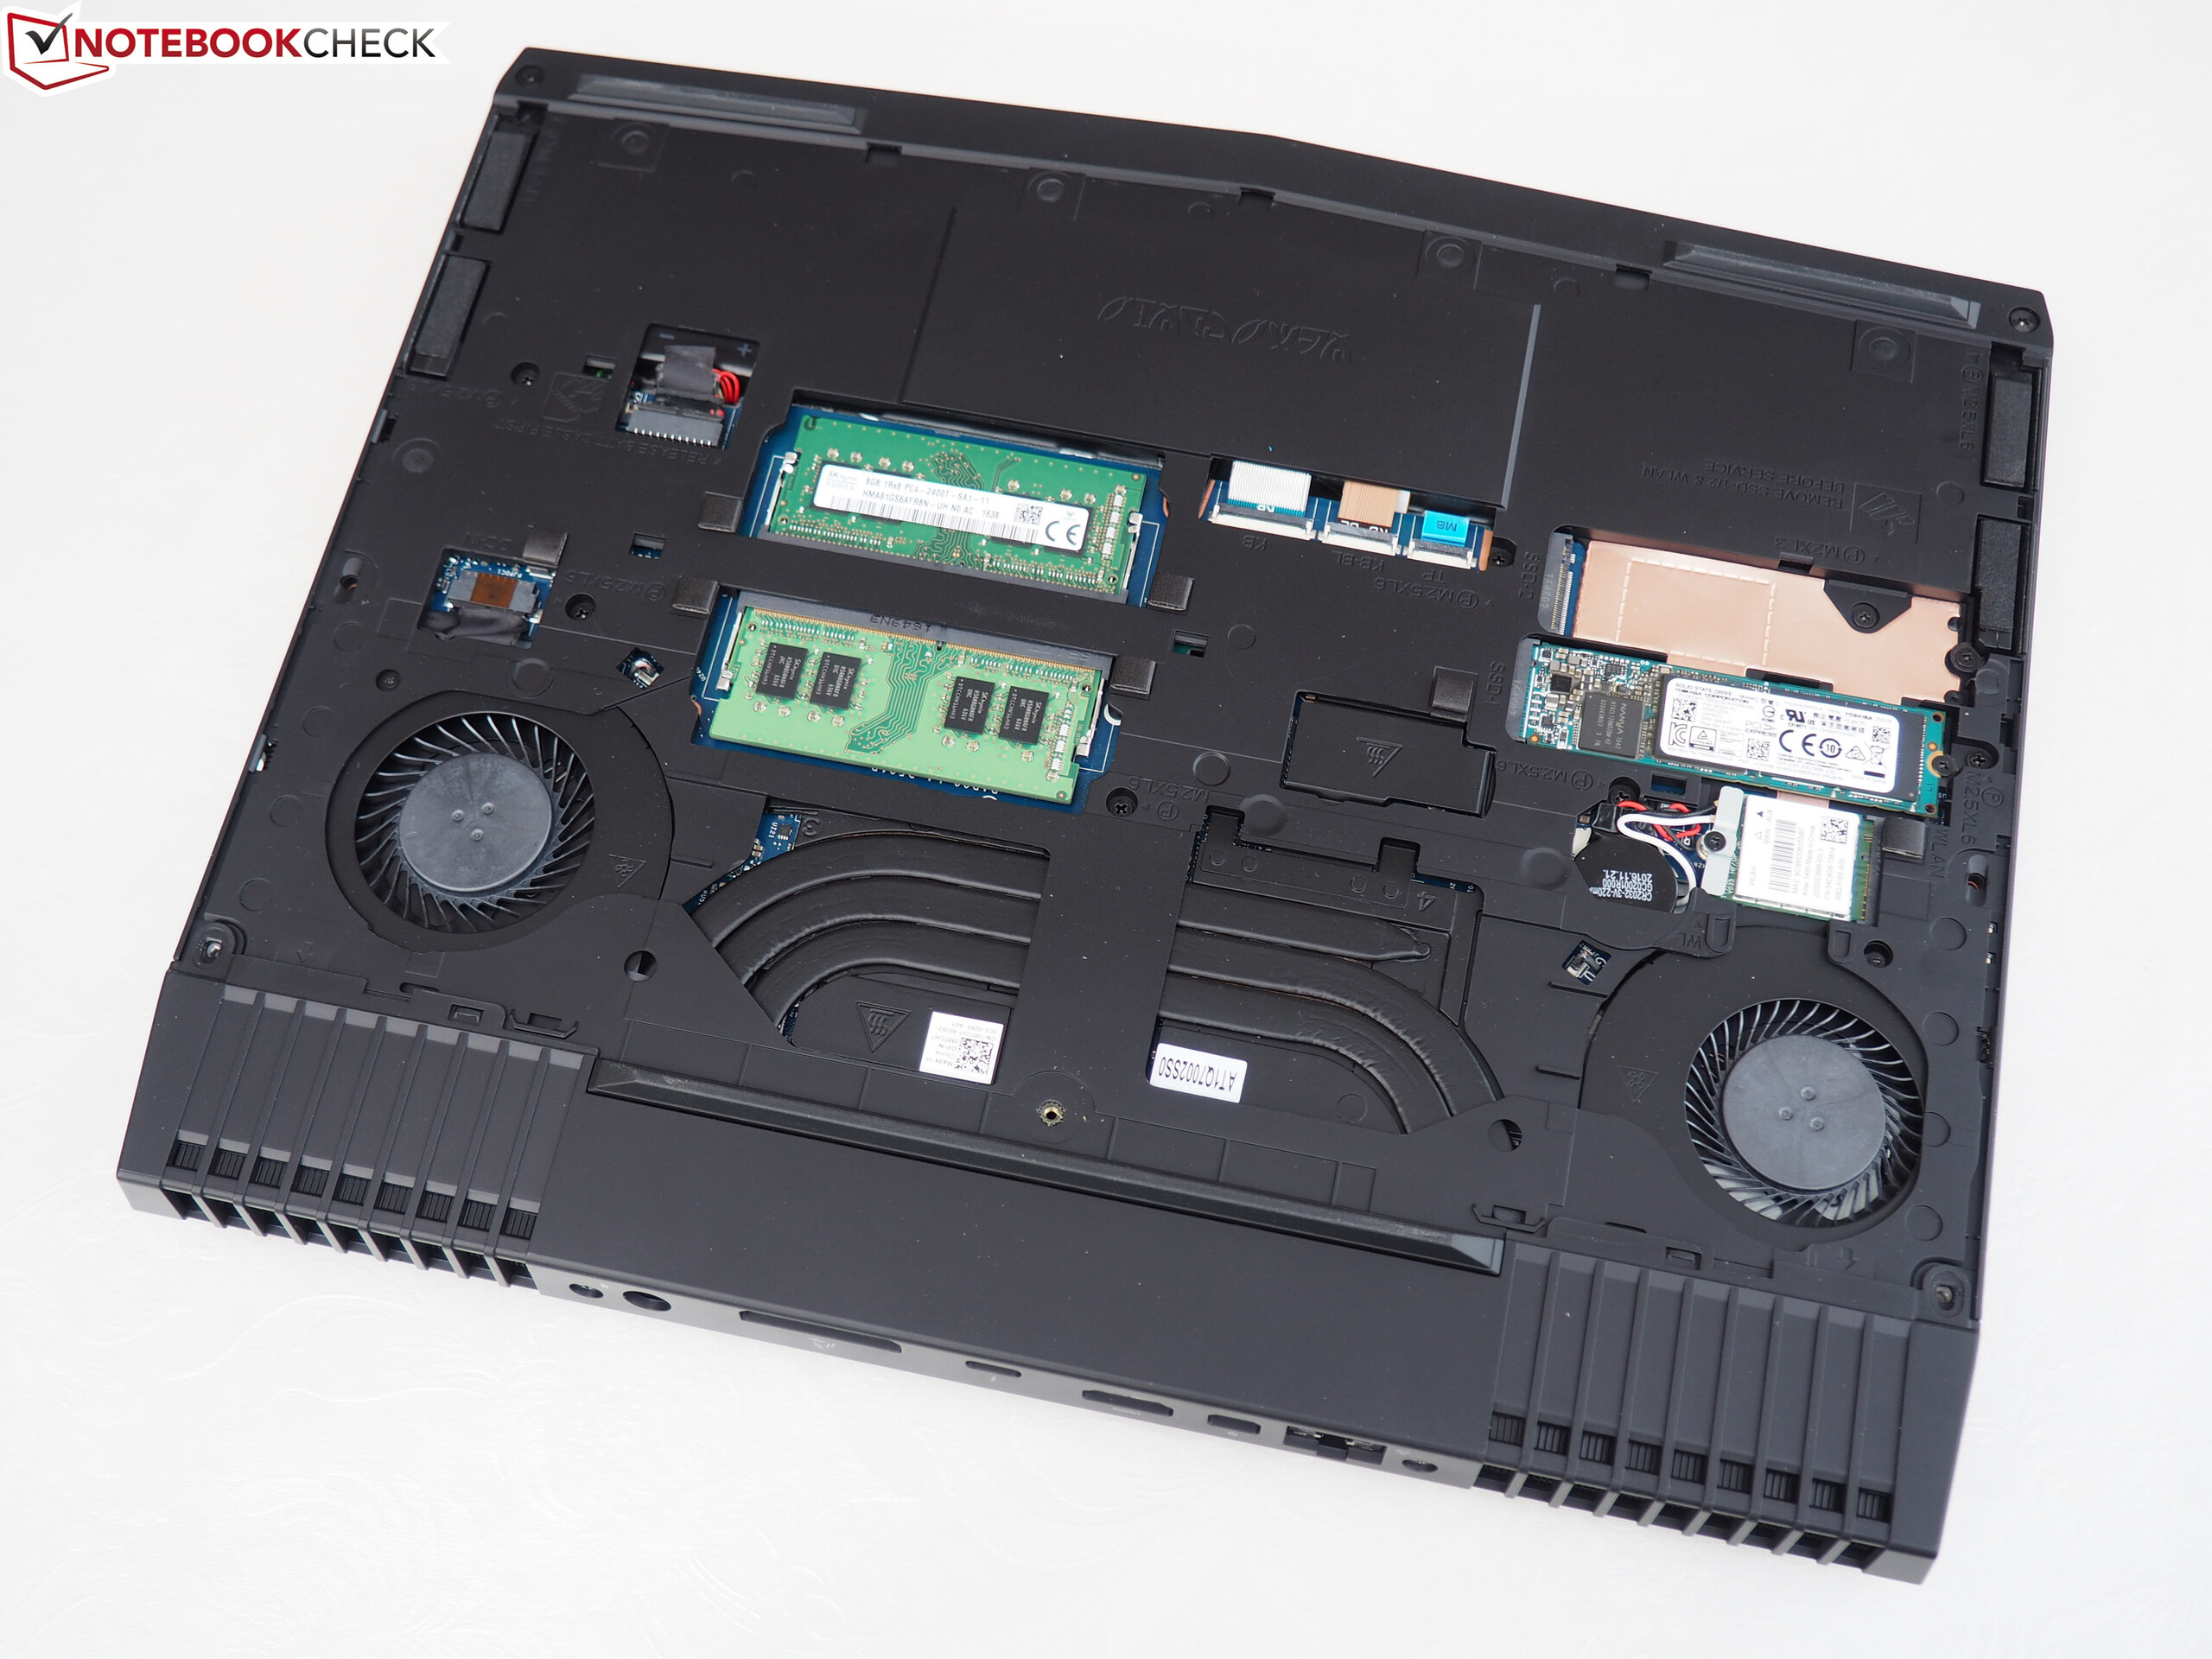
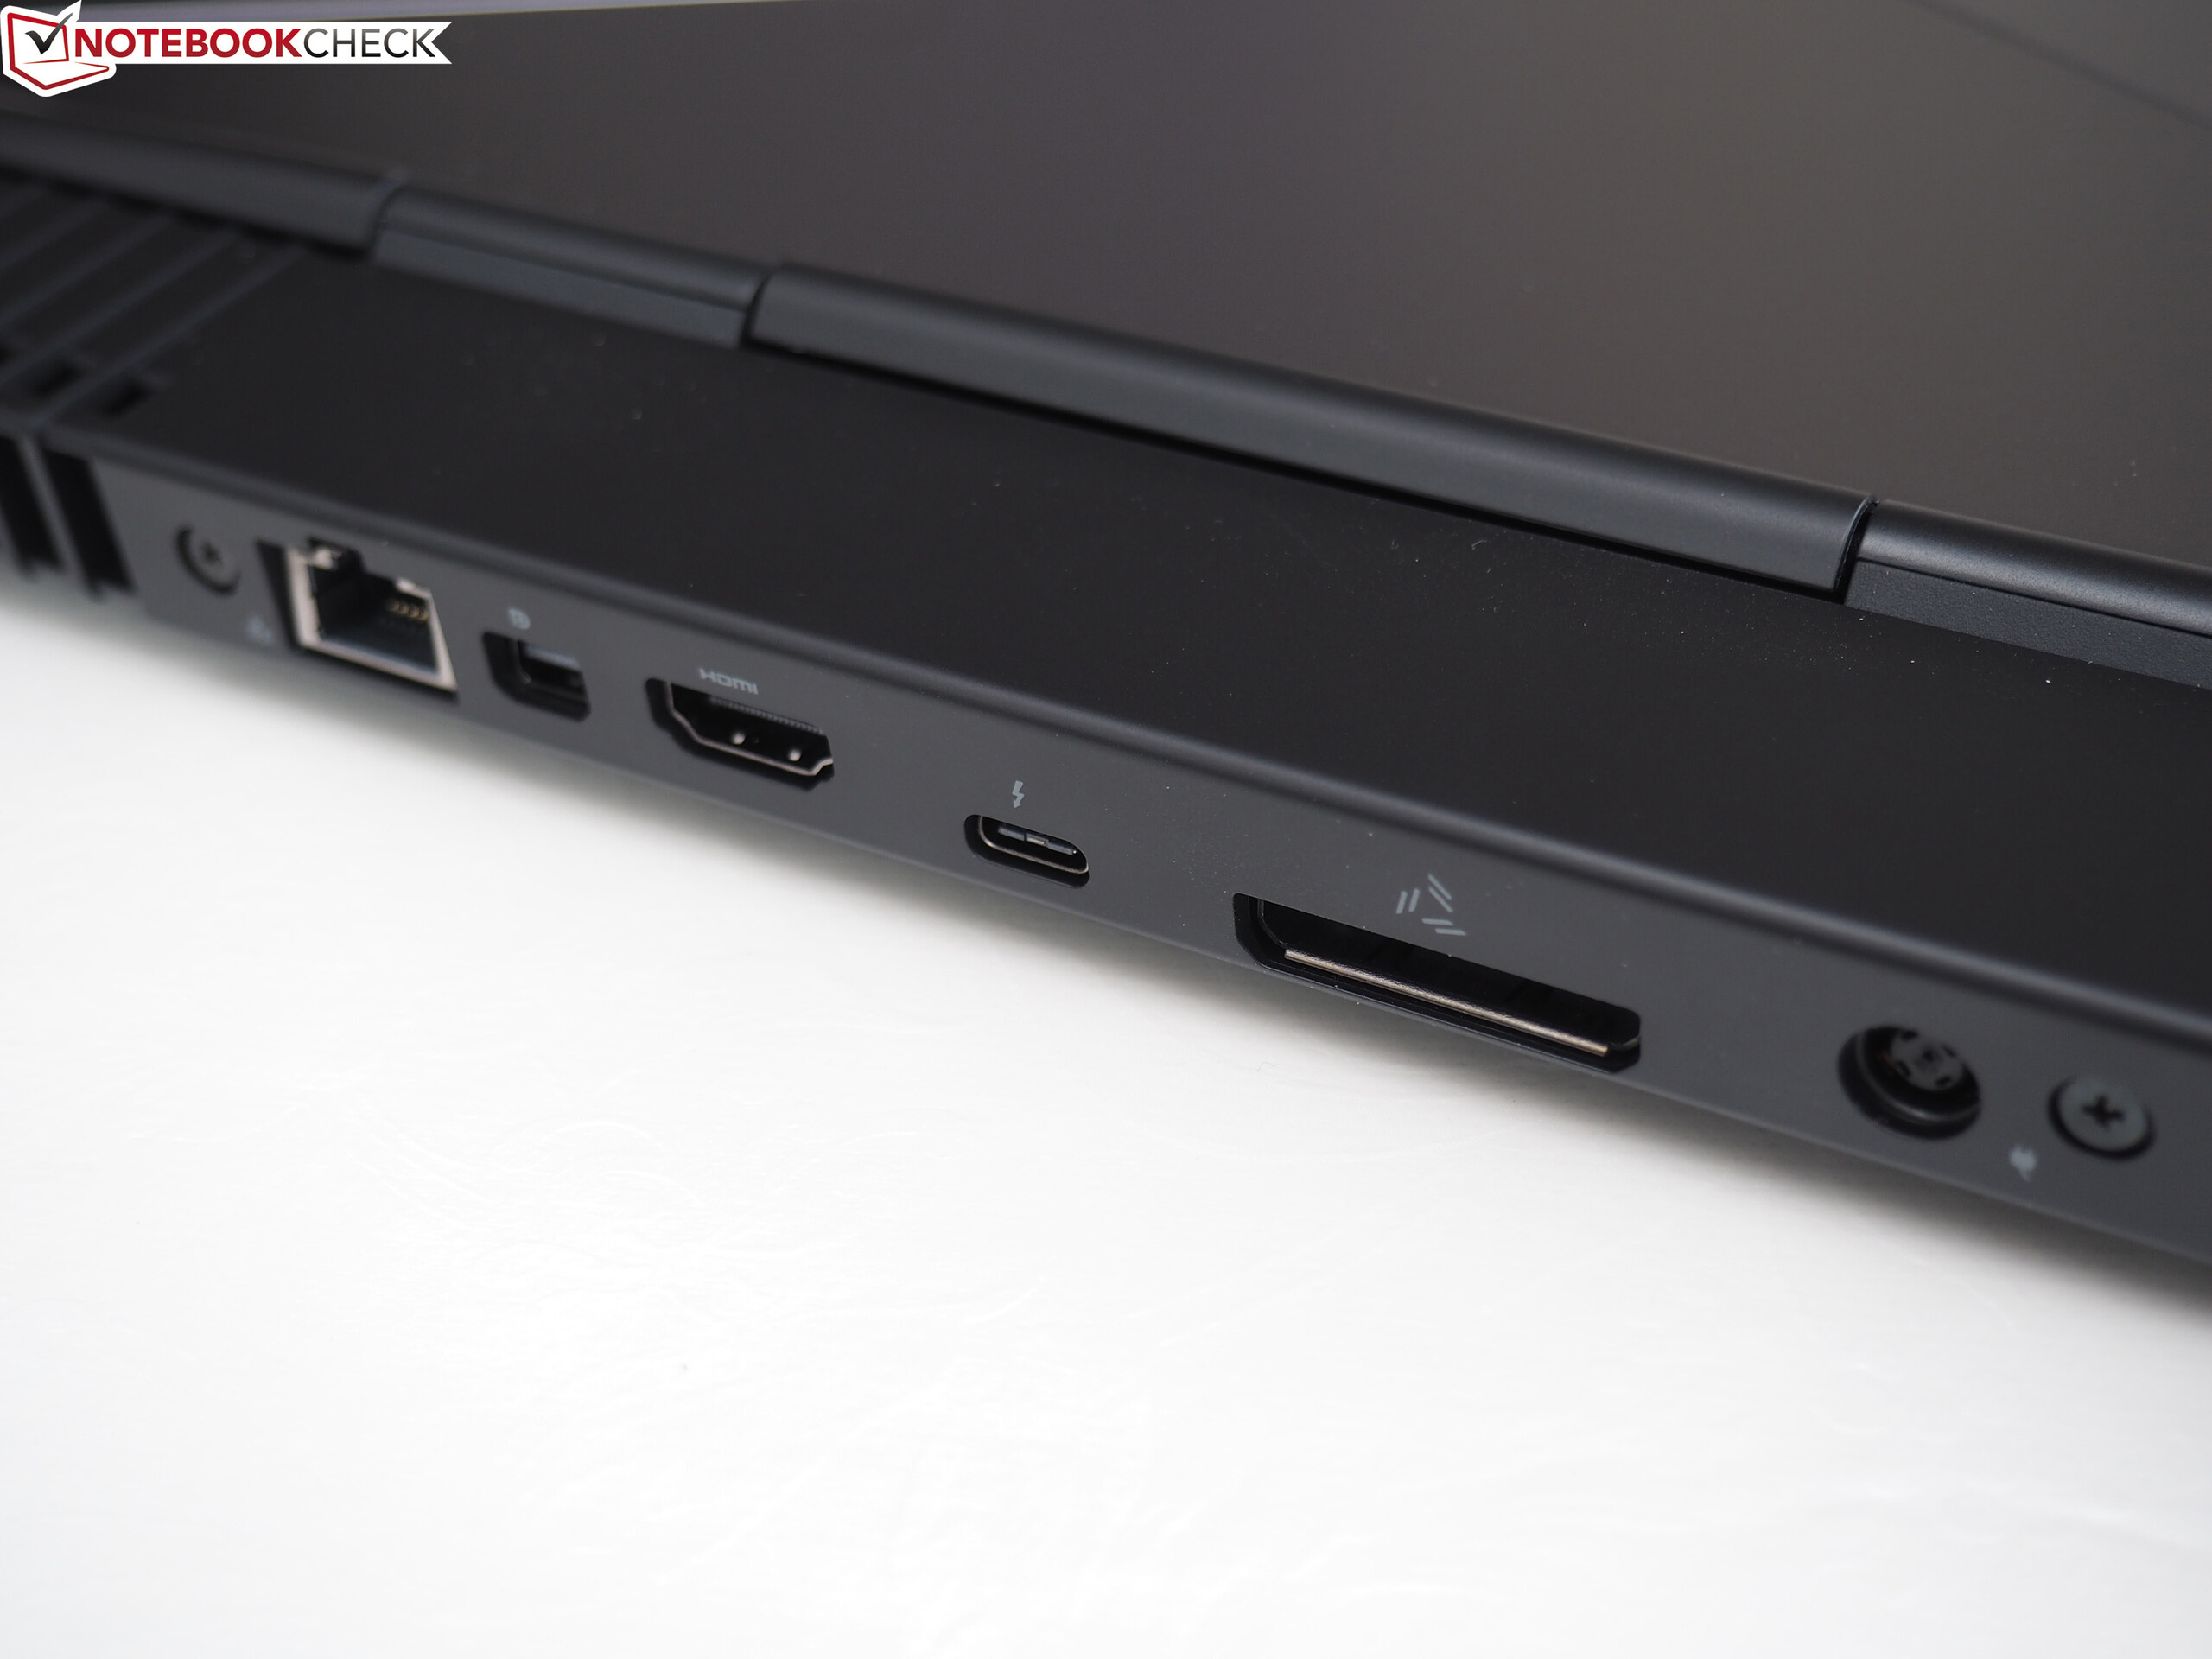
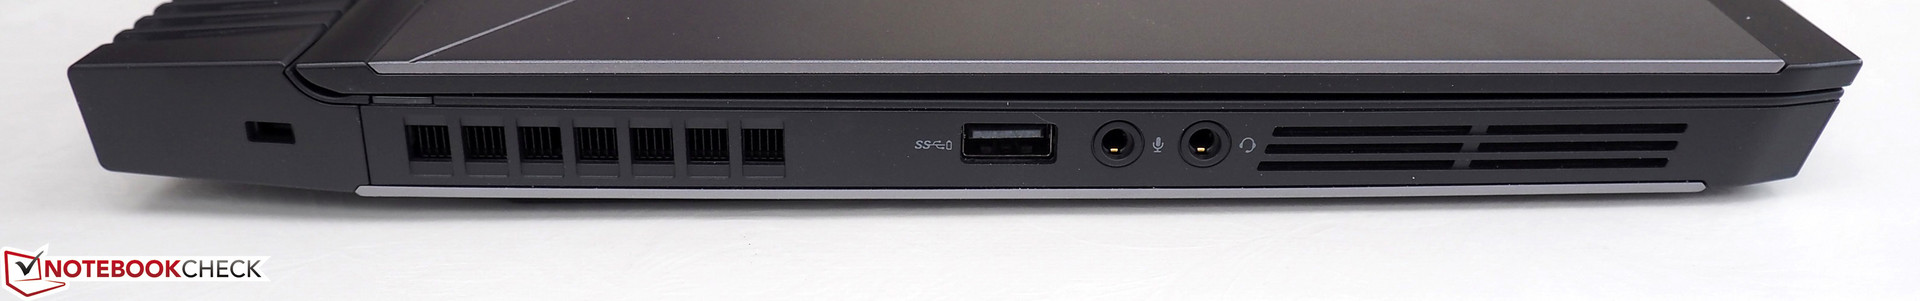
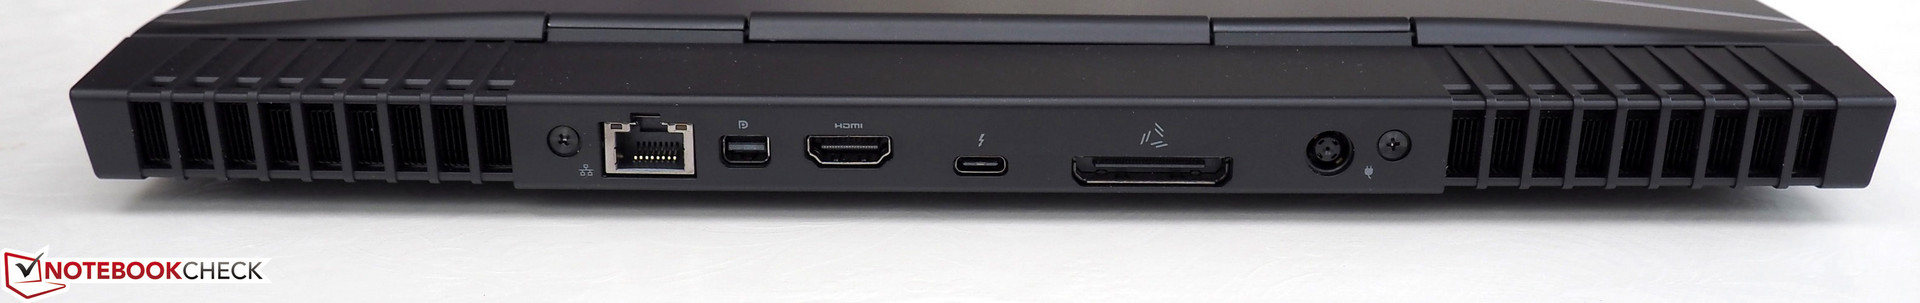
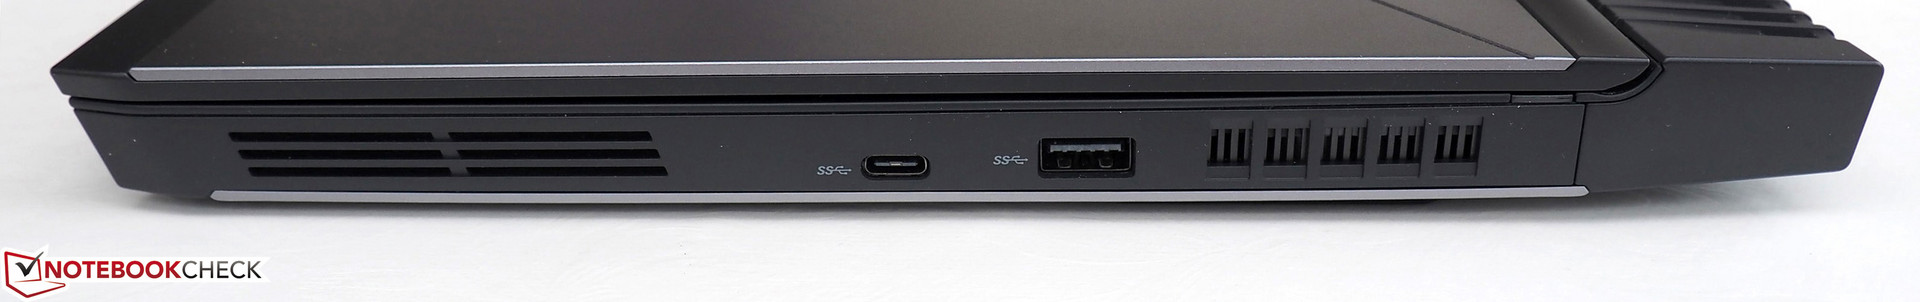
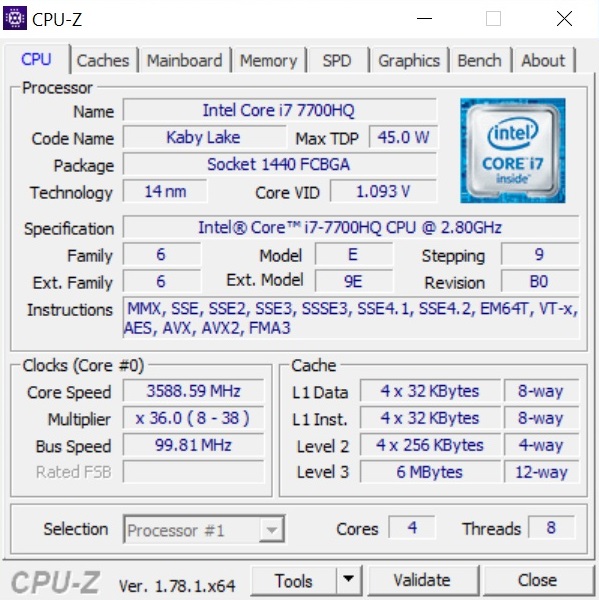
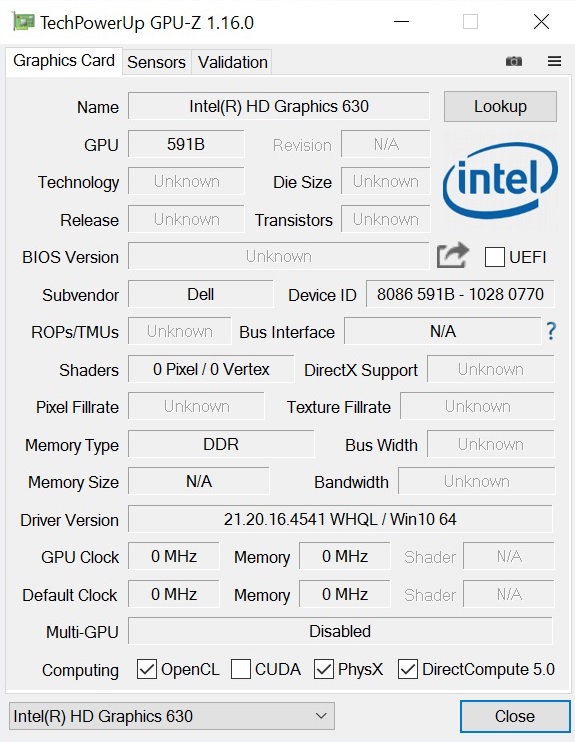
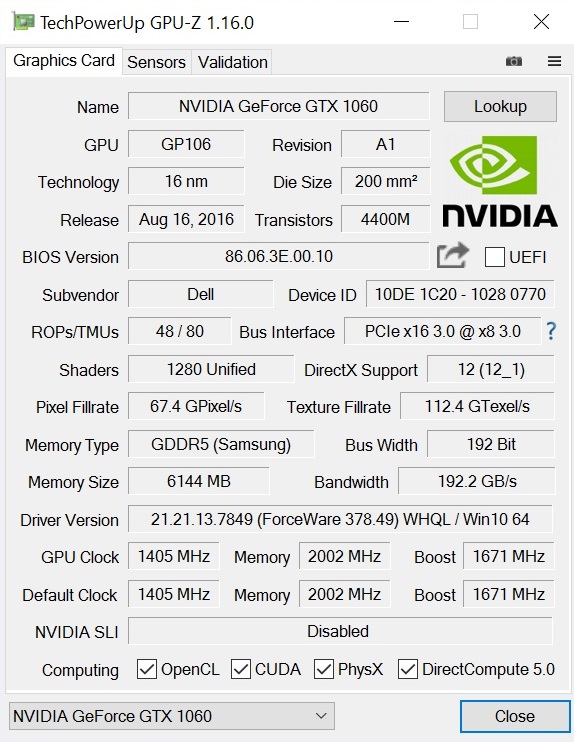
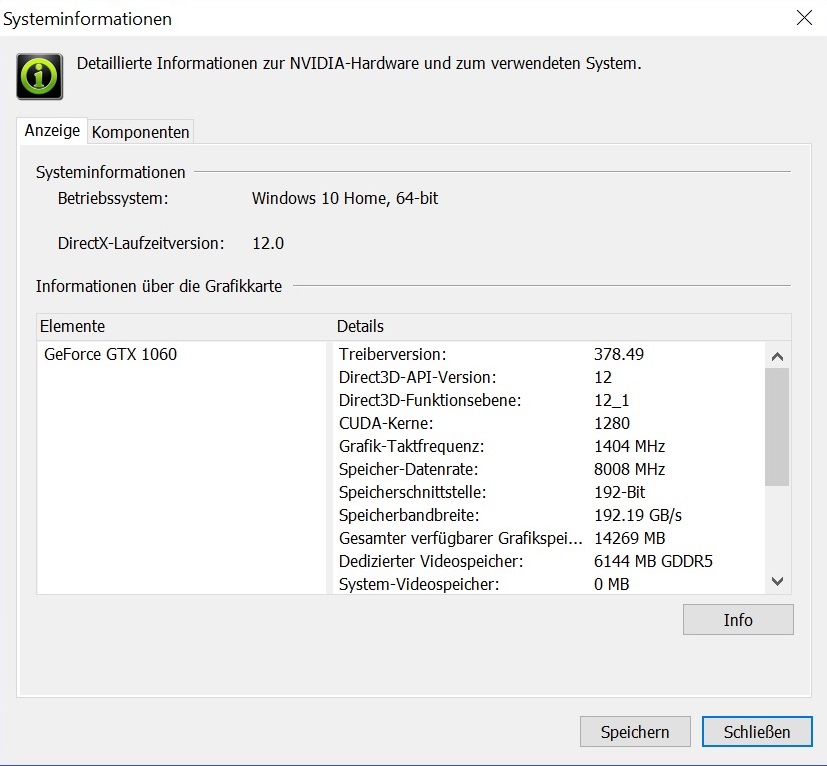
The manufacturer has included the latest and greatest hardware currently available. This starts with eye-tacking over the M.2 NVMe-SSD all the way up to the full-fledged Kaby Lake processor in combination with a high-end GPU from Nvidia's Pascal generation: The parent company Dell tries really hard to justify the retail price. Core gamers will only miss G-Sync support and a higher display refresh rate (no 120 Hz option). However, you can attach corresponding monitors via HDMI 2.0 and mini-DisplayPort. External graphics solutions are no problem thanks to Thunderbolt 3 and Alienware's Graphics Amplifier either.
Overall, the Alienware 13 R3 is not only one of the best 13-inch systems on the market, but also one of the best gaming notebooks in general. There are hardly any real problems and points of criticism, so it is by far the best device in our mobile Top 10 ranking. Even the rating of the high-quality Razer Blade is a few points lower (overall rating: 85 instead of 88%).
Alienware 13 R3
- 02/14/2017 v6 (old)
Florian Glaser
Price comparison