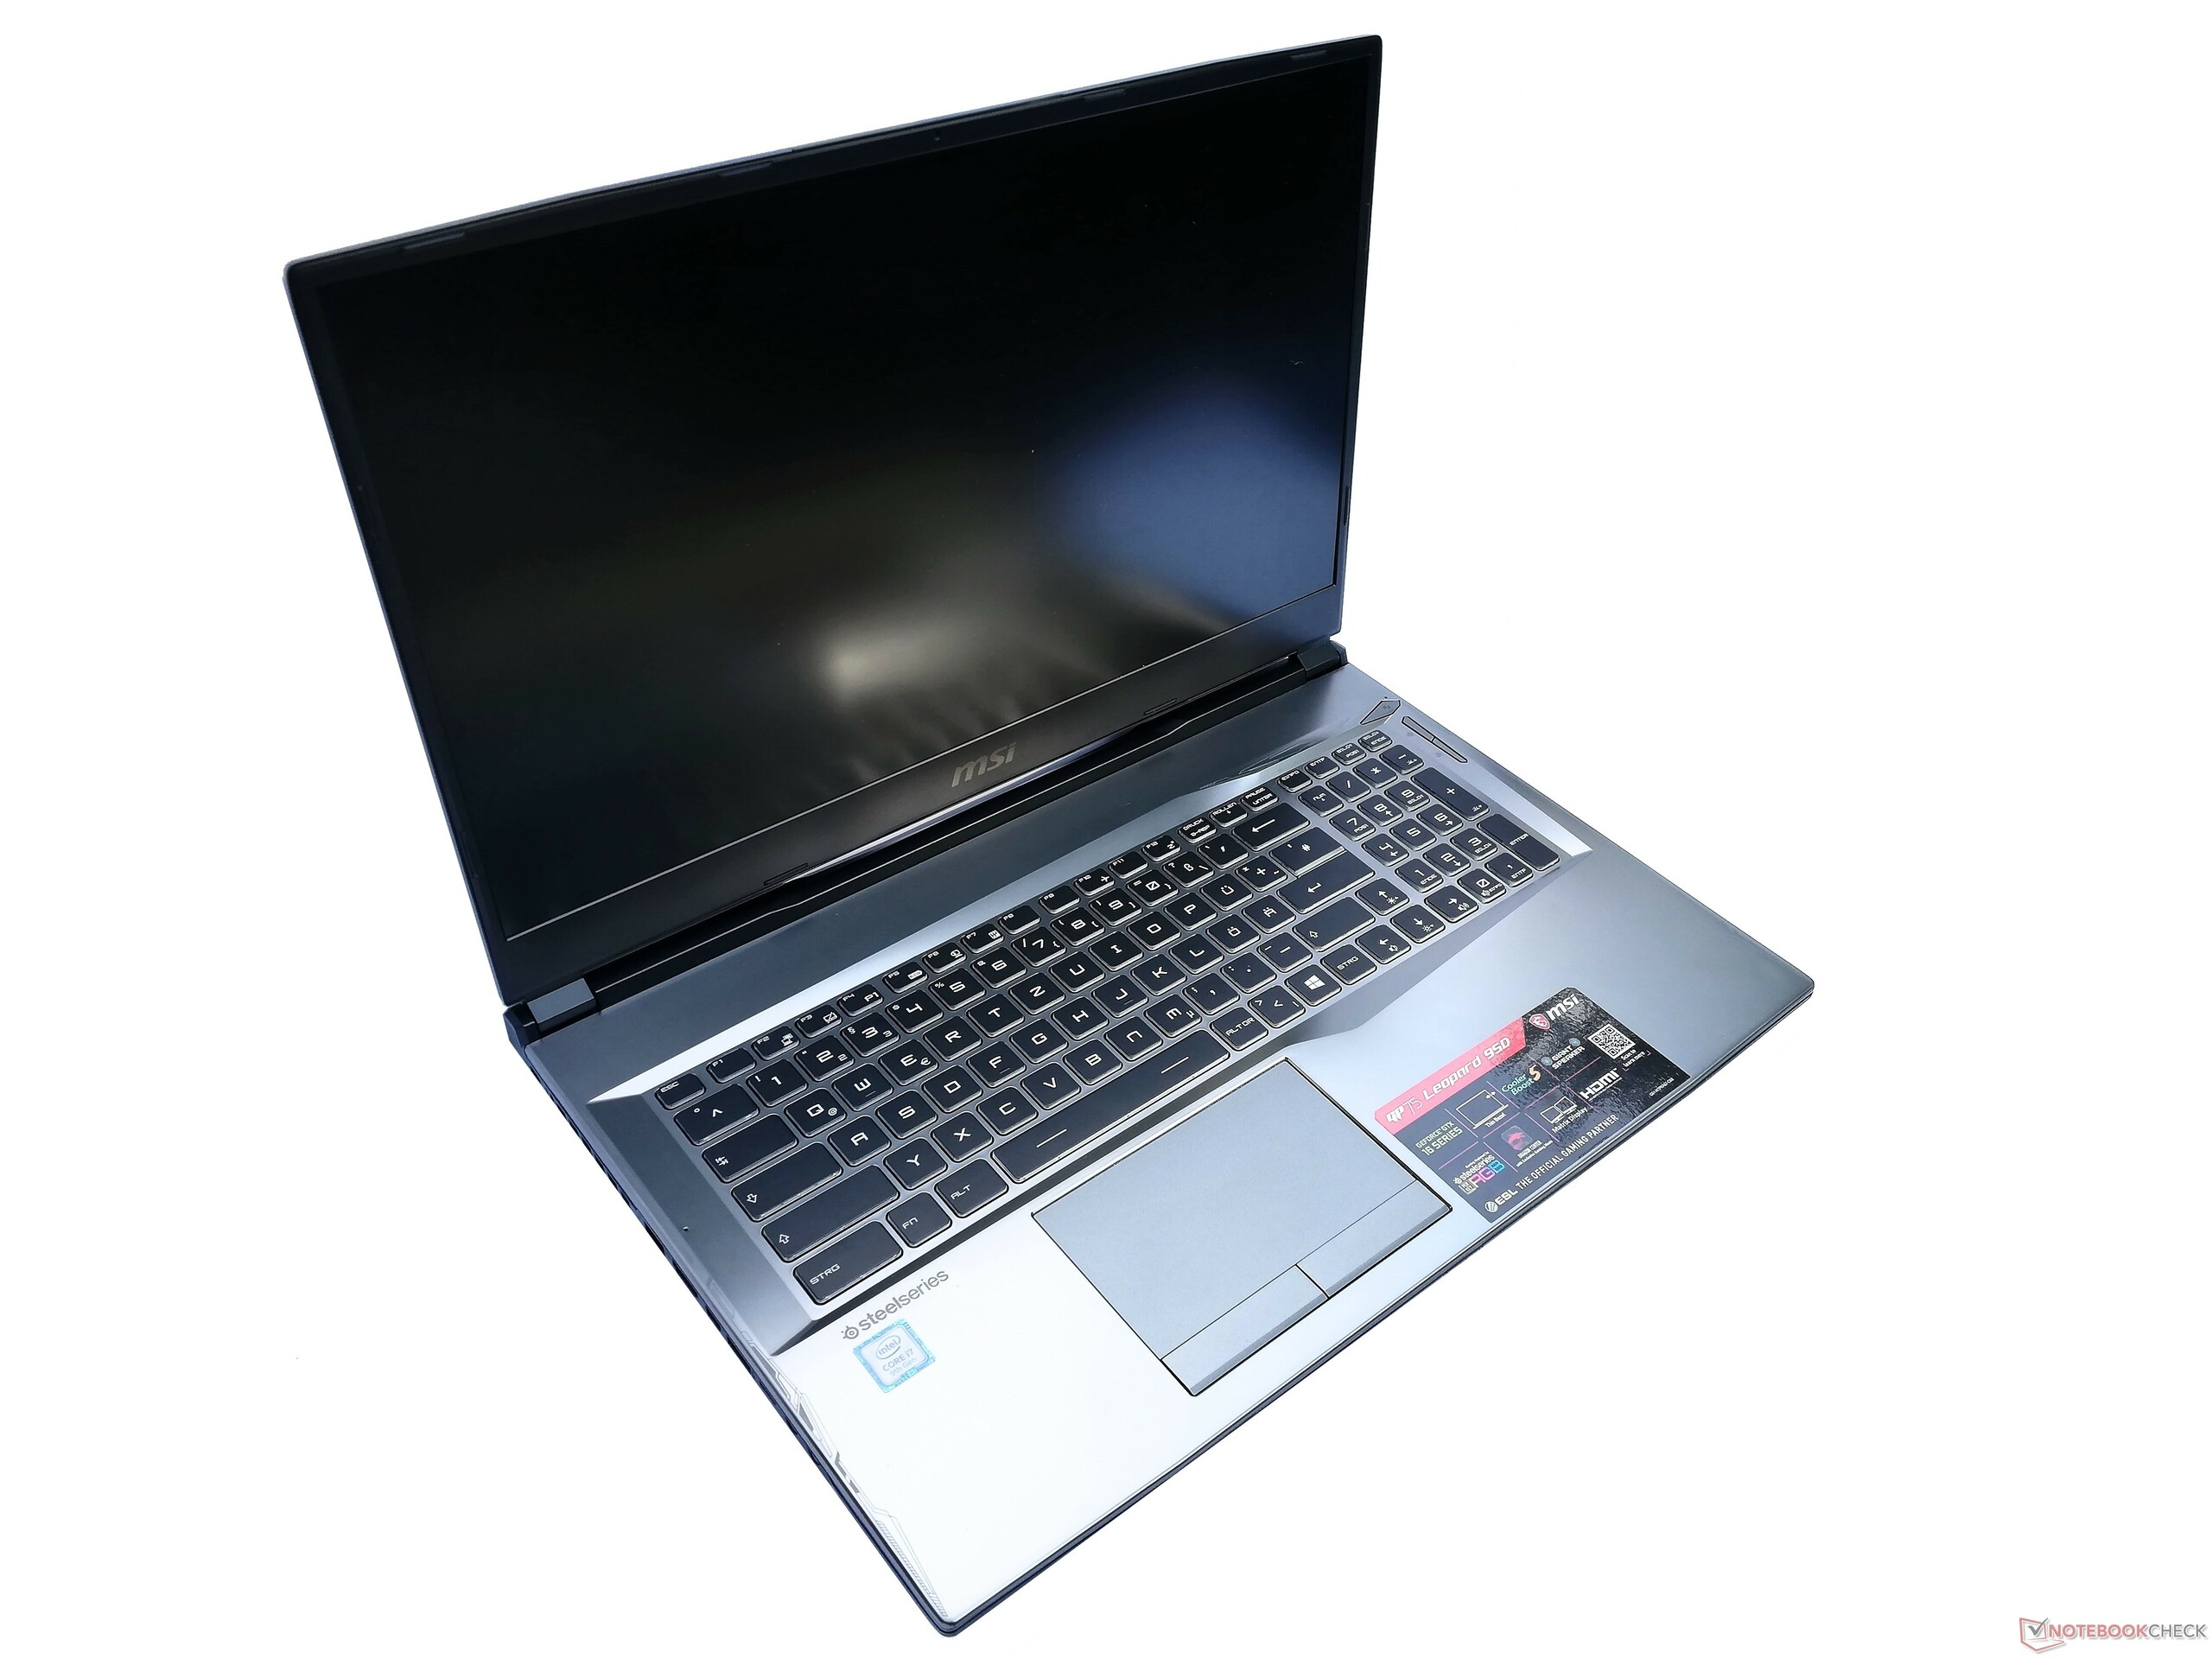
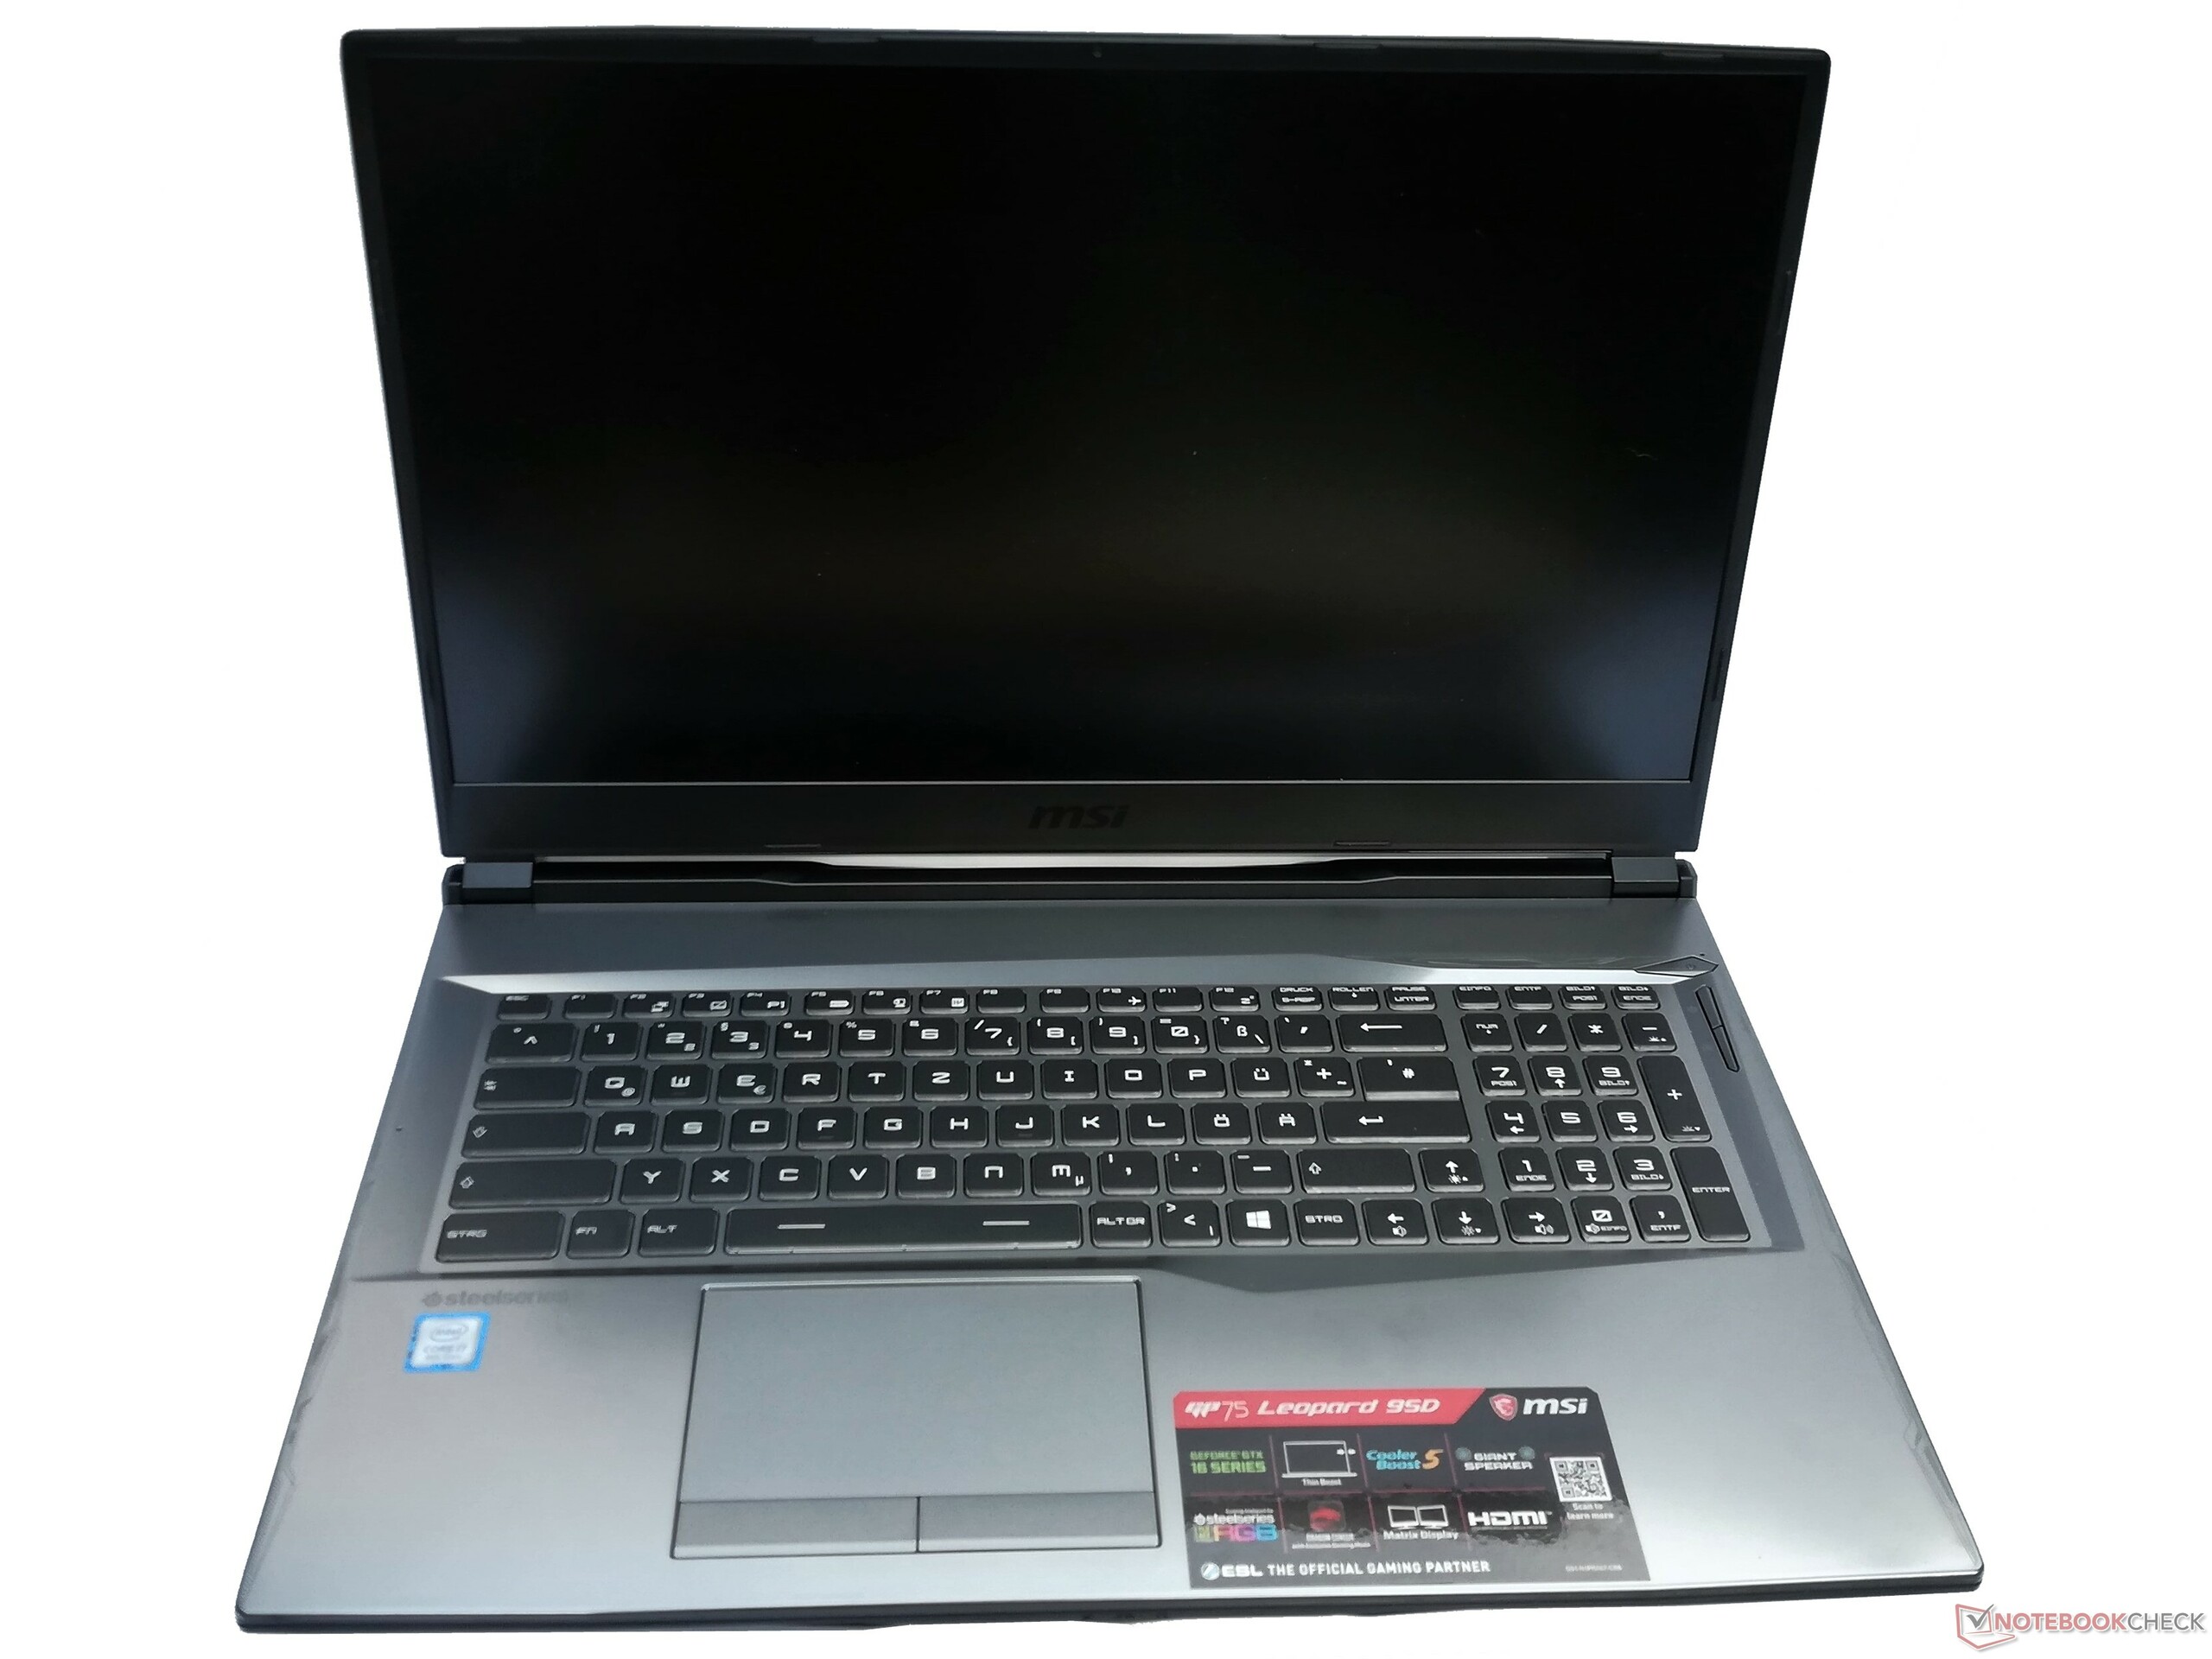
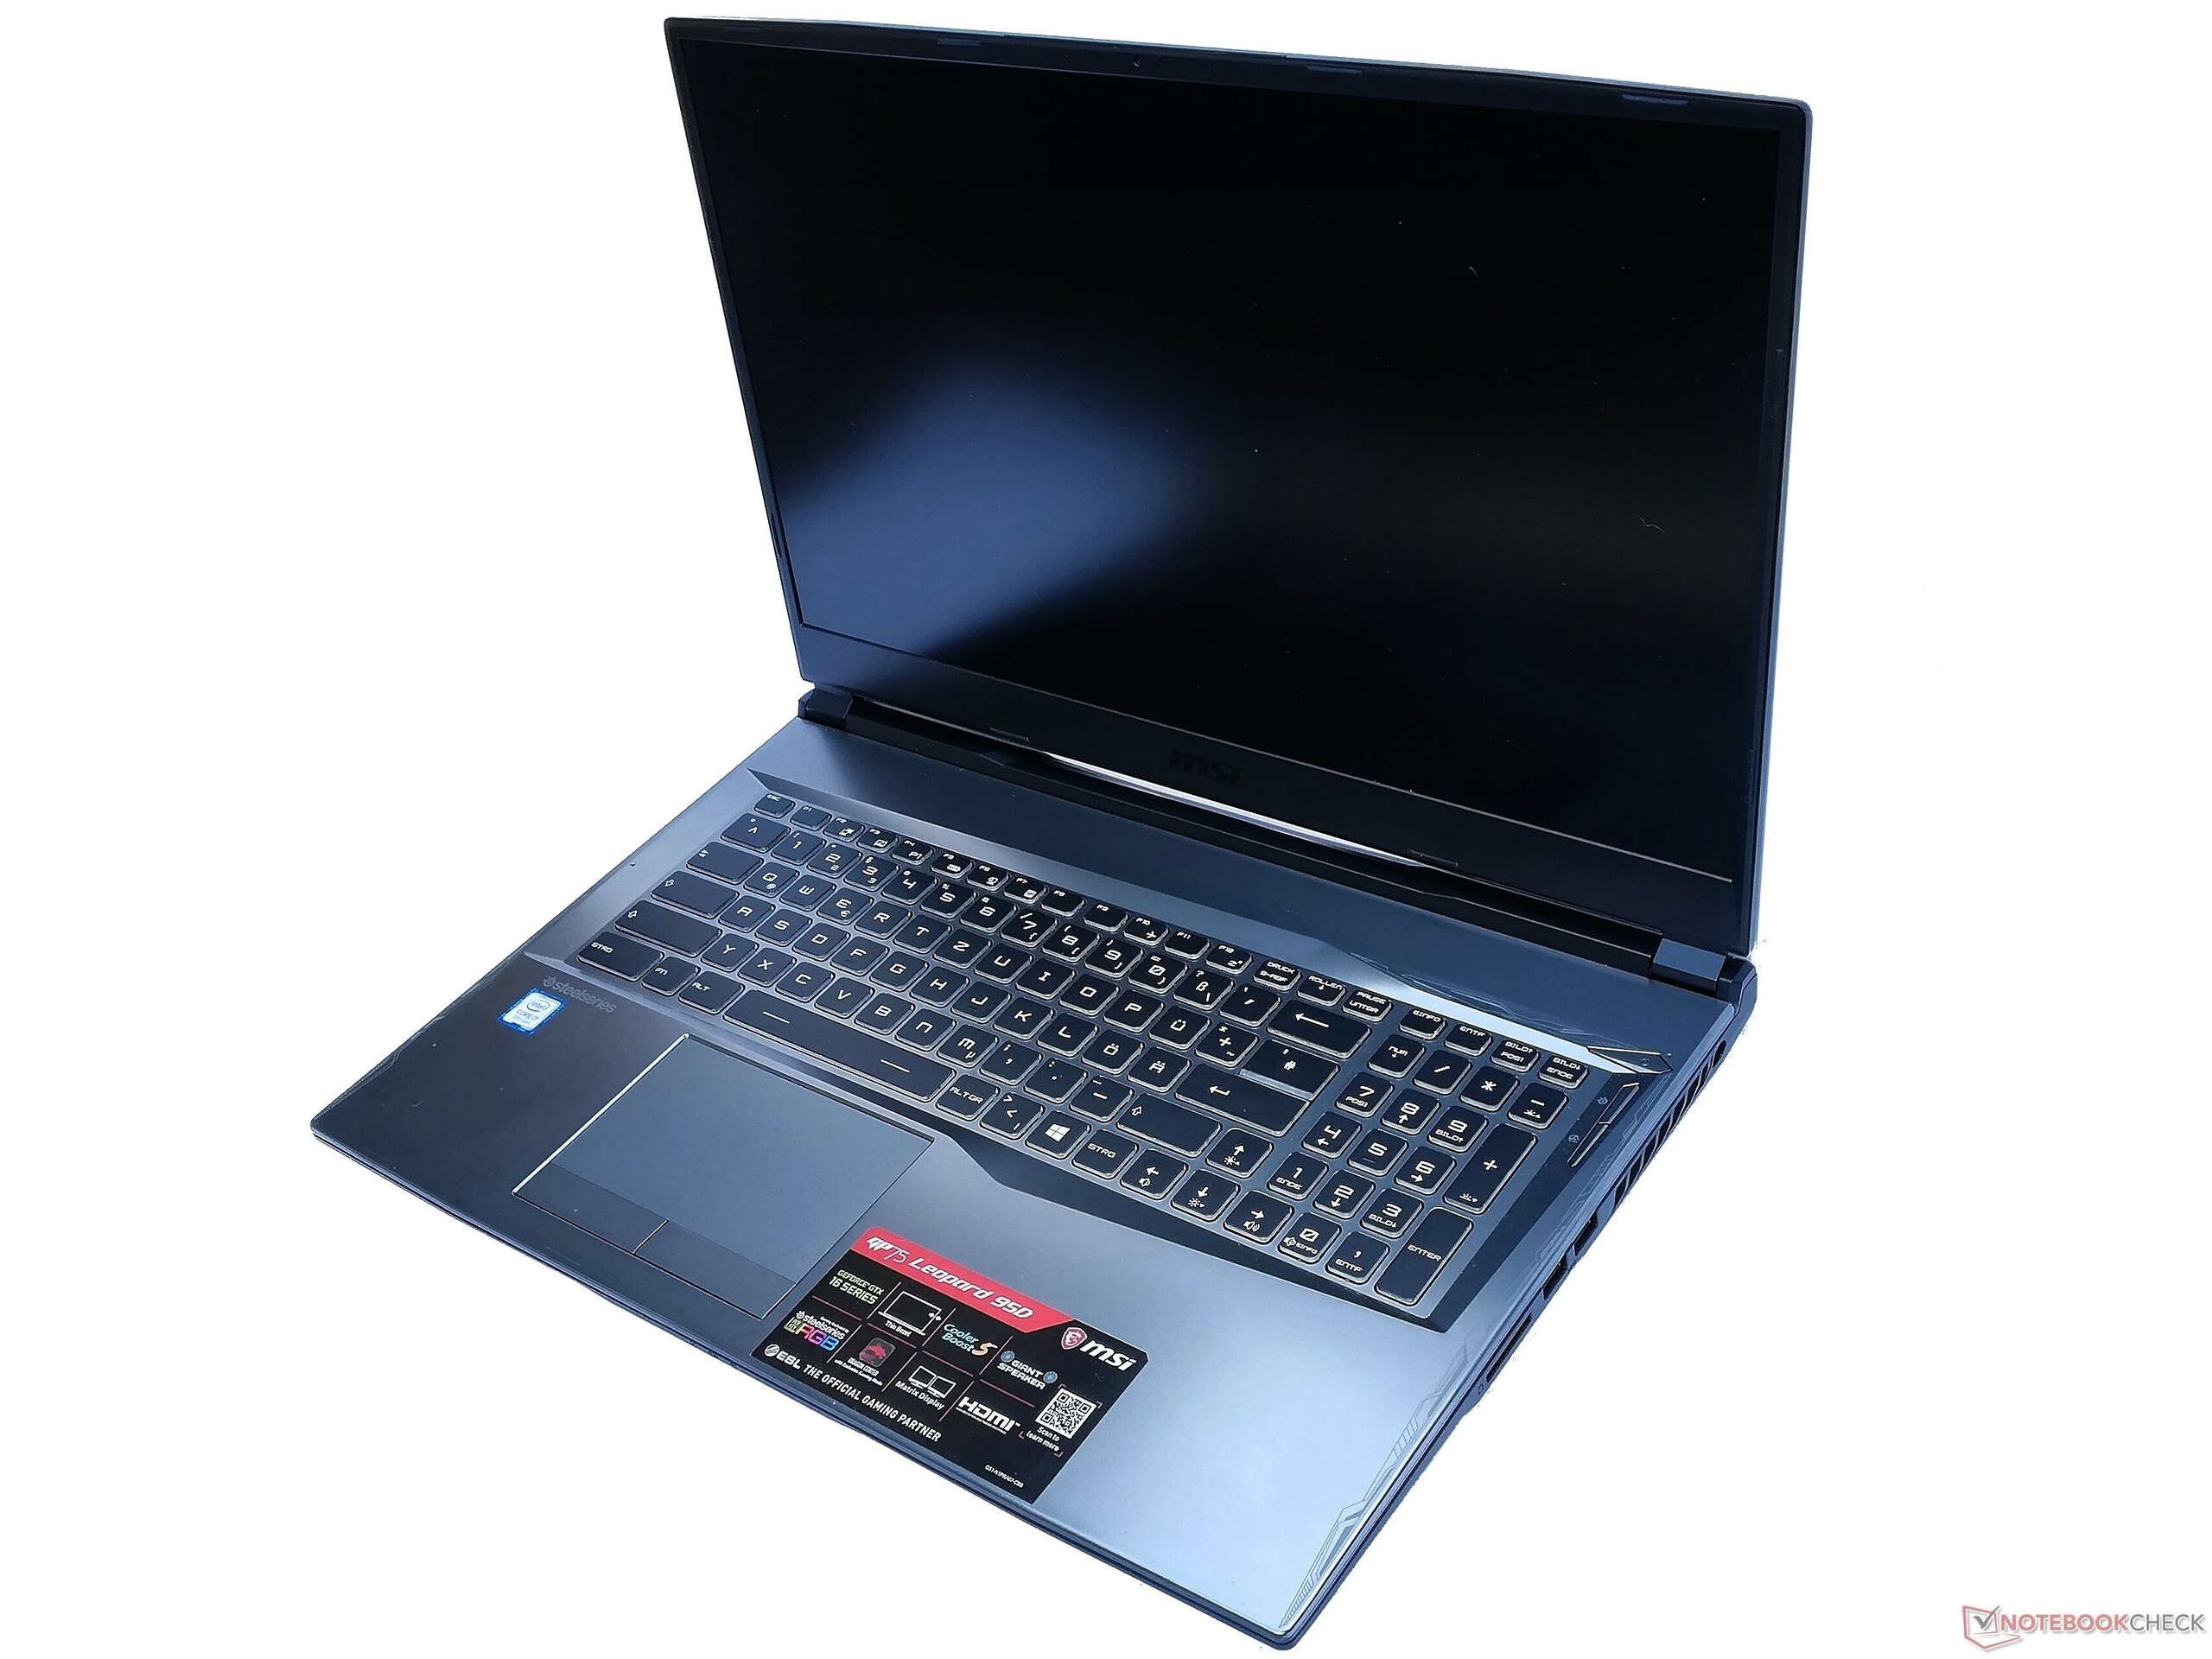
Recension av MSI GP75 Leopard 9SD: Billig spellaptop med en 144 Hz-skärm
| SD Card Reader | |
| average JPG Copy Test (av. of 3 runs) | |
| Genomsnitt av klass Gaming (20.9 - 210, n=54, senaste 2 åren) | |
| CUK Model Z GK5CQ7Z (Toshiba Exceria Pro SDXC 64 GB UHS-II) | |
| MSI GP75 Leopard 9SD (Toshiba Exceria Pro SDXC 64 GB UHS-II) | |
| Dell G5 15 5590 (Toshiba Exceria Pro SDXC 64 GB UHS-II) | |
| maximum AS SSD Seq Read Test (1GB) | |
| Genomsnitt av klass Gaming (25.5 - 261, n=51, senaste 2 åren) | |
| CUK Model Z GK5CQ7Z (Toshiba Exceria Pro SDXC 64 GB UHS-II) | |
| Dell G5 15 5590 (Toshiba Exceria Pro SDXC 64 GB UHS-II) | |
| MSI GP75 Leopard 9SD (Toshiba Exceria Pro SDXC 64 GB UHS-II) | |
| Networking | |
| iperf3 transmit AX12 | |
| Aorus 15 W9 | |
| MSI GP75 Leopard 9SD | |
| Dell G5 15 5590 | |
| CUK Model Z GK5CQ7Z | |
| Lenovo Legion Y530-15ICH | |
| iperf3 receive AX12 | |
| MSI GP75 Leopard 9SD | |
| Aorus 15 W9 | |
| Dell G5 15 5590 | |
| CUK Model Z GK5CQ7Z | |
| Lenovo Legion Y530-15ICH | |
| |||||||||||||||||||||||||
Distribution av ljusstyrkan: 91 %
Mitt på batteriet: 420 cd/m²
Kontrast: 1313:1 (Svärta: 0.32 cd/m²)
ΔE ColorChecker Calman: 3.04 | ∀{0.5-29.43 Ø4.73}
calibrated: 0.89
ΔE Greyscale Calman: 3.91 | ∀{0.09-98 Ø4.97}
95% sRGB (Argyll 1.6.3 3D)
60% AdobeRGB 1998 (Argyll 1.6.3 3D)
65.1% AdobeRGB 1998 (Argyll 3D)
94.9% sRGB (Argyll 3D)
63.4% Display P3 (Argyll 3D)
Gamma: 2.26
CCT: 7138 K
| MSI GP75 Leopard 9SD Chi Mei N173HCE-G33 (CMN175C), IPS, 1920x1080, 17.3" | Lenovo Legion Y530-15ICH LG Display LP156WFG-SPB2, IPS, 1920x1080, 15.6" | CUK Model Z GK5CQ7Z LG Philips LGD05C0, IPS, 1920x1080, 15.6" | Dell G5 15 5590 AU Optronics B156HAN, IPS, 1920x1080, 15.6" | Aorus 15 W9 LG Philips LP156WFG-SPB2 (LGD05E8), IPS, 1920x1080, 15.6" | MSI GS75 8SG Stealth N173HCE-G33 (CMN175C), IPS, 1920x1080, 17.3" | |
|---|---|---|---|---|---|---|
| Display | -2% | 0% | -38% | 0% | 1% | |
| Display P3 Coverage (%) | 63.4 | 62.5 -1% | 64.5 2% | 39.26 -38% | 64.3 1% | 63.6 0% |
| sRGB Coverage (%) | 94.9 | 93 -2% | 93 -2% | 59.1 -38% | 93.5 -1% | 95.4 1% |
| AdobeRGB 1998 Coverage (%) | 65.1 | 63.8 -2% | 65.7 1% | 40.56 -38% | 65.6 1% | 65.5 1% |
| Response Times | -57% | -53% | -352% | -78% | -2% | |
| Response Time Grey 50% / Grey 80% * (ms) | 8 ? | 15 ? -88% | 13.6 ? -70% | 45 ? -463% | 16.8 ? -110% | 7.6 ? 5% |
| Response Time Black / White * (ms) | 8.8 ? | 11 ? -25% | 12 ? -36% | 30 ? -241% | 12.8 ? -45% | 9.6 ? -9% |
| PWM Frequency (Hz) | 25510 ? | 25510 ? | ||||
| Screen | -26% | -21% | -84% | -21% | 14% | |
| Brightness middle (cd/m²) | 420 | 305 -27% | 306.8 -27% | 234 -44% | 295 -30% | 355 -15% |
| Brightness (cd/m²) | 393 | 284 -28% | 309 -21% | 219 -44% | 292 -26% | 327 -17% |
| Brightness Distribution (%) | 91 | 83 -9% | 87 -4% | 82 -10% | 80 -12% | 85 -7% |
| Black Level * (cd/m²) | 0.32 | 0.52 -63% | 0.38 -19% | 0.17 47% | 0.34 -6% | 0.26 19% |
| Contrast (:1) | 1313 | 587 -55% | 807 -39% | 1376 5% | 868 -34% | 1365 4% |
| Colorchecker dE 2000 * | 3.04 | 3.63 -19% | 3.16 -4% | 8.6 -183% | 3.89 -28% | 1.54 49% |
| Colorchecker dE 2000 max. * | 7.22 | 8.18 -13% | 6.05 16% | 17.49 -142% | 7.28 -1% | 3 58% |
| Colorchecker dE 2000 calibrated * | 0.89 | 1.31 -47% | 2.4 -170% | 4.06 -356% | 1.44 -62% | 0.77 13% |
| Greyscale dE 2000 * | 3.91 | 4.77 -22% | 2.3 41% | 8.55 -119% | 4.98 -27% | 2.19 44% |
| Gamma | 2.26 97% | 2.54 87% | 2.17 101% | 3.02 73% | 2.45 90% | 2.42 91% |
| CCT | 7138 91% | 7500 87% | 6557 99% | 7802 83% | 6407 101% | 6893 94% |
| Color Space (Percent of AdobeRGB 1998) (%) | 60 | 59 -2% | 60 0% | 37 -38% | 60 0% | 61 2% |
| Color Space (Percent of sRGB) (%) | 95 | 93 -2% | 92.6 -3% | 59 -38% | 93 -2% | 95 0% |
| Totalt genomsnitt (program/inställningar) | -28% /
-25% | -25% /
-21% | -158% /
-109% | -33% /
-24% | 4% /
9% |
* ... mindre är bättre
Visa svarstider
| ↔ Svarstid svart till vitt | ||
|---|---|---|
| 8.8 ms ... stiga ↗ och falla ↘ kombinerat | ↗ 4.4 ms stiga | 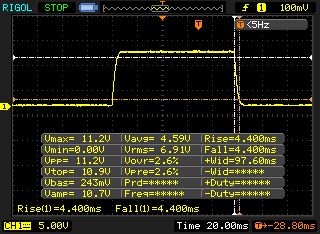 |
| ↘ 4.4 ms hösten | ||
| Skärmen visar snabba svarsfrekvenser i våra tester och bör passa för spel. I jämförelse sträcker sig alla testade enheter från 0.1 (minst) till 240 (maximalt) ms. » 24 % av alla enheter är bättre. Det betyder att den uppmätta svarstiden är bättre än genomsnittet av alla testade enheter (19.9 ms). | ||
| ↔ Svarstid 50 % grått till 80 % grått | ||
| 8 ms ... stiga ↗ och falla ↘ kombinerat | ↗ 4 ms stiga | 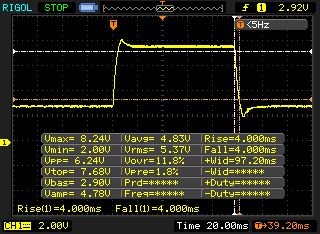 |
| ↘ 4 ms hösten | ||
| Skärmen visar snabba svarsfrekvenser i våra tester och bör passa för spel. I jämförelse sträcker sig alla testade enheter från 0.165 (minst) till 636 (maximalt) ms. » 20 % av alla enheter är bättre. Det betyder att den uppmätta svarstiden är bättre än genomsnittet av alla testade enheter (31.1 ms). | ||
Skärmflimmer / PWM (Puls-Width Modulation)
| Skärmflimmer / PWM upptäckt | 25510 Hz | ≤ 17 % ljusstyrka inställning | 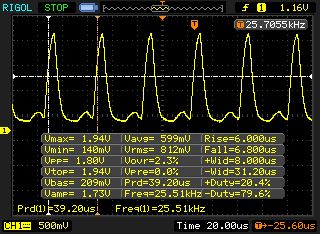 |
Displayens bakgrundsbelysning flimrar vid 25510 Hz (i värsta fall, t.ex. med PWM) Flimrande upptäckt vid en ljusstyrkeinställning på 17 % och lägre. Det ska inte finnas något flimmer eller PWM över denna ljusstyrkeinställning. Frekvensen för 25510 Hz är ganska hög, så de flesta användare som är känsliga för PWM bör inte märka något flimmer. Som jämförelse: 52 % av alla testade enheter använder inte PWM för att dämpa skärmen. Om PWM upptäcktes mättes ett medelvärde av 7798 (minst: 5 - maximum: 343500) Hz. | |||
| Cinebench R15 | |
| CPU Single 64Bit | |
| Genomsnitt av klass Gaming (188.8 - 343, n=111, senaste 2 åren) | |
| MSI GP75 Leopard 9SD | |
| CUK Model Z GK5CQ7Z | |
| Lenovo Legion Y530-15ICH | |
| Aorus 15 W9 | |
| Dell G5 15 5590 | |
| CPU Multi 64Bit | |
| Genomsnitt av klass Gaming (1578 - 6271, n=111, senaste 2 åren) | |
| CUK Model Z GK5CQ7Z | |
| Lenovo Legion Y530-15ICH | |
| Dell G5 15 5590 | |
| MSI GP75 Leopard 9SD | |
| Aorus 15 W9 | |
| PCMark 10 - Score | |
| Genomsnitt av klass Gaming (5828 - 11574, n=95, senaste 2 åren) | |
| Aorus 15 W9 | |
| CUK Model Z GK5CQ7Z | |
| MSI GP75 Leopard 9SD | |
| Lenovo Legion Y530-15ICH | |
| Dell G5 15 5590 | |
| PCMark 8 - Work Score Accelerated v2 | |
| Aorus 15 W9 | |
| CUK Model Z GK5CQ7Z | |
| MSI GP75 Leopard 9SD | |
| Lenovo Legion Y530-15ICH | |
| Dell G5 15 5590 | |
| Genomsnitt av klass Gaming (n=1senaste 2 åren) | |
| PCMark 8 Home Score Accelerated v2 | poäng | |
| PCMark 8 Work Score Accelerated v2 | 5636 poäng | |
| PCMark 10 Score | 5440 poäng | |
Hjälp | ||
| MSI GP75 Leopard 9SD Kingston RBUSNS8154P3256GJ1 | Lenovo Legion Y530-15ICH Samsung SSD PM981 MZVLB256HAHQ | CUK Model Z GK5CQ7Z Intel SSD 660p 2TB SSDPEKNW020T8 | Aorus 15 W9 Intel SSD 760p SSDPEKKW512G8 | Dell G5 15 5590 KBG30ZMS128G | |
|---|---|---|---|---|---|
| AS SSD | 119% | 206% | 233% | -124% | |
| Seq Read (MB/s) | 748 | 1808 142% | 1283 72% | 2611 249% | 1036 39% |
| Seq Write (MB/s) | 219 | 1429 553% | 1730 690% | 1545 605% | 115.1 -47% |
| 4K Read (MB/s) | 25.7 | 46.1 79% | 49.89 94% | 55.2 115% | 29.6 15% |
| 4K Write (MB/s) | 82.4 | 97 18% | 110.1 34% | 111.9 36% | 67.8 -18% |
| 4K-64 Read (MB/s) | 259.3 | 536 107% | 904 249% | 884 241% | 184.5 -29% |
| 4K-64 Write (MB/s) | 190.2 | 273.6 44% | 792 316% | 941 395% | 95.2 -50% |
| Access Time Read * (ms) | 0.159 | 0.085 47% | 0.036 77% | 0.045 72% | 1.519 -855% |
| Access Time Write * (ms) | 0.058 | 0.038 34% | 0.042 28% | 0.033 43% | 0.255 -340% |
| Score Read (Points) | 360 | 763 112% | 1082 201% | 1200 233% | 318 -12% |
| Score Write (Points) | 294 | 514 75% | 1075 266% | 1207 311% | 174 -41% |
| Score Total (Points) | 821 | 1663 103% | 2745 234% | 2982 263% | 620 -24% |
* ... mindre är bättre

| 3DMark | |
| 1920x1080 Fire Strike Graphics | |
| Genomsnitt av klass Gaming (12242 - 62849, n=120, senaste 2 åren) | |
| CUK Model Z GK5CQ7Z | |
| Aorus 15 W9 | |
| Dell G5 15 5590 | |
| MSI GP75 Leopard 9SD | |
| Lenovo Legion Y530-15ICH | |
| 2560x1440 Time Spy Graphics | |
| Genomsnitt av klass Gaming (5012 - 26212, n=119, senaste 2 åren) | |
| CUK Model Z GK5CQ7Z | |
| Aorus 15 W9 | |
| Dell G5 15 5590 | |
| MSI GP75 Leopard 9SD | |
| 3DMark 11 - 1280x720 Performance GPU | |
| Genomsnitt av klass Gaming (21841 - 80022, n=108, senaste 2 åren) | |
| CUK Model Z GK5CQ7Z | |
| Aorus 15 W9 | |
| Dell G5 15 5590 | |
| MSI GP75 Leopard 9SD | |
| Lenovo Legion Y530-15ICH | |
| 3DMark 11 Performance | 17499 poäng | |
| 3DMark Cloud Gate Standard Score | 36091 poäng | |
| 3DMark Fire Strike Score | 13443 poäng | |
| 3DMark Time Spy Score | 5743 poäng | |
Hjälp | ||
| The Witcher 3 - 1920x1080 Ultra Graphics & Postprocessing (HBAO+) | |
| Genomsnitt av klass Gaming (95 - 240, n=8, senaste 2 åren) | |
| CUK Model Z GK5CQ7Z | |
| Dell G5 15 5590 | |
| Aorus 15 W9 | |
| MSI GP75 Leopard 9SD | |
| Lenovo Legion Y530-15ICH | |
| Anno 1800 | |
| 1920x1080 Ultra Graphics Quality (DX11) | |
| Genomsnitt av klass Gaming (n=1senaste 2 åren) | |
| Dell G5 15 5590 | |
| MSI GP75 Leopard 9SD | |
| 1920x1080 High Graphics Quality (DX11) | |
| Genomsnitt av klass Gaming (n=1senaste 2 åren) | |
| MSI GP75 Leopard 9SD | |
| Dell G5 15 5590 | |
| Dota 2 Reborn | |
| 1920x1080 ultra (3/3) best looking | |
| Genomsnitt av klass Gaming (84.8 - 248, n=112, senaste 2 åren) | |
| MSI GP75 Leopard 9SD | |
| 1920x1080 high (2/3) | |
| Genomsnitt av klass Gaming (82.8 - 275, n=111, senaste 2 åren) | |
| MSI GP75 Leopard 9SD | |
| BioShock Infinite | |
| 1920x1080 Ultra Preset, DX11 (DDOF) | |
| CUK Model Z GK5CQ7Z | |
| MSI GP75 Leopard 9SD | |
| Dell G5 15 5590 | |
| Aorus 15 W9 | |
| Lenovo Legion Y530-15ICH | |
| 1366x768 High Preset | |
| MSI GP75 Leopard 9SD | |
| CUK Model Z GK5CQ7Z | |
| Dell G5 15 5590 | |
| Aorus 15 W9 | |
| Lenovo Legion Y530-15ICH | |
| låg | med. | hög | ultra | |
|---|---|---|---|---|
| BioShock Infinite (2013) | 314.1 | 278.5 | 260.1 | 142.2 |
| The Witcher 3 (2015) | 57.6 | |||
| Dota 2 Reborn (2015) | 139 | 128.7 | 120.1 | 113.5 |
| Anno 1800 (2019) | 75.9 | 35.86 |
Ljudnivå
| Låg belastning |
| 29 / 34 / 37 dB(A) |
| Hög belastning |
| 53 / 55 dB(A) |
 | ||
30 dB tyst 40 dB(A) hörbar 50 dB(A) högt ljud |
||
min: | ||
(±) Den maximala temperaturen på ovansidan är 45 °C / 113 F, jämfört med genomsnittet av 40.4 °C / 105 F , allt från 21.2 till 68.8 °C för klassen Gaming.
(±) Botten värms upp till maximalt 42 °C / 108 F, jämfört med genomsnittet av 43.2 °C / 110 F
(+) Vid tomgångsbruk är medeltemperaturen för ovansidan 28.4 °C / 83 F, jämfört med enhetsgenomsnittet på 33.9 °C / ### class_avg_f### F.
(-) När du spelar The Witcher 3 är medeltemperaturen för ovansidan 40 °C / 104 F, jämfört med enhetsgenomsnittet på 33.9 °C / ## #class_avg_f### F.
(±) Handledsstöden och pekplattan kan bli väldigt varma vid beröring med maximalt 37 °C / 98.6 F.
(-) Medeltemperaturen för handledsstödsområdet på liknande enheter var 28.8 °C / 83.8 F (-8.2 °C / -14.8 F).
MSI GP75 Leopard 9SD ljudanalys
(+) | högtalare kan spela relativt högt (95 dB)
Bas 100 - 315 Hz
(-) | nästan ingen bas - i genomsnitt 24.4% lägre än medianen
(+) | basen är linjär (3.9% delta till föregående frekvens)
Mellan 400 - 2000 Hz
(+) | balanserad mellan - endast 2.8% från medianen
(+) | mids är linjära (6.8% delta till föregående frekvens)
Högsta 2 - 16 kHz
(+) | balanserade toppar - endast 3.2% från medianen
(+) | toppar är linjära (2.1% delta till föregående frekvens)
Totalt 100 - 16 000 Hz
(±) | linjäriteten för det totala ljudet är genomsnittlig (15.8% skillnad mot median)
Jämfört med samma klass
» 37% av alla testade enheter i den här klassen var bättre, 7% liknande, 56% sämre
» Den bästa hade ett delta på 6%, genomsnittet var 18%, sämst var 132%
Jämfört med alla testade enheter
» 24% av alla testade enheter var bättre, 5% liknande, 71% sämre
» Den bästa hade ett delta på 4%, genomsnittet var 24%, sämst var 134%
Lenovo Legion Y530-15ICH ljudanalys
(-) | inte särskilt höga högtalare (68.3 dB)
Bas 100 - 315 Hz
(±) | reducerad bas - i genomsnitt 11.5% lägre än medianen
(+) | basen är linjär (6.4% delta till föregående frekvens)
Mellan 400 - 2000 Hz
(±) | högre mellan - i genomsnitt 5% högre än median
(+) | mids är linjära (6.9% delta till föregående frekvens)
Högsta 2 - 16 kHz
(+) | balanserade toppar - endast 3% från medianen
(+) | toppar är linjära (4.6% delta till föregående frekvens)
Totalt 100 - 16 000 Hz
(±) | linjäriteten för det totala ljudet är genomsnittlig (16% skillnad mot median)
Jämfört med samma klass
» 38% av alla testade enheter i den här klassen var bättre, 6% liknande, 55% sämre
» Den bästa hade ett delta på 6%, genomsnittet var 18%, sämst var 132%
Jämfört med alla testade enheter
» 25% av alla testade enheter var bättre, 5% liknande, 70% sämre
» Den bästa hade ett delta på 4%, genomsnittet var 24%, sämst var 134%
| Av/Standby | |
| Låg belastning | |
| Hög belastning |
|
Förklaring:
min: | |
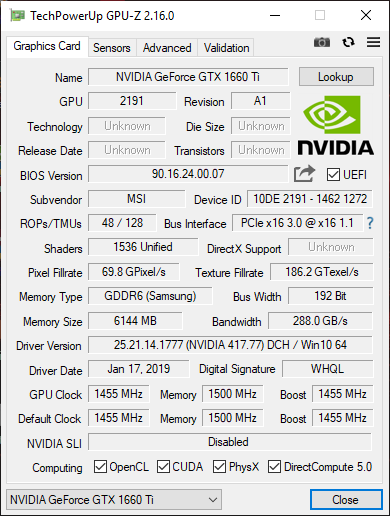
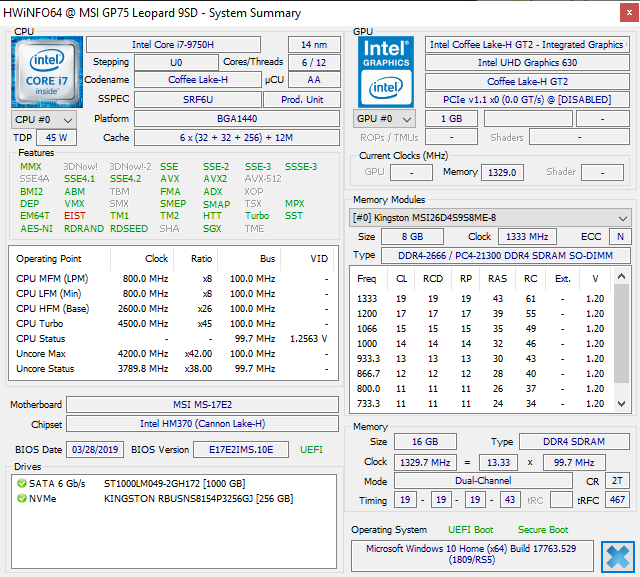
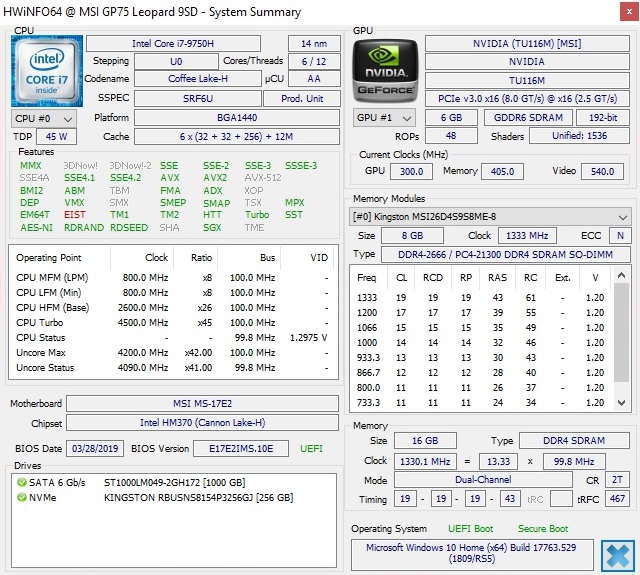
| MSI GP75 Leopard 9SD i7-9750H, GeForce GTX 1660 Ti Mobile | Lenovo Legion Y530-15ICH i7-8750H, GeForce GTX 1060 Mobile | CUK Model Z GK5CQ7Z i7-9750H, GeForce RTX 2070 Max-Q | Aorus 15 W9 i7-8750H, GeForce RTX 2060 Mobile | Dell G5 15 5590 i7-8750H, GeForce RTX 2060 Mobile | Genomsnitt av klass Gaming | |
|---|---|---|---|---|---|---|
| Power Consumption | 20% | -45% | -17% | 32% | -21% | |
| Idle Minimum * (Watt) | 10 | 7.3 27% | 23.5 -135% | 18 -80% | 3.5 65% | 13.2 ? -32% |
| Idle Average * (Watt) | 15 | 11.1 26% | 28 -87% | 20 -33% | 6.9 54% | 18.9 ? -26% |
| Idle Maximum * (Watt) | 22 | 12.6 43% | 32 -45% | 28 -27% | 8.5 61% | 24.3 ? -10% |
| Load Average * (Watt) | 92 | 109 -18% | 102.4 -11% | 87 5% | 127 -38% | 108 ? -17% |
| Witcher 3 ultra * (Watt) | 153 | 142.8 7% | 135 12% | |||
| Load Maximum * (Watt) | 216 | 168 22% | 209 3% | 175 19% | 179 17% | 254 ? -18% |
* ... mindre är bättre
| MSI GP75 Leopard 9SD i7-9750H, GeForce GTX 1660 Ti Mobile, 51 Wh | Lenovo Legion Y530-15ICH i7-8750H, GeForce GTX 1060 Mobile, 52 Wh | CUK Model Z GK5CQ7Z i7-9750H, GeForce RTX 2070 Max-Q, 46.74 Wh | Aorus 15 W9 i7-8750H, GeForce RTX 2060 Mobile, 62 Wh | Dell G5 15 5590 i7-8750H, GeForce RTX 2060 Mobile, 60 Wh | Genomsnitt av klass Gaming | |
|---|---|---|---|---|---|---|
| Batteridrifttid | 20% | -6% | 23% | 239% | 115% | |
| Reader / Idle (h) | 4.8 | 8.3 73% | 2.9 -40% | 14.8 208% | 8.71 ? 81% | |
| WiFi v1.3 (h) | 3.2 | 3.8 19% | 3 -6% | 2.4 -25% | 7.7 141% | 7.02 ? 119% |
| Load (h) | 0.6 | 0.4 -33% | 1.4 133% | 2.8 367% | 1.47 ? 145% |
För
Emot
Omdöme - Bra laptop för spel i 1080p
Läs den fullständiga versionen av den här recensionen på engelska här.
MSI GP75 Leopard 9SD visar sig vara en kapabel spellaptop som kan köra alla moderna spel i Full HD-upplösning. Kombinationen av en SSD och en HDD säkrar både att systemet känns responsivt och att det finns tillräckligt med lagringsutrymme. Processorn presterar också bra och kylsystemet lyckas förhindra att klockfrekvenserna hamnar under basfrekvensen.
Med sin GP75 Leopard 9SD erbjuder MSI en kraftfull spellaptop som bara når sin gräns om du försöker spela spel i 4K på den.
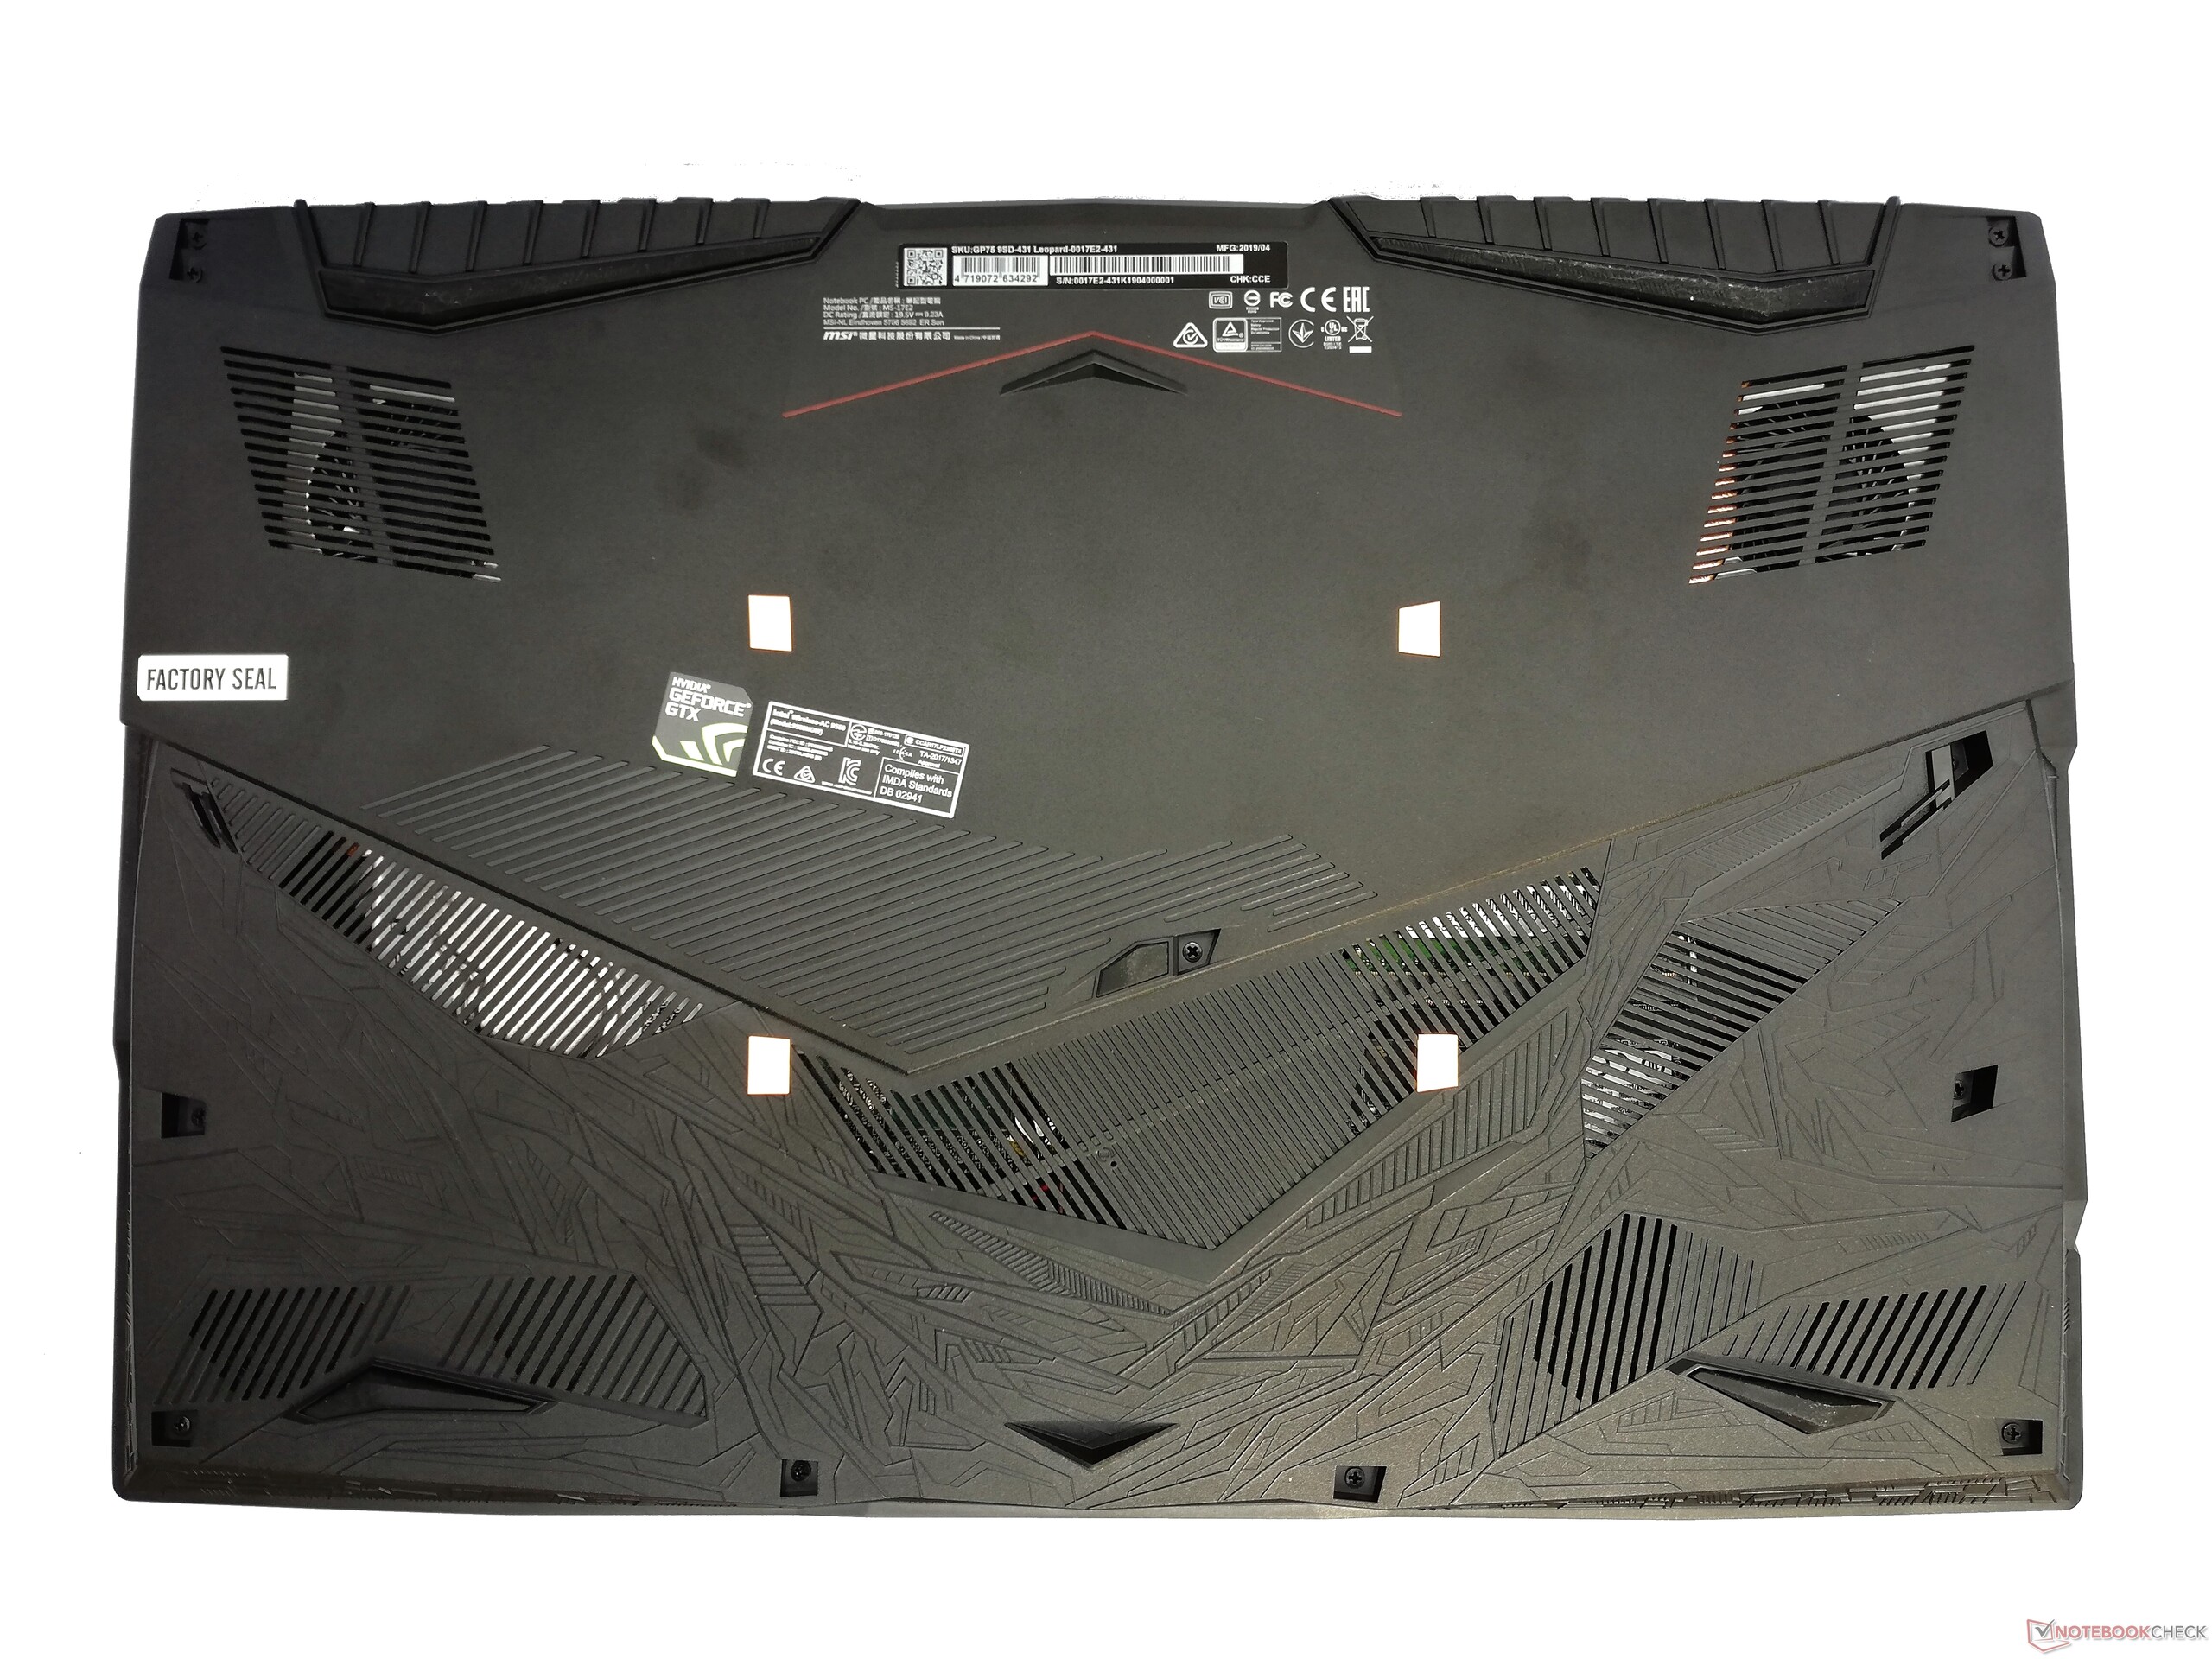
Men du får lära dig att leva med mycket fläktljud, då fläktarna på GP75 Leopard kan bli riktigt högljudda. Dessutom har den kort batteritid, vilket inte är ovanligt för enheter av det här slaget. Bra servicemöjligheter är också värt att nämna. Den som köper GP75 Leopard kan lätt uppgradera eller byta ut RAM och lagringsenheter.
MSI GP75 Leopard 9SD
- 06/19/2019 v6 (old)
Mike Wobker