Den snabbaste bärbara Core i7-12700H-datorn du kan köpa: Recension av Lenovo Legion 5 15IAH7H
2022 Legion 5 15 är en stor uppdatering jämfört med 2021 Legion 5 15. Den använder samma grafikprocessor men med ett högre TGP-mål (140 W jämfört med 130 W) och uppgraderar samtidigt CPU:n till den senaste 12:e generationen Alder Lake-H-serien. Det externa chassit har också uppdaterats för ett nyare och smidigare utseende.
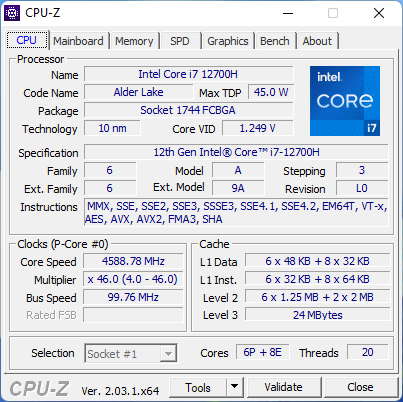
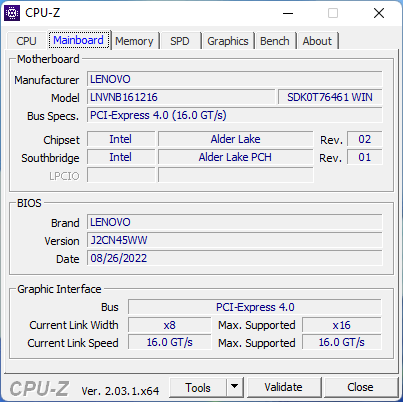
Vår konfiguration i recensionen är en mellanklasskonfiguration med Core i7-12700H, GeForce RTX 3060 GPU och 1080p165 1080p IPS-skärm för cirka 1 600 USD i detaljhandeln. Andra SKU:er finns tillgängliga med den sämre Core i5-12500H CPU:n, 144 Hz-skärm eller snabbare GeForce RTX 3070 Ti.
Konkurrenterna till Legion 5 15 inkluderar andra bärbara 15,6-tums gamingdatorer i mellanklass som Razer Blade 15 Base Edition, Asus TUF Gaming F15, MSI Bravo 15, eller Acer Aspire Nitro 5. Legion 5 15 ska inte förväxlas med Legion 5 Pro som är en större 16-tums modell.
Alla specifikationsalternativ finns på Lenovos officiella PDF här.
Fler recensioner av Lenovo:
Potentiella konkurrenter i jämförelse
Gradering | Datum | Modell | Vikt | Höjd | Storlek | Upplösning | Pris |
|---|---|---|---|---|---|---|---|
| 87.5 % v7 (old) | 11/2022 | Lenovo Legion 5 15IAH7H 82RB i7-12700H, GeForce RTX 3060 Laptop GPU | 2.4 kg | 19.99 mm | 15.60" | 1920x1080 | |
| 83.4 % v7 (old) | 09/2021 | Lenovo Legion 5 15ACH-82JU00C6GE-FL R7 5800H, GeForce RTX 3060 Laptop GPU | 2.5 kg | 26 mm | 15.60" | 1920x1080 | |
| 78.2 % v7 (old) | 04/2022 | MSI Bravo 15 B5DD-010US R5 5600H, Radeon RX 5500M | 2.3 kg | 24.95 mm | 15.60" | 1920x1080 | |
| 87.2 % v7 (old) | 03/2022 | Asus TUF Gaming F15 FX507ZM i7-12700H, GeForce RTX 3060 Laptop GPU | 2.1 kg | 24.95 mm | 15.60" | 1920x1080 | |
| 80.5 % v7 (old) | 09/2023 | Acer Aspire Nitro 5 AN515-55-57GF i5-10300H, GeForce RTX 3060 Laptop GPU | 2.3 kg | 23.9 mm | 15.60" | 1920x1080 | |
| 85.5 % v7 (old) | 04/2021 | Razer Blade 15 Base Edition 2021, i7-10750H RTX 3060 i7-10750H, GeForce RTX 3060 Laptop GPU | 2.1 kg | 19.9 mm | 15.60" | 1920x1080 |
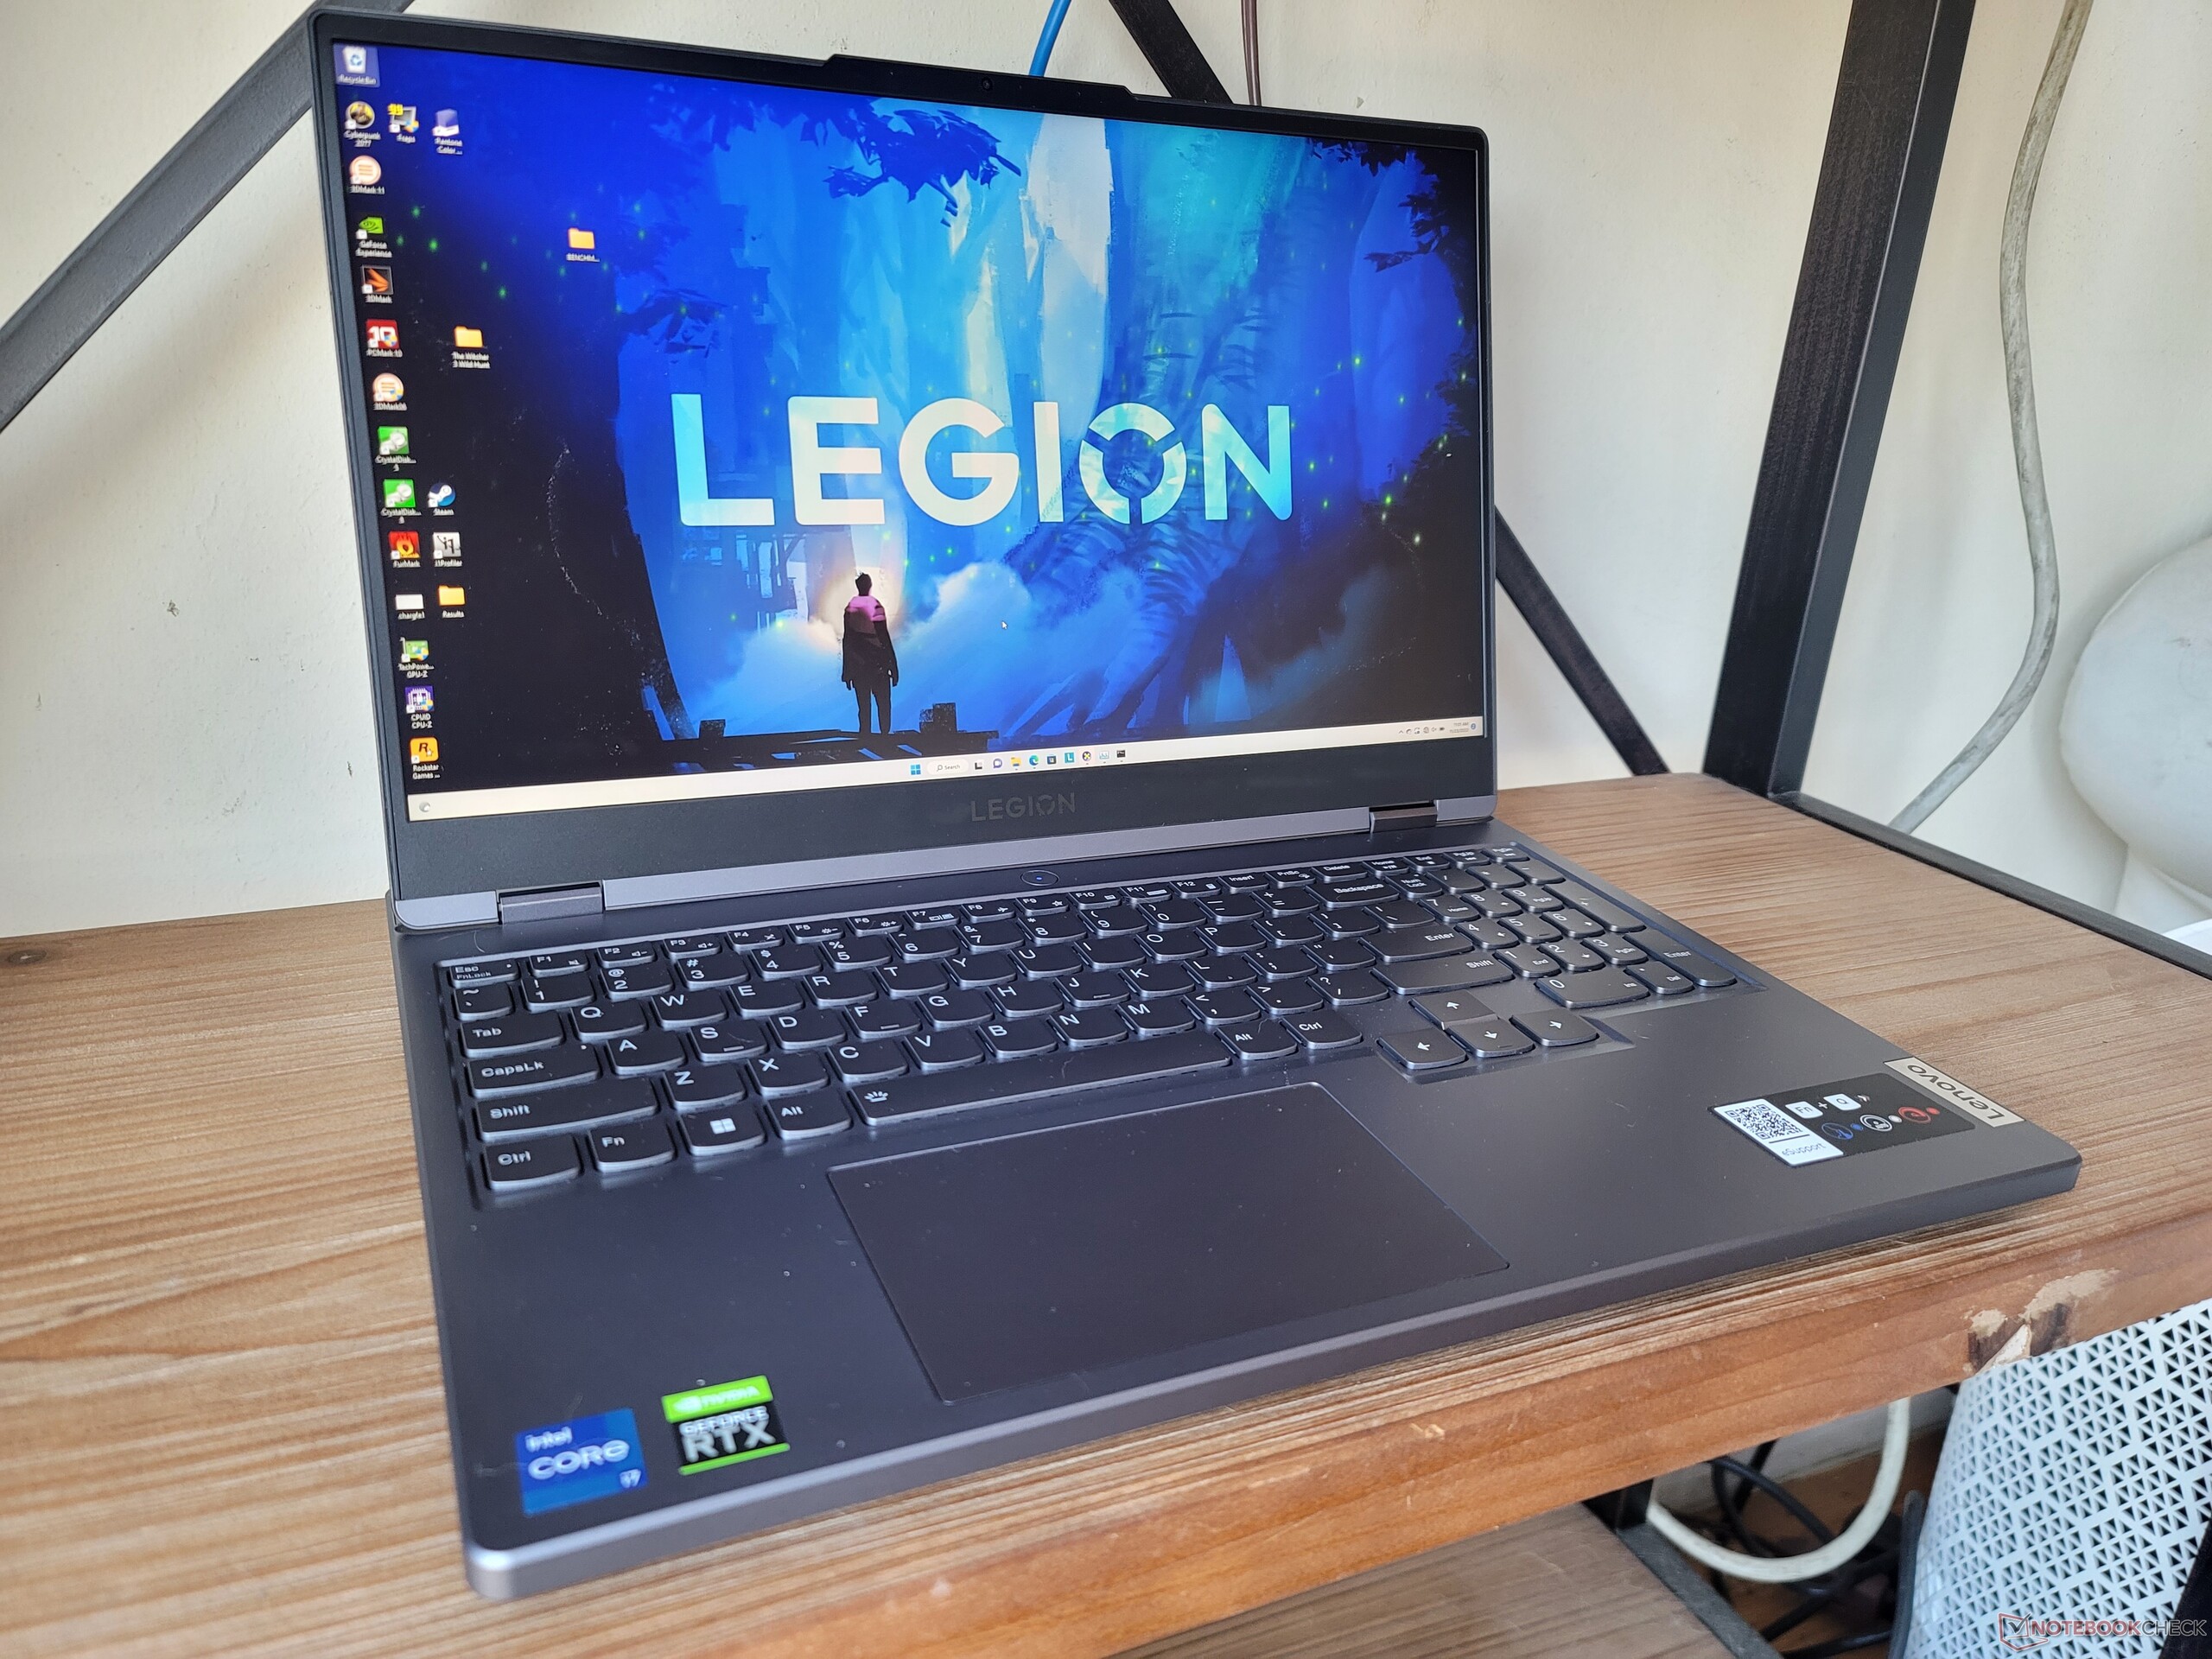
Hölje - Legion med en gnutta ThinkBook
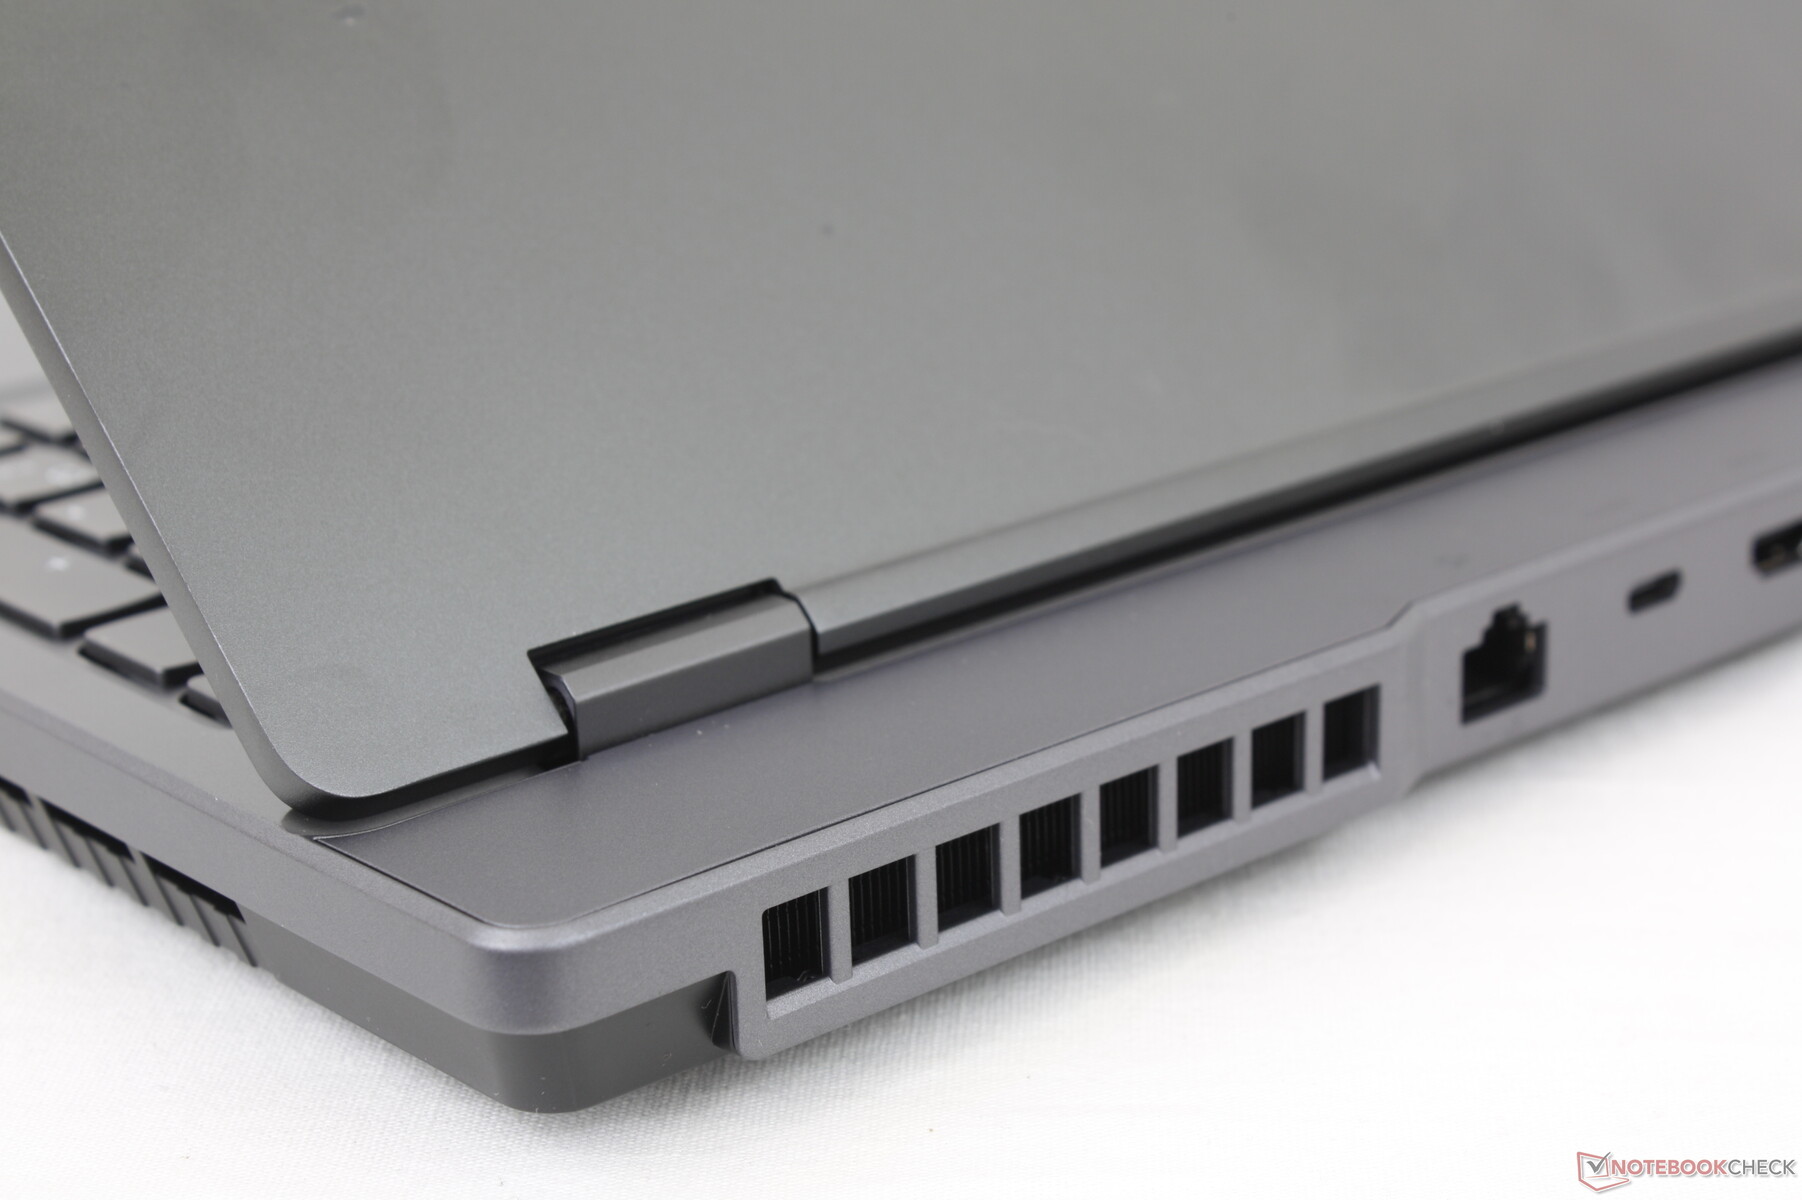
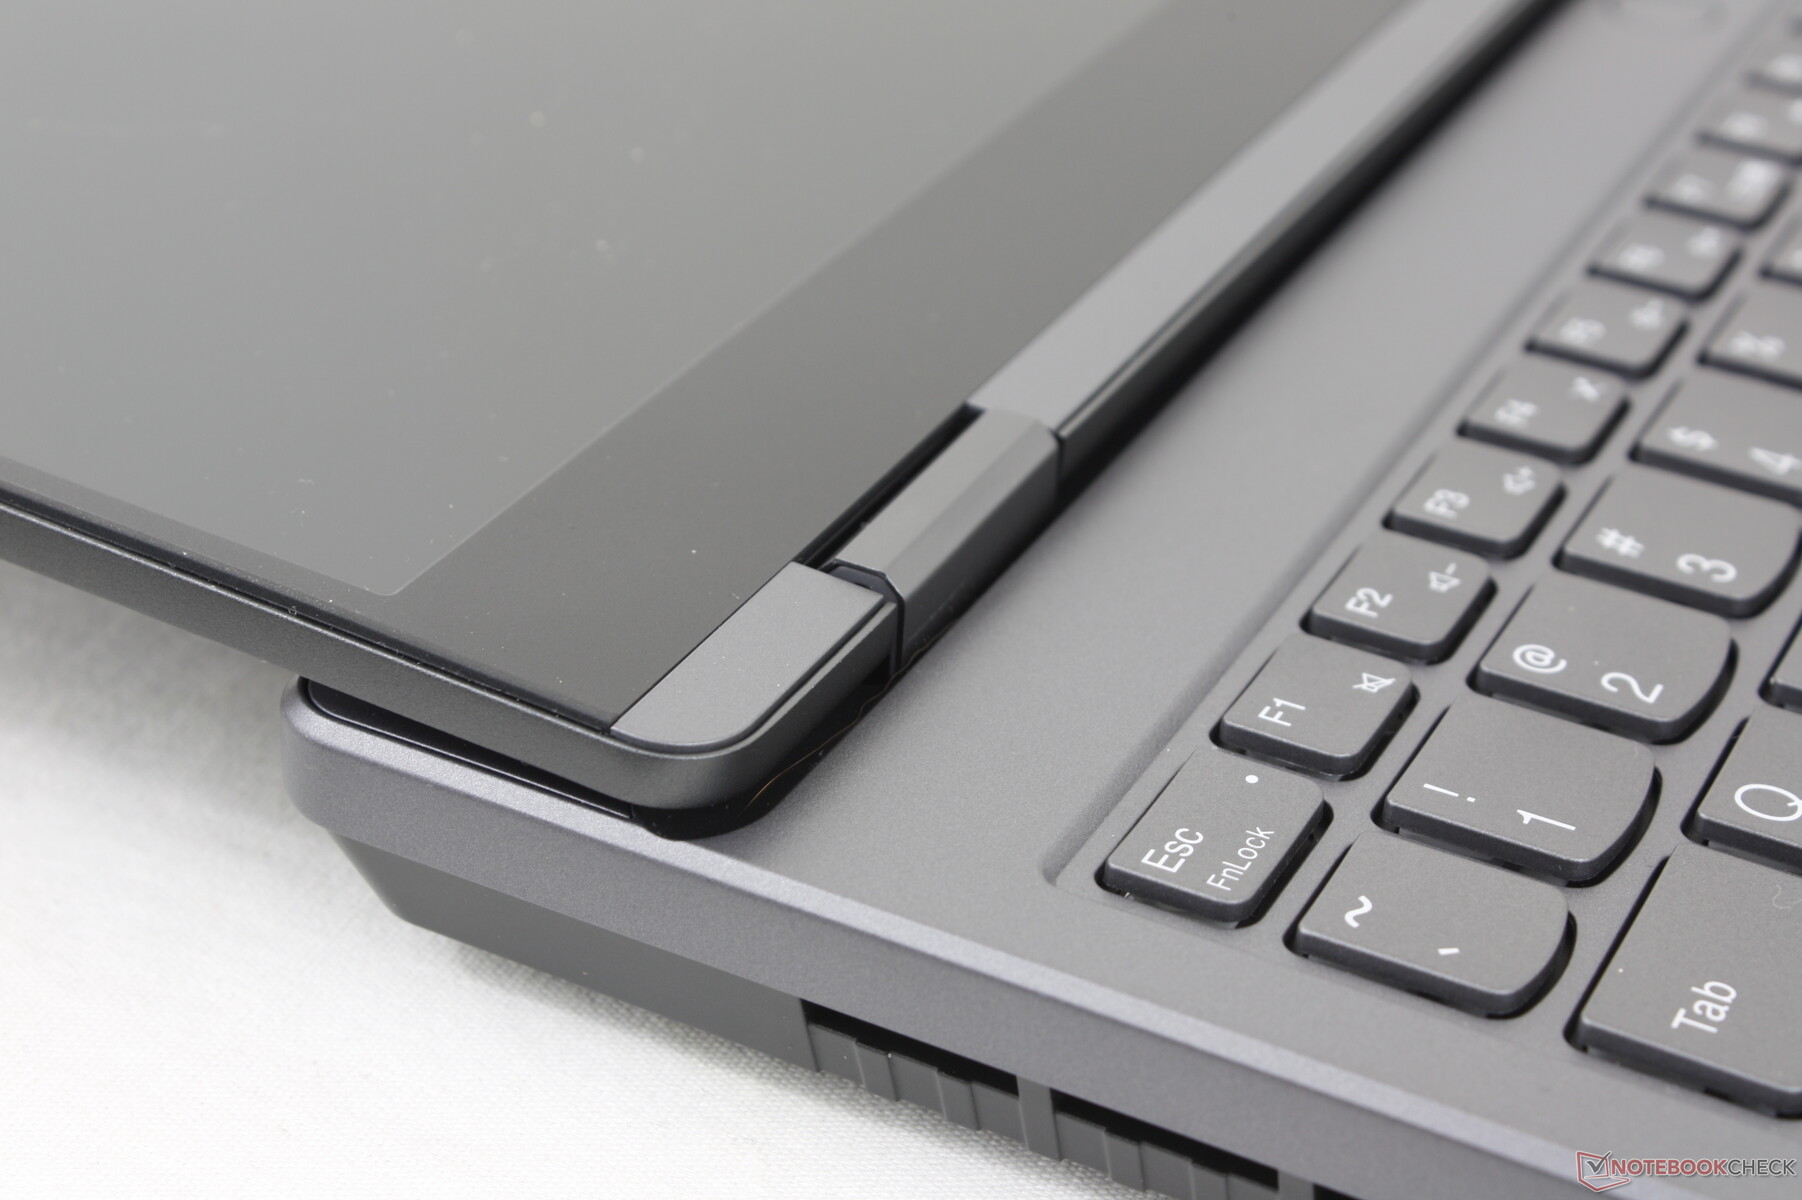
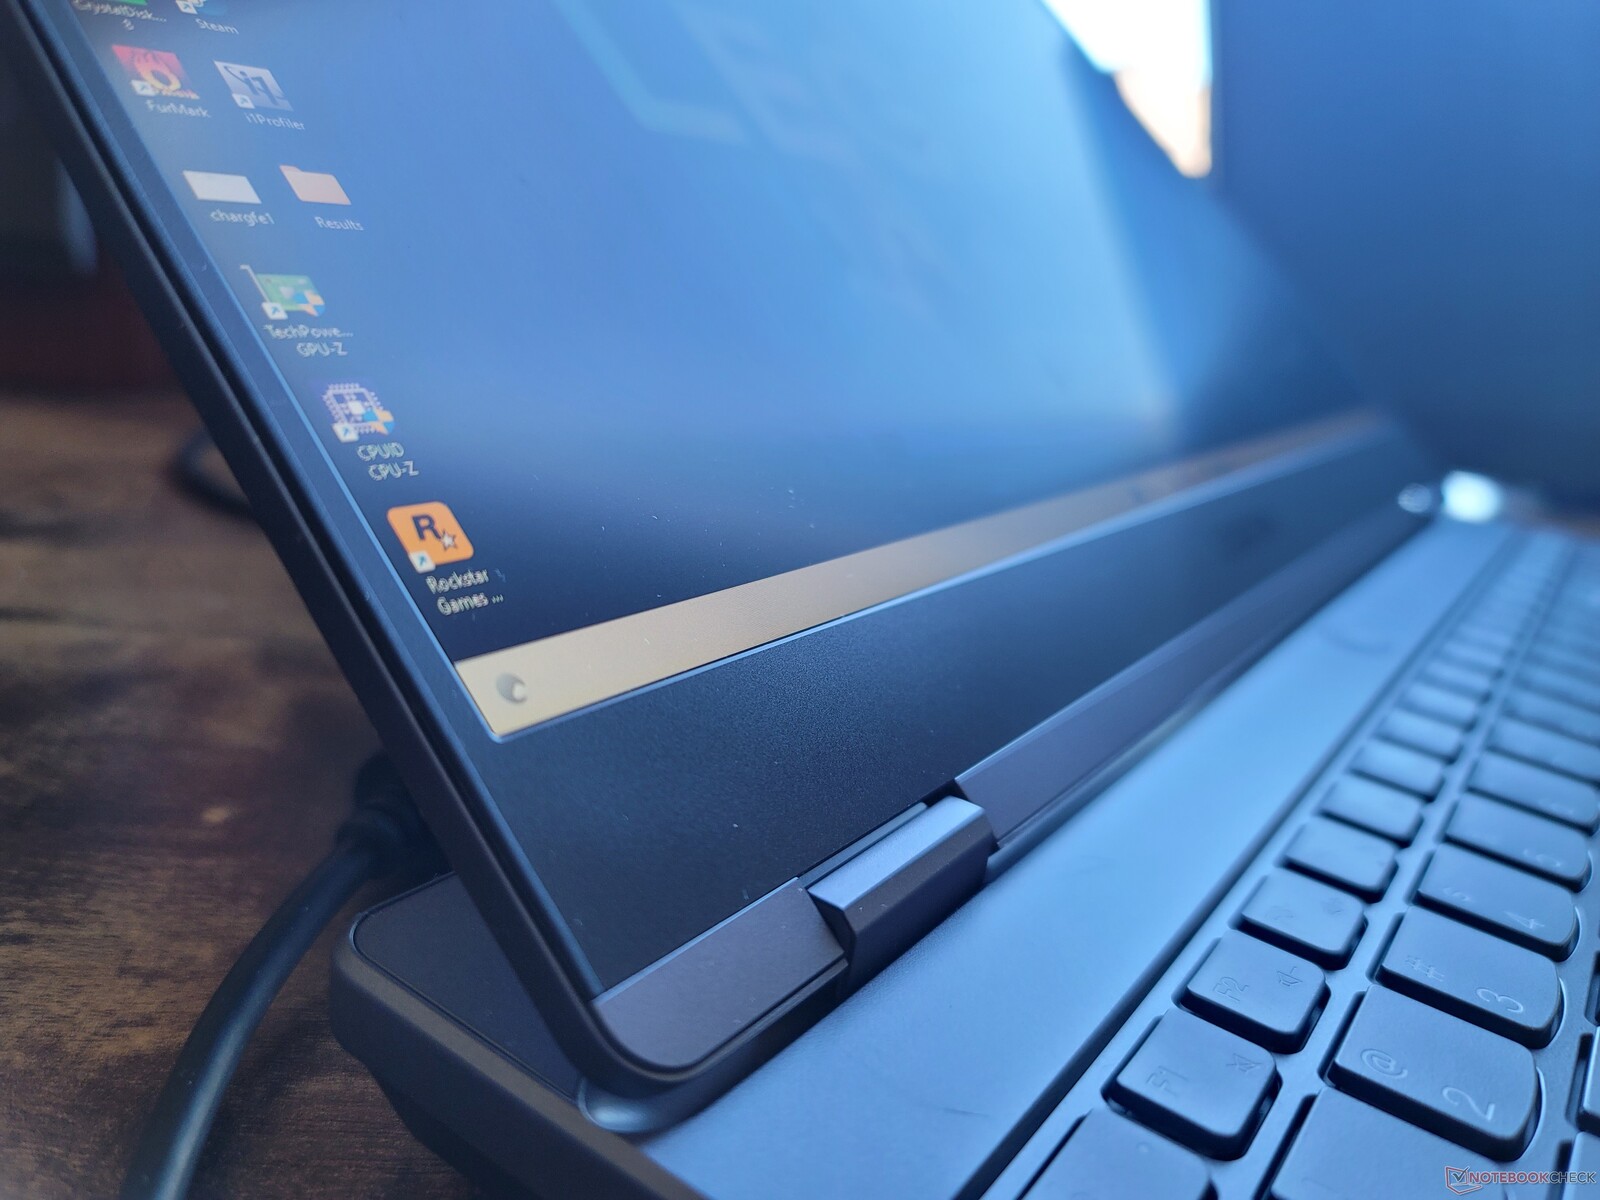
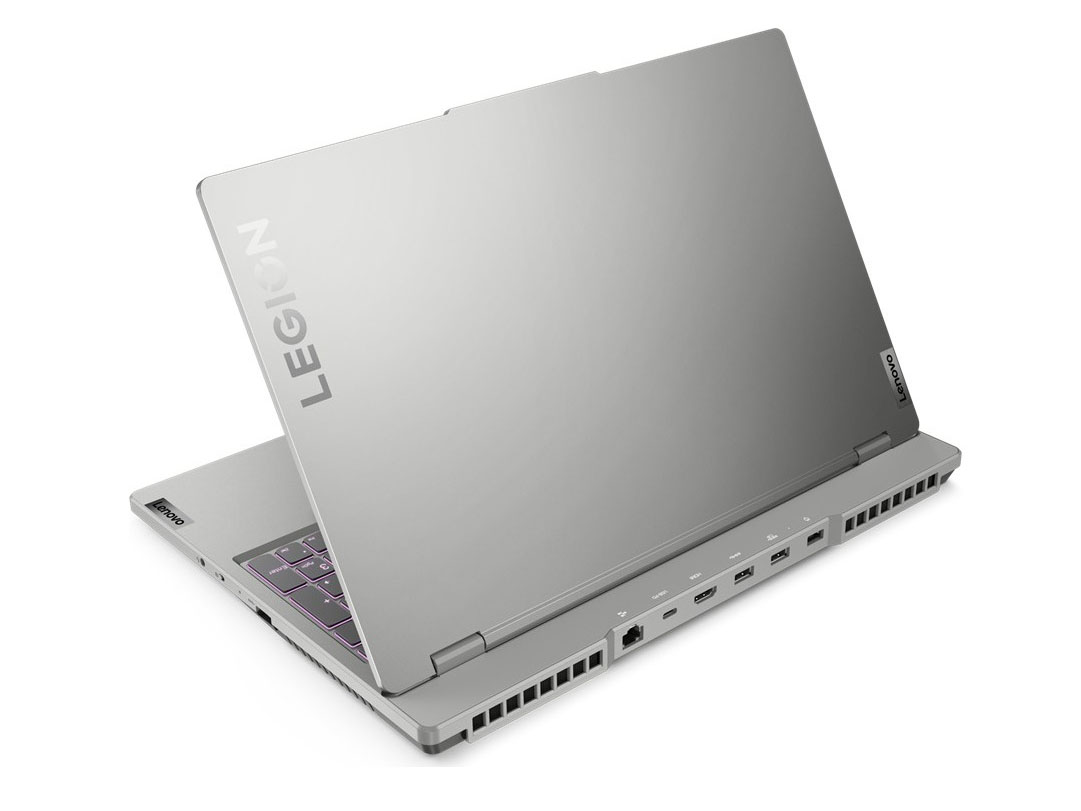
Chassit har samma allmänna estetik som förra årets modell, men med avrundade hörn på alla sidor och omgjorda ventilationsgaller. Det renare utseendet påminner mer om ThinkBook-serien vilket sannolikt inte är en tillfällighet. Jämfört med den konkurrerande Asus TUF/ROG-serien eller MSI-serien ser den nya Legion 5 15 mycket mindre gamer-aktig ut och mer åt det semi-professionella hållet.
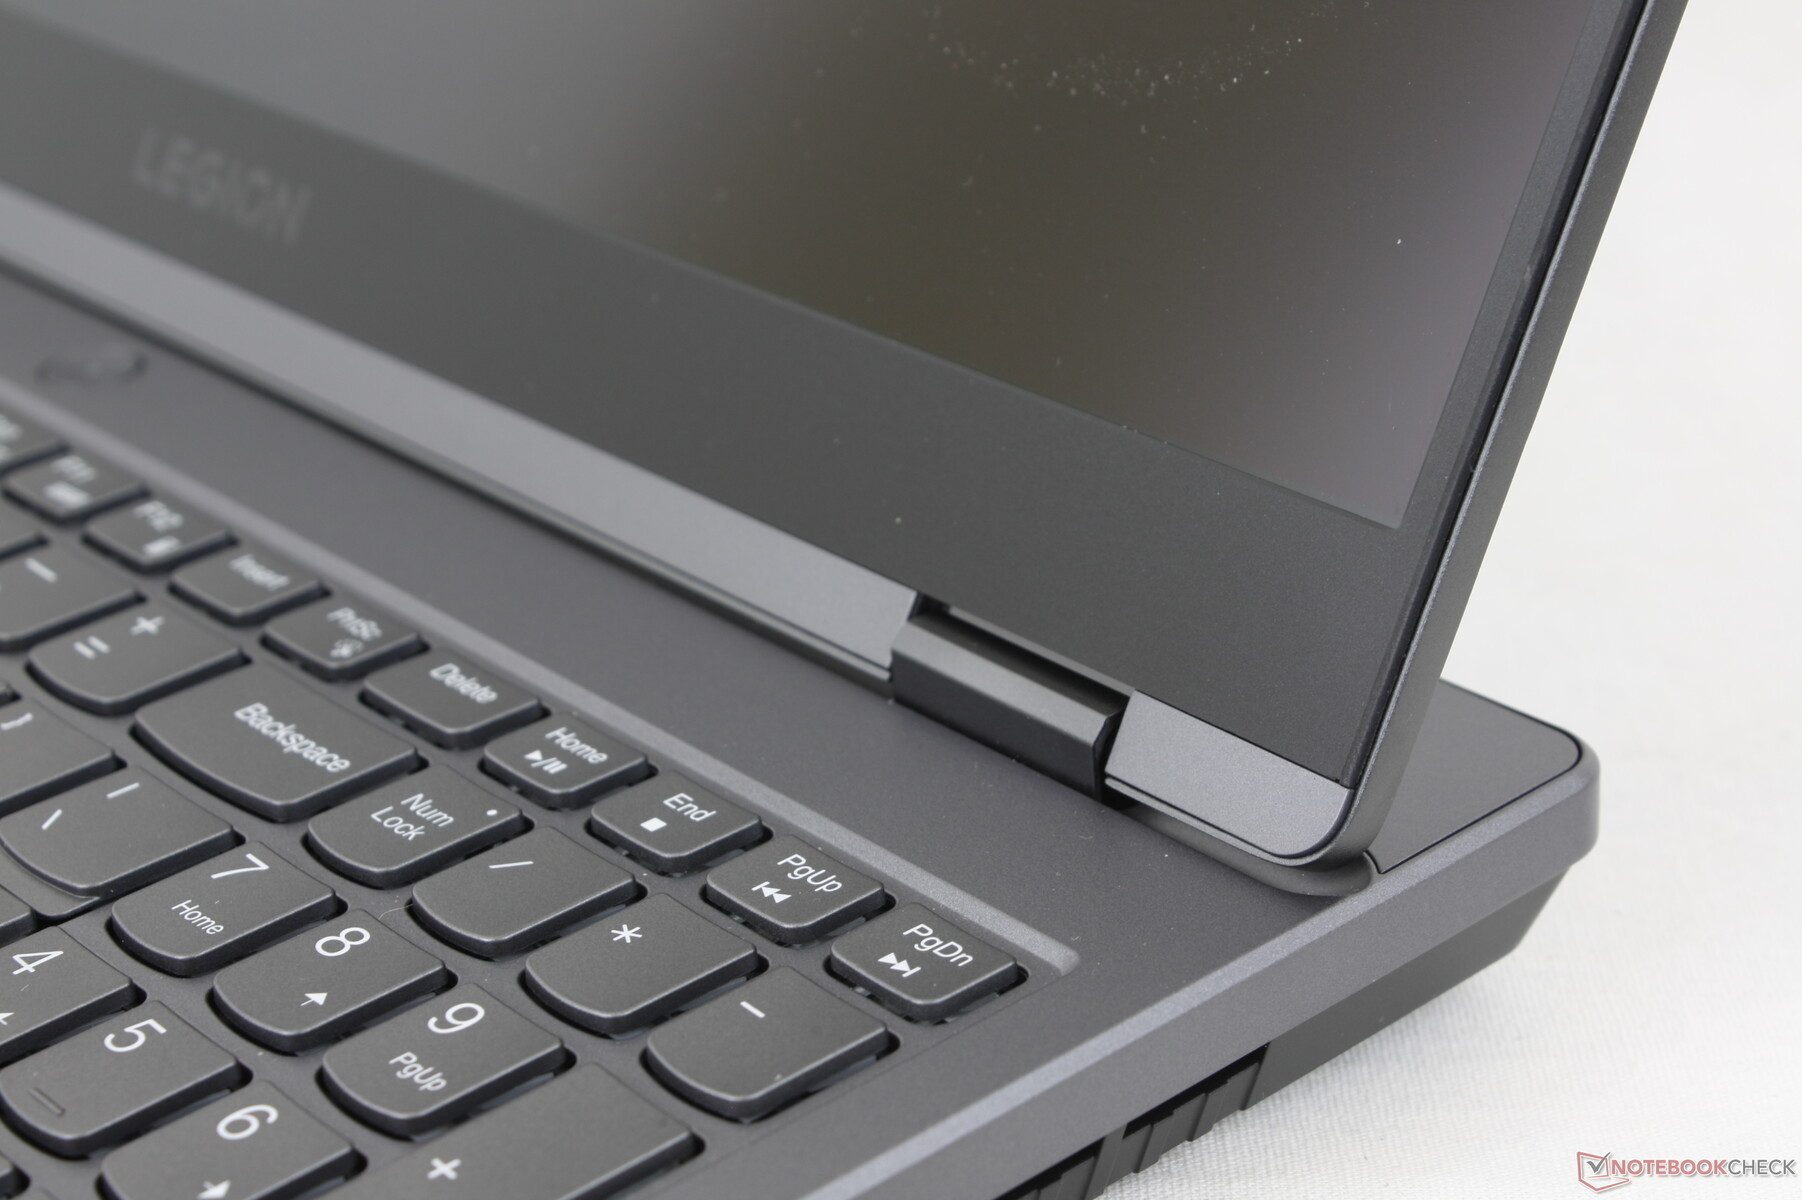
Chassiets styvhet är stark, men inte riktigt i nivå med Razer Blade serien. När man till exempel försöker vrida basen skulle Lenovo uppvisa något mer skevhet och knarrande och detsamma kan sägas om dess skärm. Gångjärnen är tillfredsställande men inte lika starka som de överdimensionerade gångjärnen i Asus TUF-serie.
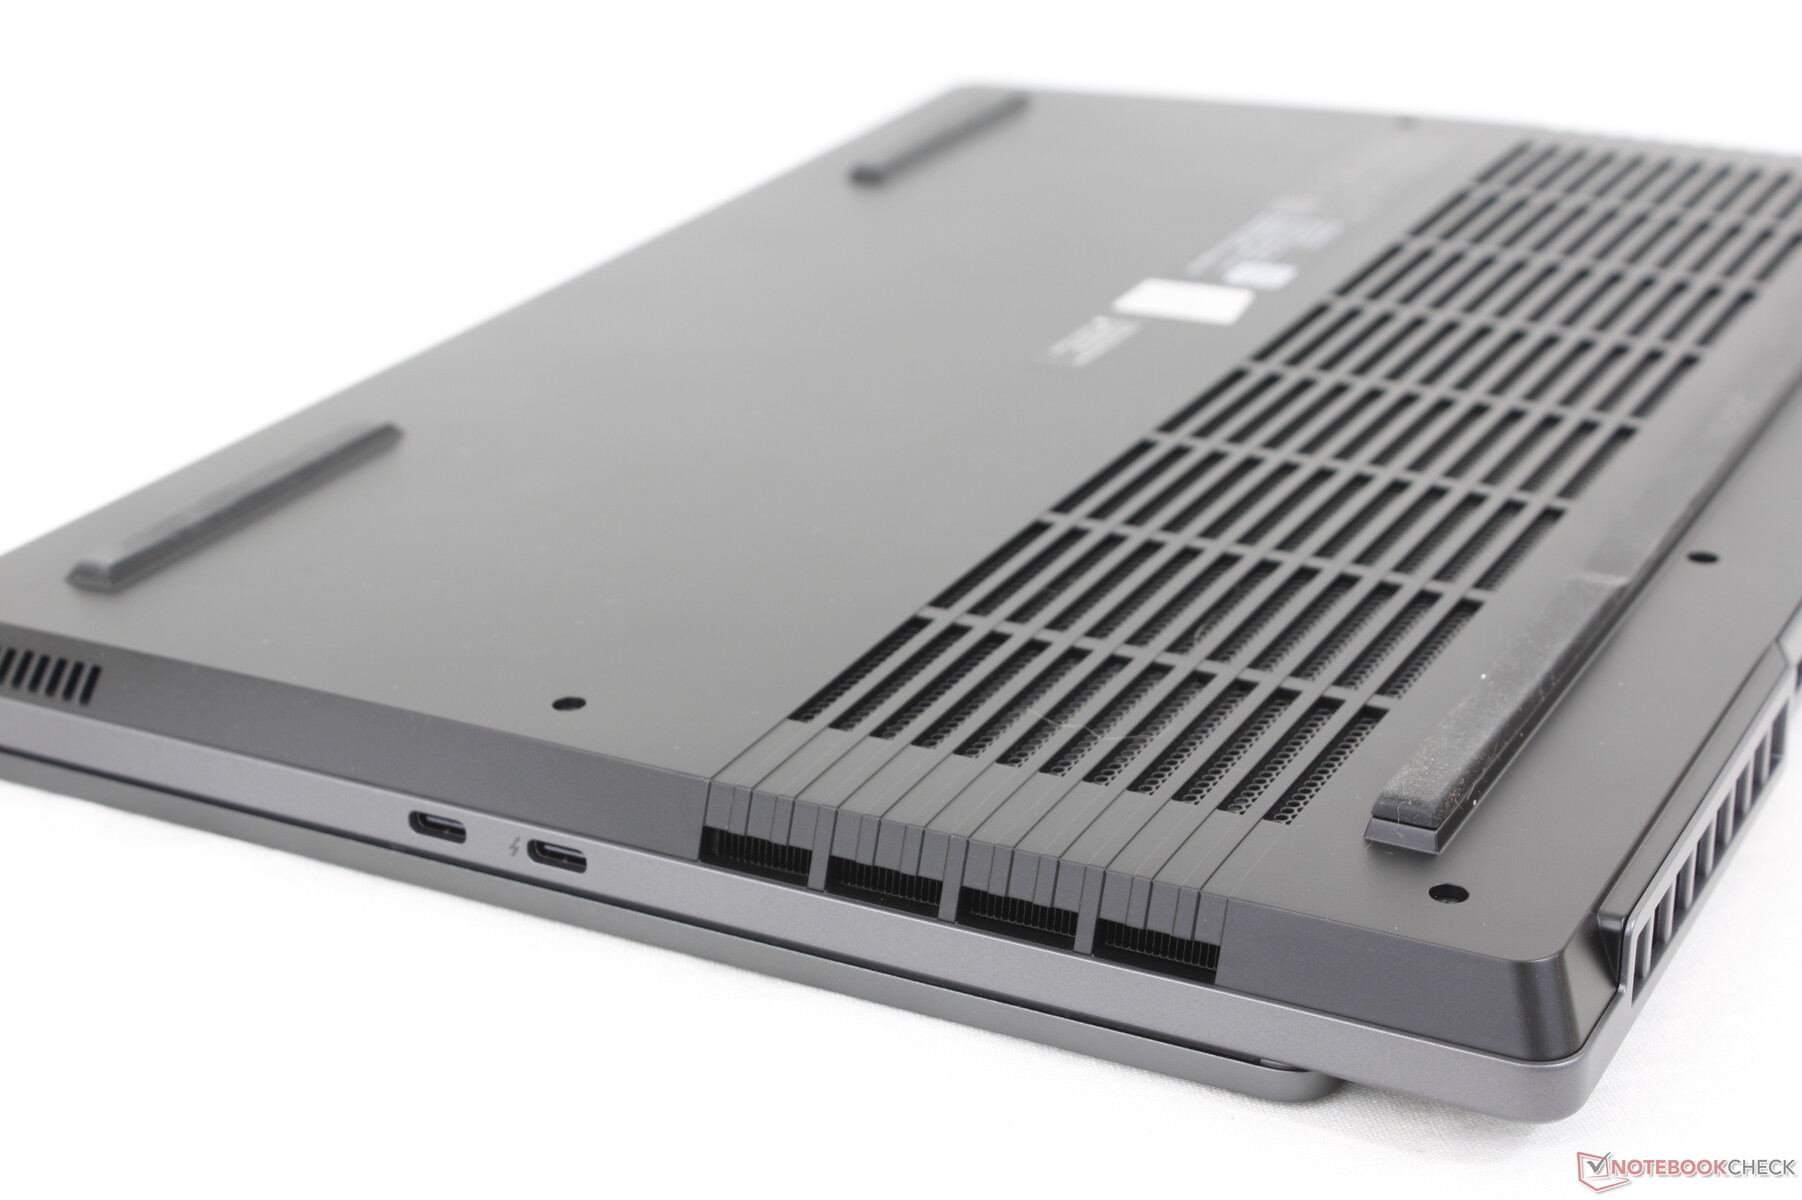
Modellen är bredare och därmed tyngre än många andra bärbara 15,6-tums gamingdatorer på grund av den stora utskjutande baksidan av Legion -designen. Även om detta hjälper till med kylning och prestanda är nackdelen en klumpigare bärbar dator som inte är lika väl lämpad för resor som många alternativ som Razer Blade 15 Base Edition.
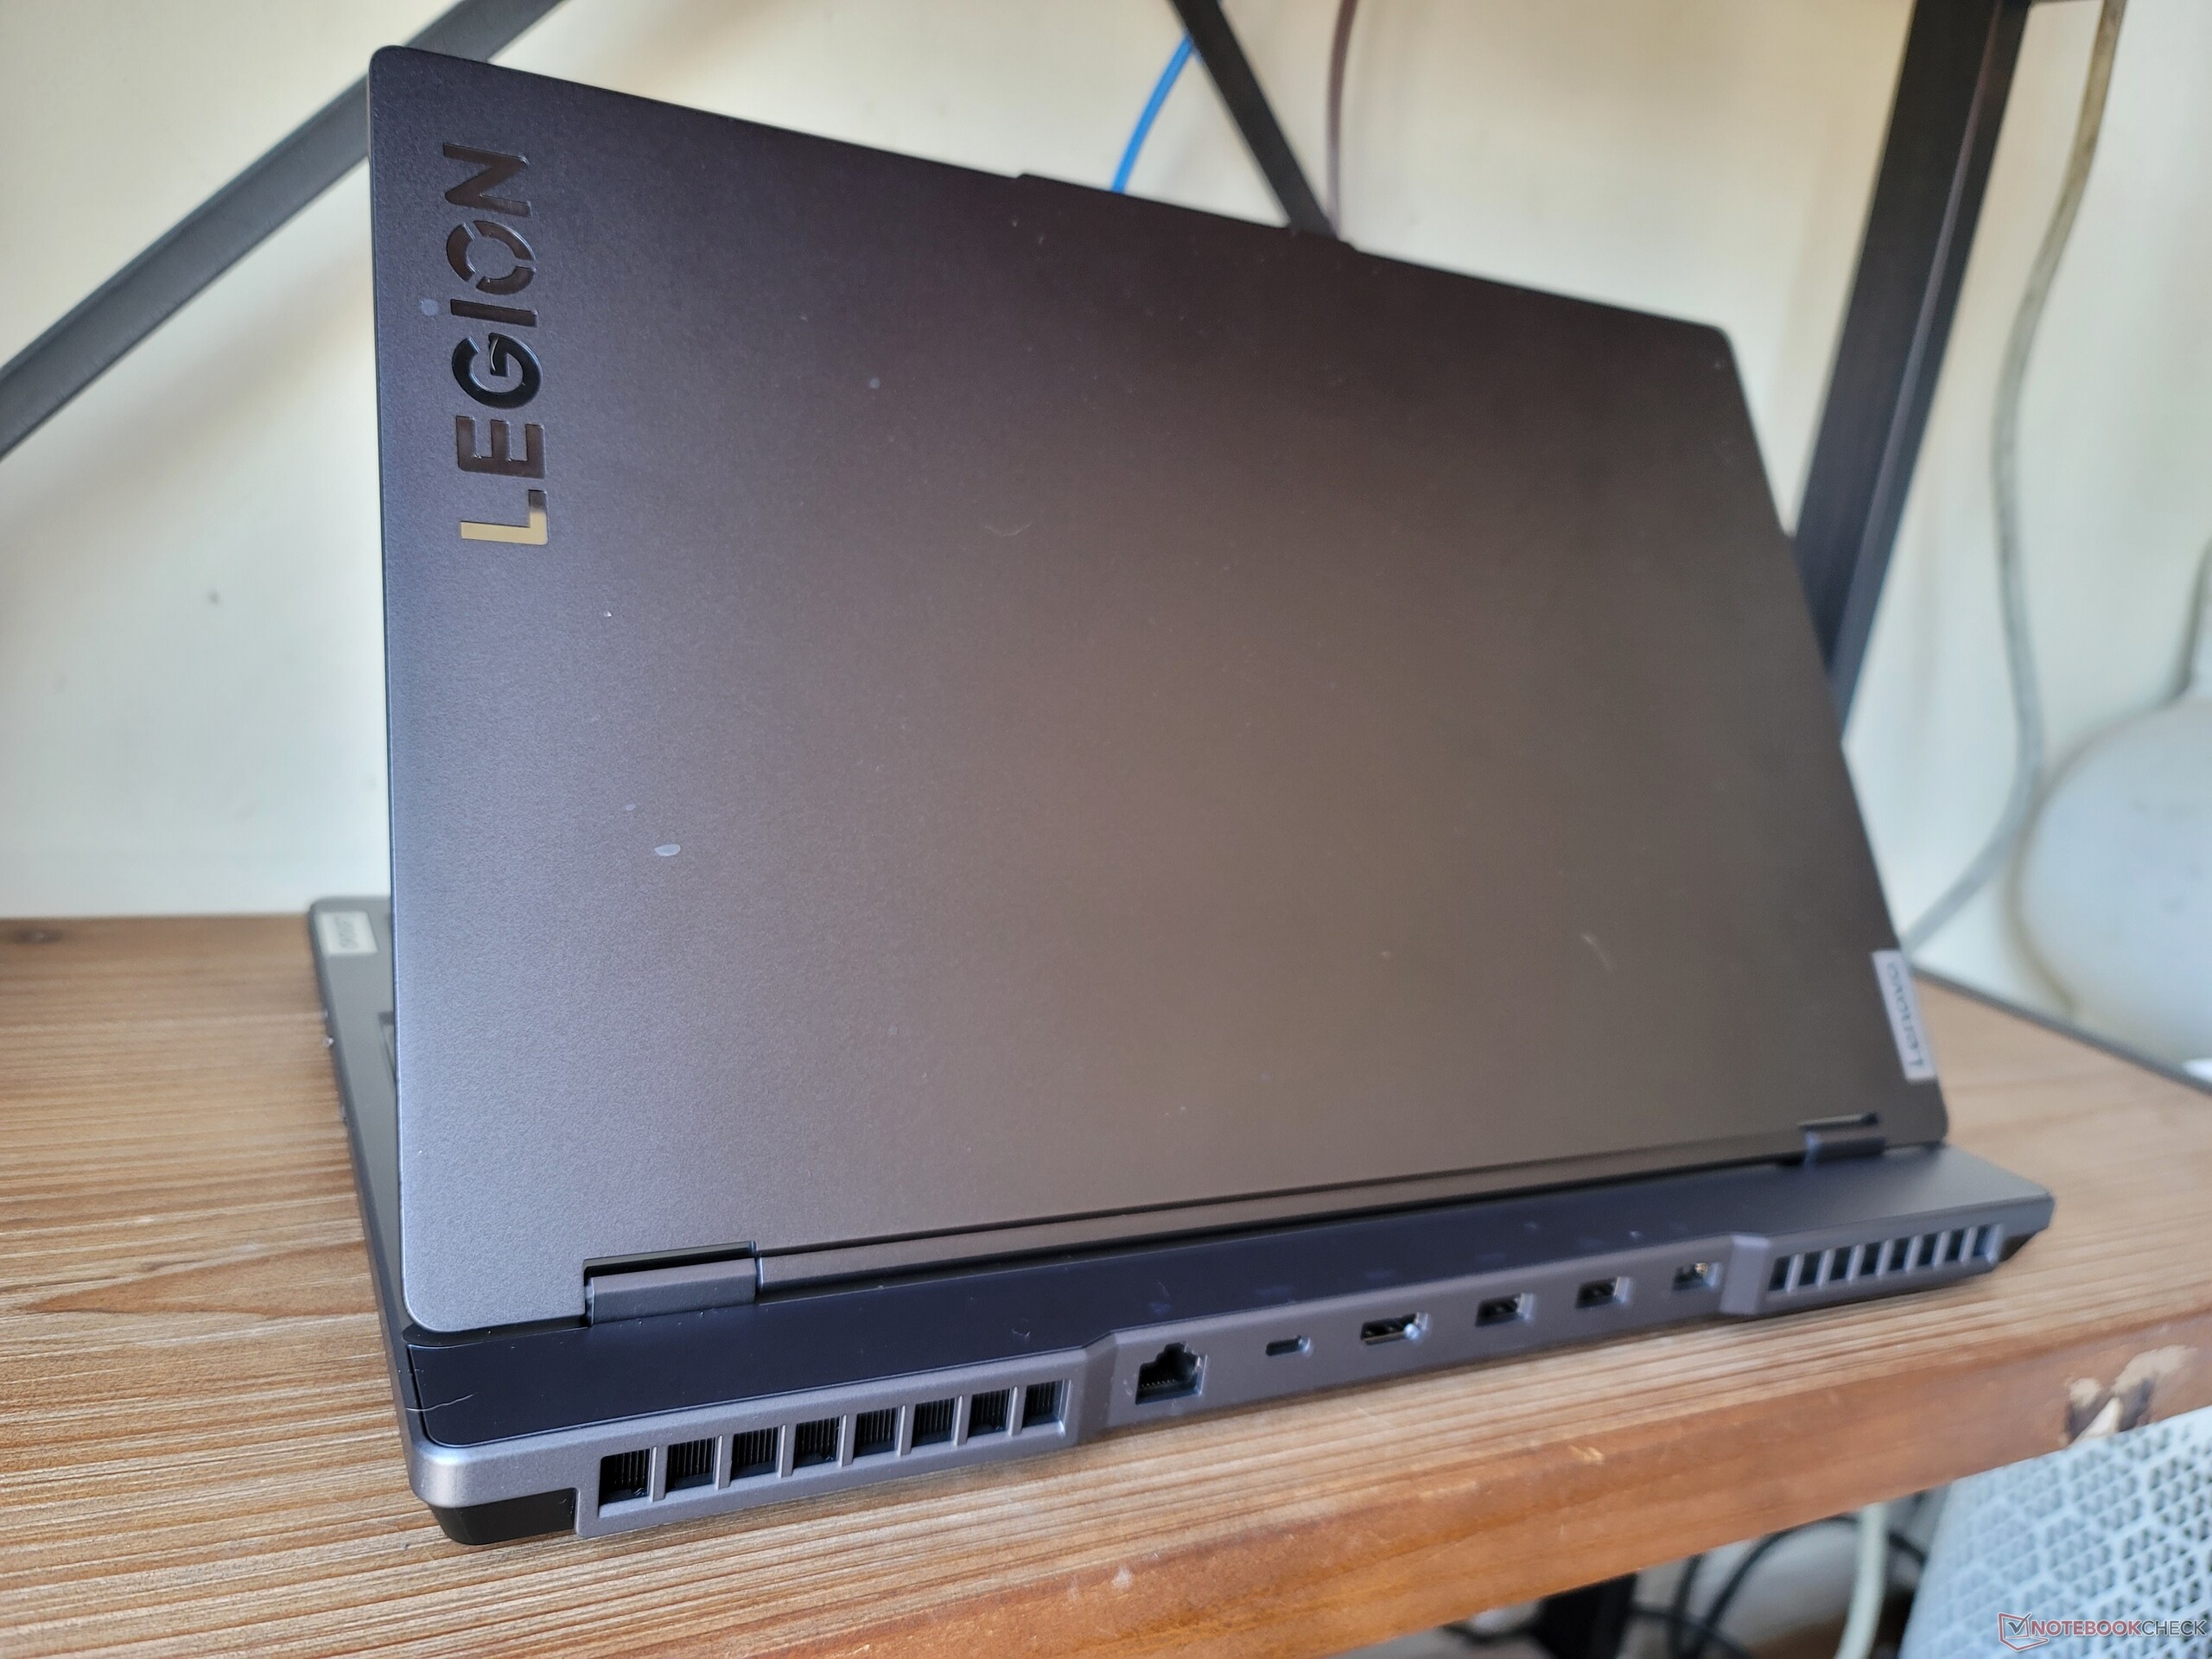
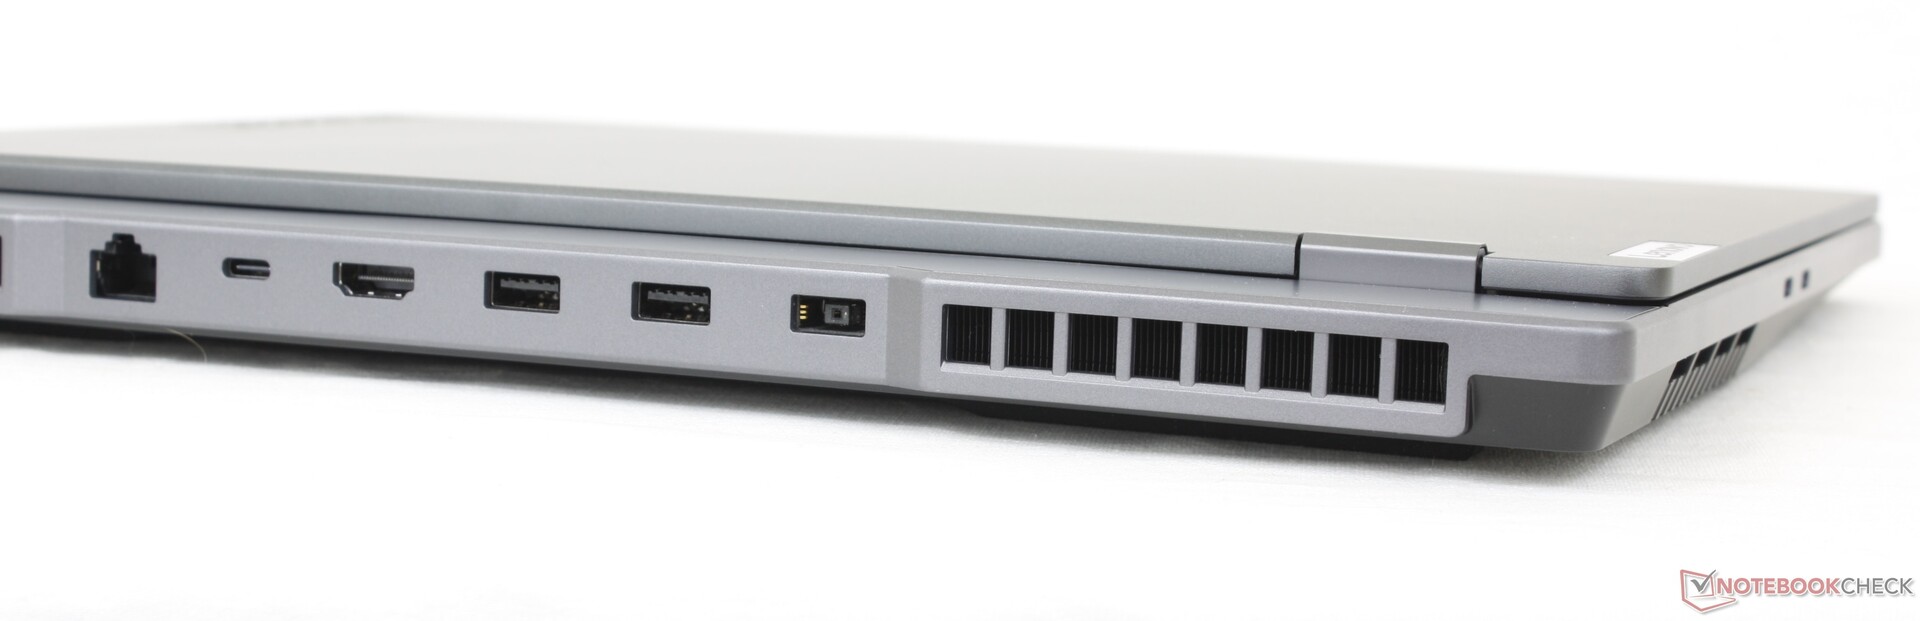
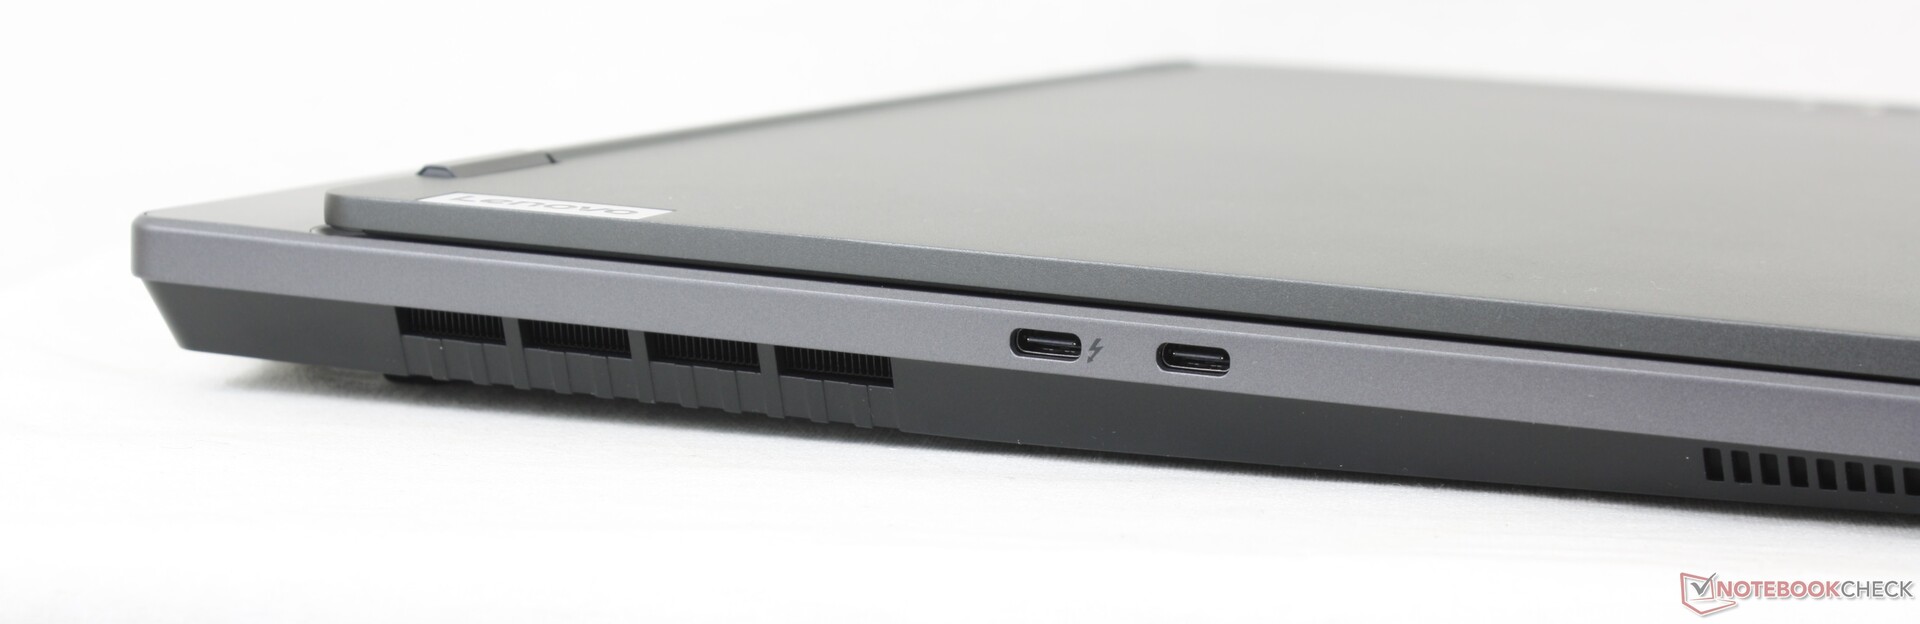
Anslutningar - Stöd för Thunderbolt 4
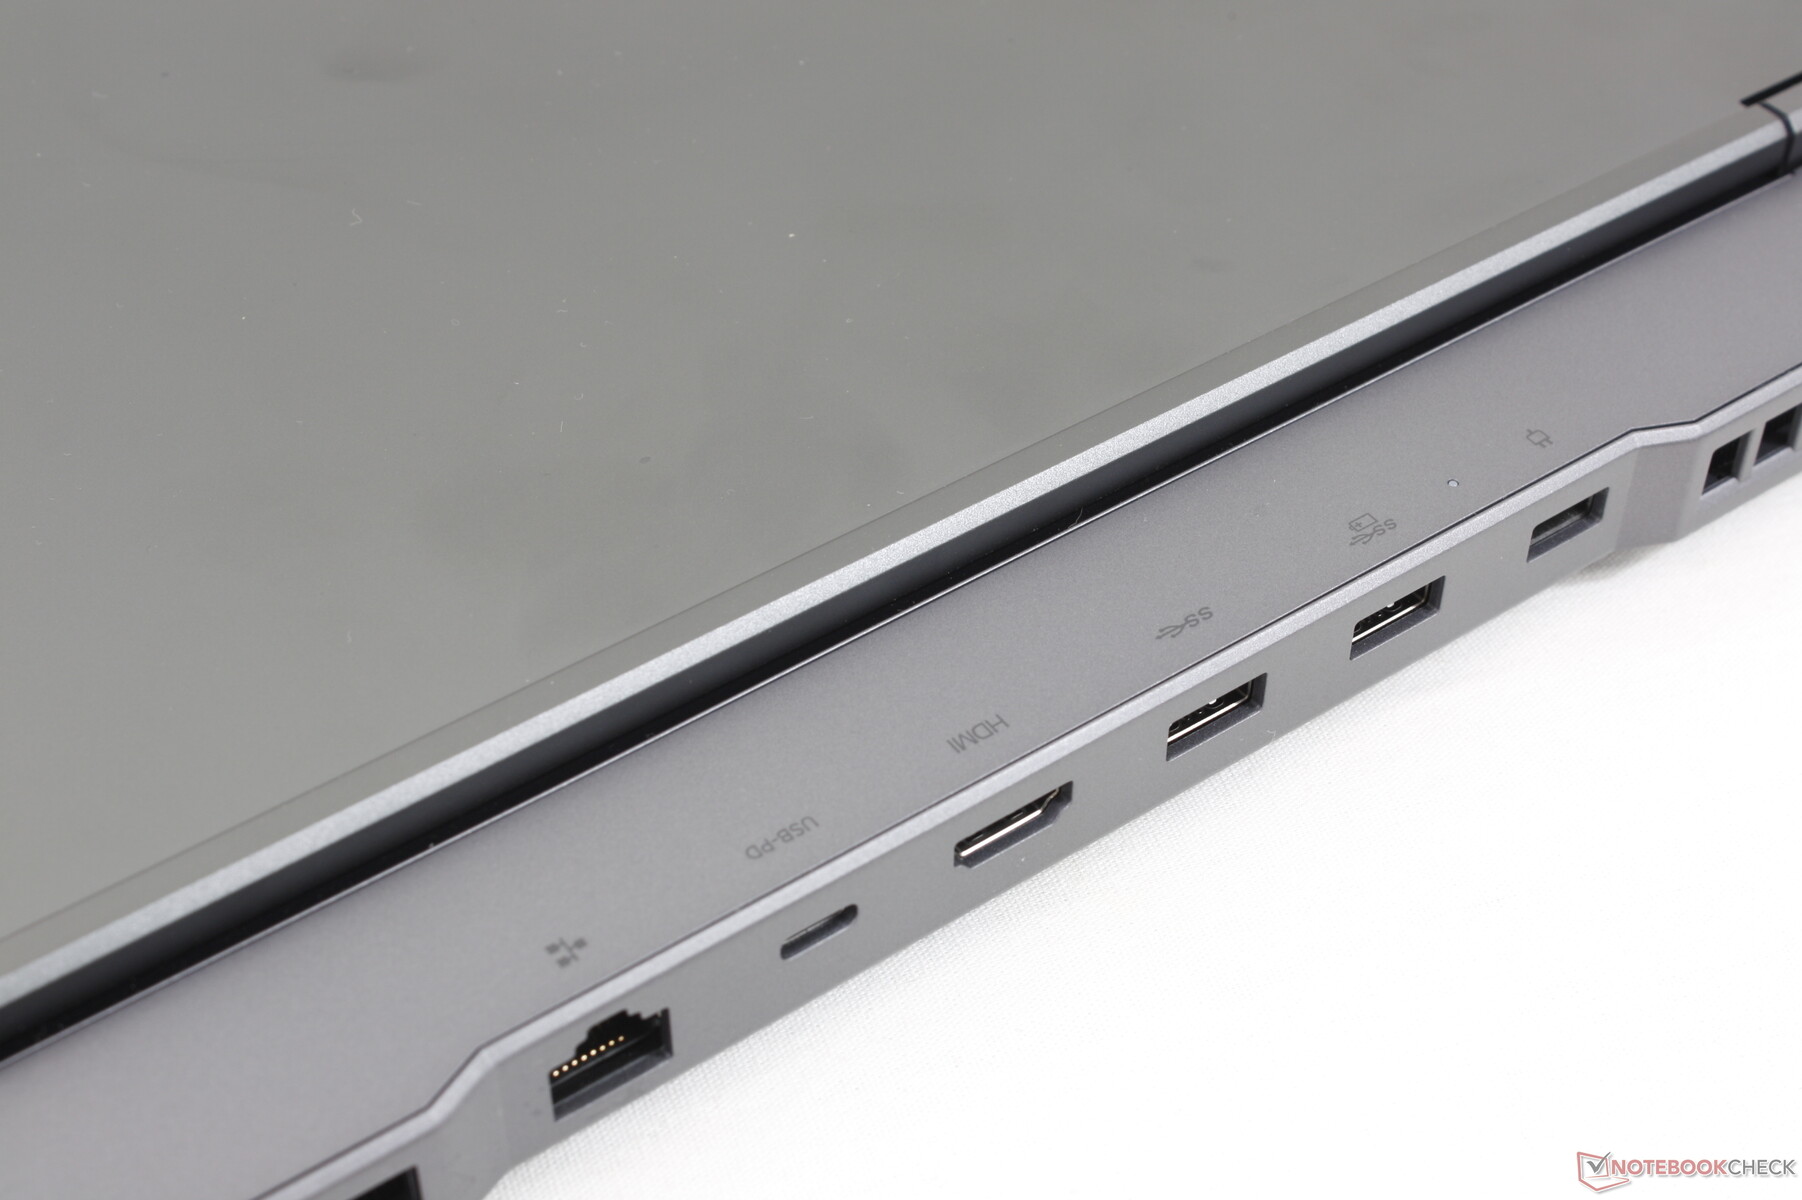
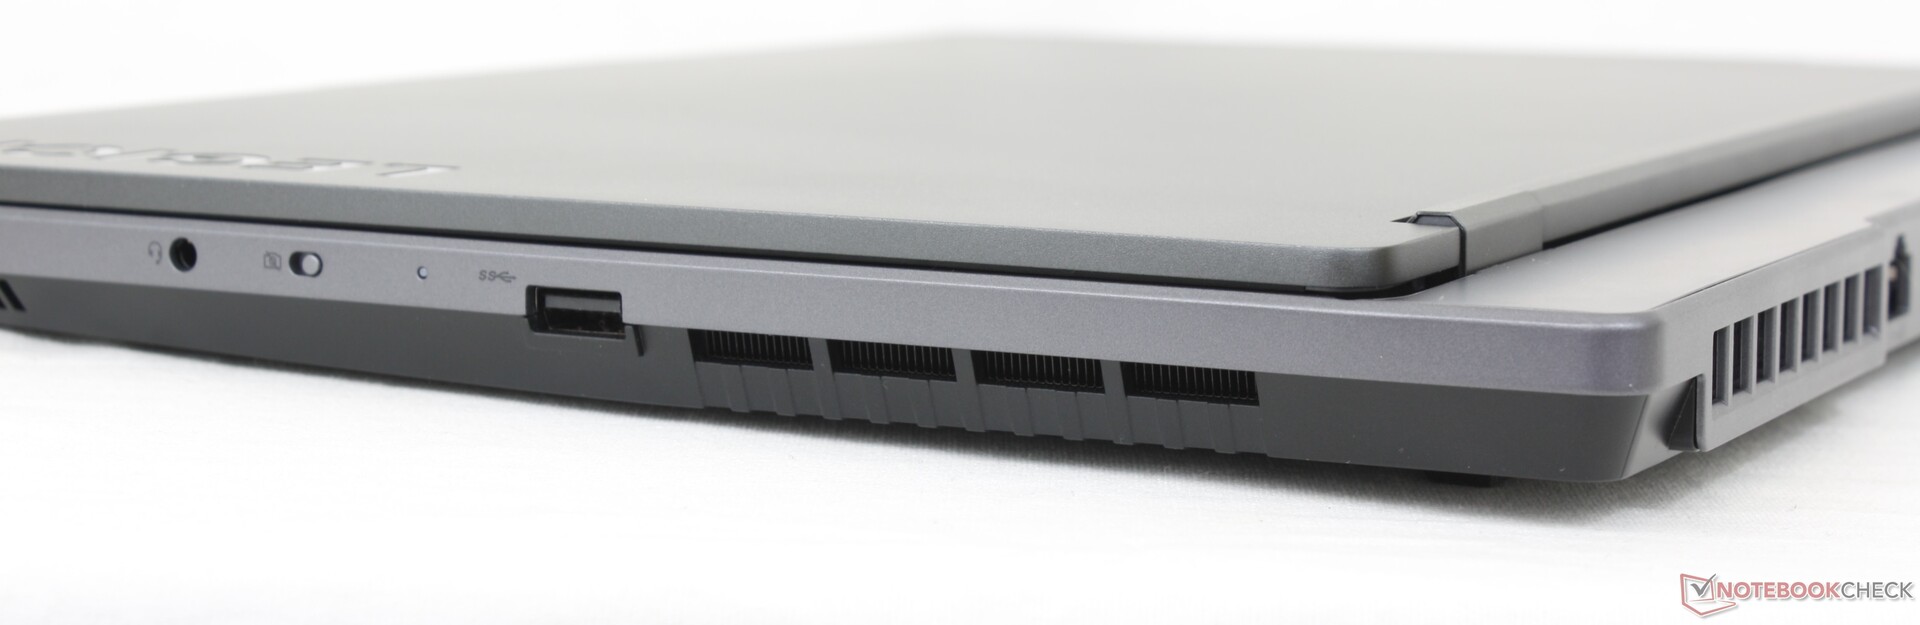
Jämfört med den AMD-baserade 2021-modellen byter vår Intel-modell ut en USB-A-port mot en USB-C-port. Portalternativen är annars identiska mellan de två modellerna, om än med omplacerad placering. Majoriteten av portarna finns längs baksidan till skillnad från på de flesta andra bärbara speldatorer på gott och ont.
Thunderbolt 4 stöds endast på den märkta USB-C-porten längs den vänstra kanten.
Kommunikation
Intel AX211 är standard på de flesta enheter för Wi-Fi 6E och Bluetooth 5.2-kompatibilitet. Vi upplevde inga problem när vi kopplade till vårt 6 GHz-nätverk.
| Networking | |
| iperf3 transmit AX12 | |
| Razer Blade 15 Base Edition 2021, i7-10750H RTX 3060 | |
| Acer Aspire Nitro 5 AN515-55-57GF | |
| MSI Bravo 15 B5DD-010US | |
| Asus TUF Gaming F15 FX507ZM | |
| Lenovo Legion 5 15ACH-82JU00C6GE-FL | |
| iperf3 receive AX12 | |
| Razer Blade 15 Base Edition 2021, i7-10750H RTX 3060 | |
| Asus TUF Gaming F15 FX507ZM | |
| MSI Bravo 15 B5DD-010US | |
| Lenovo Legion 5 15ACH-82JU00C6GE-FL | |
| Acer Aspire Nitro 5 AN515-55-57GF | |
| iperf3 receive AXE11000 6GHz | |
| Lenovo Legion 5 15IAH7H 82RB | |
| iperf3 receive AXE11000 | |
| Lenovo Legion 5 15IAH7H 82RB | |
| iperf3 transmit AXE11000 | |
| Lenovo Legion 5 15IAH7H 82RB | |
| iperf3 transmit AXE11000 6GHz | |
| Lenovo Legion 5 15IAH7H 82RB | |
Webbkamera - låg 1 MP-kvalitet
Kamerakvaliteten är dålig med en 720p webbkamera. Windows Hello stöds inte heller.


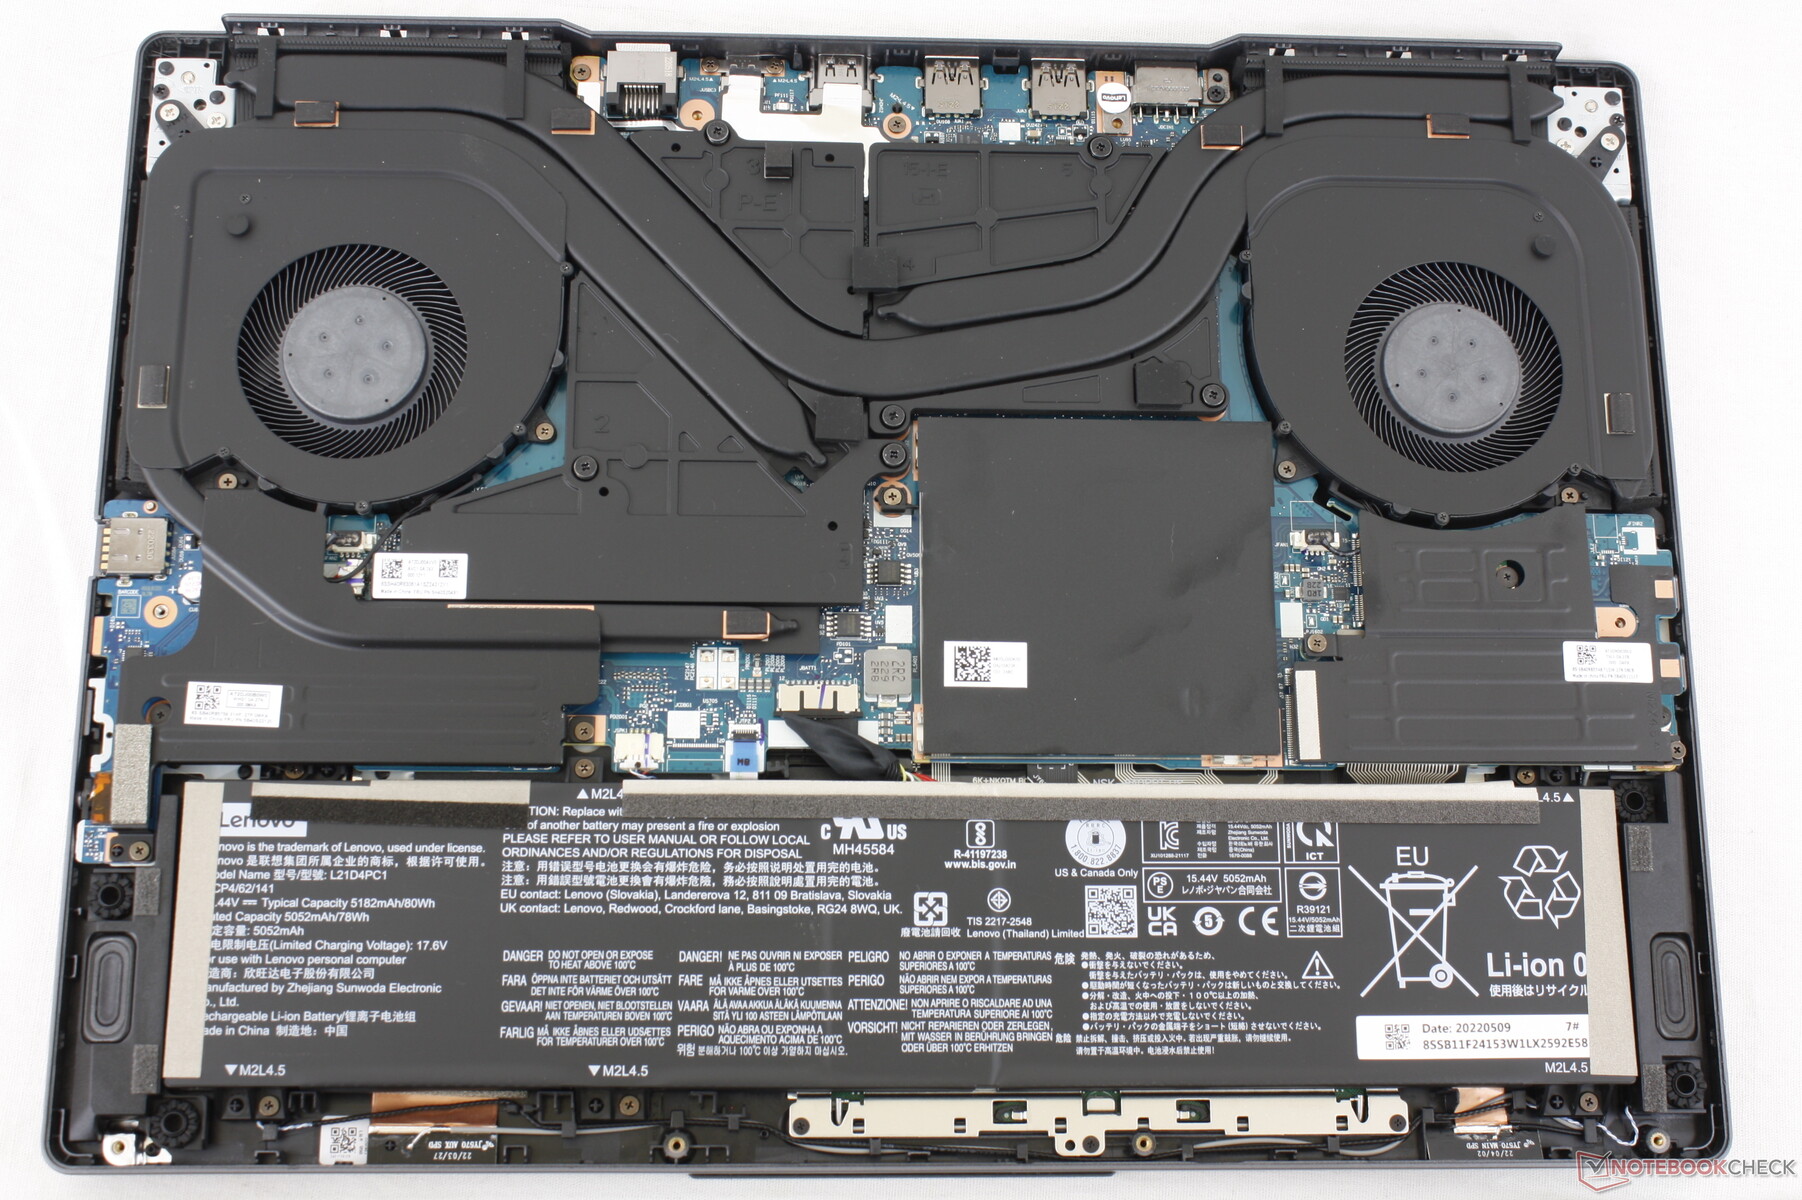
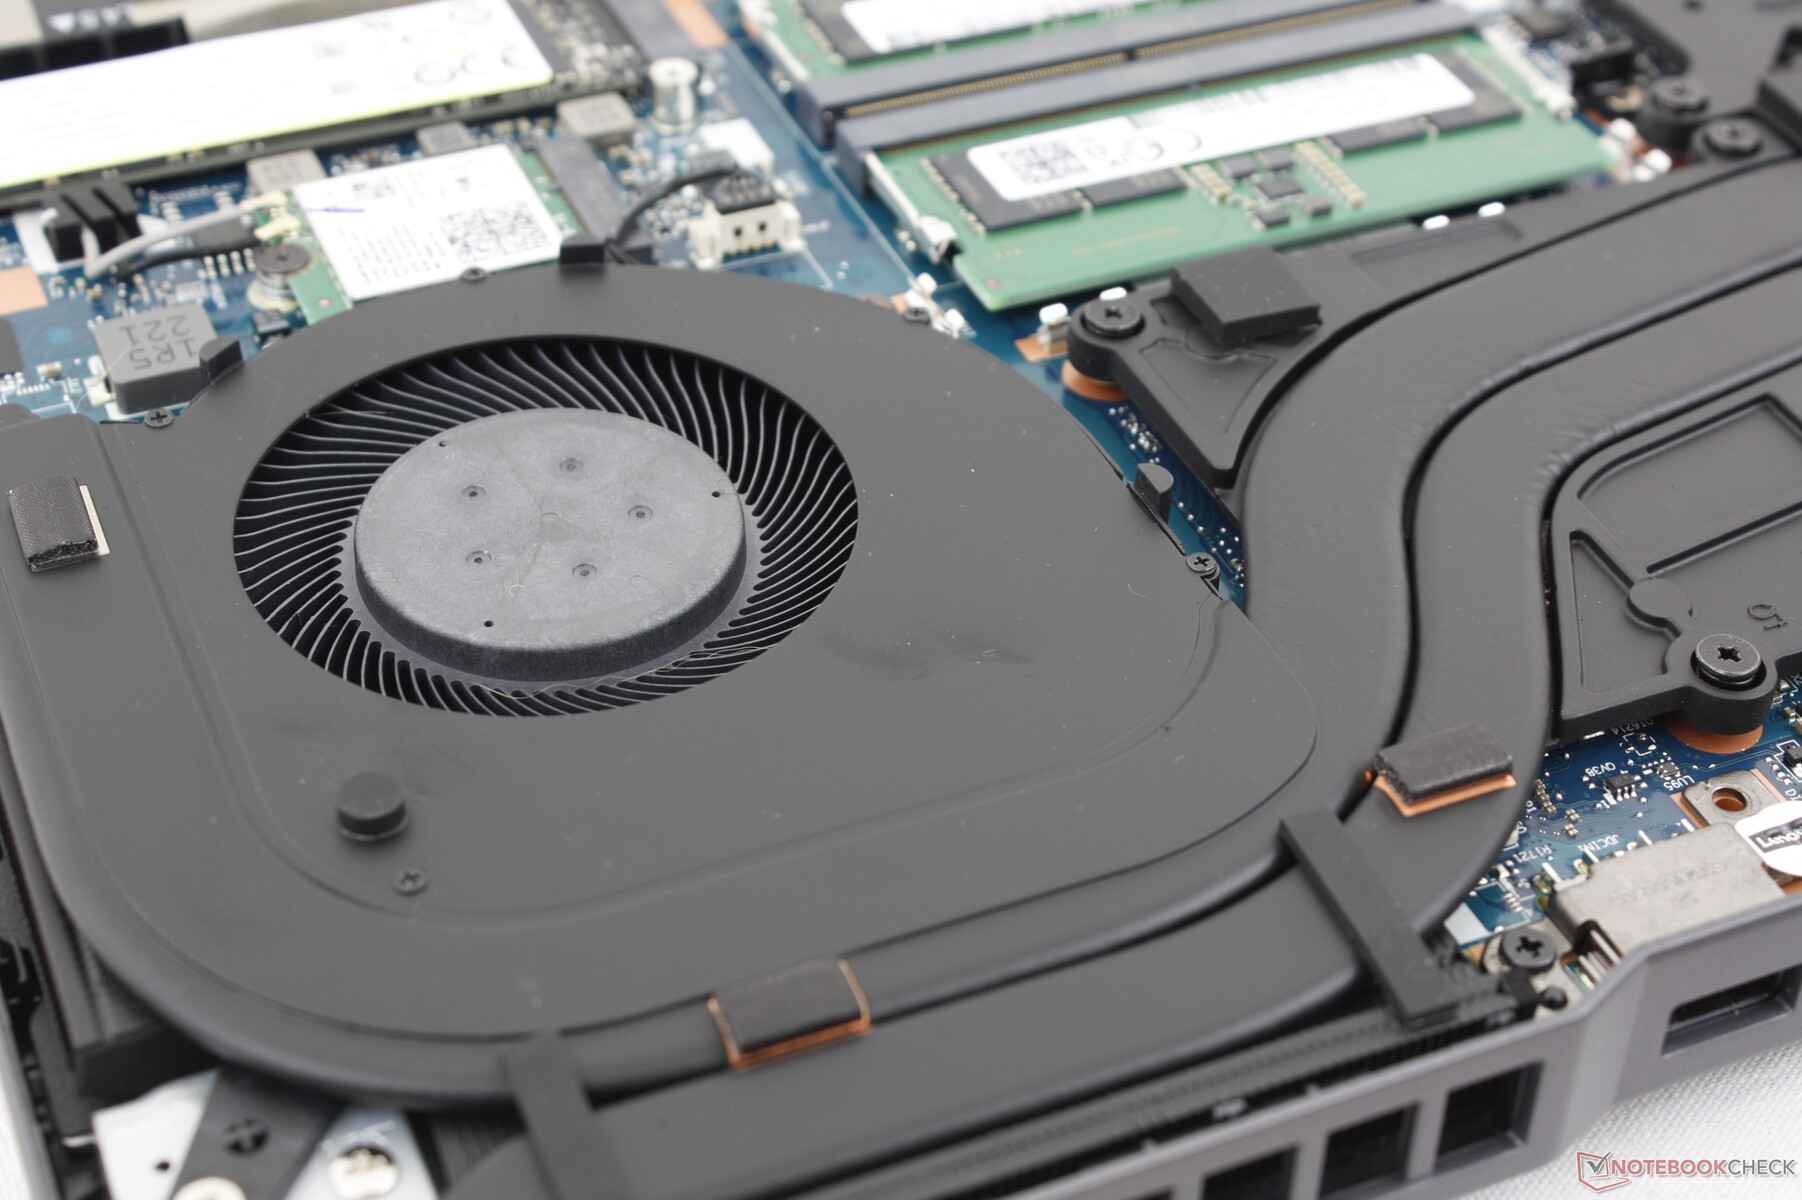
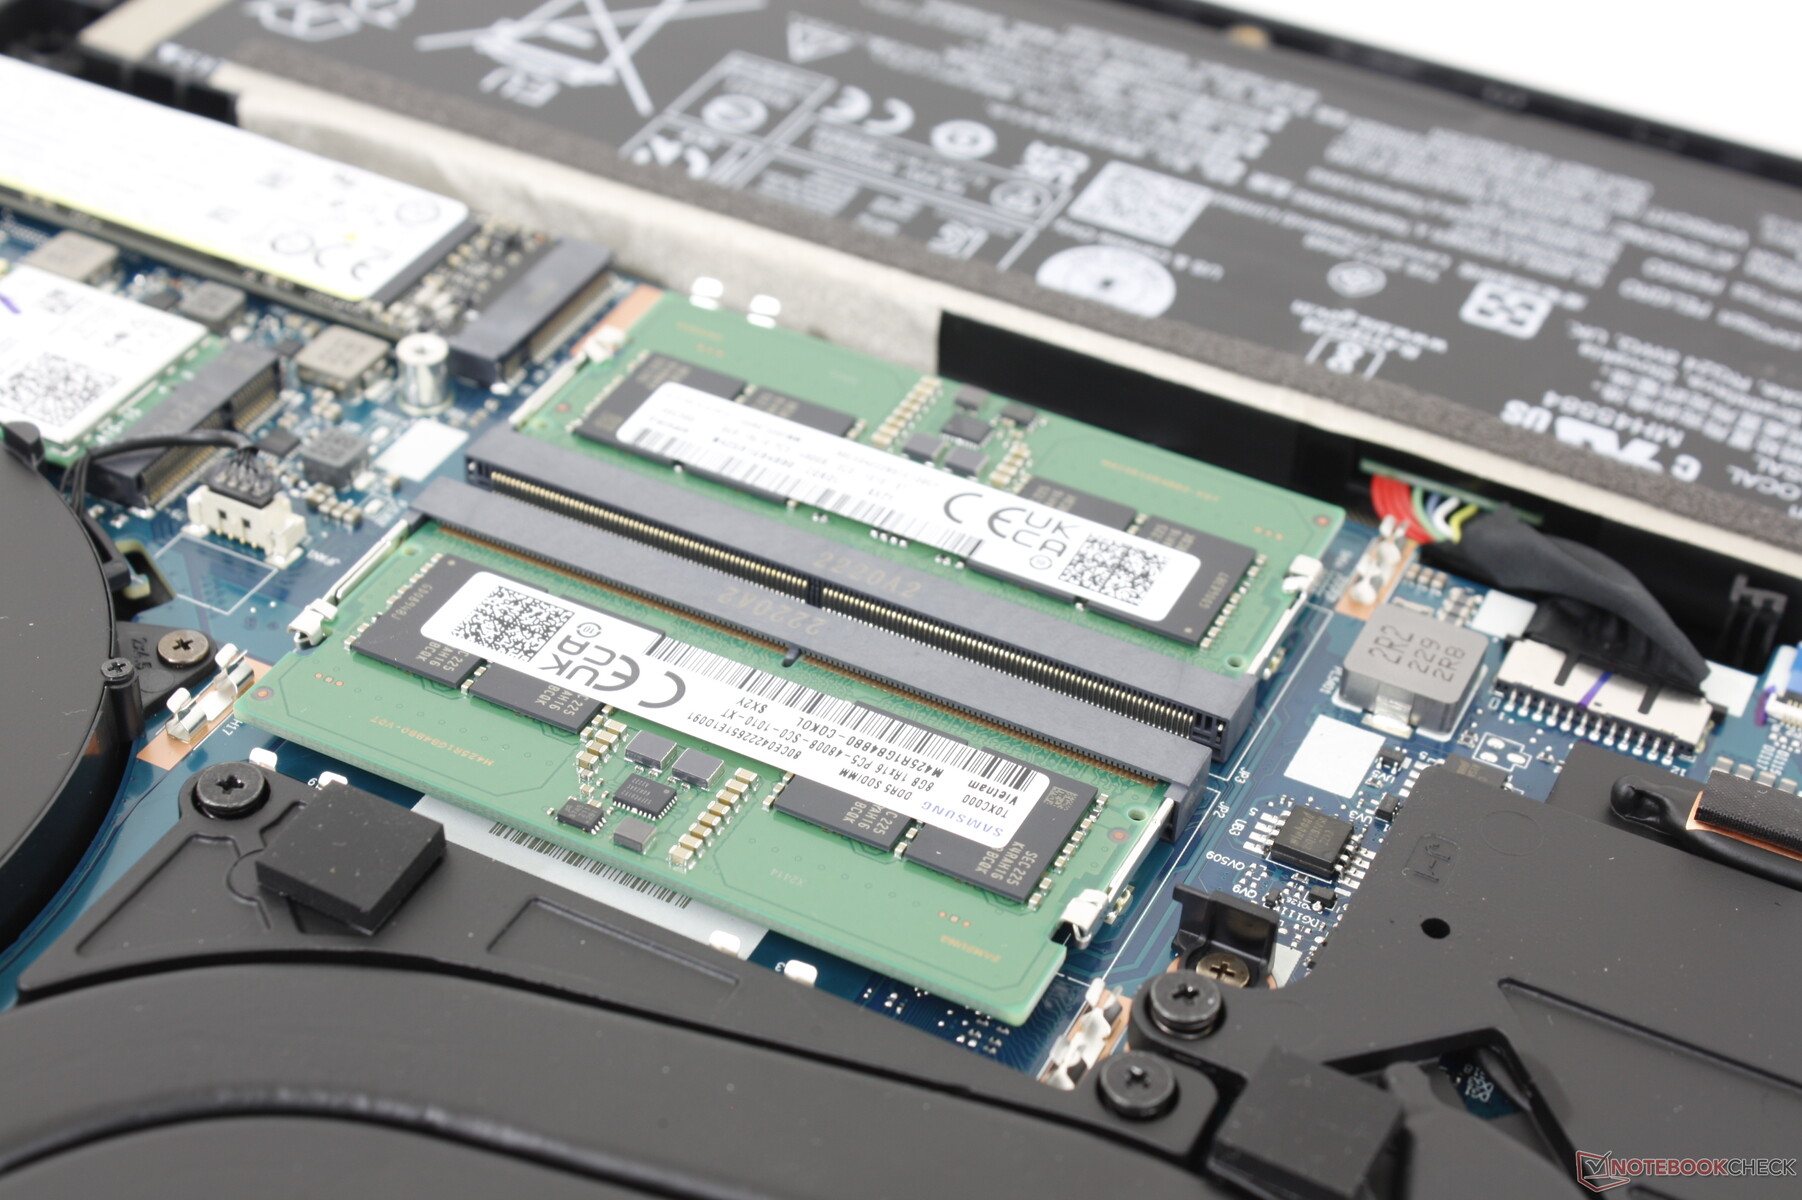
Underhåll
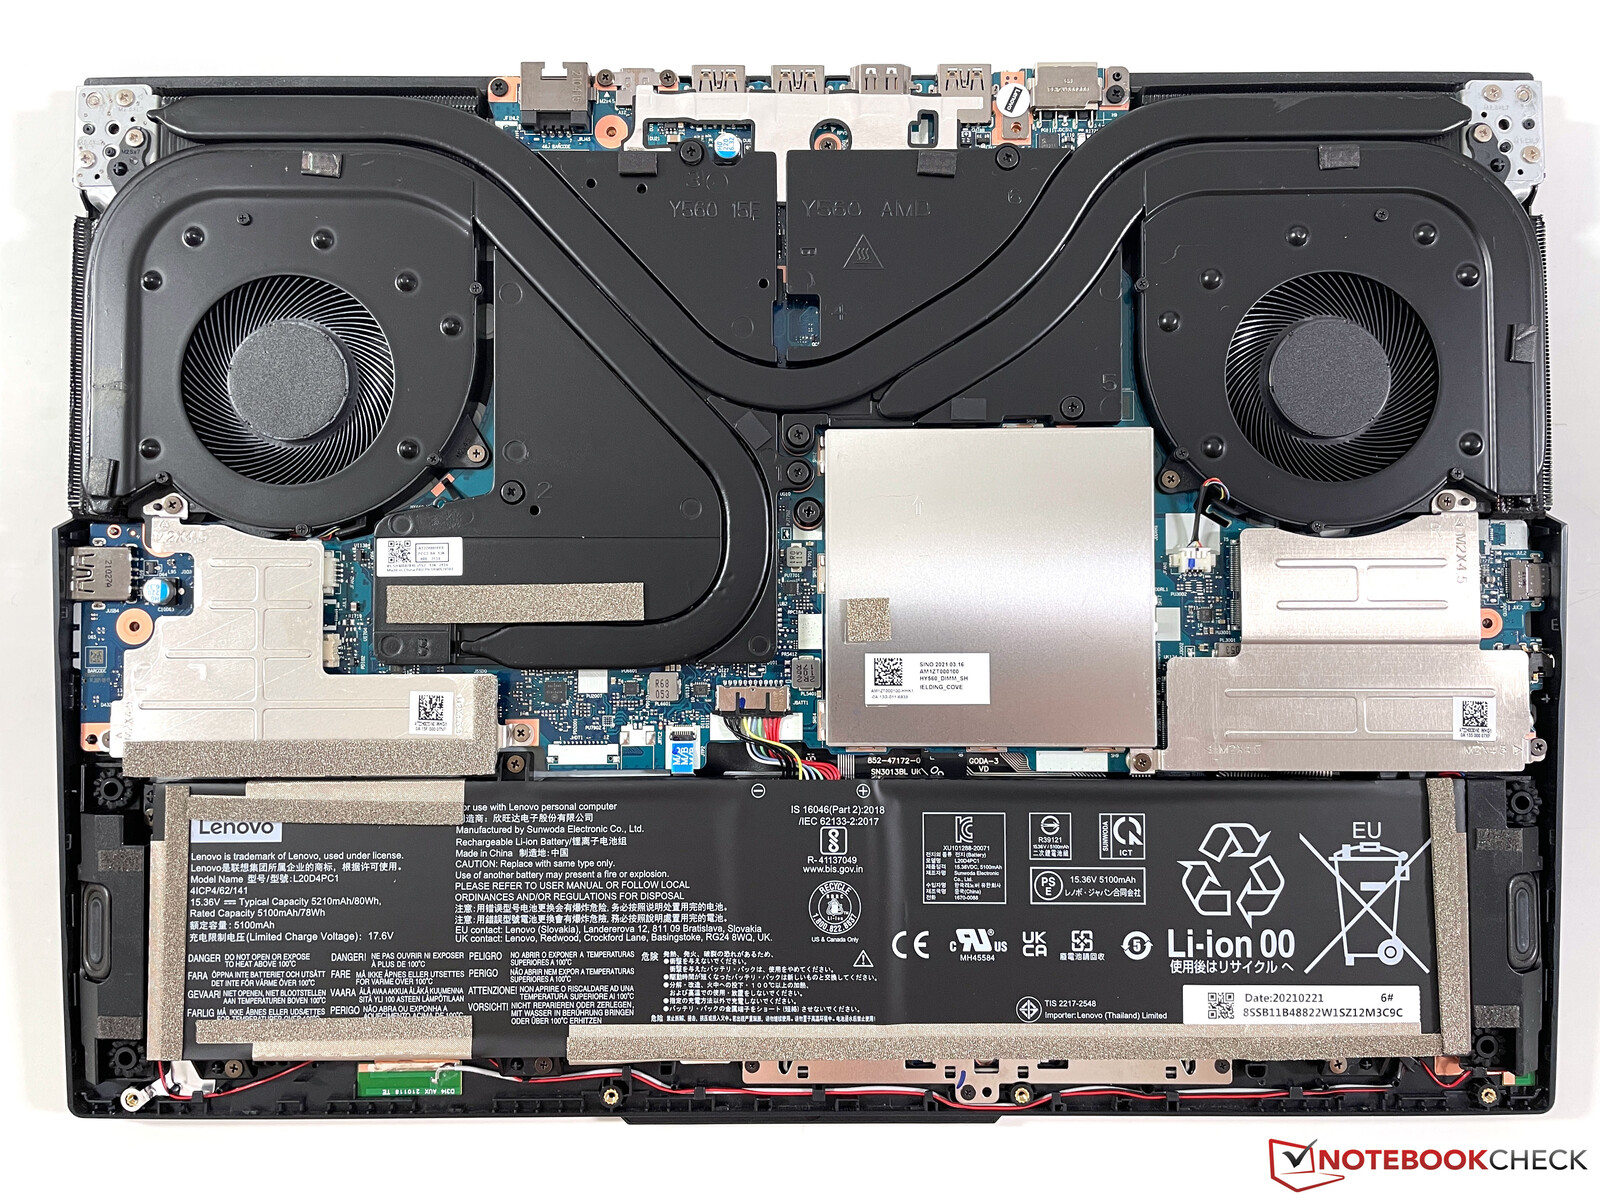
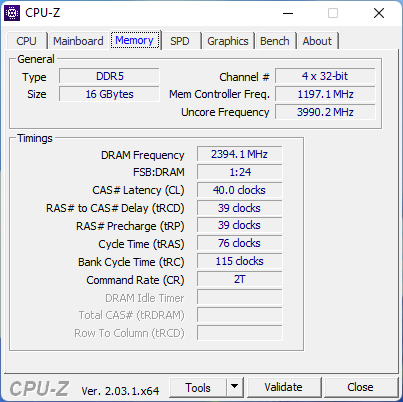
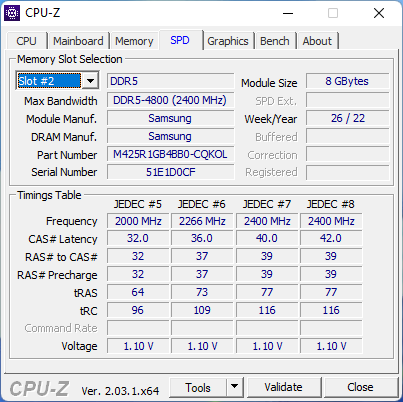
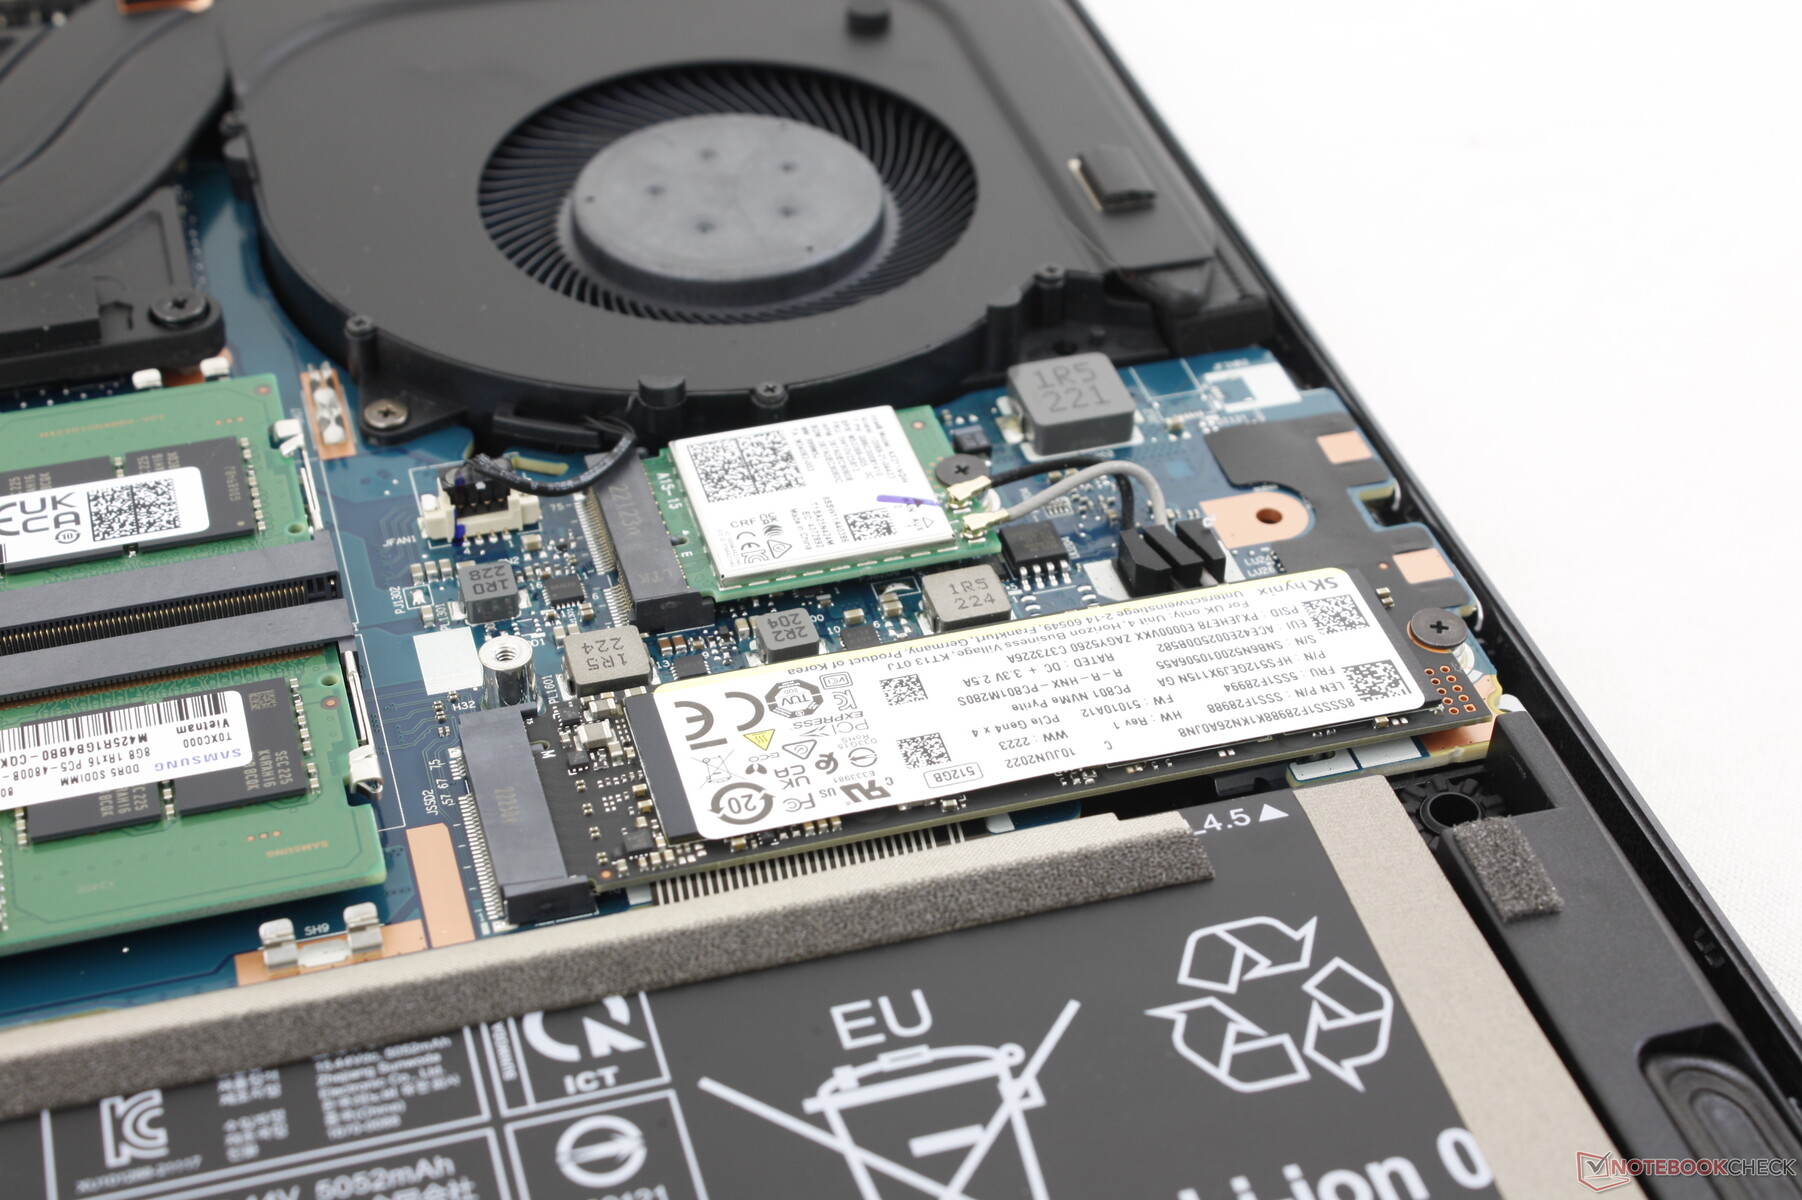
Det räcker med en Philips-skruvmejsel för att ta bort bottenpanelen. Användare kan lägga till/ta bort upp till två DDR5 SODIMM-moduler, två M.2 PCIe4 x4 2280 SSD-enheter och en M.2 WLAN-modul.
Tillbehör och garanti
Det finns inga extra tillbehör i lådan utöver nätadaptern och pappersarbete. Den vanliga ettåriga begränsade tillverkargarantin gäller.
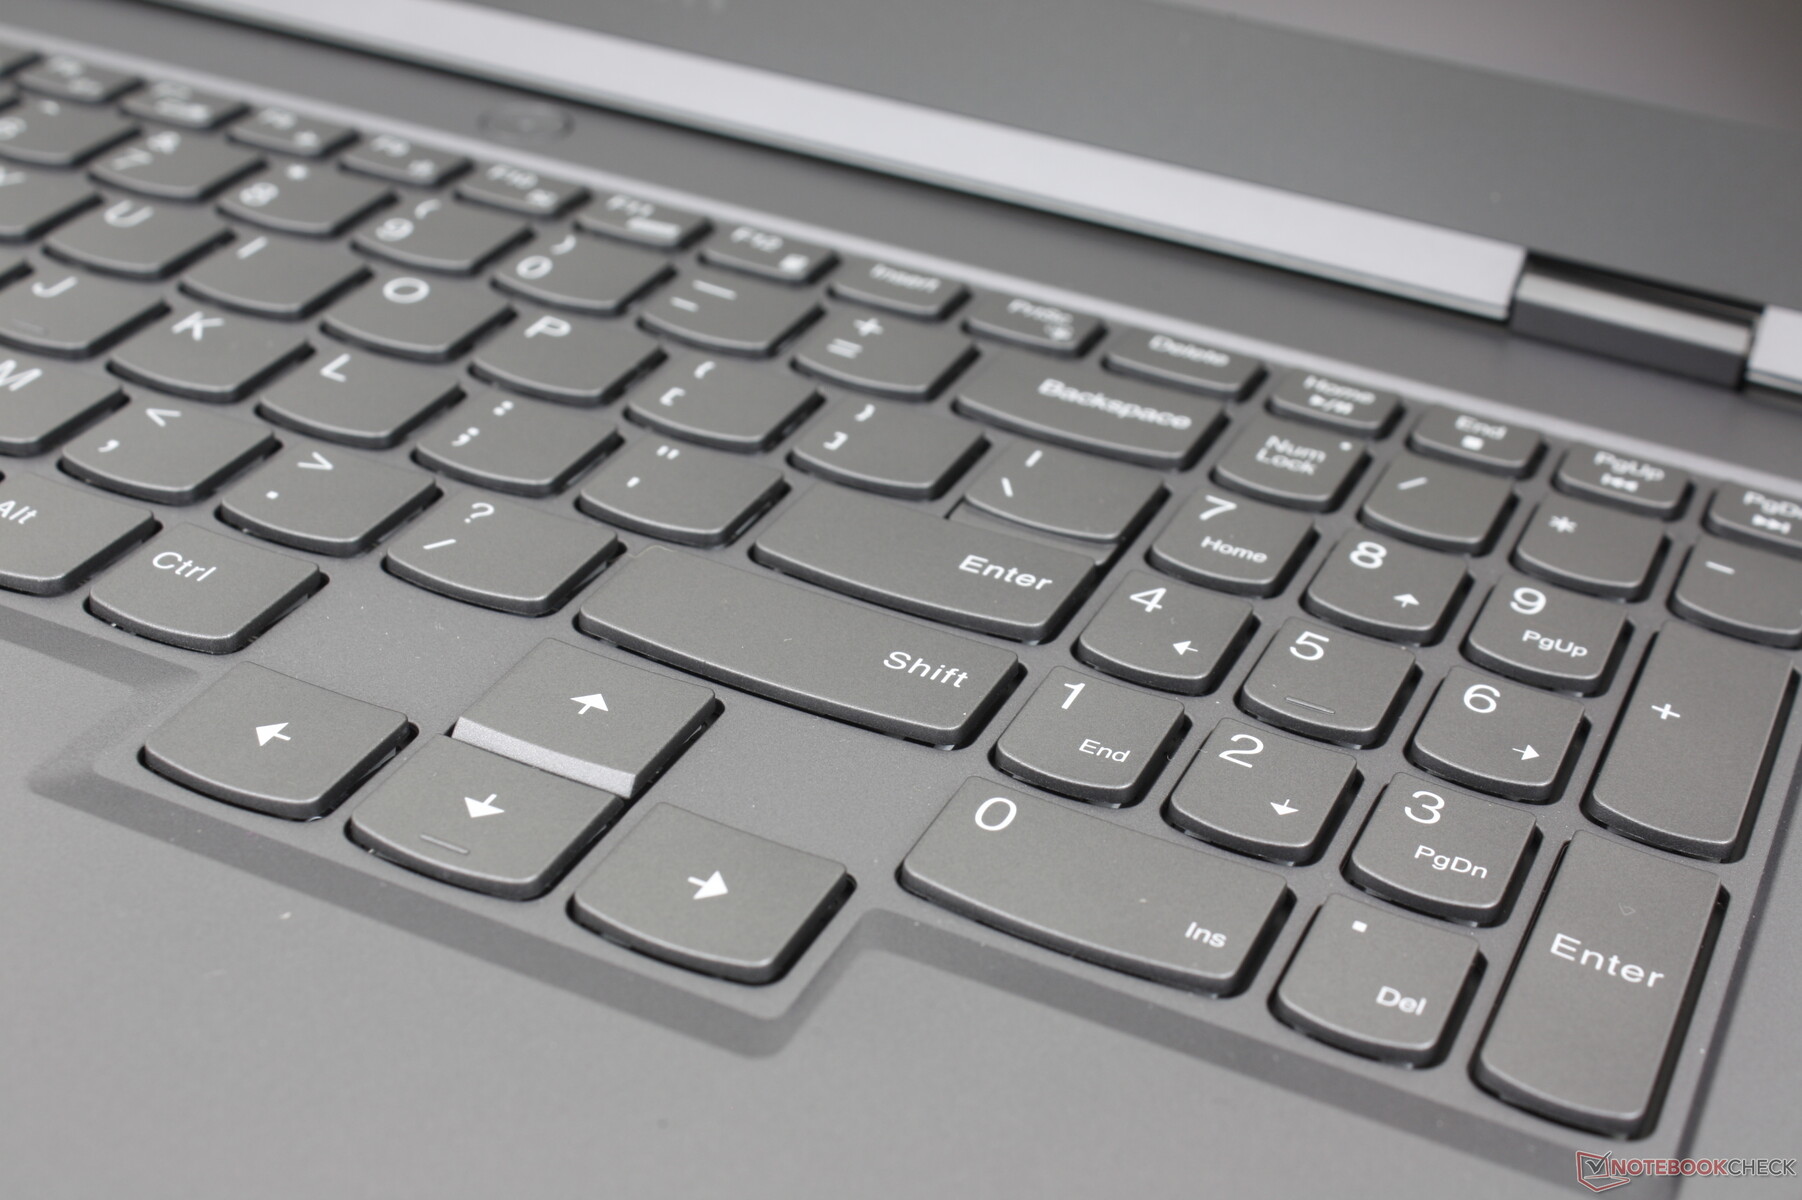
Inmatningsenheter - Bra tangentbord, svampig klickplatta
Tangentbord
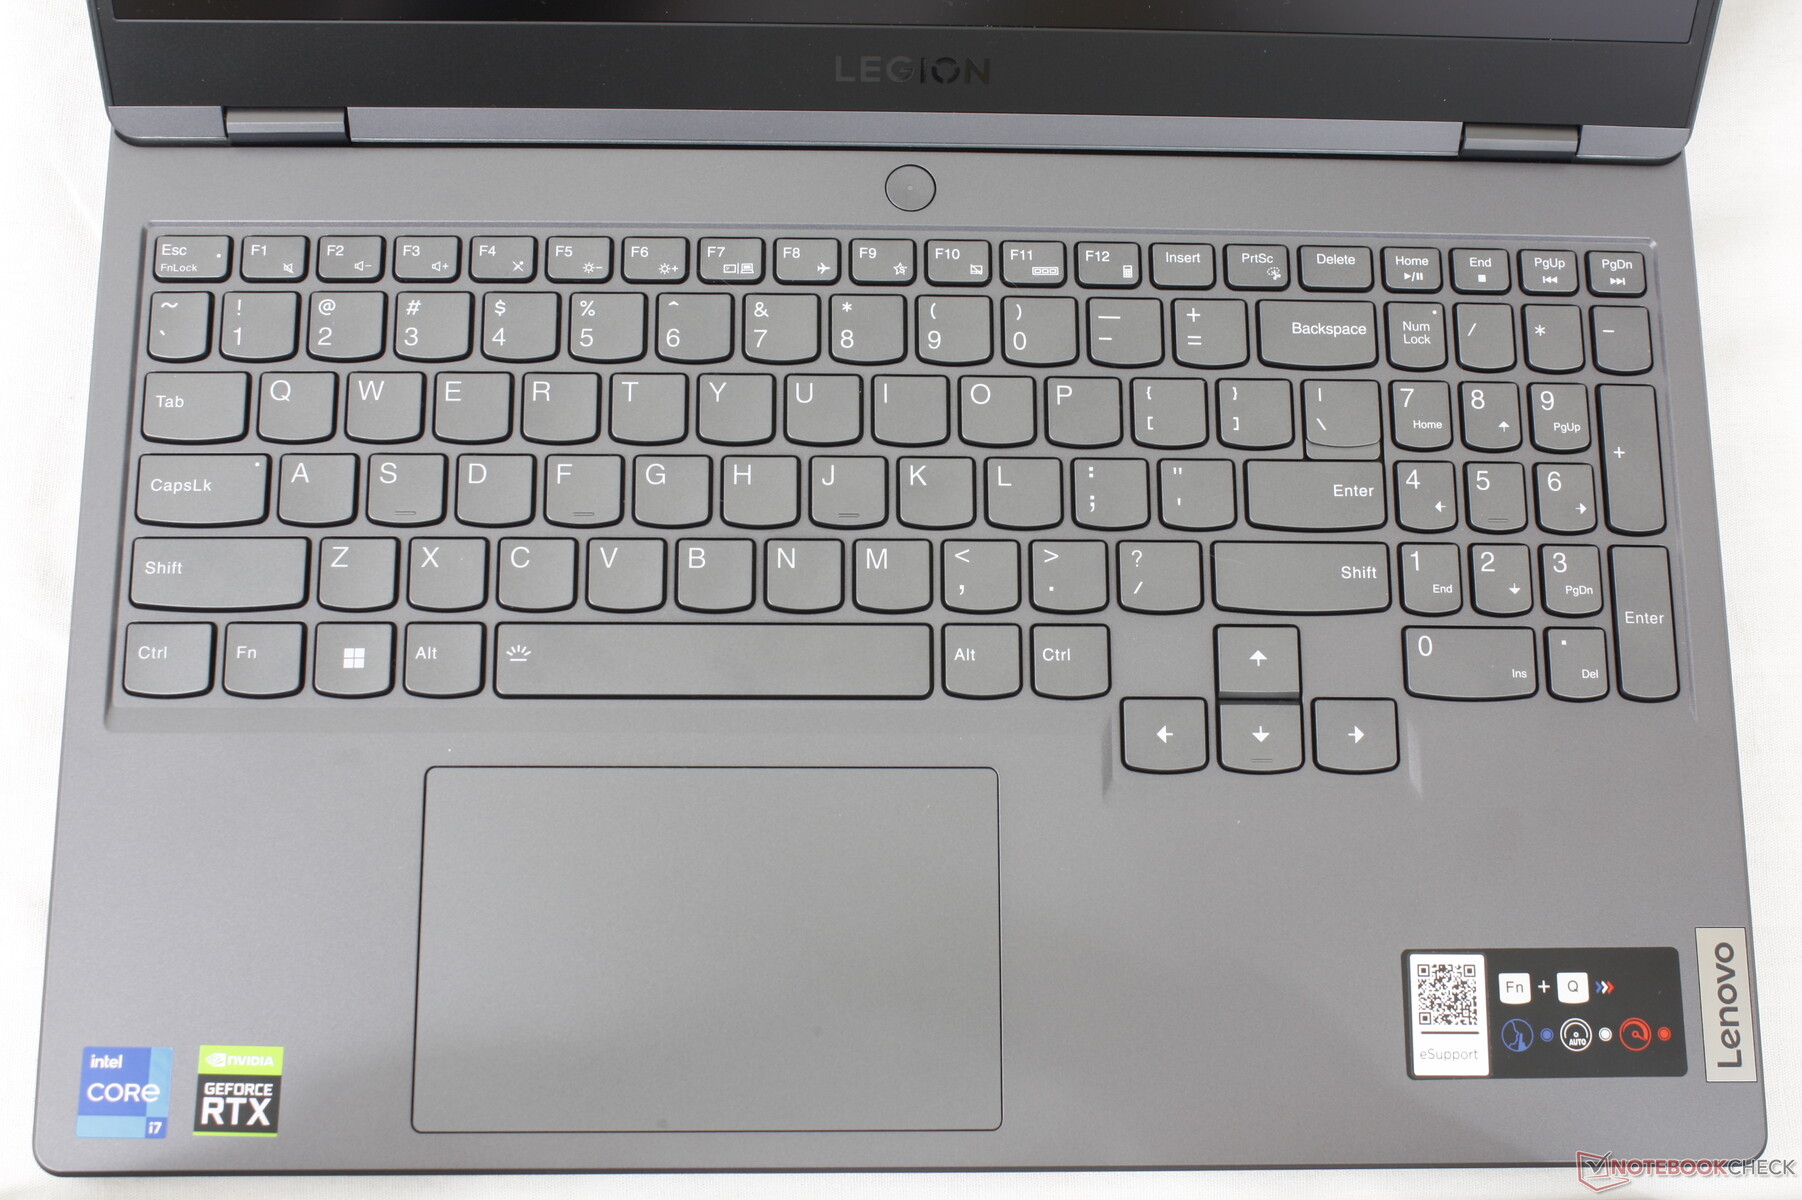
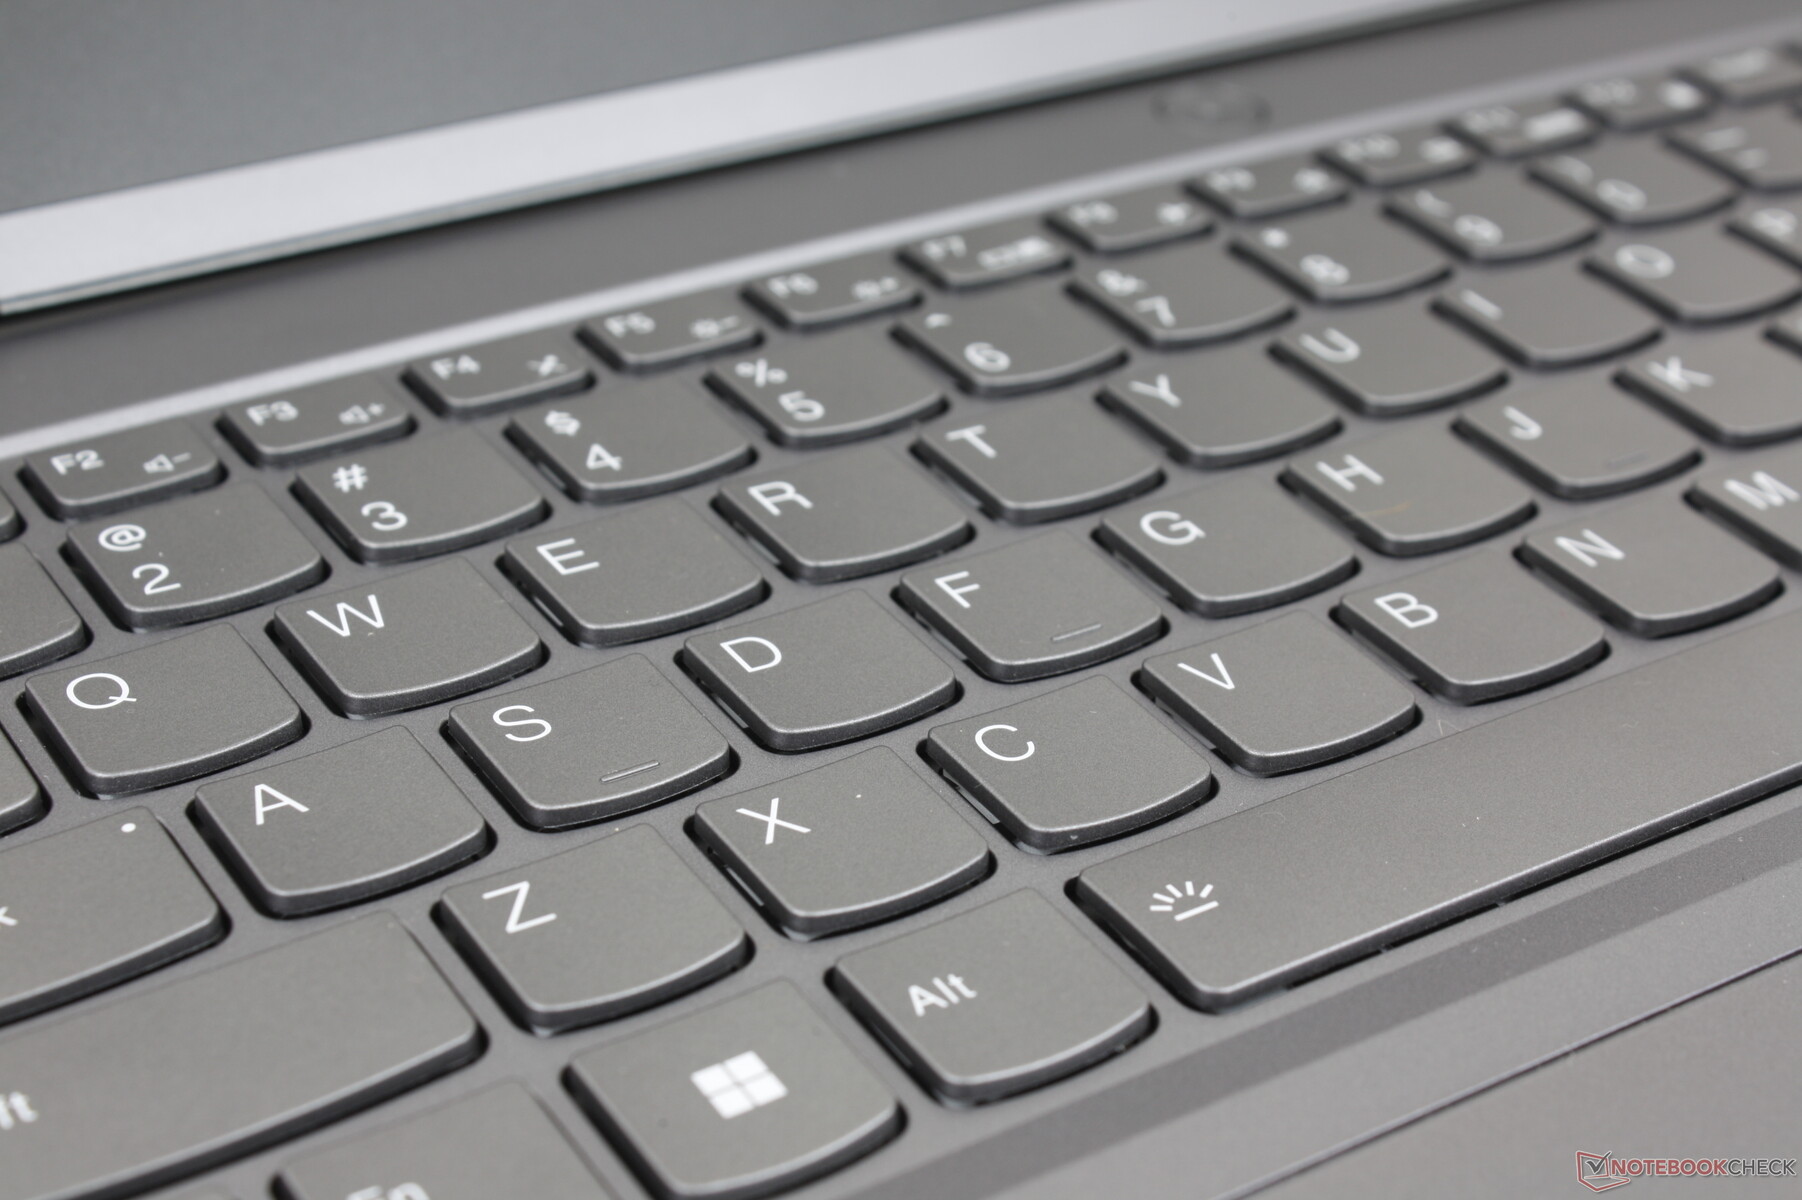
Legion 5 15 använder traditionella membranbaserade tangenter i stället för mekaniska tangenter som finns på vissa högre modeller som t.ex Alienware m15-serien. Trots detta är tangentåterkopplingen och tangenternas rörlighet skarpare och djupare på Legion jämfört med tangenterna på vanliga Ultrabooks. Om du skriver mycket kan du kanske tycka att tangentbordet här är bekvämare för kontorsuppgifter än på en billigare IdeaPad eller Dell Inspiron
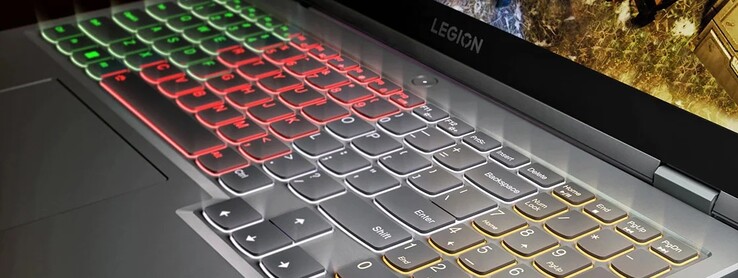
En bakgrundsbelysning för tangentbordet ingår i alla konfigurationer, men vissa är endast vita med en zon medan andra har RGB med fyra zoner. Det finns inget RGB-alternativ per tangent som sannolikt sparar på kostnaderna. Alla tangenter och symboler blir upplysta.
Pekplatta
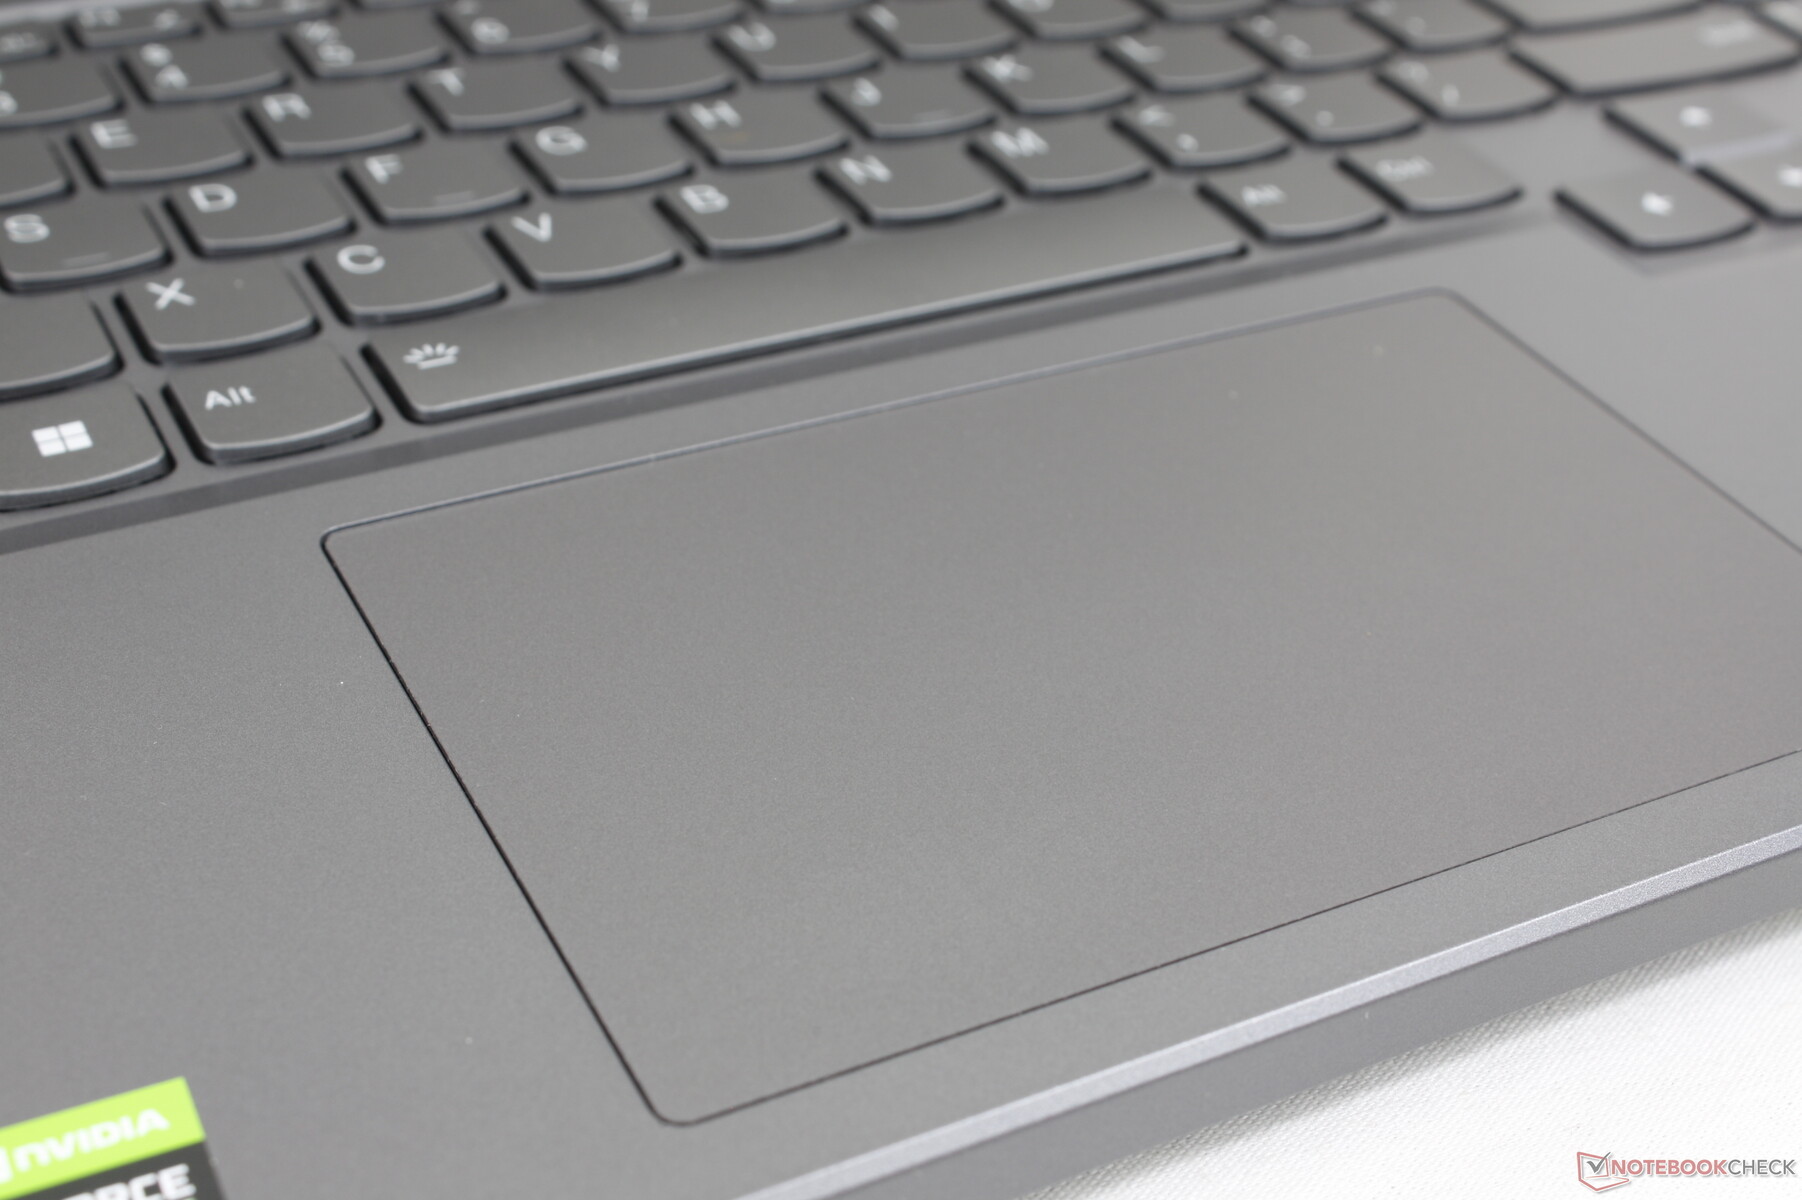
Klickplattan har samma storlek som klickplattan på den dyrare Legion 7 16 på 12 x 7,5 cm. Återkopplingen är också identisk, så användarna kan förvänta sig ett något svampigt och otillfredsställande klick när de trycker på den. Klickplattans yta är slät precis som på de omgivande handflatorna, men vi rekommenderar att du använder en extern mus för att få det lättare att klicka och dra.
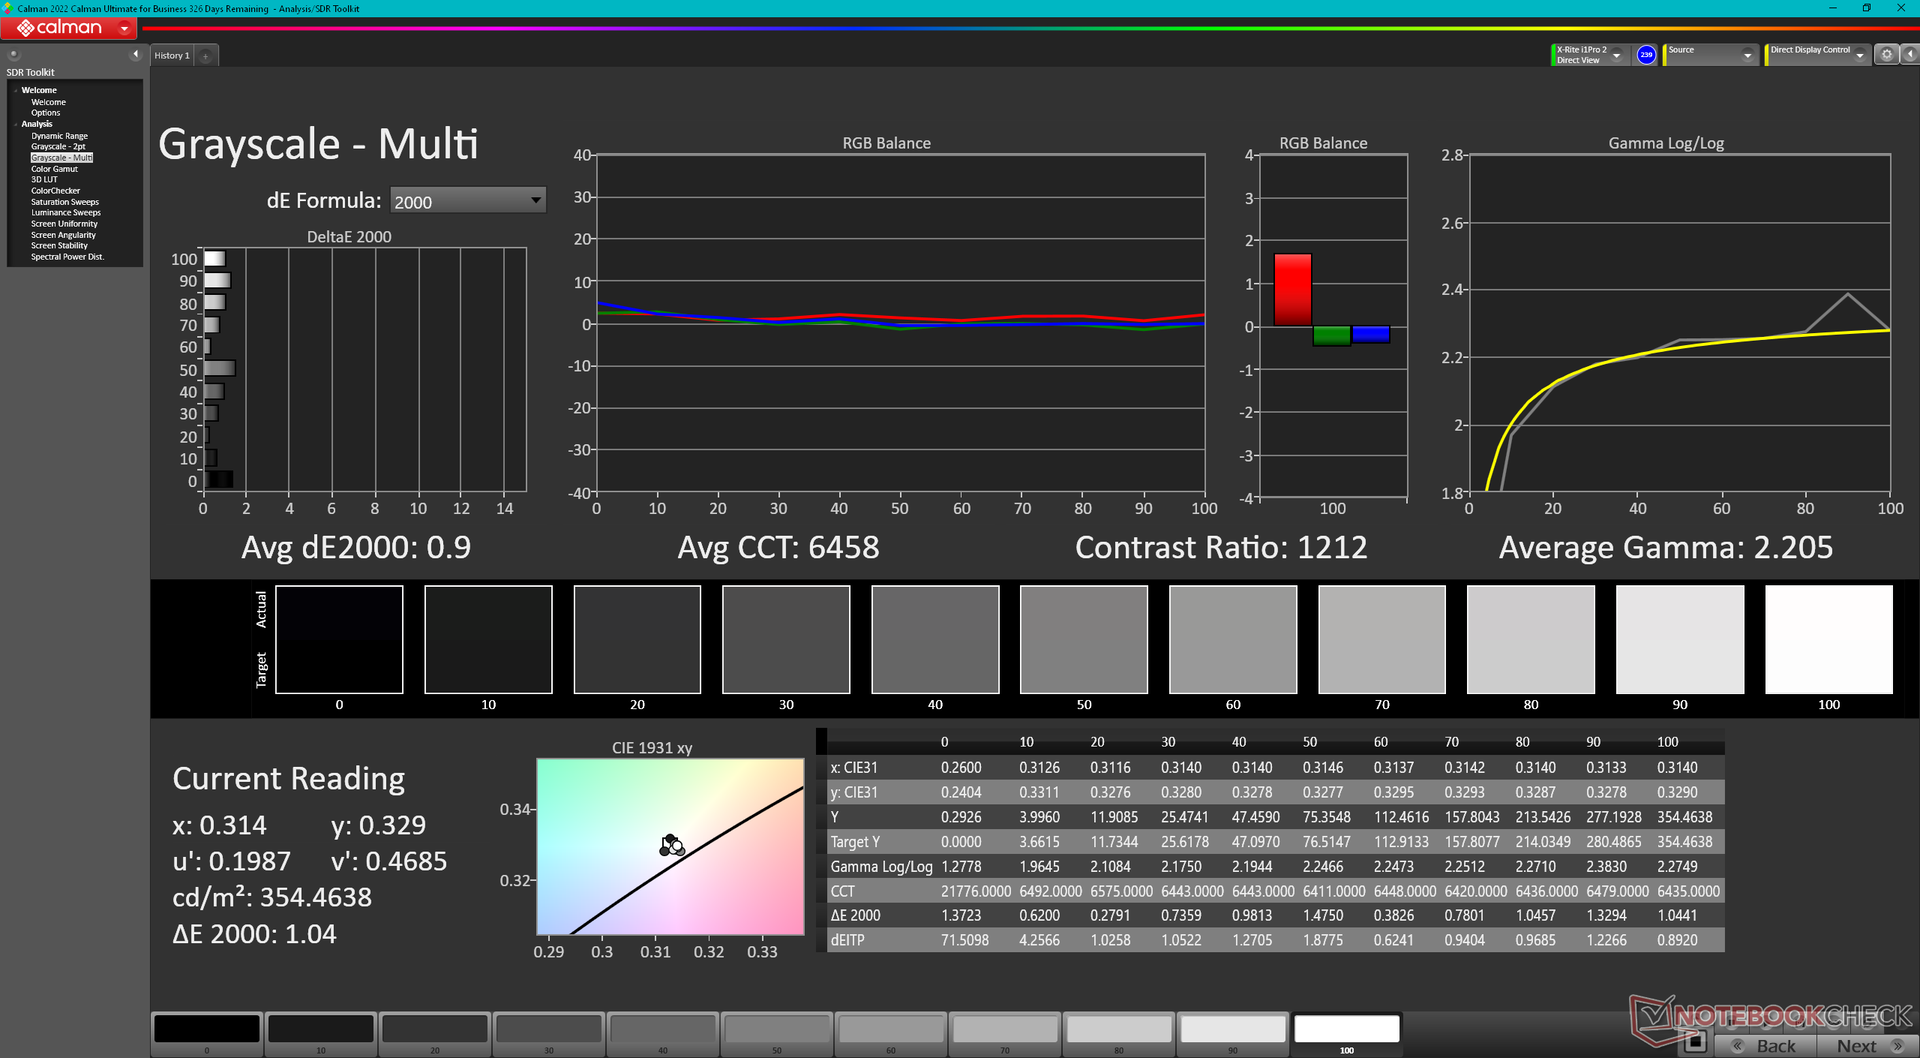
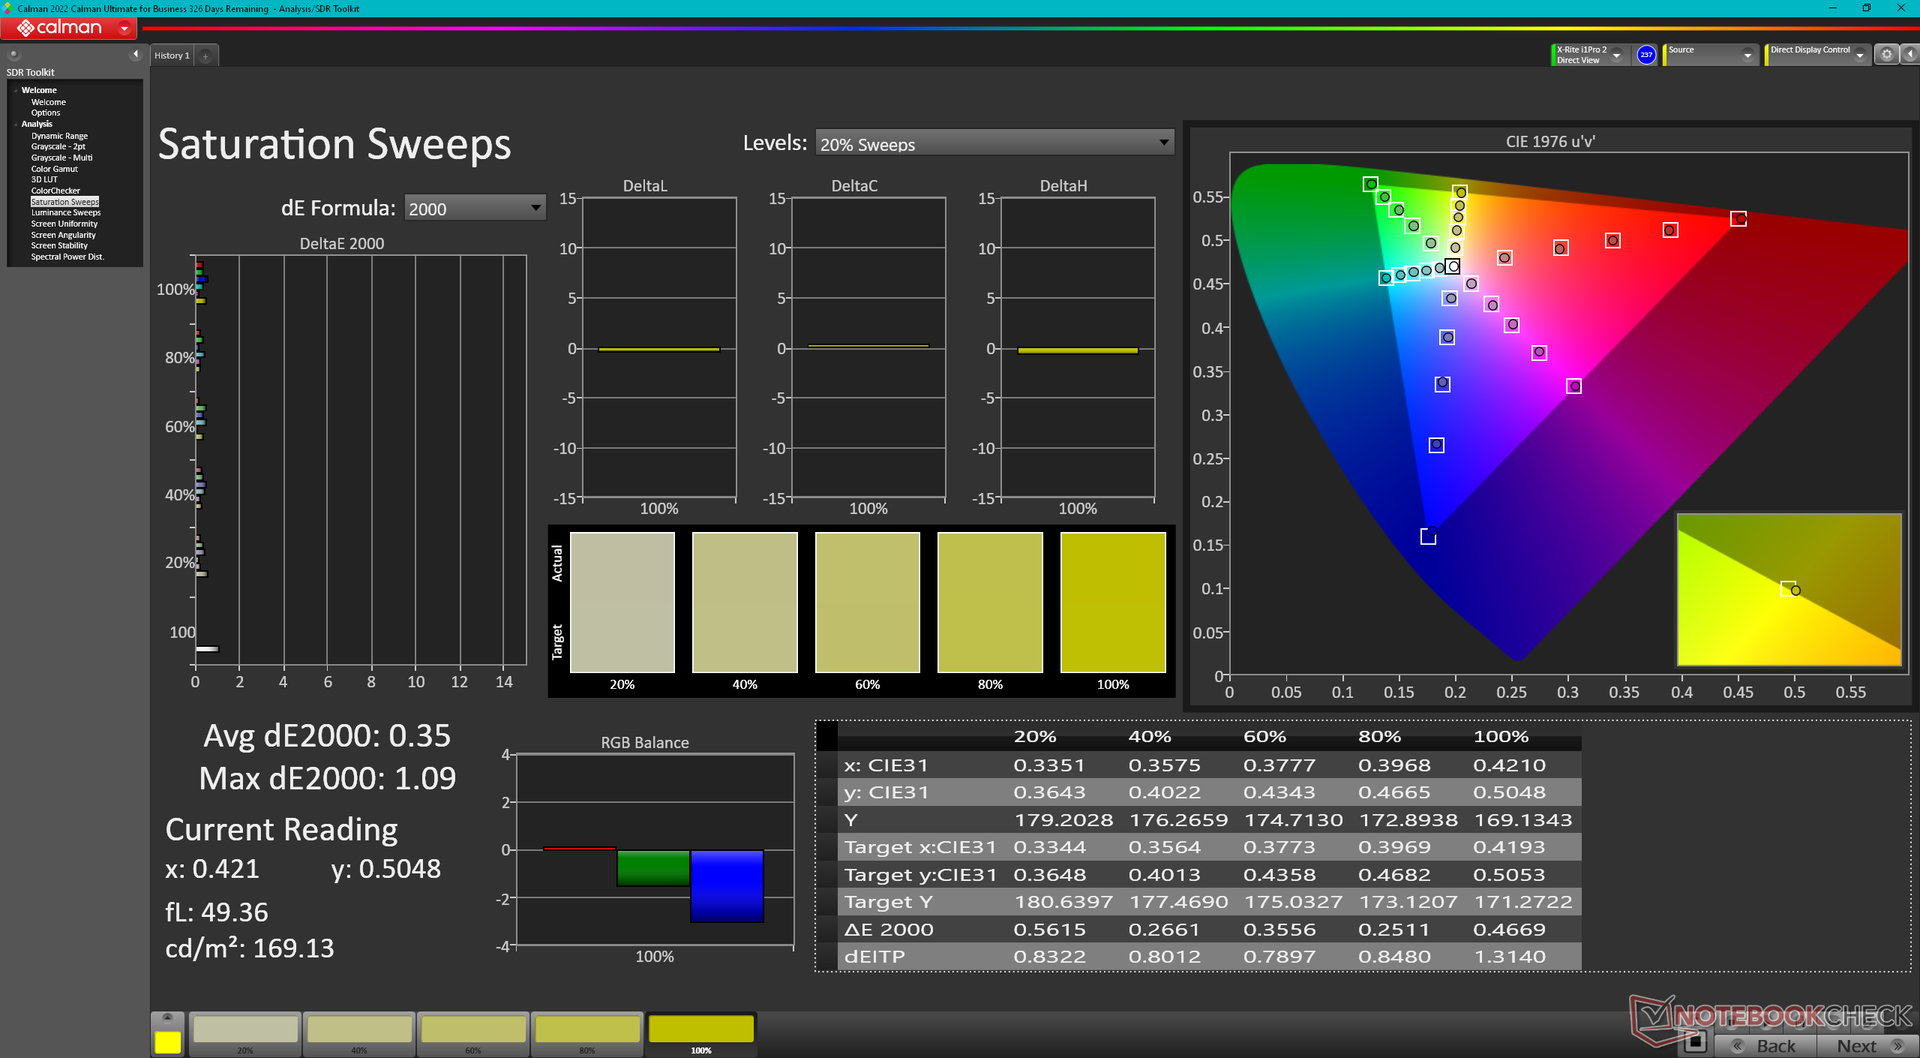
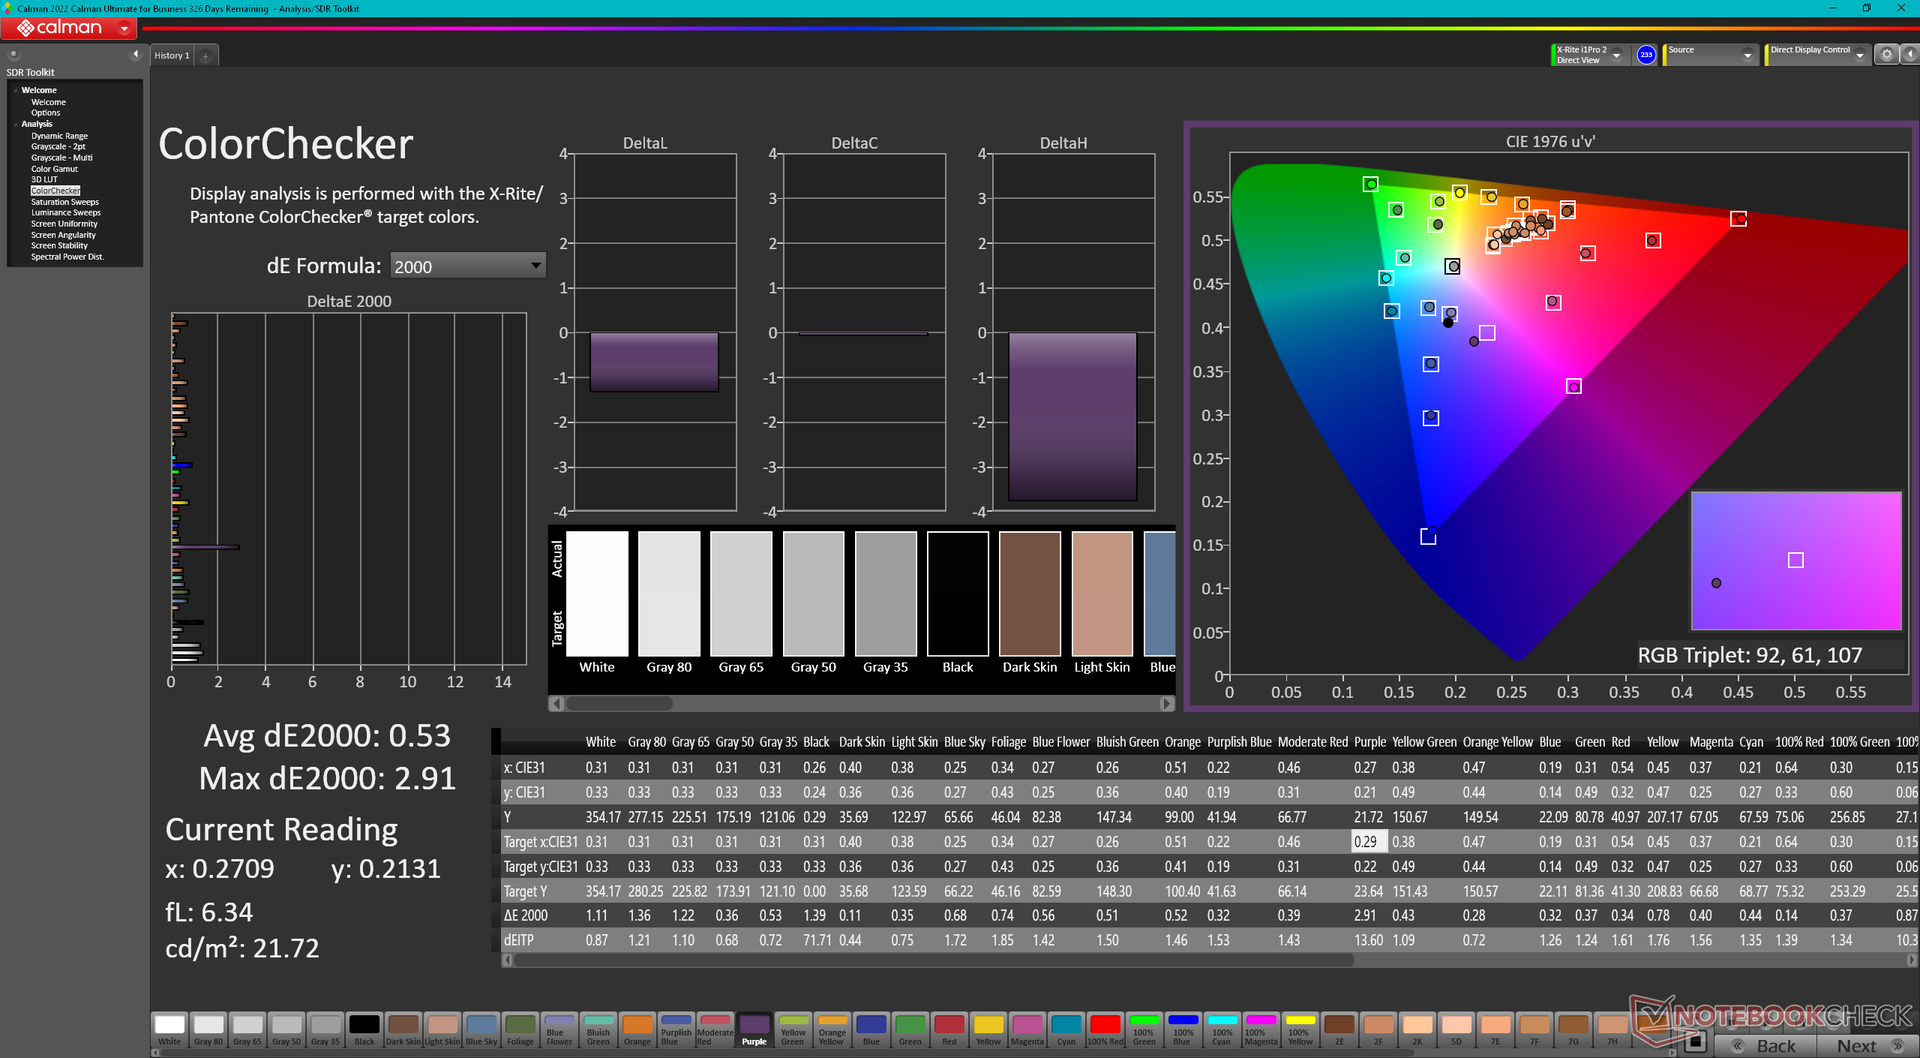
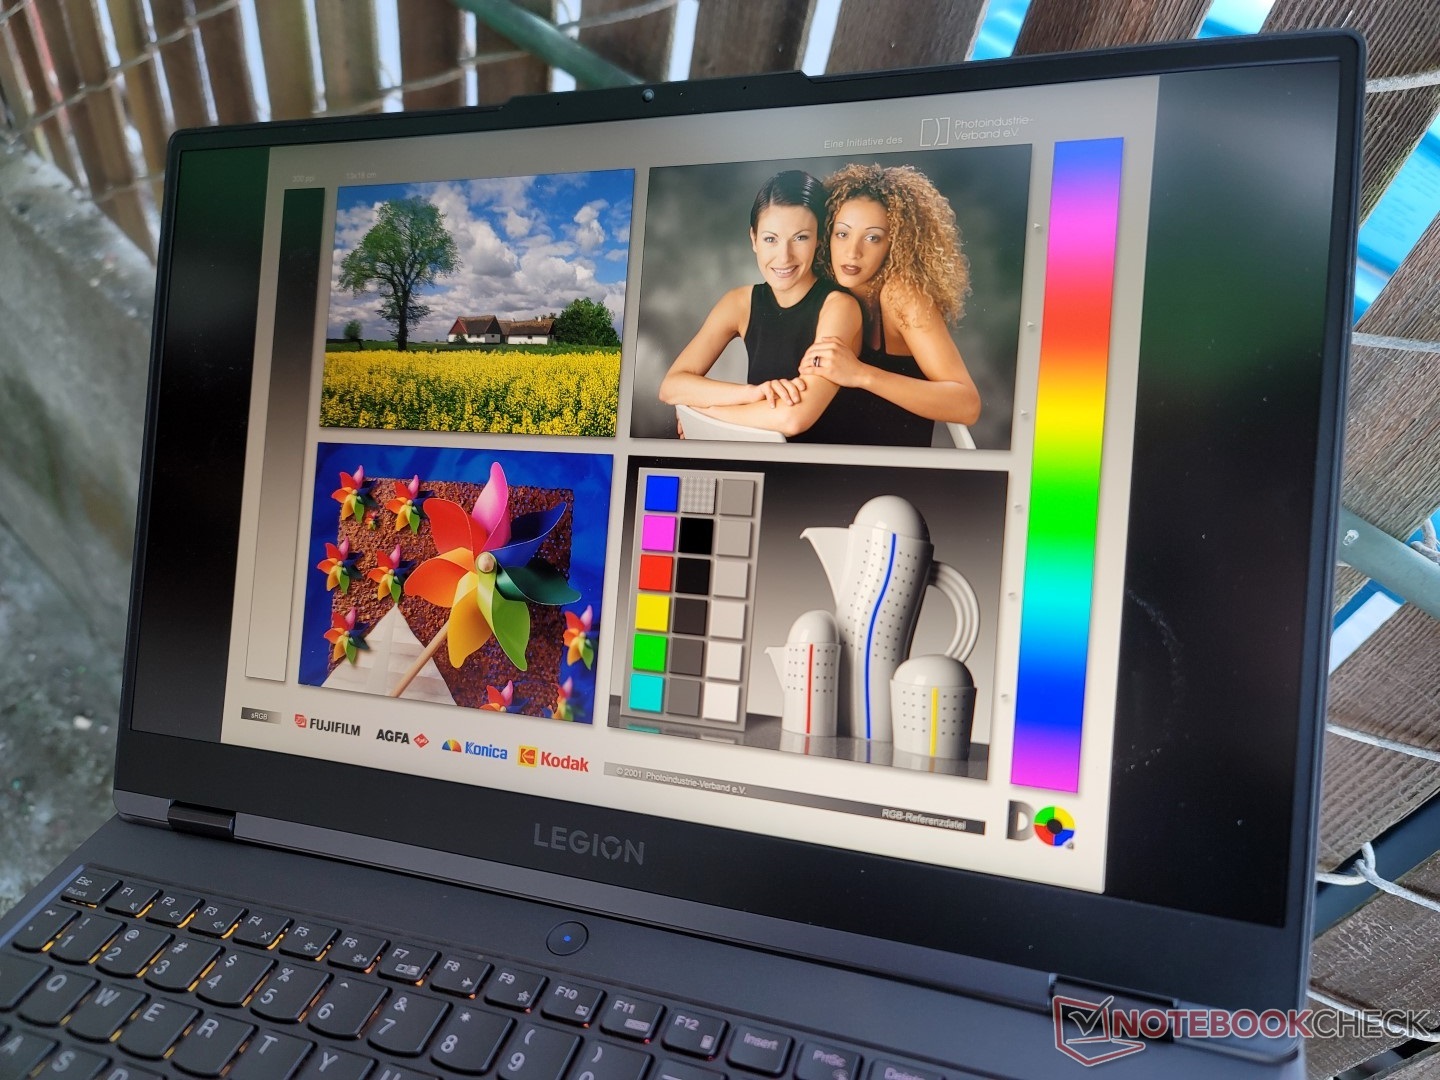
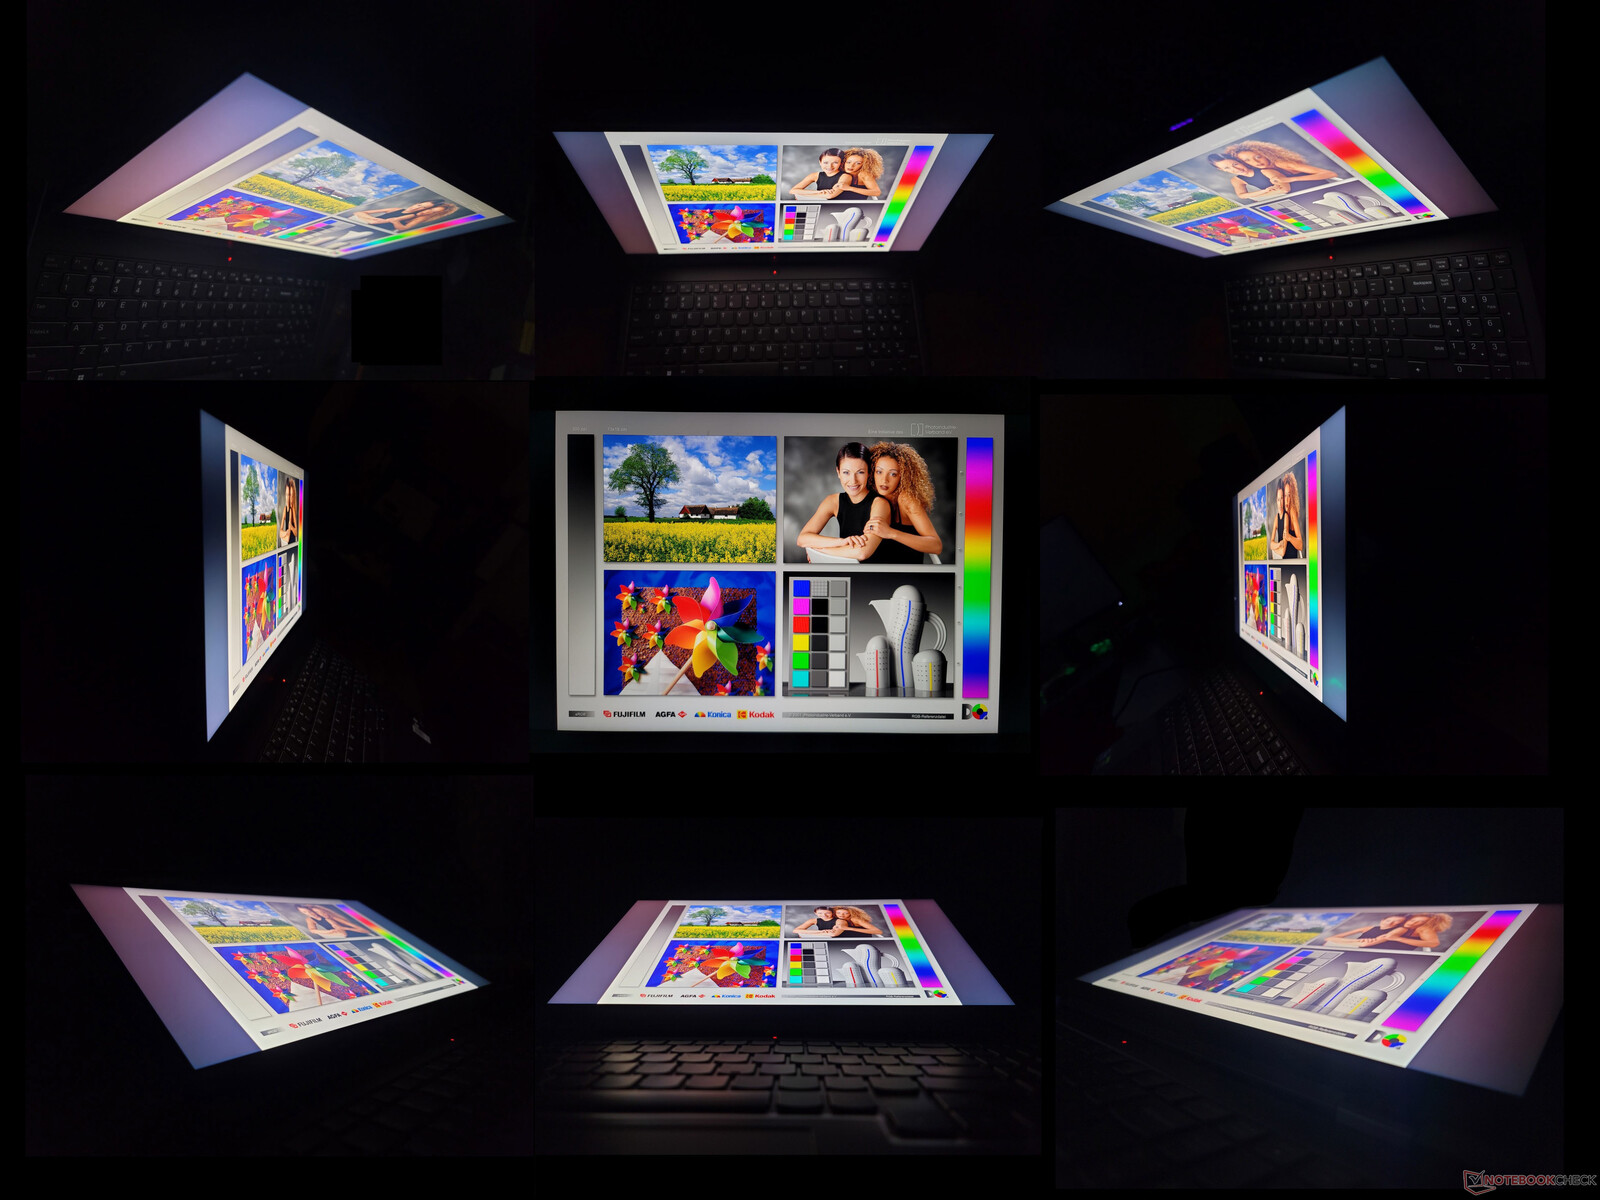
Skärm - 165 Hz, G-Sync, 100 % sRGB, IPS
Lenovo har bytt leverantör av IPS-paneler från AUO till CSOT jämfört med förra årets modell. Trots detta är de flesta egenskaperna nästan desamma för en liknande tittarupplevelse. Användarna får fortfarande G-Sync, 100 % sRGB-täckning, 165 Hz nativ uppdateringsfrekvens, snabba svarstider, ljus 350 nit bakgrundsbelysning och ett hyfsat kontrastförhållande på ~1000:1. Vissa SKU:er kan inkludera en billigare 1080p 144 Hz-panel som vi rekommenderar att du undviker på grund av dess smalare färgområde.


| |||||||||||||||||||||||||
Distribution av ljusstyrkan: 89 %
Mitt på batteriet: 363.5 cd/m²
Kontrast: 932:1 (Svärta: 0.39 cd/m²)
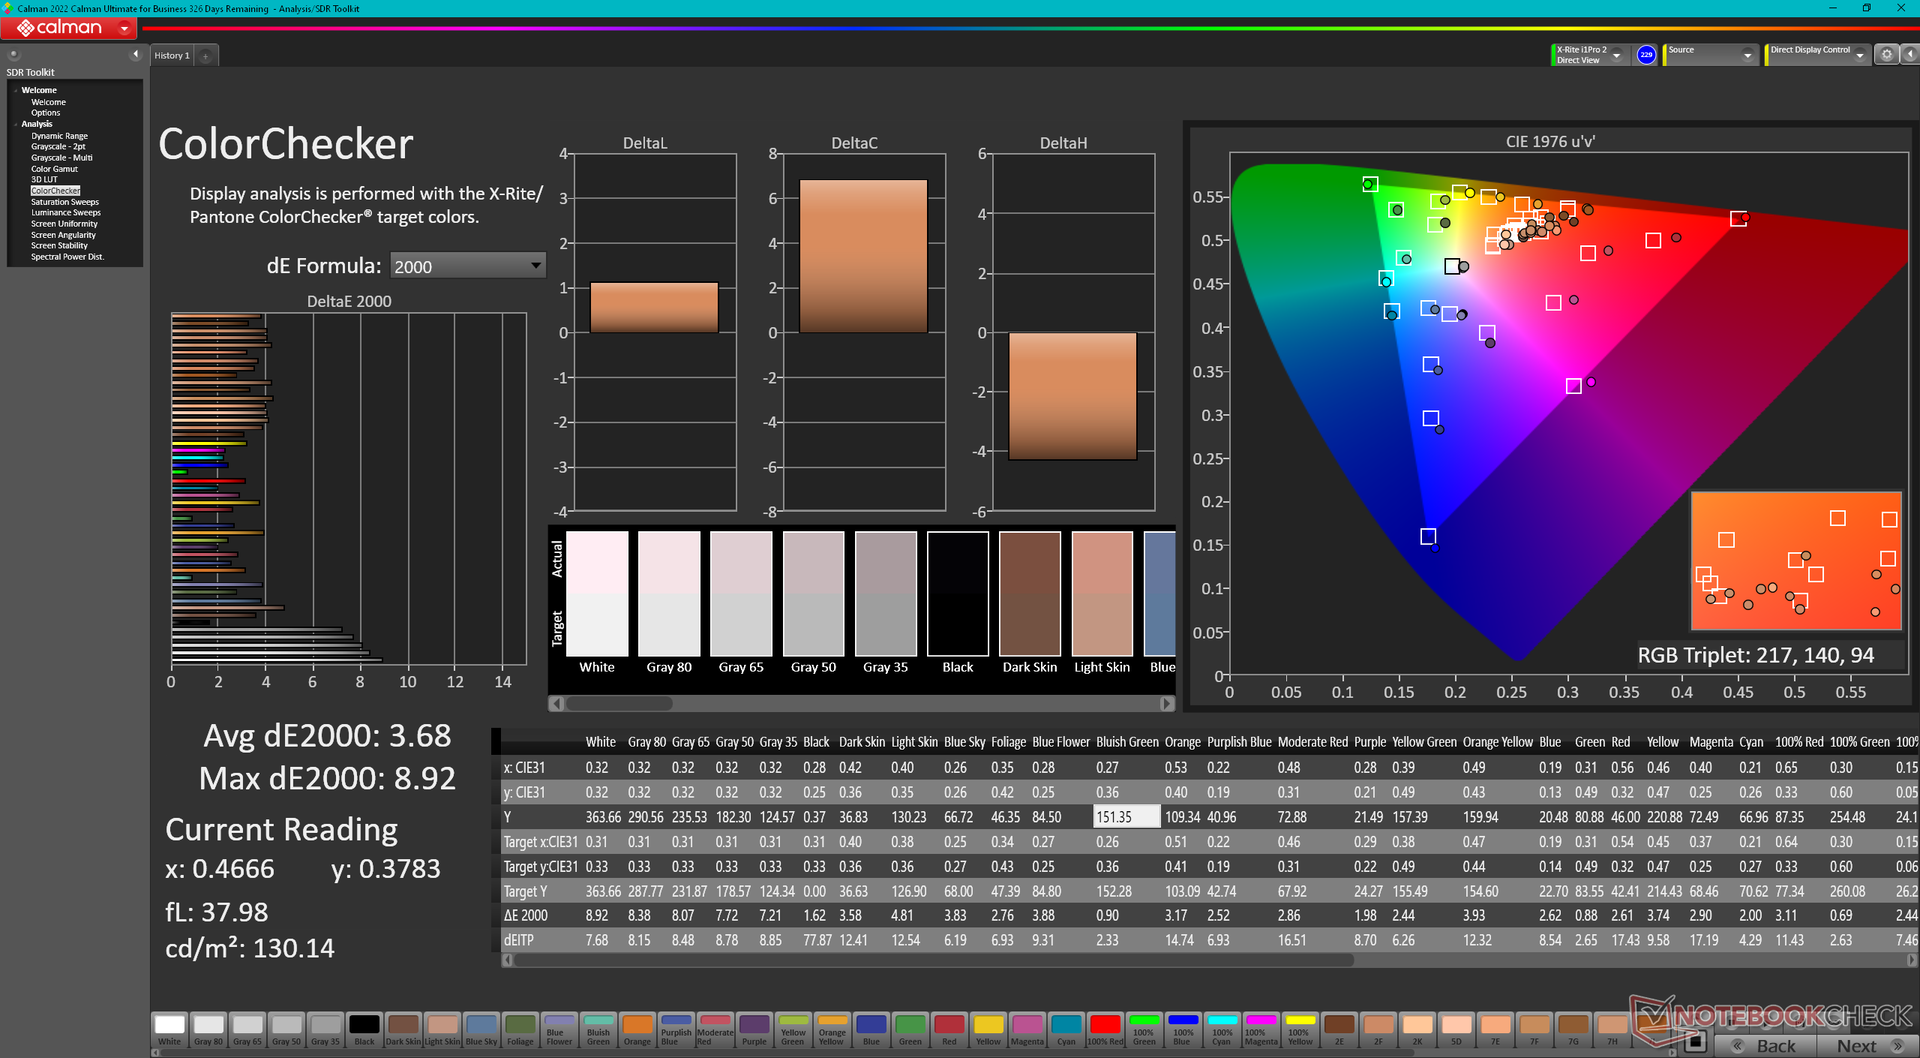
ΔE ColorChecker Calman: 3.68 | ∀{0.5-29.43 Ø4.72}
calibrated: 0.53
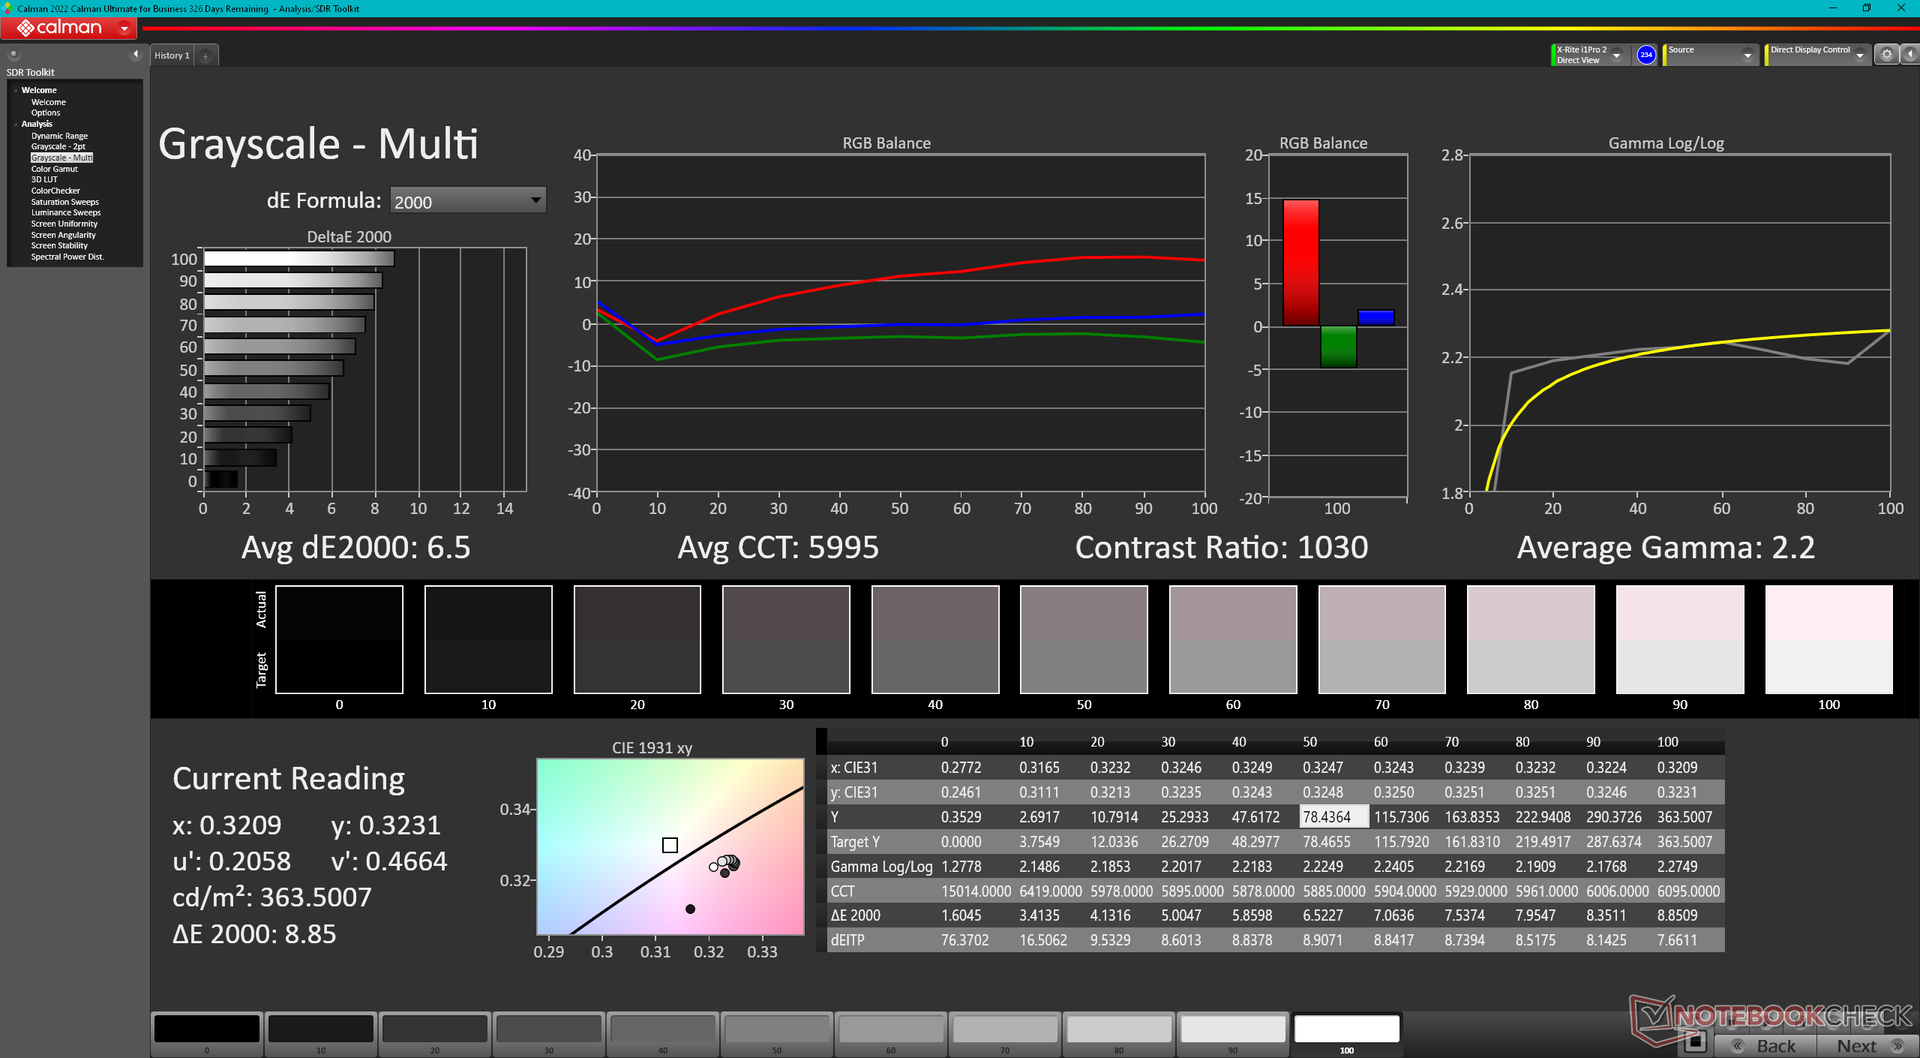
ΔE Greyscale Calman: 6.5 | ∀{0.09-98 Ø4.97}
70% AdobeRGB 1998 (Argyll 3D)
99.5% sRGB (Argyll 3D)
69.1% Display P3 (Argyll 3D)
Gamma: 2.2
CCT: 5995 K
| Lenovo Legion 5 15IAH7H 82RB CSOT MNF601CA1-3, IPS, 1920x1080, 15.6" | Lenovo Legion 5 15ACH-82JU00C6GE-FL B156HAN12.H, , 1920x1080, 15.6" | MSI Bravo 15 B5DD-010US Chi Mei N156HRA-EA1, IPS, 1920x1080, 15.6" | Asus TUF Gaming F15 FX507ZM TL156VDXP0101, IPS, 1920x1080, 15.6" | Acer Aspire Nitro 5 AN515-55-57GF Chi Mei CMN N156HRA-EA1, IPS, 1920x1080, 15.6" | Razer Blade 15 Base Edition 2021, i7-10750H RTX 3060 BOE NV156FHM-N4K, IPS, 1920x1080, 15.6" | |
|---|---|---|---|---|---|---|
| Display | -4% | -38% | -3% | -37% | -7% | |
| Display P3 Coverage (%) | 69.1 | 65.4 -5% | 42.1 -39% | 66.4 -4% | 42.54 -38% | 64.3 -7% |
| sRGB Coverage (%) | 99.5 | 96.3 -3% | 62.8 -37% | 97 -3% | 63.5 -36% | 91.8 -8% |
| AdobeRGB 1998 Coverage (%) | 70 | 67.5 -4% | 43.6 -38% | 68.5 -2% | 44.02 -37% | 65.5 -6% |
| Response Times | 16% | -82% | 28% | -111% | 29% | |
| Response Time Grey 50% / Grey 80% * (ms) | 14.8 ? | 13.6 ? 8% | 25.6 ? -73% | 5.6 ? 62% | 33.8 ? -128% | 8.8 ? 41% |
| Response Time Black / White * (ms) | 12 ? | 9.2 ? 23% | 22.8 ? -90% | 12.8 ? -7% | 23.2 ? -93% | 10 ? 17% |
| PWM Frequency (Hz) | 1000 ? | |||||
| Screen | -15% | -87% | 23% | -53% | -40% | |
| Brightness middle (cd/m²) | 363.5 | 350 -4% | 265.1 -27% | 353.7 -3% | 288 -21% | 317.2 -13% |
| Brightness (cd/m²) | 350 | 350 0% | 245 -30% | 340 -3% | 262 -25% | 306 -13% |
| Brightness Distribution (%) | 89 | 96 8% | 87 -2% | 89 0% | 88 -1% | 89 0% |
| Black Level * (cd/m²) | 0.39 | 0.3 23% | 0.35 10% | 0.34 13% | 0.21 46% | 0.31 21% |
| Contrast (:1) | 932 | 1167 25% | 757 -19% | 1040 12% | 1371 47% | 1023 10% |
| Colorchecker dE 2000 * | 3.68 | 3.9 -6% | 4.68 -27% | 1.74 53% | 3.61 2% | 4.37 -19% |
| Colorchecker dE 2000 max. * | 8.92 | 8.2 8% | 19.96 -124% | 3.63 59% | 18.07 -103% | 6.62 26% |
| Colorchecker dE 2000 calibrated * | 0.53 | 1.6 -202% | 3.7 -598% | 0.5 6% | 3.12 -489% | 2.67 -404% |
| Greyscale dE 2000 * | 6.5 | 5.5 15% | 4.5 31% | 2.1 68% | 2.4 63% | 4.5 31% |
| Gamma | 2.2 100% | 2.15 102% | 2.22 99% | 2.3 96% | 2.216 99% | 2.4 92% |
| CCT | 5995 108% | 7414 88% | 6632 98% | 6257 104% | 6675 97% | 7418 88% |
| Color Space (Percent of AdobeRGB 1998) (%) | 44 | 59.2 | ||||
| Color Space (Percent of sRGB) (%) | 62 | 91.4 | ||||
| Totalt genomsnitt (program/inställningar) | -1% /
-8% | -69% /
-76% | 16% /
18% | -67% /
-58% | -6% /
-23% |
* ... mindre är bättre
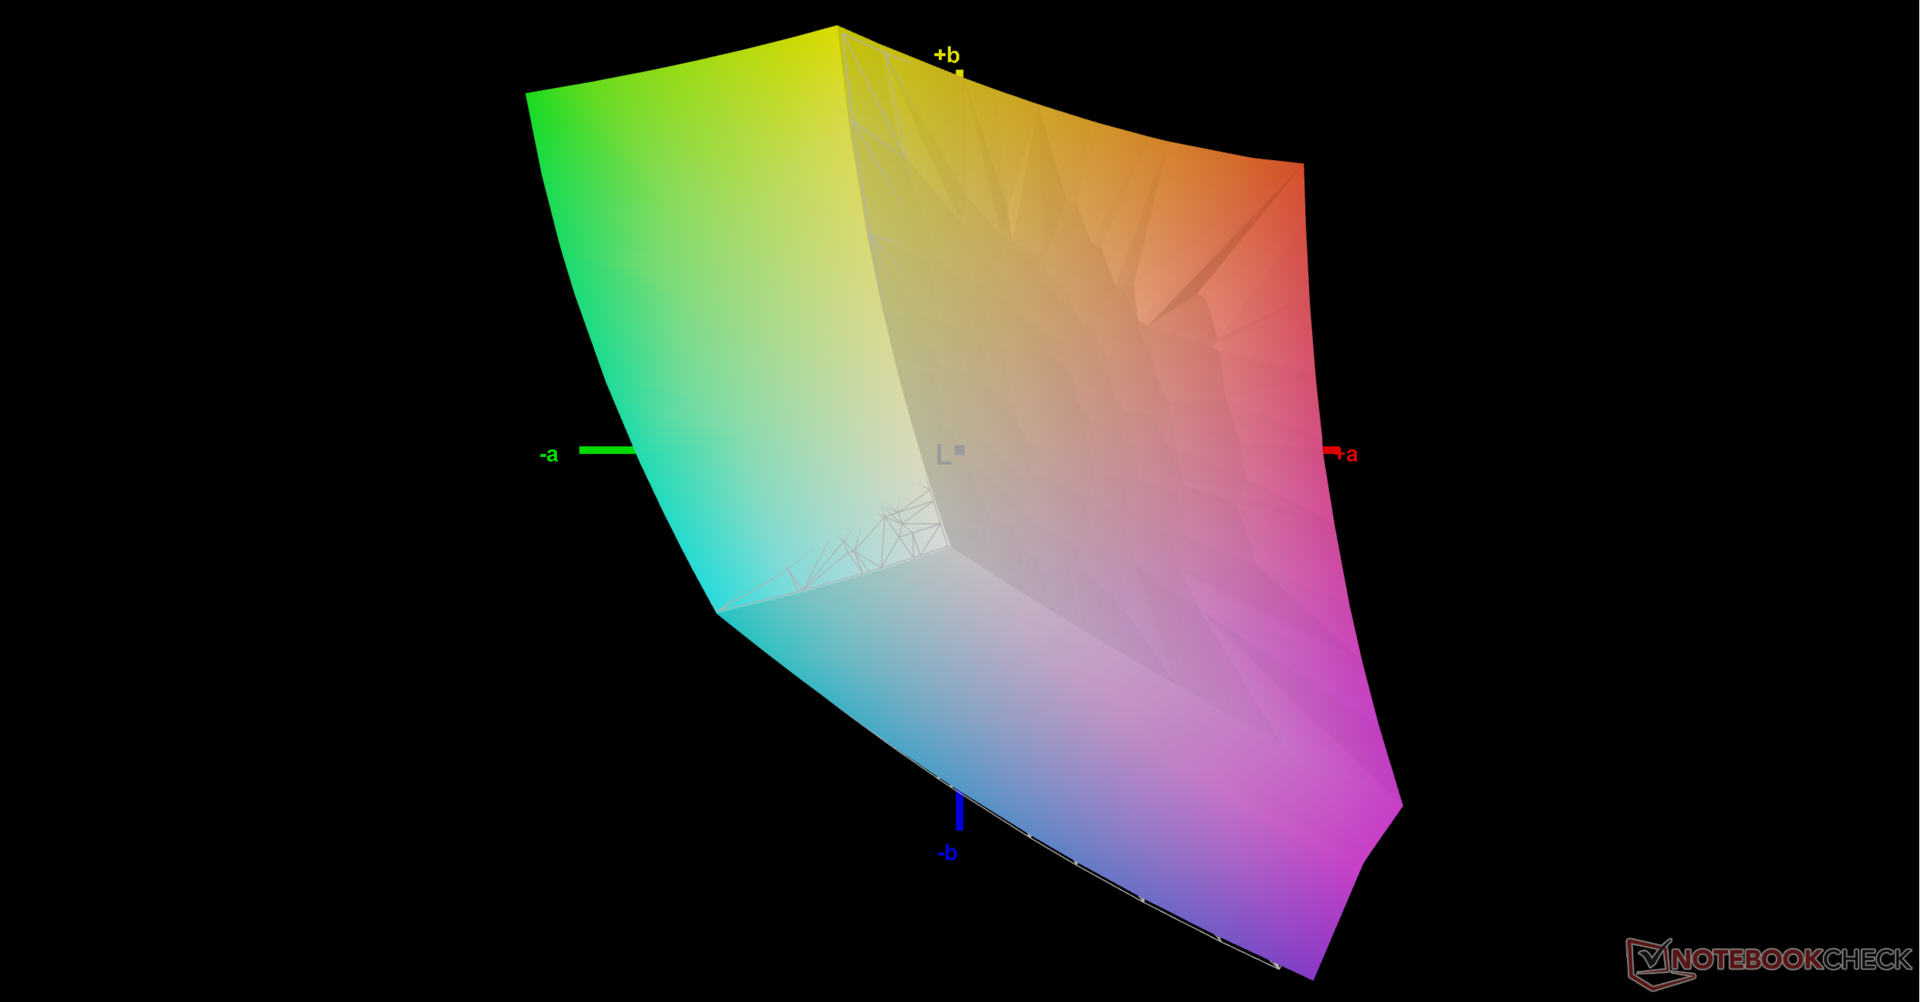
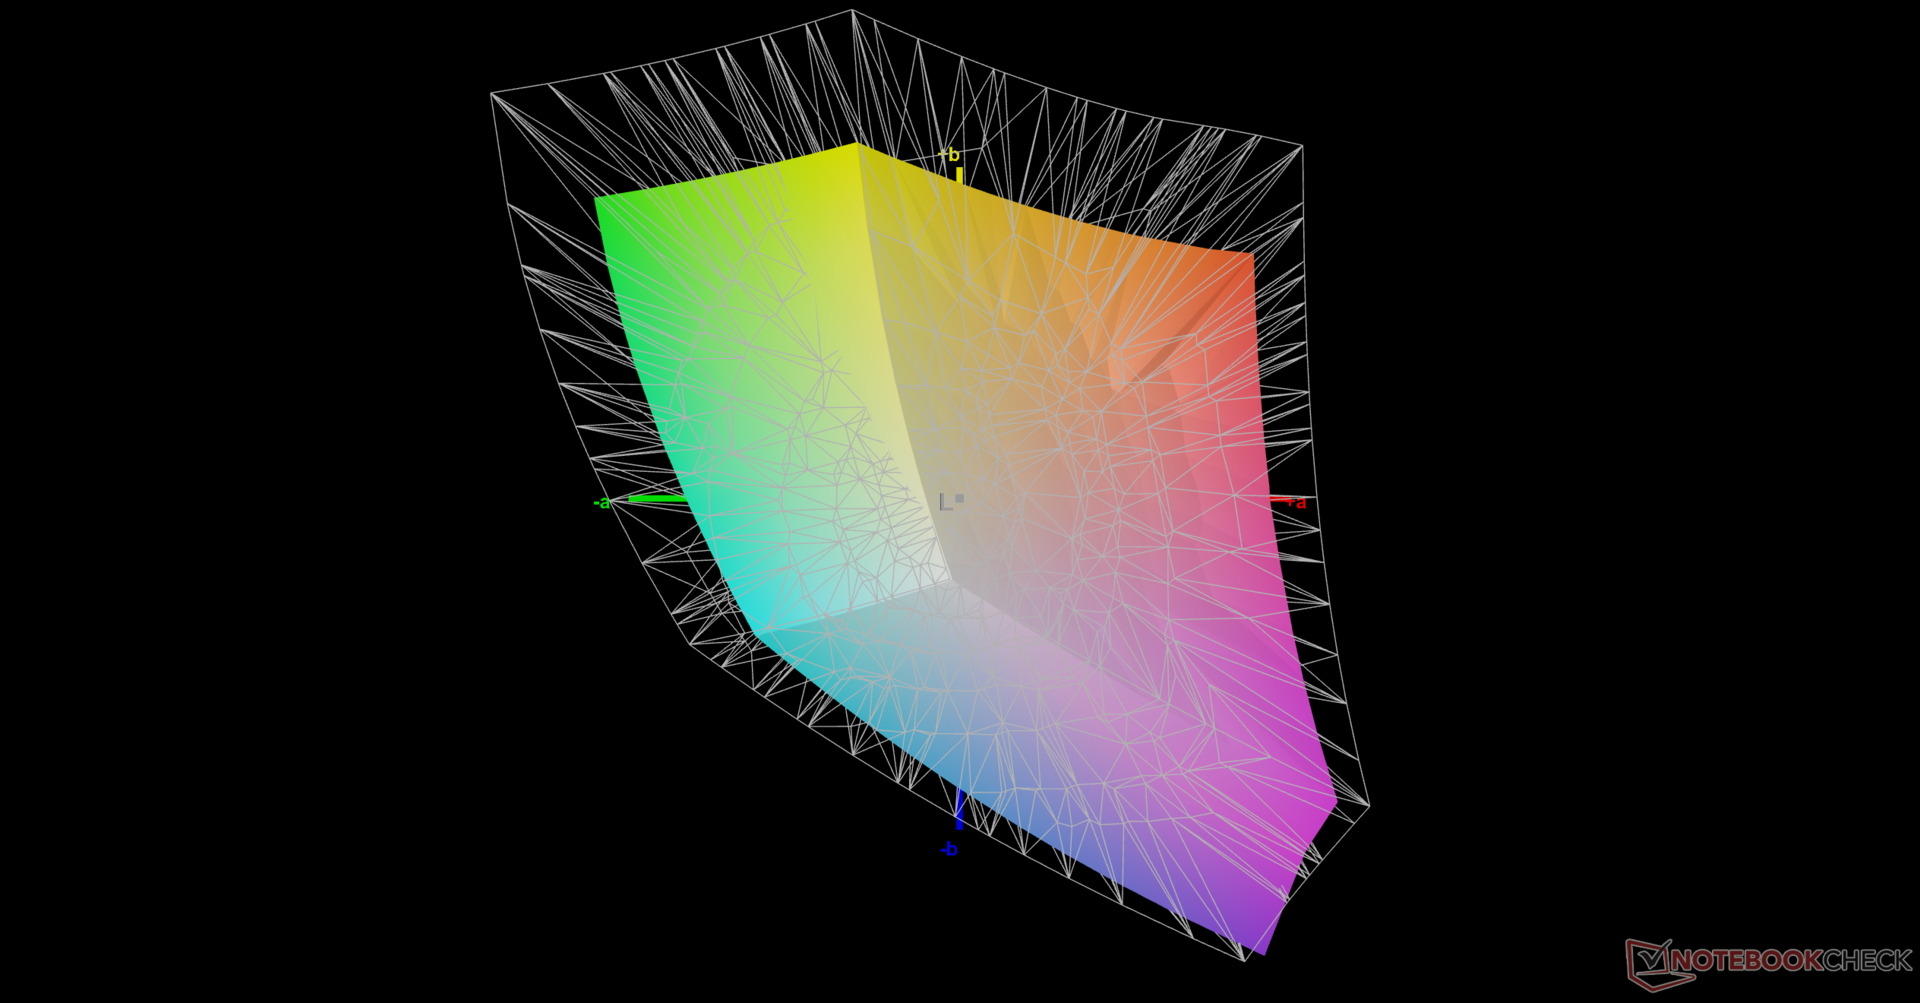
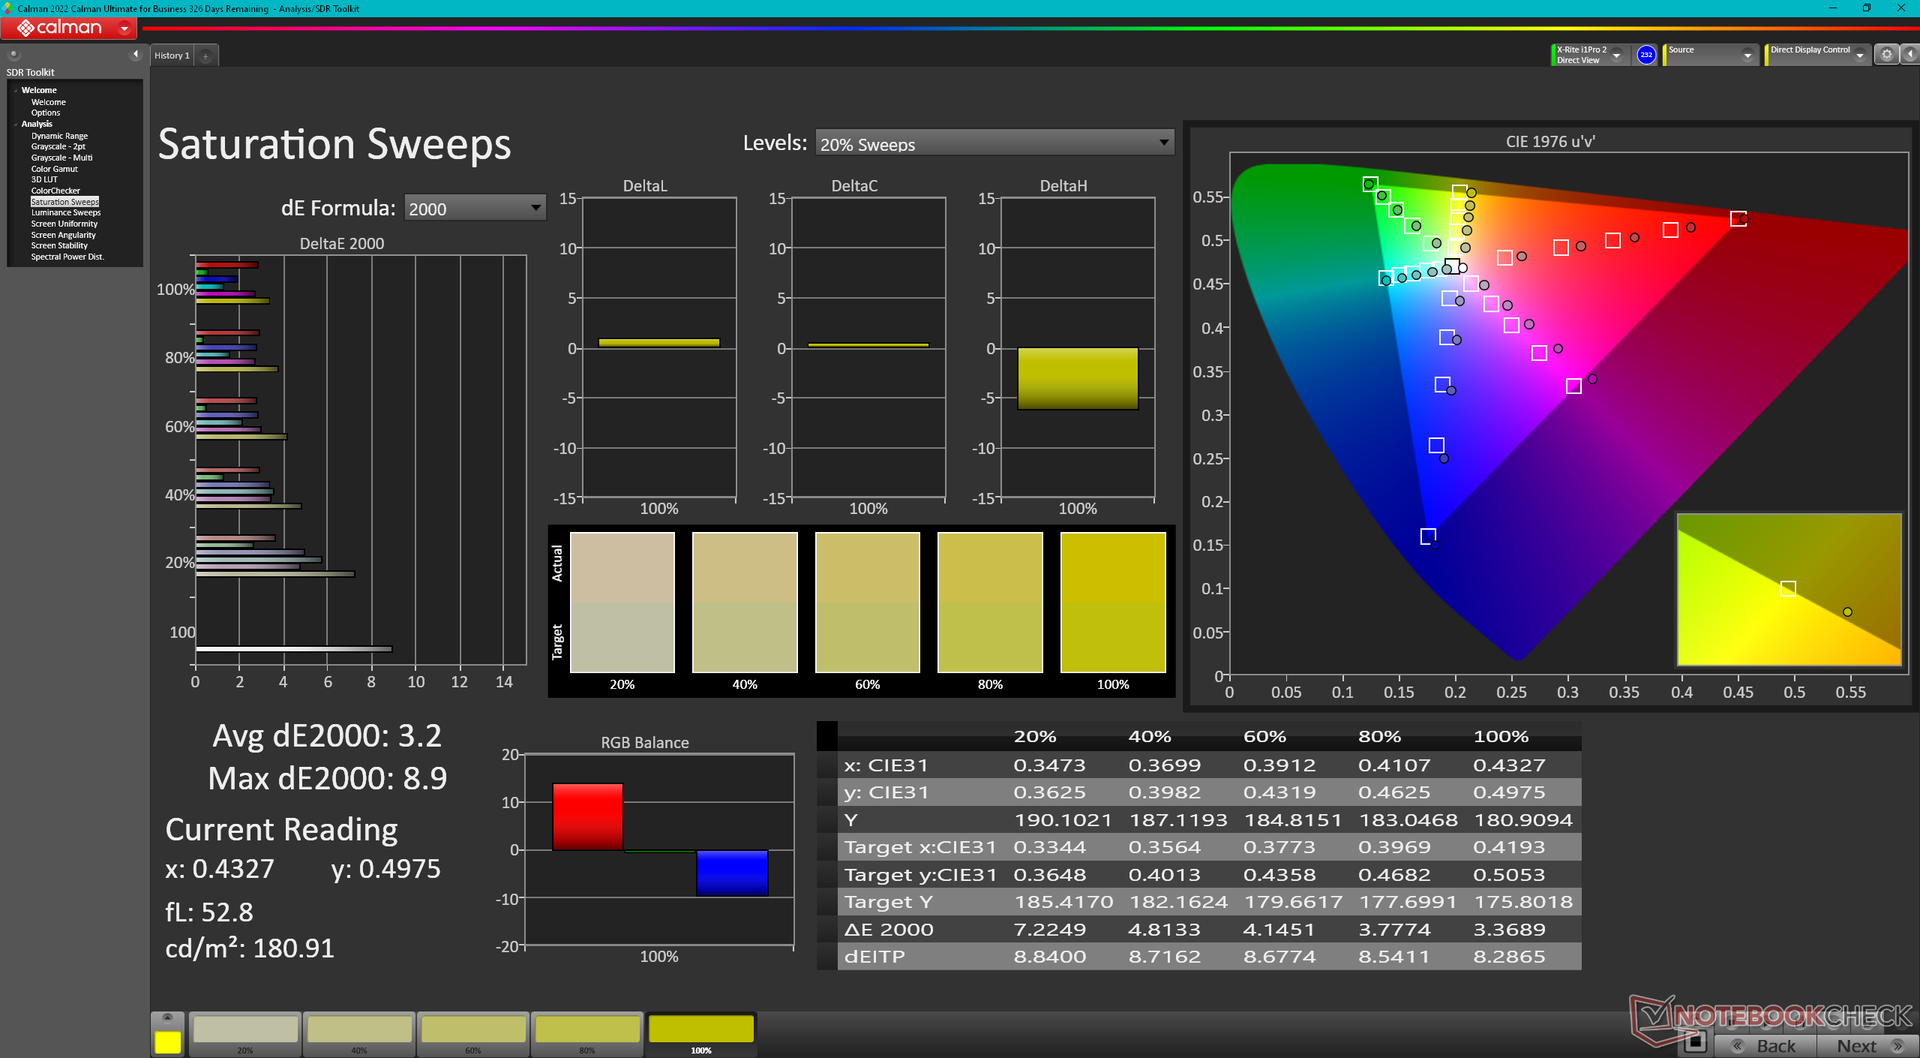
Skärmen är inte förkalibrerad, vilket visas av våra resultat från X-Rite-kolorimetern nedan, där de genomsnittliga värdena för gråskala och färg deltaE är så höga som 6,5 respektive 3,68. En korrekt kalibrering kan få ner dessa medelvärden till endast 0,9 respektive 0,53, eftersom panelen täcker hela sRGB. Vi rekommenderar att du tillämpar vår kalibrerade ICM-profil ovan för att bättre utnyttja panelens breda sRGB-färger.
Visa svarstider
| ↔ Svarstid svart till vitt | ||
|---|---|---|
| 12 ms ... stiga ↗ och falla ↘ kombinerat | ↗ 6.8 ms stiga | 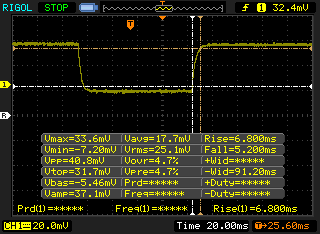 |
| ↘ 5.2 ms hösten | ||
| Skärmen visar bra svarsfrekvens i våra tester, men kan vara för långsam för konkurrenskraftiga spelare. I jämförelse sträcker sig alla testade enheter från 0.1 (minst) till 240 (maximalt) ms. » 32 % av alla enheter är bättre. Det betyder att den uppmätta svarstiden är bättre än genomsnittet av alla testade enheter (19.8 ms). | ||
| ↔ Svarstid 50 % grått till 80 % grått | ||
| 14.8 ms ... stiga ↗ och falla ↘ kombinerat | ↗ 8 ms stiga | 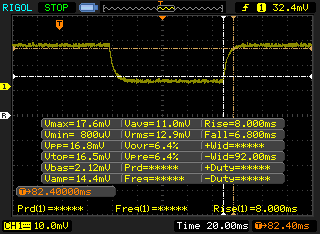 |
| ↘ 6.8 ms hösten | ||
| Skärmen visar bra svarsfrekvens i våra tester, men kan vara för långsam för konkurrenskraftiga spelare. I jämförelse sträcker sig alla testade enheter från 0.165 (minst) till 636 (maximalt) ms. » 29 % av alla enheter är bättre. Det betyder att den uppmätta svarstiden är bättre än genomsnittet av alla testade enheter (31 ms). | ||
Skärmflimmer / PWM (Puls-Width Modulation)
| Skärmflimmer / PWM upptäcktes inte | 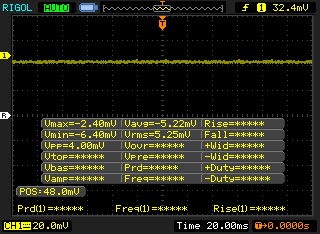 | ||
Som jämförelse: 52 % av alla testade enheter använder inte PWM för att dämpa skärmen. Om PWM upptäcktes mättes ett medelvärde av 7753 (minst: 5 - maximum: 343500) Hz. | |||
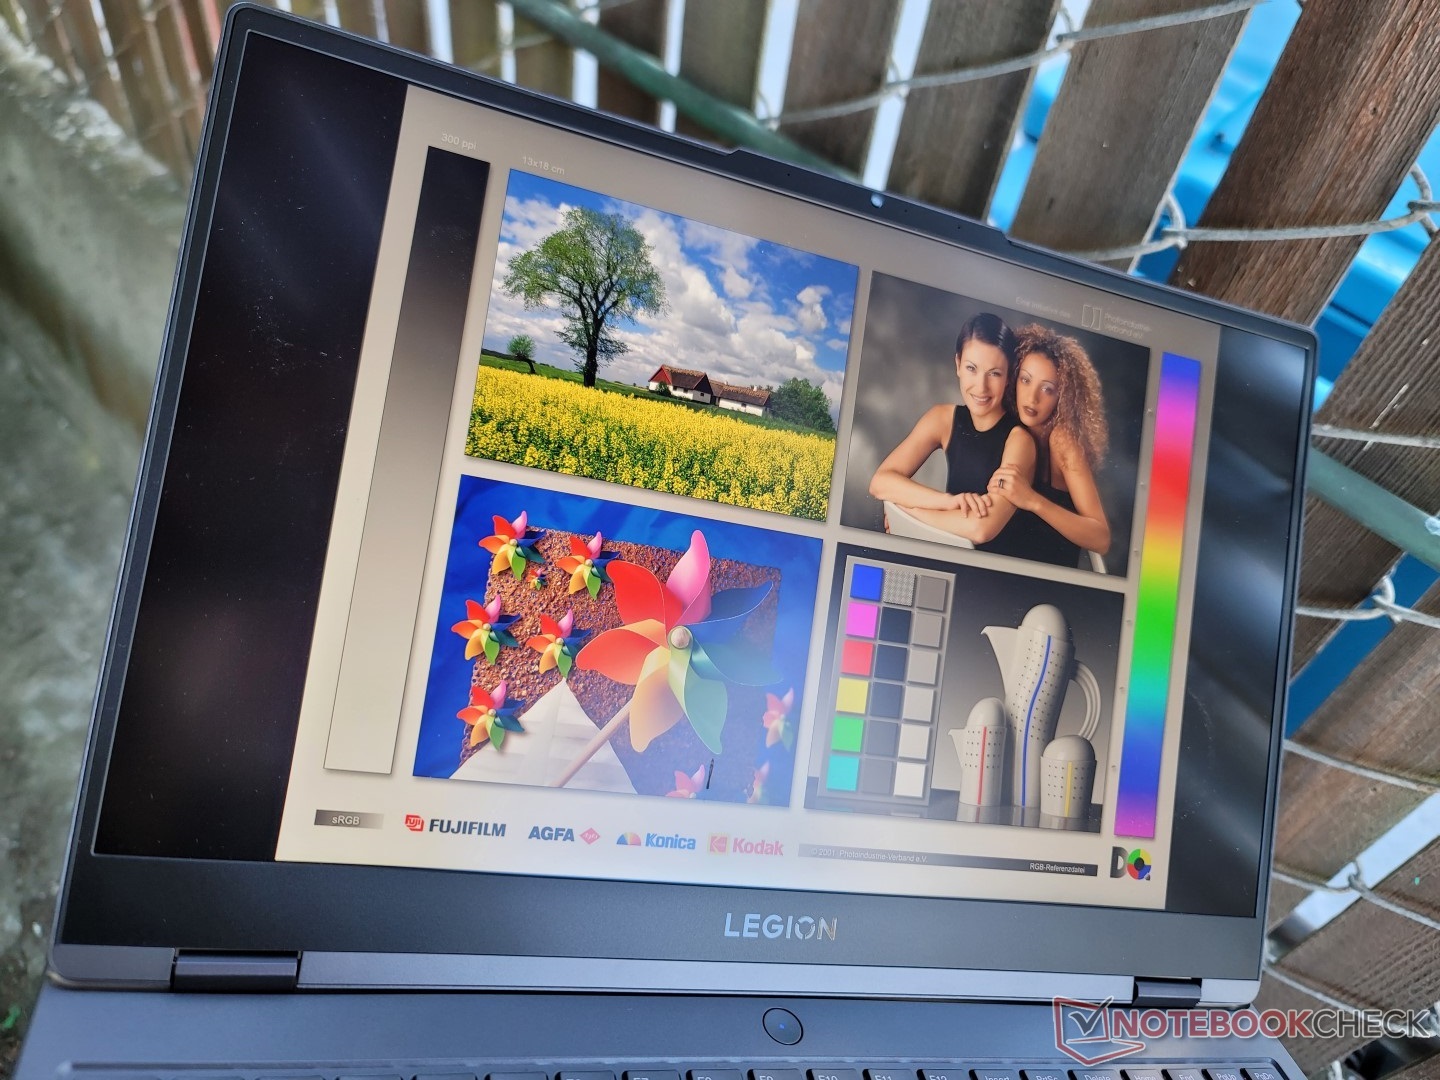
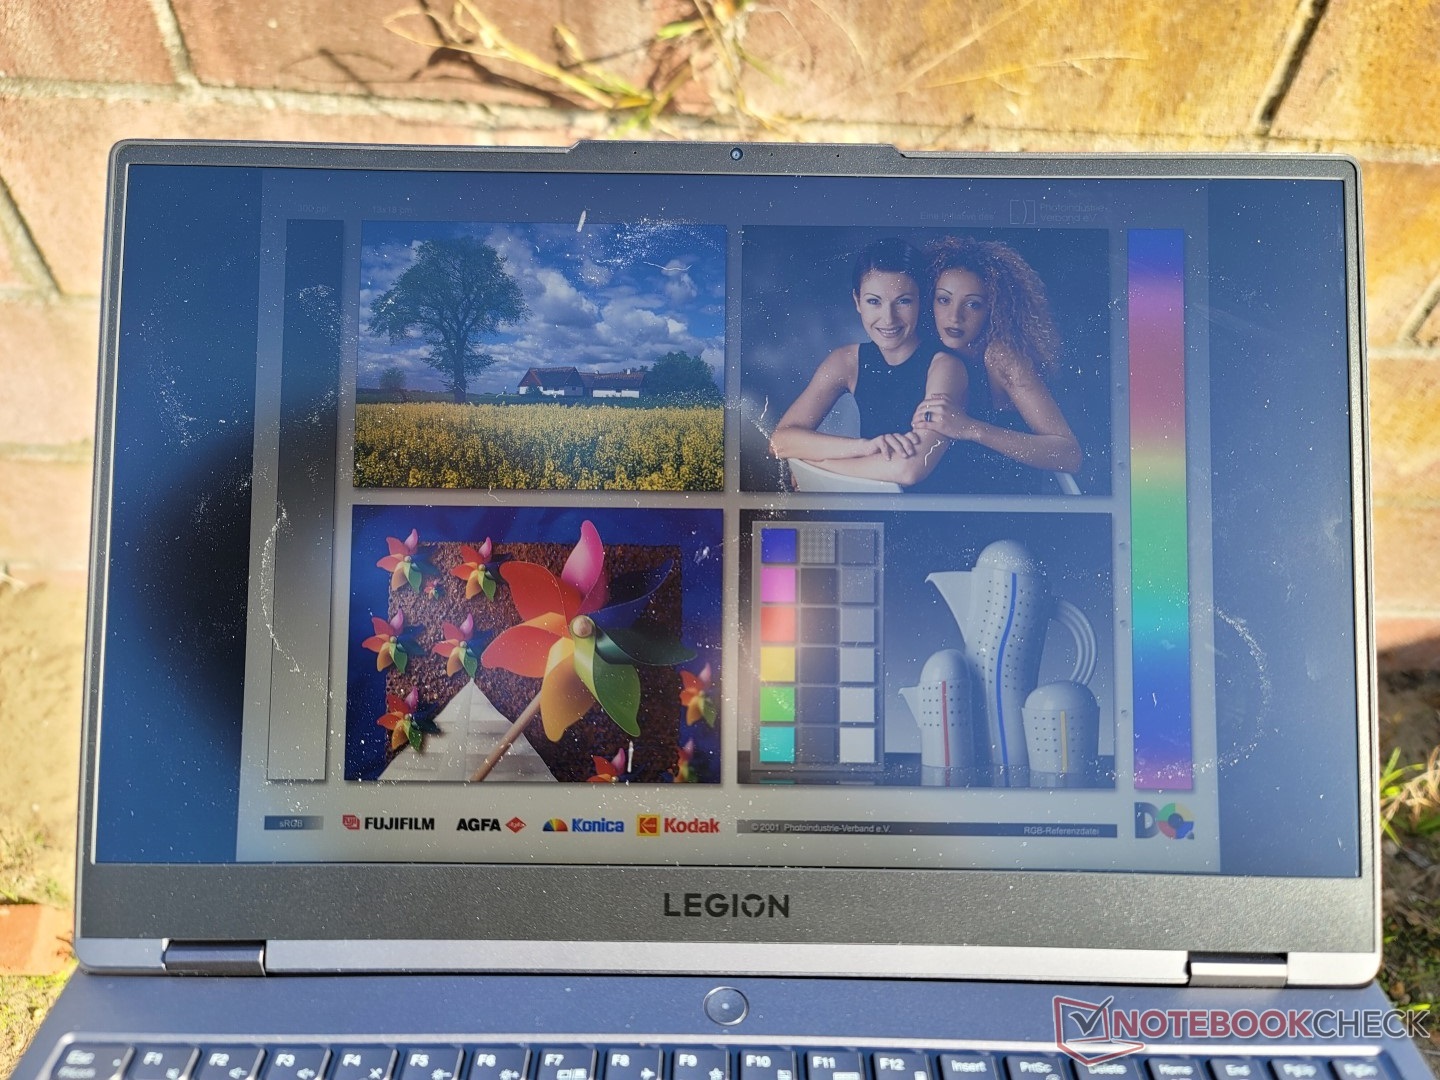
Med 350 nits är skärmen bara något ljusare än den genomsnittliga bärbara speldatorn där 300 nits är vanligt förekommande. Skärmen är bekväm att titta på utomhus i skugga och det matta överlägget hjälper till att minska bländning, men allt blir urtvättat om det är under ljusare förhållanden.
Prestanda - MUX-stöd
Provningsförhållanden
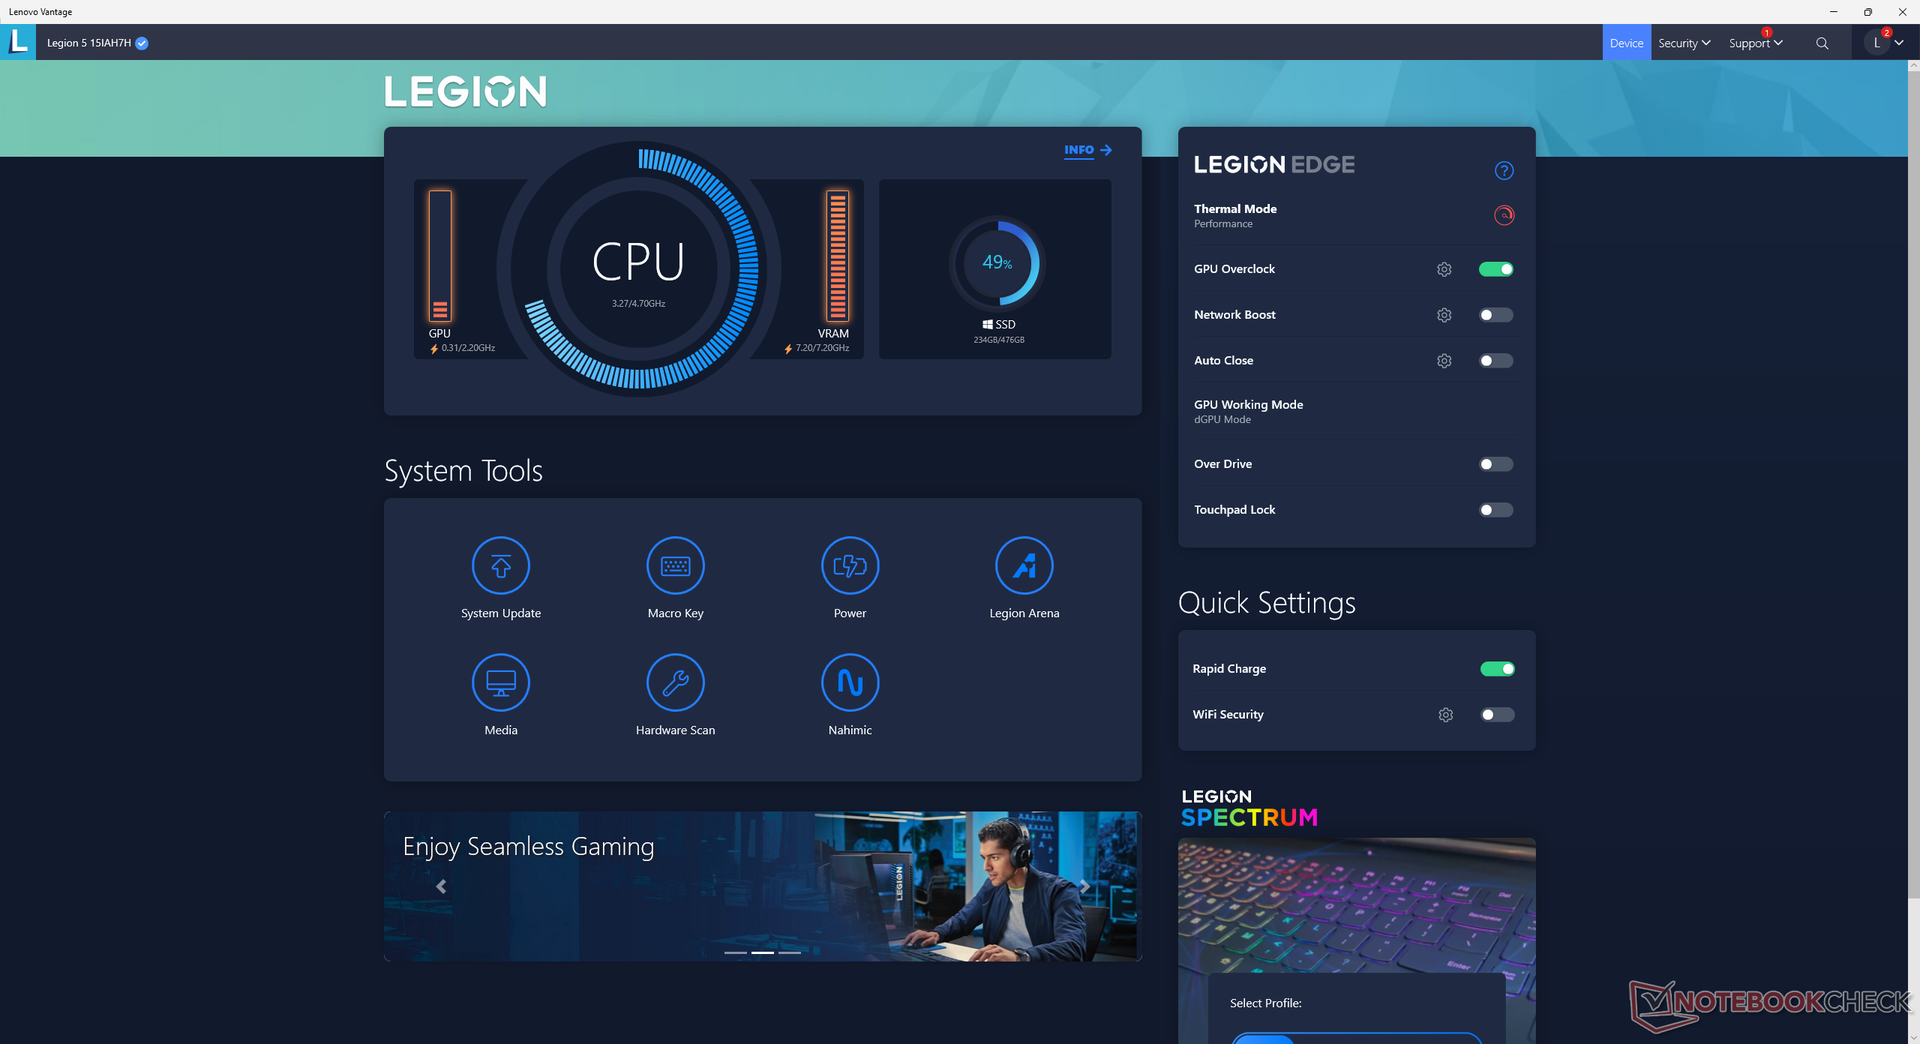
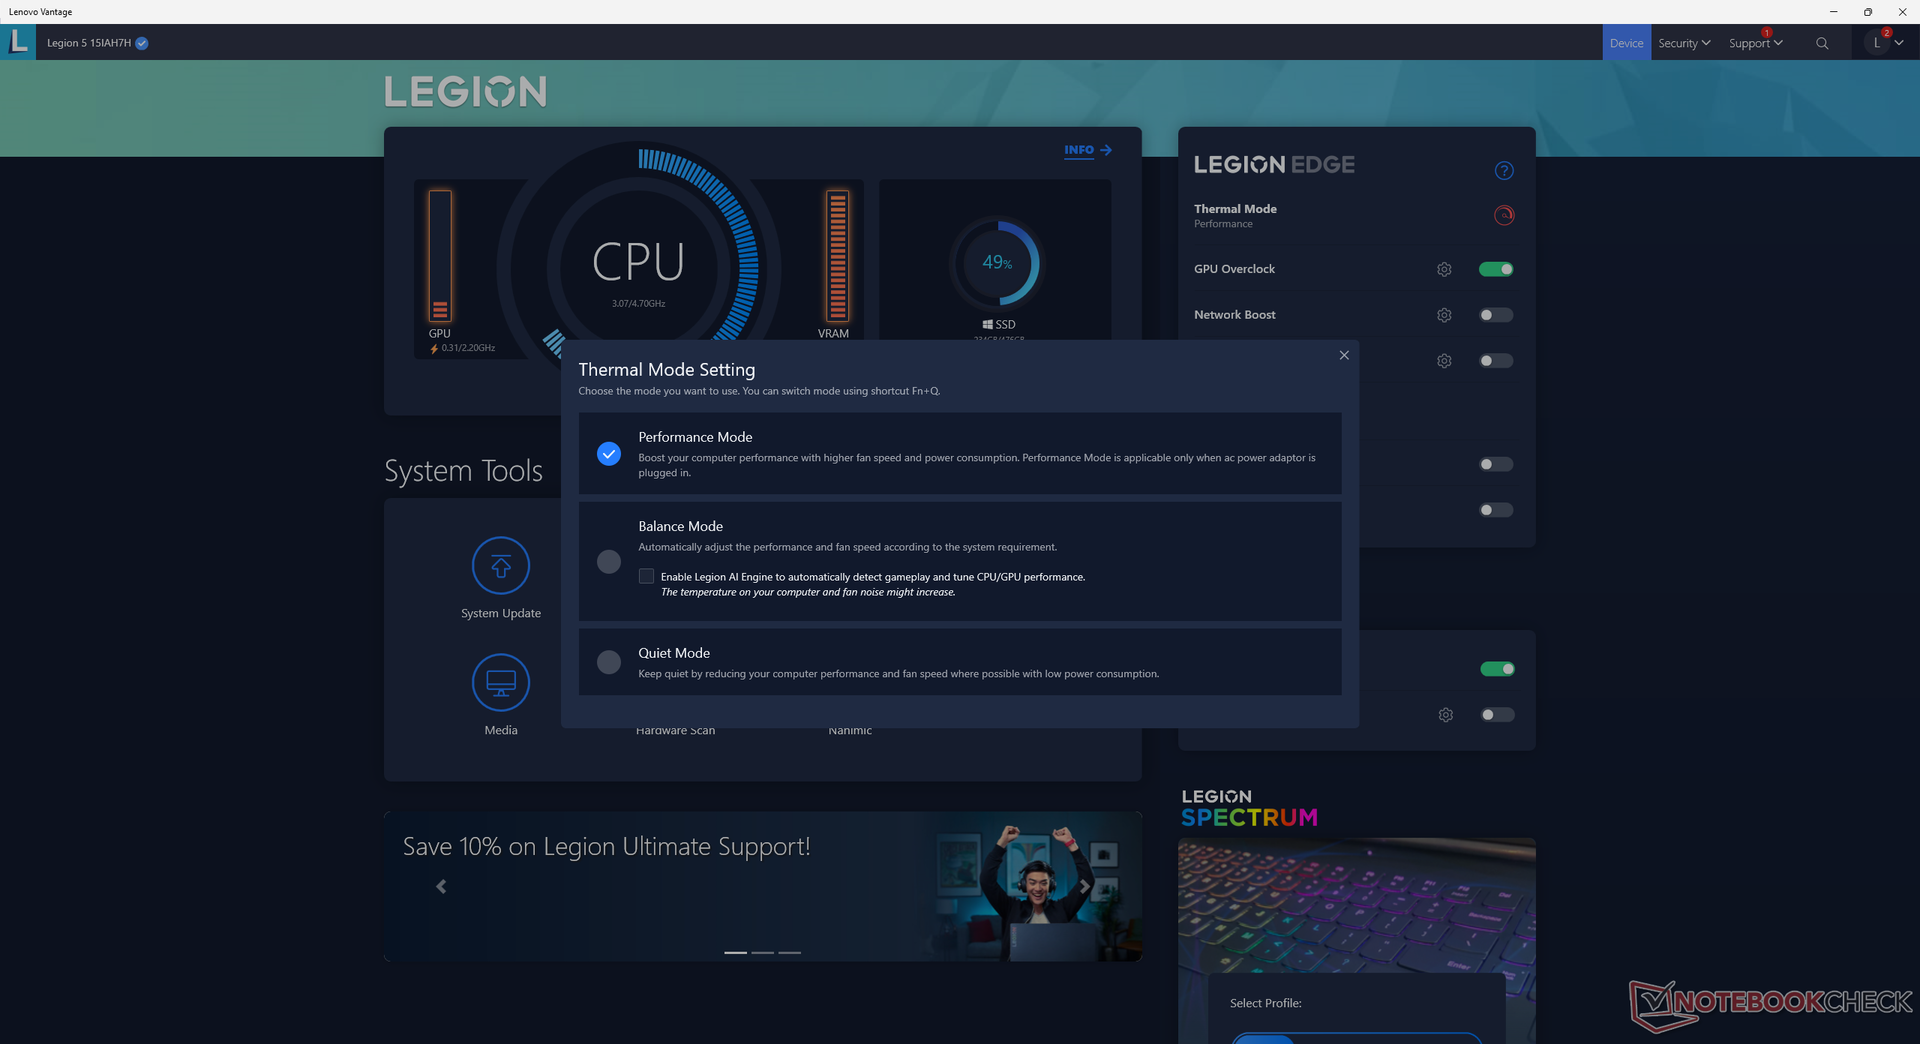
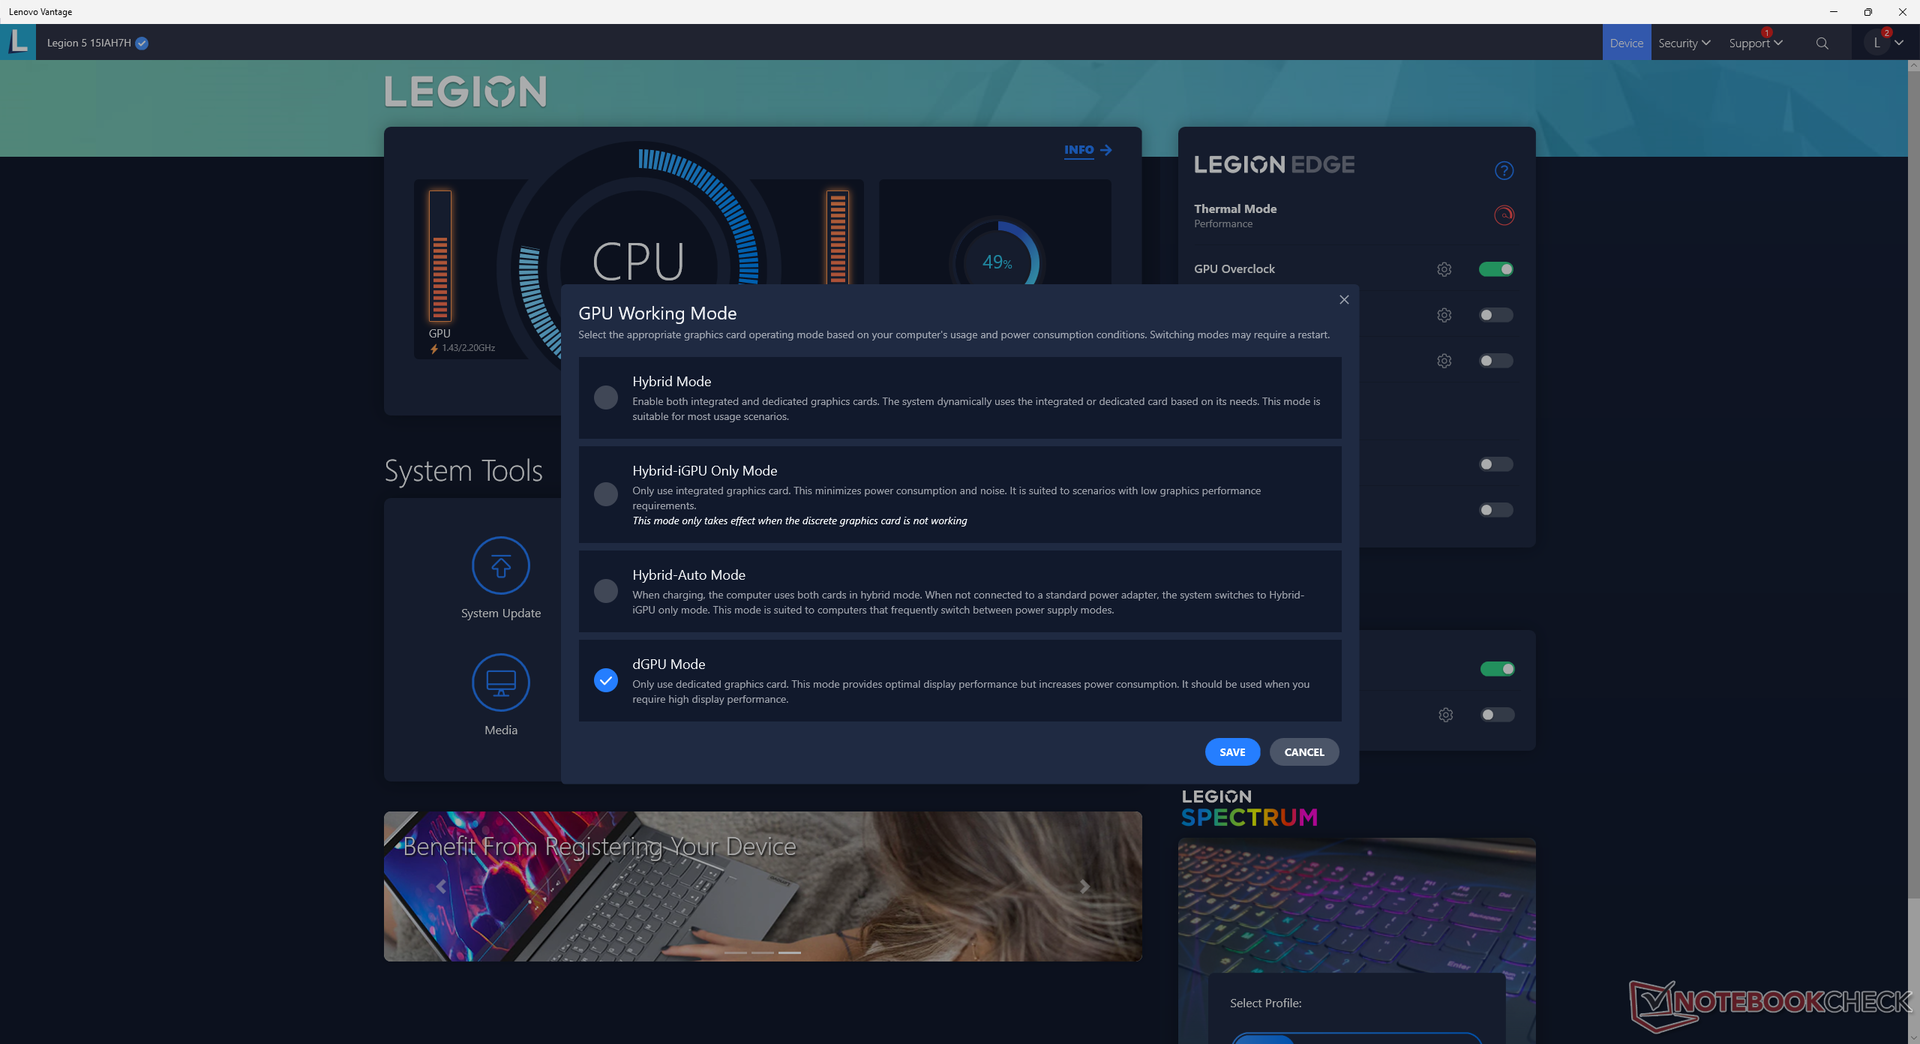
Vi ställde in vårt system till prestandaläge och GPU:n till diskret läge via Lenovo Vantage innan vi körde några av prestandanivåerna nedan. Det rekommenderas starkt att användare bekantar sig med den förinstallerade Vantage-programvaran eftersom den är navet för systemuppdateringar, MUX- eller hybridgrafiklägen, laddningsbeteende med mera, vilket framgår av skärmdumparna nedan.
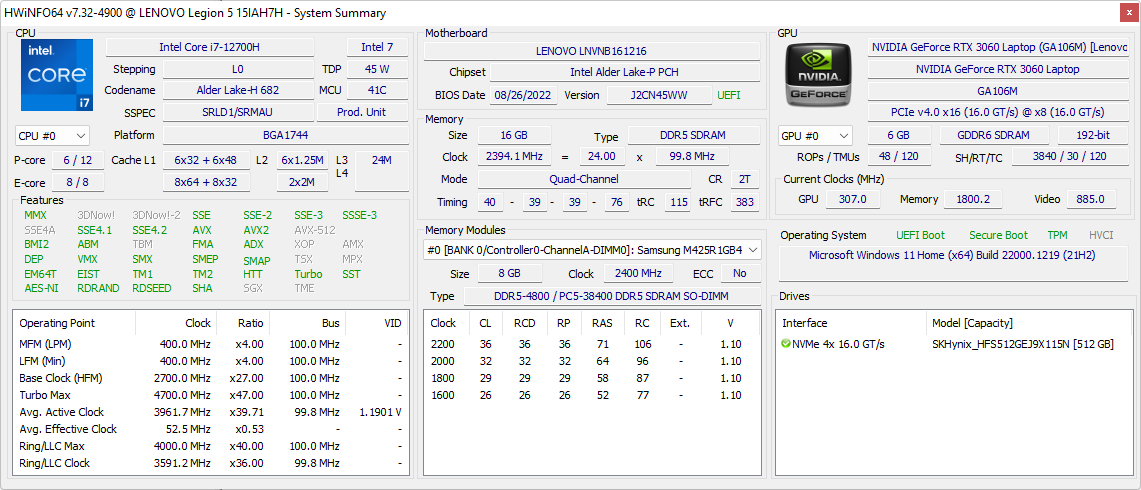
Processor
CPU-prestandan är snabbare än förväntat med resultat som är 15-25 procent snabbare än den genomsnittliga bärbara datorn i vår databas som är utrustad med samma Core i7-12700H processor. Faktum är att Legion 5 15 är en av de snabbaste modellerna du kan få med Core i7-12700H. Den råa prestandan överträffar den Core i7-12800H i den dyrare 2022 Razer Blade 15 med märkbara marginaler
Nedgradering till en mindre Core i5-12500H konfiguration medför en 5-procentig och 25-procentig nedgång i prestanda för enkel- och flerstegsbehandlingar respektive.
Cinebench R15 Multi Loop
Cinebench R23: Multi Core | Single Core
Cinebench R15: CPU Multi 64Bit | CPU Single 64Bit
Blender: v2.79 BMW27 CPU
7-Zip 18.03: 7z b 4 | 7z b 4 -mmt1
Geekbench 5.5: Multi-Core | Single-Core
HWBOT x265 Benchmark v2.2: 4k Preset
LibreOffice : 20 Documents To PDF
R Benchmark 2.5: Overall mean
* ... mindre är bättre
AIDA64: FP32 Ray-Trace | FPU Julia | CPU SHA3 | CPU Queen | FPU SinJulia | FPU Mandel | CPU AES | CPU ZLib | FP64 Ray-Trace | CPU PhotoWorxx
| Performance rating | |
| Lenovo Legion 5 15IAH7H 82RB | |
| Lenovo Legion 5 15ACH-82JU00C6GE-FL | |
| Genomsnitt Intel Core i7-12700H | |
| Asus TUF Gaming F15 FX507ZM | |
| MSI Bravo 15 B5DD-010US | |
| Acer Aspire Nitro 5 AN515-55-57GF | |
| AIDA64 / FP32 Ray-Trace | |
| Lenovo Legion 5 15IAH7H 82RB | |
| Lenovo Legion 5 15ACH-82JU00C6GE-FL | |
| Genomsnitt Intel Core i7-12700H (2585 - 17957, n=64) | |
| MSI Bravo 15 B5DD-010US | |
| Asus TUF Gaming F15 FX507ZM | |
| Acer Aspire Nitro 5 AN515-55-57GF | |
| AIDA64 / FPU Julia | |
| Lenovo Legion 5 15ACH-82JU00C6GE-FL | |
| Lenovo Legion 5 15IAH7H 82RB | |
| MSI Bravo 15 B5DD-010US | |
| Genomsnitt Intel Core i7-12700H (12439 - 90760, n=64) | |
| Asus TUF Gaming F15 FX507ZM | |
| Acer Aspire Nitro 5 AN515-55-57GF | |
| AIDA64 / CPU SHA3 | |
| Lenovo Legion 5 15IAH7H 82RB | |
| Asus TUF Gaming F15 FX507ZM | |
| Lenovo Legion 5 15ACH-82JU00C6GE-FL | |
| Genomsnitt Intel Core i7-12700H (833 - 4242, n=64) | |
| MSI Bravo 15 B5DD-010US | |
| Acer Aspire Nitro 5 AN515-55-57GF | |
| AIDA64 / CPU Queen | |
| Lenovo Legion 5 15IAH7H 82RB | |
| Asus TUF Gaming F15 FX507ZM | |
| Genomsnitt Intel Core i7-12700H (57923 - 103202, n=63) | |
| Lenovo Legion 5 15ACH-82JU00C6GE-FL | |
| MSI Bravo 15 B5DD-010US | |
| Acer Aspire Nitro 5 AN515-55-57GF | |
| AIDA64 / FPU SinJulia | |
| Lenovo Legion 5 15ACH-82JU00C6GE-FL | |
| Lenovo Legion 5 15IAH7H 82RB | |
| Asus TUF Gaming F15 FX507ZM | |
| MSI Bravo 15 B5DD-010US | |
| Genomsnitt Intel Core i7-12700H (3249 - 9939, n=64) | |
| Acer Aspire Nitro 5 AN515-55-57GF | |
| AIDA64 / FPU Mandel | |
| Lenovo Legion 5 15ACH-82JU00C6GE-FL | |
| Lenovo Legion 5 15IAH7H 82RB | |
| MSI Bravo 15 B5DD-010US | |
| Genomsnitt Intel Core i7-12700H (7135 - 44760, n=64) | |
| Asus TUF Gaming F15 FX507ZM | |
| Acer Aspire Nitro 5 AN515-55-57GF | |
| AIDA64 / CPU AES | |
| Lenovo Legion 5 15IAH7H 82RB | |
| Lenovo Legion 5 15ACH-82JU00C6GE-FL | |
| MSI Bravo 15 B5DD-010US | |
| Genomsnitt Intel Core i7-12700H (31839 - 144360, n=64) | |
| Asus TUF Gaming F15 FX507ZM | |
| Acer Aspire Nitro 5 AN515-55-57GF | |
| AIDA64 / CPU ZLib | |
| Asus TUF Gaming F15 FX507ZM | |
| Lenovo Legion 5 15IAH7H 82RB | |
| Genomsnitt Intel Core i7-12700H (305 - 1171, n=64) | |
| Lenovo Legion 5 15ACH-82JU00C6GE-FL | |
| MSI Bravo 15 B5DD-010US | |
| Acer Aspire Nitro 5 AN515-55-57GF | |
| AIDA64 / FP64 Ray-Trace | |
| Lenovo Legion 5 15IAH7H 82RB | |
| Lenovo Legion 5 15ACH-82JU00C6GE-FL | |
| Genomsnitt Intel Core i7-12700H (1437 - 9692, n=64) | |
| MSI Bravo 15 B5DD-010US | |
| Asus TUF Gaming F15 FX507ZM | |
| Acer Aspire Nitro 5 AN515-55-57GF | |
| AIDA64 / CPU PhotoWorxx | |
| Lenovo Legion 5 15IAH7H 82RB | |
| Asus TUF Gaming F15 FX507ZM | |
| Genomsnitt Intel Core i7-12700H (12863 - 52207, n=64) | |
| Acer Aspire Nitro 5 AN515-55-57GF | |
| MSI Bravo 15 B5DD-010US | |
| Lenovo Legion 5 15ACH-82JU00C6GE-FL | |
Systemets prestanda
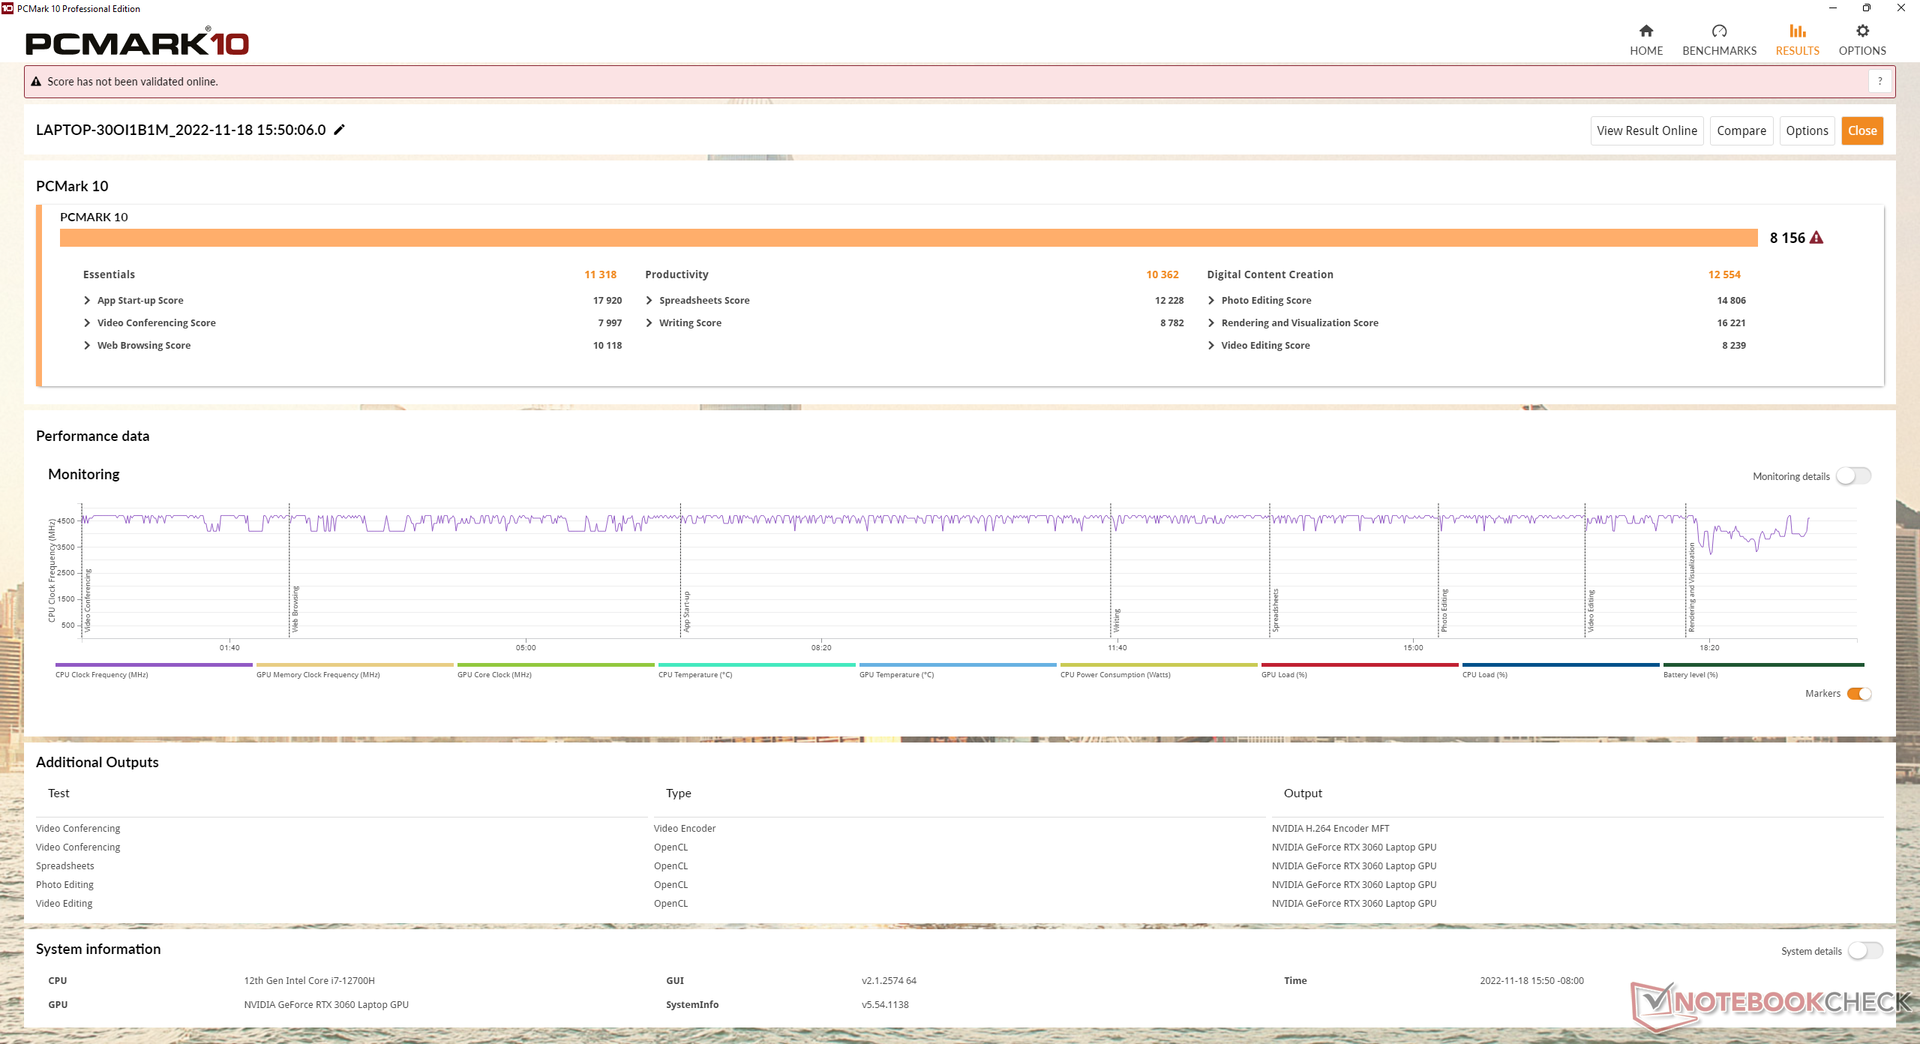
PCMark-resultaten är genomgående högre än på förra årets modell och är bland de högsta av alla bärbara datorer med samma Core i7-12700H CPU och RTX 3060 GPU. Detta stämmer överens med de snabbare än genomsnittliga resultaten för CPU- och GPU-prestanda i vår testenhet.
CrossMark: Overall | Productivity | Creativity | Responsiveness
| PCMark 10 / Score | |
| Lenovo Legion 5 15IAH7H 82RB | |
| Asus TUF Gaming F15 FX507ZM | |
| Genomsnitt Intel Core i7-12700H, NVIDIA GeForce RTX 3060 Laptop GPU (5986 - 8156, n=12) | |
| Lenovo Legion 5 15ACH-82JU00C6GE-FL | |
| Razer Blade 15 Base Edition 2021, i7-10750H RTX 3060 | |
| MSI Bravo 15 B5DD-010US | |
| Acer Aspire Nitro 5 AN515-55-57GF | |
| PCMark 10 / Essentials | |
| Lenovo Legion 5 15IAH7H 82RB | |
| Genomsnitt Intel Core i7-12700H, NVIDIA GeForce RTX 3060 Laptop GPU (9289 - 12144, n=12) | |
| Asus TUF Gaming F15 FX507ZM | |
| Lenovo Legion 5 15ACH-82JU00C6GE-FL | |
| Razer Blade 15 Base Edition 2021, i7-10750H RTX 3060 | |
| MSI Bravo 15 B5DD-010US | |
| Acer Aspire Nitro 5 AN515-55-57GF | |
| PCMark 10 / Productivity | |
| Lenovo Legion 5 15IAH7H 82RB | |
| Lenovo Legion 5 15ACH-82JU00C6GE-FL | |
| Genomsnitt Intel Core i7-12700H, NVIDIA GeForce RTX 3060 Laptop GPU (6161 - 10362, n=12) | |
| Asus TUF Gaming F15 FX507ZM | |
| MSI Bravo 15 B5DD-010US | |
| Razer Blade 15 Base Edition 2021, i7-10750H RTX 3060 | |
| Acer Aspire Nitro 5 AN515-55-57GF | |
| PCMark 10 / Digital Content Creation | |
| Lenovo Legion 5 15IAH7H 82RB | |
| Asus TUF Gaming F15 FX507ZM | |
| Genomsnitt Intel Core i7-12700H, NVIDIA GeForce RTX 3060 Laptop GPU (8950 - 12554, n=12) | |
| Razer Blade 15 Base Edition 2021, i7-10750H RTX 3060 | |
| Lenovo Legion 5 15ACH-82JU00C6GE-FL | |
| MSI Bravo 15 B5DD-010US | |
| Acer Aspire Nitro 5 AN515-55-57GF | |
| CrossMark / Overall | |
| Lenovo Legion 5 15IAH7H 82RB | |
| Genomsnitt Intel Core i7-12700H, NVIDIA GeForce RTX 3060 Laptop GPU (1649 - 2017, n=11) | |
| CrossMark / Productivity | |
| Lenovo Legion 5 15IAH7H 82RB | |
| Genomsnitt Intel Core i7-12700H, NVIDIA GeForce RTX 3060 Laptop GPU (1536 - 1958, n=11) | |
| CrossMark / Creativity | |
| Lenovo Legion 5 15IAH7H 82RB | |
| Genomsnitt Intel Core i7-12700H, NVIDIA GeForce RTX 3060 Laptop GPU (1816 - 2084, n=11) | |
| CrossMark / Responsiveness | |
| Lenovo Legion 5 15IAH7H 82RB | |
| Genomsnitt Intel Core i7-12700H, NVIDIA GeForce RTX 3060 Laptop GPU (1210 - 2207, n=11) | |
| PCMark 10 Score | 8156 poäng | |
Hjälp | ||
| AIDA64 / Memory Copy | |
| Genomsnitt Intel Core i7-12700H (25615 - 80511, n=64) | |
| Asus TUF Gaming F15 FX507ZM | |
| Lenovo Legion 5 15IAH7H 82RB | |
| MSI Bravo 15 B5DD-010US | |
| Lenovo Legion 5 15ACH-82JU00C6GE-FL | |
| Acer Aspire Nitro 5 AN515-55-57GF | |
| AIDA64 / Memory Read | |
| Lenovo Legion 5 15IAH7H 82RB | |
| Asus TUF Gaming F15 FX507ZM | |
| Genomsnitt Intel Core i7-12700H (25586 - 79442, n=64) | |
| MSI Bravo 15 B5DD-010US | |
| Lenovo Legion 5 15ACH-82JU00C6GE-FL | |
| Acer Aspire Nitro 5 AN515-55-57GF | |
| AIDA64 / Memory Write | |
| Lenovo Legion 5 15IAH7H 82RB | |
| Asus TUF Gaming F15 FX507ZM | |
| Genomsnitt Intel Core i7-12700H (23679 - 88660, n=64) | |
| Acer Aspire Nitro 5 AN515-55-57GF | |
| MSI Bravo 15 B5DD-010US | |
| Lenovo Legion 5 15ACH-82JU00C6GE-FL | |
| AIDA64 / Memory Latency | |
| Lenovo Legion 5 15IAH7H 82RB | |
| Lenovo Legion 5 15ACH-82JU00C6GE-FL | |
| Genomsnitt Intel Core i7-12700H (76.2 - 133.9, n=62) | |
| MSI Bravo 15 B5DD-010US | |
| Acer Aspire Nitro 5 AN515-55-57GF | |
| Asus TUF Gaming F15 FX507ZM | |
* ... mindre är bättre
DPC-latenstid
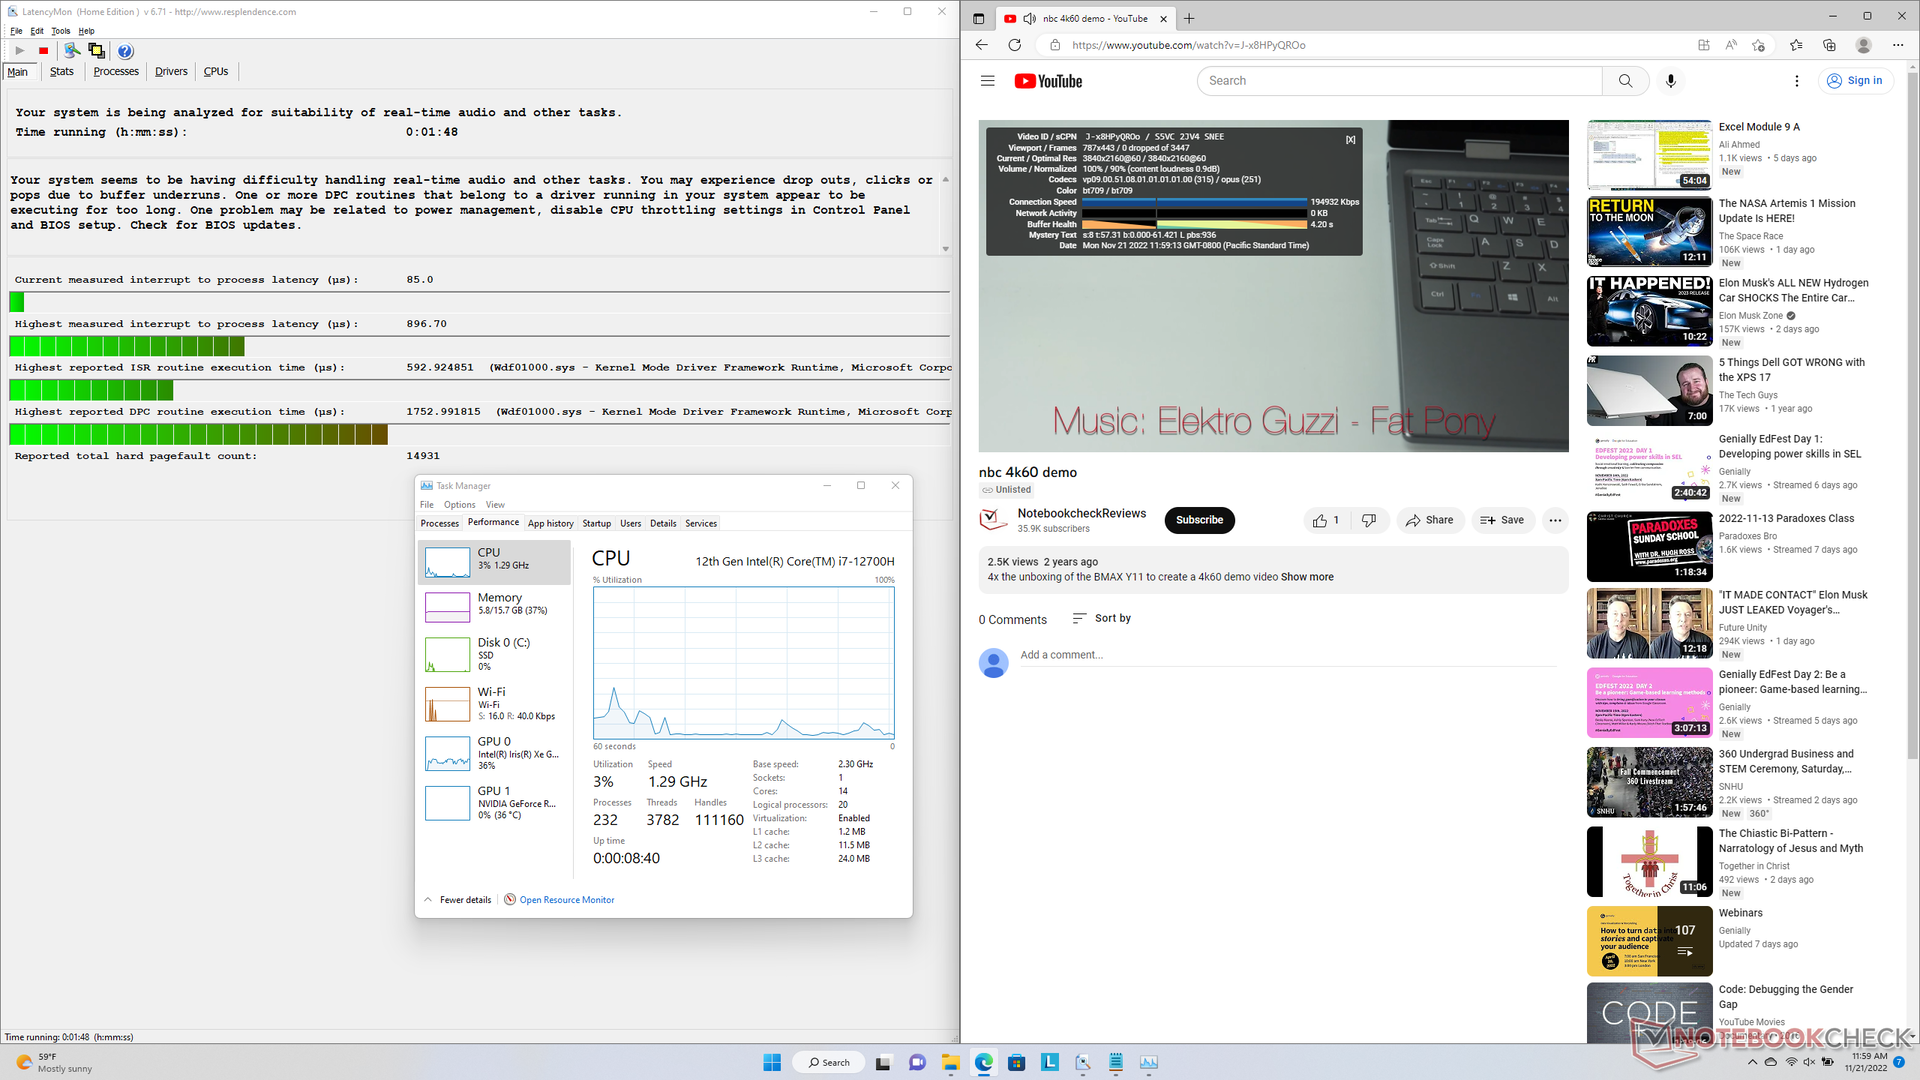
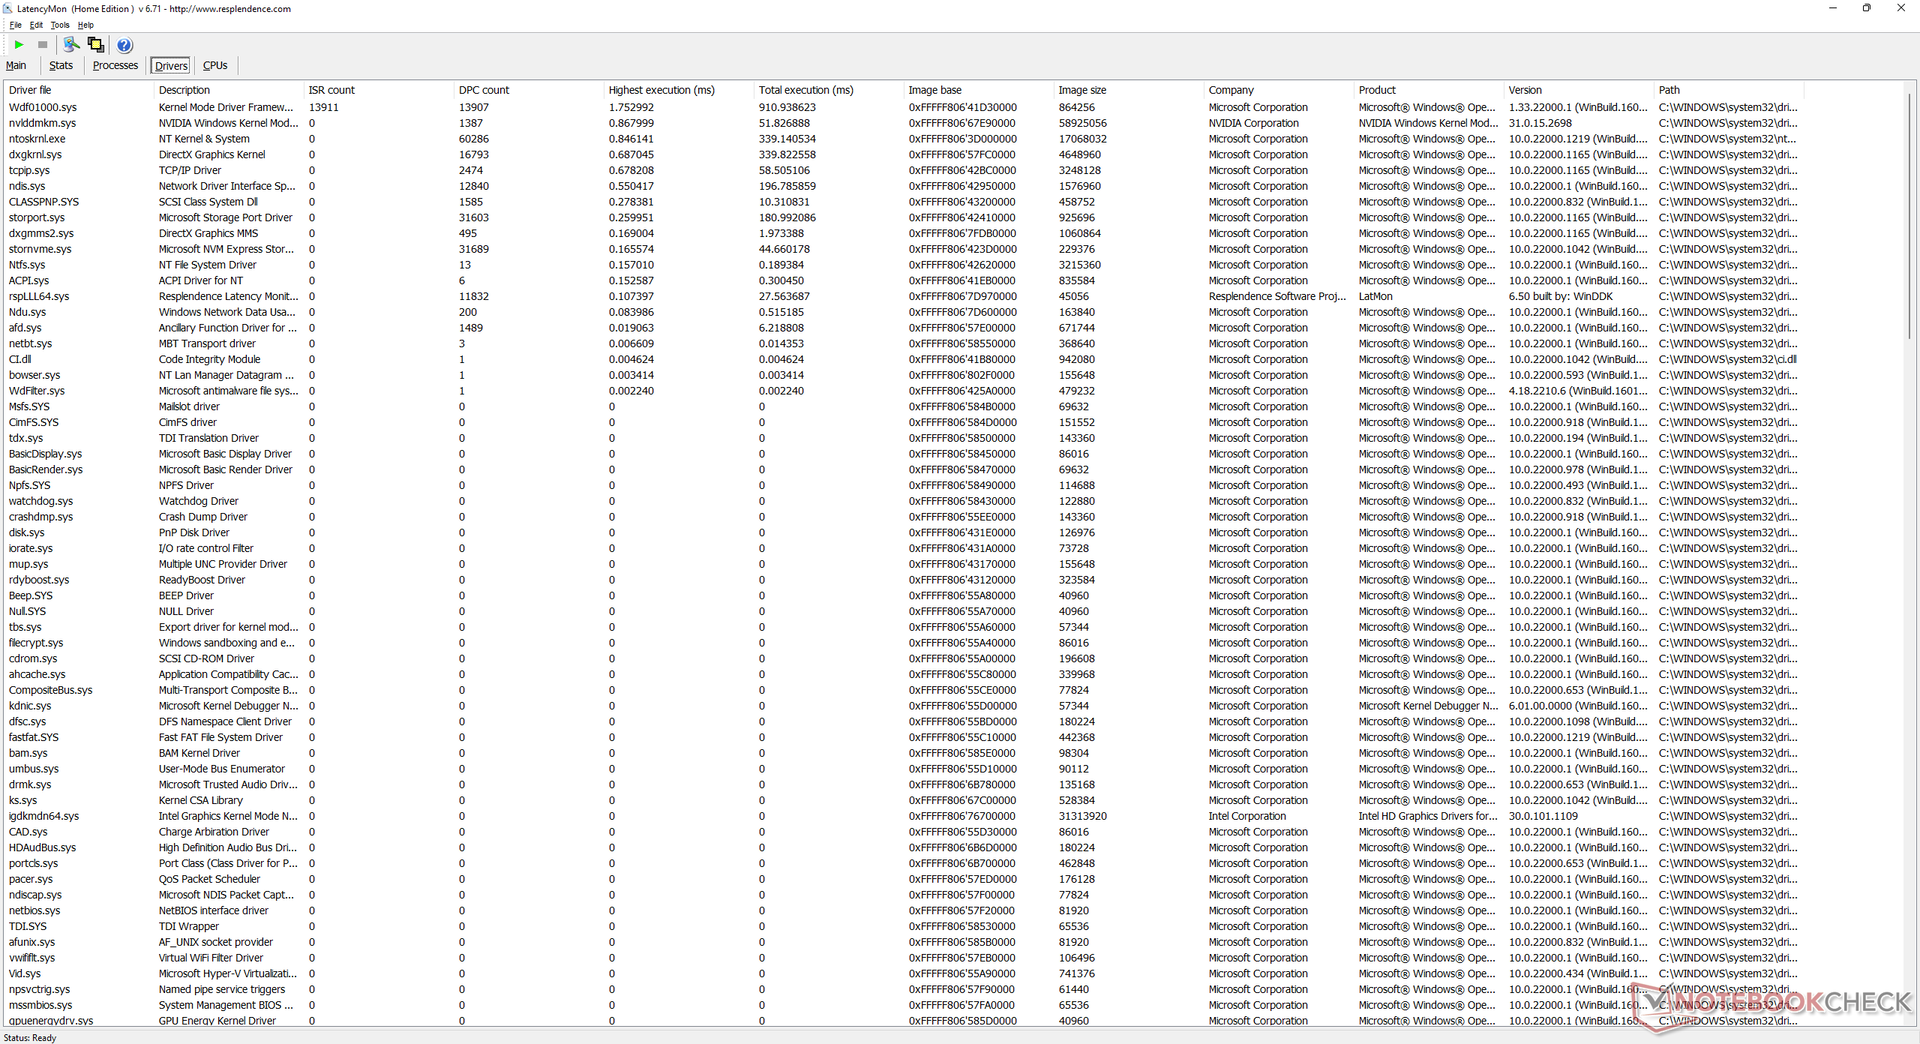
LatencyMon avslöjar mindre DPC-problem när man öppnar flera webbläsarflikar på vår hemsida. uppspelning av 4K-video vid 60 FPS är annars perfekt utan några tappade bilder.
| DPC Latencies / LatencyMon - interrupt to process latency (max), Web, Youtube, Prime95 | |
| MSI Bravo 15 B5DD-010US | |
| Lenovo Legion 5 15IAH7H 82RB | |
| Asus TUF Gaming F15 FX507ZM | |
| Lenovo Legion 5 15ACH-82JU00C6GE-FL | |
| Razer Blade 15 Base Edition 2021, i7-10750H RTX 3060 | |
| Acer Aspire Nitro 5 AN515-55-57GF | |
* ... mindre är bättre
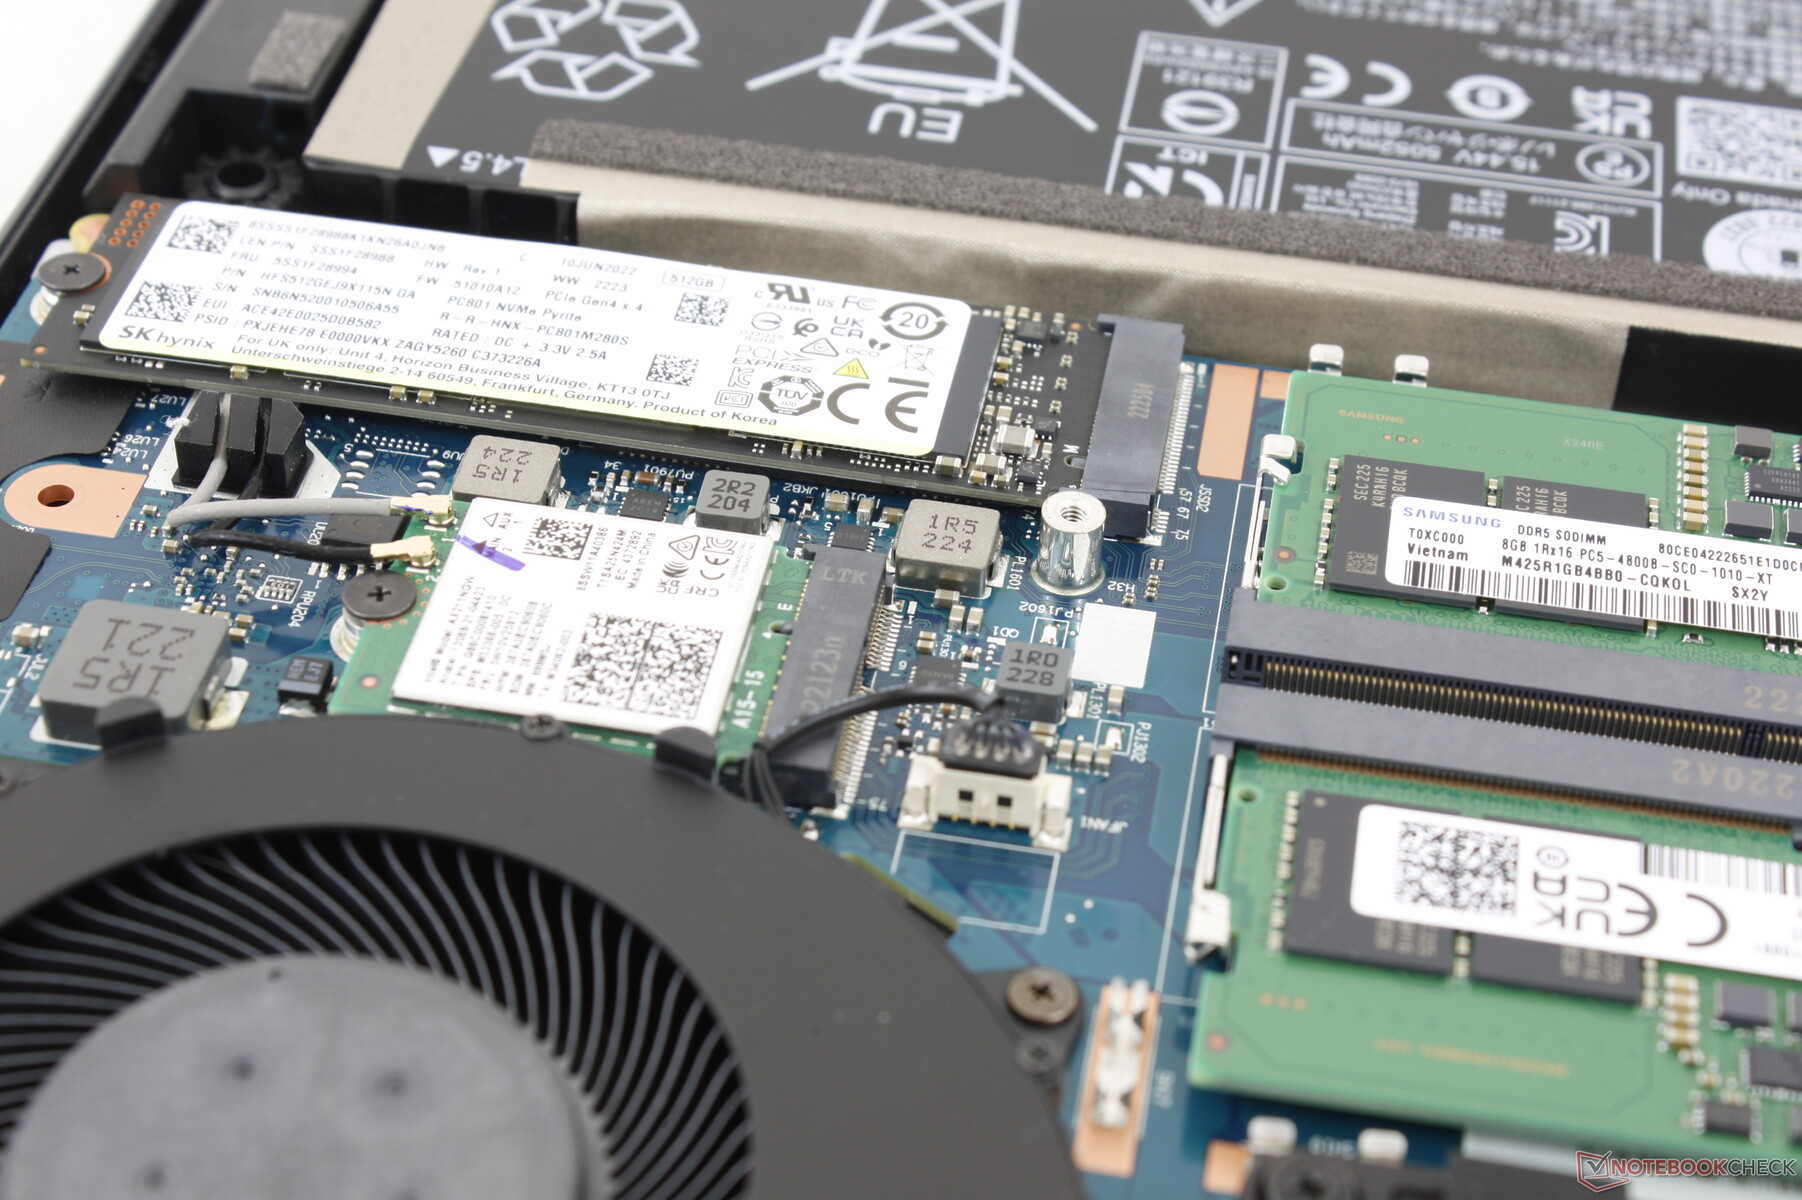
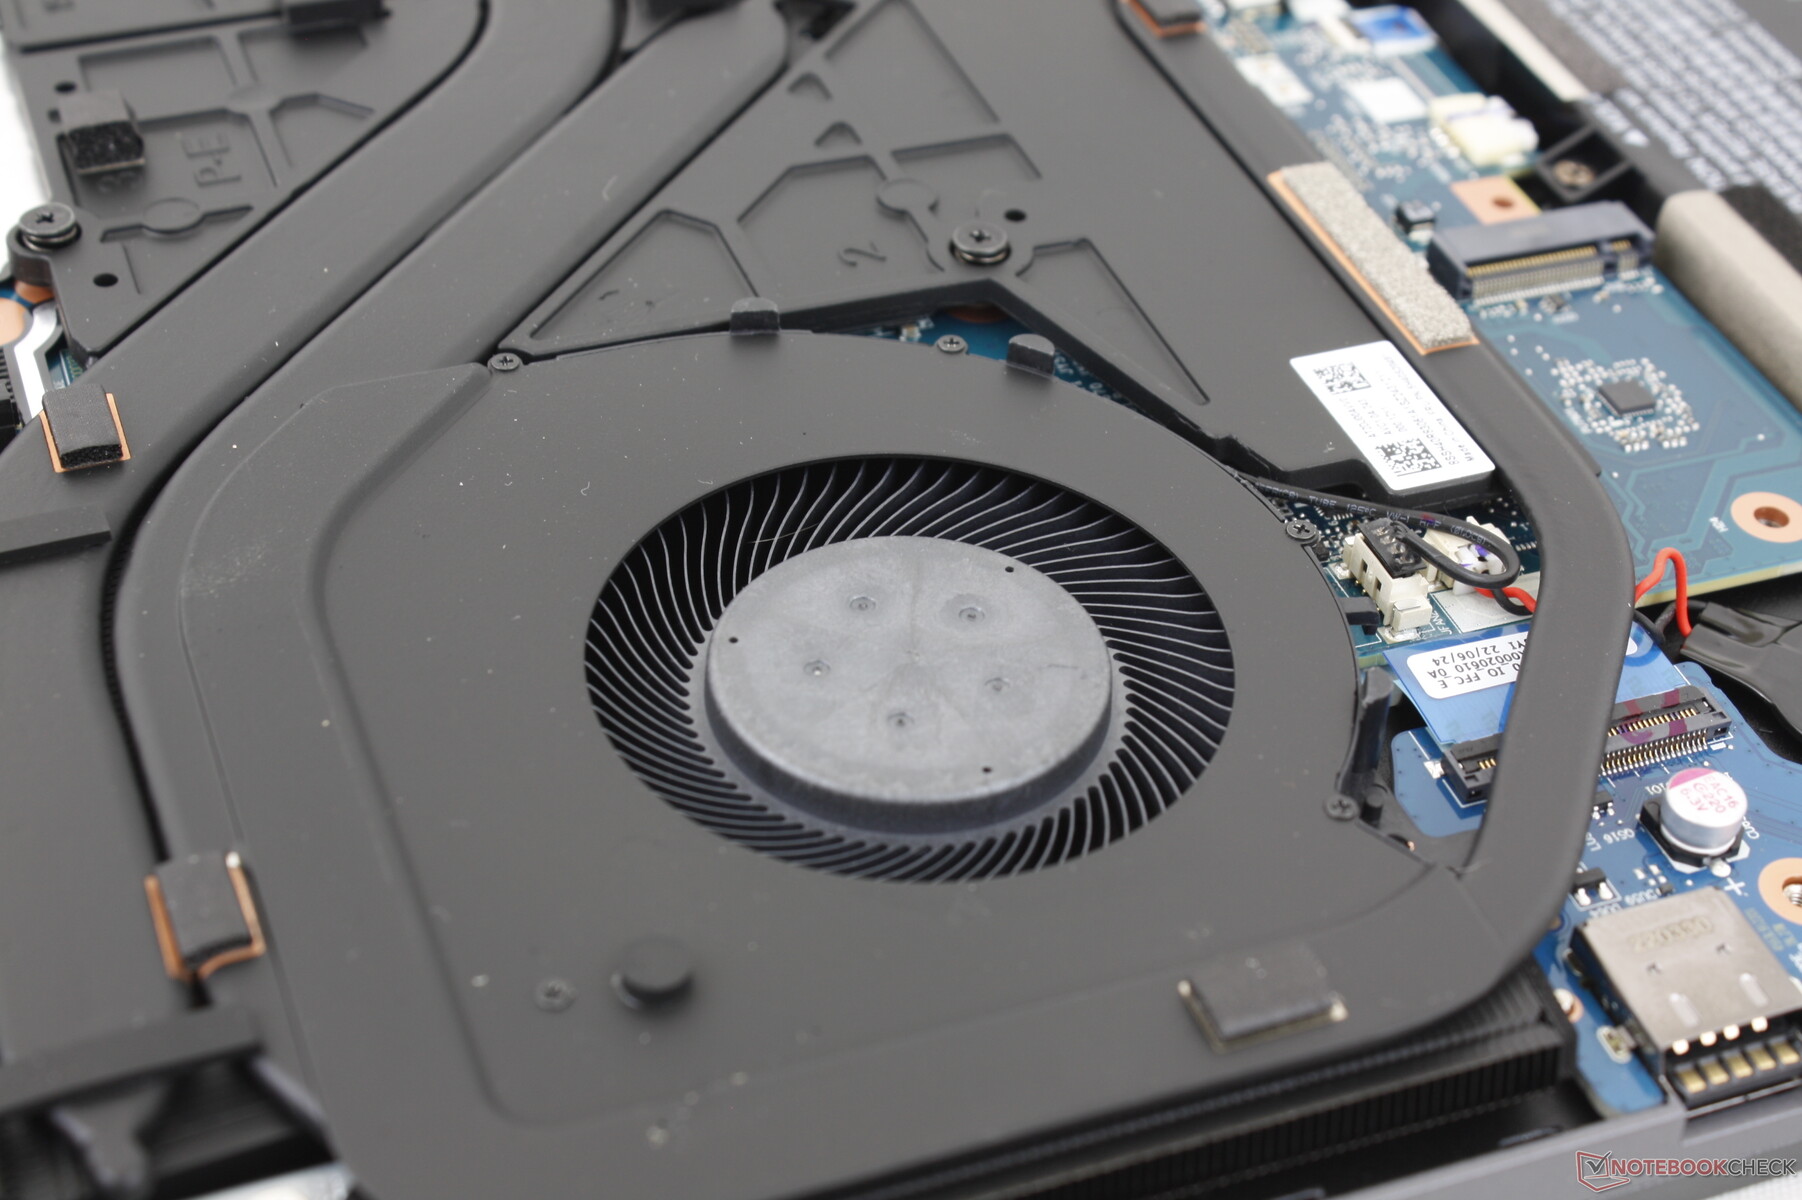
Lagringsenheter - stöd för 2x PCIe4 x4
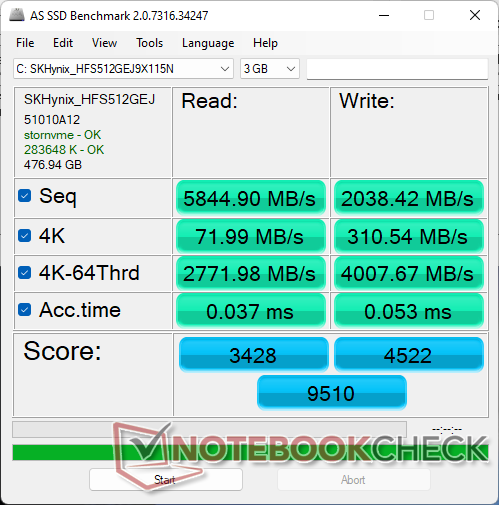
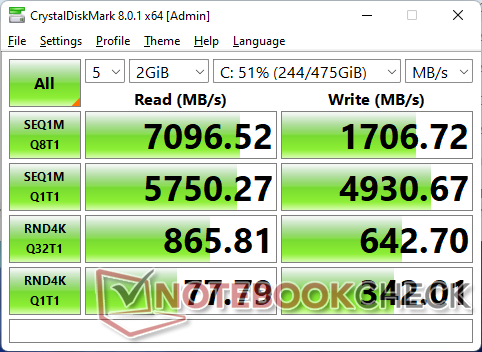
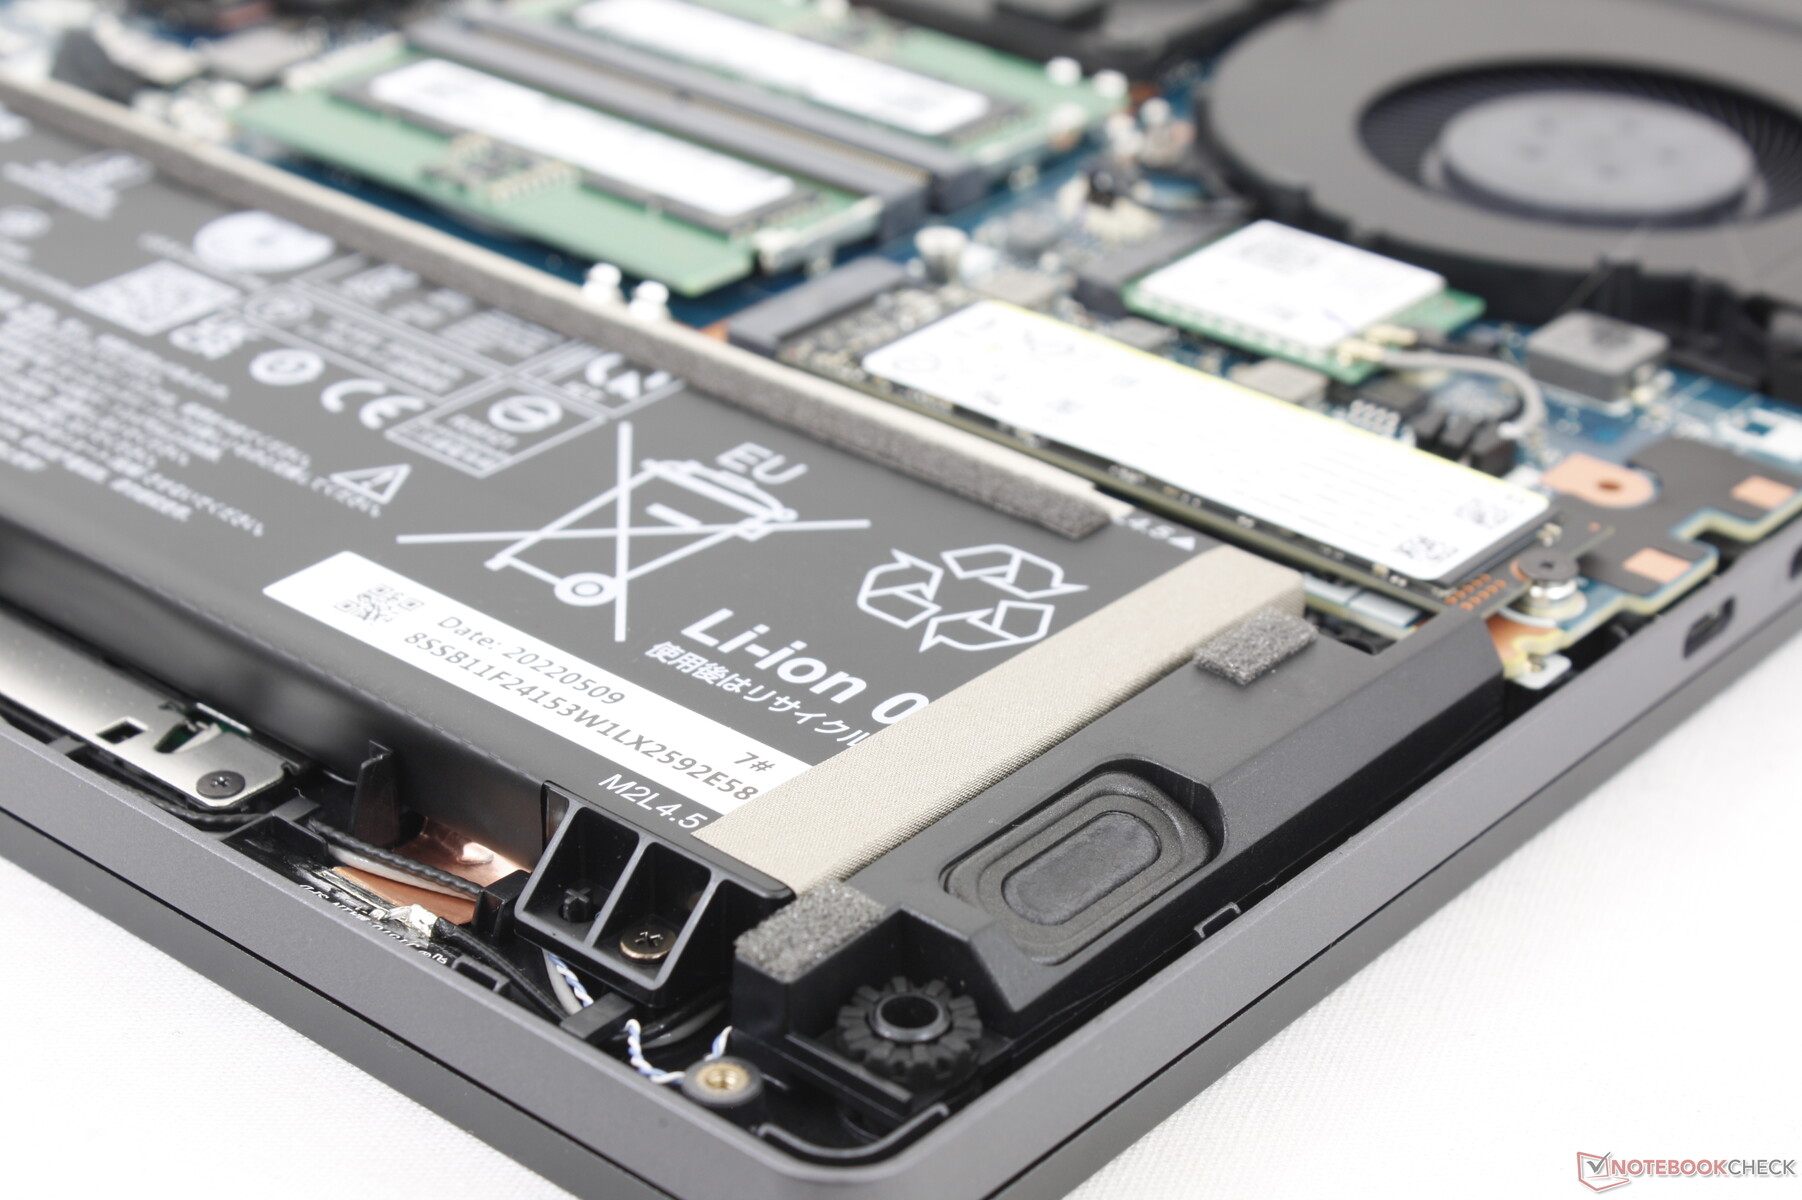
Användare kan installera upp till två M.2 2280 SSD-enheter. Varje plats har en egen termisk kudde och värmespridare för att hjälpa till med kylningen. Den 512 GB stora SK Hynix-enhet i vår enhet kunde bibehålla sin maximala läshastighet på 7000 MB/s utan några problem med strypning
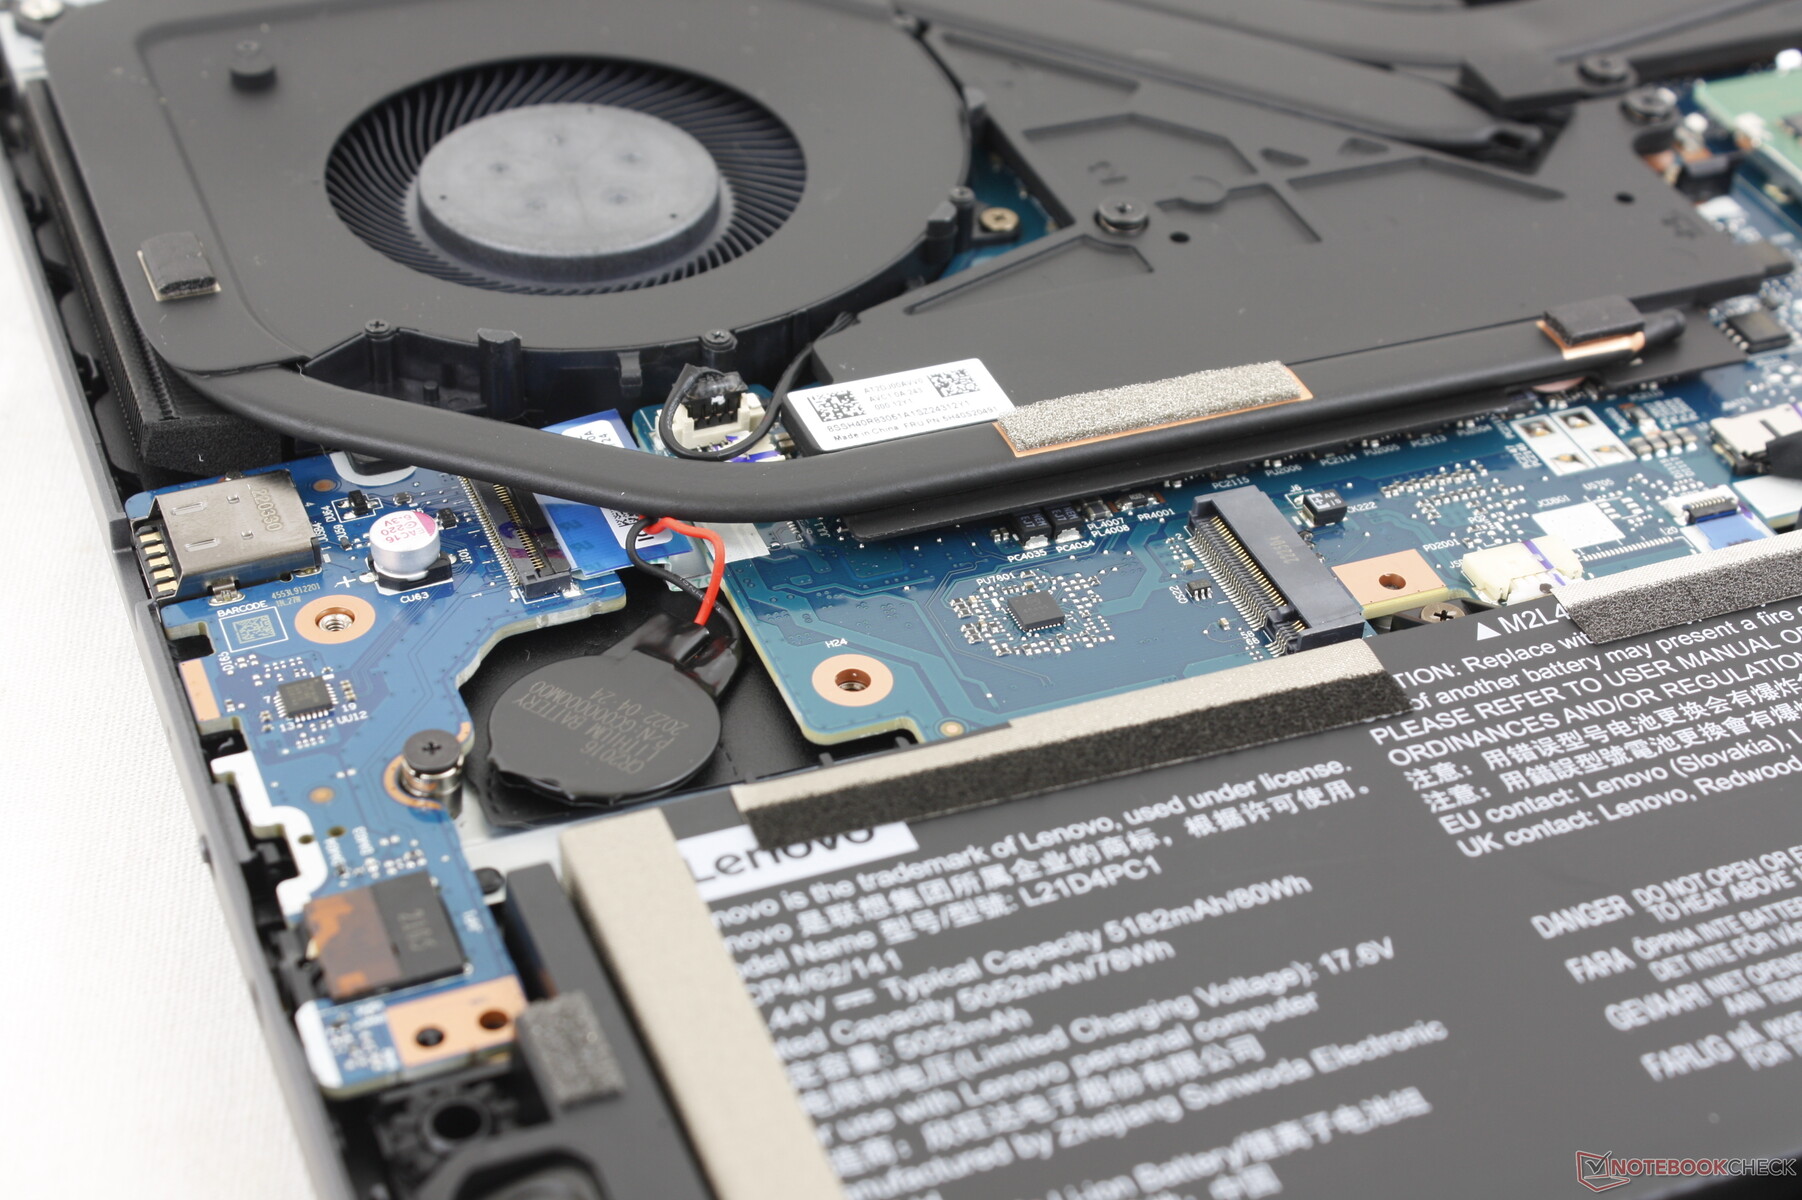
Om du installerar en andra enhet ska du se till att den inte är dubbelsidig, annars kanske den inte får plats i sitt fack. Vår bild nedan visar att BIOS-batteriet tar upp plats från en potentiell M.2 2280 SSD.

* ... mindre är bättre
Disk Throttling: DiskSpd Read Loop, Queue Depth 8
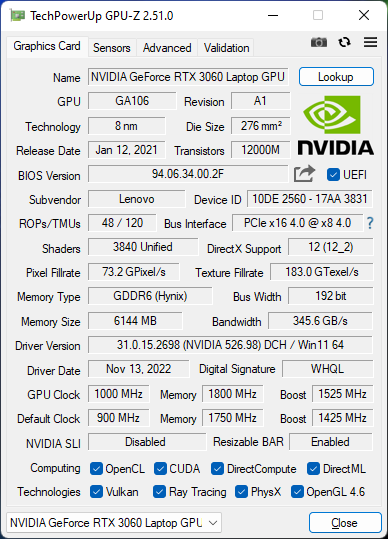
GPU-prestanda - Hög 140 W TGP
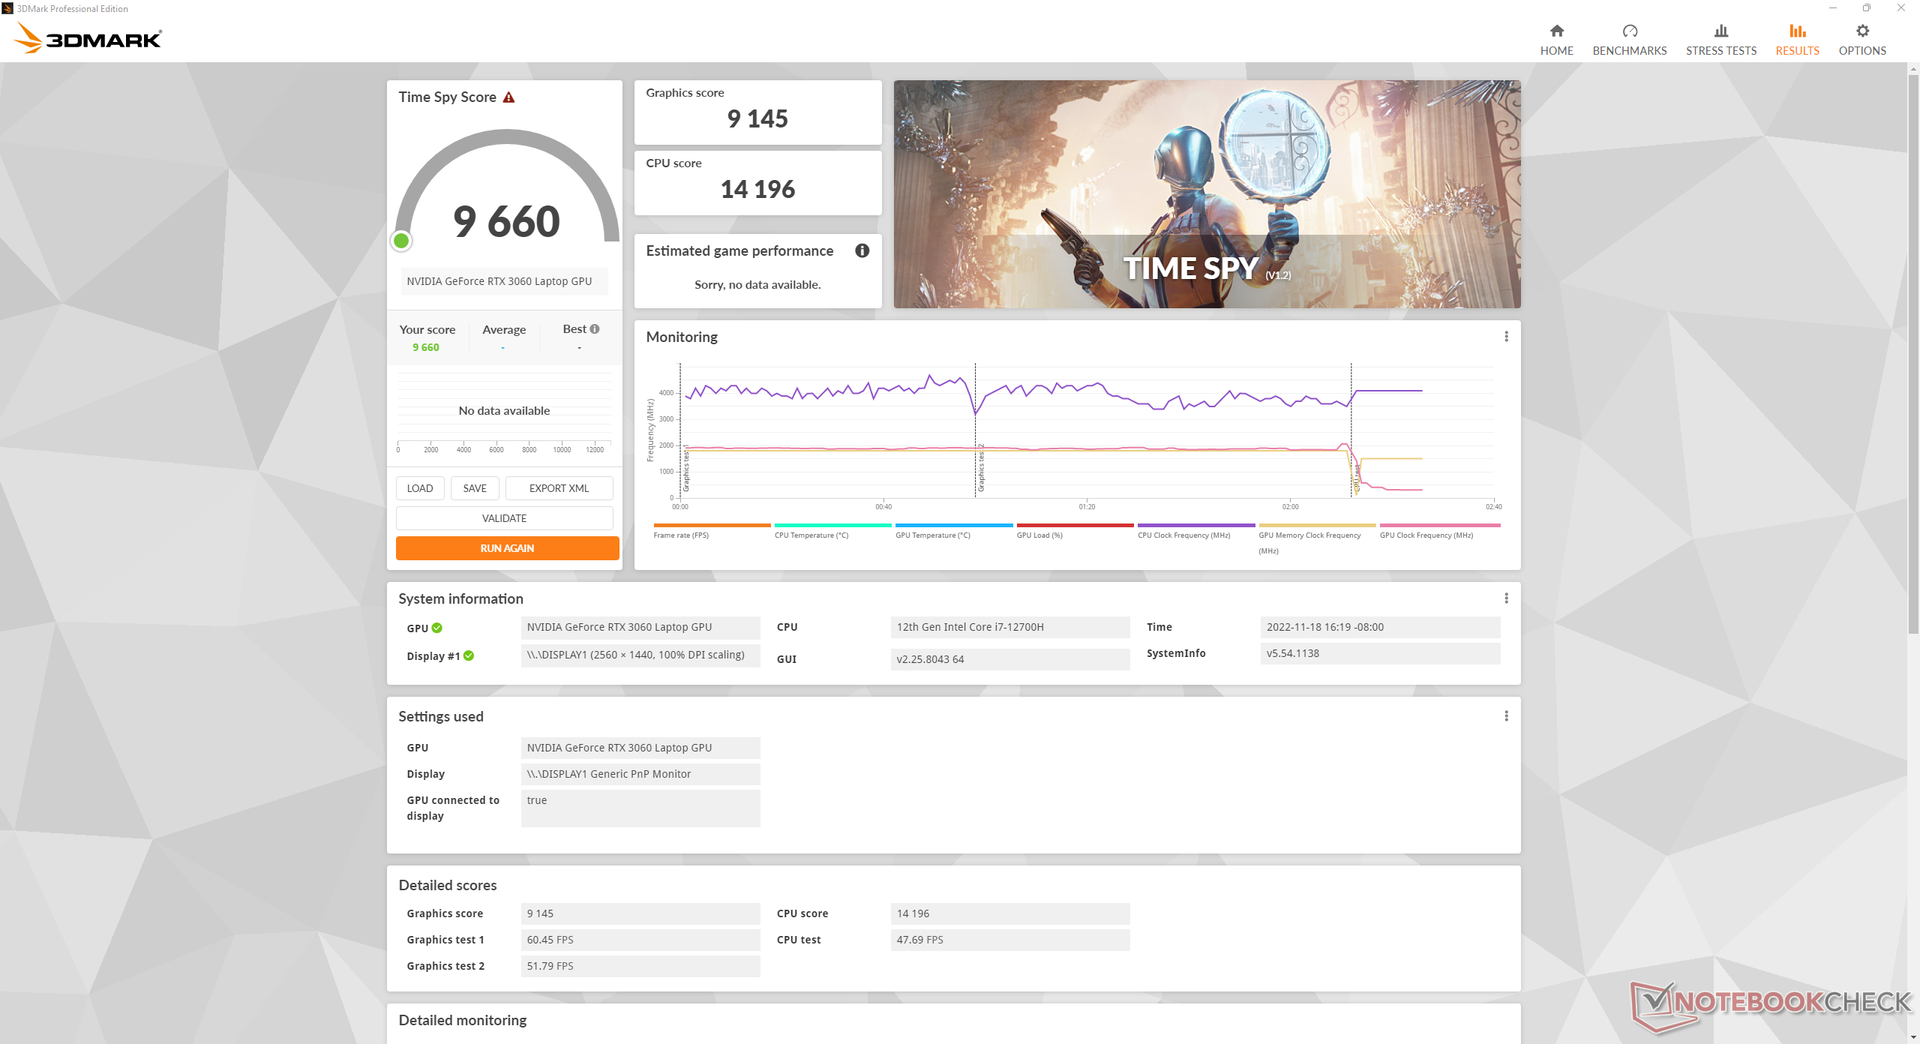
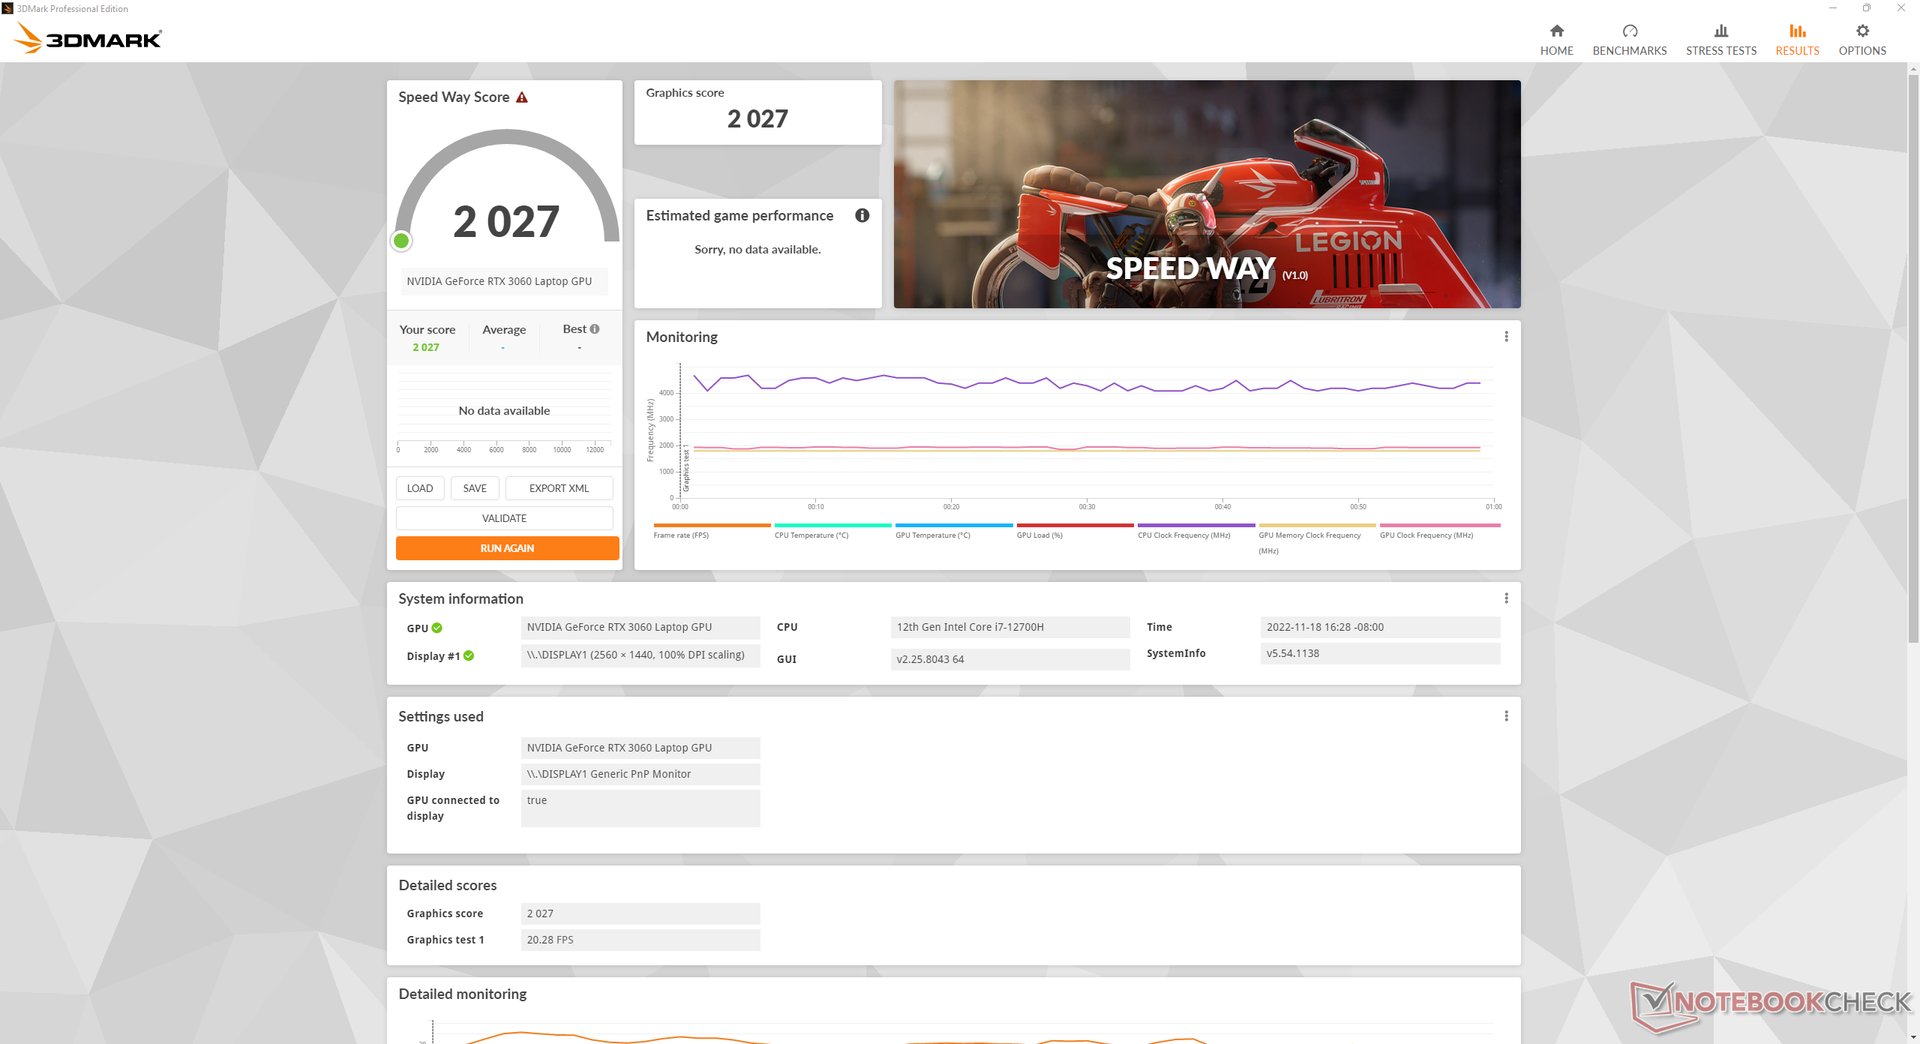
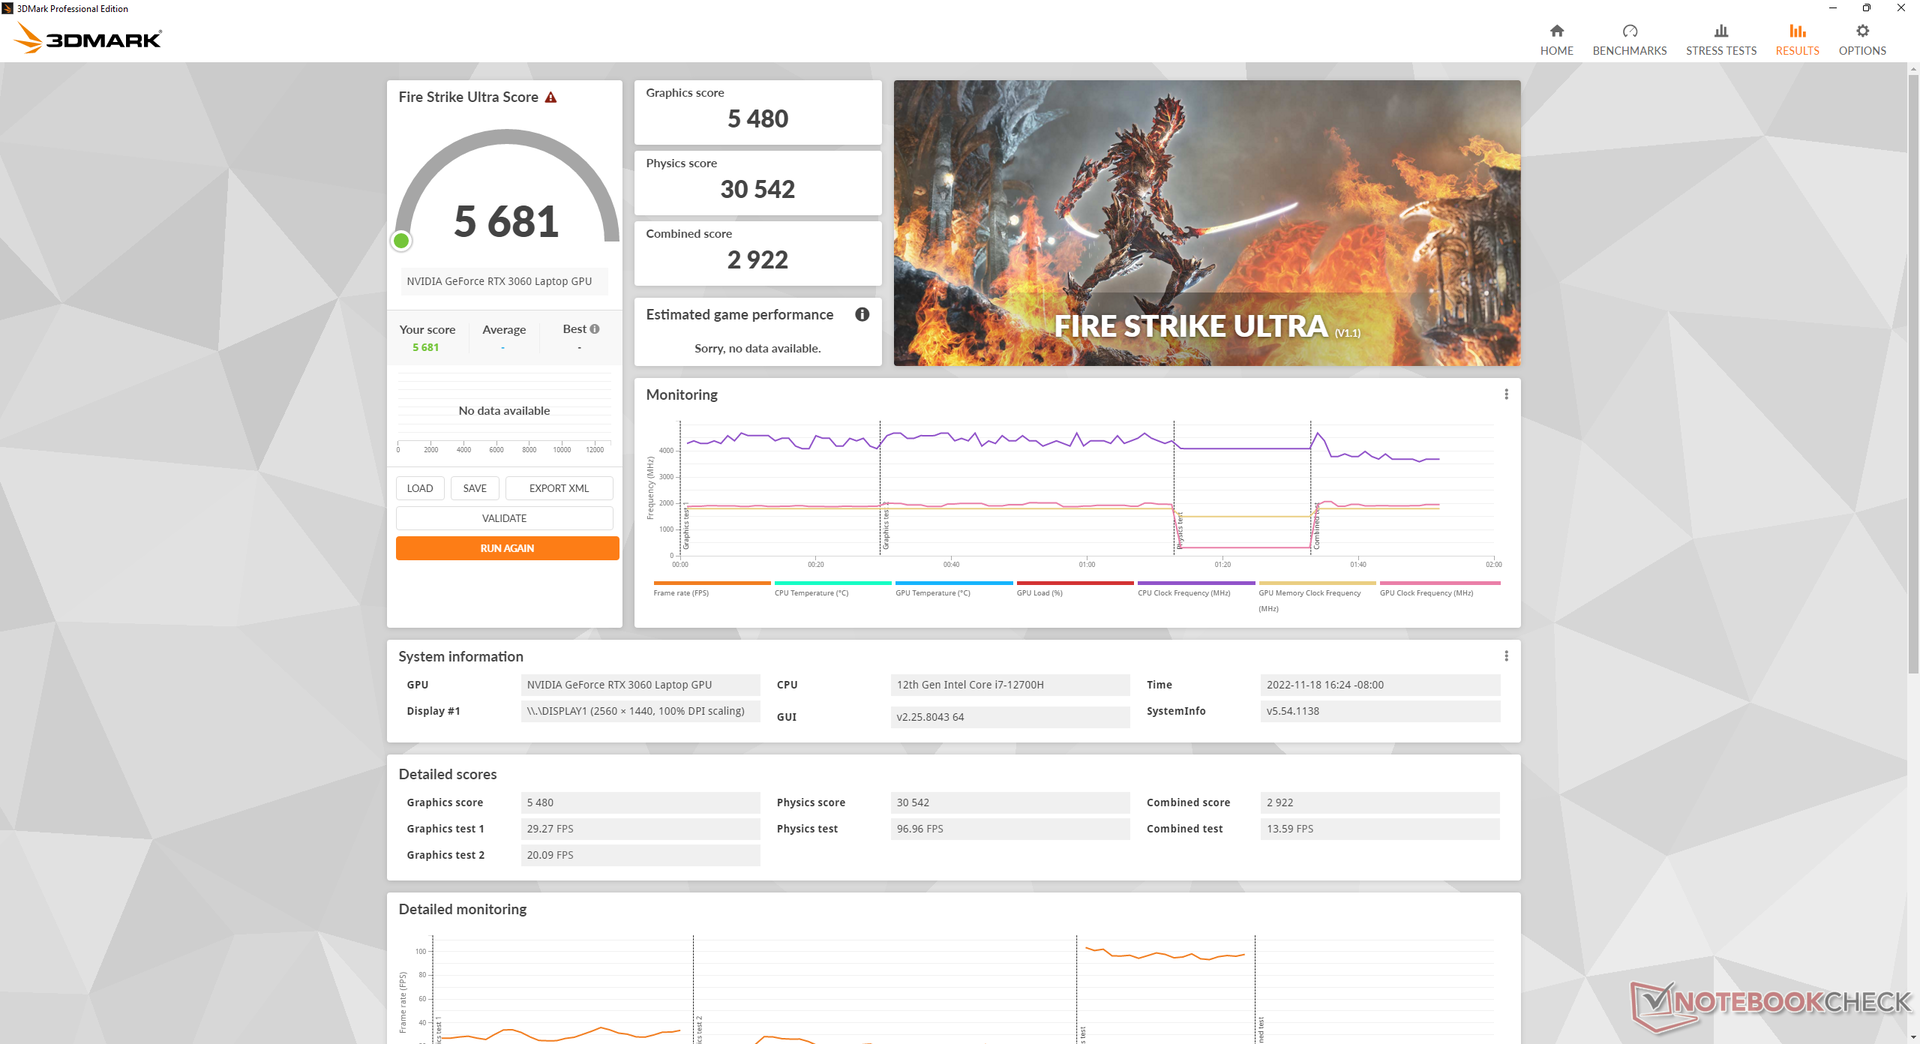
Grafikprestandan är utmärkt med 3DMark-resultat som är 10 till 15 procent snabbare än den genomsnittliga bärbara datorn i vår databas som är utrustad med samma GeForce RTX 3060 GPU. Prestandan som är högre än genomsnittet kan delvis tillskrivas TGP-målet på 140 W som är högre än på de flesta andra bärbara datorer för spel.
Systemet måste vara inställt på Performance-läget för att GPU:n ska kunna utnyttjas fullt ut. Om du till exempel körs i läget Balanced kommer grafikprestandan att sjunka med cirka 10 procent, vilket framgår av våra Fire Strike -resultat nedan
.
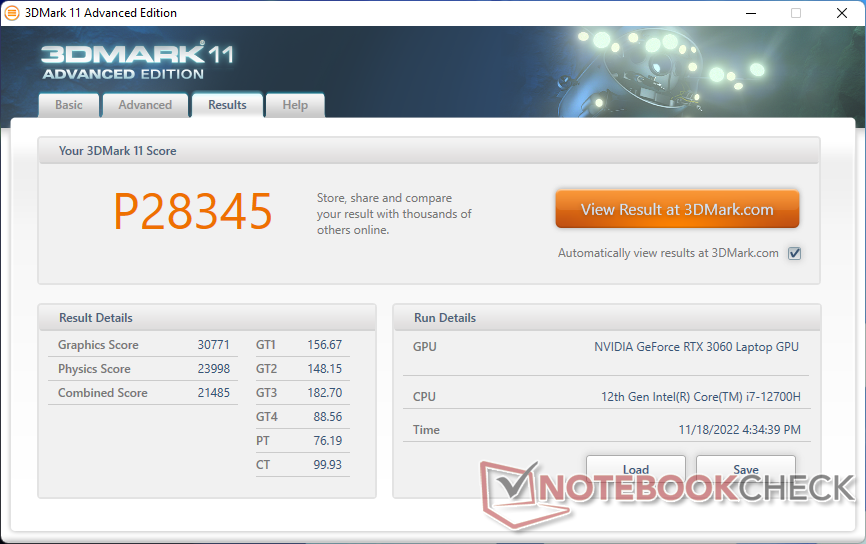

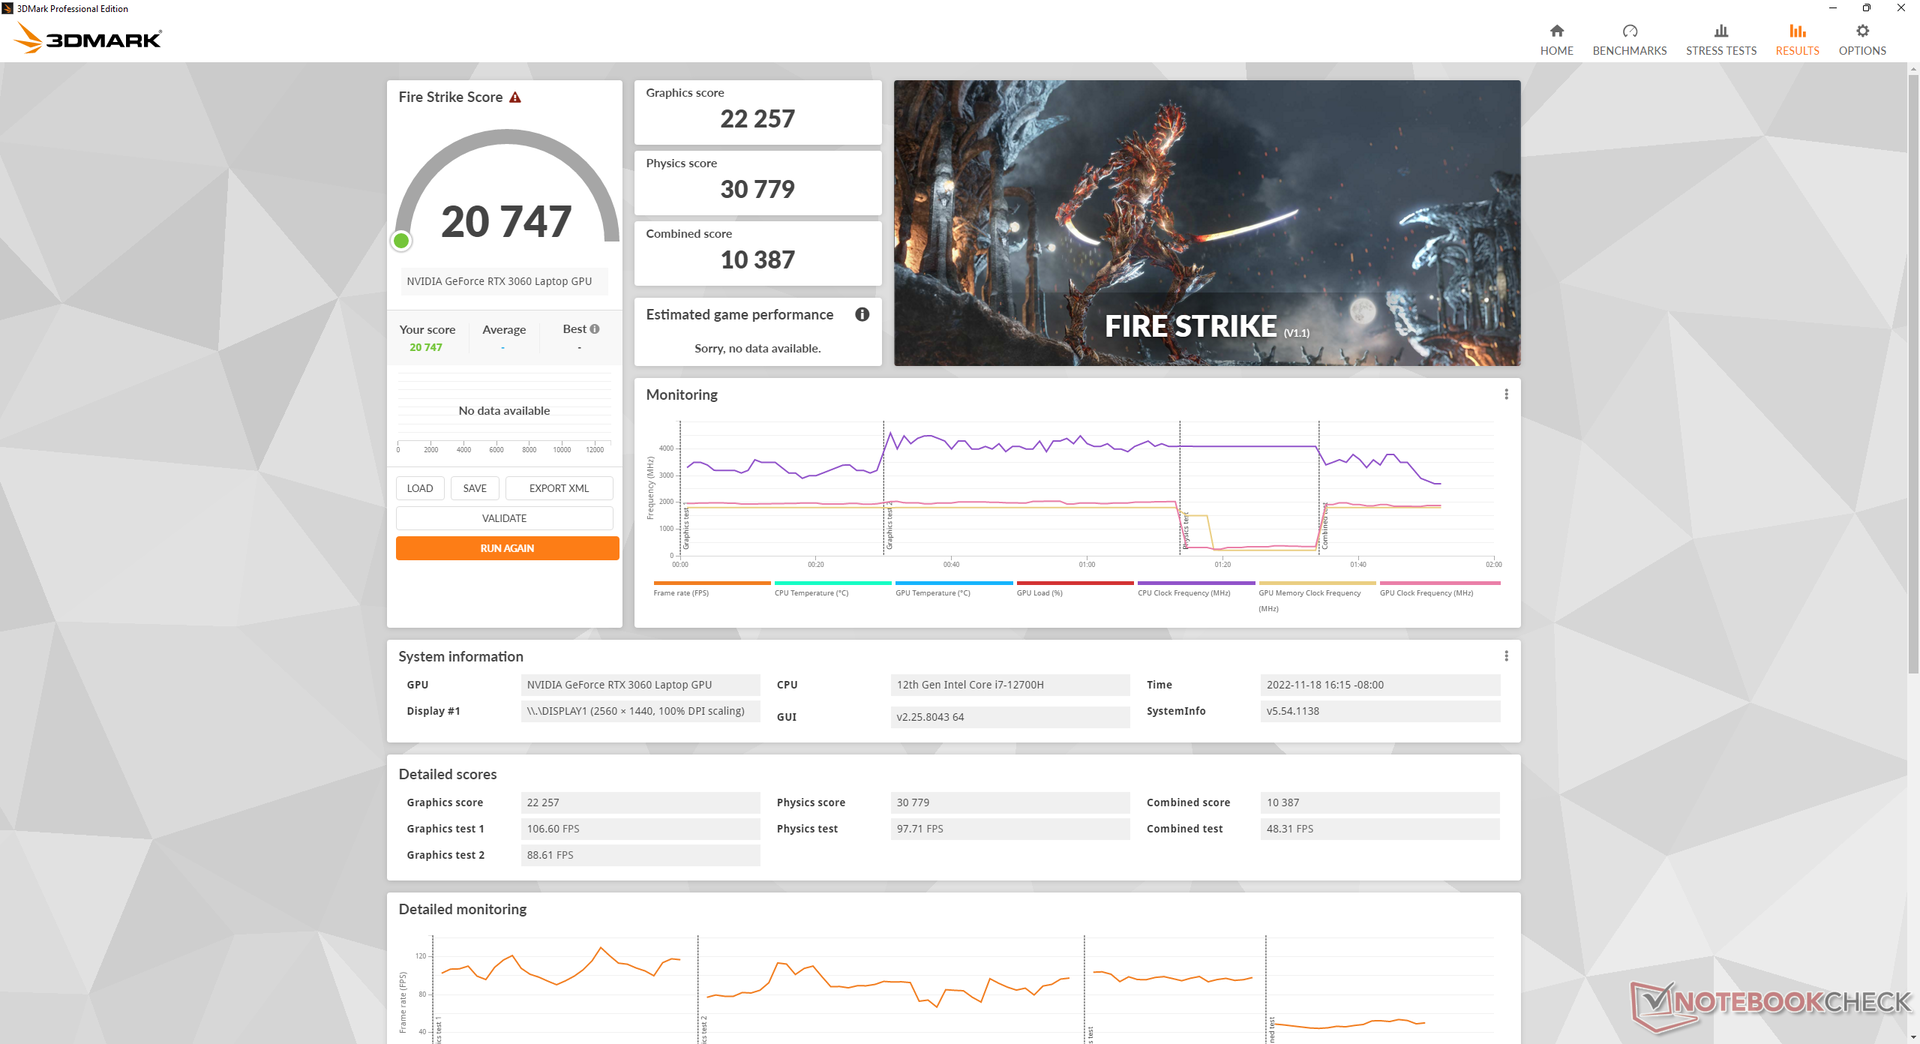
| 3DMark 11 Performance | 28345 poäng | |
| 3DMark Fire Strike Score | 20747 poäng | |
| 3DMark Time Spy Score | 9660 poäng | |
Hjälp | ||
| Blender | |
| v3.3 Classroom OPTIX/RTX | |
| Genomsnitt NVIDIA GeForce RTX 3060 Laptop GPU (30 - 56, n=15) | |
| Lenovo Legion 5 15IAH7H 82RB | |
| v3.3 Classroom CUDA | |
| Genomsnitt NVIDIA GeForce RTX 3060 Laptop GPU (51 - 89, n=15) | |
| Lenovo Legion 5 15IAH7H 82RB | |
| v3.3 Classroom CPU | |
| Genomsnitt NVIDIA GeForce RTX 3060 Laptop GPU (291 - 508, n=15) | |
| Lenovo Legion 5 15IAH7H 82RB | |
* ... mindre är bättre
| Performance rating - Percent | |
| Genomsnitt av klass Gaming | |
| Lenovo Legion 5 15IAH7H 82RB | |
| The Witcher 3 - 1920x1080 Ultra Graphics & Postprocessing (HBAO+) | |
| Genomsnitt av klass Gaming (95 - 240, n=7, senaste 2 åren) | |
| Lenovo Legion 5 15IAH7H 82RB | |
| GTA V - 1920x1080 Highest AA:4xMSAA + FX AF:16x | |
| Genomsnitt av klass Gaming (48.3 - 186.9, n=95, senaste 2 åren) | |
| Lenovo Legion 5 15IAH7H 82RB | |
| Final Fantasy XV Benchmark - 1920x1080 High Quality | |
| Genomsnitt av klass Gaming (41 - 215, n=96, senaste 2 åren) | |
| Lenovo Legion 5 15IAH7H 82RB | |
| Strange Brigade - 1920x1080 ultra AA:ultra AF:16 | |
| Genomsnitt av klass Gaming (76.3 - 456, n=86, senaste 2 åren) | |
| Lenovo Legion 5 15IAH7H 82RB | |
| Dota 2 Reborn - 1920x1080 ultra (3/3) best looking | |
| Lenovo Legion 5 15IAH7H 82RB | |
| Genomsnitt av klass Gaming (84.8 - 248, n=108, senaste 2 åren) | |
| X-Plane 11.11 - 1920x1080 high (fps_test=3) | |
| Lenovo Legion 5 15IAH7H 82RB | |
| Genomsnitt av klass Gaming (52.1 - 143.5, n=110, senaste 2 åren) | |
Witcher 3 FPS Chart
| låg | med. | hög | ultra | QHD | |
|---|---|---|---|---|---|
| GTA V (2015) | 186.8 | 183.4 | 179.4 | 109.8 | 83.6 |
| The Witcher 3 (2015) | 448.6 | 295.6 | 181.1 | 89.2 | |
| Dota 2 Reborn (2015) | 180.1 | 168.2 | 161.9 | 154.8 | |
| Final Fantasy XV Benchmark (2018) | 214 | 133.5 | 100.9 | 73.7 | |
| X-Plane 11.11 (2018) | 157.1 | 138.3 | 109.3 | ||
| Strange Brigade (2018) | 471 | 242 | 192.1 | 166.3 | 118.4 |
| Cyberpunk 2077 1.6 (2022) | 135.7 | 113.4 | 87.7 | 73.7 | 45.8 |
Utsläpp
Systembrus
De interna fläktarna är tystare under längre tid innan de behöver öka ljudnivån jämfört med fläktarna i 2021 års modell. När man kör den första benchmark-scenen i 3DMark 06, till exempel, toppar fläktljudet på endast 29,3 dB(A) jämfört med 54 dB(A) på den äldre modellen. Detta innebär att du kan köra låg till låg-medelhög belastning som webbsurfning eller videoströmning under längre perioder innan fläktarna blir hörbara.
Kör Witcher 3 i balanserat läge skulle resultera i en fläktljudnivå på mellan 43 och 48 dB(A) jämfört med 51,4 dB(A) i prestandaläget. Användarna måste alltså stå ut med högre fläktar om de vill utnyttja GPU:n fullt ut. Det totala fläktljudet är högre än på Razer Blade 15 Base Edition men tystare än på Razer Blade 15 Base Edition.Asus TUF Gaming F15 båda med samma GeForce RTX 3060 GPU.
Ljudnivå
| Låg belastning |
| 23.5 / 23.5 / 26.8 dB(A) |
| Hög belastning |
| 29.3 / 53 dB(A) |
 | ||
30 dB tyst 40 dB(A) hörbar 50 dB(A) högt ljud |
||
min: | ||
| Lenovo Legion 5 15IAH7H 82RB GeForce RTX 3060 Laptop GPU, i7-12700H | Lenovo Legion 5 15ACH-82JU00C6GE-FL GeForce RTX 3060 Laptop GPU, R7 5800H, Micron 2300 512GB MTFDHBA512TDV | MSI Bravo 15 B5DD-010US Radeon RX 5500M, R5 5600H, Kingston OM8PCP3512F-AB | Asus TUF Gaming F15 FX507ZM GeForce RTX 3060 Laptop GPU, i7-12700H, SK Hynix HFM001TD3JX013N | Acer Aspire Nitro 5 AN515-55-57GF GeForce RTX 3060 Laptop GPU, i5-10300H, WDC PC SN530 SDBPNPZ-512G | Razer Blade 15 Base Edition 2021, i7-10750H RTX 3060 GeForce RTX 3060 Laptop GPU, i7-10750H, Samsung SSD PM981a MZVLB512HBJQ | |
|---|---|---|---|---|---|---|
| Noise | -21% | -12% | -5% | -15% | -6% | |
| av / miljö * (dB) | 23.3 | 24.2 -4% | 24.5 -5% | 23.2 -0% | 25 -7% | 25.3 -9% |
| Idle Minimum * (dB) | 23.5 | 29 -23% | 24.5 -4% | 23.6 -0% | 25 -6% | 25.4 -8% |
| Idle Average * (dB) | 23.5 | 29 -23% | 32.8 -40% | 23.6 -0% | 30 -28% | 25.4 -8% |
| Idle Maximum * (dB) | 26.8 | 29 -8% | 32.8 -22% | 25.4 5% | 33 -23% | 25.4 5% |
| Load Average * (dB) | 29.3 | 53.5 -83% | 34.5 -18% | 38 -30% | 46 -57% | 42.5 -45% |
| Witcher 3 ultra * (dB) | 51.4 | 53.5 -4% | 42.5 17% | 54.1 -5% | 47 9% | 42 18% |
| Load Maximum * (dB) | 53 | 53.5 -1% | 58.5 -10% | 57.2 -8% | 50 6% | 52.2 2% |
* ... mindre är bättre
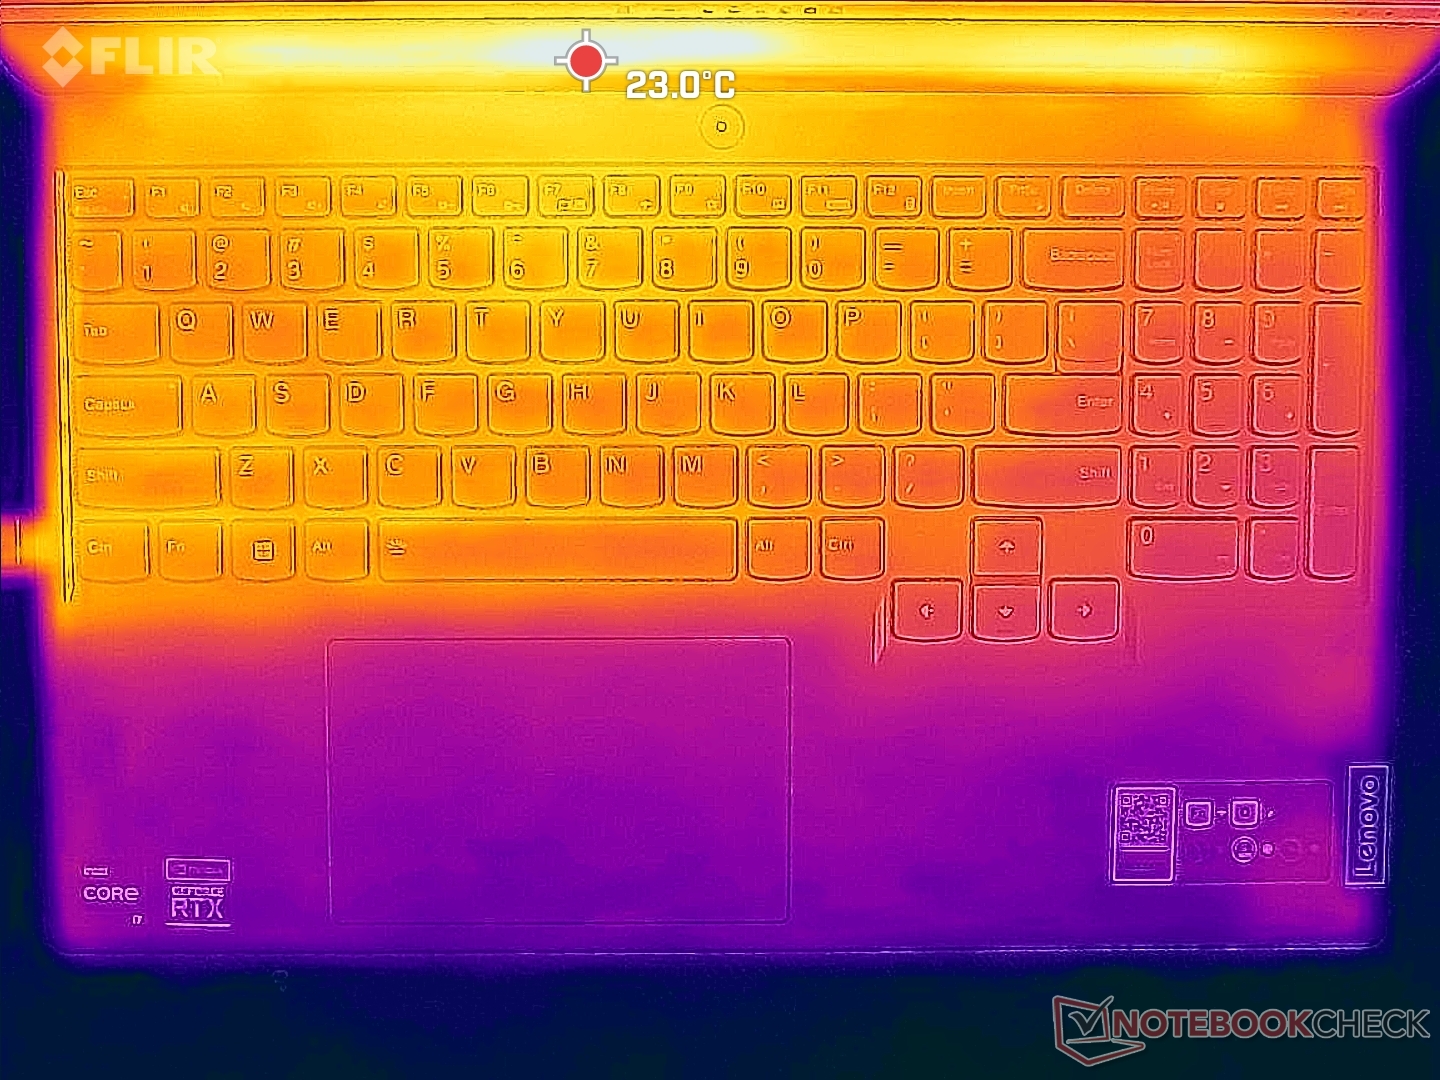
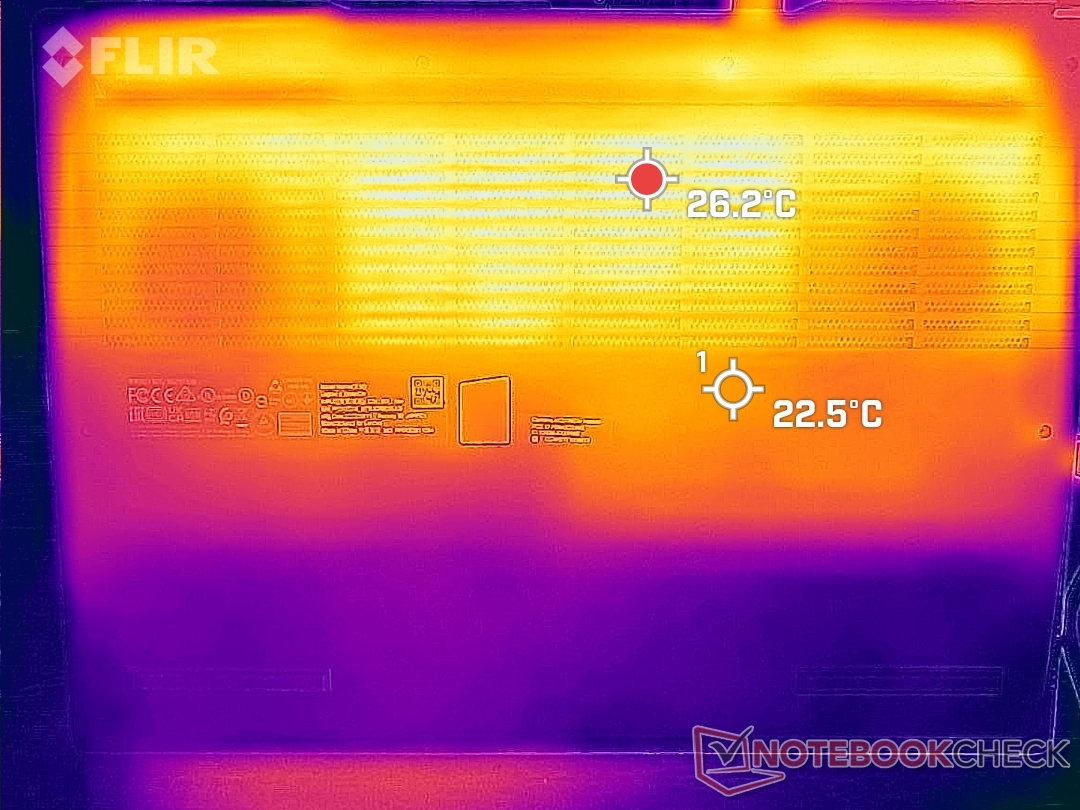
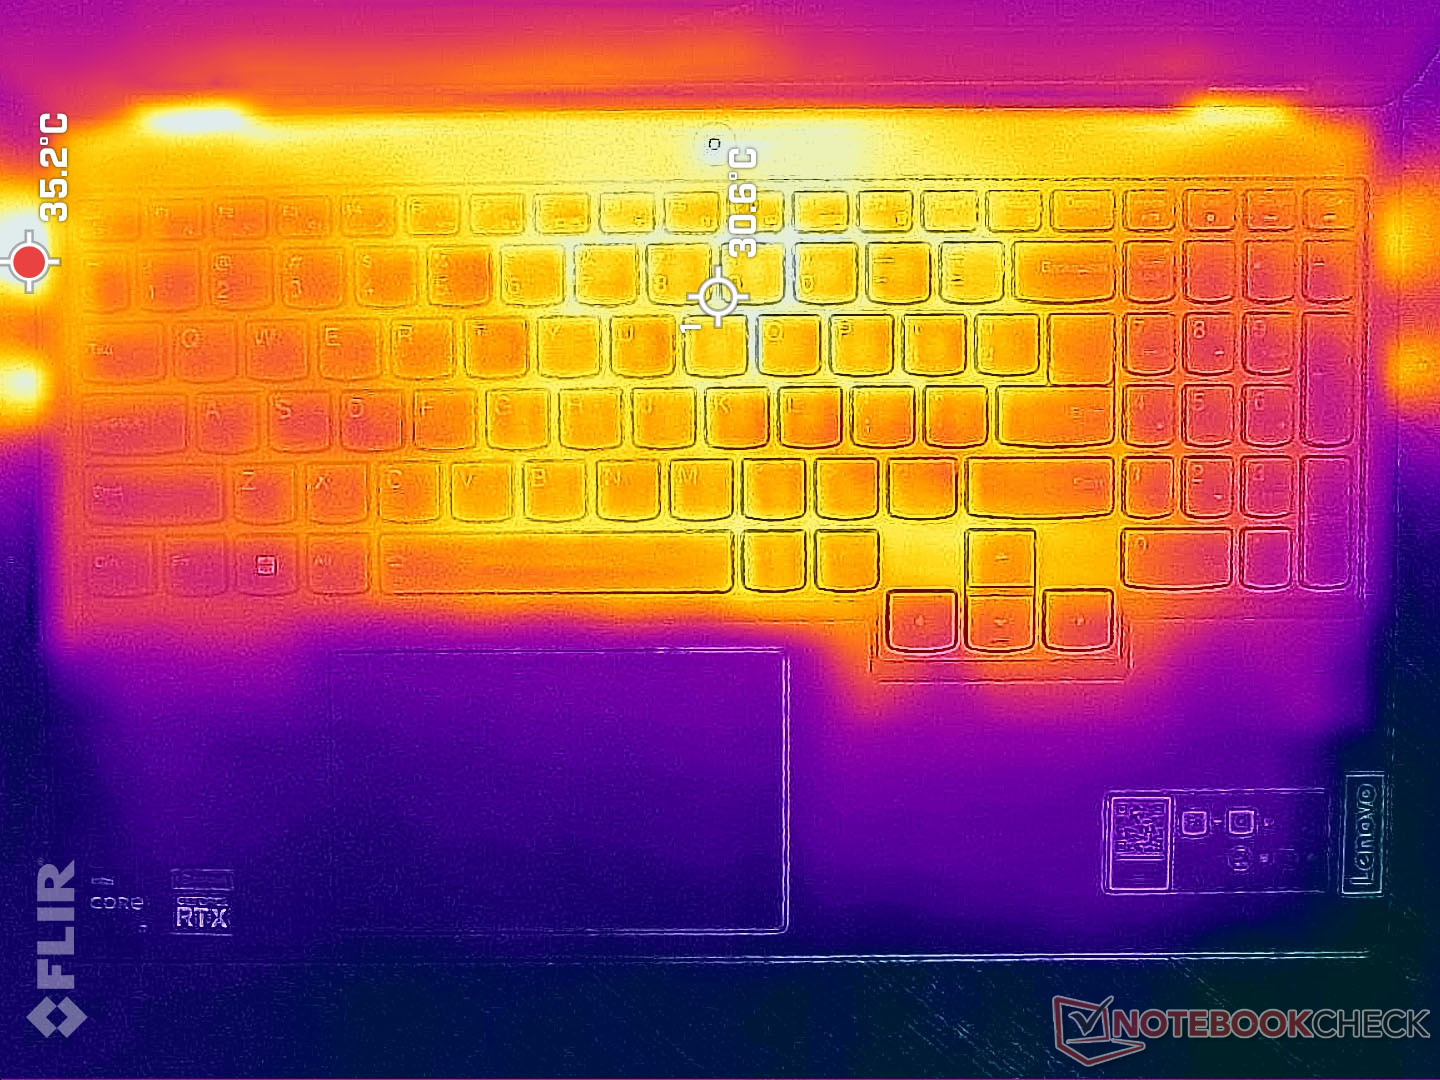
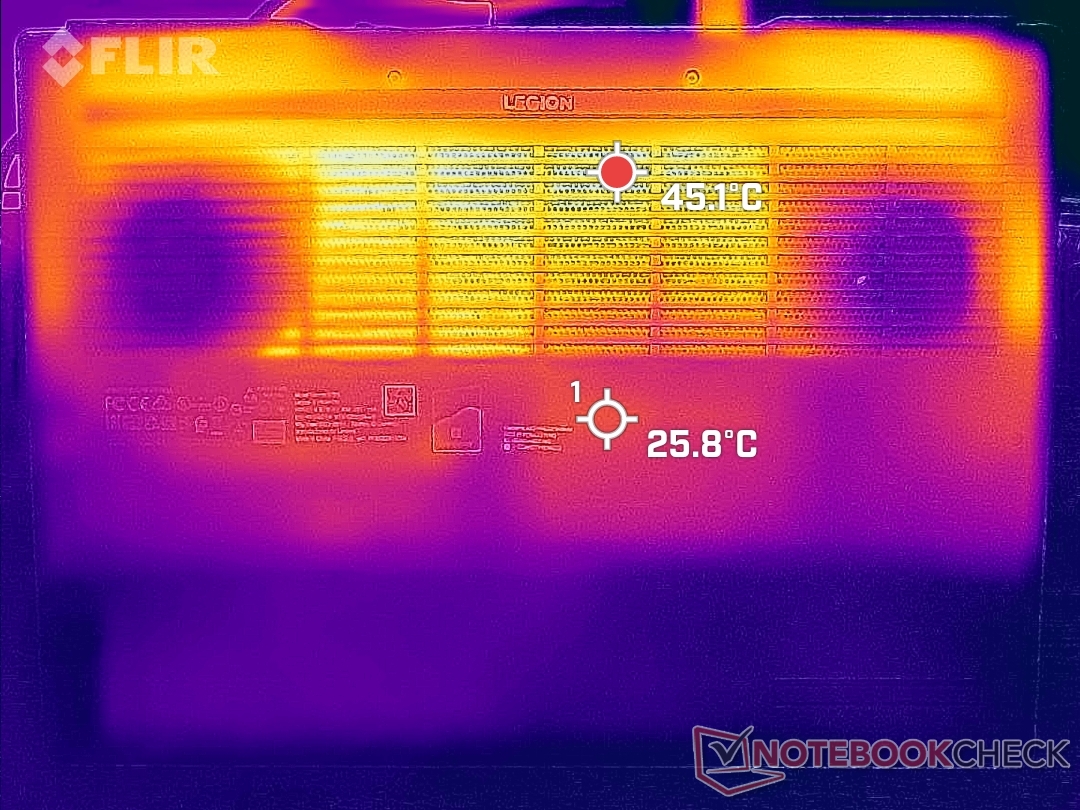
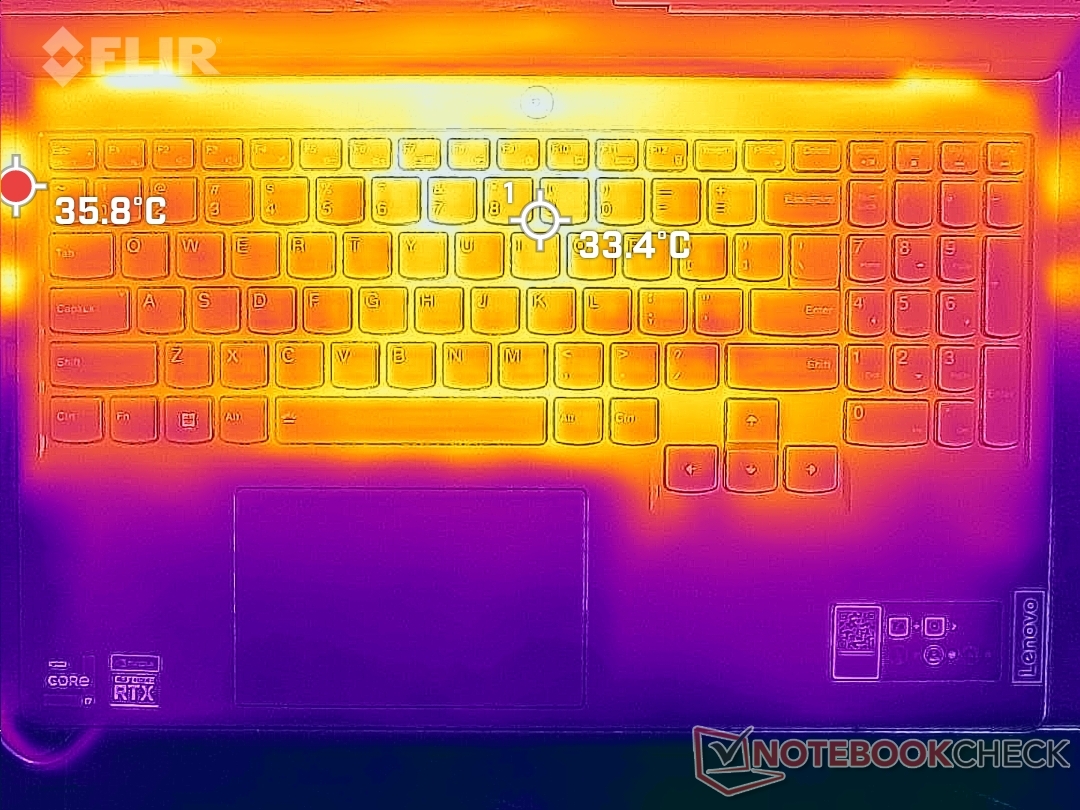
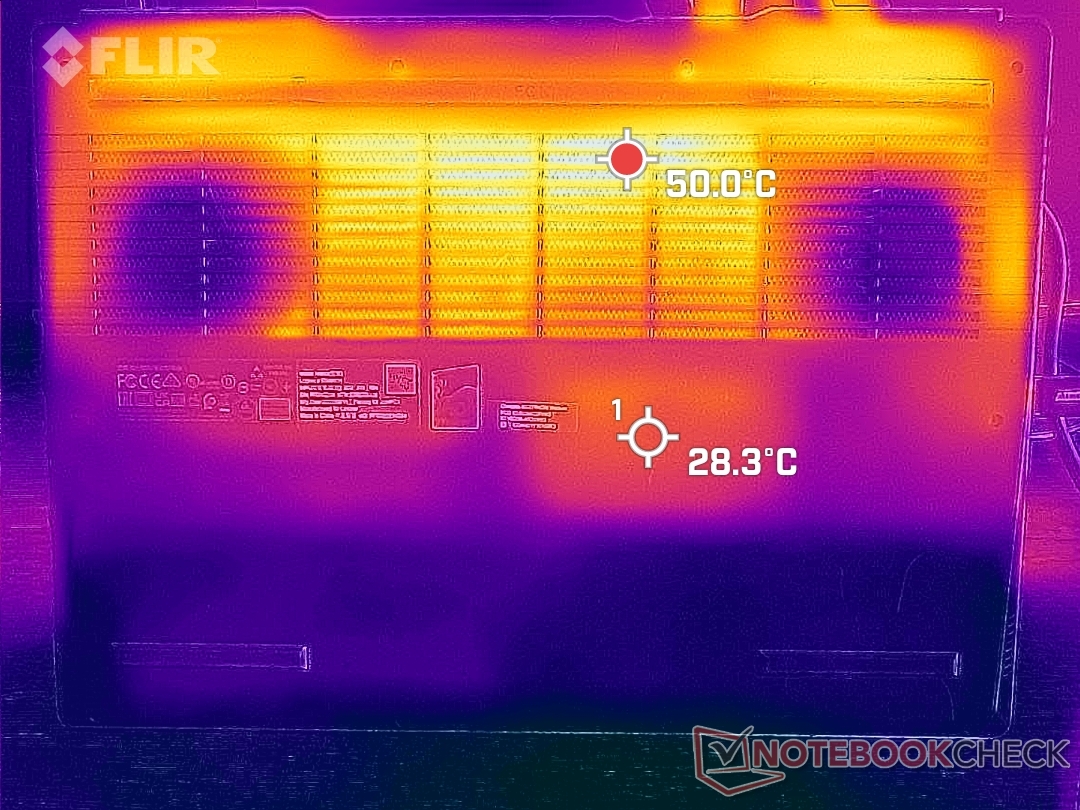
Temperatur
Yttemperaturerna är mycket varmare på botten där heta punkter kan nå över 50 C jämfört med endast 36 C på toppen när det körs krävande belastningar. Detta är ändå en förbättring jämfört med förra årets modell där temperaturen kan nå över 40 C på större delen av tangentbordet när man spelar.
De heta punkterna finns mot chassits bakre kant där hudkontakt är osannolik. Det finns ventilationsgaller på nästan hälften av chassiytan och därför bör användare vara försiktiga så att de inte blockerar något luftflöde.
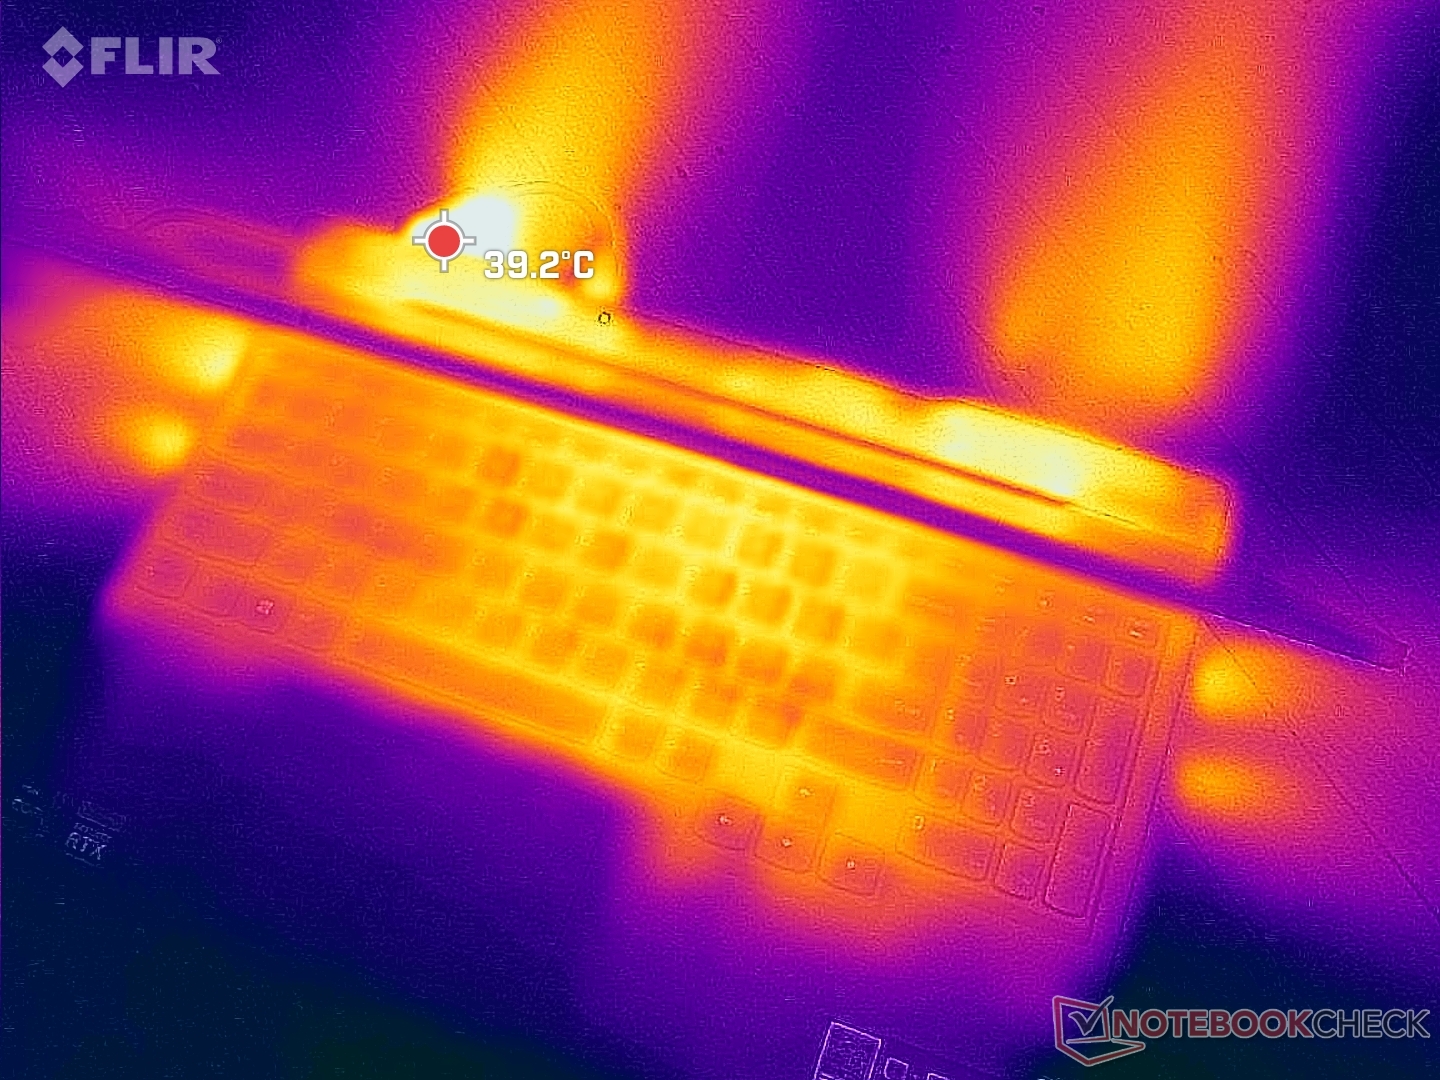
(+) Den maximala temperaturen på ovansidan är 37.8 °C / 100 F, jämfört med genomsnittet av 40.4 °C / 105 F , allt från 21.2 till 68.8 °C för klassen Gaming.
(-) Botten värms upp till maximalt 51 °C / 124 F, jämfört med genomsnittet av 43.2 °C / 110 F
(+) Vid tomgångsbruk är medeltemperaturen för ovansidan 23.8 °C / 75 F, jämfört med enhetsgenomsnittet på 33.9 °C / ### class_avg_f### F.
(+) När du spelar The Witcher 3 är medeltemperaturen för ovansidan 27.3 °C / 81 F, jämfört med enhetsgenomsnittet på 33.9 °C / ## #class_avg_f### F.
(+) Handledsstöden och pekplattan är kallare än hudtemperaturen med maximalt 23.8 °C / 74.8 F och är därför svala att ta på.
(+) Medeltemperaturen för handledsstödsområdet på liknande enheter var 28.8 °C / 83.8 F (+5 °C / 9 F).
| Lenovo Legion 5 15IAH7H 82RB Intel Core i7-12700H, NVIDIA GeForce RTX 3060 Laptop GPU | Lenovo Legion 5 15ACH-82JU00C6GE-FL AMD Ryzen 7 5800H, NVIDIA GeForce RTX 3060 Laptop GPU | MSI Bravo 15 B5DD-010US AMD Ryzen 5 5600H, AMD Radeon RX 5500M | Asus TUF Gaming F15 FX507ZM Intel Core i7-12700H, NVIDIA GeForce RTX 3060 Laptop GPU | Acer Aspire Nitro 5 AN515-55-57GF Intel Core i5-10300H, NVIDIA GeForce RTX 3060 Laptop GPU | Razer Blade 15 Base Edition 2021, i7-10750H RTX 3060 Intel Core i7-10750H, NVIDIA GeForce RTX 3060 Laptop GPU | |
|---|---|---|---|---|---|---|
| Heat | 0% | -20% | -25% | -6% | -19% | |
| Maximum Upper Side * (°C) | 37.8 | 42.6 -13% | 52.2 -38% | 44.4 -17% | 49 -30% | 45.2 -20% |
| Maximum Bottom * (°C) | 51 | 52.2 -2% | 48.6 5% | 48.8 4% | 51 -0% | 48 6% |
| Idle Upper Side * (°C) | 25.8 | 24.9 3% | 38 -47% | 37.8 -47% | 26 -1% | 34.4 -33% |
| Idle Bottom * (°C) | 28.8 | 25.3 12% | 28.4 1% | 39.6 -38% | 27 6% | 37.2 -29% |
* ... mindre är bättre
Stresstest
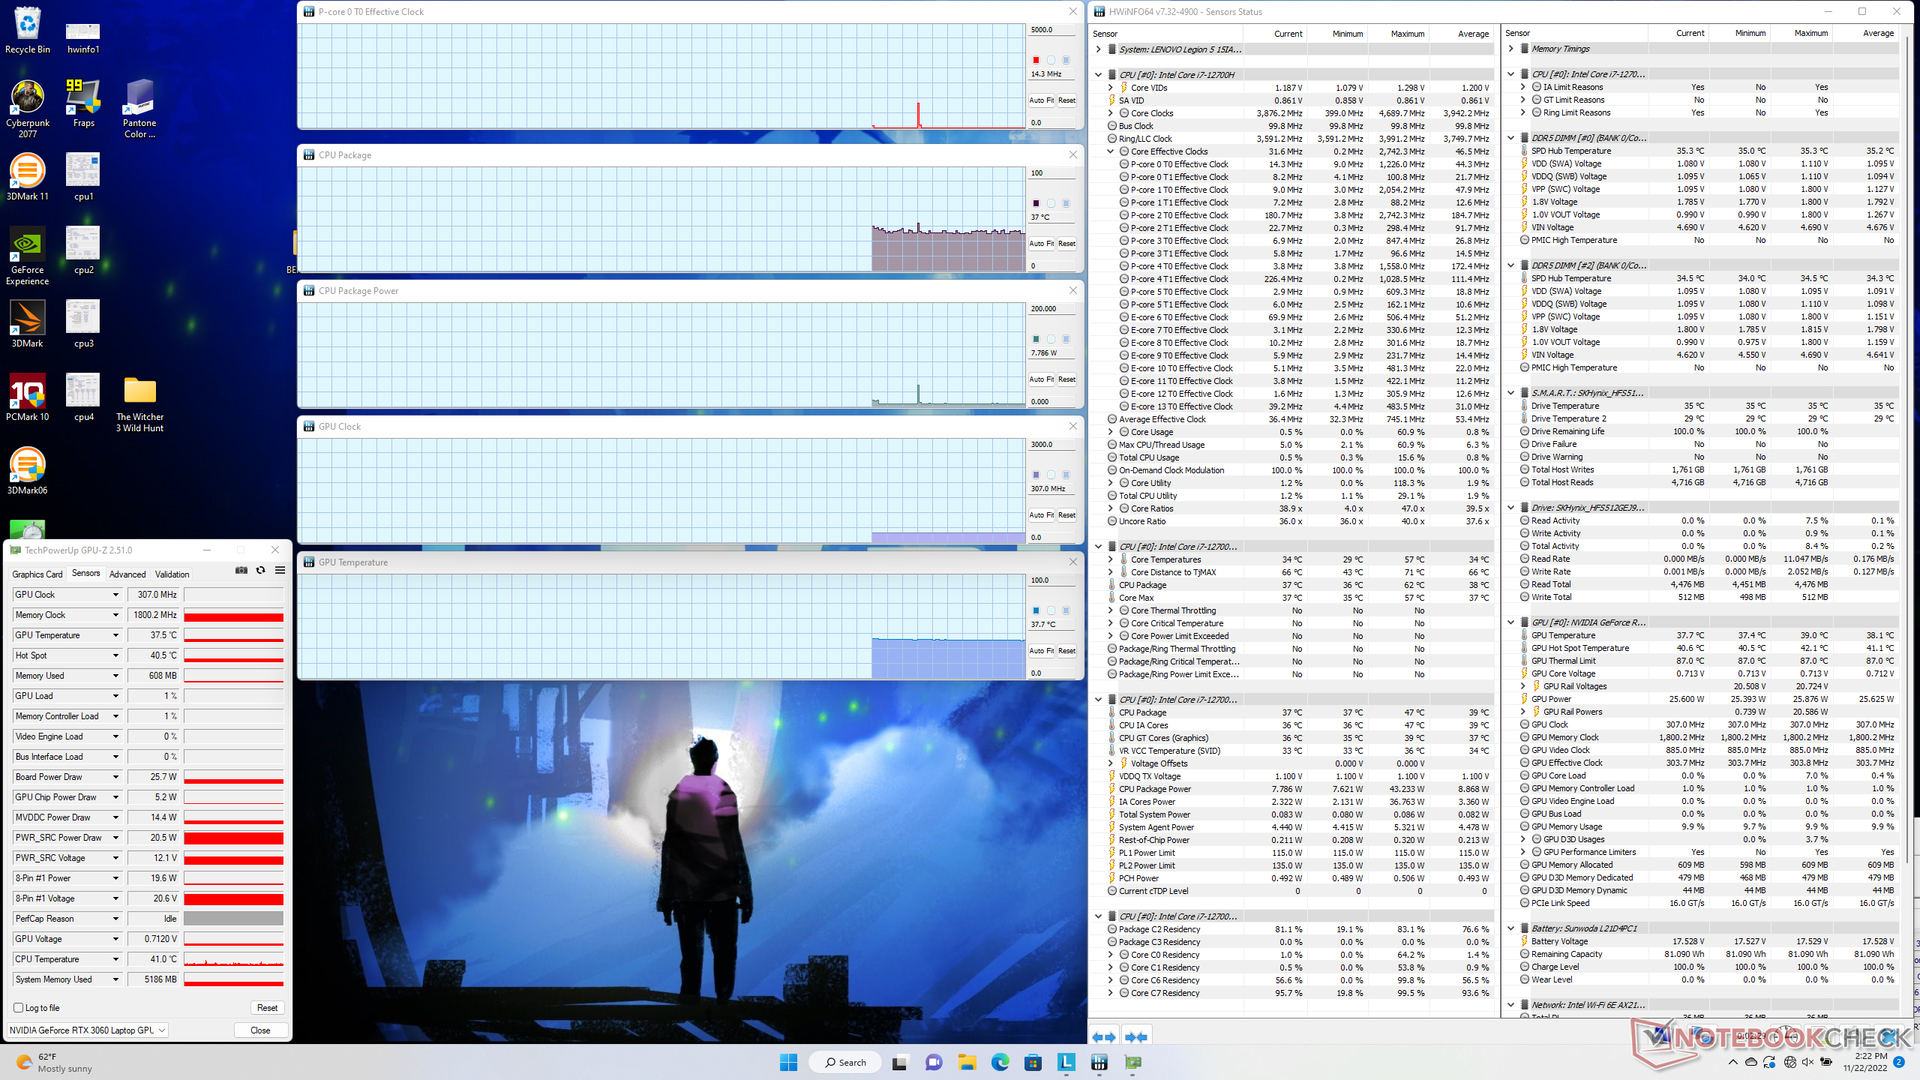
När Prime95 körs för att stressa processorn skulle klockfrekvensen och strömförbrukningen på kortet stiga till 4,1 GHz respektive 110 W, vilket varade i ungefär en minut. Processorn stabiliserades sedan vid 3,6 GHz, 101 W och 97 C därefter. Den mycket varma kärntemperaturen tyder på att processorn pressar gränserna för kylningslösningen mer än på andra bärbara datorer för spel för att pressa ytterligare prestanda. HP Envy 16 med samma Core i7-12700H-processor skulle till exempel stabilisera sig vid endast 2,1 GHz och 66 C när den utsätts för liknande testförhållanden i jämförelse.
Körning av Witcher 3 i läget Prestanda för att representera typiska spelbelastningar skulle Nvidias grafikkort stabiliseras vid 1972 MHz, 134 W strömförbrukning och 76 C. I läget Balanserat skulle grafikkortet istället stabiliseras vid 1665 MHz, 95 W och 70 C, vilket innebär ett 10-procentigt prestandaförlust, vilket beskrivs i avsnittet om grafikkortets prestanda ovan. Användare måste därför aktivera prestandaläget via Vantage-programvaran om de vill utnyttja GPU:n fullt ut.
Att köra på batteri begränsar prestandan. Ett Fire Strike -test på batterier skulle ge fysik- och grafikpoäng på 23698 respektive 12906 poäng, jämfört med 30779 respektive 22257 poäng på nätströmmen.
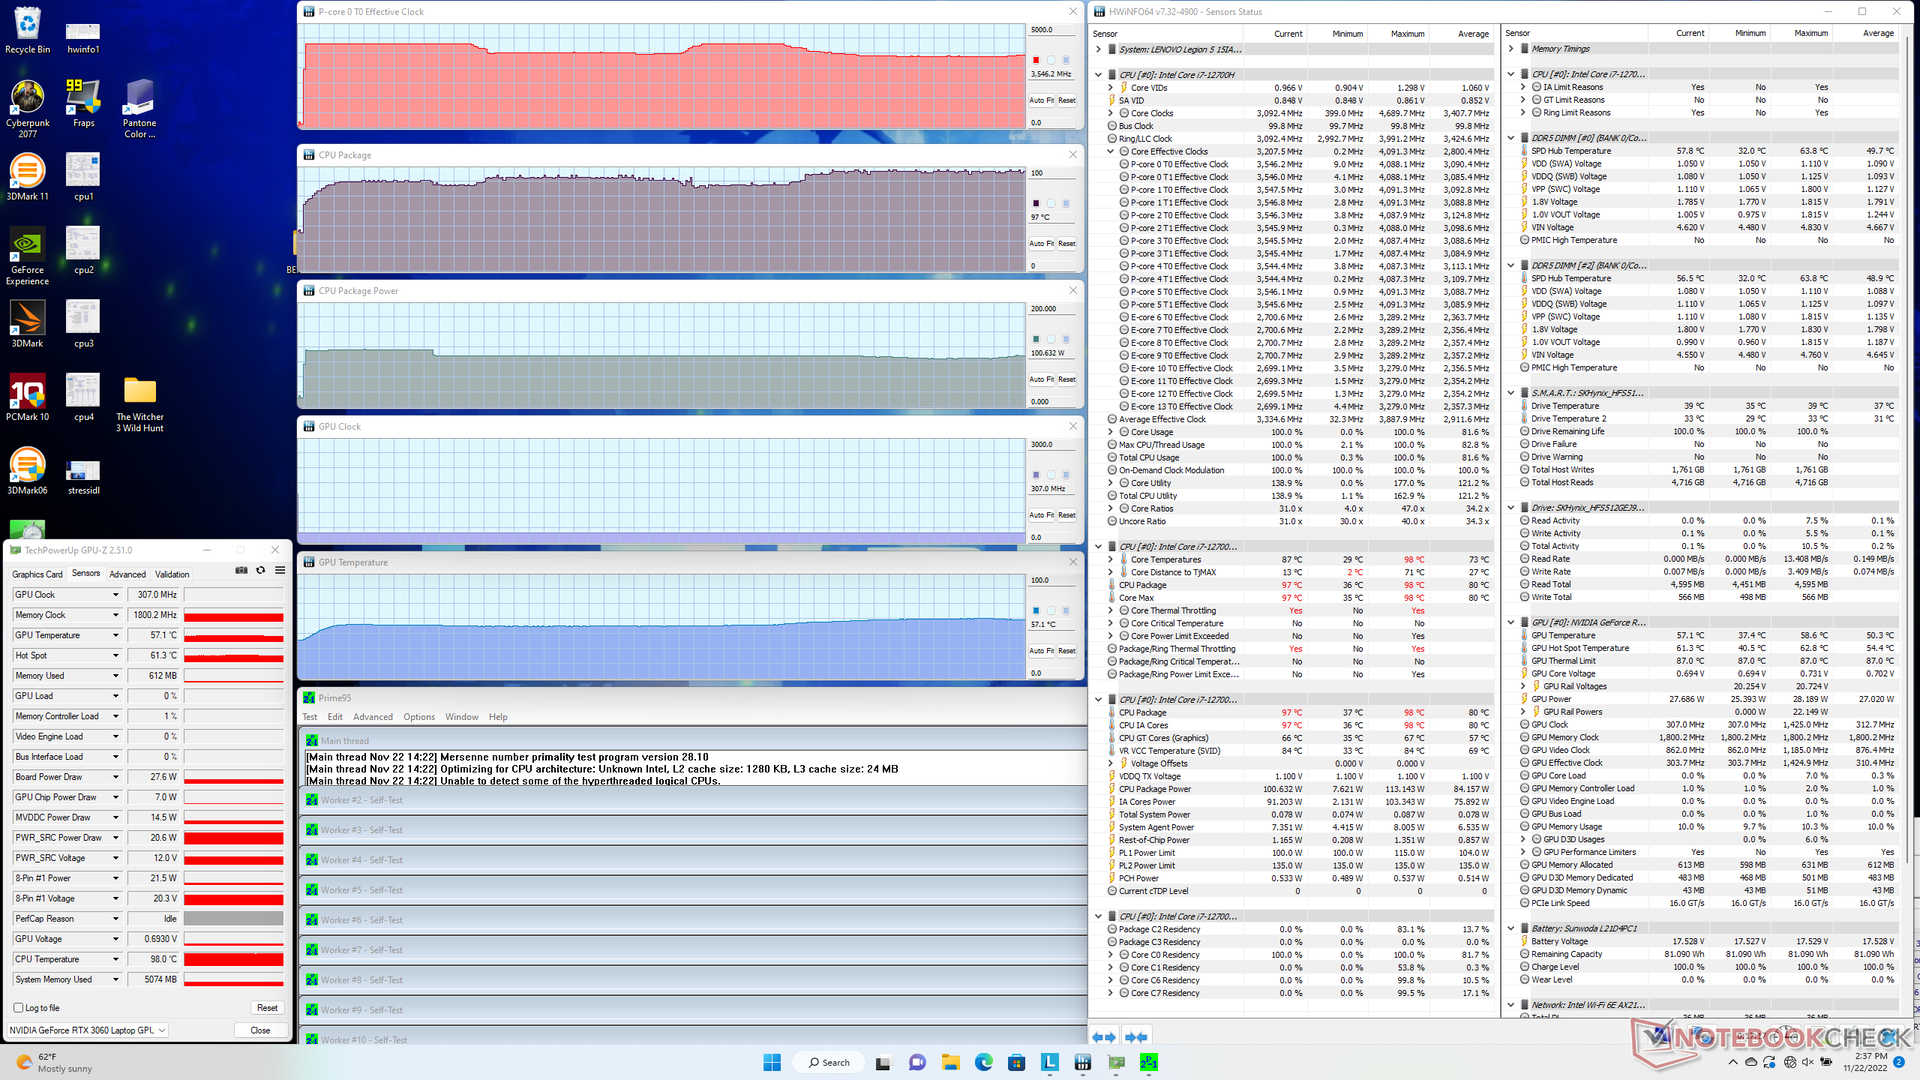
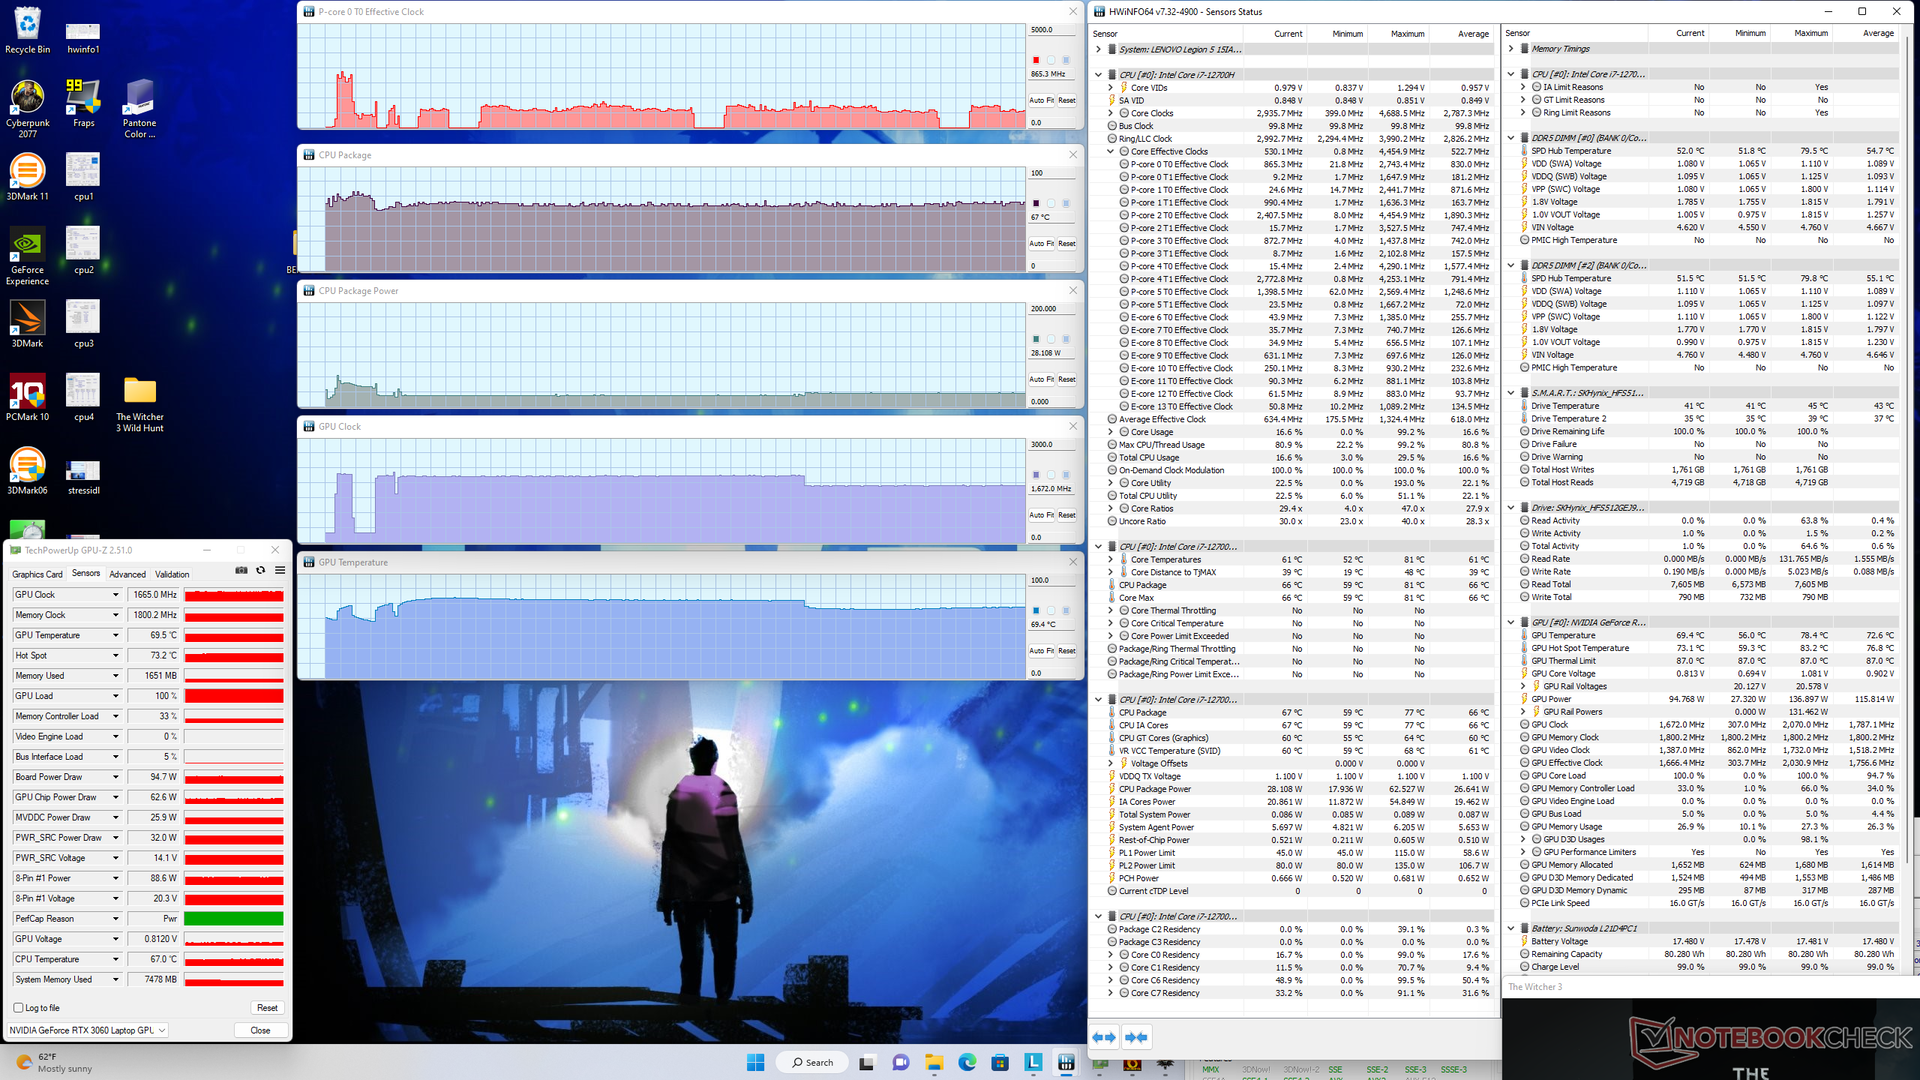
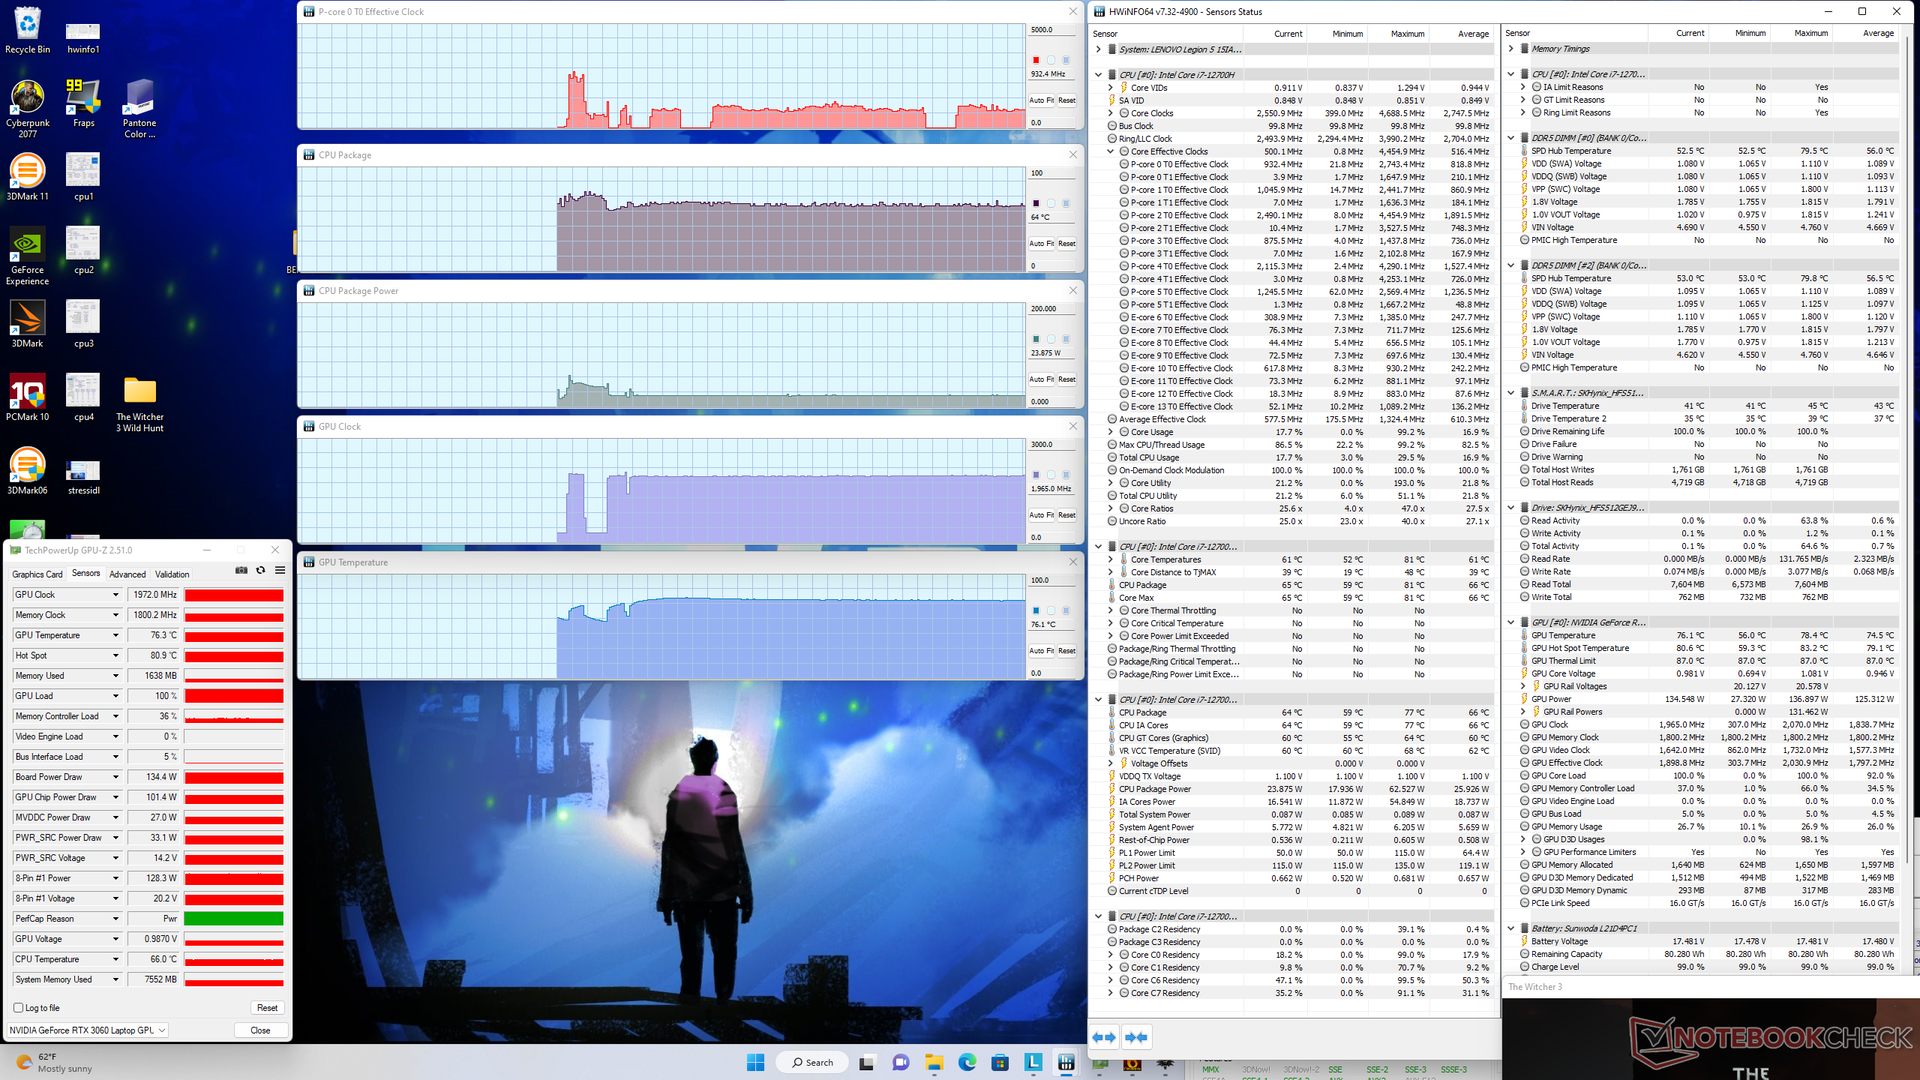
| CPU-klocka (GHz) | GPU-klocka (MHz) | Genomsnittlig CPU-temperatur (°C) | Genomsnittlig GPU-temperatur (°C) | |
| Systemets tomgång | -- | -- | 37 | 38 |
| Prime95 Stress | 3.6 - 3.8 | -- | 97 | 57 |
| Prime95 + FurMark Stress | 2,5 | 1597 - 2010 | 77 | 75 |
| Witcher 3 Stress (balanserat läge) | ~0,9 | 1665 | 67 | 70 |
| Witcher 3 Stress (prestationsläge) | ~0,9 | 1972 | 64 | 76 |
Högtalare
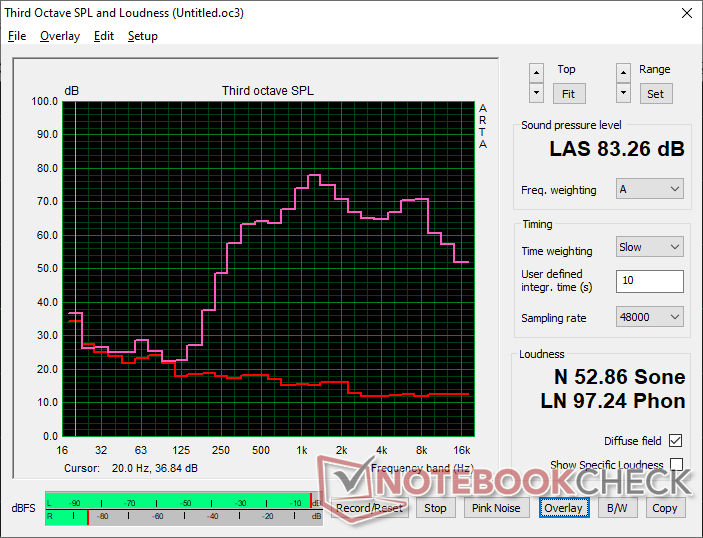
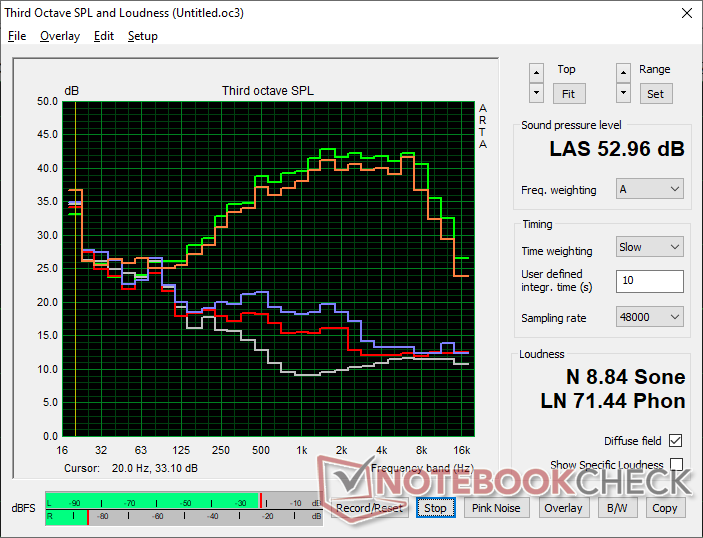
Lenovo Legion 5 15IAH7H 82RB ljudanalys
(+) | högtalare kan spela relativt högt (83.3 dB)
Bas 100 - 315 Hz
(-) | nästan ingen bas - i genomsnitt 28.2% lägre än medianen
(±) | linjäriteten för basen är genomsnittlig (12.9% delta till föregående frekvens)
Mellan 400 - 2000 Hz
(±) | högre mellan - i genomsnitt 5.7% högre än median
(±) | linjäriteten för mids är genomsnittlig (7.4% delta till föregående frekvens)
Högsta 2 - 16 kHz
(+) | balanserade toppar - endast 3.3% från medianen
(+) | toppar är linjära (6.4% delta till föregående frekvens)
Totalt 100 - 16 000 Hz
(±) | linjäriteten för det totala ljudet är genomsnittlig (23.6% skillnad mot median)
Jämfört med samma klass
» 86% av alla testade enheter i den här klassen var bättre, 4% liknande, 10% sämre
» Den bästa hade ett delta på 6%, genomsnittet var 18%, sämst var 132%
Jämfört med alla testade enheter
» 71% av alla testade enheter var bättre, 6% liknande, 23% sämre
» Den bästa hade ett delta på 4%, genomsnittet var 23%, sämst var 134%
Apple MacBook Pro 16 2021 M1 Pro ljudanalys
(+) | högtalare kan spela relativt högt (84.7 dB)
Bas 100 - 315 Hz
(+) | bra bas - bara 3.8% från medianen
(+) | basen är linjär (5.2% delta till föregående frekvens)
Mellan 400 - 2000 Hz
(+) | balanserad mellan - endast 1.3% från medianen
(+) | mids är linjära (2.1% delta till föregående frekvens)
Högsta 2 - 16 kHz
(+) | balanserade toppar - endast 1.9% från medianen
(+) | toppar är linjära (2.7% delta till föregående frekvens)
Totalt 100 - 16 000 Hz
(+) | det totala ljudet är linjärt (4.6% skillnad mot median)
Jämfört med samma klass
» 0% av alla testade enheter i den här klassen var bättre, 0% liknande, 100% sämre
» Den bästa hade ett delta på 5%, genomsnittet var 17%, sämst var 45%
Jämfört med alla testade enheter
» 0% av alla testade enheter var bättre, 0% liknande, 100% sämre
» Den bästa hade ett delta på 4%, genomsnittet var 23%, sämst var 134%
Energihantering - krävande vid hög CPU-belastning
Effektförbrukning
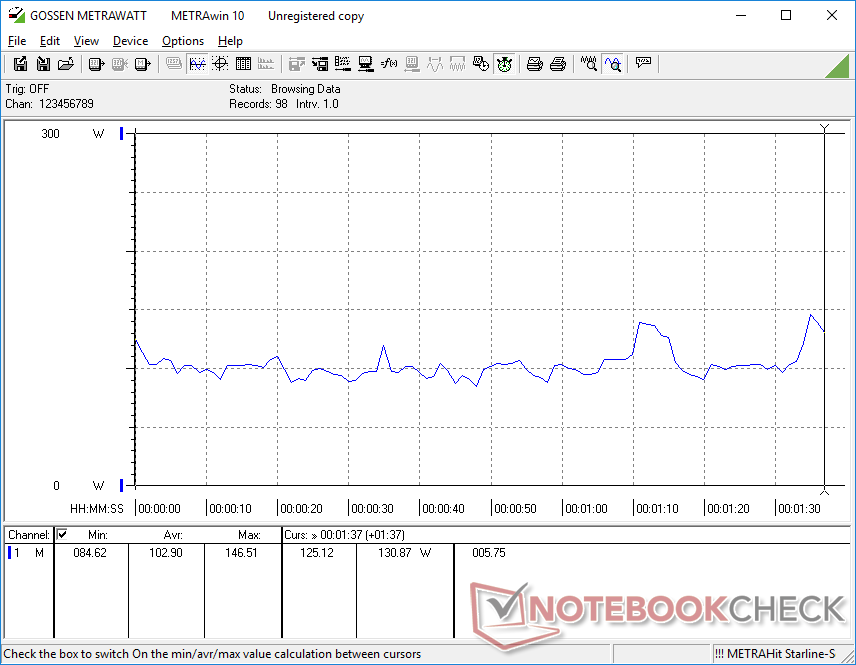
Systemet är ovanligt krävande när det ligger på tomgång på skrivbordet. Strömförbrukningen varierar mellan 20 W vid lägsta ljusstyrka och strömprofil med hybridgrafik och 49 W vid högsta ljusstyrka och strömprofil med dGPU aktiv. I motsats till detta skulle 2021-modellen i stället ligga mellan 7 W och 16 W.
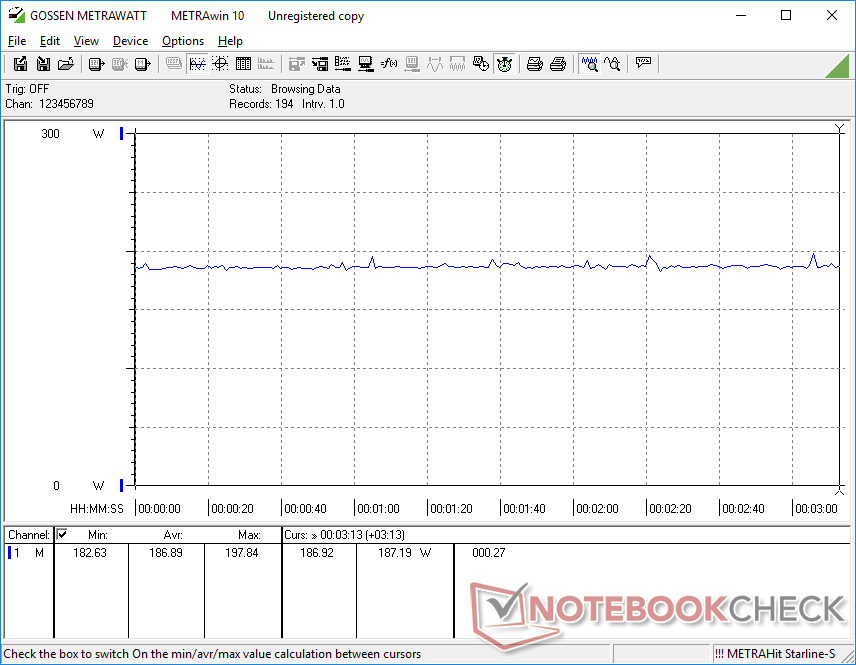
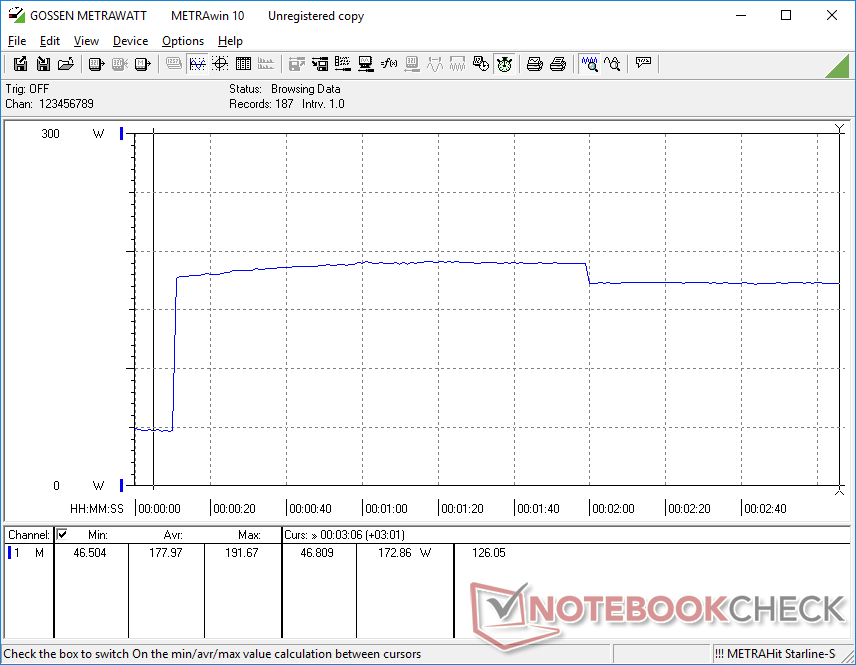
Kör Witcher 3 kräver cirka 187 W jämfört med 175 W på förra årets modell, vilket nära korrelerar med det 10 W högre TGP-målet för vår 2022-modell.
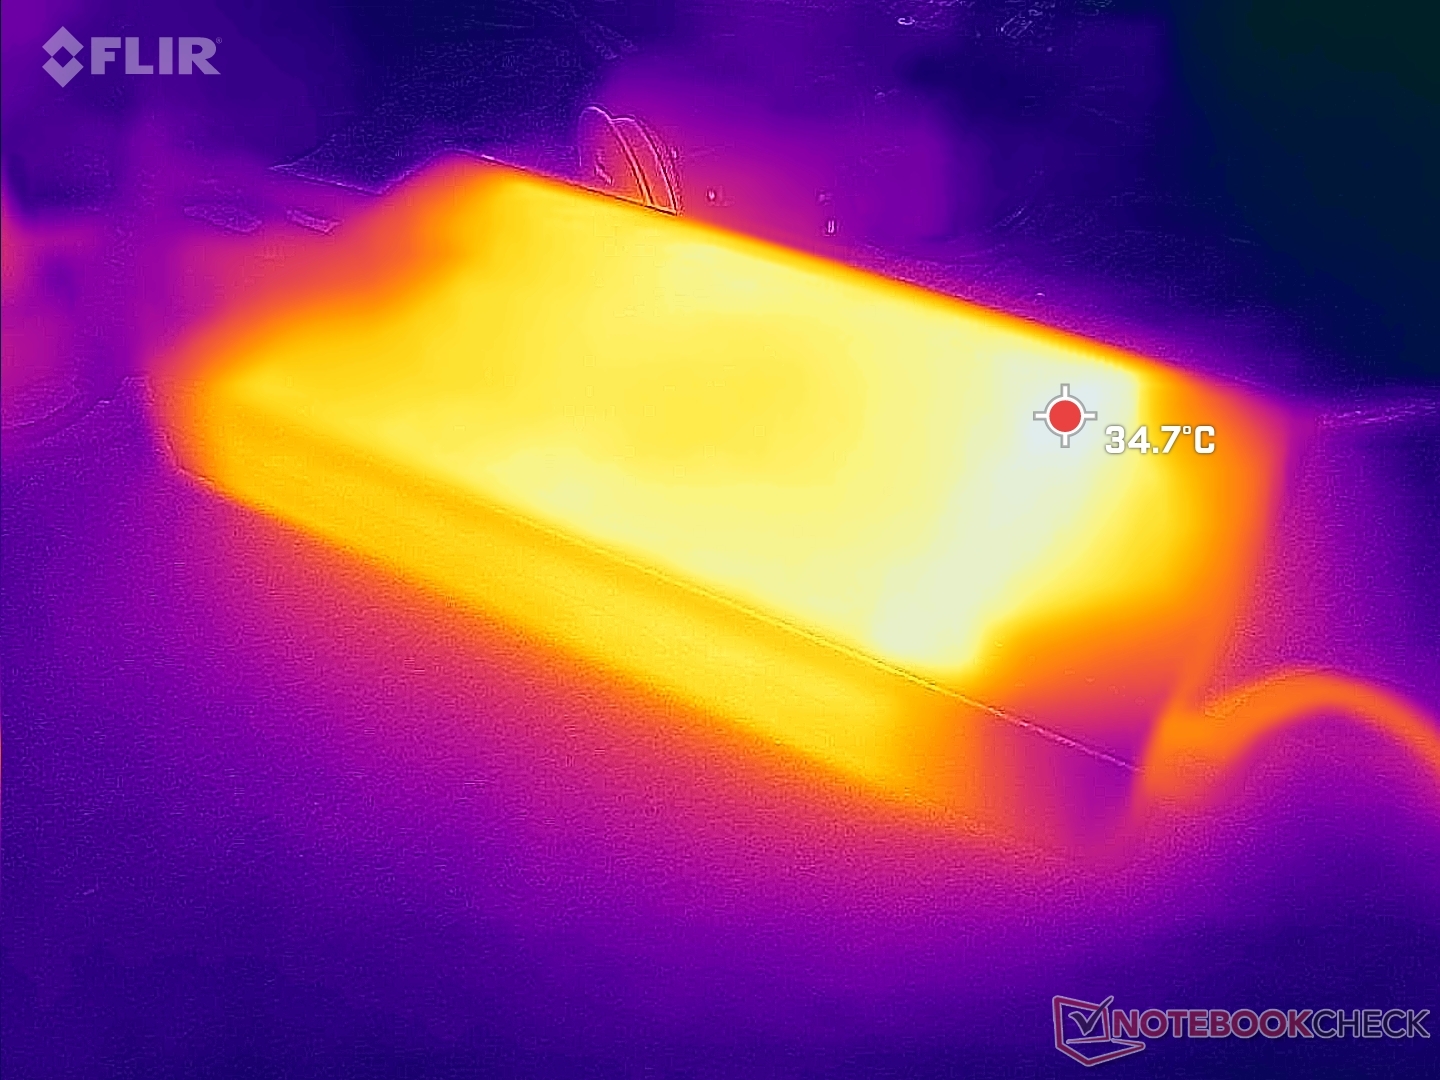
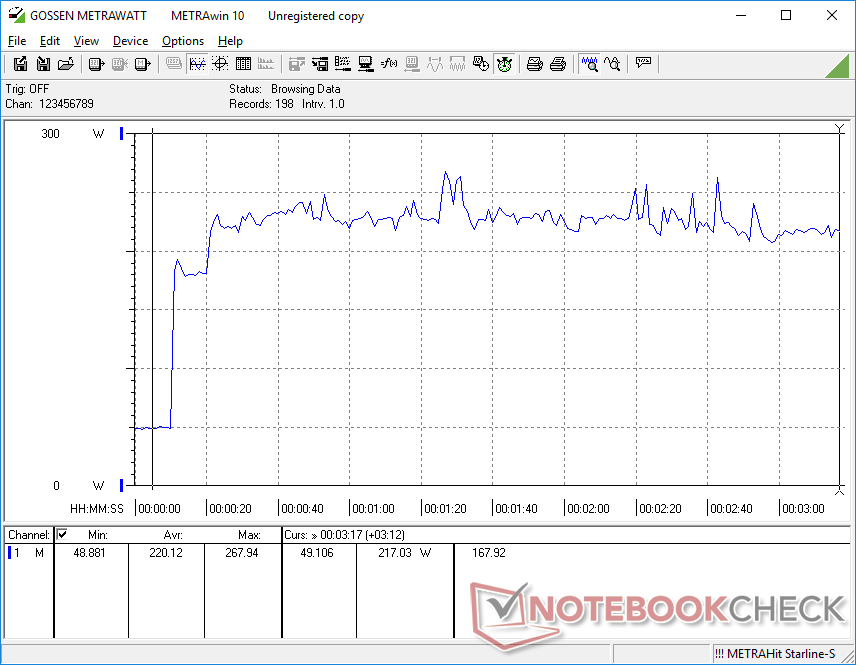
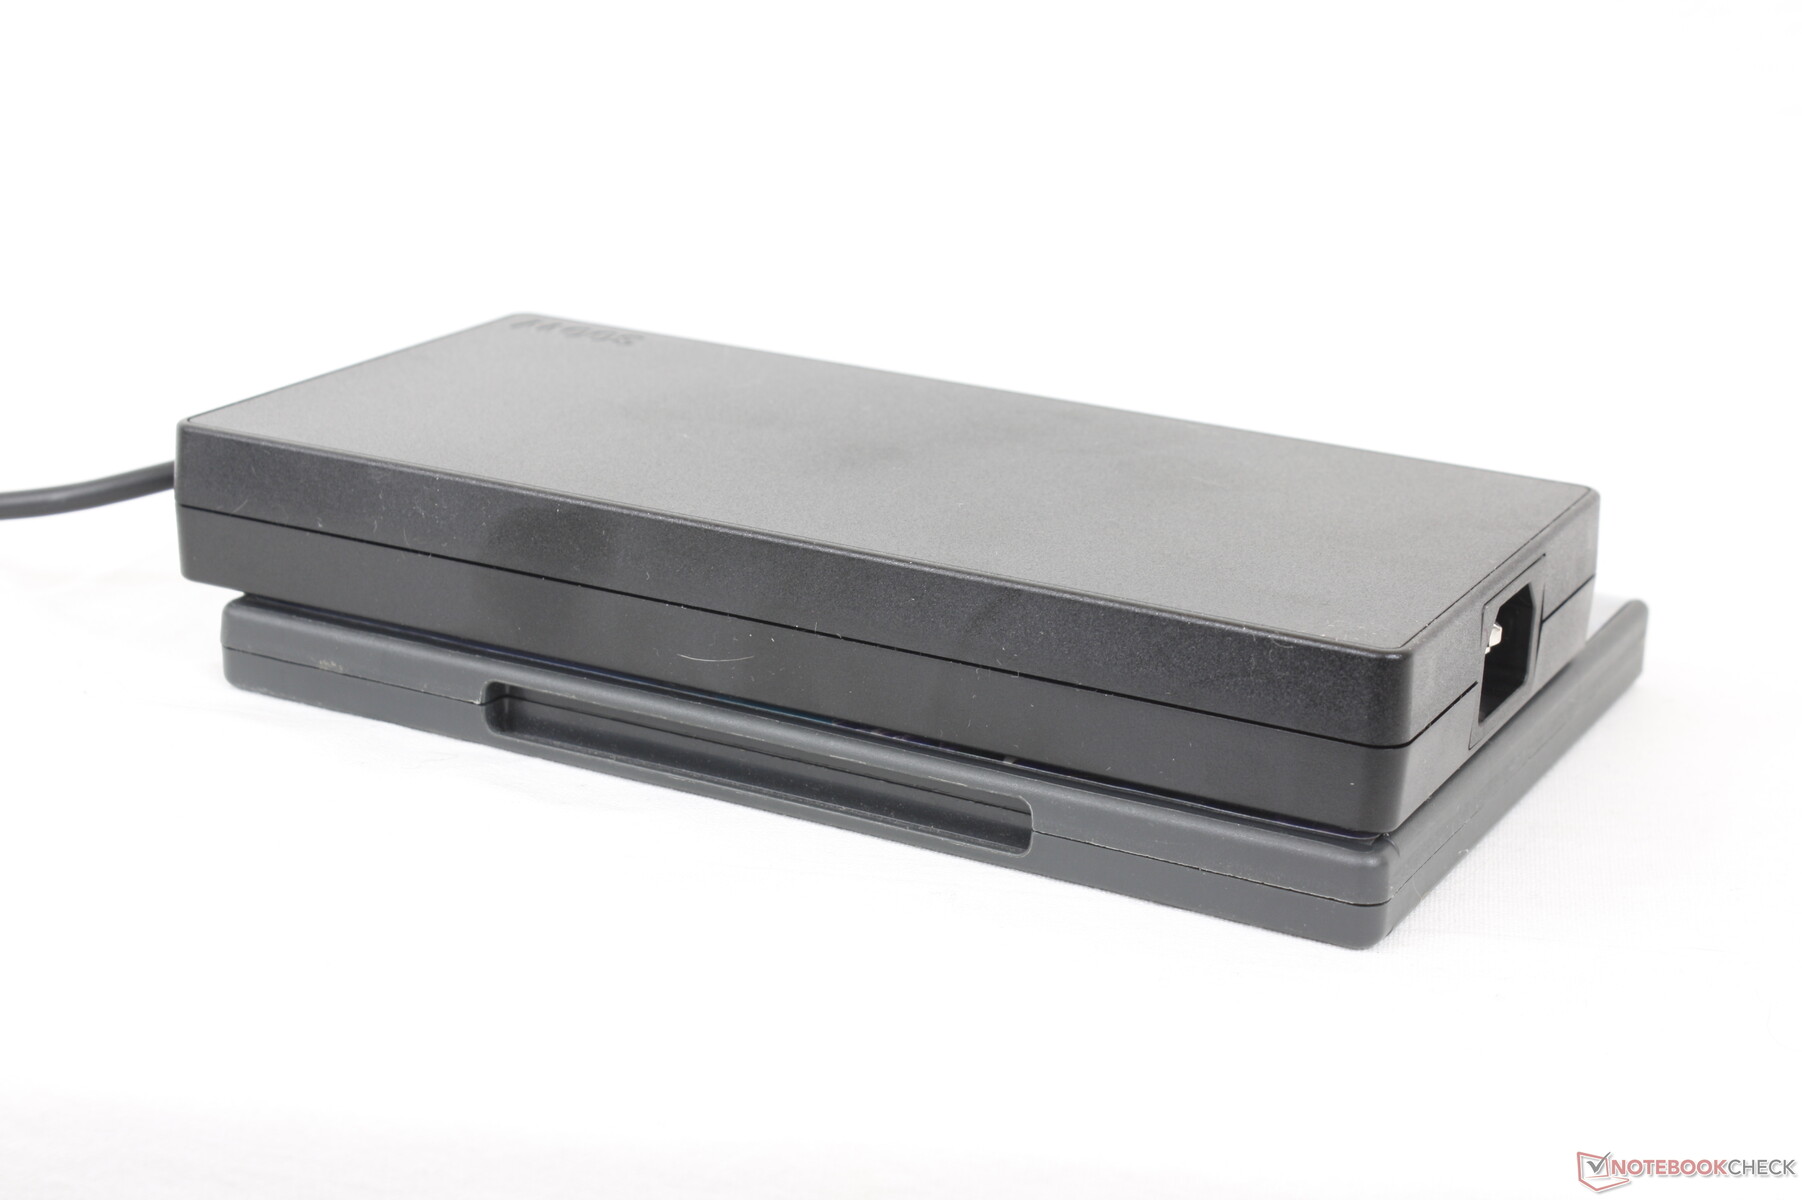
Vi kan registrera ett maximalt uttag på 268 W från den stora (~19,8 x 9,8 x 2,5 cm) 300 W AC-adaptern när både CPU och GPU är 100 procent utnyttjade. Detta maximum är högre än på de flesta andra bärbara speldatorer som körs på AMD- eller 10:e/11:e generationens Intel-plattformar eftersom 12:e generationens Core-serie är mycket mer krävande.
| Av/Standby | |
| Låg belastning | |
| Hög belastning |
|
Förklaring:
min: | |
| Lenovo Legion 5 15IAH7H 82RB i7-12700H, GeForce RTX 3060 Laptop GPU, , IPS, 1920x1080, 15.6" | Lenovo Legion 5 15ACH-82JU00C6GE-FL R7 5800H, GeForce RTX 3060 Laptop GPU, Micron 2300 512GB MTFDHBA512TDV, , 1920x1080, 15.6" | MSI Bravo 15 B5DD-010US R5 5600H, Radeon RX 5500M, Kingston OM8PCP3512F-AB, IPS, 1920x1080, 15.6" | Asus TUF Gaming F15 FX507ZM i7-12700H, GeForce RTX 3060 Laptop GPU, SK Hynix HFM001TD3JX013N, IPS, 1920x1080, 15.6" | Acer Aspire Nitro 5 AN515-55-57GF i5-10300H, GeForce RTX 3060 Laptop GPU, WDC PC SN530 SDBPNPZ-512G, IPS, 1920x1080, 15.6" | Razer Blade 15 Base Edition 2021, i7-10750H RTX 3060 i7-10750H, GeForce RTX 3060 Laptop GPU, Samsung SSD PM981a MZVLB512HBJQ, IPS, 1920x1080, 15.6" | |
|---|---|---|---|---|---|---|
| Power Consumption | 34% | 53% | 31% | 49% | 29% | |
| Idle Minimum * (Watt) | 19.8 | 7.3 63% | 6.6 67% | 6.3 68% | 5 75% | 11.7 41% |
| Idle Average * (Watt) | 26.2 | 10.5 60% | 9.8 63% | 9.8 63% | 9 66% | 16 39% |
| Idle Maximum * (Watt) | 48.2 | 15.7 67% | 10.8 78% | 26.5 45% | 13 73% | 29.3 39% |
| Load Average * (Watt) | 102.9 | 108 -5% | 70.5 31% | 103.8 -1% | 84 18% | 95.6 7% |
| Witcher 3 ultra * (Watt) | 186.7 | 175 6% | 103.2 45% | 189 -1% | 125 33% | 141.3 24% |
| Load Maximum * (Watt) | 268 | 228 15% | 175 35% | 241.9 10% | 190 29% | 197 26% |
* ... mindre är bättre
Power Consumption Witcher 3 / Stresstest
Power Consumption external Monitor
Batteritid
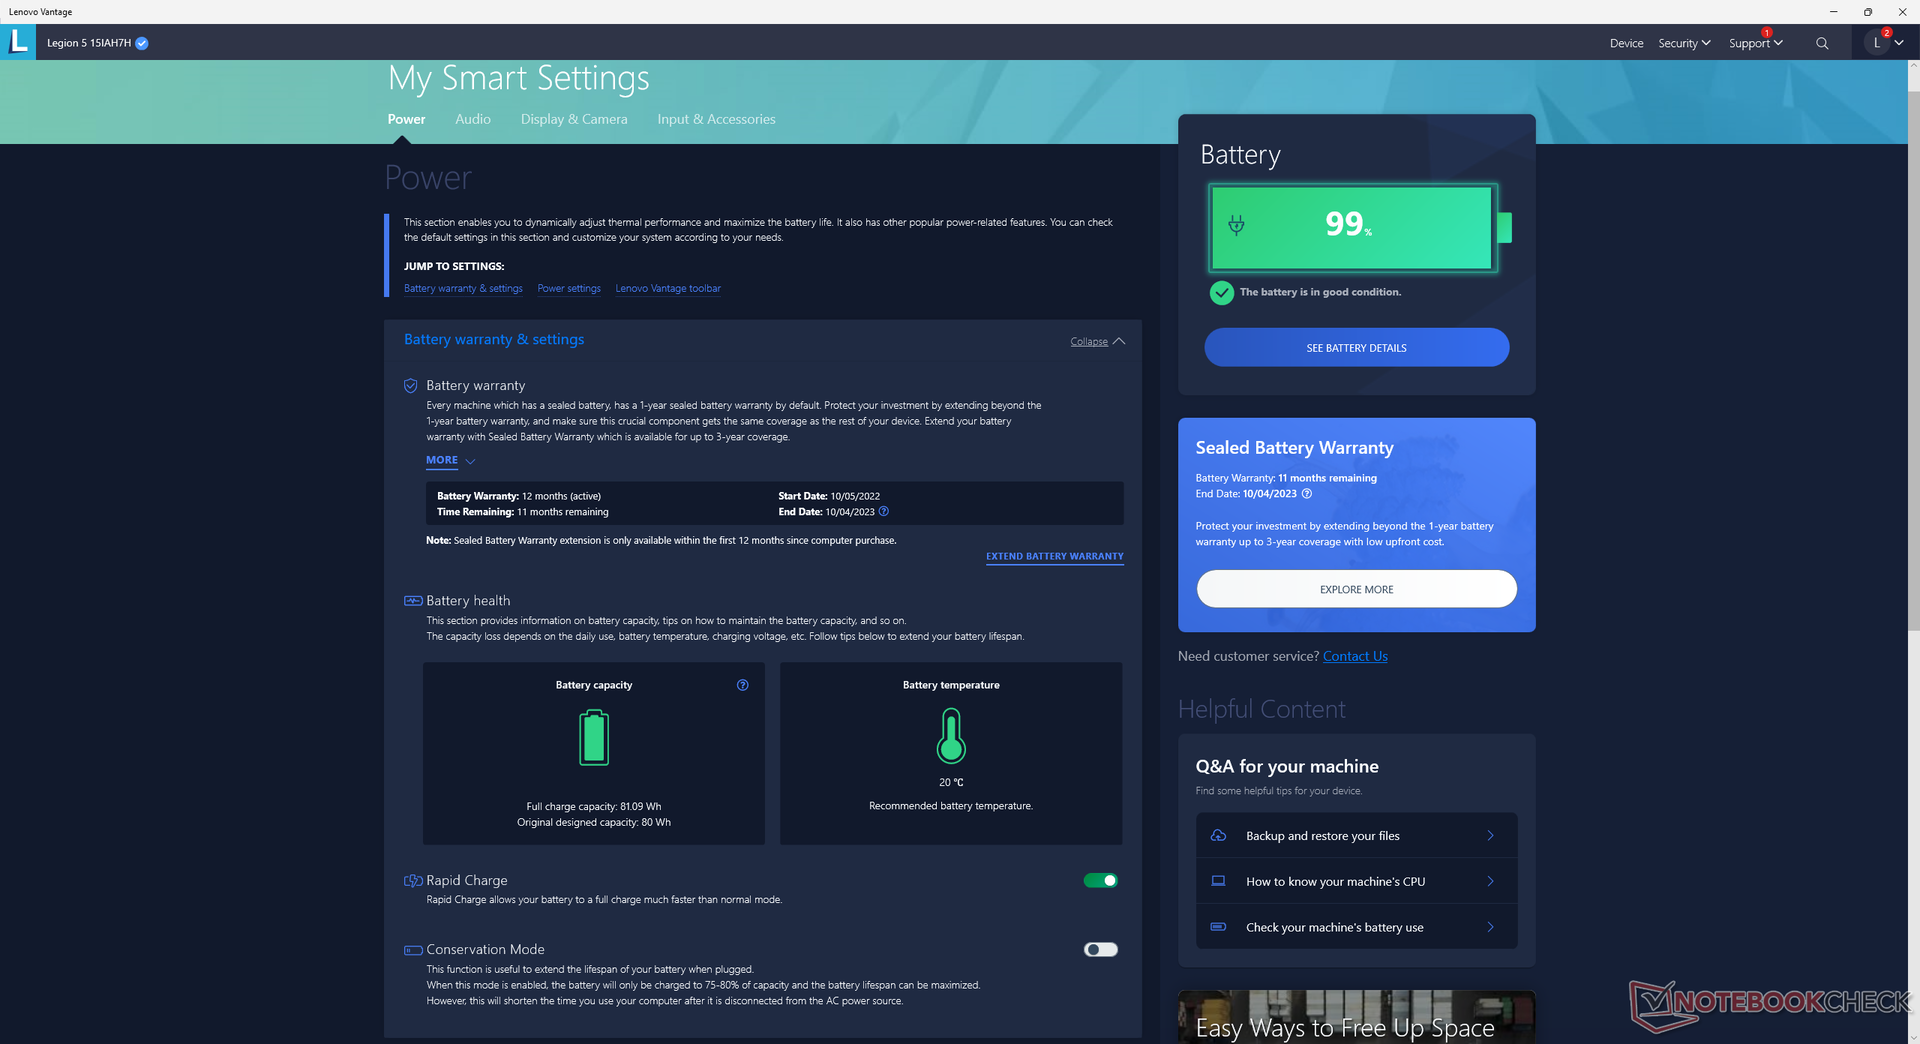
WLAN-drifttiden är ungefär densamma som på förra årets modell eftersom batterikapaciteten fortfarande är 80 Wh. Det tar bara 35 minuter att ladda från tom till full kapacitet när Rapid Charge är aktiverat, jämfört med 1,5 till 2 timmar för de flesta andra bärbara datorer.
USB-C-laddning stöds endast via den bakre USB-C-porten. Laddningen kan dock endast vara kompatibel med Lenovos USB-C-laddare (tillval) och inte med de flesta tredjeparts laddare. Vi provade tre separata USB-C-laddare (30 W, 100 W och 130 W), men endast 130 W-laddaren från Lenovo fungerade.
Vissa SKU:er levereras med ett mindre 60 Wh-batteri i stället för vårt 80 Wh-batteri.
| Lenovo Legion 5 15IAH7H 82RB i7-12700H, GeForce RTX 3060 Laptop GPU, 80 Wh | Lenovo Legion 5 15ACH-82JU00C6GE-FL R7 5800H, GeForce RTX 3060 Laptop GPU, 80 Wh | MSI Bravo 15 B5DD-010US R5 5600H, Radeon RX 5500M, 53 Wh | Asus TUF Gaming F15 FX507ZM i7-12700H, GeForce RTX 3060 Laptop GPU, 90 Wh | Acer Aspire Nitro 5 AN515-55-57GF i5-10300H, GeForce RTX 3060 Laptop GPU, 57.5 Wh | Razer Blade 15 Base Edition 2021, i7-10750H RTX 3060 i7-10750H, GeForce RTX 3060 Laptop GPU, 65 Wh | |
|---|---|---|---|---|---|---|
| Batteridrifttid | 30% | 10% | 30% | 25% | 9% | |
| Reader / Idle (h) | 8.1 | 9.2 14% | 15.8 95% | 7.8 -4% | ||
| WiFi v1.3 (h) | 5 | 4.8 -4% | 6.3 26% | 4.8 -4% | 5.7 14% | 4.8 -4% |
| Load (h) | 1.1 | 1.8 64% | 1 -9% | 1.1 0% | 1.5 36% | 1.5 36% |
| H.264 (h) | 4.3 | 6.2 |
För
Emot
Omdöme - Stor storlek, stor prestanda
Den mest överraskande aspekten av 2022 Legion 5 15 är dess snabbare prestanda än genomsnittet. Även om vi redan har testat många bärbara datorer för spel med den Core i7-12700H CPU och GeForce RTX 3060 GPU, körs den här Lenovo-modellen med märkbart högre klockfrekvenser för högre prestanda än många konkurrenter som är utrustade med samma hårdvara. Om du är orolig för att av misstag köpa en bärbar dator med underklockad hårdvara kommer Legion 5 15 att undanröja alla sådana bekymmer.
2022 års Lenovo Legion 5 15 utmärker sig genom att maximera prestandan i ett nästan halvprofessionellt chassi med minimalt med RGB-lampor. Den är dock ganska stor och tung, och ett par aspekter skulle kunna förbättras.
Den extra prestandan kommer till priset av ett tyngre och större chassi. Den stora utskjutande baksidan är svår att ignorera och konkurrenter som Asus TUF Gaming F15 FX507ZM eller Razer Blade 15 Base Model är alla märkbart lättare. Om du reser mycket kanske den högre prestandan inte är värd den tyngre vikten. Den skrymmande 300 W AC-adaptern gör inte heller Lenovo särskilt resevänlig.
För framtida modeller skulle vi vilja se förbättringar av den svampiga klickplattan, den pixliga webbkamerakvaliteten, det dåliga stödet för USB-C-laddning från tredje part och de små gångjärnen. Särskilt det sistnämnda skulle hjälpa till att rättfärdiga det tyngre chassit jämfört med konkurrenterna.
Pris och tillgänglighet
Lenovo levererar nu sin Legion 5 15-serie som börjar kosta mellan 1 100 och 1 900 dollar beroende på konfiguration. Vår specifika konfiguration för recensionen levereras för närvarande för 1350 dollar.
Lenovo Legion 5 15IAH7H 82RB
- 11/25/2022 v7 (old)
Allen Ngo
Price comparison

