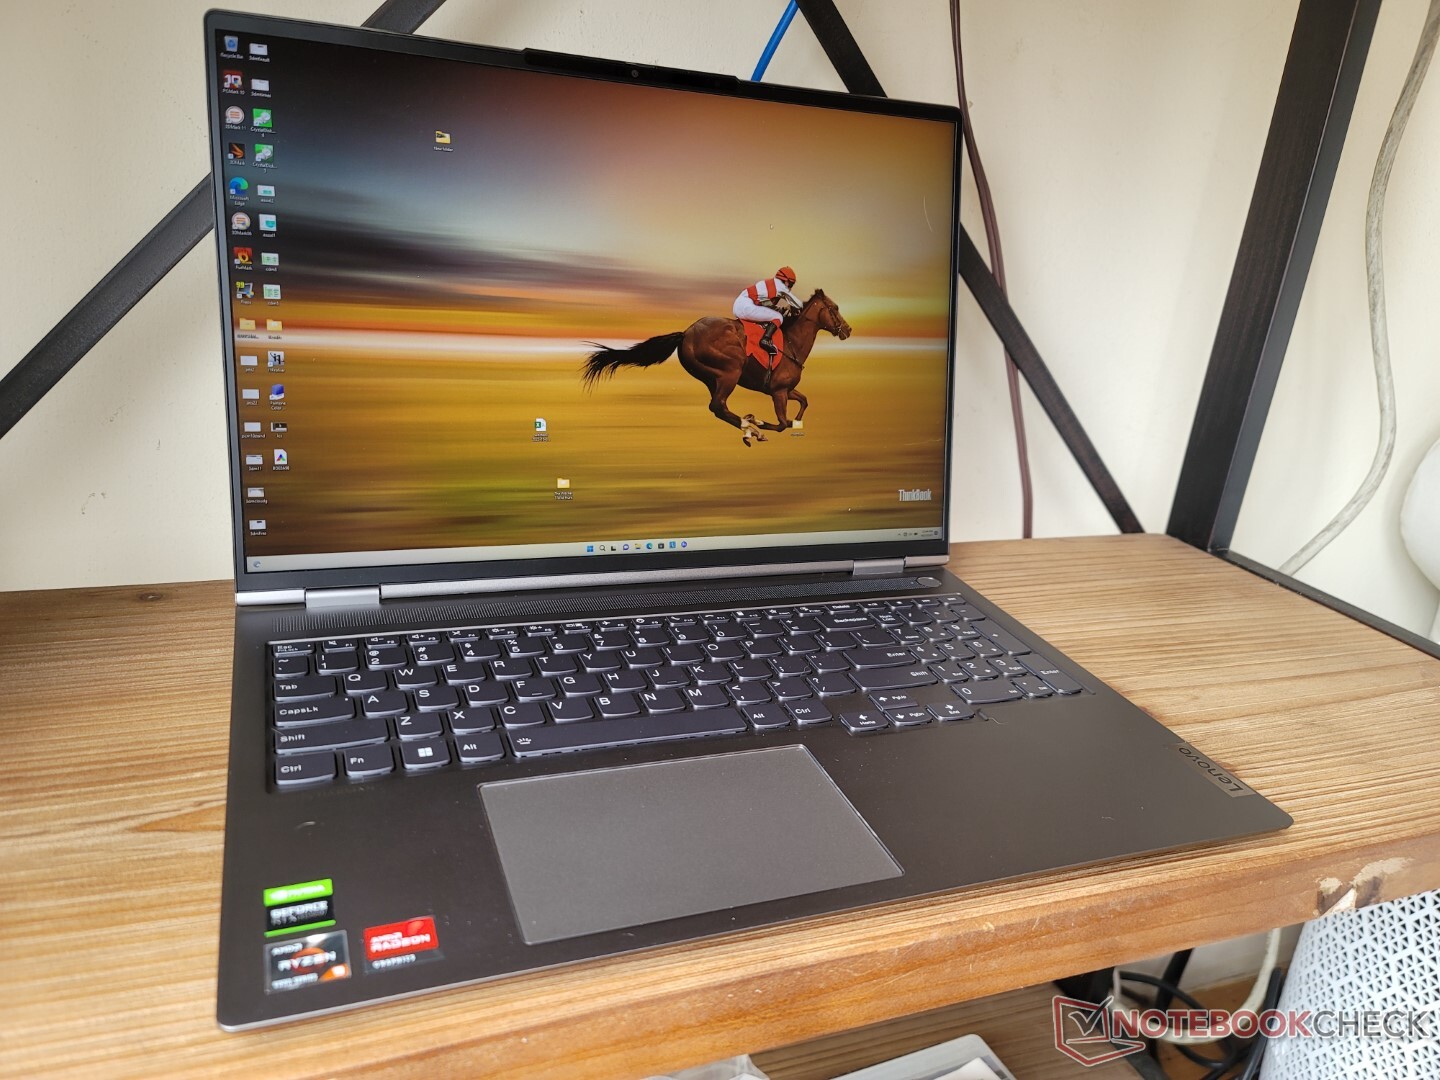
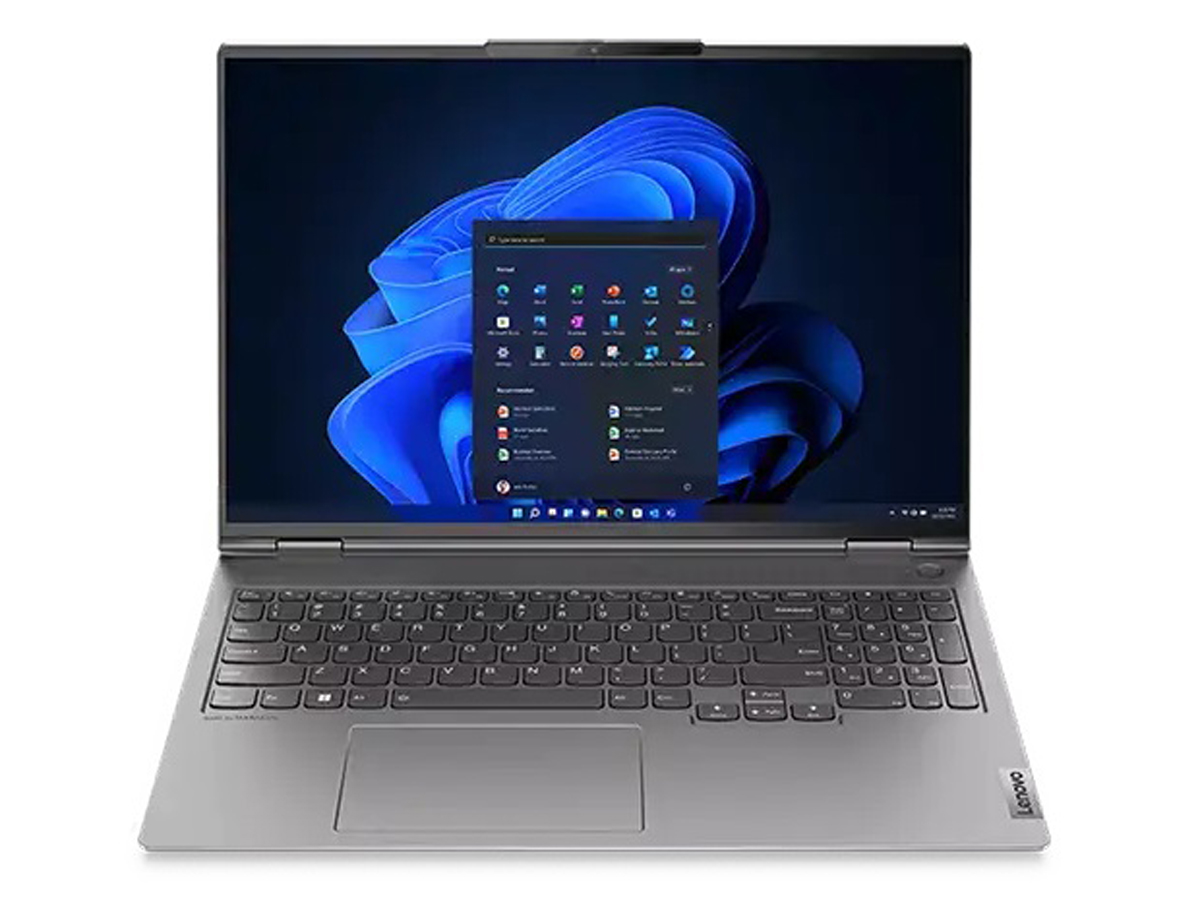
Recension av den bärbara datorn Lenovo ThinkBook 16p Gen 3 ARH: Dell XPS 15-utmanaren

Den 16-tums ThinkBook 16p Gen 3 är efterföljaren till förra årets ThinkBook 16p Gen 2. Den kommer med uppgraderade AMD Zen 3+ CPU-alternativ som ersätter Zen 3-serien i 2021 års modell. Det finns även andra mindre skillnader som förklaras i den här recensionen, men 2022-modellen är annars visuellt identisk med 2021-modellen. Vi rekommenderar därför att du kollar in vår recension av den ThinkBook 16p Gen 2 för att lära dig mer om de fysiska egenskaperna hos Gen 3
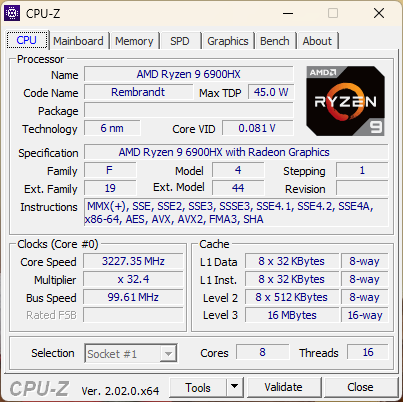
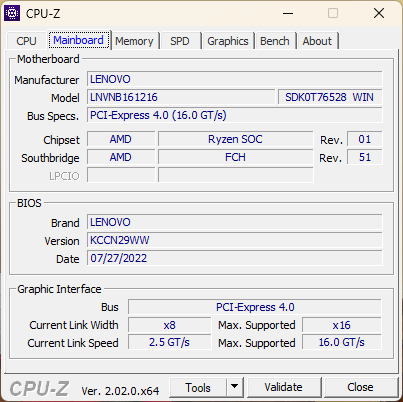
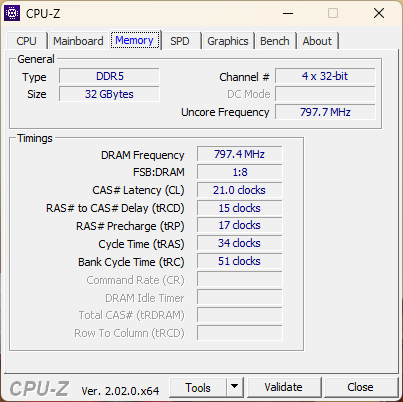
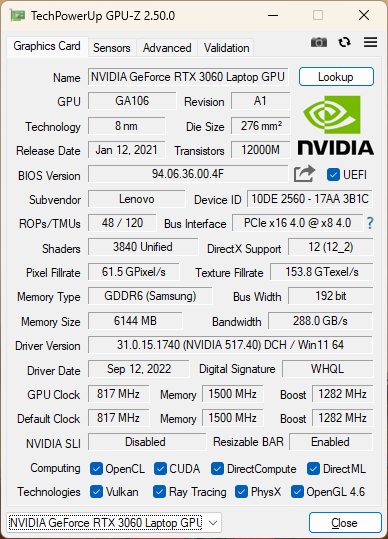
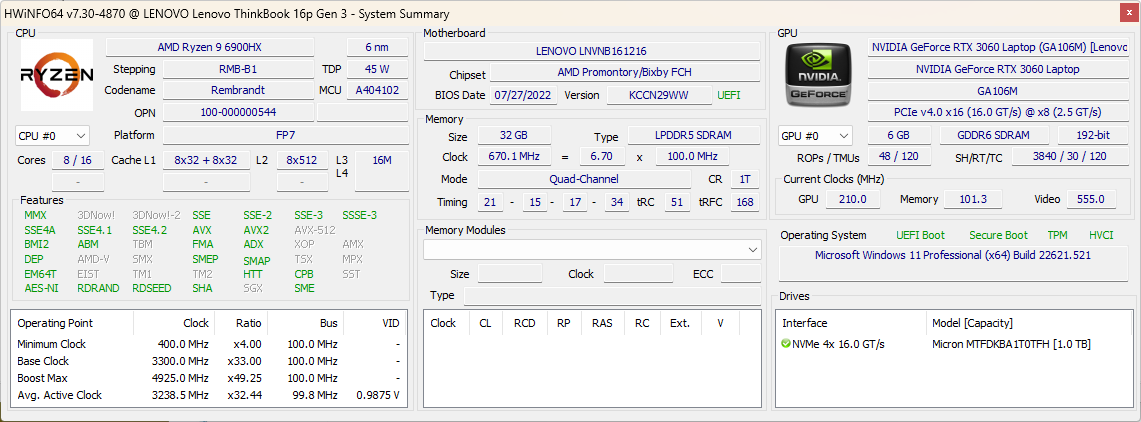
Vår specifika testenhet är utrustad med Ryzen 9 6900HX CPU, 90 W GeForce RTX 3060 GPU, 32 GB LPDDR5 RAM och en IPS-skärm med 165 Hz 2560 x 1600 upplösning för cirka 2 600 USD i detaljhandeln. Mindre SKU:er med en 60 Hz-skärm och en Ryzen 5 6600H- eller Ryzen 7 6800H-CPU finns också tillgängliga.
Bland de direkta konkurrenterna finns andra bärbara 16-tums multimedie- eller Nvidia Studio-datorer av hög kvalitet, t.ex HP Envy 16, Dell Inspiron 16 Plus 7620, Acer Swift X 16eller MSI Creator Z16.
Fler recensioner av Lenovo:
Potentiella konkurrenter i jämförelse
Gradering | Datum | Modell | Vikt | Höjd | Storlek | Upplösning | Pris |
|---|---|---|---|---|---|---|---|
| 87.9 % v7 (old) | 10/2022 | Lenovo ThinkBook 16p G3 ARH R9 6900HX, GeForce RTX 3060 Laptop GPU | 2.1 kg | 19.5 mm | 16.00" | 2560x1600 | |
| 86.9 % v7 (old) | 09/2022 | HP Envy 16 h0112nr i7-12700H, GeForce RTX 3060 Laptop GPU | 2.3 kg | 19.8 mm | 16.00" | 3840x2400 | |
| 87 % v7 (old) | 01/2022 | Lenovo ThinkBook 16p G2 ACH R9 5900HX, GeForce RTX 3060 Laptop GPU | 2 kg | 19.5 mm | 16.00" | 2560x1600 | |
| 85.7 % v7 (old) | 09/2022 | Lenovo IdeaPad 5 Pro 16ARH7 R5 6600HS, Radeon 660M | 1.9 kg | 18.4 mm | 16.00" | 2560x1600 | |
| 86.2 % v7 (old) | 07/2022 | Acer Swift X SFX16-51G-5388 i5-11320H, GeForce RTX 3050 4GB Laptop GPU | 1.8 kg | 18.9 mm | 16.10" | 1920x1080 | |
| 86.6 % v7 (old) | 07/2022 | Lenovo Legion 5 Pro 16IAH7H i7-12700H, GeForce RTX 3060 Laptop GPU | 2.6 kg | 27 mm | 16.00" | 2560x1600 |
Fall
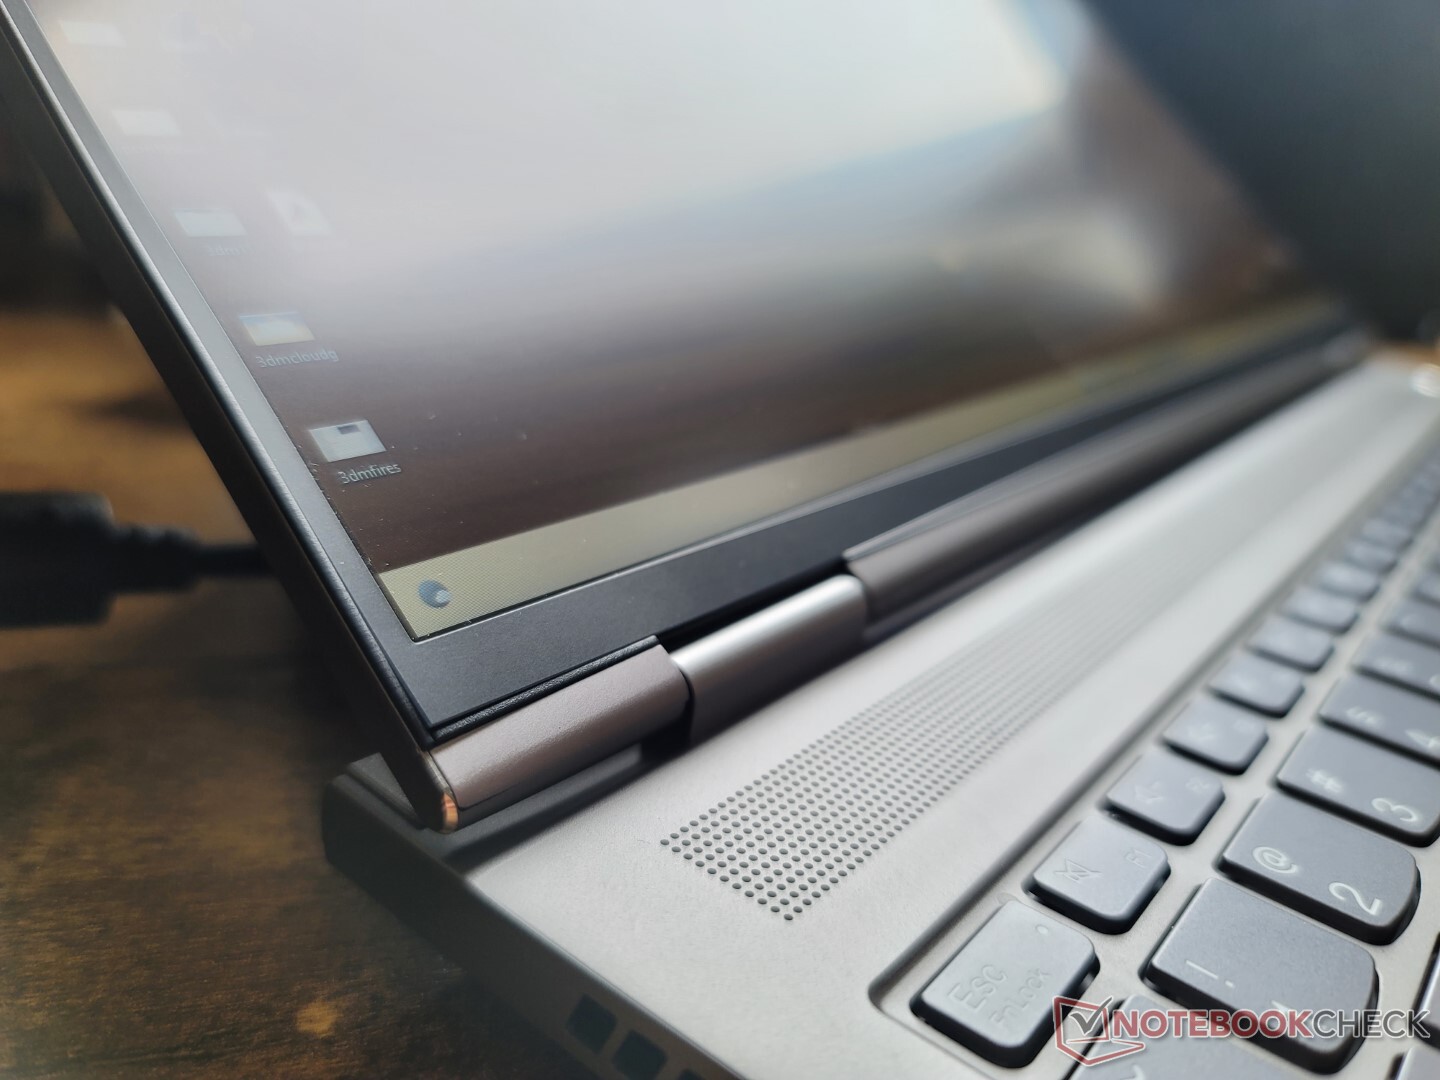
Även om chassit är visuellt identiskt med förra årets Gen 2-modell finns det ett enkelt sätt att skilja Gen 3-modellen från Gen 2: närvaron av en HDMI-port på baksidan. Gen 2-modellen har ingen HDMI-port i jämförelse.

SD-kortläsare
| SD Card Reader | |
| average JPG Copy Test (av. of 3 runs) | |
| Lenovo IdeaPad 5 Pro 16ARH7 (AV PRO microSD 128 GB V60) | |
| Lenovo ThinkBook 16p G2 ACH | |
| Lenovo ThinkBook 16p G3 ARH (AV PRO microSD 128 GB V60) | |
| HP Envy 16 h0112nr (AV Pro SD microSD 128 GB V60) | |
| maximum AS SSD Seq Read Test (1GB) | |
| Lenovo ThinkBook 16p G2 ACH | |
| Lenovo ThinkBook 16p G3 ARH (AV PRO microSD 128 GB V60) | |
| HP Envy 16 h0112nr (AV Pro SD microSD 128 GB V60) | |
Kommunikation
| Networking | |
| iperf3 transmit AX12 | |
| Acer Swift X SFX16-51G-5388 | |
| Lenovo ThinkBook 16p G2 ACH | |
| iperf3 receive AX12 | |
| Acer Swift X SFX16-51G-5388 | |
| Lenovo ThinkBook 16p G2 ACH | |
| iperf3 receive AXE11000 6GHz | |
| Lenovo Legion 5 Pro 16IAH7H | |
| HP Envy 16 h0112nr | |
| iperf3 receive AXE11000 | |
| Lenovo ThinkBook 16p G3 ARH | |
| Lenovo IdeaPad 5 Pro 16ARH7 | |
| iperf3 transmit AXE11000 6GHz | |
| Lenovo Legion 5 Pro 16IAH7H | |
| HP Envy 16 h0112nr | |
| iperf3 transmit AXE11000 | |
| Lenovo ThinkBook 16p G3 ARH | |
| Lenovo IdeaPad 5 Pro 16ARH7 | |
Webbkamera


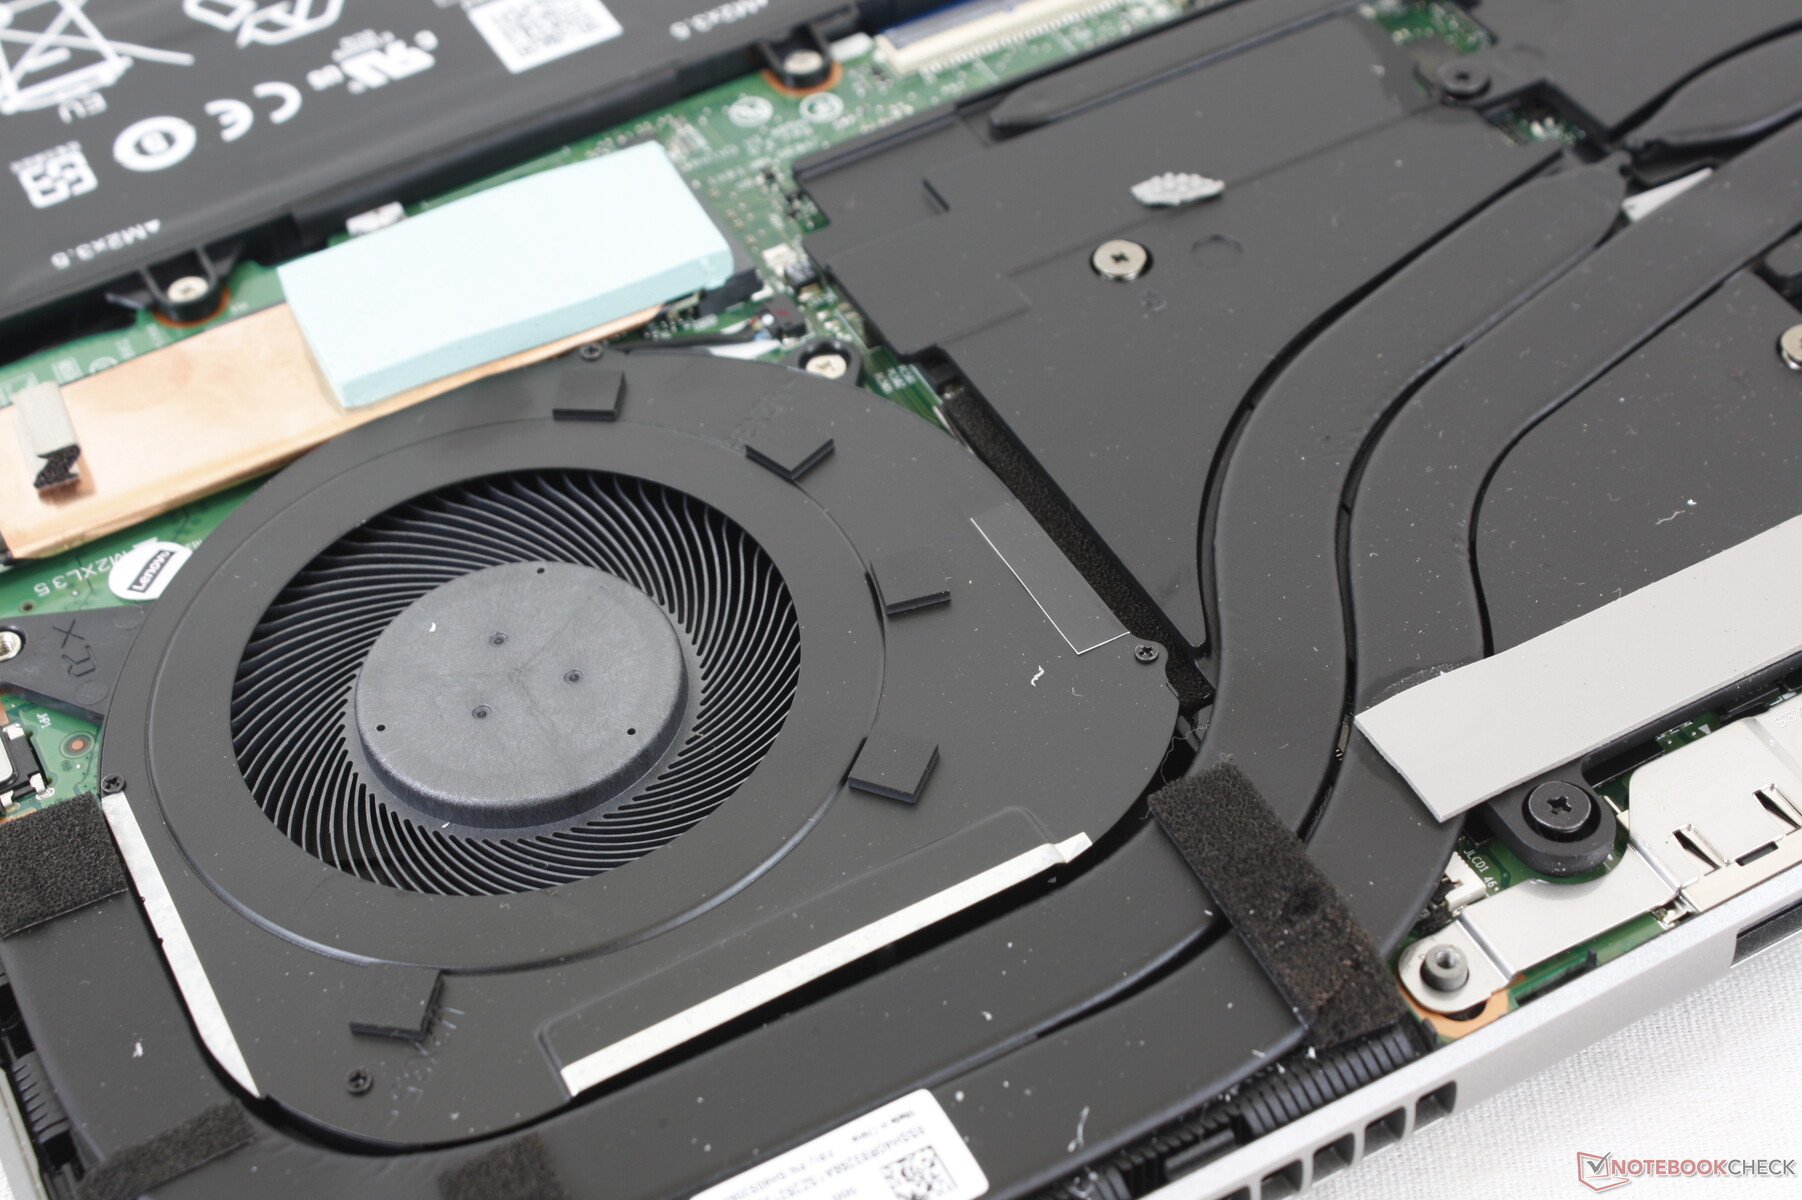
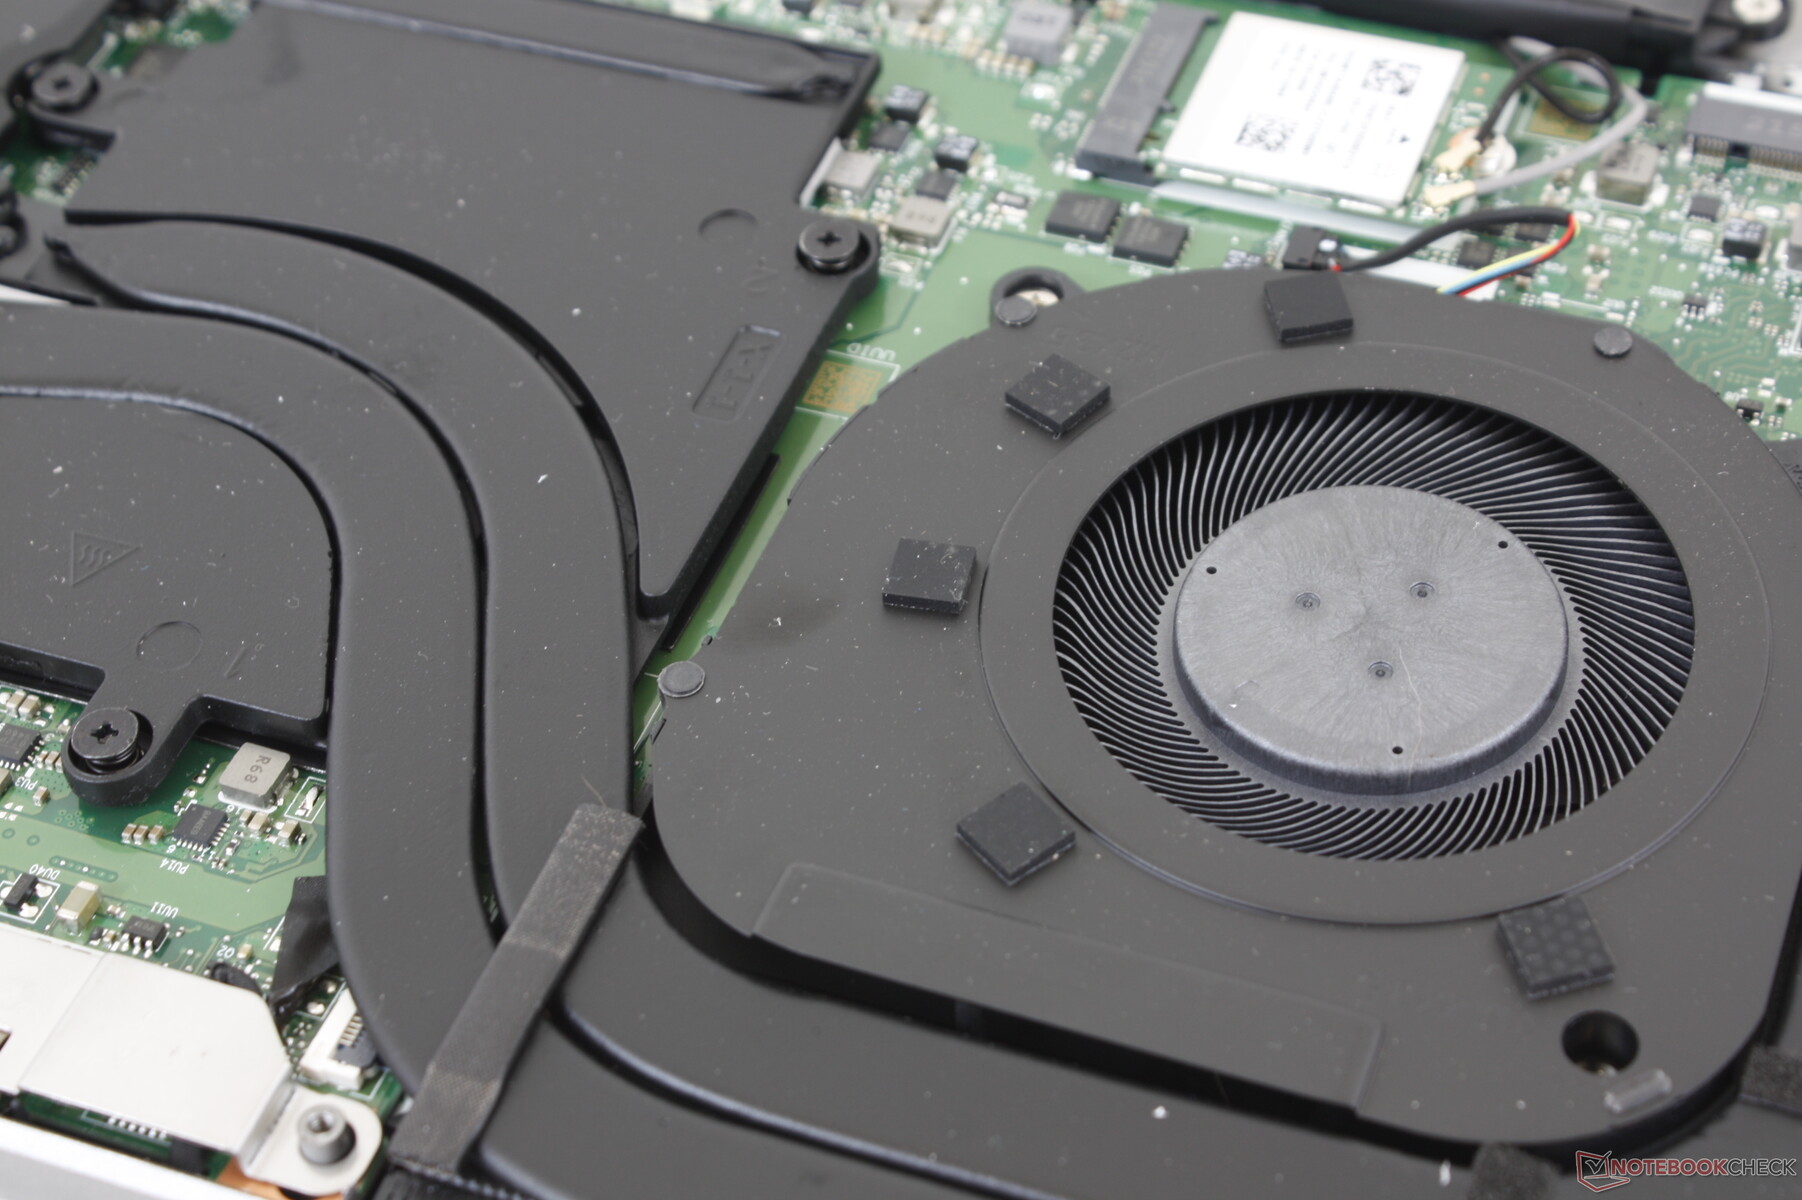
Underhåll
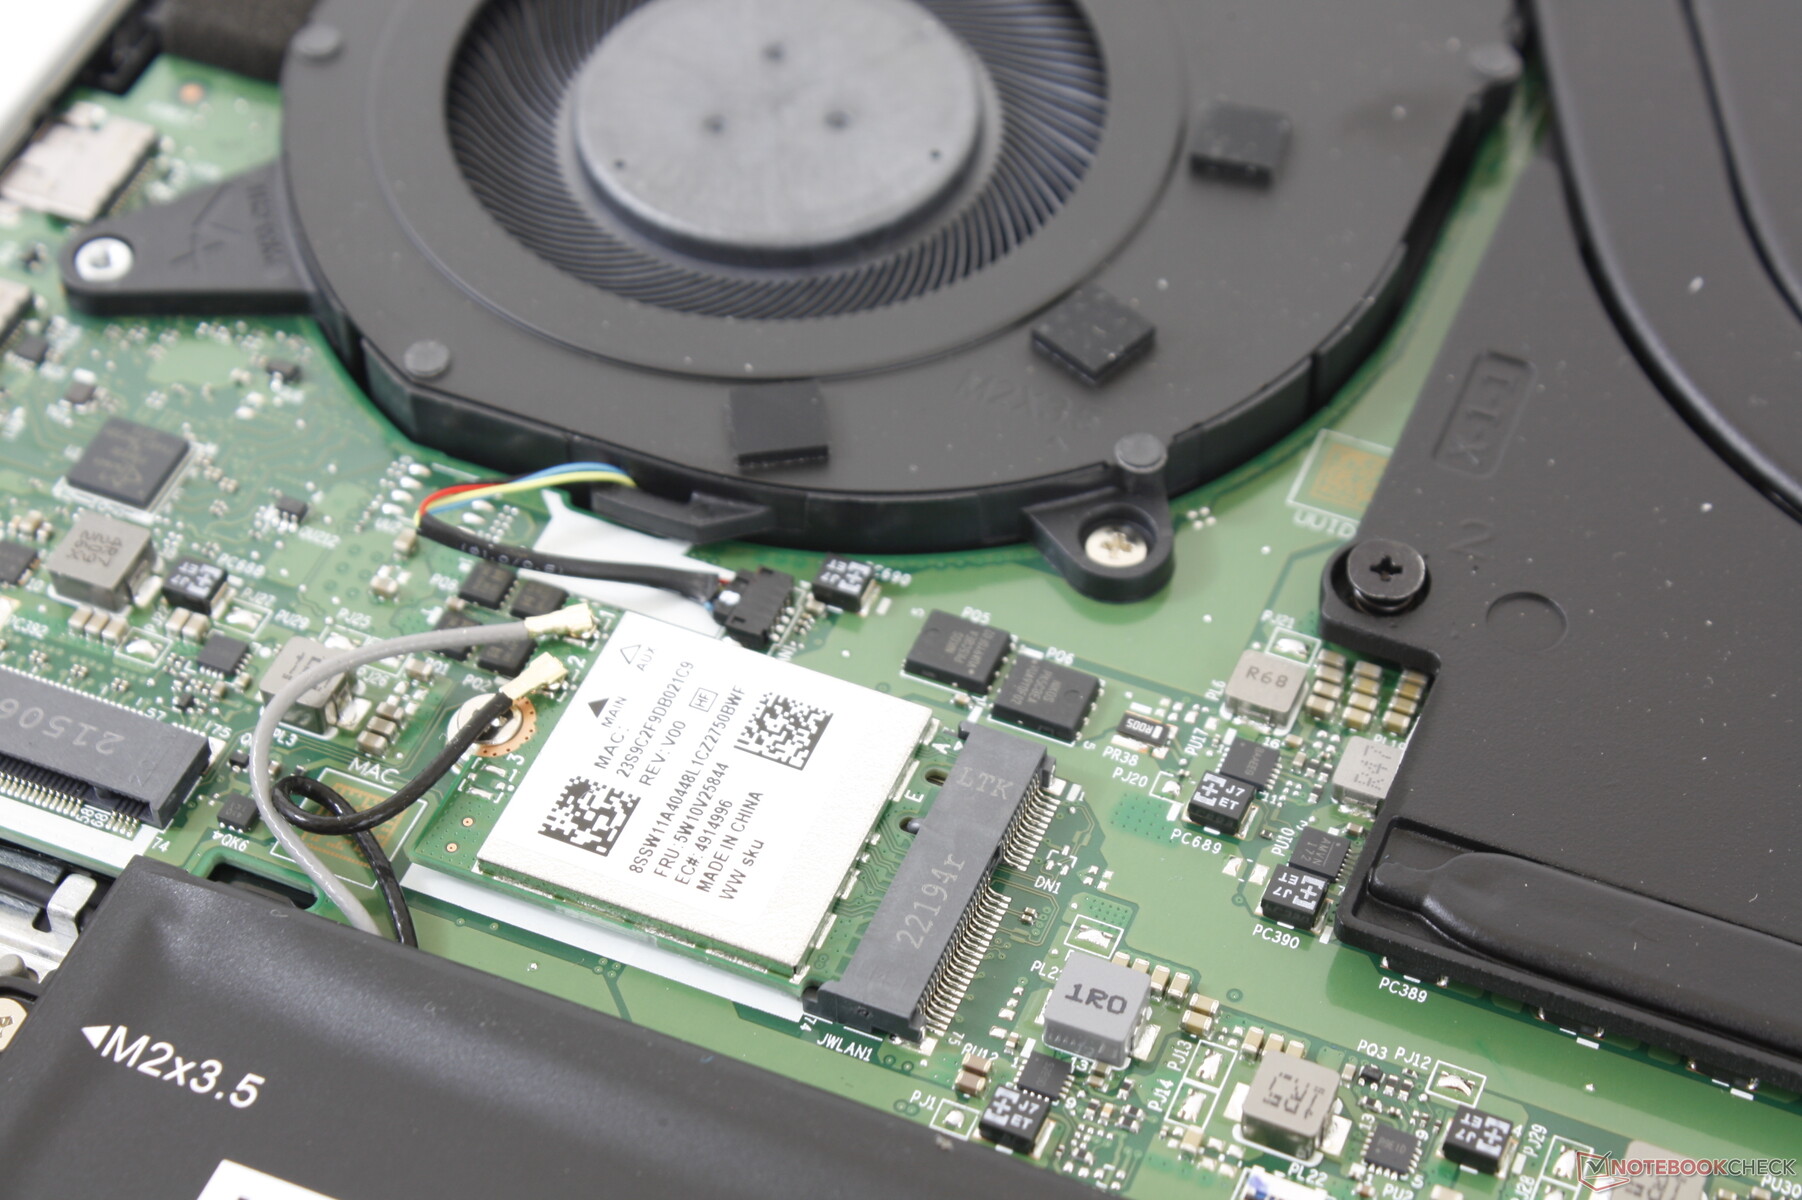
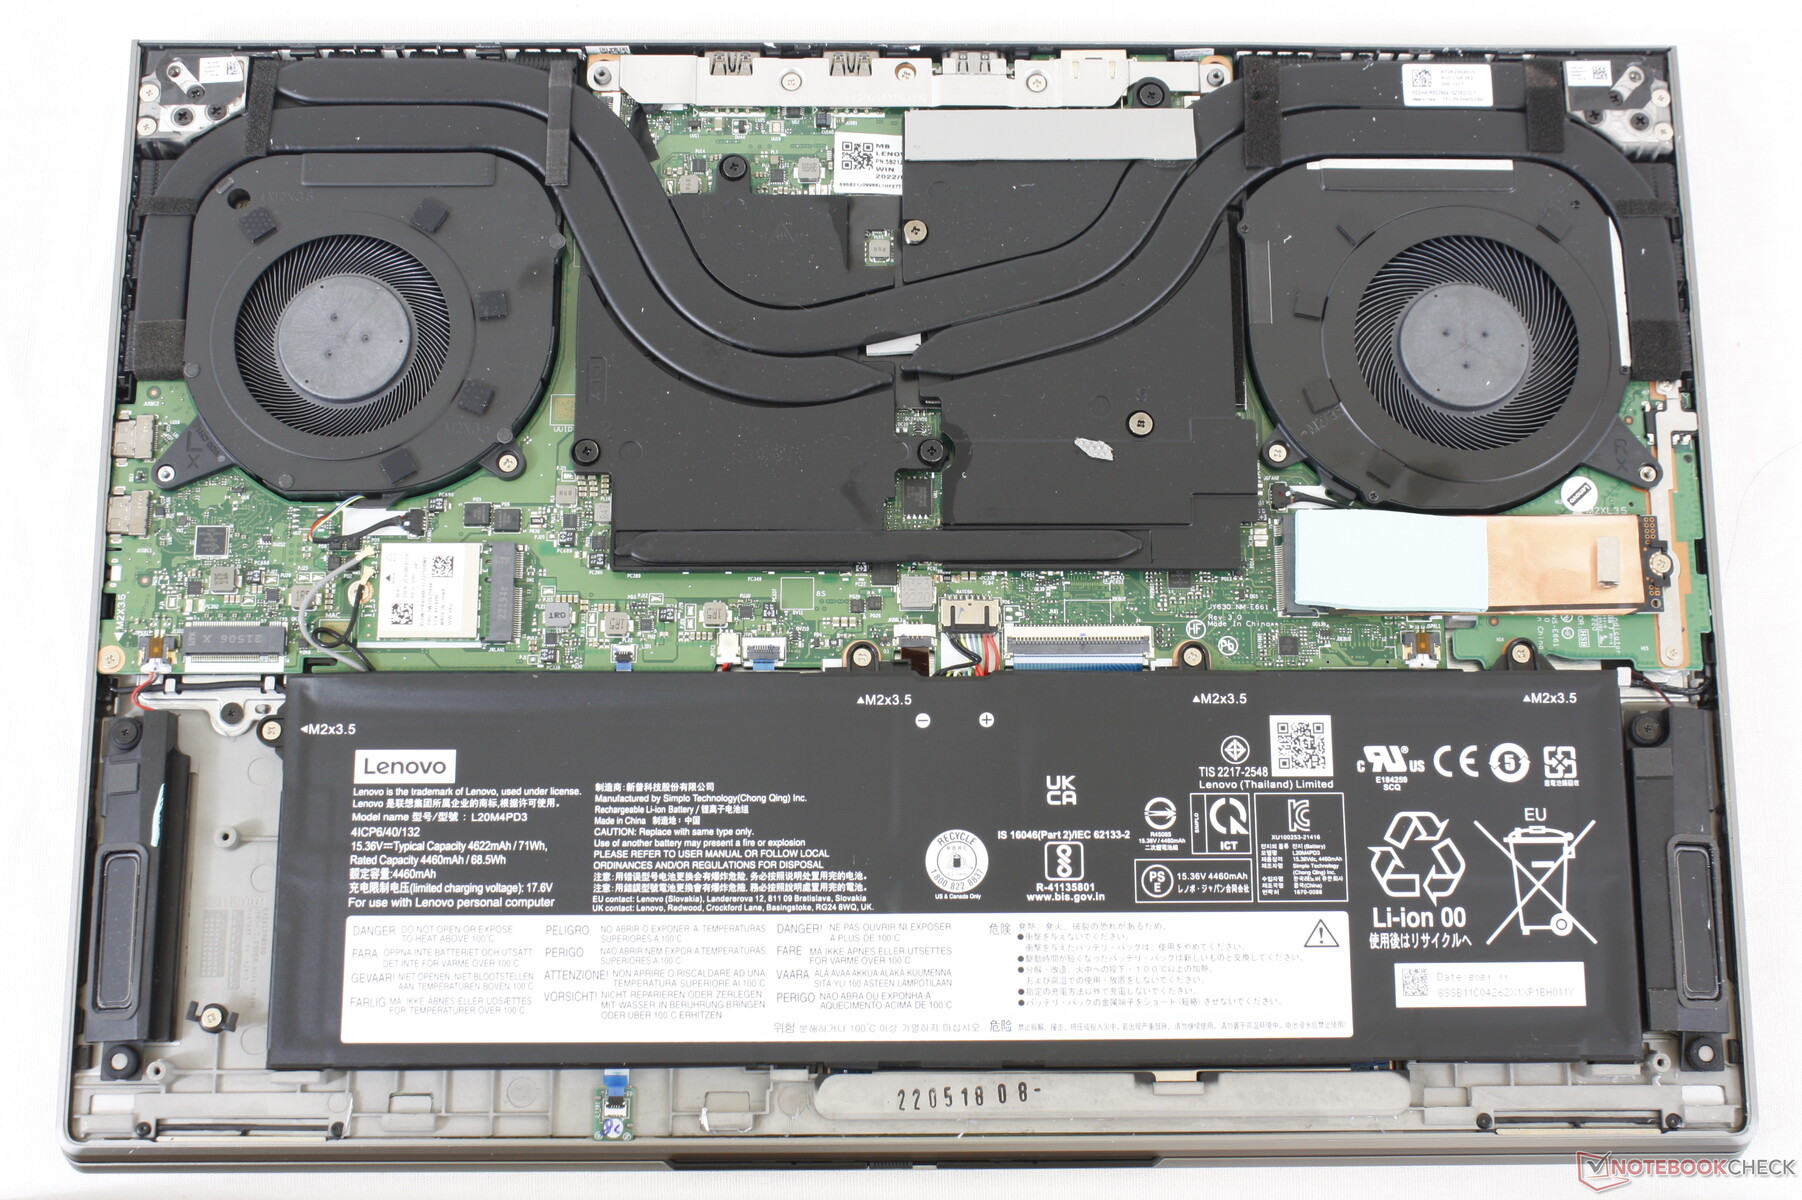
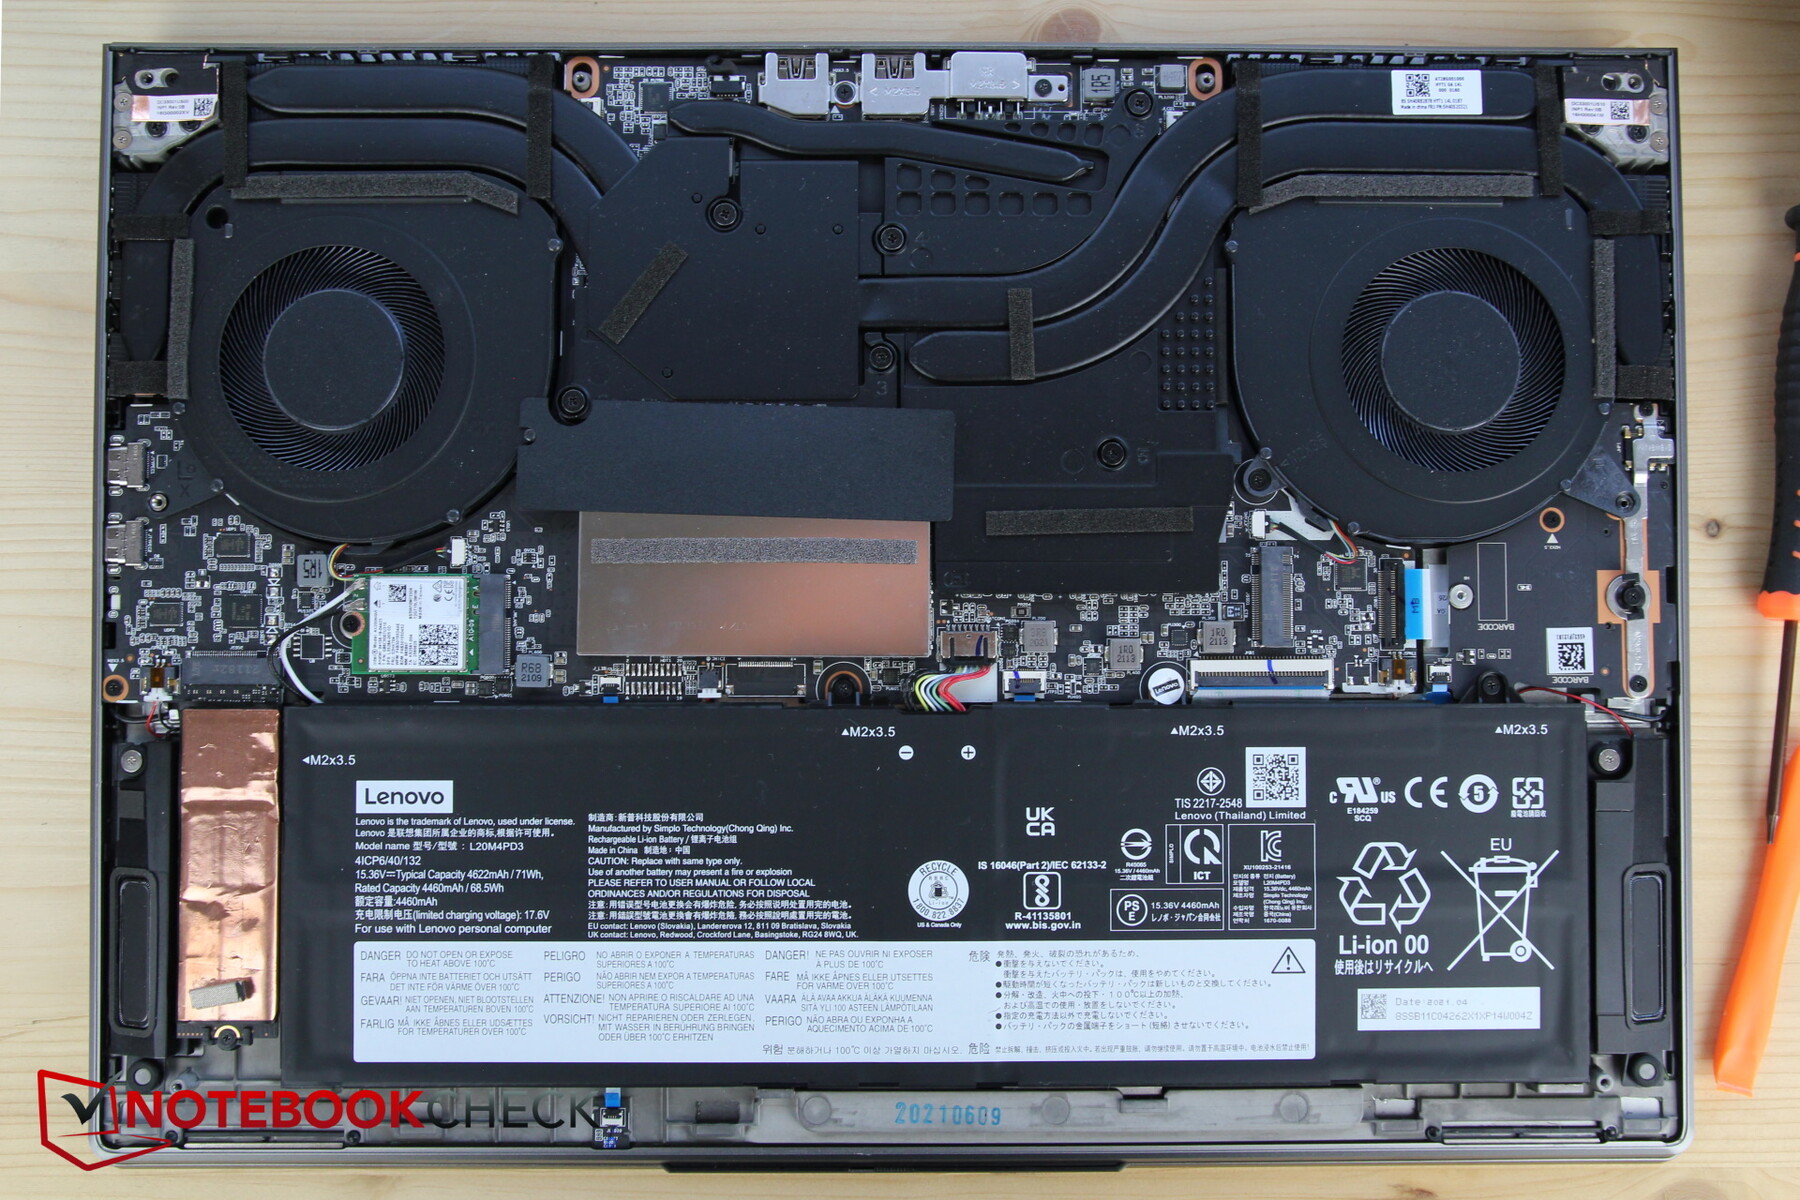
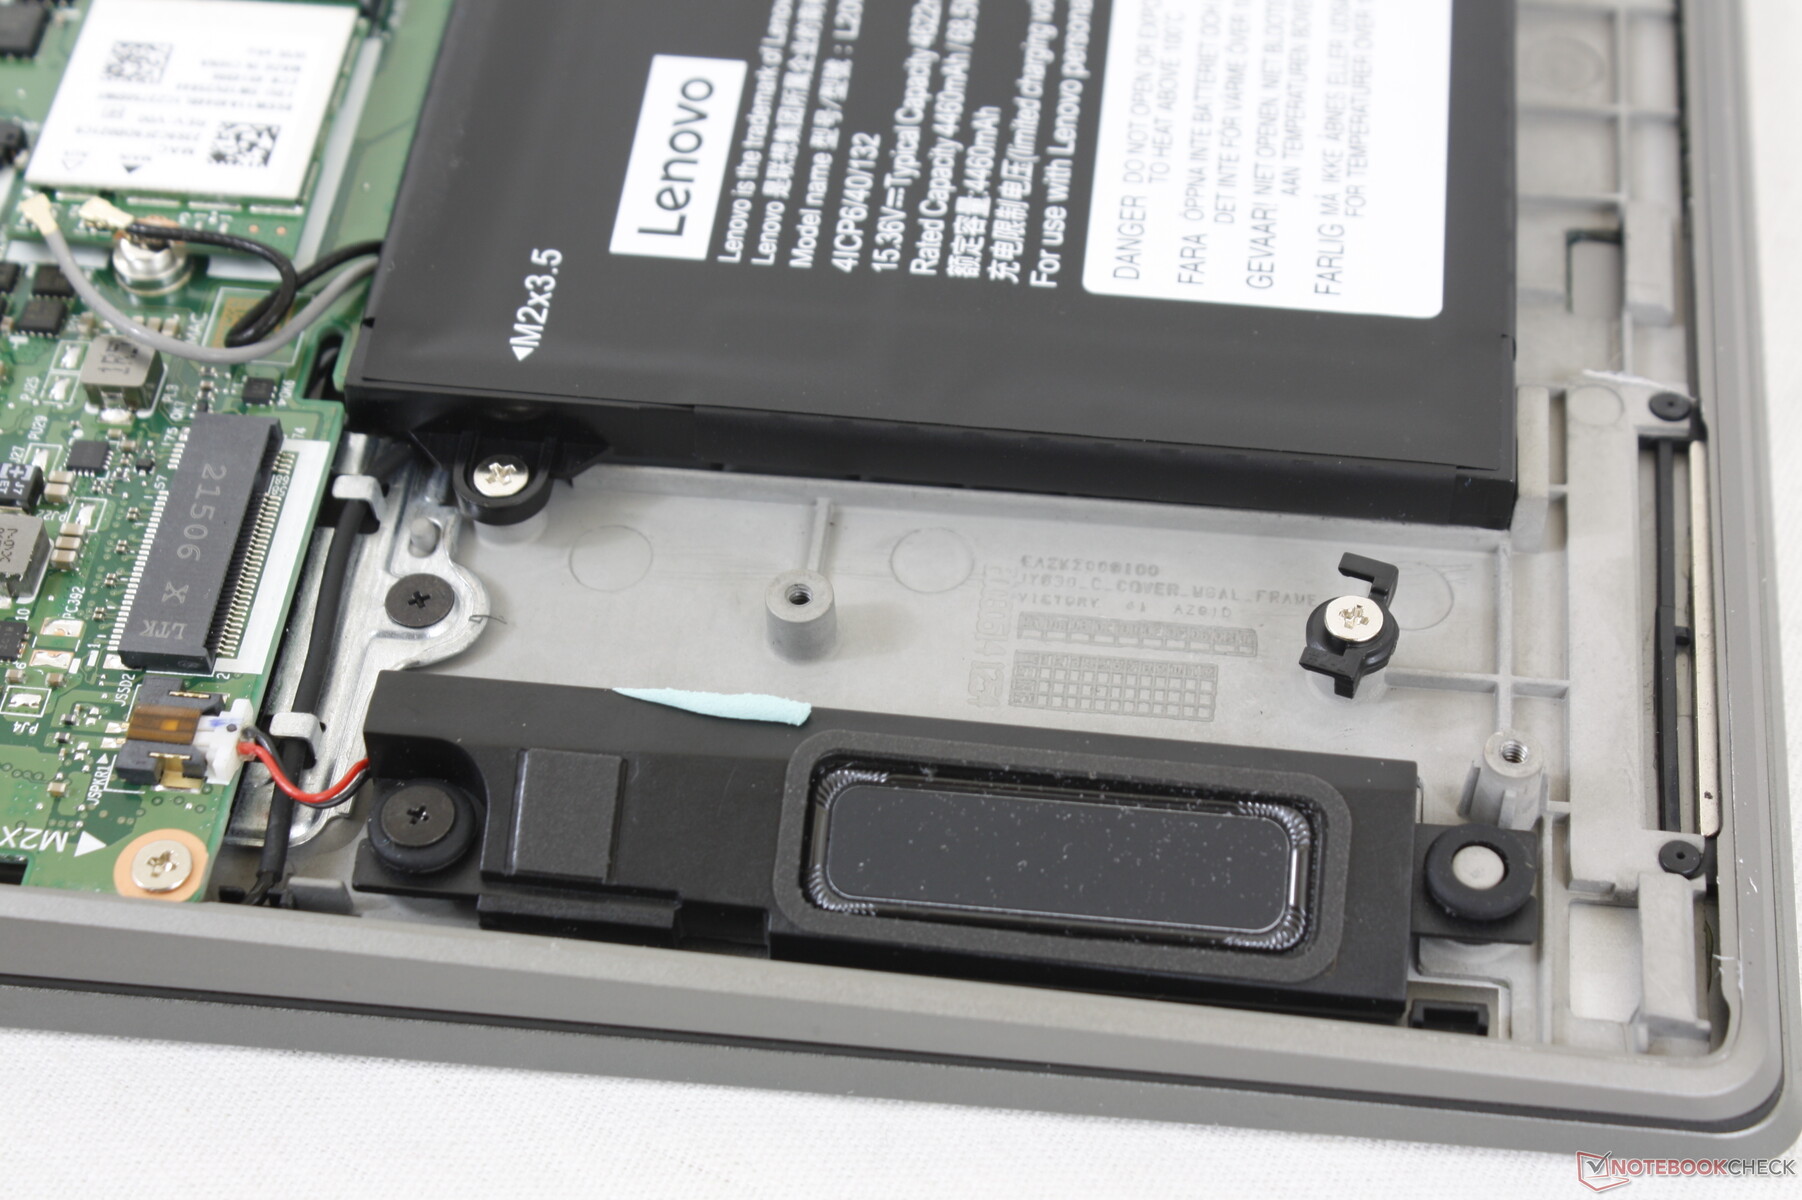
Gen 3-modellen använder sig av fastlödda RAM-minne medan Gen 2-modellen har en avtagbar SODIMM-plats.
Visa
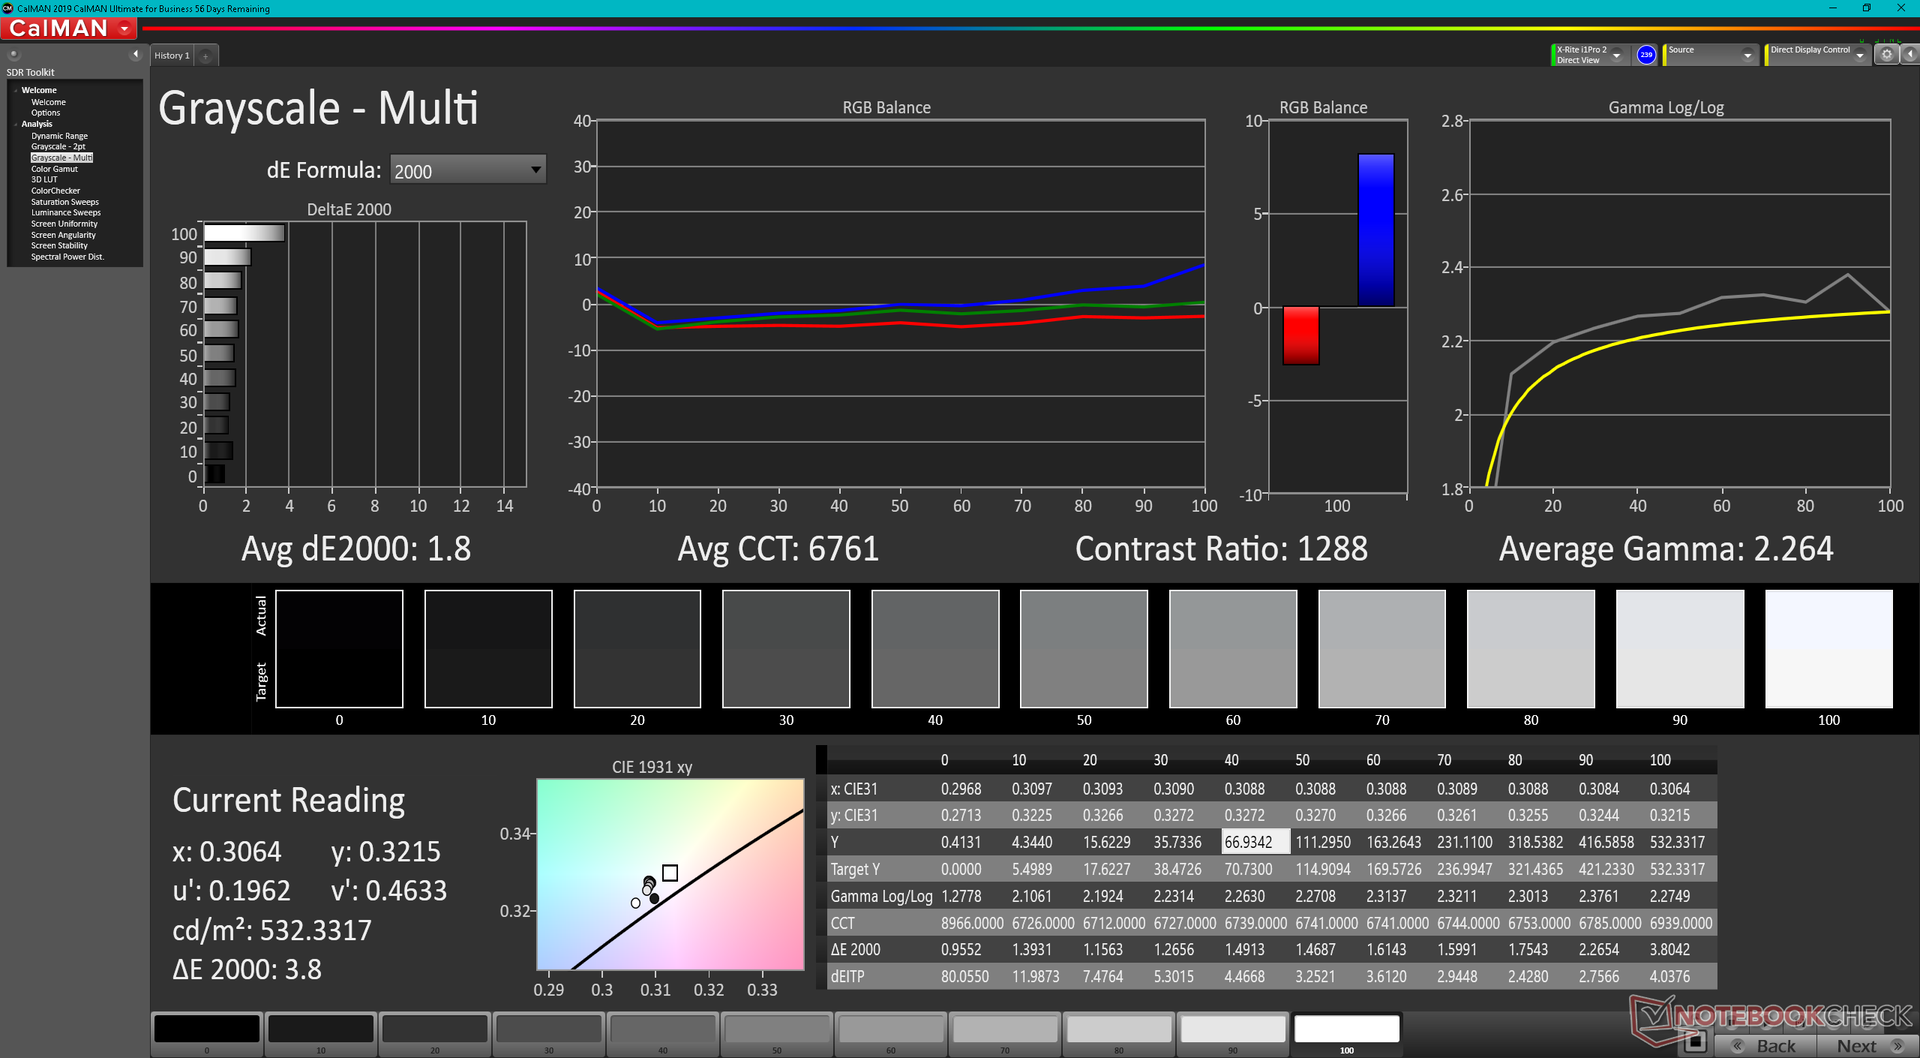
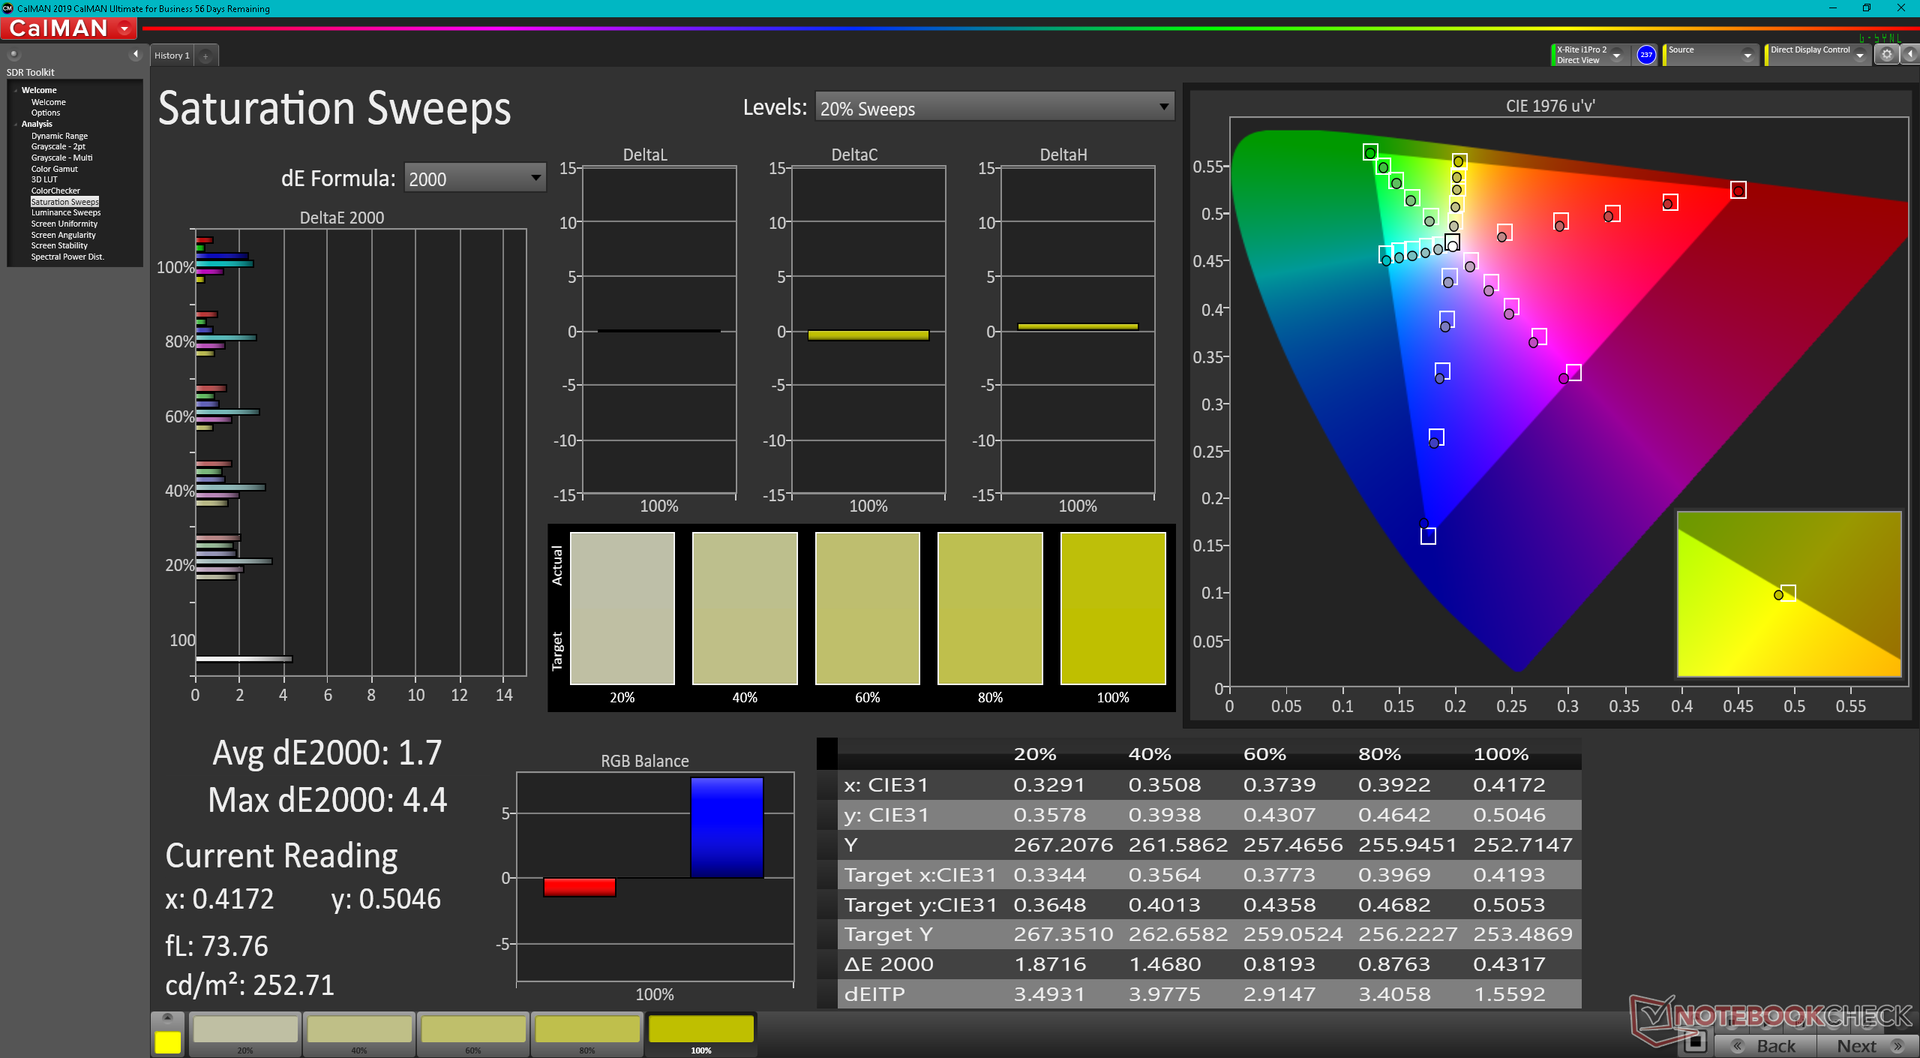
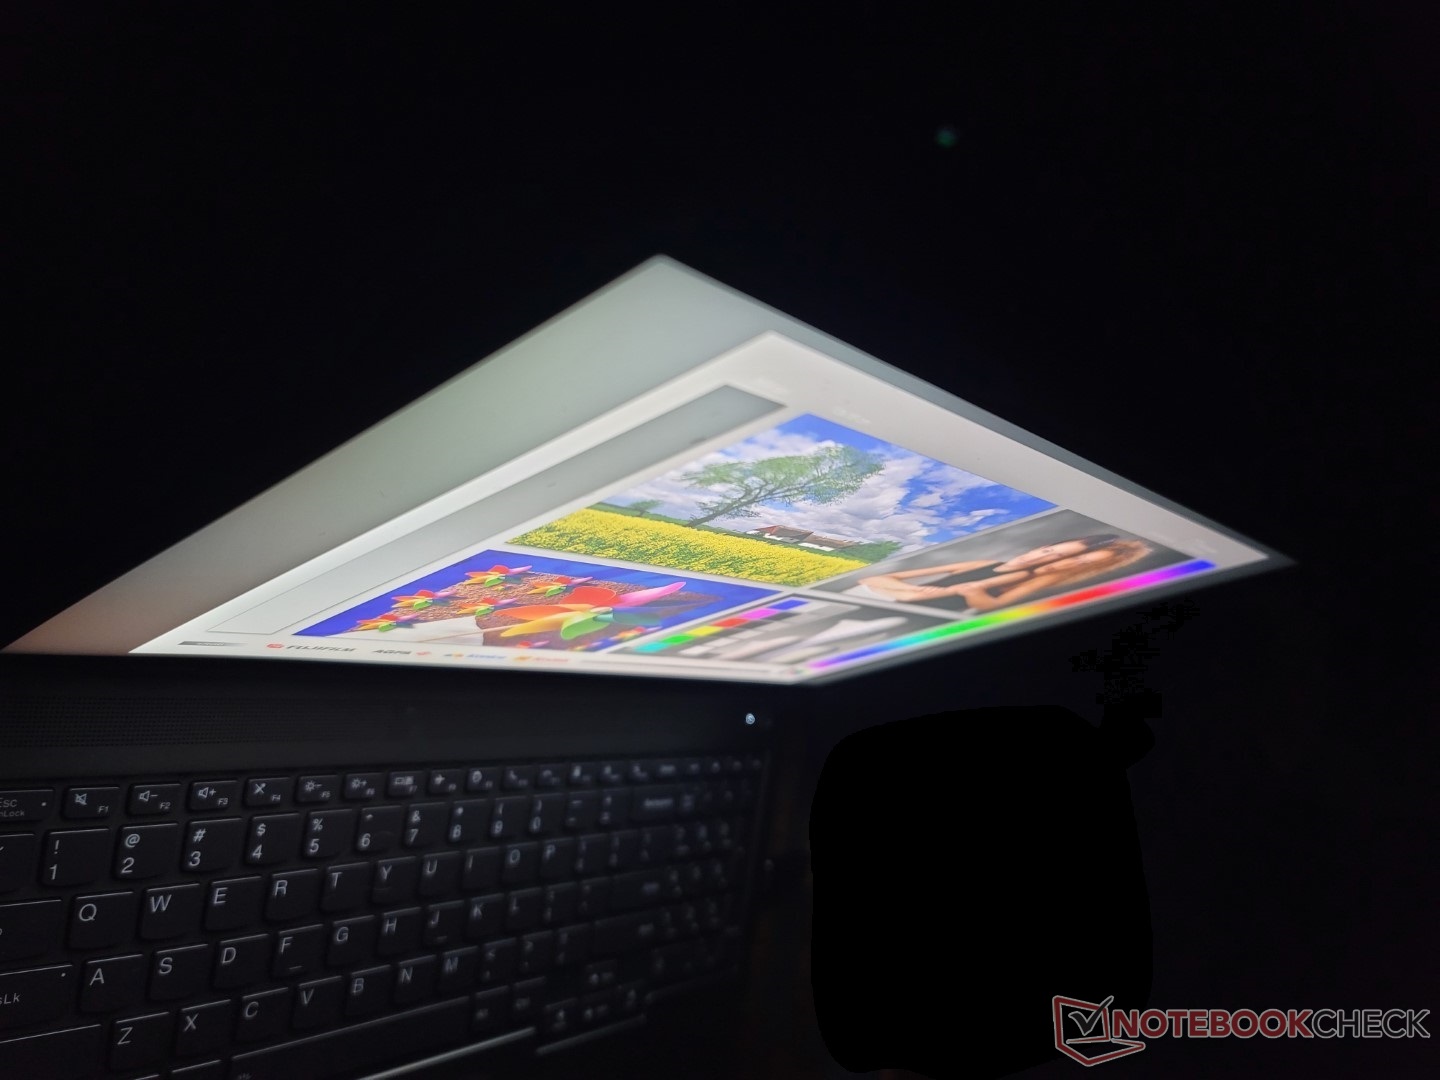
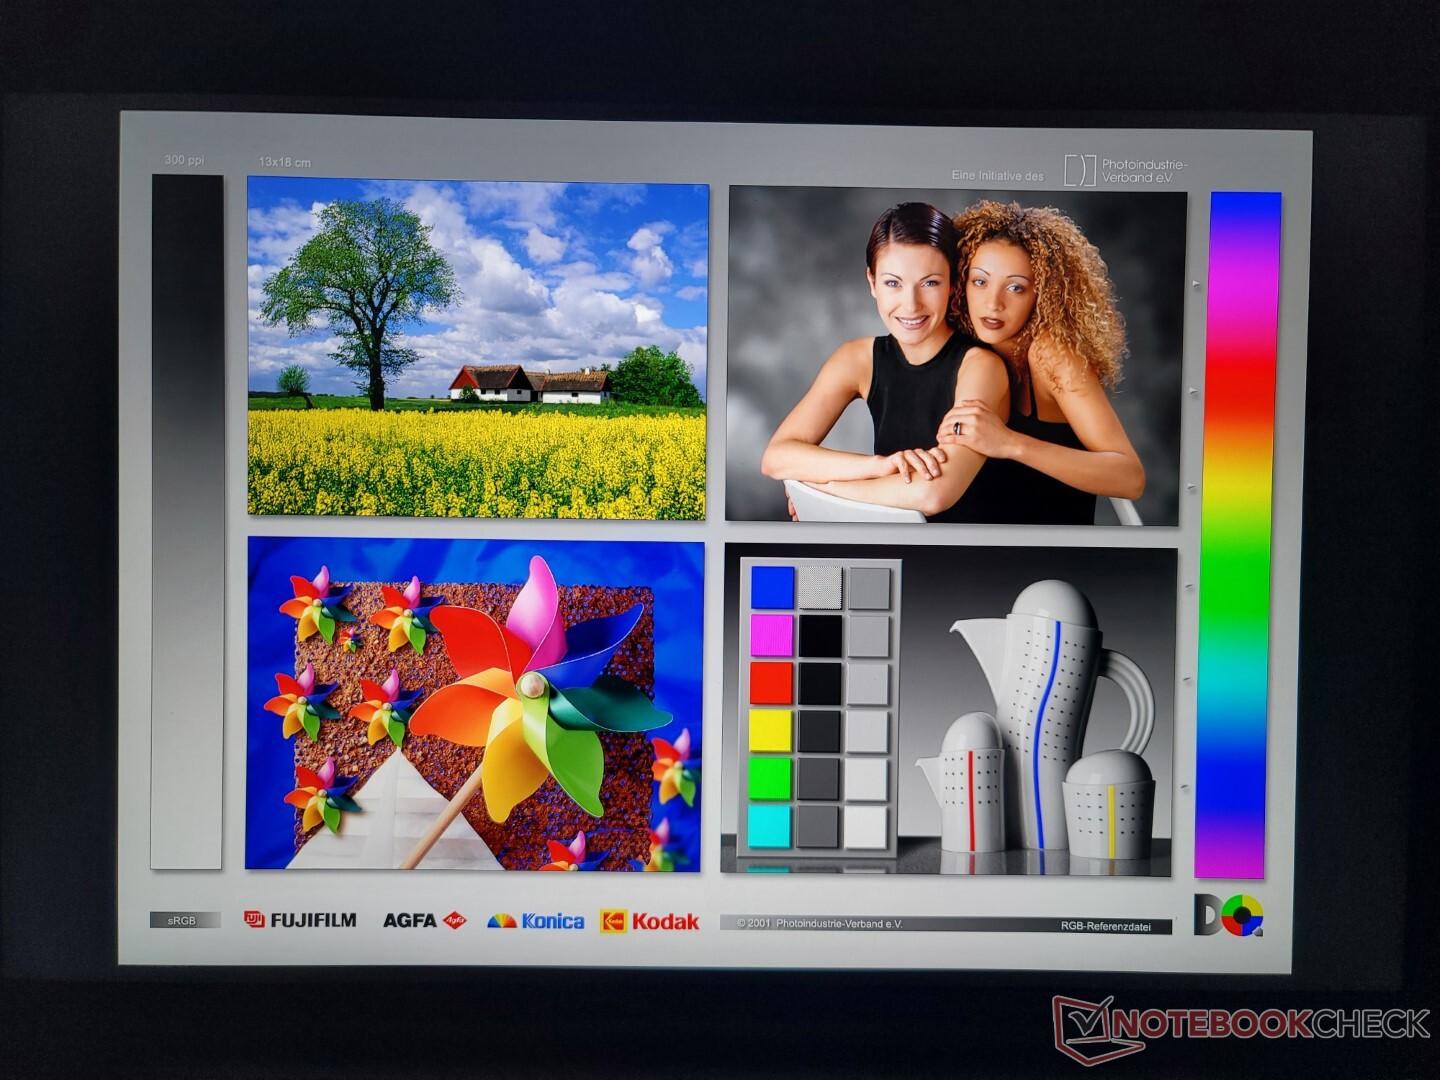
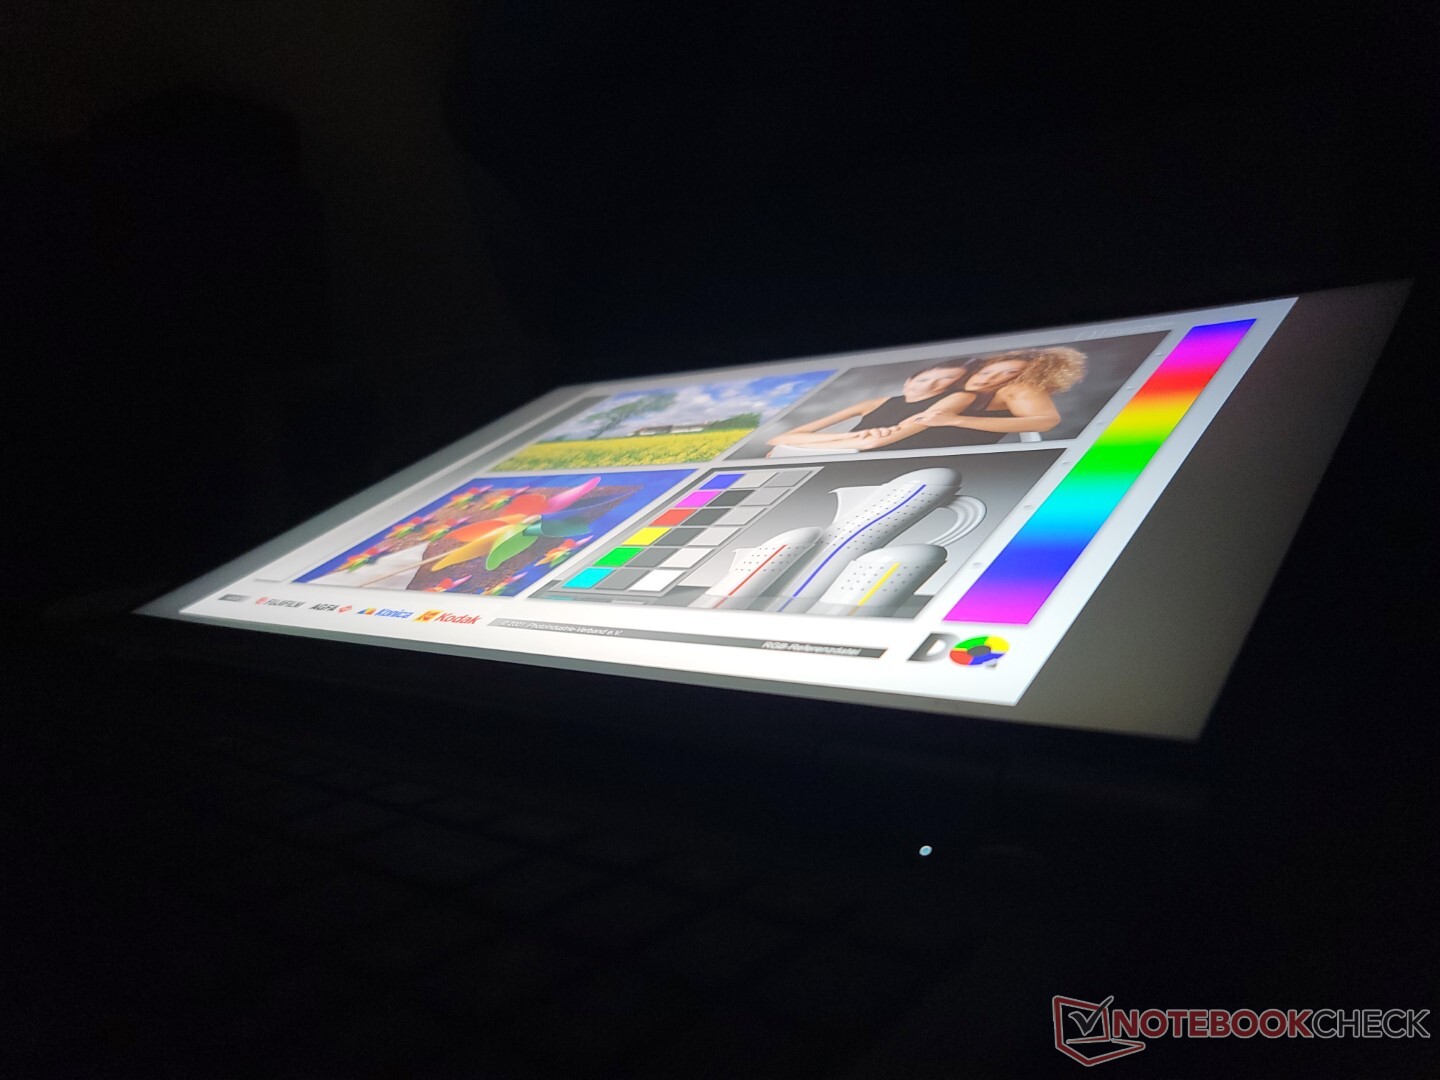
Vår 165 Hz-skärm är en uppgradering från 60 Hz-panelen på vår Gen 2-testenhet. Den har också snabbare svarstider, ljusare bakgrundsbelysning och samma fulla sRGB-täckning. Det finns tyvärr inga alternativ för OLED- eller P3-paneler för tillfället.


| |||||||||||||||||||||||||
Distribution av ljusstyrkan: 94 %
Mitt på batteriet: 532.8 cd/m²
Kontrast: 969:1 (Svärta: 0.55 cd/m²)
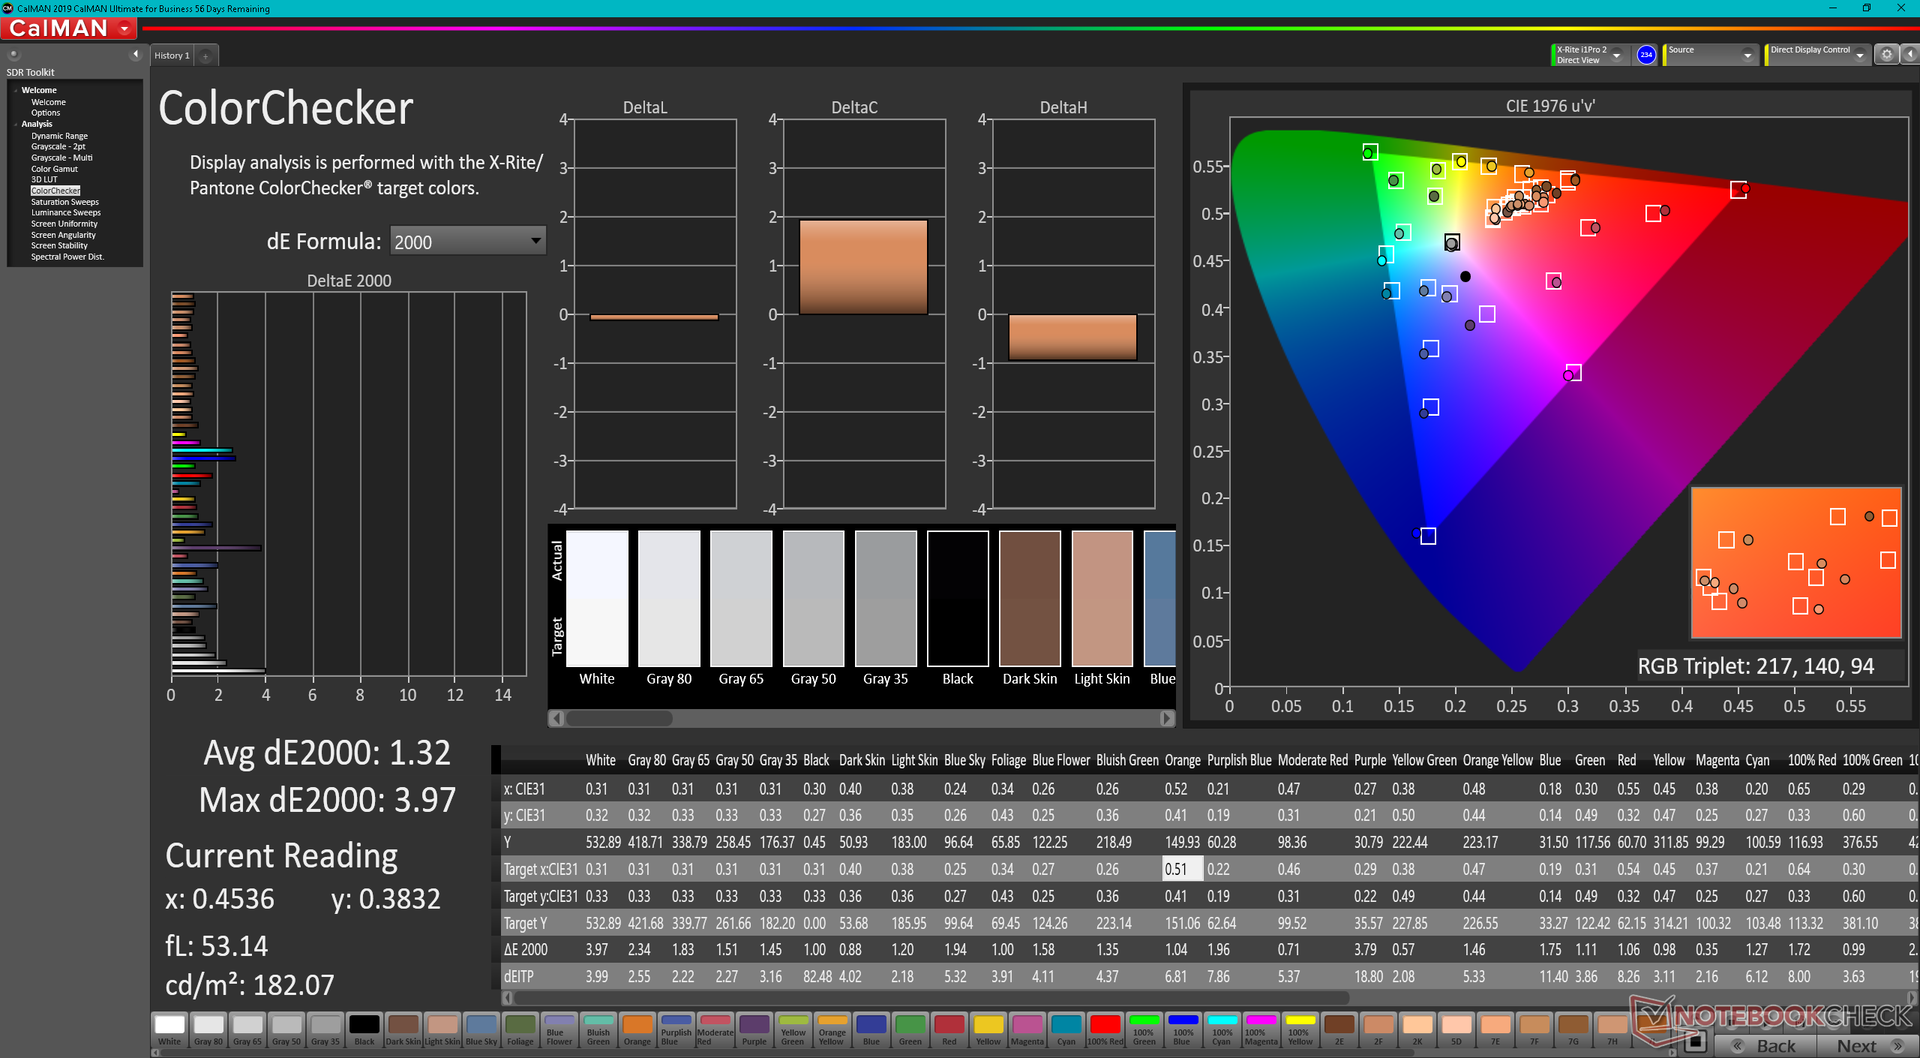
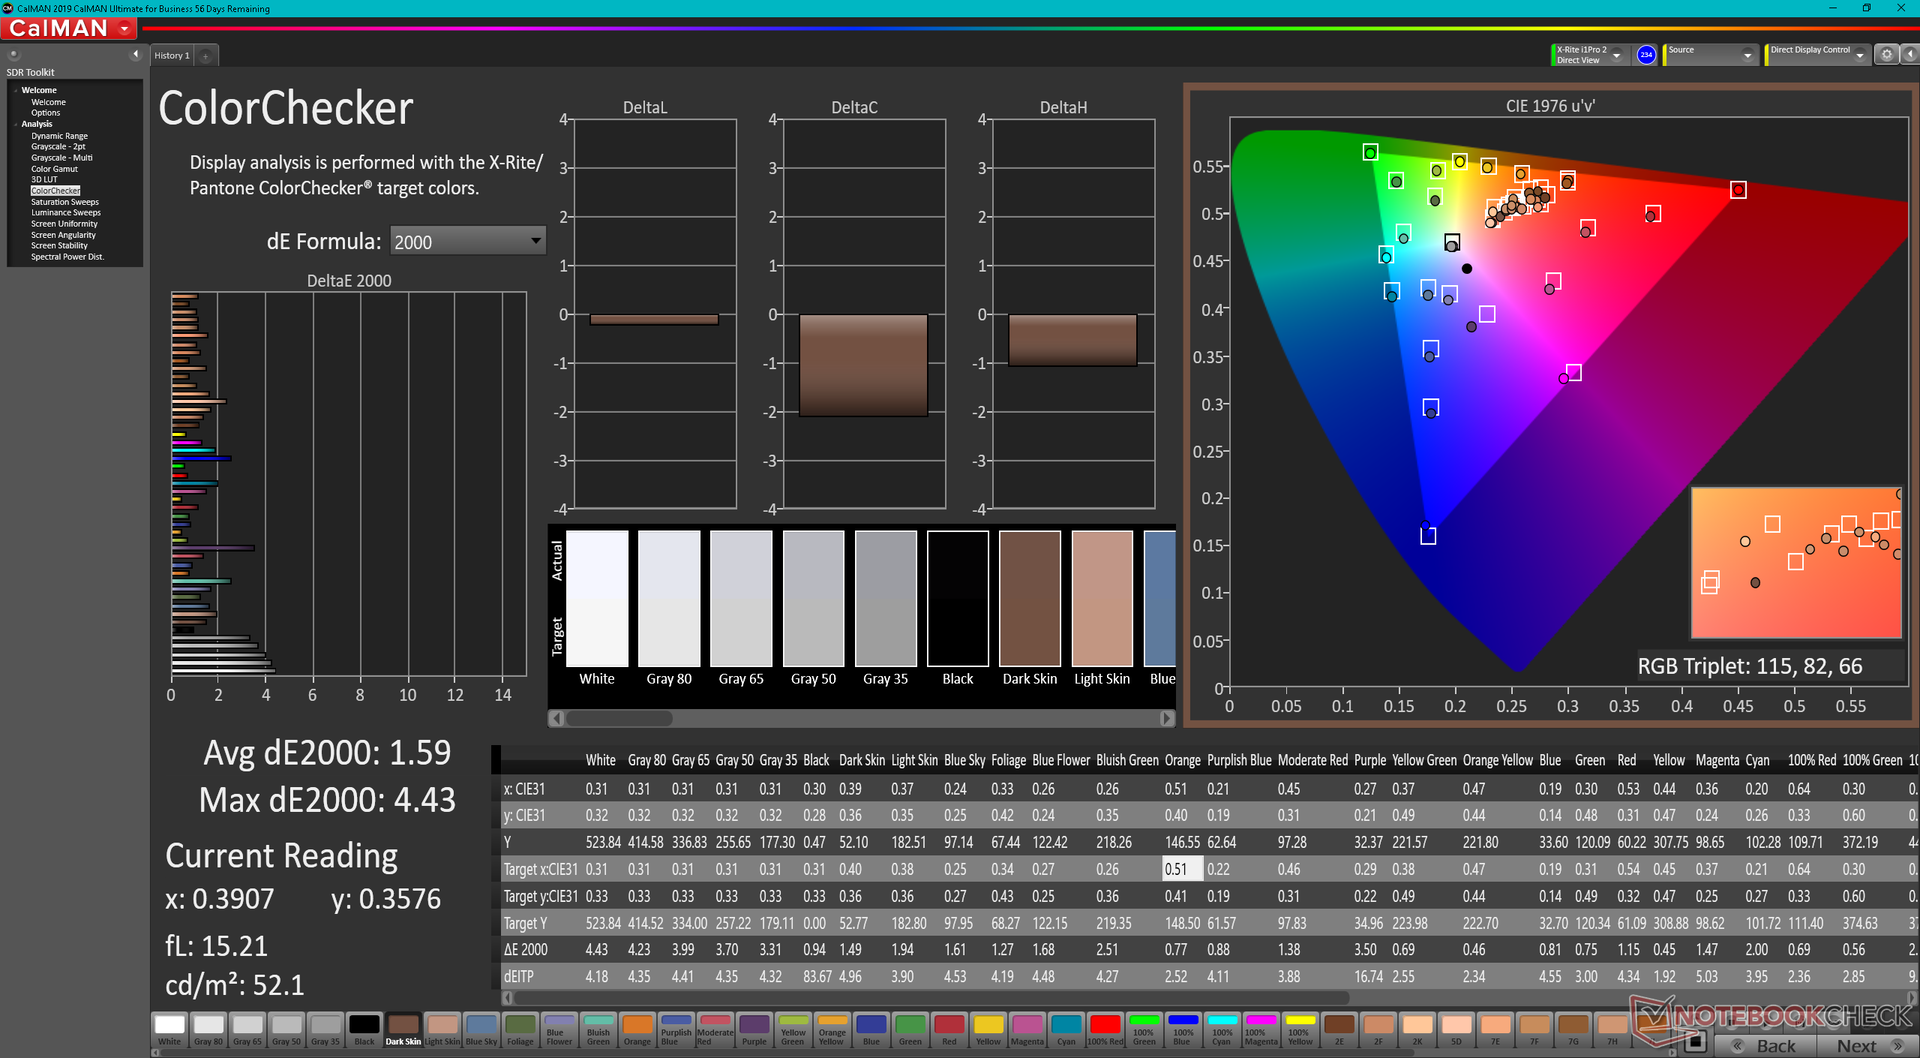
ΔE ColorChecker Calman: 1.32 | ∀{0.5-29.43 Ø4.71}
calibrated: 1.59
ΔE Greyscale Calman: 1.8 | ∀{0.09-98 Ø4.96}
71.4% AdobeRGB 1998 (Argyll 3D)
98.2% sRGB (Argyll 3D)
69.8% Display P3 (Argyll 3D)
Gamma: 2.64
CCT: 6761 K
| Lenovo ThinkBook 16p G3 ARH BOE CQ NE160QDM-NY1, IPS, 2560x1600, 16" | HP Envy 16 h0112nr Samsung SDC4174, OLED, 3840x2400, 16" | Lenovo ThinkBook 16p G2 ACH Lenovo LEN8A95 (AUO B160QAN02.M), IPS, 2560x1600, 16" | Lenovo IdeaPad 5 Pro 16ARH7 AUO B160QAN02.H, IPS, 2560x1600, 16" | Acer Swift X SFX16-51G-5388 Chi Mei N161HCA-EA3, , 1920x1080, 16.1" | Lenovo Legion 5 Pro 16IAH7H BOE CCQ_NE160QDM_NY1, IPS, 2560x1600, 16" | |
|---|---|---|---|---|---|---|
| Display | 22% | 6% | -4% | -6% | -1% | |
| Display P3 Coverage (%) | 69.8 | 99.3 42% | 76.4 9% | 65 -7% | 65.1 -7% | 68.53 -2% |
| sRGB Coverage (%) | 98.2 | 100 2% | 100 2% | 98 0% | 95.65 -3% | 98.38 0% |
| AdobeRGB 1998 Coverage (%) | 71.4 | 88 23% | 77.4 8% | 67.2 -6% | 66.75 -7% | 70.45 -1% |
| Response Times | 85% | -89% | 24% | -86% | 28% | |
| Response Time Grey 50% / Grey 80% * (ms) | 15.6 ? | 2 ? 87% | 36 -131% | 14.1 ? 10% | 30 ? -92% | 14 ? 10% |
| Response Time Black / White * (ms) | 11.2 ? | 1.9 ? 83% | 16.4 -46% | 7.1 ? 37% | 20 ? -79% | 6 ? 46% |
| PWM Frequency (Hz) | 240.4 ? | |||||
| Screen | -19% | -1% | -11% | 2% | -11% | |
| Brightness middle (cd/m²) | 532.8 | 328.8 -38% | 439 -18% | 415 -22% | 276 -48% | 515 -3% |
| Brightness (cd/m²) | 519 | 332 -36% | 397 -24% | 409 -21% | 264 -49% | 475 -8% |
| Brightness Distribution (%) | 94 | 97 3% | 83 -12% | 91 -3% | 85 -10% | 85 -10% |
| Black Level * (cd/m²) | 0.55 | 0.44 20% | 0.32 42% | 0.16 71% | 0.45 18% | |
| Contrast (:1) | 969 | 998 3% | 1297 34% | 1725 78% | 1144 18% | |
| Colorchecker dE 2000 * | 1.32 | 1.53 -16% | 1.68 -27% | 1.92 -45% | 1.8 -36% | 2.38 -80% |
| Colorchecker dE 2000 max. * | 3.97 | 6.04 -52% | 2.36 41% | 5.71 -44% | 3.77 5% | 4.37 -10% |
| Colorchecker dE 2000 calibrated * | 1.59 | 1.57 1% | 0.58 64% | 0.63 60% | 1.1 31% | |
| Greyscale dE 2000 * | 1.8 | 1.3 28% | 1.64 9% | 3.7 -106% | 2.76 -53% | 2.71 -51% |
| Gamma | 2.64 83% | 2.18 101% | 2.39 92% | 2.272 97% | 2.37 93% | 2.49 88% |
| CCT | 6761 96% | 6362 102% | 6616 98% | 7132 91% | 6564 99% | 6117 106% |
| Totalt genomsnitt (program/inställningar) | 29% /
11% | -28% /
-12% | 3% /
-5% | -30% /
-12% | 5% /
-3% |
* ... mindre är bättre
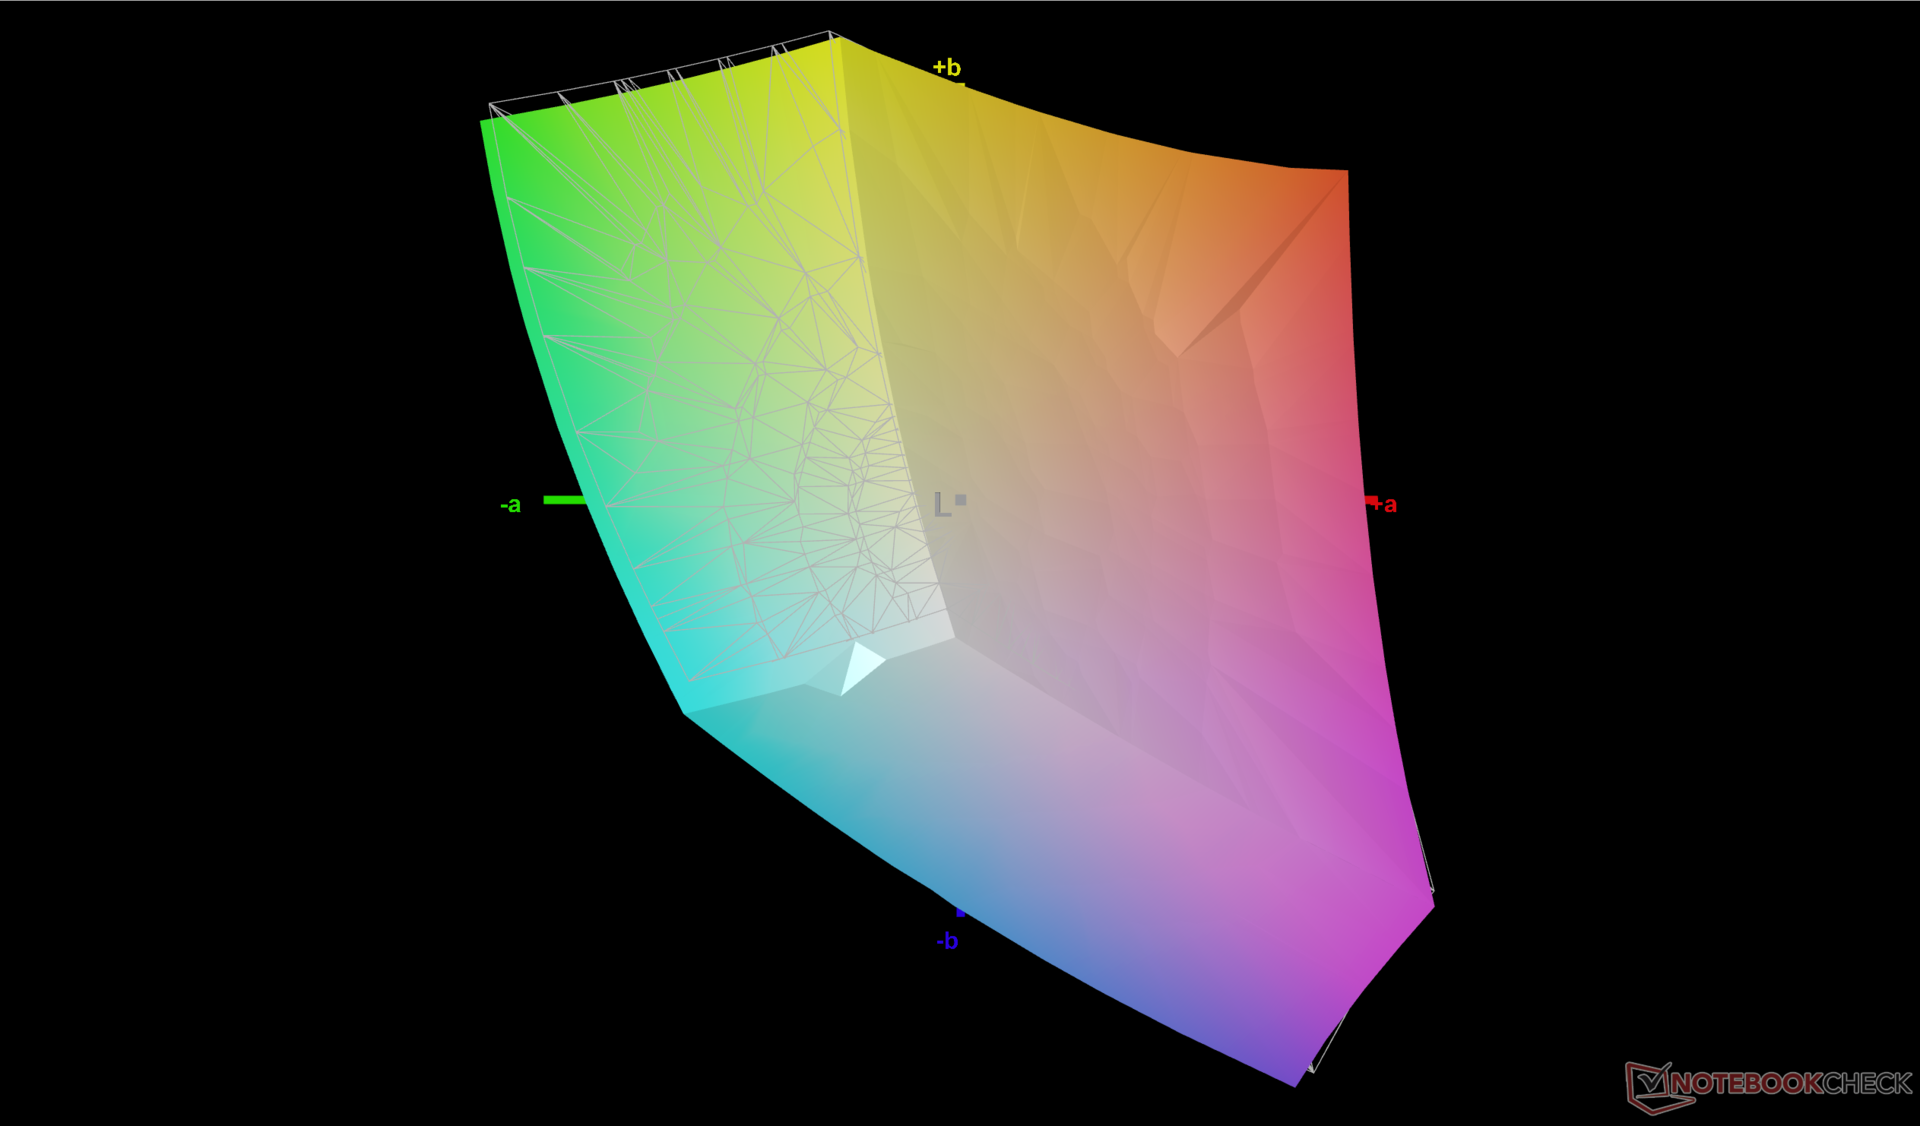
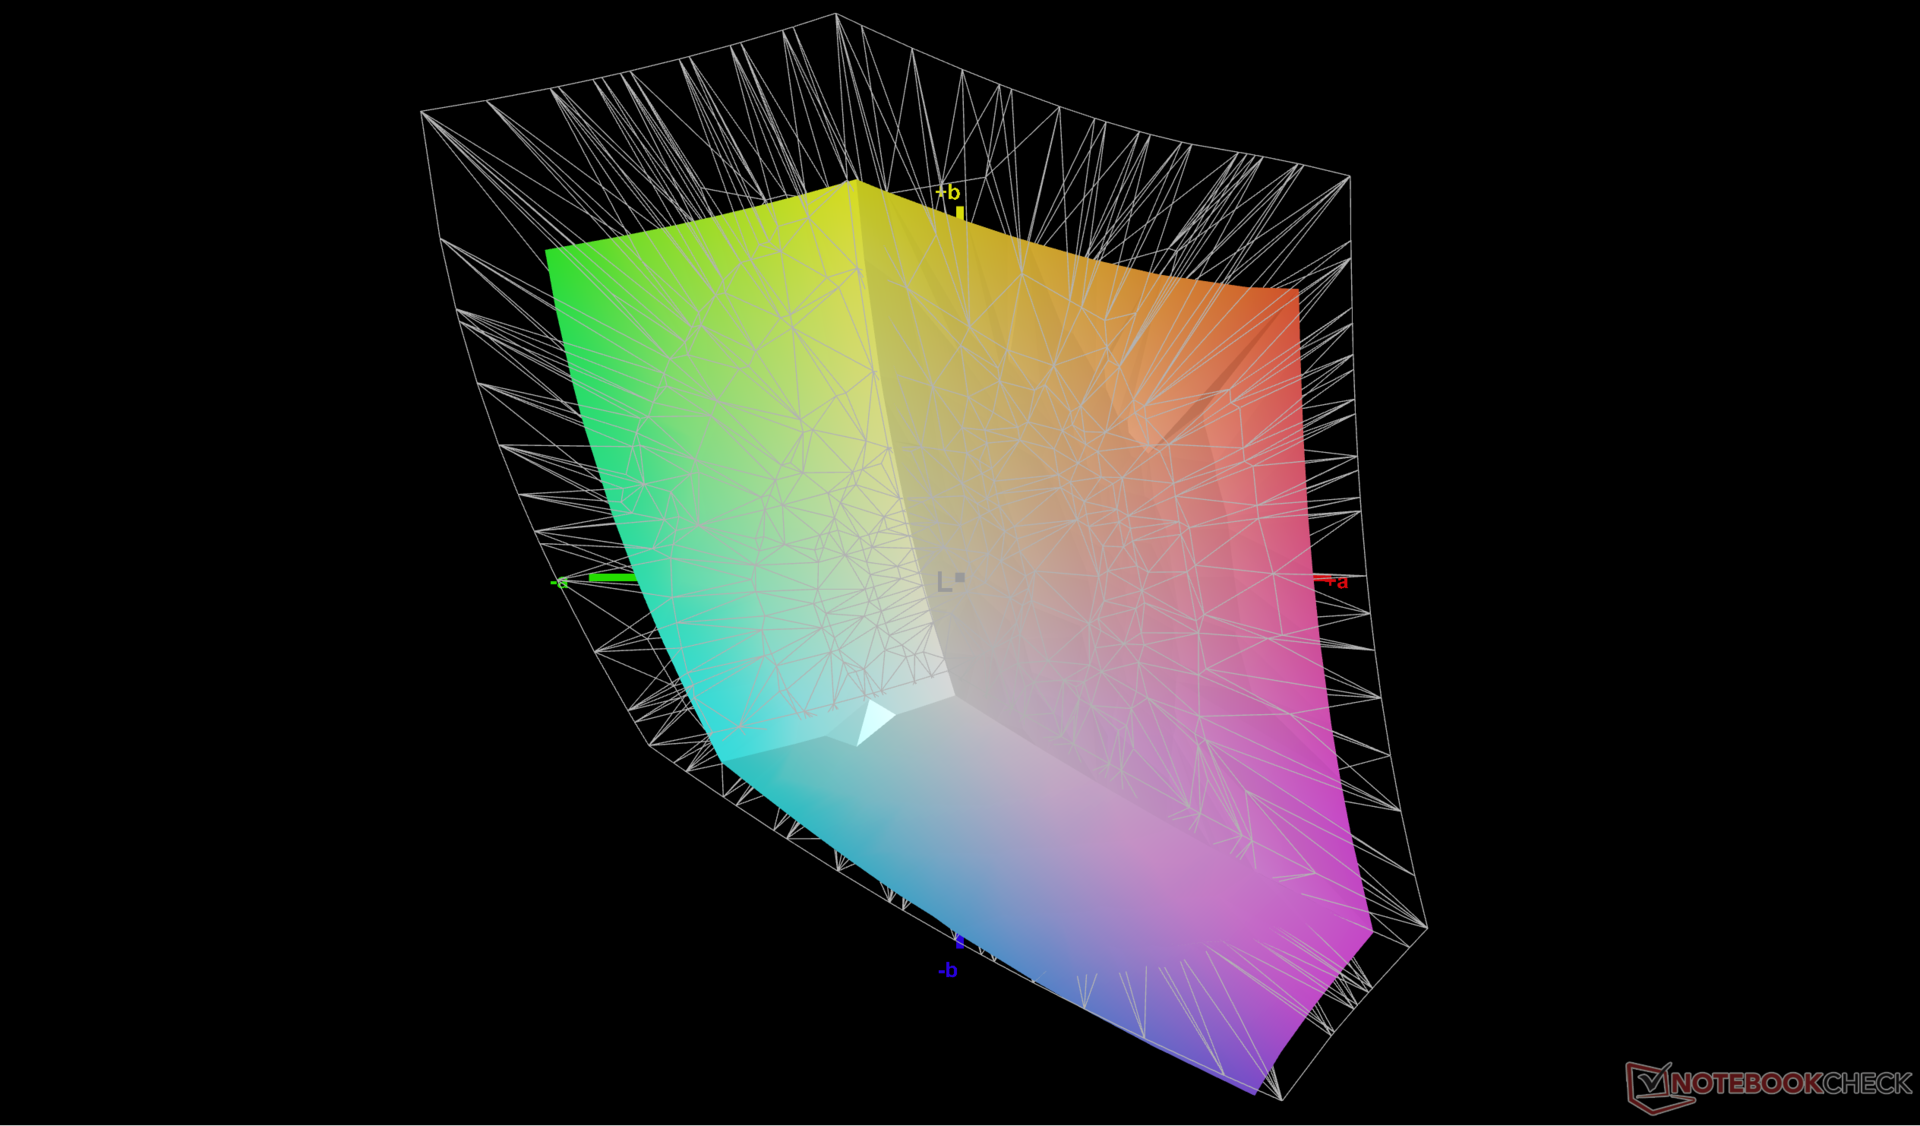
Skärmen levereras förkalibrerad mot sRGB-standarden. De genomsnittliga värdena för gråskala och färgdeltaE är endast 1,8 respektive 1,32, så en kalibrering för slutanvändaren är inte nödvändig.
Visa svarstider
| ↔ Svarstid svart till vitt | ||
|---|---|---|
| 11.2 ms ... stiga ↗ och falla ↘ kombinerat | ↗ 6 ms stiga | 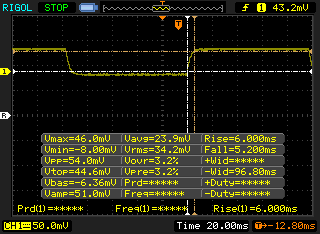 |
| ↘ 5.2 ms hösten | ||
| Skärmen visar bra svarsfrekvens i våra tester, men kan vara för långsam för konkurrenskraftiga spelare. I jämförelse sträcker sig alla testade enheter från 0.1 (minst) till 240 (maximalt) ms. » 30 % av alla enheter är bättre. Det betyder att den uppmätta svarstiden är bättre än genomsnittet av alla testade enheter (19.8 ms). | ||
| ↔ Svarstid 50 % grått till 80 % grått | ||
| 15.6 ms ... stiga ↗ och falla ↘ kombinerat | ↗ 7.2 ms stiga | 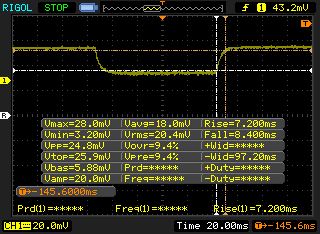 |
| ↘ 8.4 ms hösten | ||
| Skärmen visar bra svarsfrekvens i våra tester, men kan vara för långsam för konkurrenskraftiga spelare. I jämförelse sträcker sig alla testade enheter från 0.165 (minst) till 636 (maximalt) ms. » 30 % av alla enheter är bättre. Det betyder att den uppmätta svarstiden är bättre än genomsnittet av alla testade enheter (31 ms). | ||
Skärmflimmer / PWM (Puls-Width Modulation)
| Skärmflimmer / PWM upptäcktes inte | 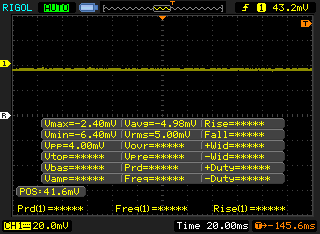 | ||
Som jämförelse: 52 % av alla testade enheter använder inte PWM för att dämpa skärmen. Om PWM upptäcktes mättes ett medelvärde av 7754 (minst: 5 - maximum: 343500) Hz. | |||
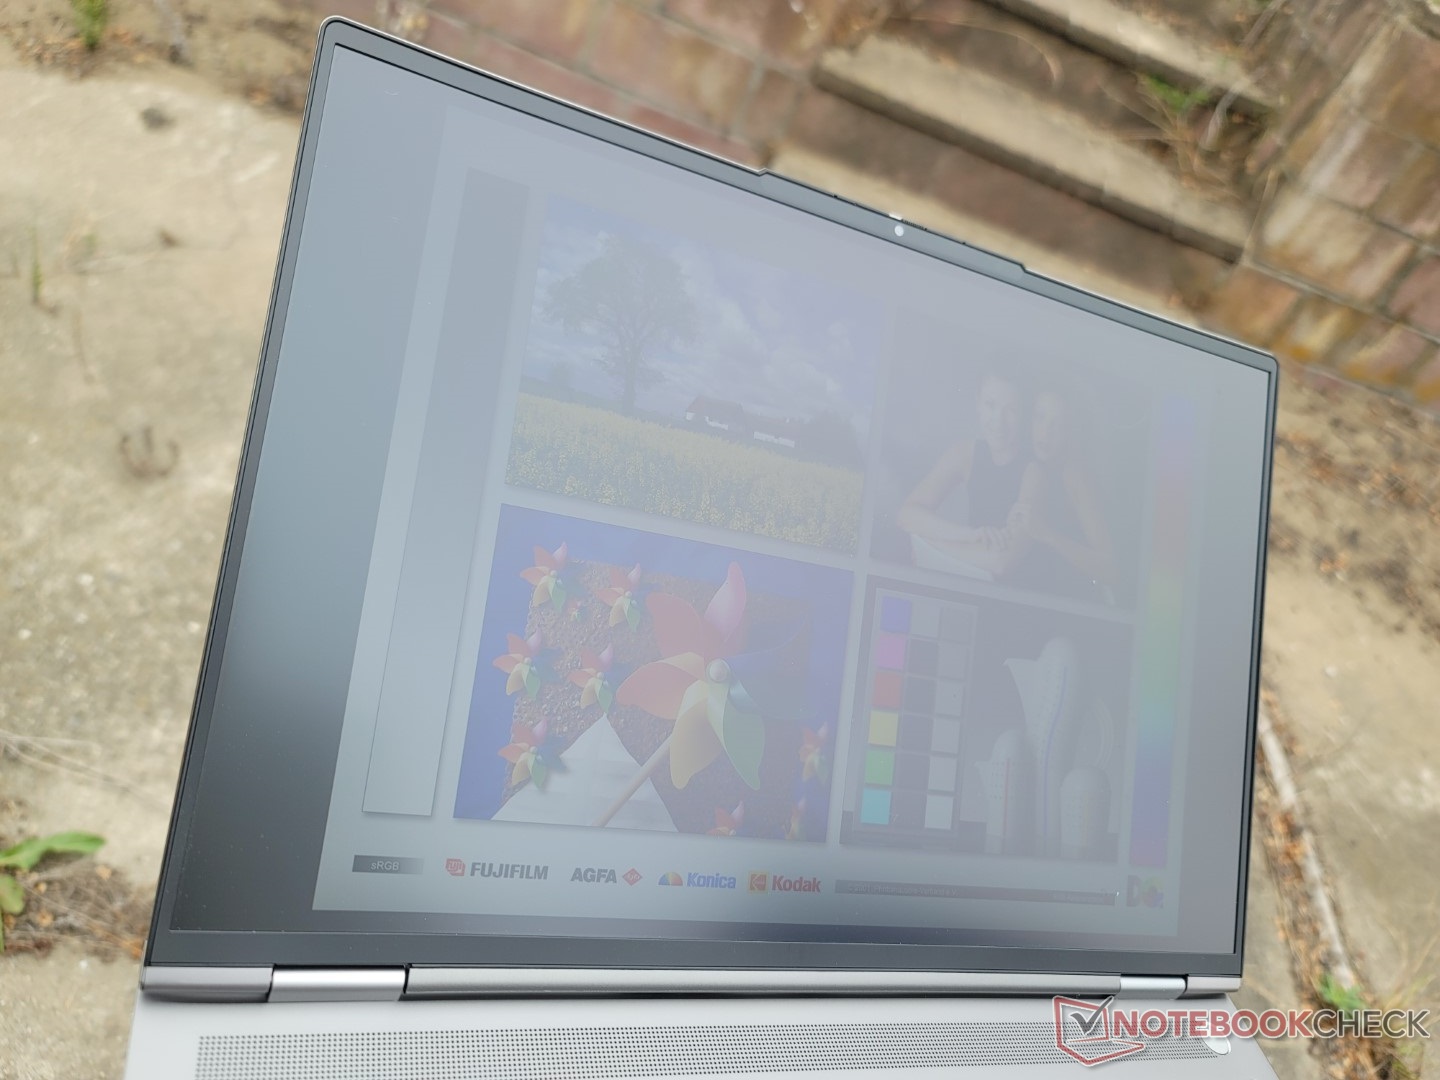
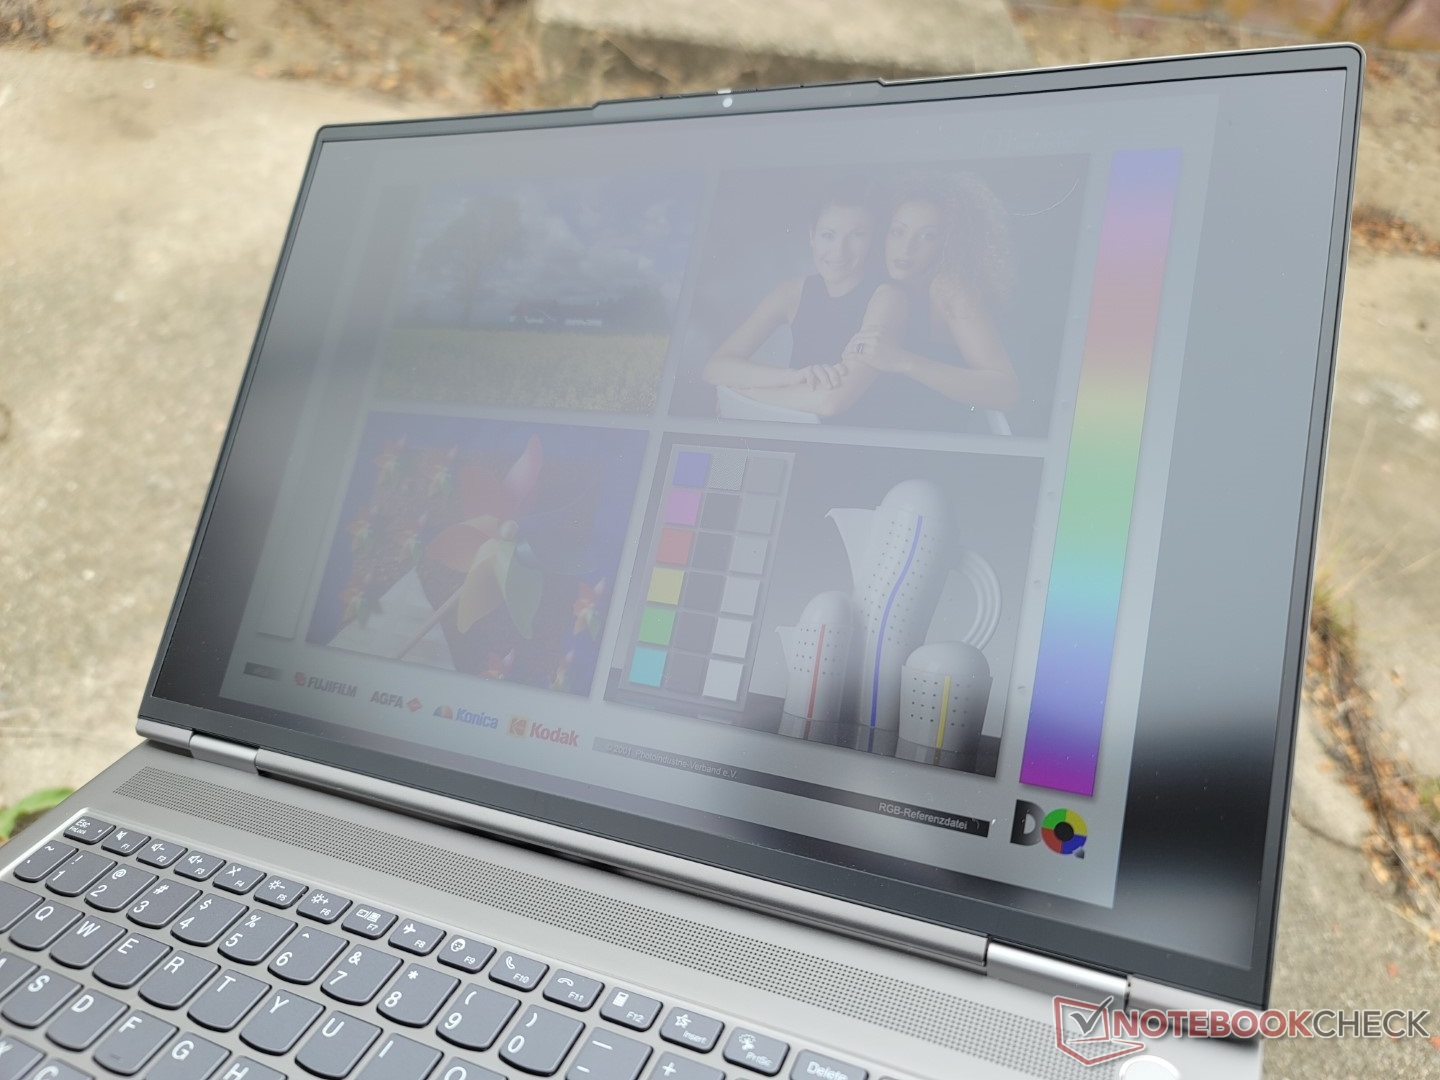
Utomhus är sikten hyfsad om den ligger i skugga. Det matta överdraget och den relativt ljusa bakgrundsbelysningen på 500 nit bidrar till att minimera bländning mer än med ett glansigt alternativ.
Prestanda
Provningsförhållanden
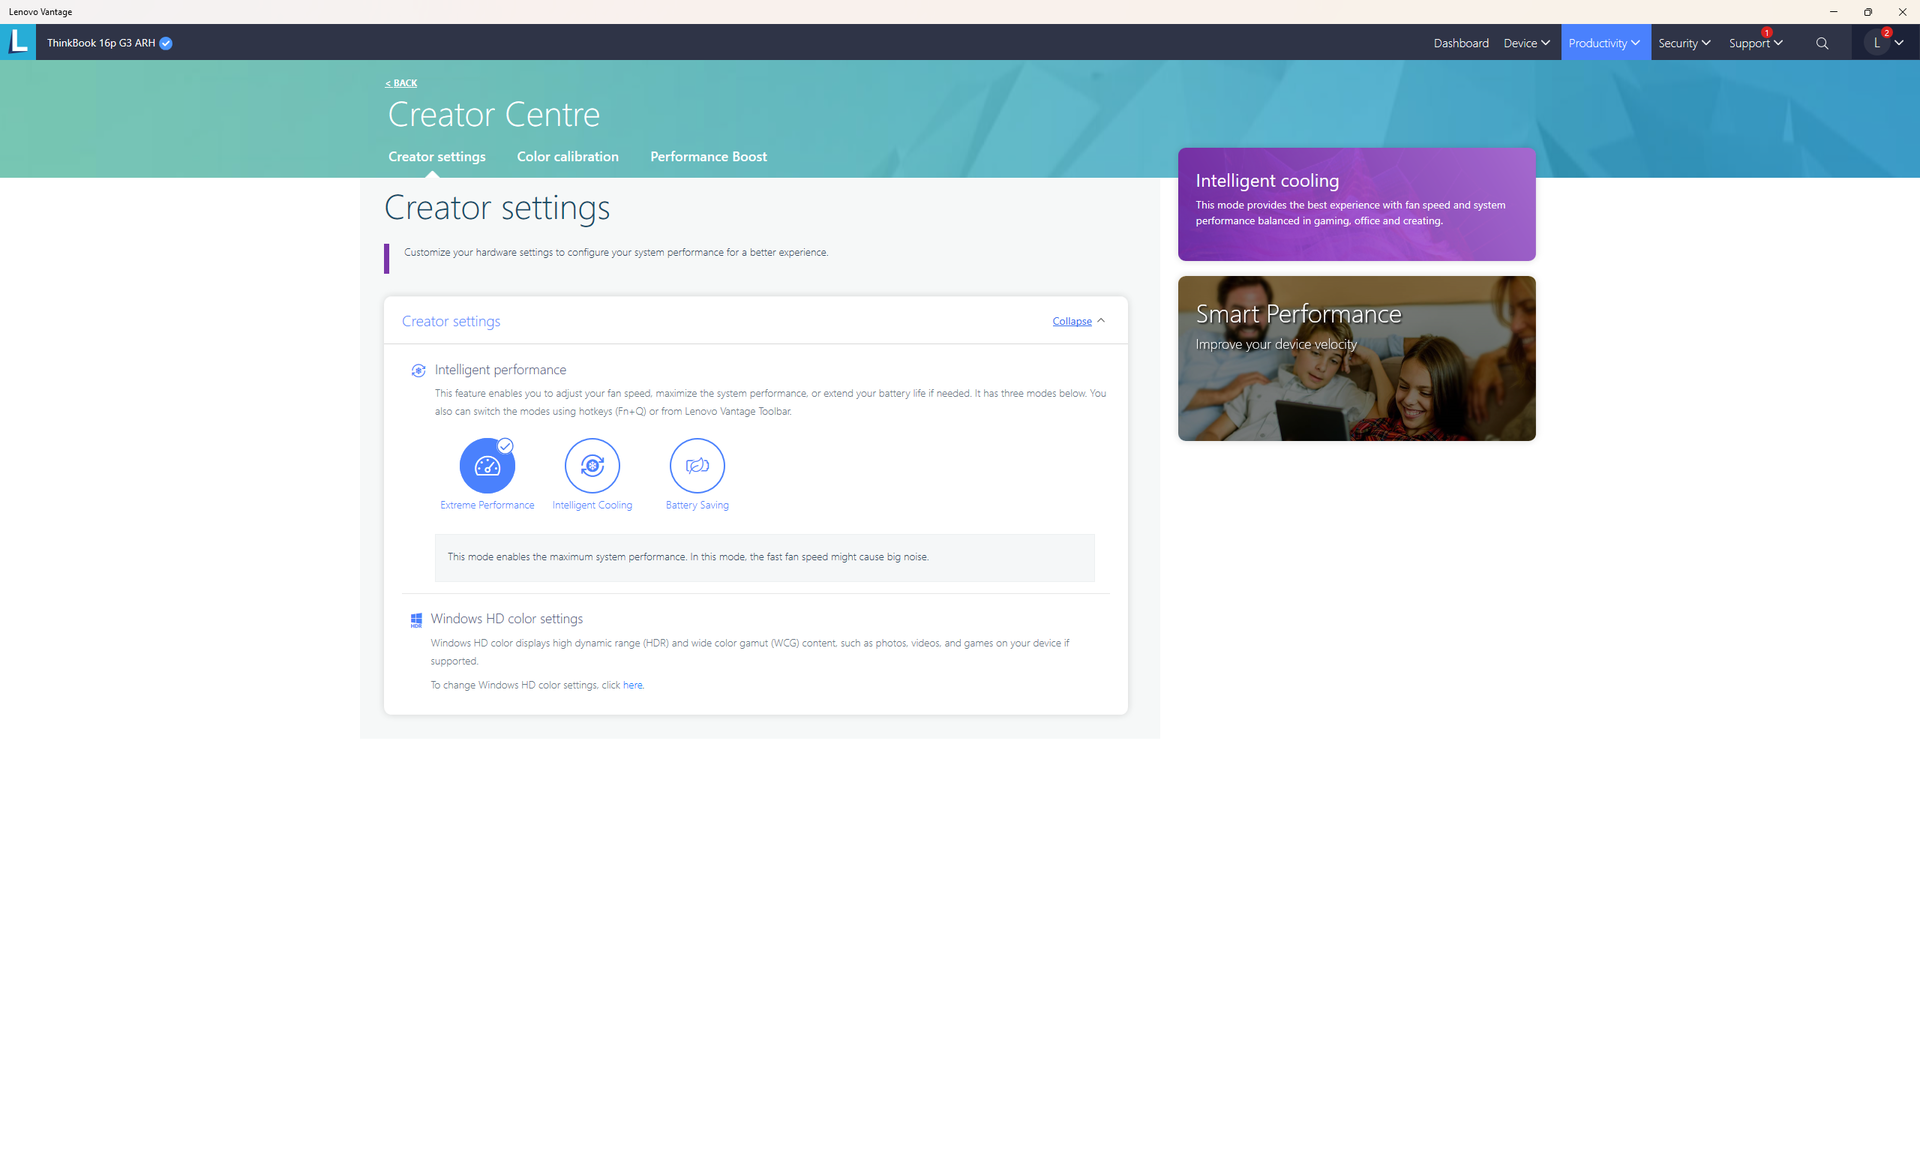
Vi ställde in vår enhet i prestandaläge via Windows och Extreme Performance-läge via Lenovo Vantage-programvaran innan vi körde alla benchmarks nedan. Det rekommenderas att du bekantar dig med Lenovo Vantage eftersom det är kontrollcentret för uppdateringar och inställningar, vilket framgår av skärmdumparna nedan.

Processor
CPU-prestanda är en blandad kompott. Även om Ryzen 9 6900HX är en av de snabbaste mobila processorerna från AMD, är prestandan i stort sett identisk med den för Ryzen 9 5900HX. Faktum är att den knappt är snabbare än Ryzen 7 6800H. Nedgradering till Ryzen 5 6600H konfiguration minskar prestandan för enkel- och flertrådsbehandling med cirka 5 procent respektive 20 procent.
Cinebench R15 Multi Loop
Cinebench R23: Multi Core | Single Core
Cinebench R15: CPU Multi 64Bit | CPU Single 64Bit
Blender: v2.79 BMW27 CPU
7-Zip 18.03: 7z b 4 | 7z b 4 -mmt1
Geekbench 5.5: Multi-Core | Single-Core
HWBOT x265 Benchmark v2.2: 4k Preset
LibreOffice : 20 Documents To PDF
R Benchmark 2.5: Overall mean
| Cinebench R20 / CPU (Multi Core) | |
| Lenovo Legion 5 Pro 16IAH7H | |
| Razer Blade 15 2022 | |
| Lenovo ThinkBook 16p G3 ARH | |
| Genomsnitt AMD Ryzen 9 6900HX (3742 - 5813, n=19) | |
| Lenovo ThinkBook 16p G2 ACH | |
| HP Envy 16 h0112nr | |
| Asus ROG Zephyrus G14 GA402RJ | |
| Lenovo IdeaPad 5 Pro 16ACH | |
| Lenovo Legion 5 Pro 16 ARH7H-82RG0047GE | |
| Aorus 15P XC | |
| Acer Swift X SFX16-51G-5388 | |
| Cinebench R20 / CPU (Single Core) | |
| Razer Blade 15 2022 | |
| HP Envy 16 h0112nr | |
| Lenovo Legion 5 Pro 16IAH7H | |
| Genomsnitt AMD Ryzen 9 6900HX (595 - 631, n=19) | |
| Lenovo ThinkBook 16p G3 ARH | |
| Lenovo ThinkBook 16p G2 ACH | |
| Lenovo Legion 5 Pro 16 ARH7H-82RG0047GE | |
| Asus ROG Zephyrus G14 GA402RJ | |
| Acer Swift X SFX16-51G-5388 | |
| Lenovo IdeaPad 5 Pro 16ACH | |
| Aorus 15P XC | |
| Cinebench R23 / Multi Core | |
| Lenovo Legion 5 Pro 16IAH7H | |
| Razer Blade 15 2022 | |
| Lenovo ThinkBook 16p G3 ARH | |
| Genomsnitt AMD Ryzen 9 6900HX (9709 - 15100, n=19) | |
| Lenovo ThinkBook 16p G2 ACH | |
| HP Envy 16 h0112nr | |
| Asus ROG Zephyrus G14 GA402RJ | |
| Lenovo IdeaPad 5 Pro 16ACH | |
| Lenovo Legion 5 Pro 16 ARH7H-82RG0047GE | |
| Aorus 15P XC | |
| Acer Swift X SFX16-51G-5388 | |
| Cinebench R23 / Single Core | |
| Razer Blade 15 2022 | |
| HP Envy 16 h0112nr | |
| Lenovo Legion 5 Pro 16IAH7H | |
| Genomsnitt AMD Ryzen 9 6900HX (1516 - 1616, n=19) | |
| Lenovo ThinkBook 16p G3 ARH | |
| Lenovo ThinkBook 16p G2 ACH | |
| Lenovo Legion 5 Pro 16 ARH7H-82RG0047GE | |
| Asus ROG Zephyrus G14 GA402RJ | |
| Lenovo IdeaPad 5 Pro 16ACH | |
| Acer Swift X SFX16-51G-5388 | |
| Aorus 15P XC | |
| Cinebench R15 / CPU Multi 64Bit | |
| Lenovo Legion 5 Pro 16IAH7H | |
| HP Envy 16 h0112nr | |
| Razer Blade 15 2022 | |
| Genomsnitt AMD Ryzen 9 6900HX (1588 - 2411, n=19) | |
| Lenovo ThinkBook 16p G3 ARH | |
| Lenovo ThinkBook 16p G2 ACH | |
| Asus ROG Zephyrus G14 GA402RJ | |
| Lenovo IdeaPad 5 Pro 16ACH | |
| Lenovo Legion 5 Pro 16 ARH7H-82RG0047GE | |
| Aorus 15P XC | |
| Acer Swift X SFX16-51G-5388 | |
| Cinebench R15 / CPU Single 64Bit | |
| Razer Blade 15 2022 | |
| HP Envy 16 h0112nr | |
| Lenovo Legion 5 Pro 16IAH7H | |
| Genomsnitt AMD Ryzen 9 6900HX (241 - 261, n=19) | |
| Lenovo ThinkBook 16p G3 ARH | |
| Lenovo ThinkBook 16p G2 ACH | |
| Lenovo Legion 5 Pro 16 ARH7H-82RG0047GE | |
| Asus ROG Zephyrus G14 GA402RJ | |
| Lenovo IdeaPad 5 Pro 16ACH | |
| Acer Swift X SFX16-51G-5388 | |
| Aorus 15P XC | |
| Blender / v2.79 BMW27 CPU | |
| Acer Swift X SFX16-51G-5388 | |
| Aorus 15P XC | |
| Lenovo Legion 5 Pro 16 ARH7H-82RG0047GE | |
| Lenovo IdeaPad 5 Pro 16ACH | |
| Asus ROG Zephyrus G14 GA402RJ | |
| HP Envy 16 h0112nr | |
| Lenovo ThinkBook 16p G3 ARH | |
| Genomsnitt AMD Ryzen 9 6900HX (212 - 357, n=21) | |
| Lenovo ThinkBook 16p G2 ACH | |
| Razer Blade 15 2022 | |
| Lenovo Legion 5 Pro 16IAH7H | |
| 7-Zip 18.03 / 7z b 4 | |
| Lenovo Legion 5 Pro 16IAH7H | |
| Razer Blade 15 2022 | |
| Genomsnitt AMD Ryzen 9 6900HX (49526 - 65336, n=20) | |
| Lenovo ThinkBook 16p G2 ACH | |
| Asus ROG Zephyrus G14 GA402RJ | |
| Lenovo ThinkBook 16p G3 ARH | |
| HP Envy 16 h0112nr | |
| Lenovo IdeaPad 5 Pro 16ACH | |
| Lenovo Legion 5 Pro 16 ARH7H-82RG0047GE | |
| Aorus 15P XC | |
| Acer Swift X SFX16-51G-5388 | |
| 7-Zip 18.03 / 7z b 4 -mmt1 | |
| Genomsnitt AMD Ryzen 9 6900HX (5090 - 6070, n=20) | |
| Lenovo ThinkBook 16p G2 ACH | |
| Razer Blade 15 2022 | |
| HP Envy 16 h0112nr | |
| Lenovo Legion 5 Pro 16 ARH7H-82RG0047GE | |
| Asus ROG Zephyrus G14 GA402RJ | |
| Lenovo Legion 5 Pro 16IAH7H | |
| Lenovo IdeaPad 5 Pro 16ACH | |
| Aorus 15P XC | |
| Lenovo ThinkBook 16p G3 ARH | |
| Acer Swift X SFX16-51G-5388 | |
| Geekbench 5.5 / Multi-Core | |
| Lenovo Legion 5 Pro 16IAH7H | |
| HP Envy 16 h0112nr | |
| Razer Blade 15 2022 | |
| Genomsnitt AMD Ryzen 9 6900HX (8313 - 10490, n=21) | |
| Lenovo ThinkBook 16p G3 ARH | |
| Asus ROG Zephyrus G14 GA402RJ | |
| Lenovo ThinkBook 16p G2 ACH | |
| Aorus 15P XC | |
| Lenovo Legion 5 Pro 16 ARH7H-82RG0047GE | |
| Lenovo IdeaPad 5 Pro 16ACH | |
| Acer Swift X SFX16-51G-5388 | |
| Geekbench 5.5 / Single-Core | |
| HP Envy 16 h0112nr | |
| Razer Blade 15 2022 | |
| Lenovo Legion 5 Pro 16IAH7H | |
| Genomsnitt AMD Ryzen 9 6900HX (1523 - 1652, n=21) | |
| Lenovo ThinkBook 16p G3 ARH | |
| Lenovo ThinkBook 16p G2 ACH | |
| Acer Swift X SFX16-51G-5388 | |
| Asus ROG Zephyrus G14 GA402RJ | |
| Lenovo Legion 5 Pro 16 ARH7H-82RG0047GE | |
| Lenovo IdeaPad 5 Pro 16ACH | |
| Aorus 15P XC | |
| HWBOT x265 Benchmark v2.2 / 4k Preset | |
| Lenovo Legion 5 Pro 16IAH7H | |
| Razer Blade 15 2022 | |
| Lenovo ThinkBook 16p G3 ARH | |
| Genomsnitt AMD Ryzen 9 6900HX (12.6 - 18.7, n=20) | |
| Lenovo ThinkBook 16p G2 ACH | |
| Asus ROG Zephyrus G14 GA402RJ | |
| HP Envy 16 h0112nr | |
| Lenovo Legion 5 Pro 16 ARH7H-82RG0047GE | |
| Lenovo IdeaPad 5 Pro 16ACH | |
| Aorus 15P XC | |
| Acer Swift X SFX16-51G-5388 | |
| LibreOffice / 20 Documents To PDF | |
| Lenovo Legion 5 Pro 16 ARH7H-82RG0047GE | |
| Lenovo ThinkBook 16p G3 ARH | |
| Asus ROG Zephyrus G14 GA402RJ | |
| Lenovo ThinkBook 16p G2 ACH | |
| Aorus 15P XC | |
| Genomsnitt AMD Ryzen 9 6900HX (44.8 - 81.7, n=20) | |
| Razer Blade 15 2022 | |
| Acer Swift X SFX16-51G-5388 | |
| Lenovo IdeaPad 5 Pro 16ACH | |
| HP Envy 16 h0112nr | |
| Lenovo Legion 5 Pro 16IAH7H | |
| R Benchmark 2.5 / Overall mean | |
| Acer Swift X SFX16-51G-5388 | |
| Aorus 15P XC | |
| Lenovo IdeaPad 5 Pro 16ACH | |
| Asus ROG Zephyrus G14 GA402RJ | |
| Lenovo Legion 5 Pro 16 ARH7H-82RG0047GE | |
| Lenovo ThinkBook 16p G2 ACH | |
| Lenovo ThinkBook 16p G3 ARH | |
| Genomsnitt AMD Ryzen 9 6900HX (0.4627 - 0.4974, n=20) | |
| Lenovo Legion 5 Pro 16IAH7H | |
| Razer Blade 15 2022 | |
| HP Envy 16 h0112nr | |
* ... mindre är bättre
AIDA64: FP32 Ray-Trace | FPU Julia | CPU SHA3 | CPU Queen | FPU SinJulia | FPU Mandel | CPU AES | CPU ZLib | FP64 Ray-Trace | CPU PhotoWorxx
| Performance rating | |
| Genomsnitt AMD Ryzen 9 6900HX | |
| Lenovo ThinkBook 16p G2 ACH | |
| Lenovo ThinkBook 16p G3 ARH | |
| Lenovo Legion 5 Pro 16IAH7H | |
| HP Envy 16 h0112nr | |
| Lenovo IdeaPad 5 Pro 16ARH7 | |
| Acer Swift X SFX16-51G-5388 | |
| AIDA64 / FP32 Ray-Trace | |
| Lenovo ThinkBook 16p G3 ARH | |
| Lenovo ThinkBook 16p G2 ACH | |
| Genomsnitt AMD Ryzen 9 6900HX (10950 - 17963, n=20) | |
| Lenovo Legion 5 Pro 16IAH7H | |
| Lenovo Legion 5 Pro 16IAH7H | |
| HP Envy 16 h0112nr | |
| Lenovo IdeaPad 5 Pro 16ARH7 | |
| Acer Swift X SFX16-51G-5388 | |
| AIDA64 / FPU Julia | |
| Lenovo ThinkBook 16p G3 ARH | |
| Lenovo ThinkBook 16p G2 ACH | |
| Genomsnitt AMD Ryzen 9 6900HX (71414 - 110797, n=20) | |
| Lenovo Legion 5 Pro 16IAH7H | |
| Lenovo Legion 5 Pro 16IAH7H | |
| Lenovo IdeaPad 5 Pro 16ARH7 | |
| HP Envy 16 h0112nr | |
| Acer Swift X SFX16-51G-5388 | |
| AIDA64 / CPU SHA3 | |
| Lenovo Legion 5 Pro 16IAH7H | |
| Lenovo Legion 5 Pro 16IAH7H | |
| Lenovo ThinkBook 16p G2 ACH | |
| Genomsnitt AMD Ryzen 9 6900HX (2471 - 3804, n=20) | |
| Lenovo ThinkBook 16p G3 ARH | |
| HP Envy 16 h0112nr | |
| Lenovo IdeaPad 5 Pro 16ARH7 | |
| Acer Swift X SFX16-51G-5388 | |
| AIDA64 / CPU Queen | |
| Lenovo ThinkBook 16p G3 ARH | |
| Lenovo ThinkBook 16p G2 ACH | |
| HP Envy 16 h0112nr | |
| Genomsnitt AMD Ryzen 9 6900HX (84185 - 107544, n=20) | |
| Lenovo Legion 5 Pro 16IAH7H | |
| Lenovo IdeaPad 5 Pro 16ARH7 | |
| Acer Swift X SFX16-51G-5388 | |
| AIDA64 / FPU SinJulia | |
| Lenovo ThinkBook 16p G3 ARH | |
| Genomsnitt AMD Ryzen 9 6900HX (10970 - 13205, n=20) | |
| Lenovo ThinkBook 16p G2 ACH | |
| Lenovo Legion 5 Pro 16IAH7H | |
| Lenovo Legion 5 Pro 16IAH7H | |
| Lenovo IdeaPad 5 Pro 16ARH7 | |
| HP Envy 16 h0112nr | |
| Acer Swift X SFX16-51G-5388 | |
| AIDA64 / FPU Mandel | |
| Lenovo ThinkBook 16p G3 ARH | |
| Lenovo ThinkBook 16p G2 ACH | |
| Genomsnitt AMD Ryzen 9 6900HX (39164 - 61370, n=20) | |
| Lenovo IdeaPad 5 Pro 16ARH7 | |
| Lenovo Legion 5 Pro 16IAH7H | |
| Lenovo Legion 5 Pro 16IAH7H | |
| HP Envy 16 h0112nr | |
| Acer Swift X SFX16-51G-5388 | |
| AIDA64 / CPU ZLib | |
| Lenovo Legion 5 Pro 16IAH7H | |
| Lenovo Legion 5 Pro 16IAH7H | |
| Lenovo ThinkBook 16p G3 ARH | |
| Lenovo ThinkBook 16p G2 ACH | |
| HP Envy 16 h0112nr | |
| Genomsnitt AMD Ryzen 9 6900HX (578 - 911, n=20) | |
| Lenovo IdeaPad 5 Pro 16ARH7 | |
| Acer Swift X SFX16-51G-5388 | |
| AIDA64 / FP64 Ray-Trace | |
| Lenovo ThinkBook 16p G3 ARH | |
| Lenovo ThinkBook 16p G2 ACH | |
| Genomsnitt AMD Ryzen 9 6900HX (5798 - 9540, n=20) | |
| Lenovo Legion 5 Pro 16IAH7H | |
| Lenovo Legion 5 Pro 16IAH7H | |
| HP Envy 16 h0112nr | |
| Lenovo IdeaPad 5 Pro 16ARH7 | |
| Acer Swift X SFX16-51G-5388 | |
| AIDA64 / CPU PhotoWorxx | |
| HP Envy 16 h0112nr | |
| Acer Swift X SFX16-51G-5388 | |
| Lenovo Legion 5 Pro 16IAH7H | |
| Lenovo Legion 5 Pro 16IAH7H | |
| Genomsnitt AMD Ryzen 9 6900HX (26873 - 30604, n=20) | |
| Lenovo IdeaPad 5 Pro 16ARH7 | |
| Lenovo ThinkBook 16p G3 ARH | |
| Lenovo ThinkBook 16p G2 ACH | |
Systemets prestanda
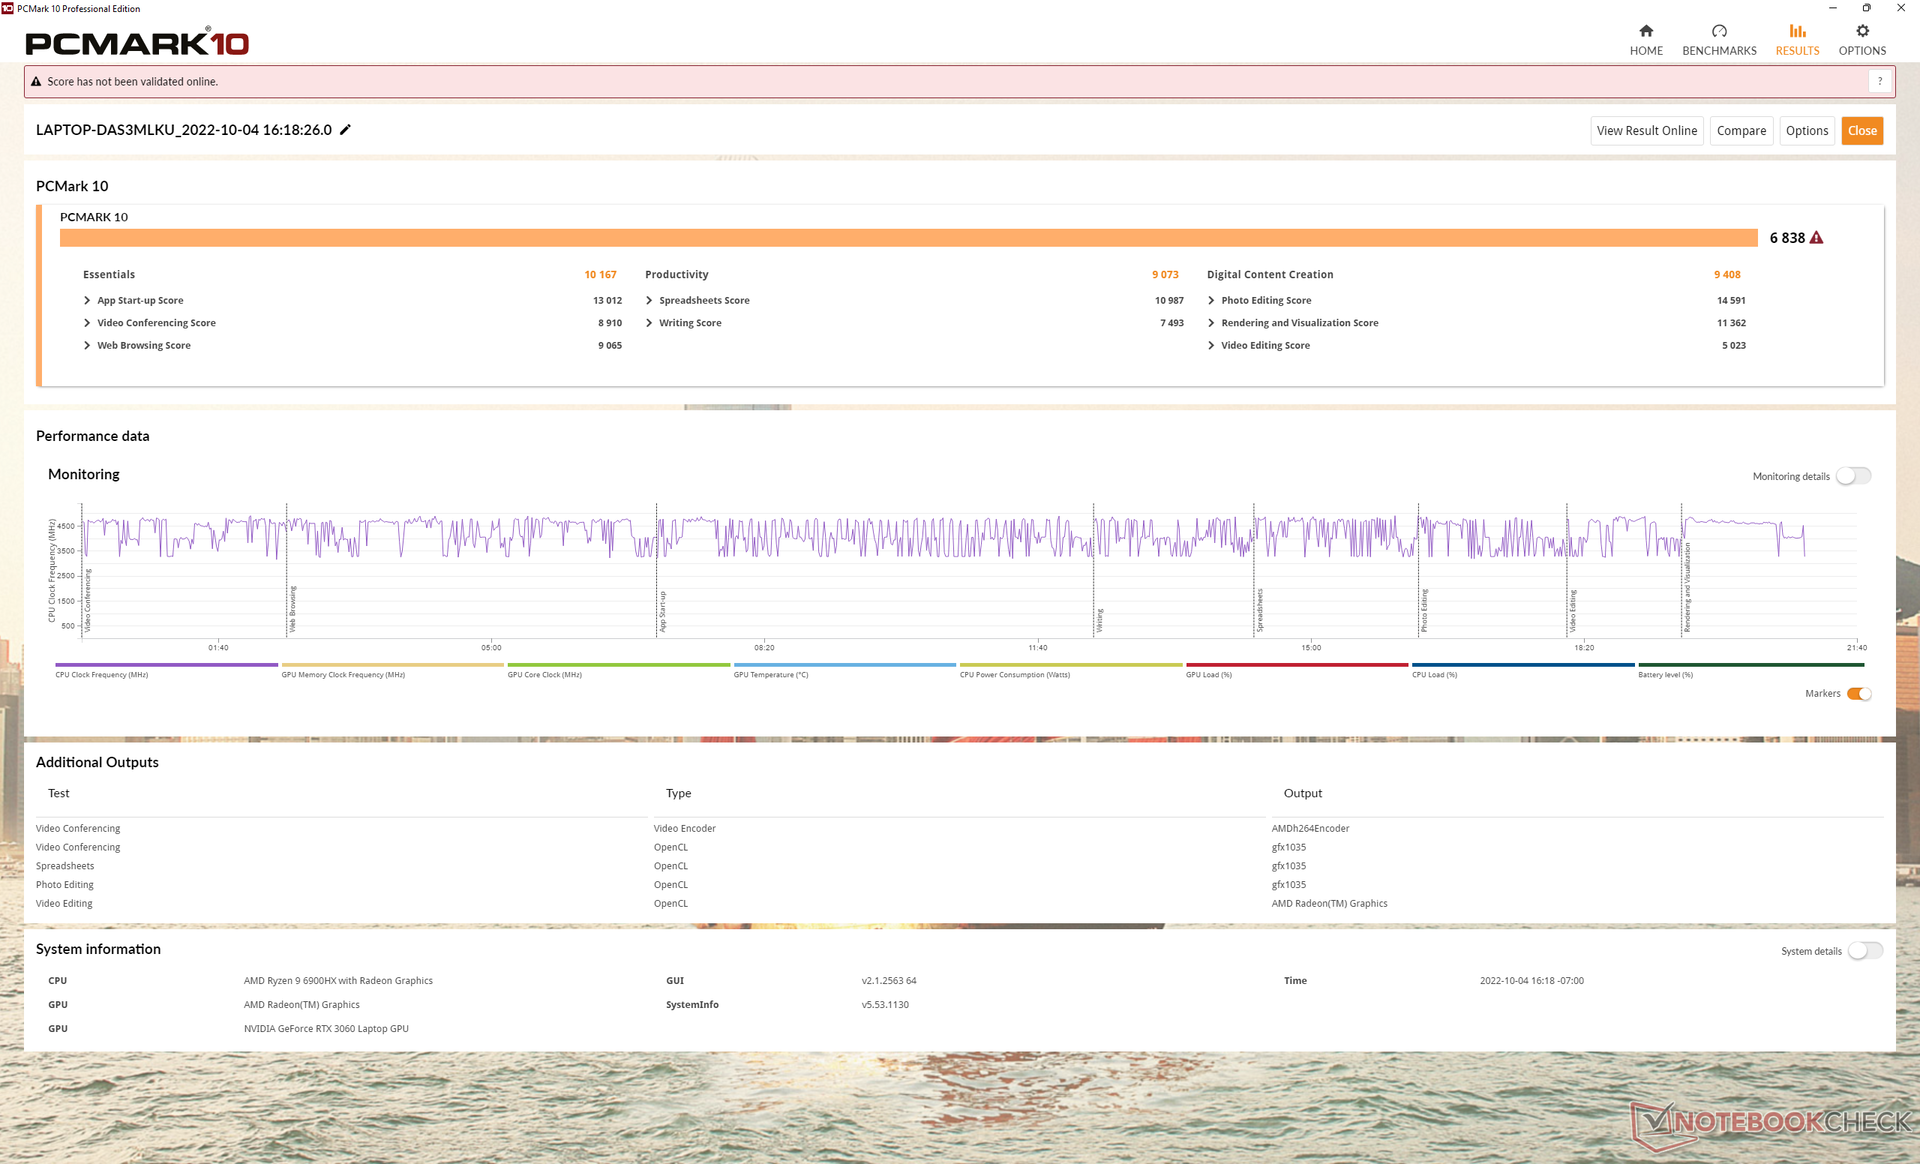
PCMark-resultaten är nästan identiska med ThinkBook 16p Gen 2, eftersom CPU-prestandan knappt är bättre som nämnts ovan.
CrossMark: Overall | Productivity | Creativity | Responsiveness
| PCMark 10 / Score | |
| HP Envy 16 h0112nr | |
| Lenovo Legion 5 Pro 16IAH7H | |
| Lenovo ThinkBook 16p G3 ARH | |
| Genomsnitt AMD Ryzen 9 6900HX, NVIDIA GeForce RTX 3060 Laptop GPU (n=1) | |
| Lenovo ThinkBook 16p G2 ACH | |
| Lenovo IdeaPad 5 Pro 16ARH7 | |
| Acer Swift X SFX16-51G-5388 | |
| PCMark 10 / Essentials | |
| HP Envy 16 h0112nr | |
| Lenovo Legion 5 Pro 16IAH7H | |
| Lenovo ThinkBook 16p G2 ACH | |
| Lenovo ThinkBook 16p G3 ARH | |
| Genomsnitt AMD Ryzen 9 6900HX, NVIDIA GeForce RTX 3060 Laptop GPU (n=1) | |
| Lenovo IdeaPad 5 Pro 16ARH7 | |
| Acer Swift X SFX16-51G-5388 | |
| PCMark 10 / Productivity | |
| Lenovo Legion 5 Pro 16IAH7H | |
| HP Envy 16 h0112nr | |
| Lenovo ThinkBook 16p G2 ACH | |
| Lenovo ThinkBook 16p G3 ARH | |
| Genomsnitt AMD Ryzen 9 6900HX, NVIDIA GeForce RTX 3060 Laptop GPU (n=1) | |
| Lenovo IdeaPad 5 Pro 16ARH7 | |
| Acer Swift X SFX16-51G-5388 | |
| PCMark 10 / Digital Content Creation | |
| Lenovo Legion 5 Pro 16IAH7H | |
| HP Envy 16 h0112nr | |
| Lenovo ThinkBook 16p G3 ARH | |
| Genomsnitt AMD Ryzen 9 6900HX, NVIDIA GeForce RTX 3060 Laptop GPU (n=1) | |
| Lenovo ThinkBook 16p G2 ACH | |
| Acer Swift X SFX16-51G-5388 | |
| Lenovo IdeaPad 5 Pro 16ARH7 | |
| CrossMark / Overall | |
| HP Envy 16 h0112nr | |
| Lenovo Legion 5 Pro 16IAH7H | |
| Lenovo ThinkBook 16p G3 ARH | |
| Genomsnitt AMD Ryzen 9 6900HX, NVIDIA GeForce RTX 3060 Laptop GPU (n=1) | |
| Acer Swift X SFX16-51G-5388 | |
| CrossMark / Productivity | |
| HP Envy 16 h0112nr | |
| Lenovo Legion 5 Pro 16IAH7H | |
| Lenovo ThinkBook 16p G3 ARH | |
| Genomsnitt AMD Ryzen 9 6900HX, NVIDIA GeForce RTX 3060 Laptop GPU (n=1) | |
| Acer Swift X SFX16-51G-5388 | |
| CrossMark / Creativity | |
| HP Envy 16 h0112nr | |
| Lenovo Legion 5 Pro 16IAH7H | |
| Lenovo ThinkBook 16p G3 ARH | |
| Genomsnitt AMD Ryzen 9 6900HX, NVIDIA GeForce RTX 3060 Laptop GPU (n=1) | |
| Acer Swift X SFX16-51G-5388 | |
| CrossMark / Responsiveness | |
| Lenovo Legion 5 Pro 16IAH7H | |
| HP Envy 16 h0112nr | |
| Lenovo ThinkBook 16p G3 ARH | |
| Genomsnitt AMD Ryzen 9 6900HX, NVIDIA GeForce RTX 3060 Laptop GPU (n=1) | |
| Acer Swift X SFX16-51G-5388 | |
| PCMark 10 Score | 6838 poäng | |
Hjälp | ||
| AIDA64 / Memory Copy | |
| HP Envy 16 h0112nr | |
| Acer Swift X SFX16-51G-5388 | |
| Lenovo Legion 5 Pro 16IAH7H | |
| Lenovo Legion 5 Pro 16IAH7H | |
| Lenovo IdeaPad 5 Pro 16ARH7 | |
| Genomsnitt AMD Ryzen 9 6900HX (47938 - 53345, n=20) | |
| Lenovo ThinkBook 16p G3 ARH | |
| Lenovo ThinkBook 16p G2 ACH | |
| AIDA64 / Memory Read | |
| HP Envy 16 h0112nr | |
| Lenovo Legion 5 Pro 16IAH7H | |
| Lenovo Legion 5 Pro 16IAH7H | |
| Acer Swift X SFX16-51G-5388 | |
| Genomsnitt AMD Ryzen 9 6900HX (43892 - 53321, n=20) | |
| Lenovo ThinkBook 16p G2 ACH | |
| Lenovo IdeaPad 5 Pro 16ARH7 | |
| Lenovo ThinkBook 16p G3 ARH | |
| AIDA64 / Memory Write | |
| Lenovo IdeaPad 5 Pro 16ARH7 | |
| Acer Swift X SFX16-51G-5388 | |
| Lenovo Legion 5 Pro 16IAH7H | |
| Lenovo Legion 5 Pro 16IAH7H | |
| HP Envy 16 h0112nr | |
| Genomsnitt AMD Ryzen 9 6900HX (51085 - 57202, n=20) | |
| Lenovo ThinkBook 16p G3 ARH | |
| Lenovo ThinkBook 16p G2 ACH | |
| AIDA64 / Memory Latency | |
| Lenovo ThinkBook 16p G3 ARH | |
| Lenovo IdeaPad 5 Pro 16ARH7 | |
| Lenovo Legion 5 Pro 16IAH7H | |
| Lenovo Legion 5 Pro 16IAH7H | |
| Acer Swift X SFX16-51G-5388 | |
| HP Envy 16 h0112nr | |
| Genomsnitt AMD Ryzen 9 6900HX (80.7 - 120.6, n=20) | |
| Lenovo ThinkBook 16p G2 ACH | |
* ... mindre är bättre
DPC-latenstid
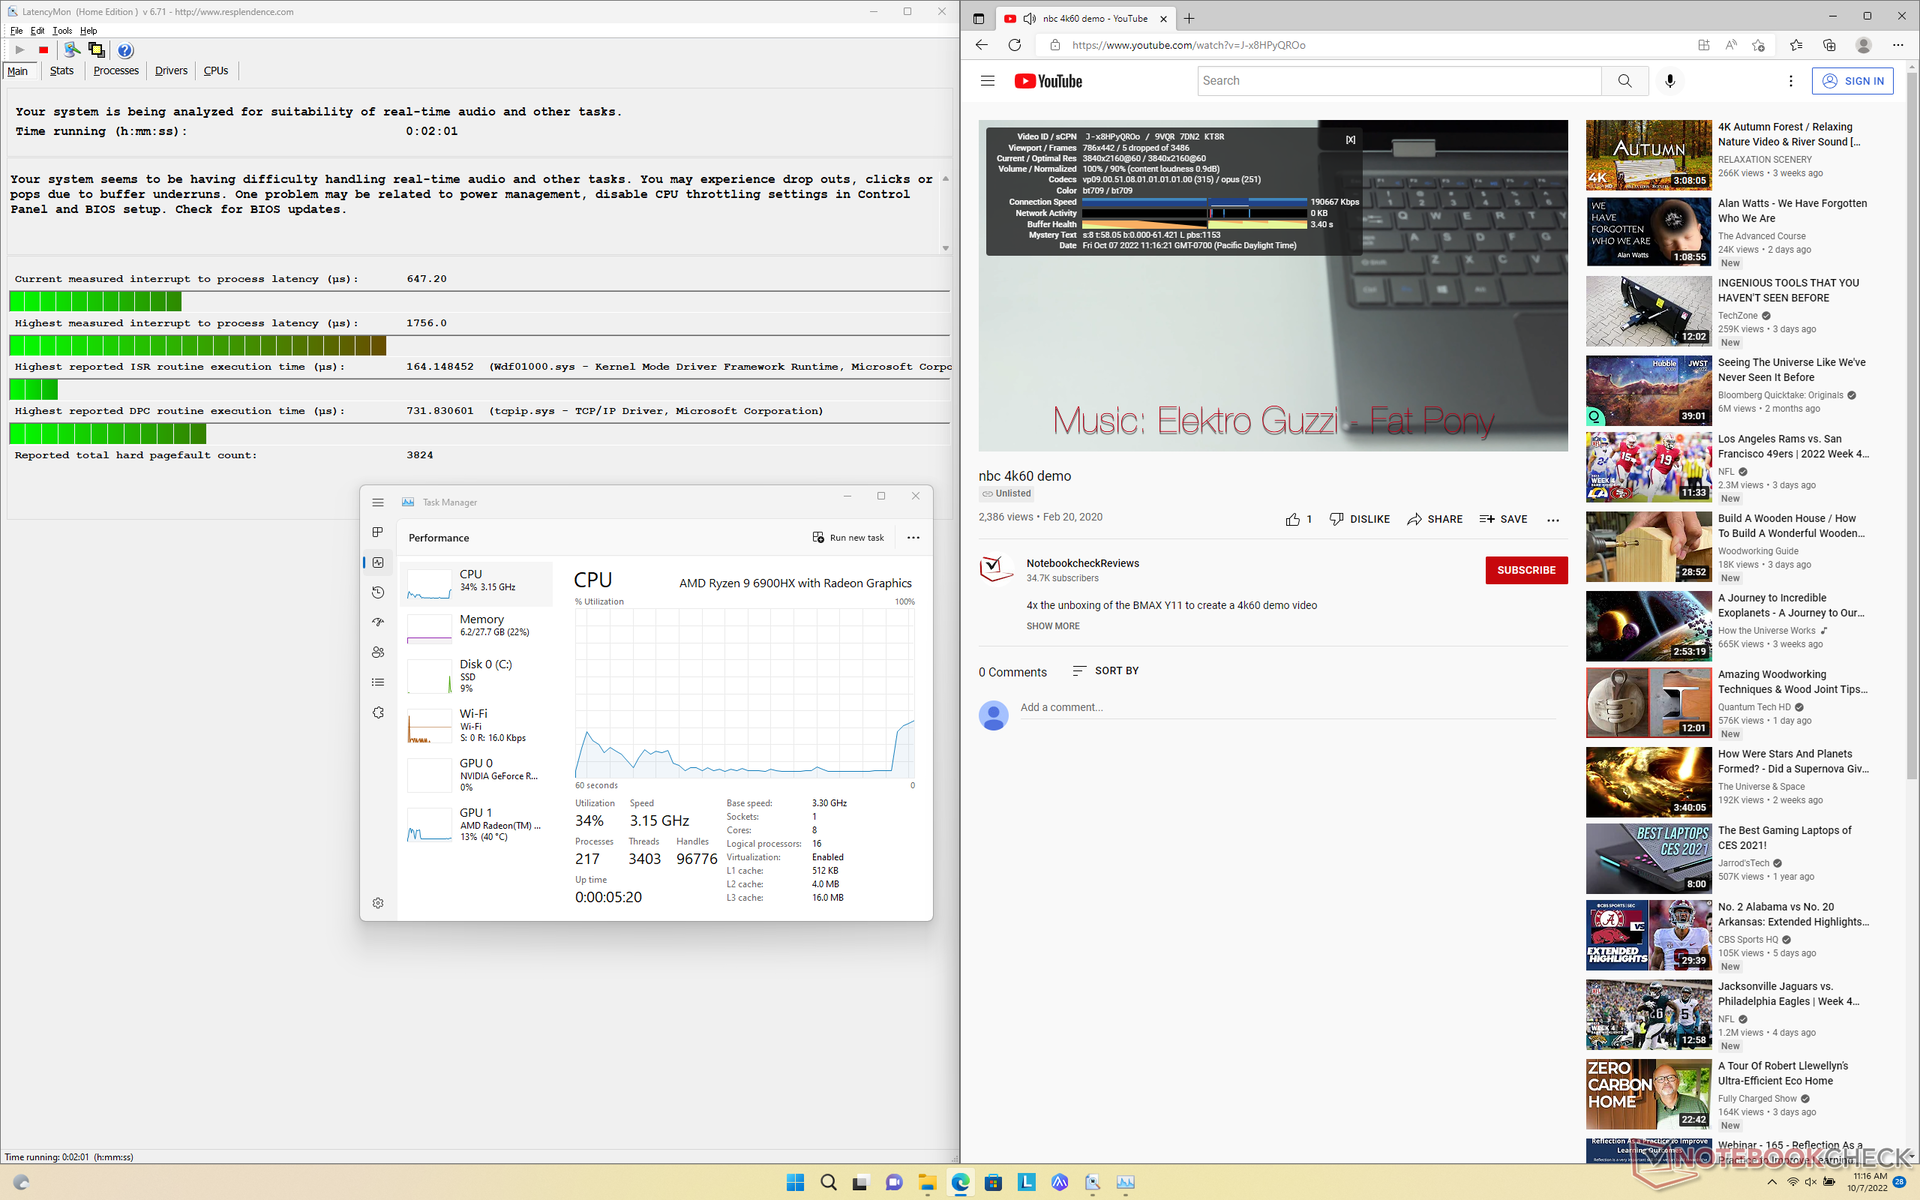
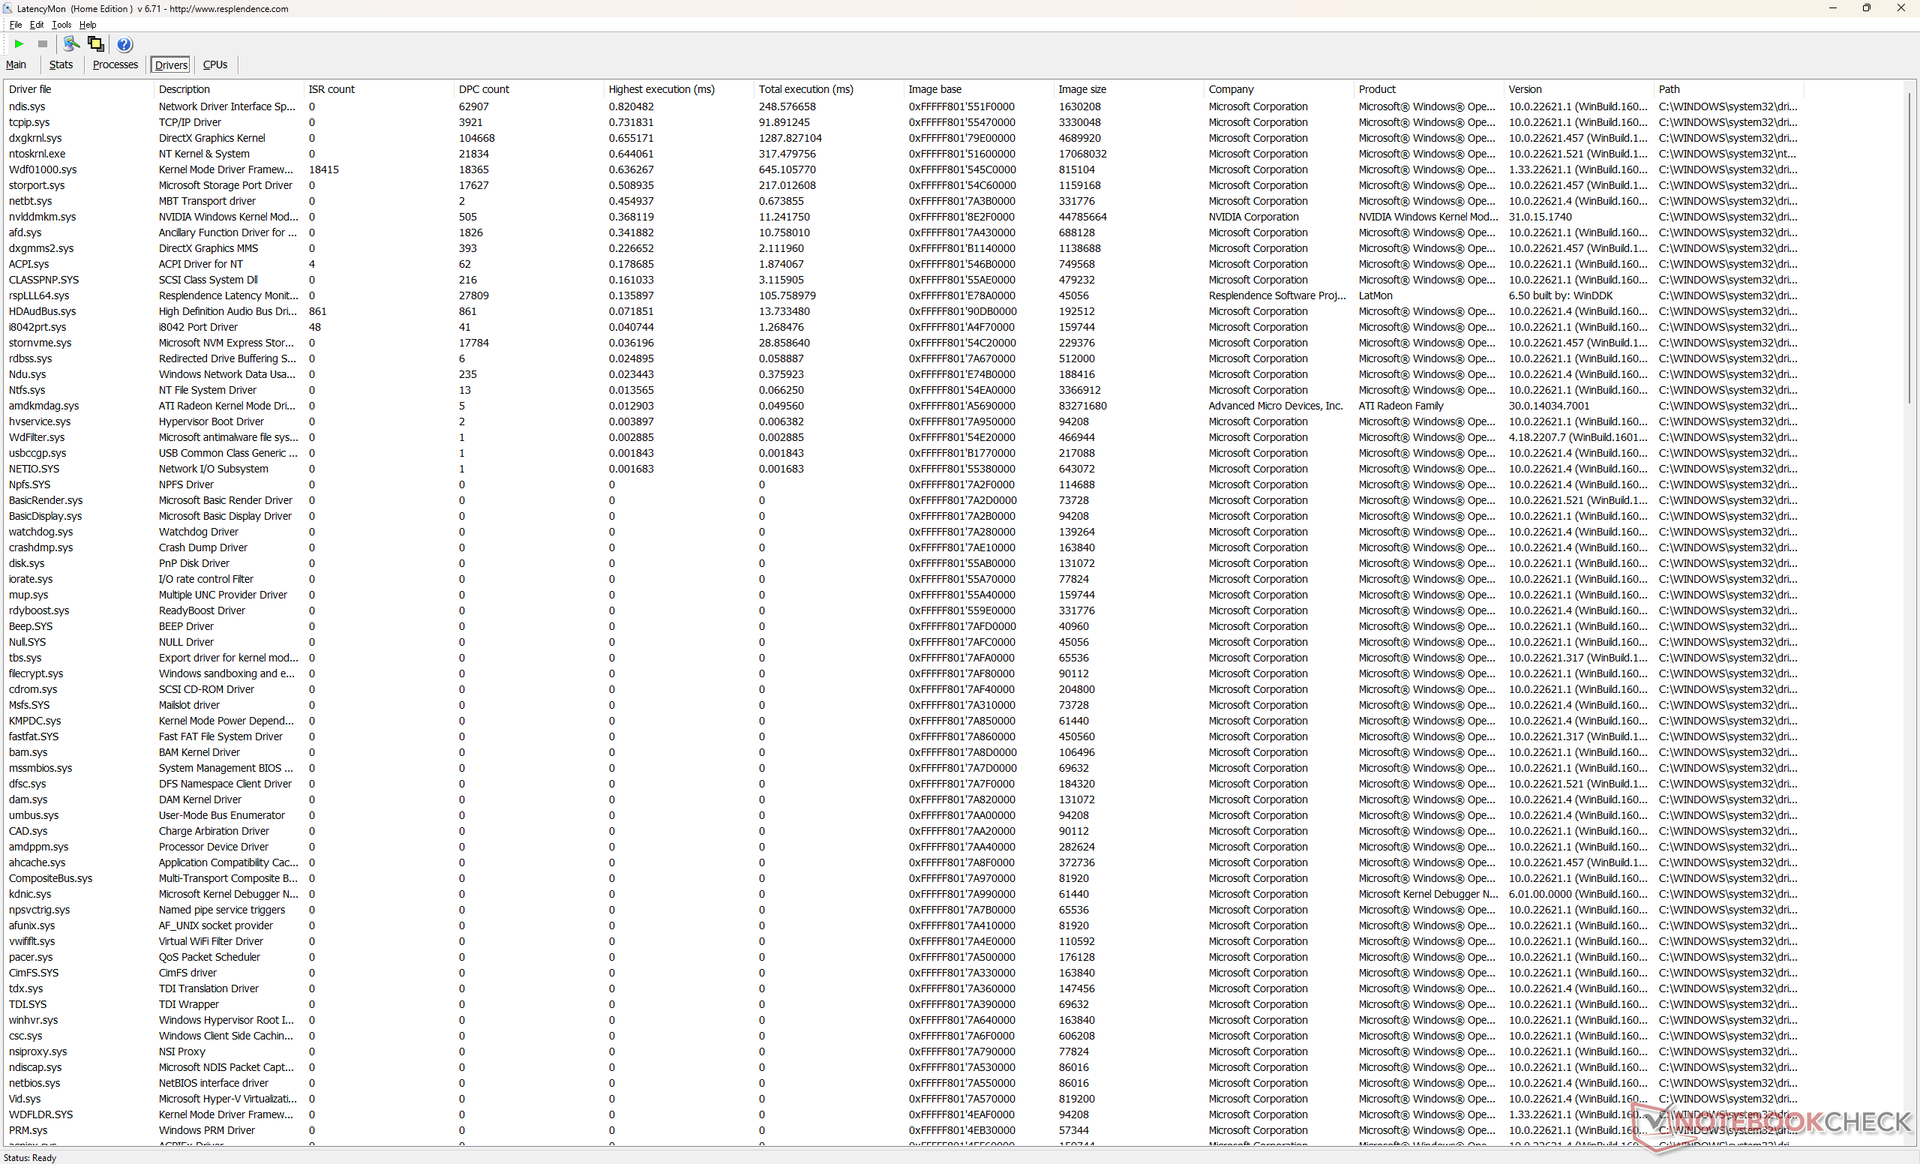
LatencyMon avslöjar små DPC-problem när du öppnar flera webbläsarflikar på vår hemsida. uppspelning av 4K-video vid 60 FPS är också bristfällig med 5 tappade bilder under vår minutlånga testvideo.
| DPC Latencies / LatencyMon - interrupt to process latency (max), Web, Youtube, Prime95 | |
| Acer Swift X SFX16-51G-5388 | |
| Lenovo ThinkBook 16p G3 ARH | |
| HP Envy 16 h0112nr | |
| Lenovo IdeaPad 5 Pro 16ARH7 | |
| Lenovo Legion 5 Pro 16IAH7H | |
| Lenovo ThinkBook 16p G2 ACH | |
* ... mindre är bättre
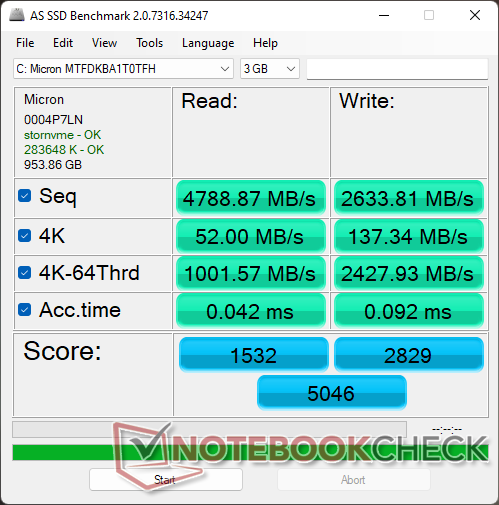
Lagringsenheter
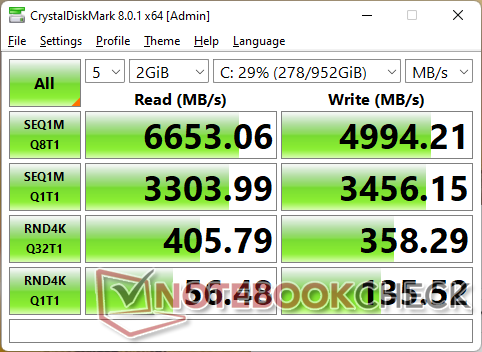
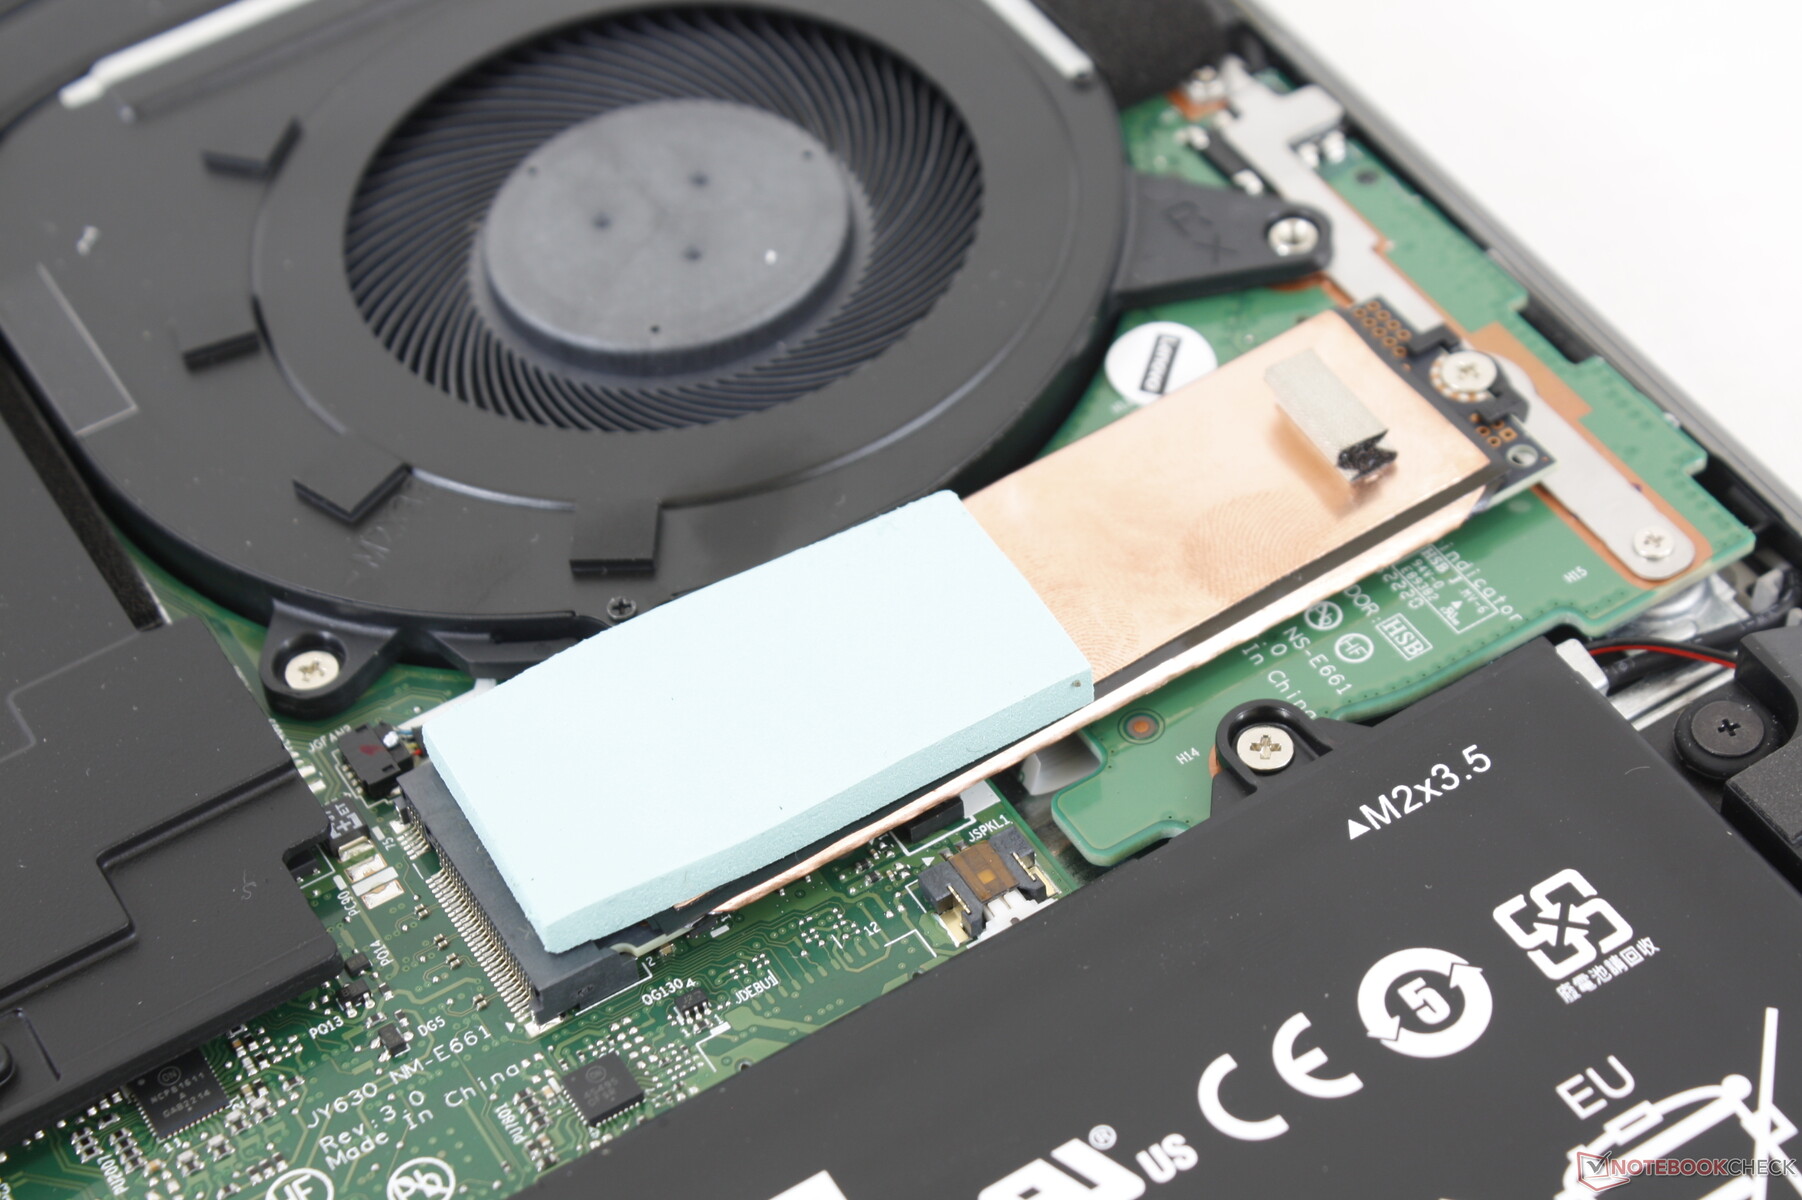
Den medföljande PCIe4 x4 SSD-enheten har en egen värmespridare och en egen termisk kudde för att hjälpa till med värmeavledningen. Vår enhet uppvisade inga problem med strypning när DiskSpd kördes i en loop, vilket visas i diagrammet nedan.

| Drive Performance rating - Percent | |
| Lenovo Legion 5 Pro 16IAH7H | |
| Lenovo ThinkBook 16p G2 ACH | |
| HP Envy 16 h0112nr | |
| Lenovo ThinkBook 16p G3 ARH | |
| Lenovo IdeaPad 5 Pro 16ARH7 | |
| Acer Swift X SFX16-51G-5388 | |
* ... mindre är bättre
Disk Throttling: DiskSpd Read Loop, Queue Depth 8
GPU-prestanda
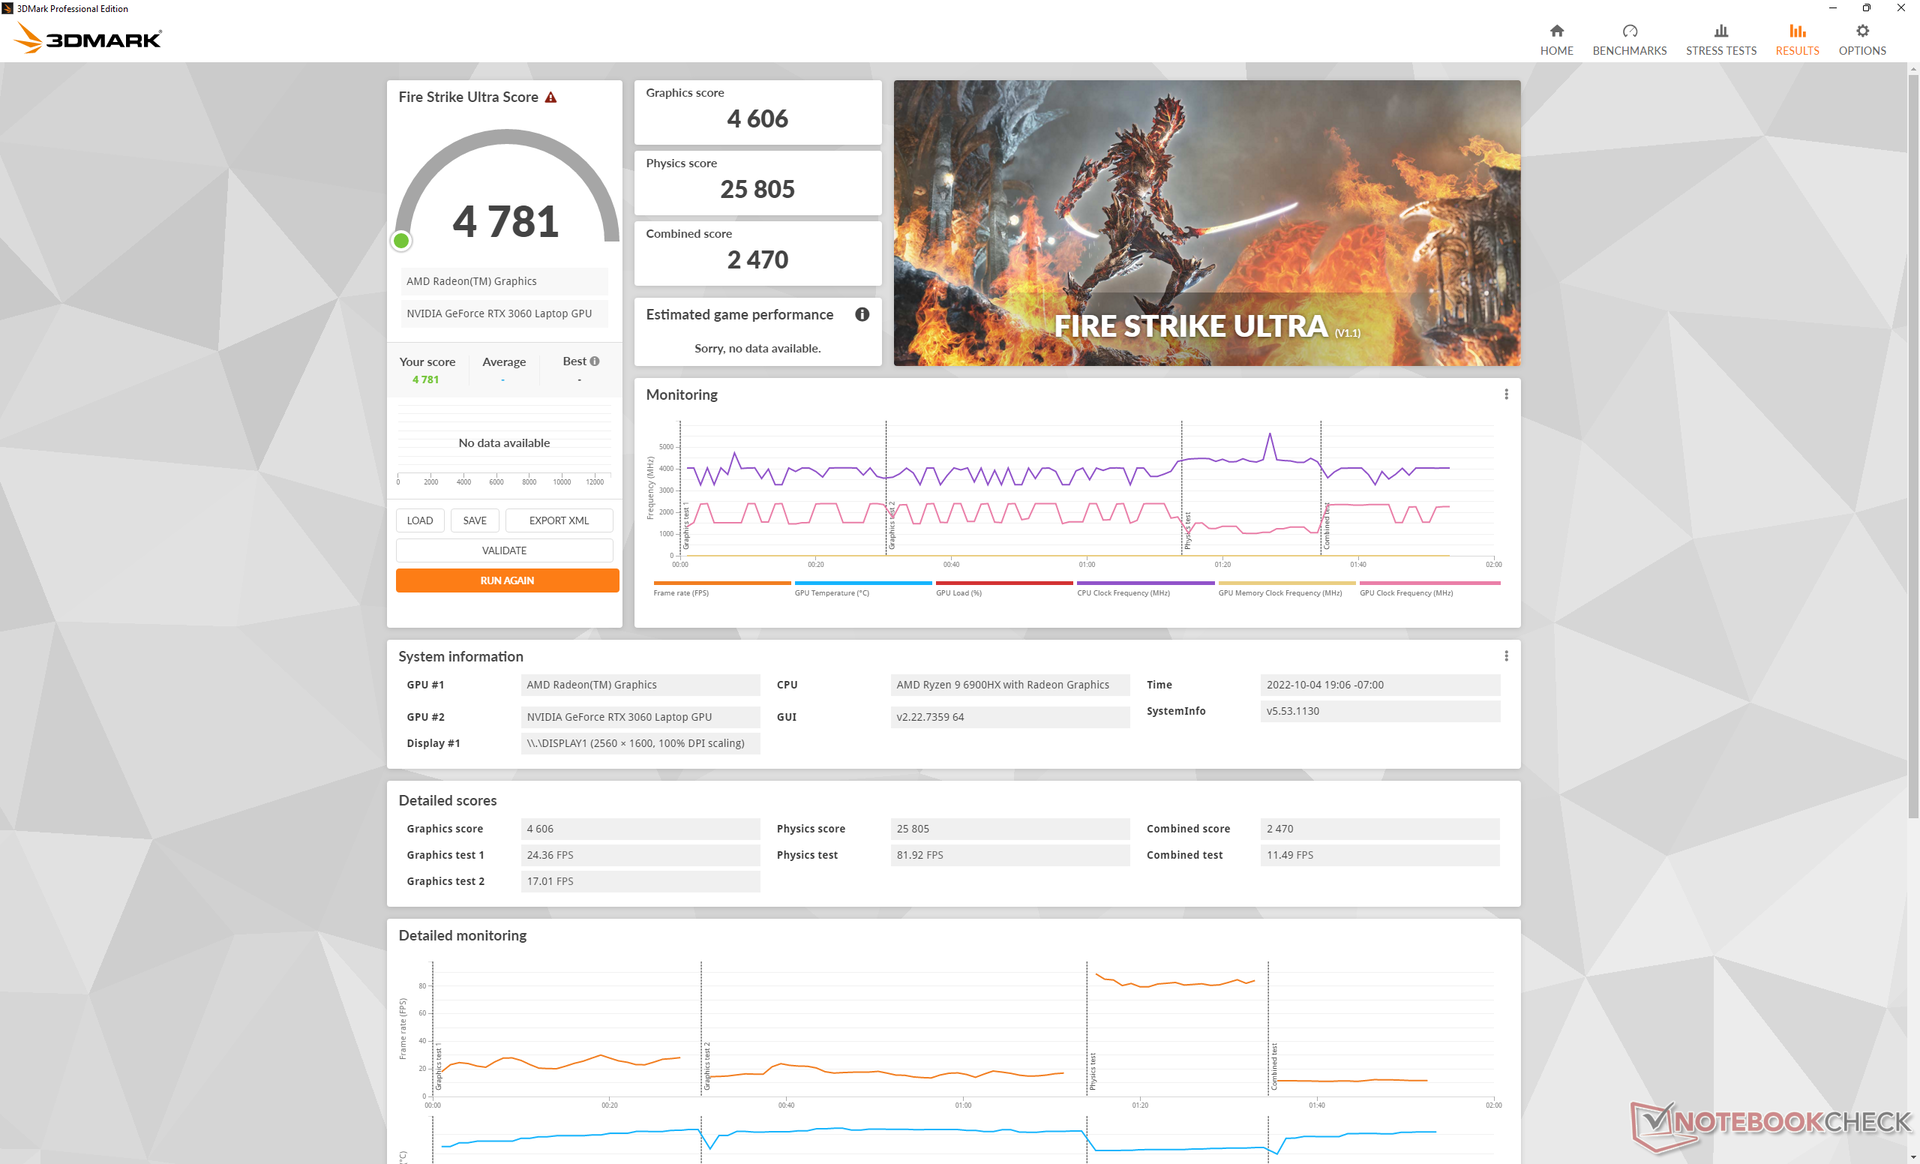
Lenovo har höjt nivån på GeForce RTX 3060 TGP från 75 W på ThinkBook 16p Gen 2 till 90 W på ThinkBook 16p Gen 3. Trots detta är prestandan i bästa fall bara cirka 10 procent snabbare.
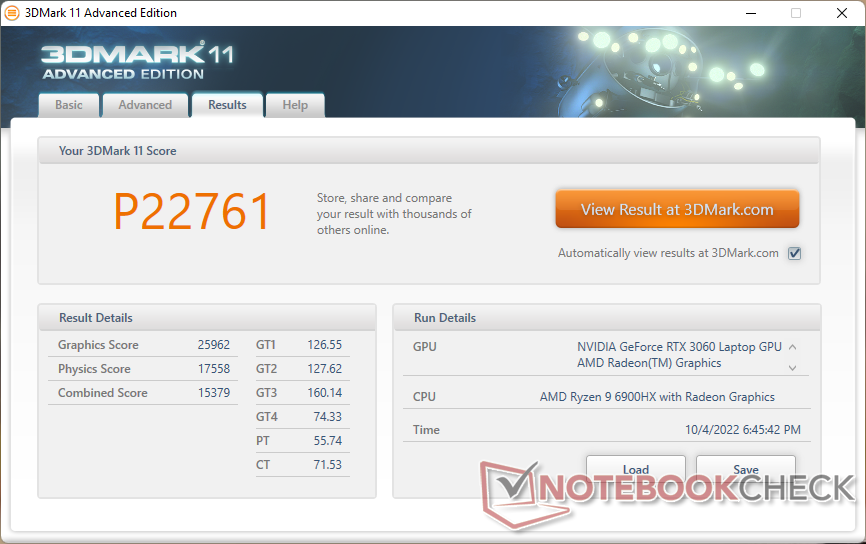
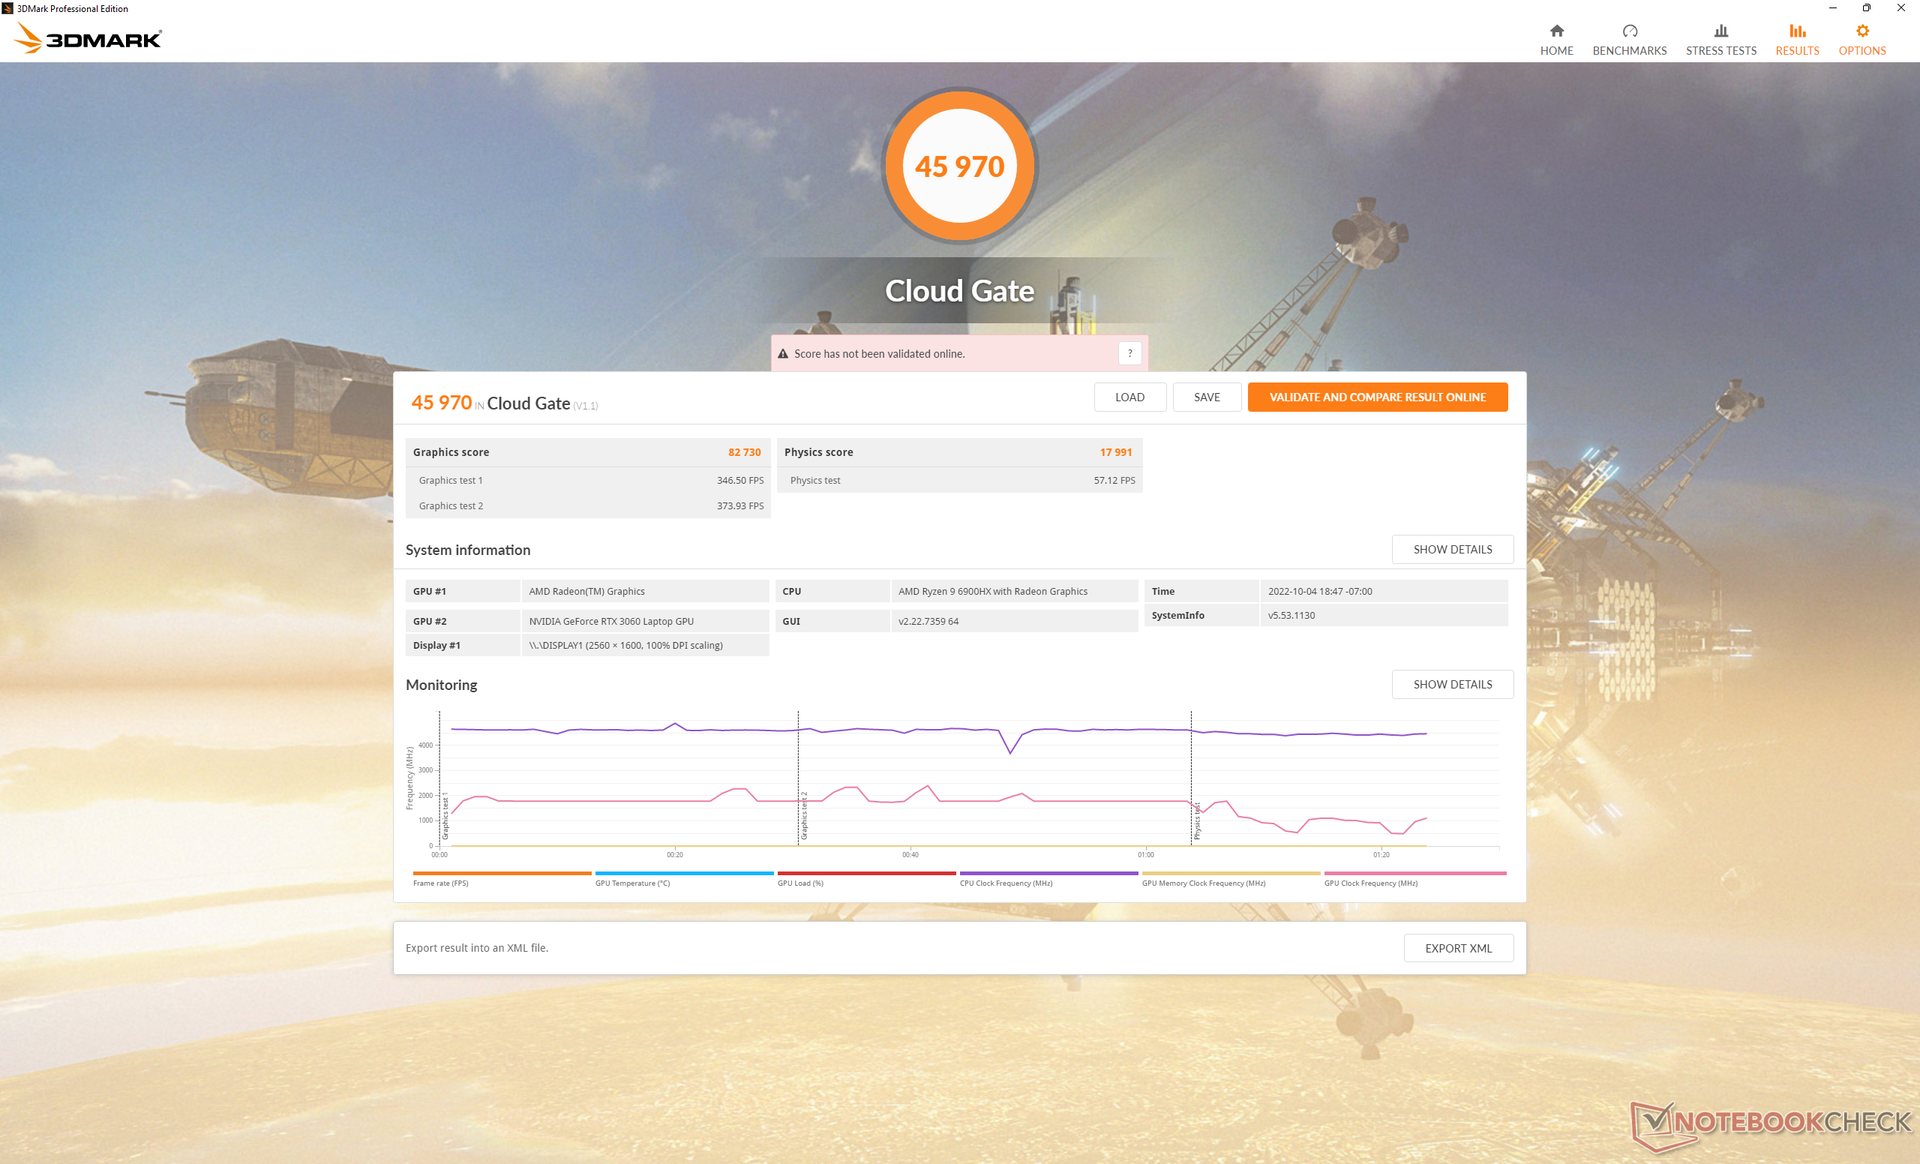
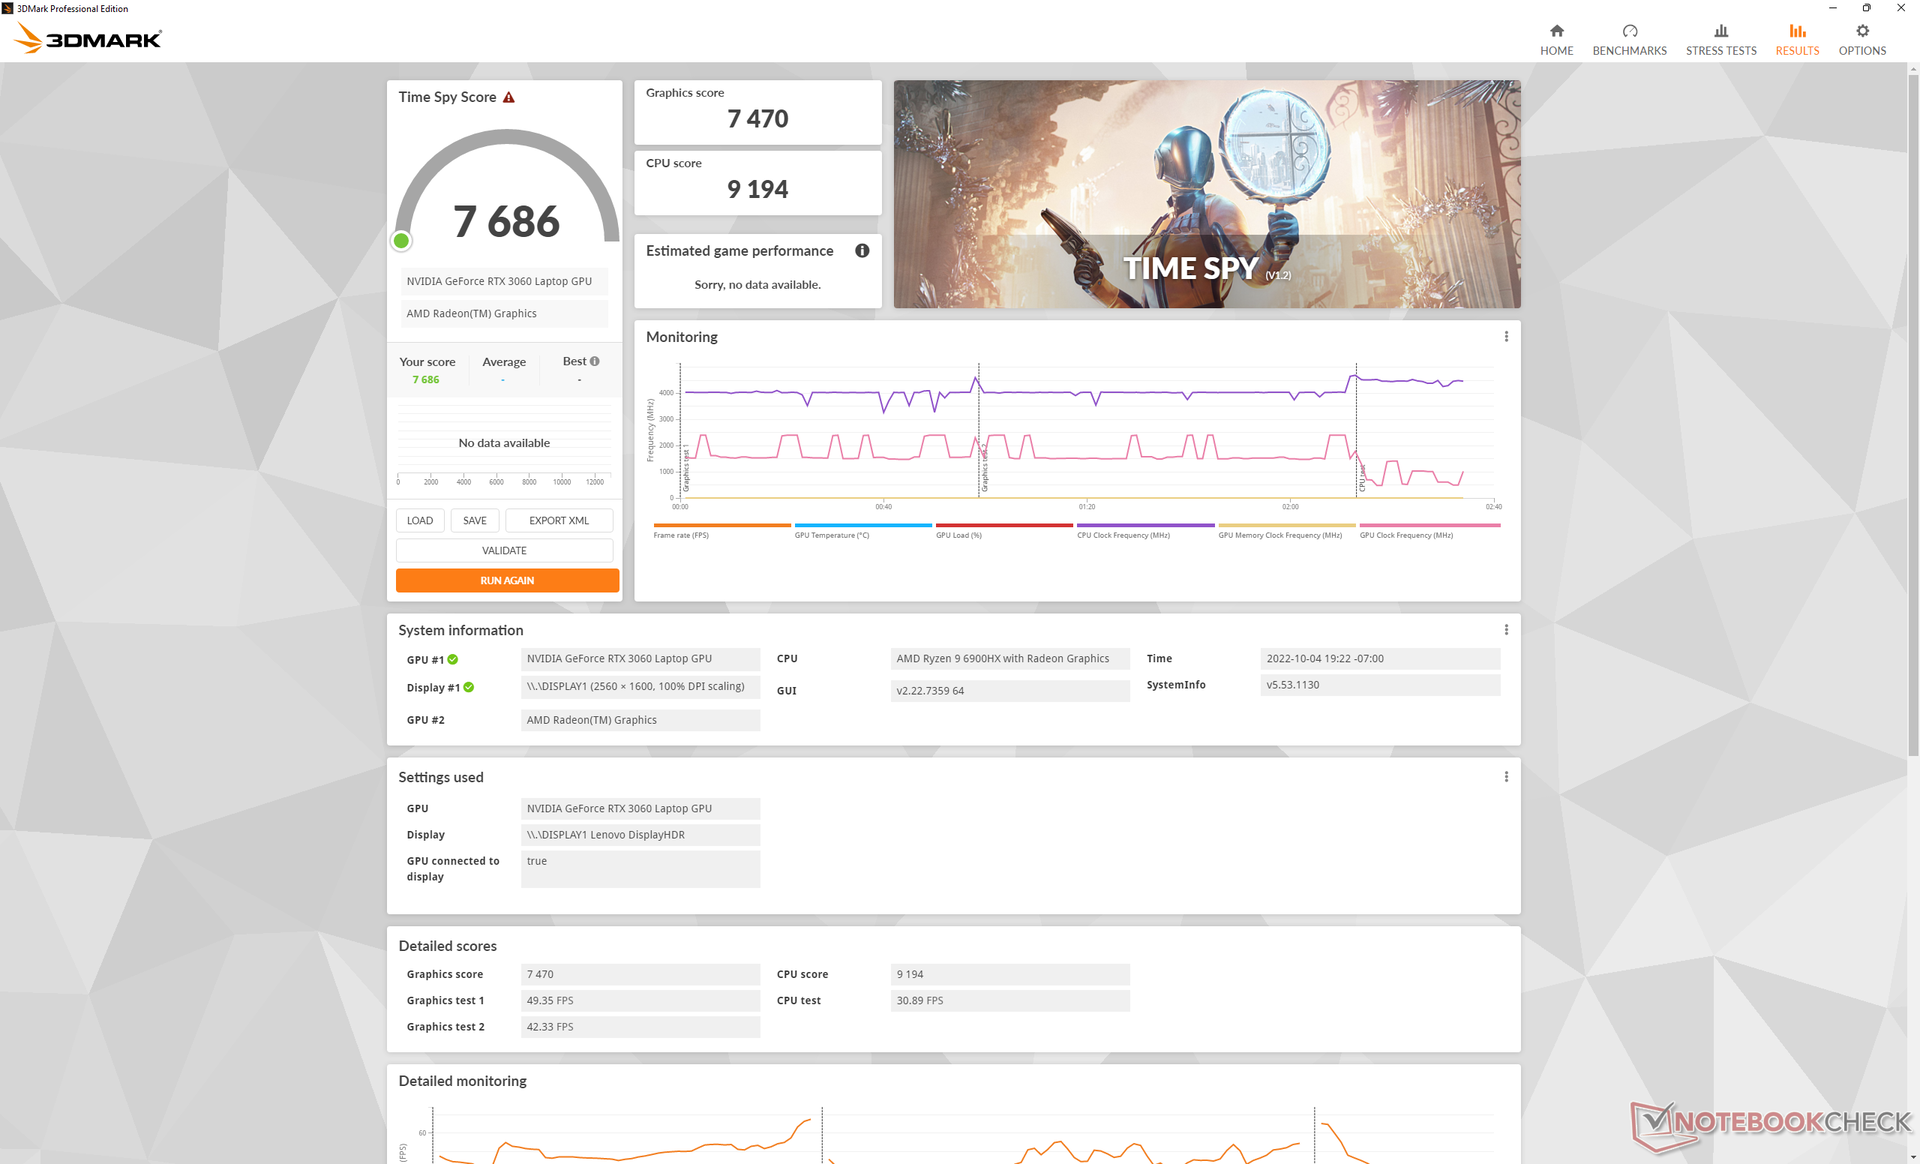
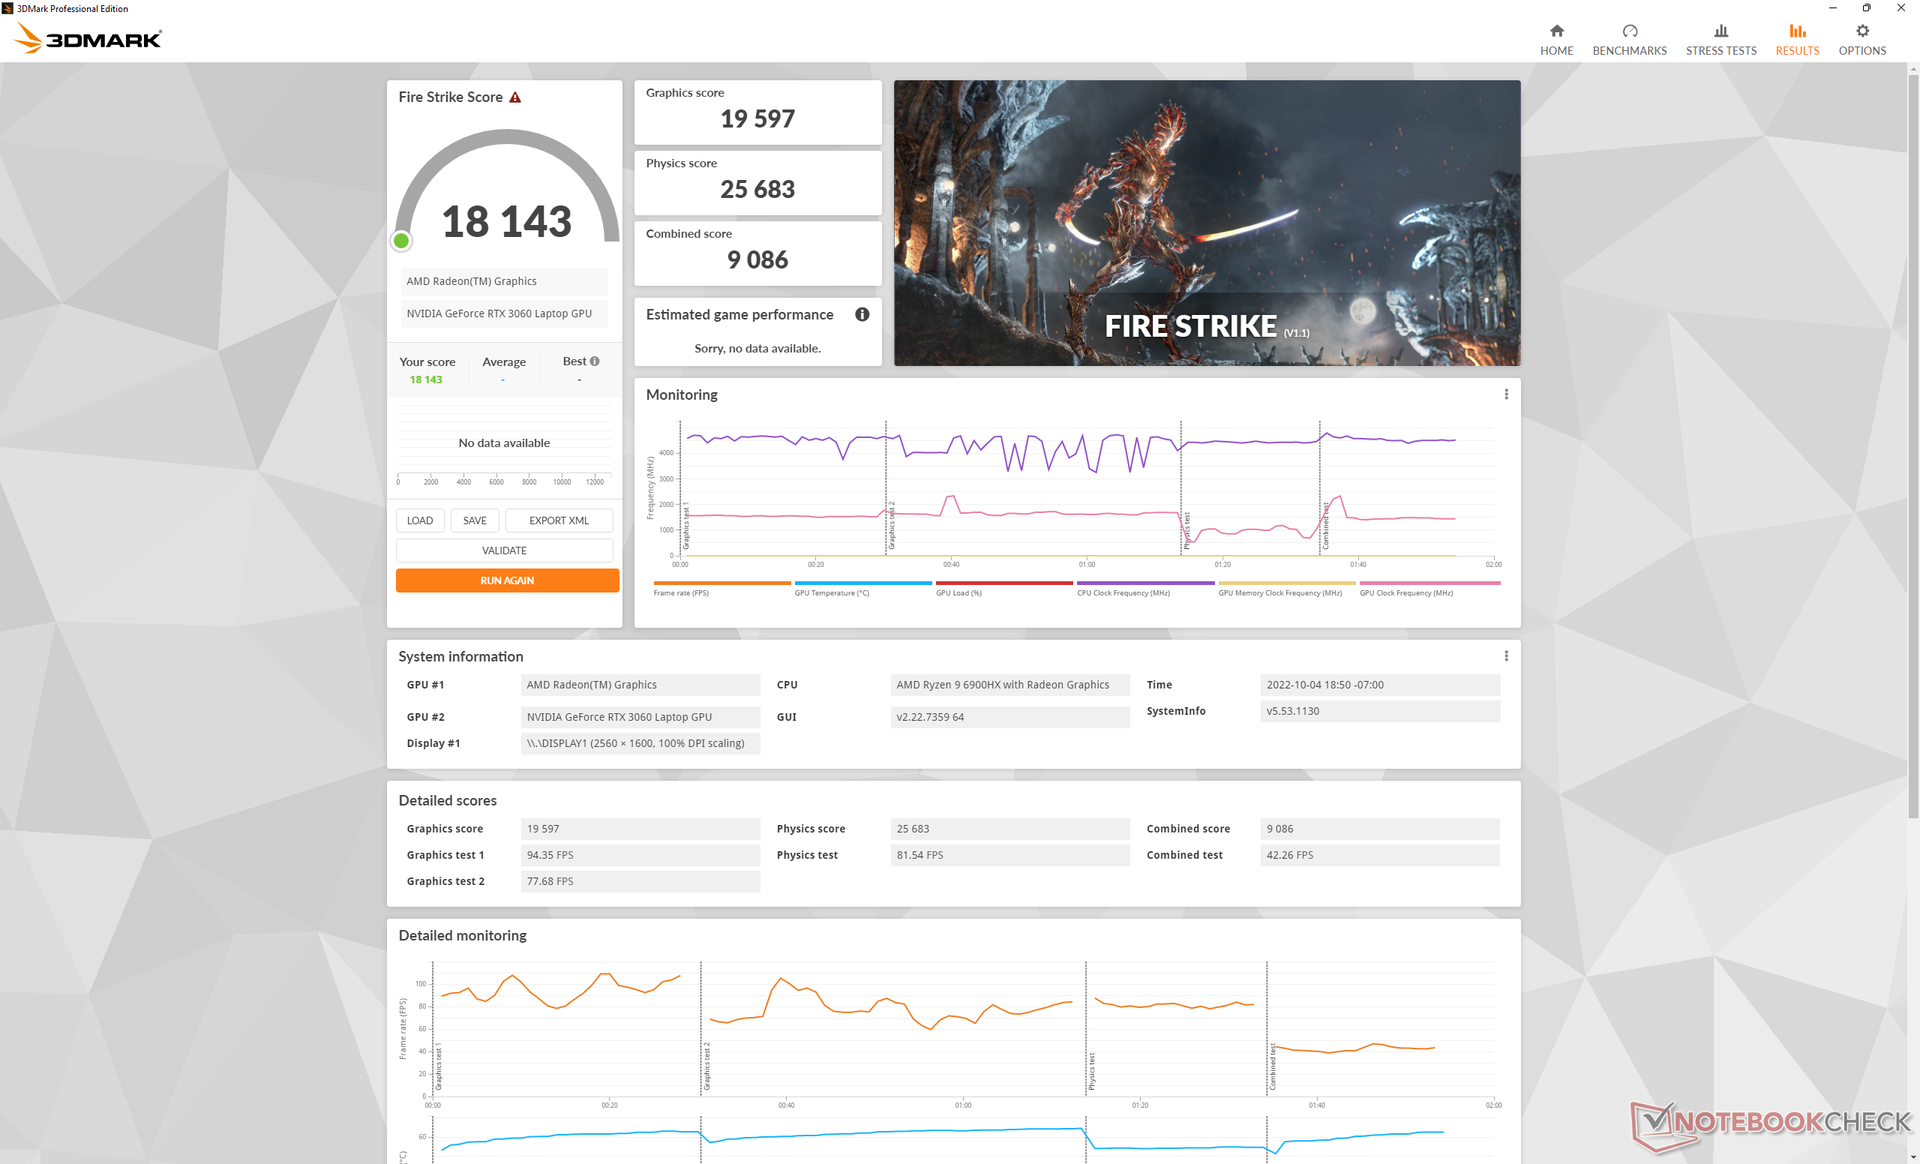
| 3DMark 11 Performance | 22761 poäng | |
| 3DMark Cloud Gate Standard Score | 45970 poäng | |
| 3DMark Fire Strike Score | 18143 poäng | |
| 3DMark Time Spy Score | 7686 poäng | |
Hjälp | ||
* ... mindre är bättre
| Final Fantasy XV Benchmark | |
| 1280x720 Lite Quality | |
| Razer Blade 15 2022 | |
| Genomsnitt NVIDIA GeForce RTX 3060 Laptop GPU (122.5 - 214, n=33) | |
| Lenovo ThinkBook 16p G3 ARH | |
| MSI Stealth 15M A11SEK | |
| Acer Swift X SFX16-51G-5388 | |
| Lenovo IdeaPad 5 Pro 16ARH7 | |
| 1920x1080 Standard Quality | |
| Razer Blade 15 2022 | |
| Genomsnitt NVIDIA GeForce RTX 3060 Laptop GPU (70.4 - 133.5, n=37) | |
| Lenovo ThinkBook 16p G3 ARH | |
| MSI Stealth 15M A11SEK | |
| Acer Swift X SFX16-51G-5388 | |
| Lenovo IdeaPad 5 Pro 16ARH7 | |
| 1920x1080 High Quality | |
| Razer Blade 15 2022 | |
| Genomsnitt NVIDIA GeForce RTX 3060 Laptop GPU (55 - 100.9, n=42) | |
| Lenovo ThinkBook 16p G3 ARH | |
| MSI Stealth 15M A11SEK | |
| Acer Swift X SFX16-51G-5388 | |
| Lenovo IdeaPad 5 Pro 16ARH7 | |
| 2560x1440 High Quality | |
| Razer Blade 15 2022 | |
| Genomsnitt NVIDIA GeForce RTX 3060 Laptop GPU (41.1 - 73.7, n=25) | |
| Lenovo ThinkBook 16p G3 ARH | |
| Cyberpunk 2077 1.6 | |
| 1920x1080 Low Preset | |
| Genomsnitt NVIDIA GeForce RTX 3060 Laptop GPU (80 - 135.7, n=14) | |
| Lenovo ThinkBook 16p G3 ARH | |
| Lenovo IdeaPad 5 Pro 16ARH7 | |
| 1920x1080 Medium Preset | |
| Genomsnitt NVIDIA GeForce RTX 3060 Laptop GPU (68 - 118, n=14) | |
| Lenovo ThinkBook 16p G3 ARH | |
| Lenovo IdeaPad 5 Pro 16ARH7 | |
| 1920x1080 High Preset | |
| Genomsnitt NVIDIA GeForce RTX 3060 Laptop GPU (42.2 - 87.7, n=14) | |
| Lenovo ThinkBook 16p G3 ARH | |
| Lenovo IdeaPad 5 Pro 16ARH7 | |
| 1920x1080 Ultra Preset | |
| Genomsnitt NVIDIA GeForce RTX 3060 Laptop GPU (40 - 78.8, n=16) | |
| Lenovo ThinkBook 16p G3 ARH | |
| 2560x1440 Ultra Preset | |
| Genomsnitt NVIDIA GeForce RTX 3060 Laptop GPU (23 - 45.8, n=9) | |
| Lenovo ThinkBook 16p G3 ARH | |
Witcher 3 FPS Chart
| låg | med. | hög | ultra | QHD | |
|---|---|---|---|---|---|
| GTA V (2015) | 165.4 | 158.9 | 134.6 | 78.5 | 68.8 |
| The Witcher 3 (2015) | 259.5 | 211.4 | 138.5 | 73.4 | |
| Dota 2 Reborn (2015) | 112.5 | 106 | 98.9 | 96.8 | |
| Final Fantasy XV Benchmark (2018) | 141.8 | 104.1 | 78.2 | 58.5 | |
| X-Plane 11.11 (2018) | 90.6 | 81.8 | 64.8 | ||
| Strange Brigade (2018) | 253 | 170.9 | 147.7 | 132.5 | 99.3 |
| Cyberpunk 2077 1.6 (2022) | 100.8 | 87.7 | 67.8 | 56 | 35 |
Utsläpp
Systembrus
Ljudet från fläkten vid hög belastning är jämförbart med ljudet frånAcer Swift X SFX16 men tystare änHP Envy 16. De interna fläktarna pulserar inte särskilt ofta, vilket ger en generellt sett tyst upplevelse när du surfar på webben, streamar video eller kör andra enkla belastningar.
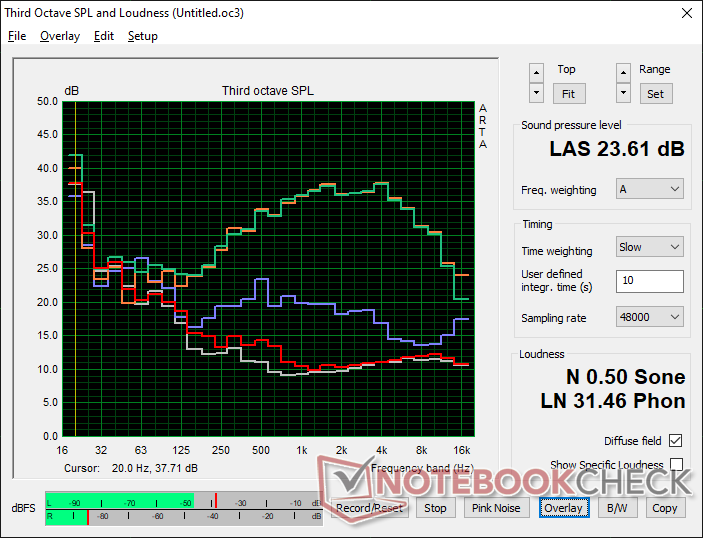
Ljudnivå
| Låg belastning |
| 23.1 / 23.2 / 23.6 dB(A) |
| Hög belastning |
| 30.6 / 47.5 dB(A) |
 | ||
30 dB tyst 40 dB(A) hörbar 50 dB(A) högt ljud |
||
min: | ||
| Lenovo ThinkBook 16p G3 ARH GeForce RTX 3060 Laptop GPU, R9 6900HX, Micron 3400 1TB MTFDKBA1T0TFH | HP Envy 16 h0112nr GeForce RTX 3060 Laptop GPU, i7-12700H, Micron 3400 1TB MTFDKBA1T0TFH | Lenovo ThinkBook 16p G2 ACH GeForce RTX 3060 Laptop GPU, R9 5900HX, WDC PC SN730 SDBPNTY-1T00 | Lenovo IdeaPad 5 Pro 16ARH7 Radeon 660M, R5 6600HS, Samsung PM9A1 MZVL2512HCJQ | Acer Swift X SFX16-51G-5388 GeForce RTX 3050 4GB Laptop GPU, i5-11320H, Samsung PM991 MZVLQ512HBLU | Lenovo Legion 5 Pro 16IAH7H GeForce RTX 3060 Laptop GPU, i7-12700H, 2x Samsung PM9A1 MZVL21T0HCLR (RAID 0) | |
|---|---|---|---|---|---|---|
| Noise | -11% | -2% | -6% | -14% | -28% | |
| av / miljö * (dB) | 22.7 | 22.8 -0% | 23 -1% | 25 -10% | 25.4 -12% | 24.6 -8% |
| Idle Minimum * (dB) | 23.1 | 22.9 1% | 23 -0% | 25 -8% | 25.4 -10% | 28.7 -24% |
| Idle Average * (dB) | 23.2 | 22.9 1% | 23 1% | 26 -12% | 25.4 -9% | 32 -38% |
| Idle Maximum * (dB) | 23.6 | 30.5 -29% | 23 3% | 28 -19% | 27.8 -18% | 32 -36% |
| Load Average * (dB) | 30.6 | 41.4 -35% | 35.66 -17% | 44 -44% | 41 -34% | 45.2 -48% |
| Witcher 3 ultra * (dB) | 47.6 | 51.1 -7% | 48.7 -2% | 35 26% | ||
| Load Maximum * (dB) | 47.5 | 51.4 -8% | 48.13 -1% | 35 26% | 47 1% | 54.4 -15% |
* ... mindre är bättre
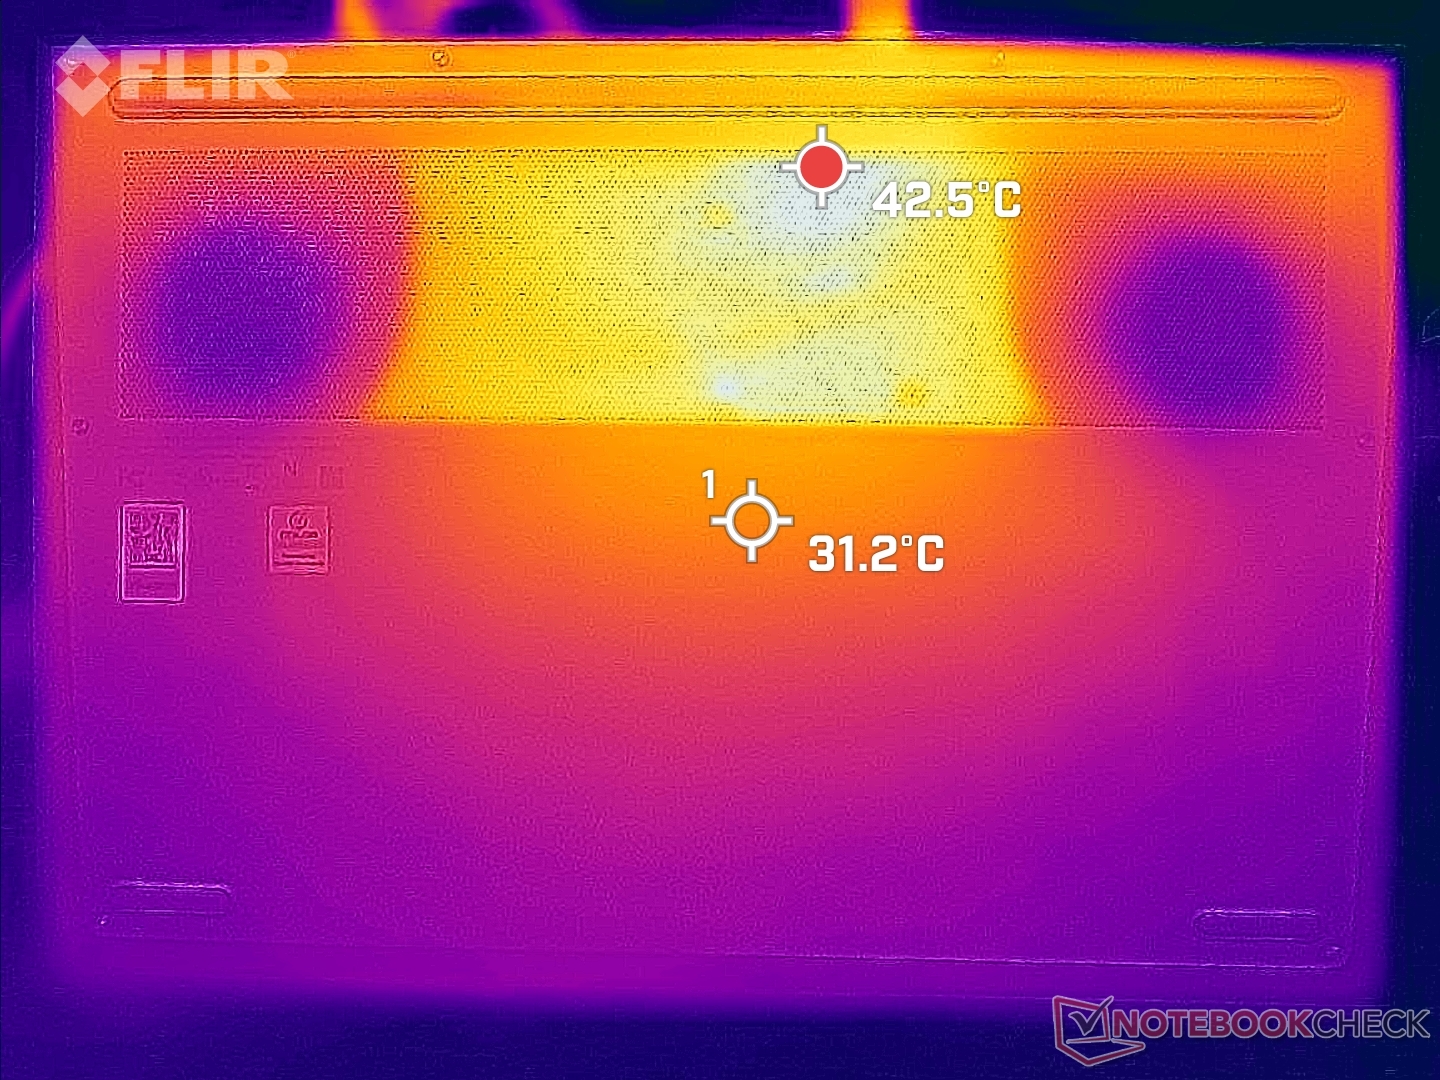
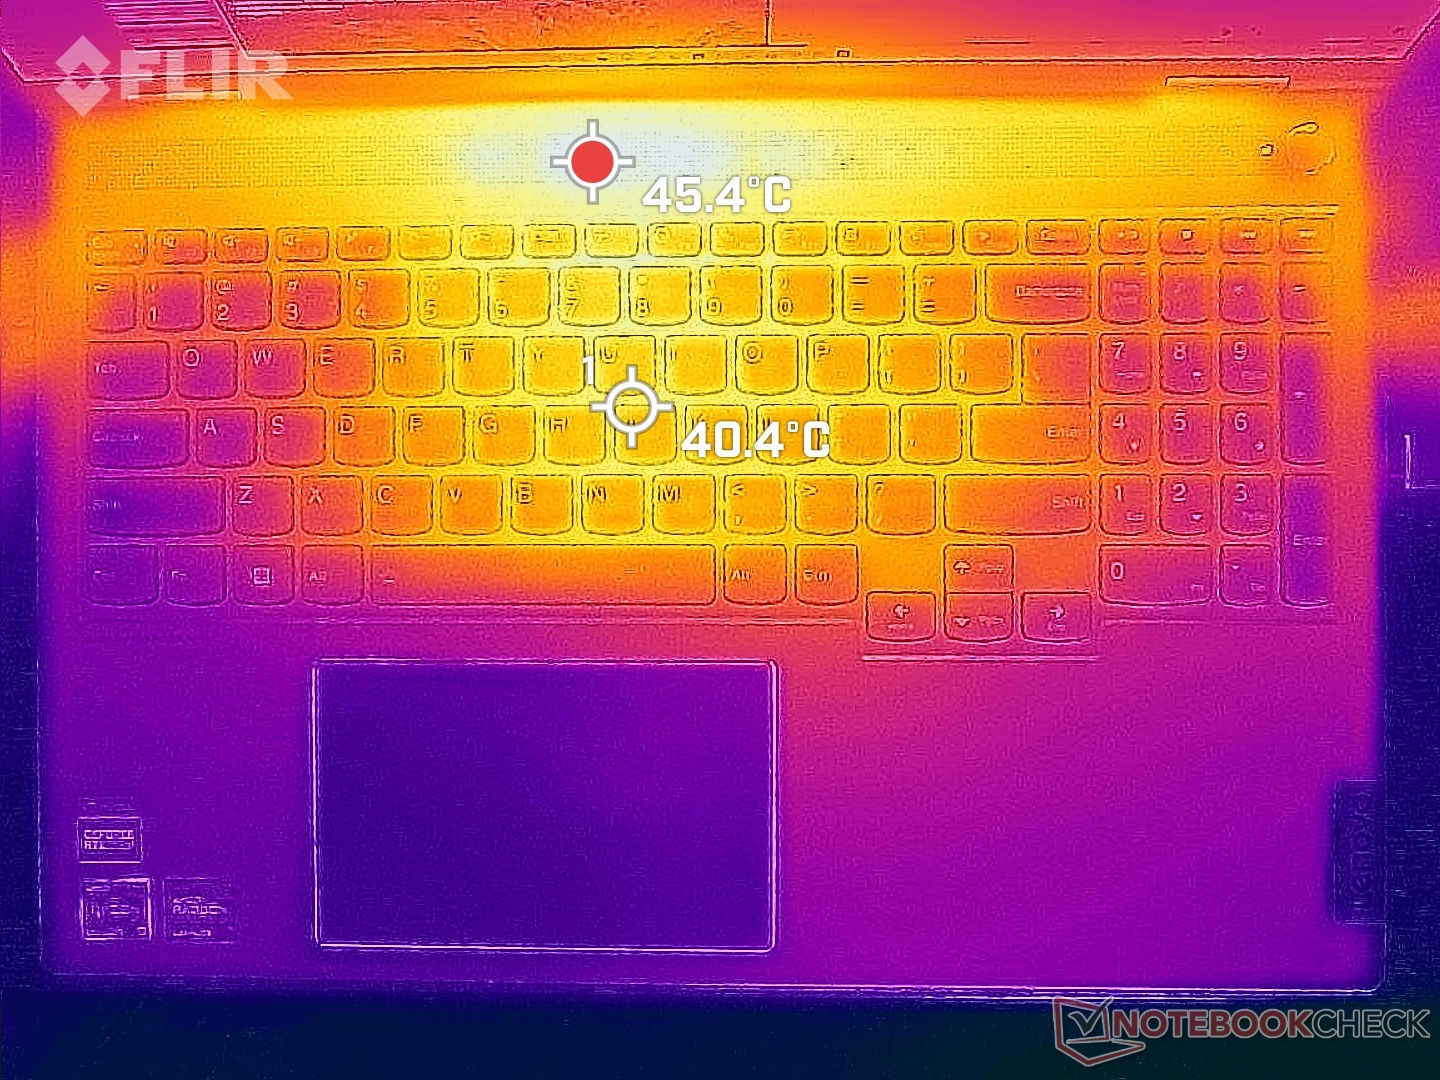
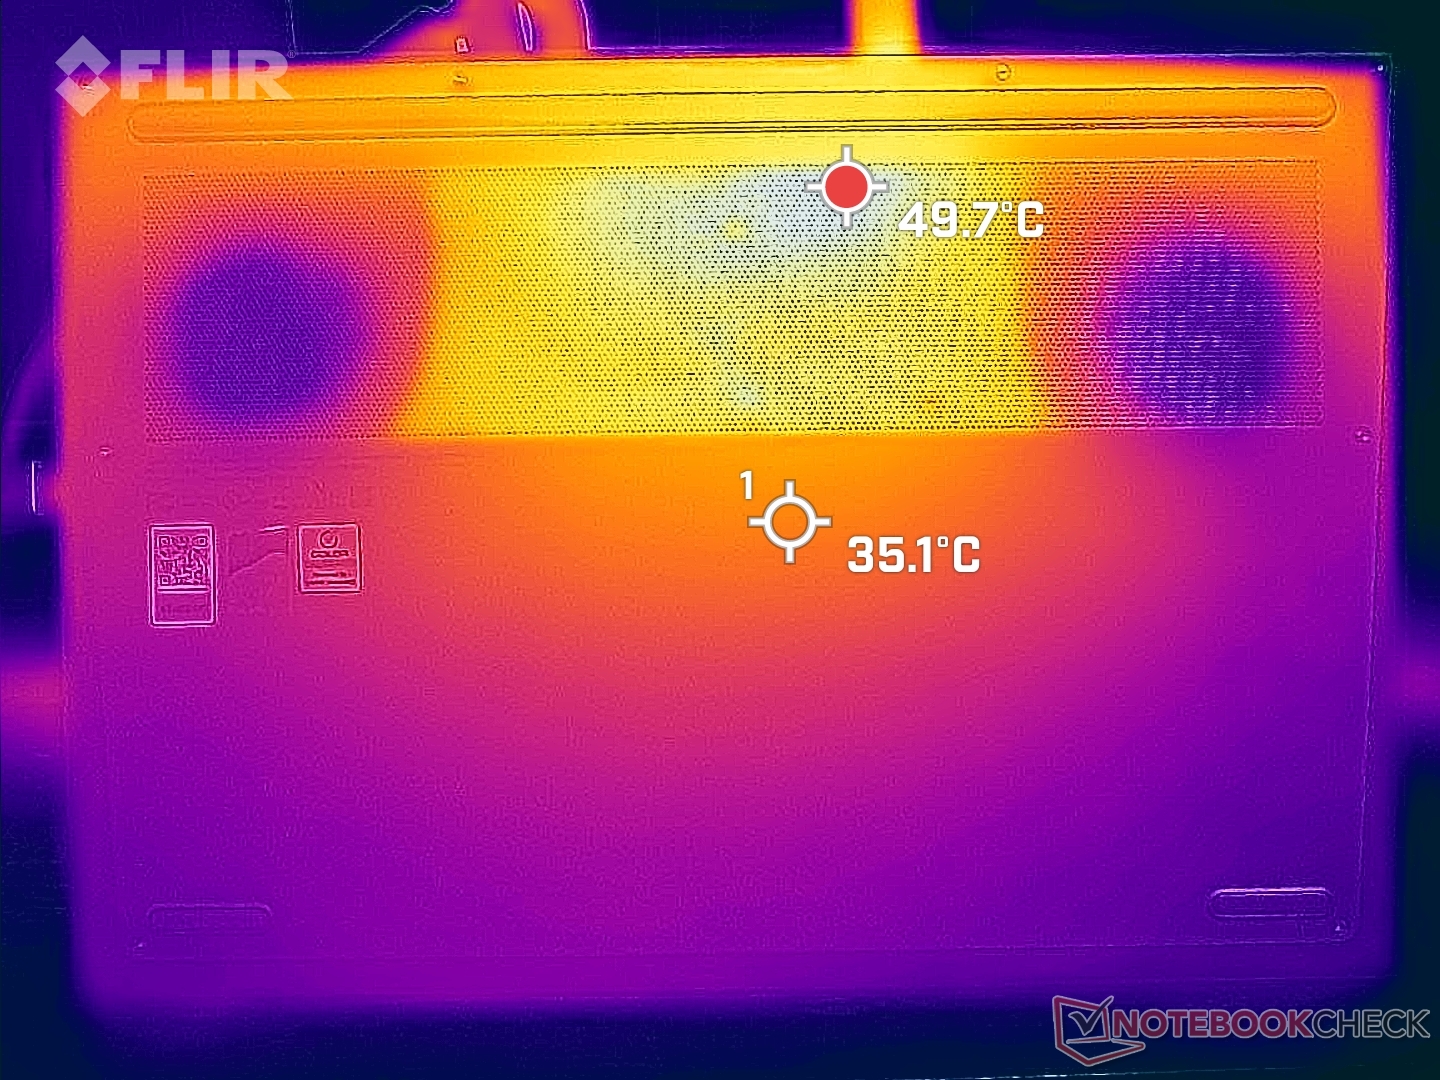
Temperatur
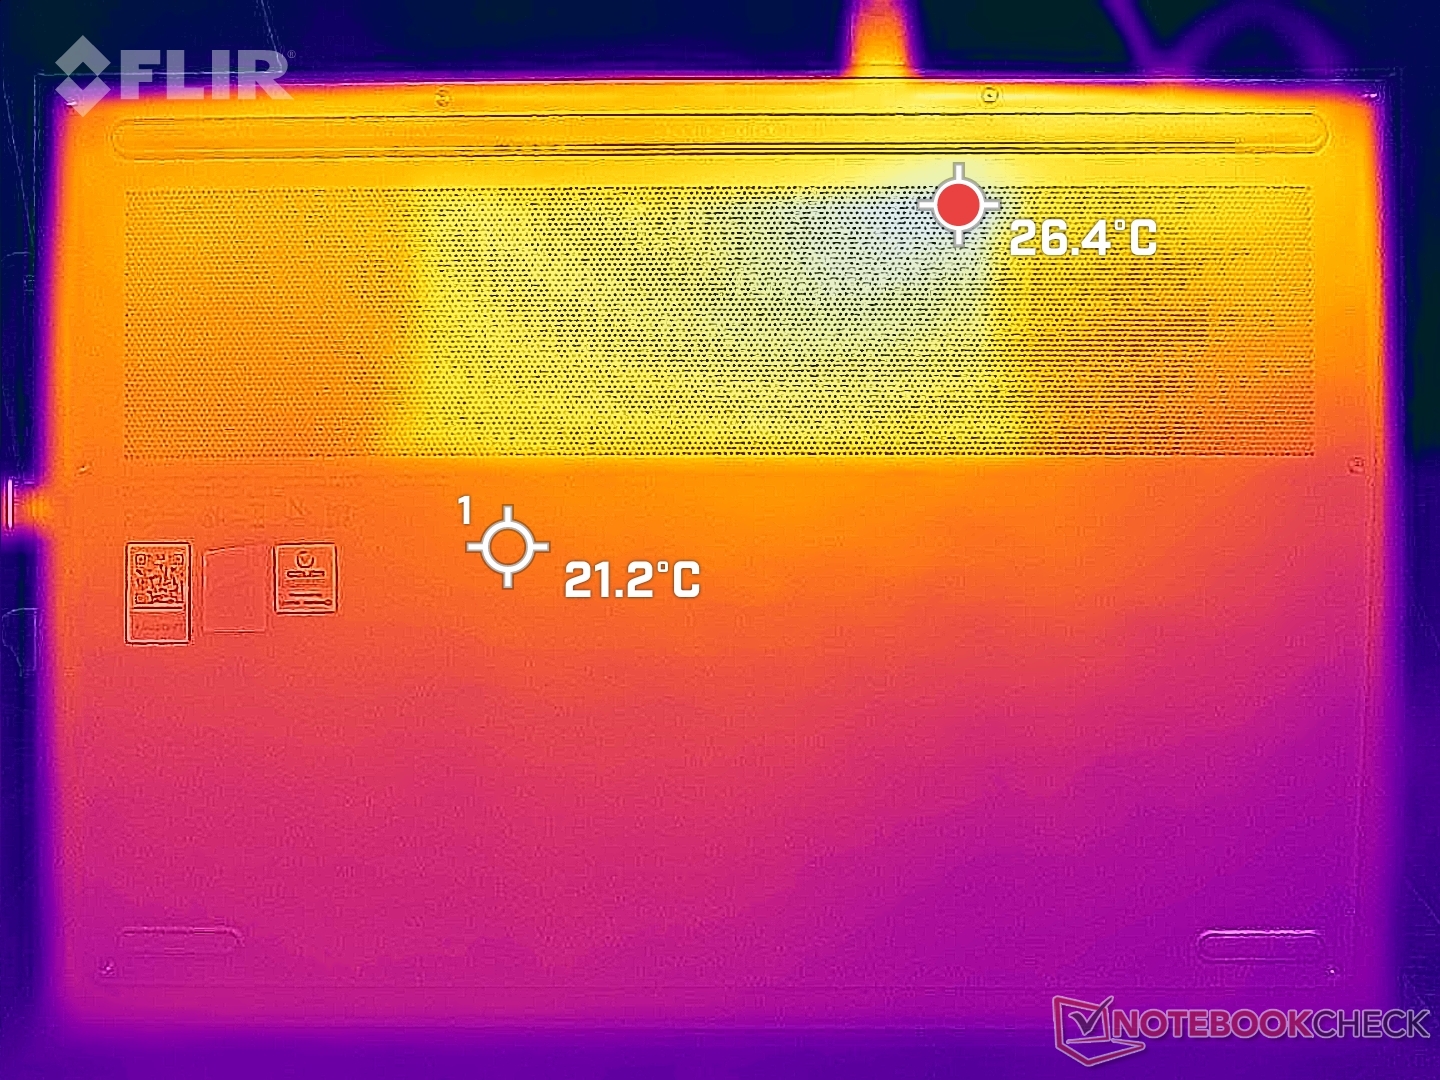
Ytvärmepunkterna kan nå nästan 50 C på toppen och botten, vilket liknar vad vi observerade på Gen 2-modellen ellerDell Inspiron 16 Plus.
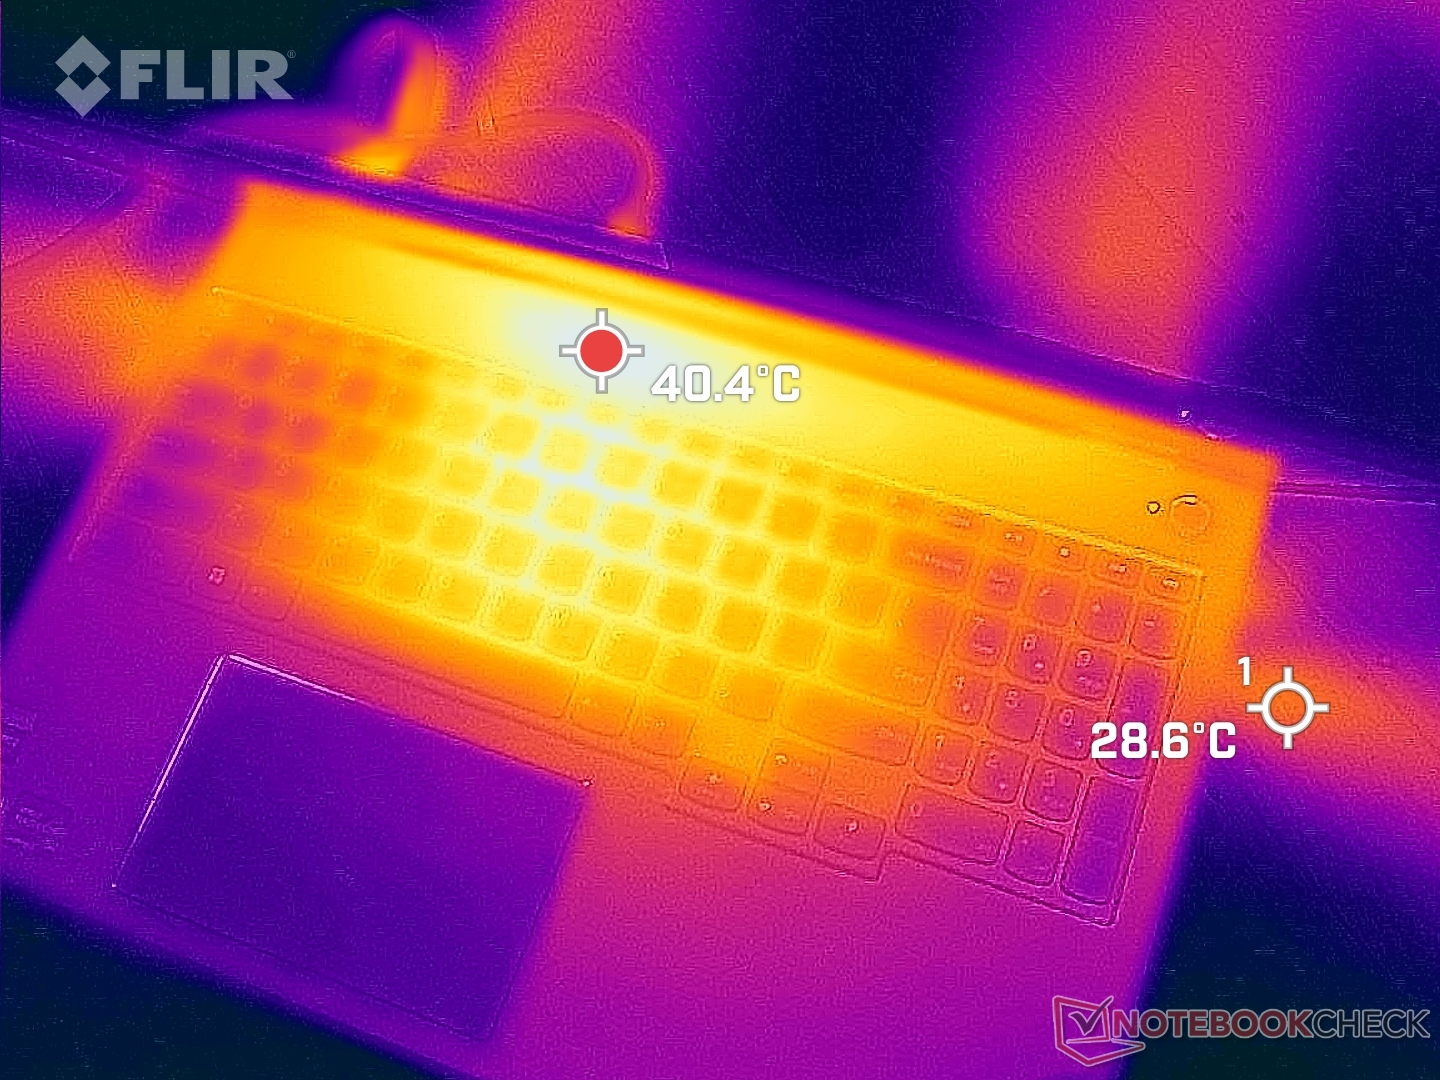
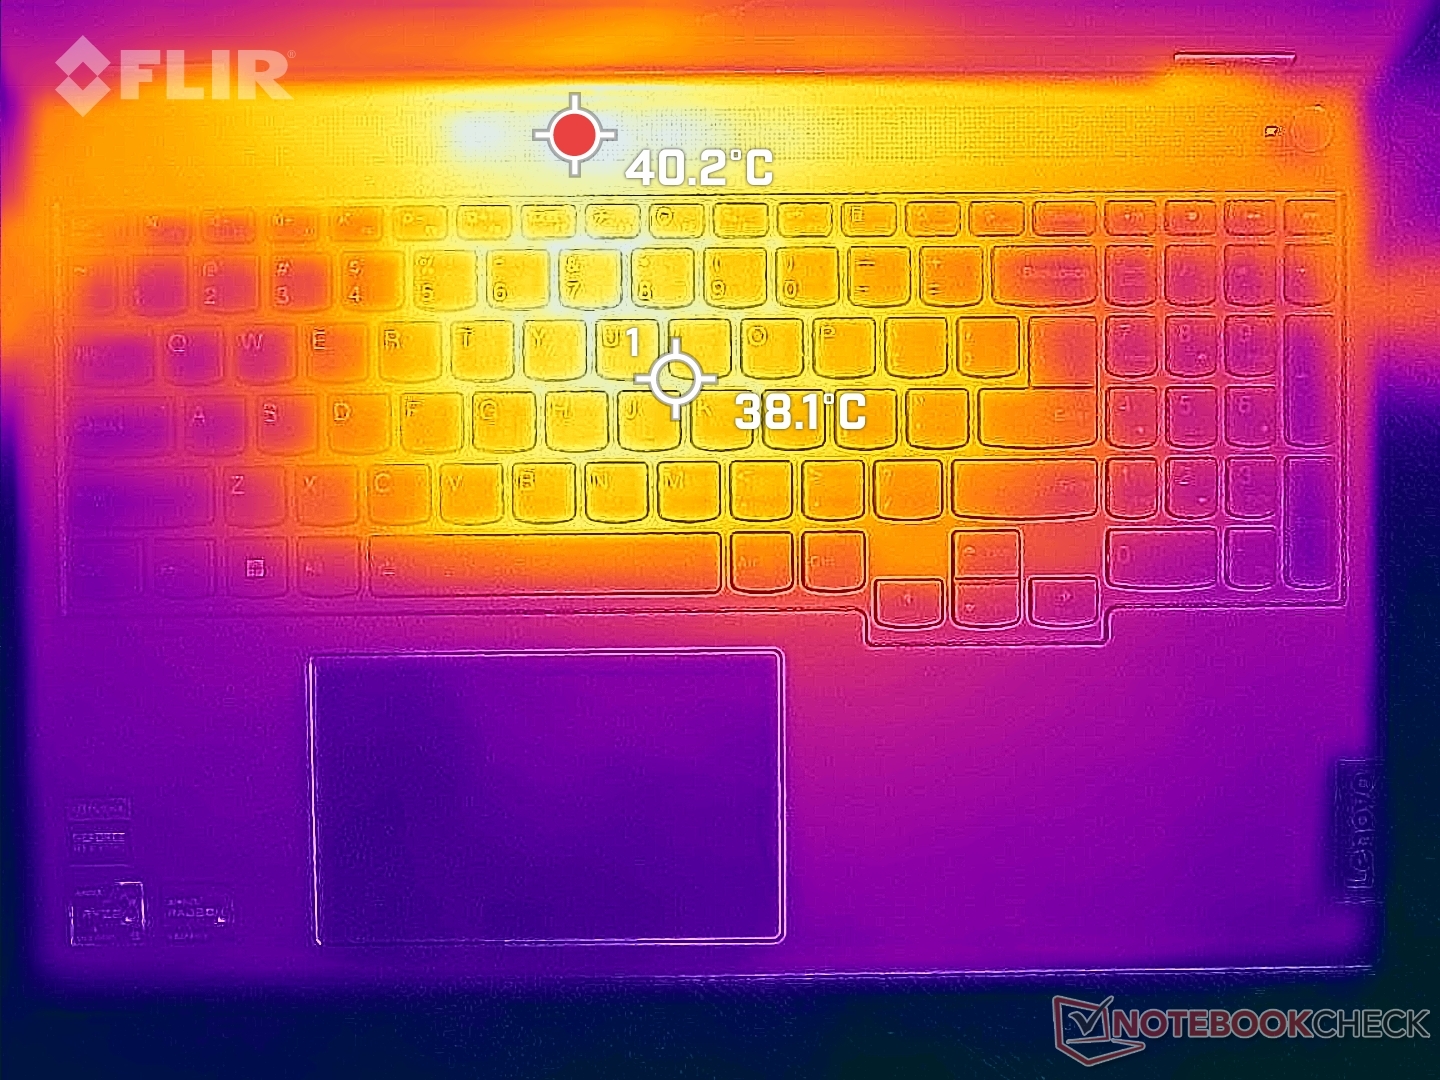
(-) Den maximala temperaturen på ovansidan är 48.2 °C / 119 F, jämfört med genomsnittet av 36.8 °C / 98 F , allt från 21 till 71 °C för klassen Multimedia.
(-) Botten värms upp till maximalt 49.6 °C / 121 F, jämfört med genomsnittet av 39.1 °C / 102 F
(+) Vid tomgångsbruk är medeltemperaturen för ovansidan 29.3 °C / 85 F, jämfört med enhetsgenomsnittet på 31.3 °C / ### class_avg_f### F.
(±) När du spelar The Witcher 3 är medeltemperaturen för ovansidan 34.3 °C / 94 F, jämfört med enhetsgenomsnittet på 31.3 °C / ## #class_avg_f### F.
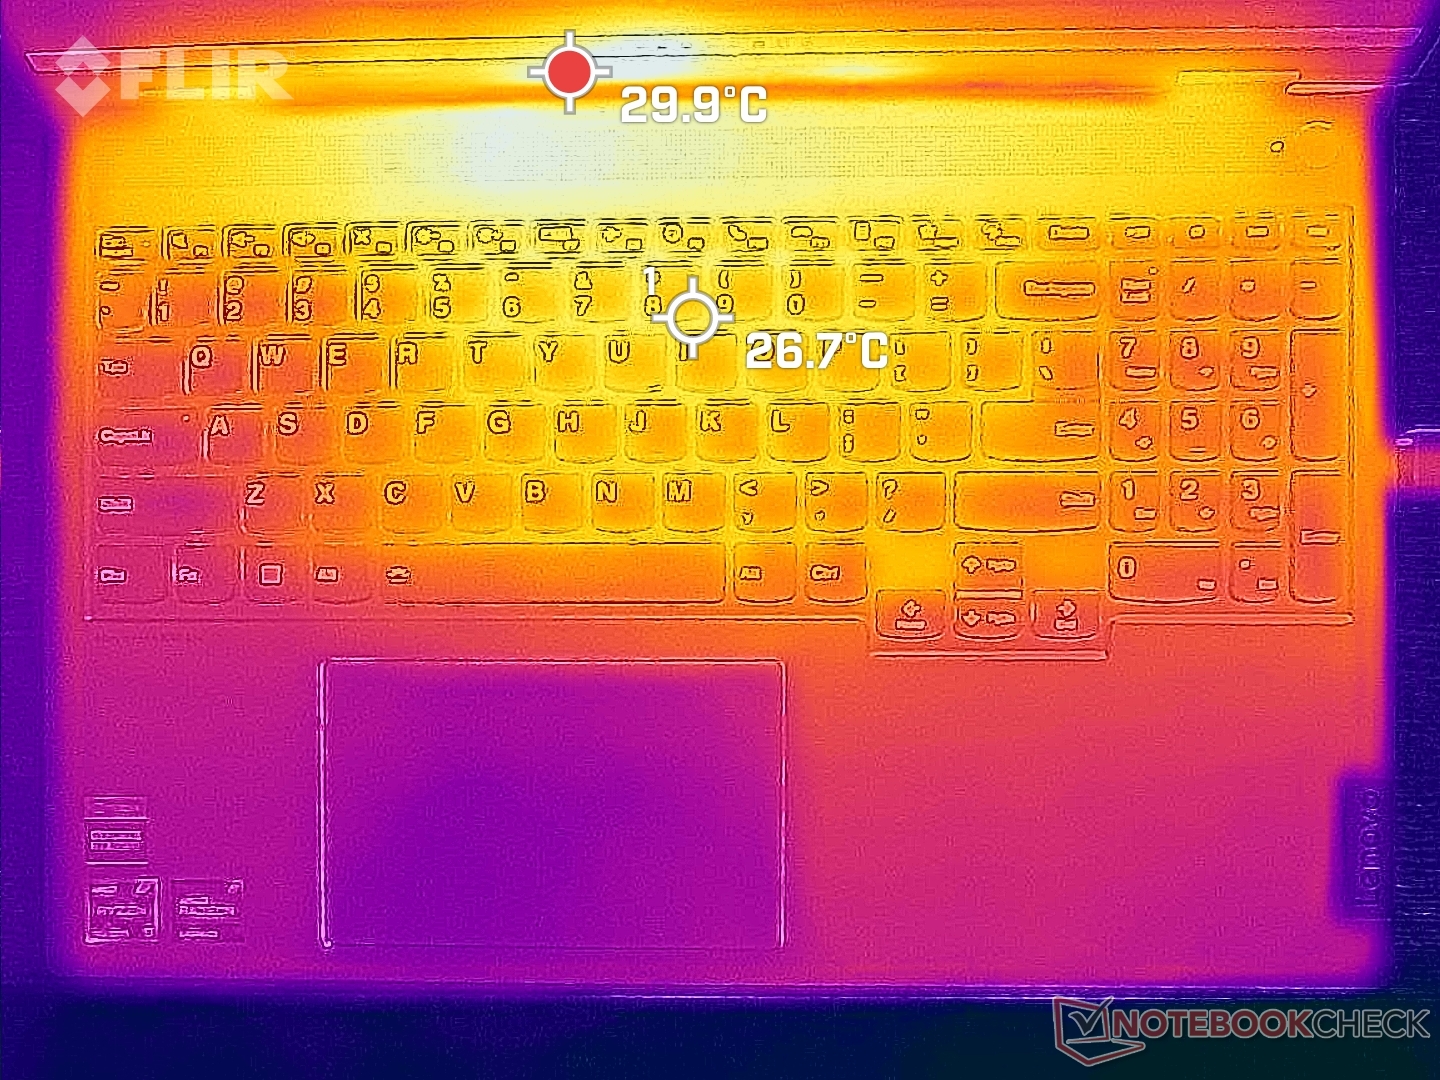
(+) Handledsstöden och pekplattan är kallare än hudtemperaturen med maximalt 29.4 °C / 84.9 F och är därför svala att ta på.
(±) Medeltemperaturen för handledsstödsområdet på liknande enheter var 28.7 °C / 83.7 F (-0.7 °C / -1.2 F).
| Lenovo ThinkBook 16p G3 ARH AMD Ryzen 9 6900HX, NVIDIA GeForce RTX 3060 Laptop GPU | HP Envy 16 h0112nr Intel Core i7-12700H, NVIDIA GeForce RTX 3060 Laptop GPU | Lenovo ThinkBook 16p G2 ACH AMD Ryzen 9 5900HX, NVIDIA GeForce RTX 3060 Laptop GPU | Lenovo IdeaPad 5 Pro 16ARH7 AMD Ryzen 5 6600HS, AMD Radeon 660M | Acer Swift X SFX16-51G-5388 Intel Core i5-11320H, NVIDIA GeForce RTX 3050 4GB Laptop GPU | Lenovo Legion 5 Pro 16IAH7H Intel Core i7-12700H, NVIDIA GeForce RTX 3060 Laptop GPU | |
|---|---|---|---|---|---|---|
| Heat | 4% | 2% | 10% | 1% | -4% | |
| Maximum Upper Side * (°C) | 48.2 | 45.2 6% | 50 -4% | 46 5% | 52.4 -9% | 45.8 5% |
| Maximum Bottom * (°C) | 49.6 | 44 11% | 53 -7% | 48 3% | 50 -1% | 66.3 -34% |
| Idle Upper Side * (°C) | 31.8 | 33.6 -6% | 29 9% | 28 12% | 30.3 5% | 30.4 4% |
| Idle Bottom * (°C) | 33.6 | 32.6 3% | 30 11% | 27 20% | 30.4 10% | 30.4 10% |
* ... mindre är bättre
Stresstest
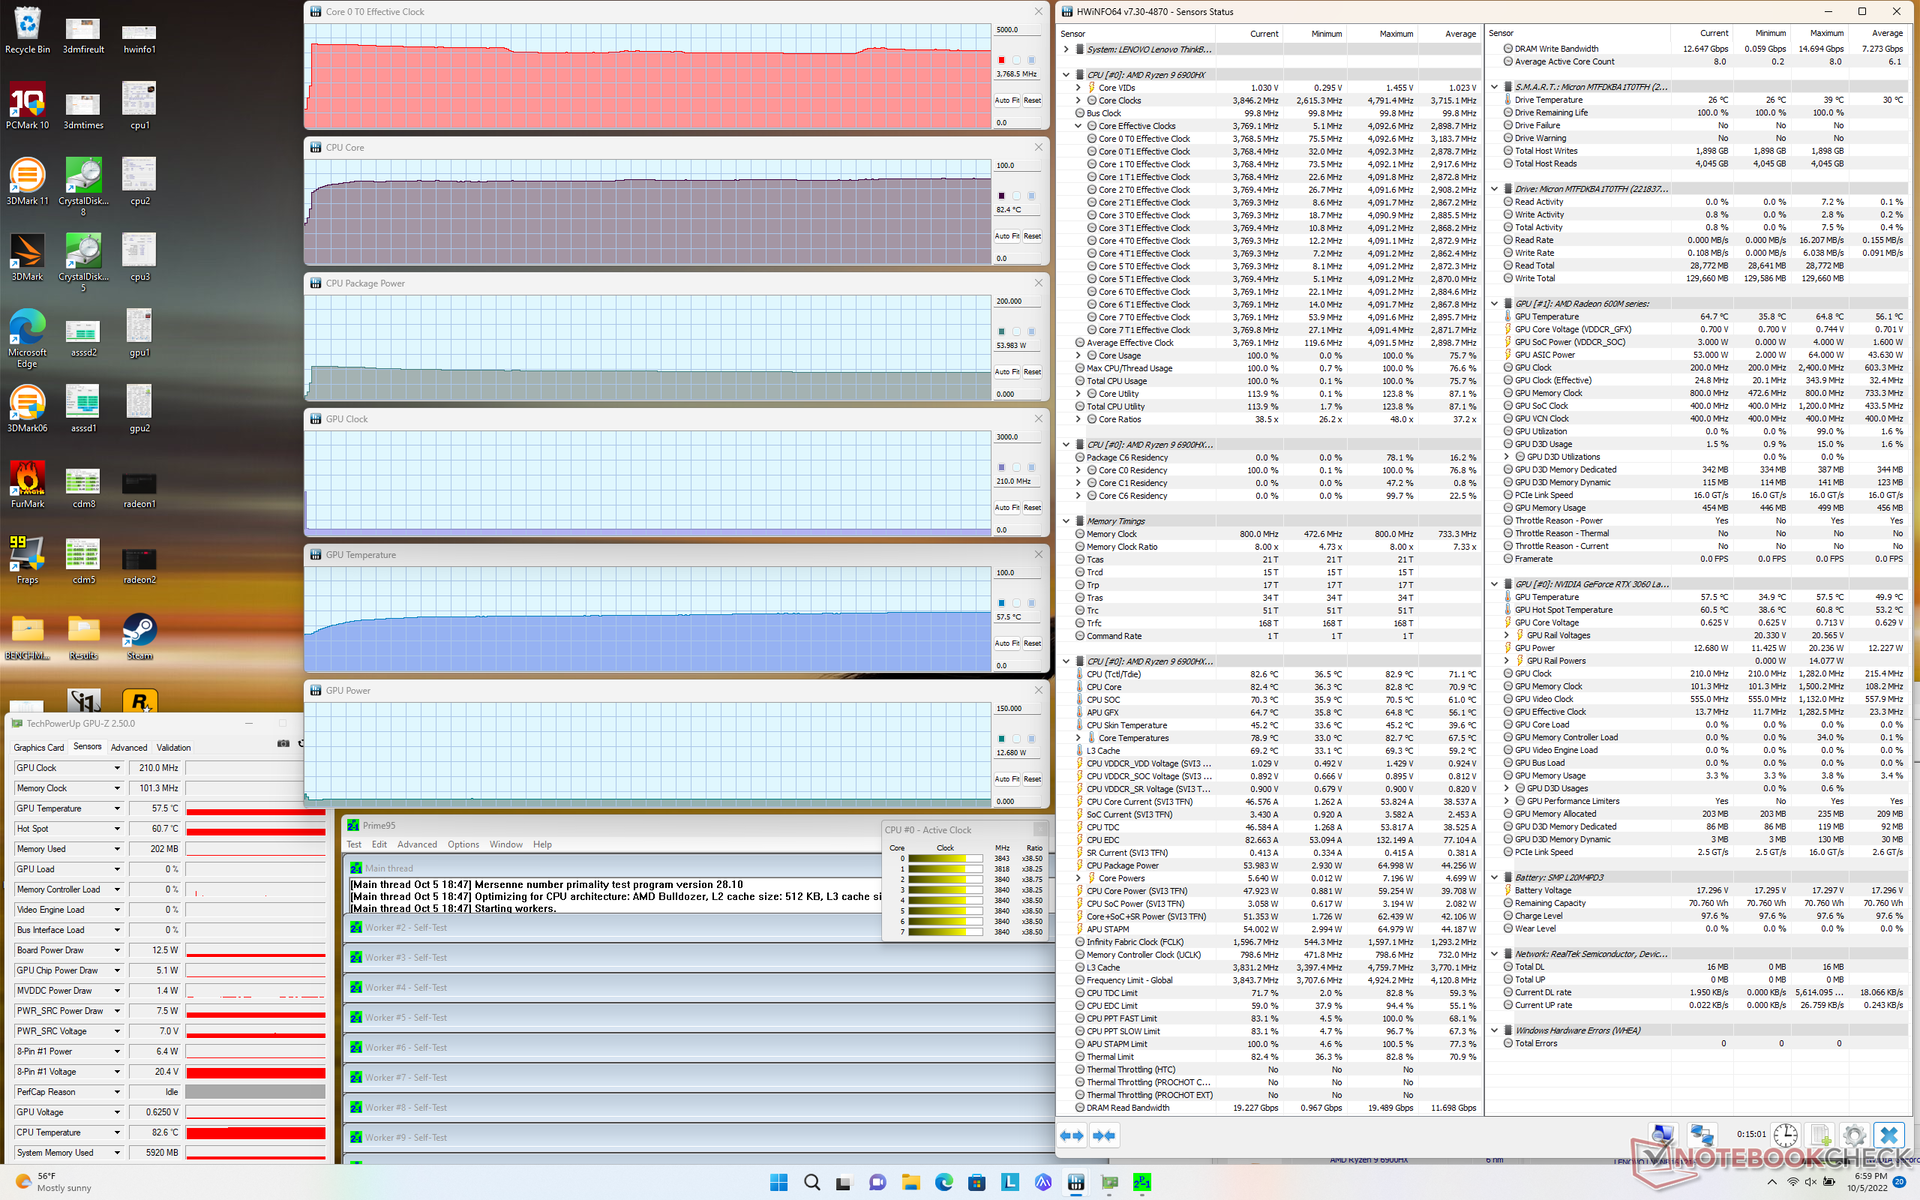
CPU-klockfrekvens, temperatur och strömförbrukning på kortet ökade till 4,1 GHz, 77 C respektive 65 W när Prime95-stressen inleddes. Processorn stabiliserades så småningom på 3,7 GHz, 82 C och 54 W kort därefter. Som jämförelse kan nämnas att den tjockare Legion 7 16ARHA med samma Ryzen 9 6900HX-processor stabiliserades vid 4,2 GHz, 89 C och 99 W när samma Prime95-test kördes.
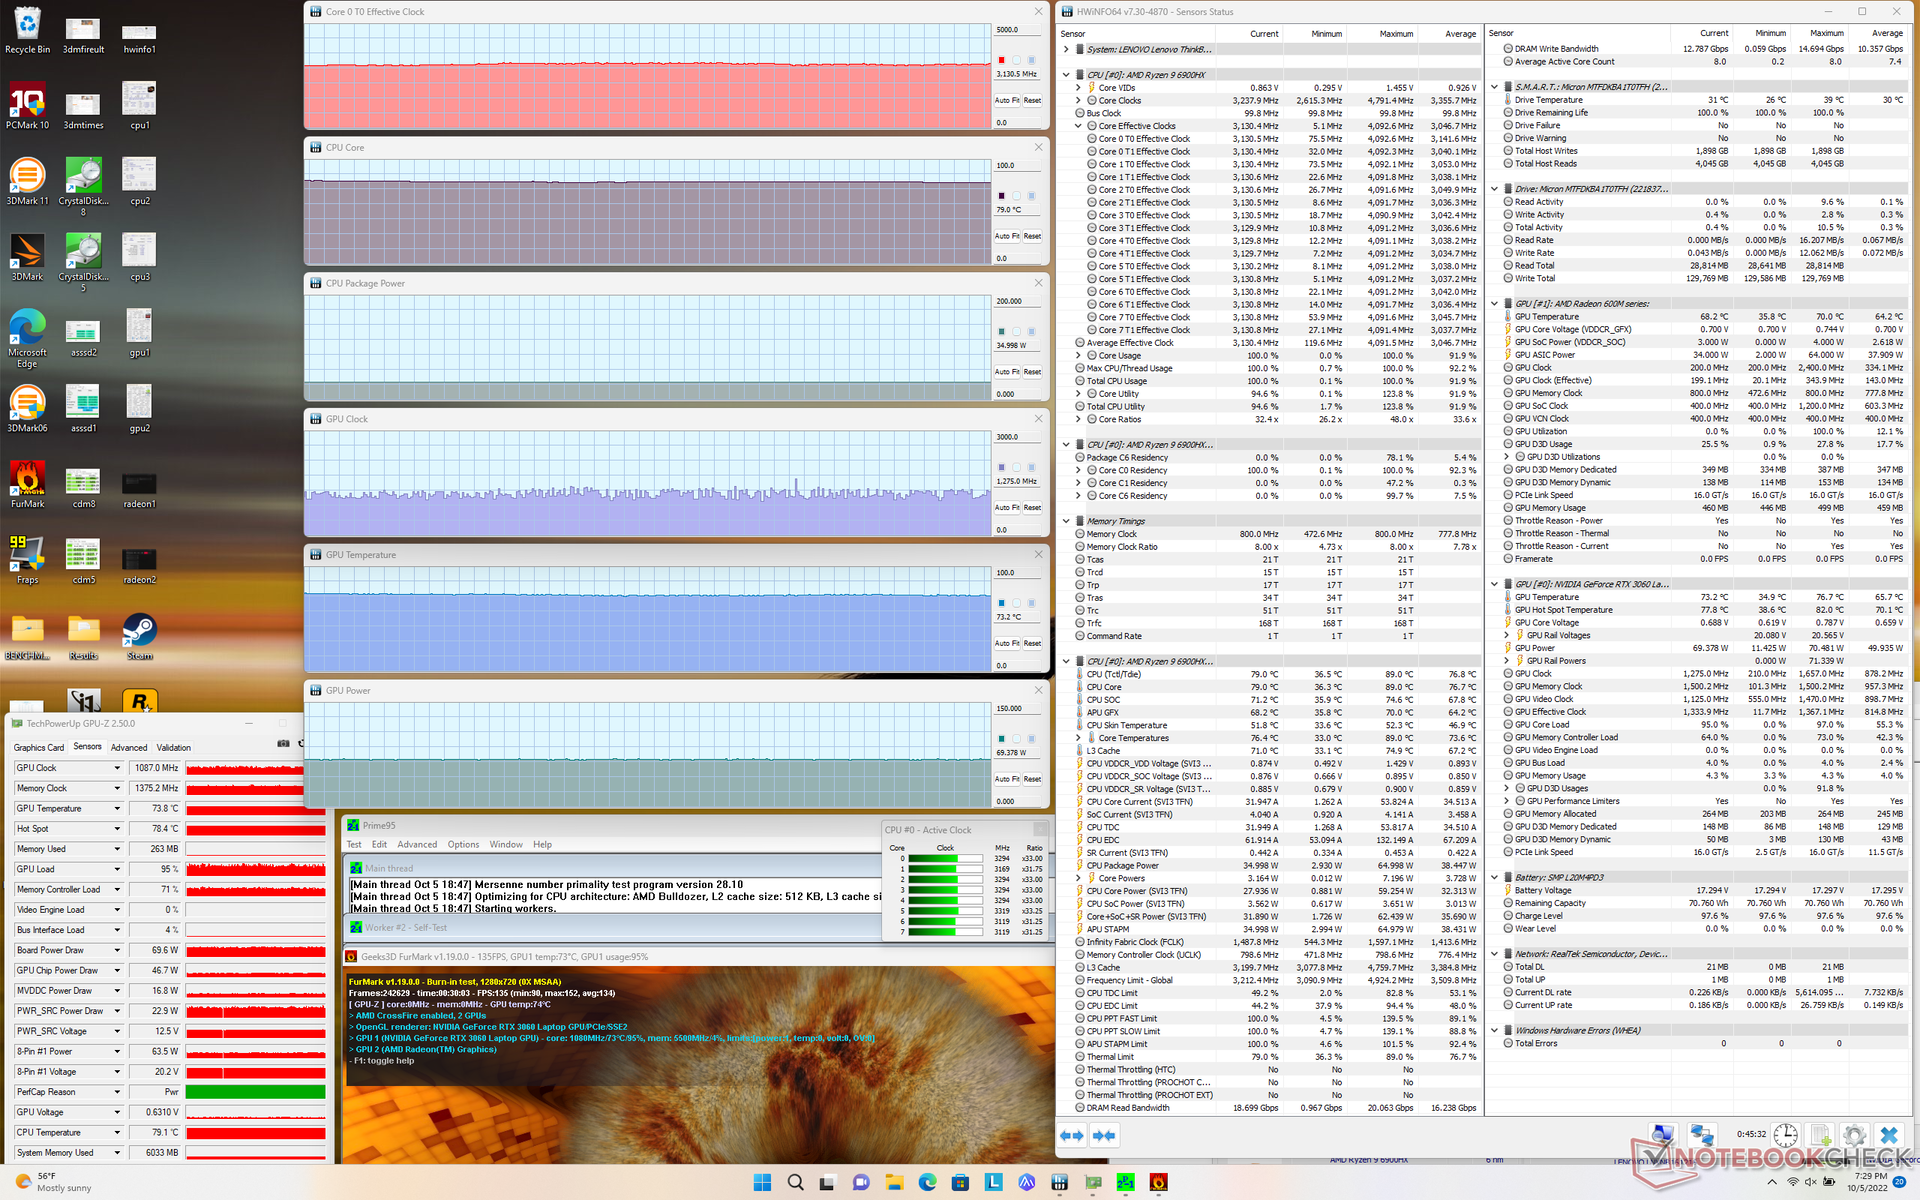
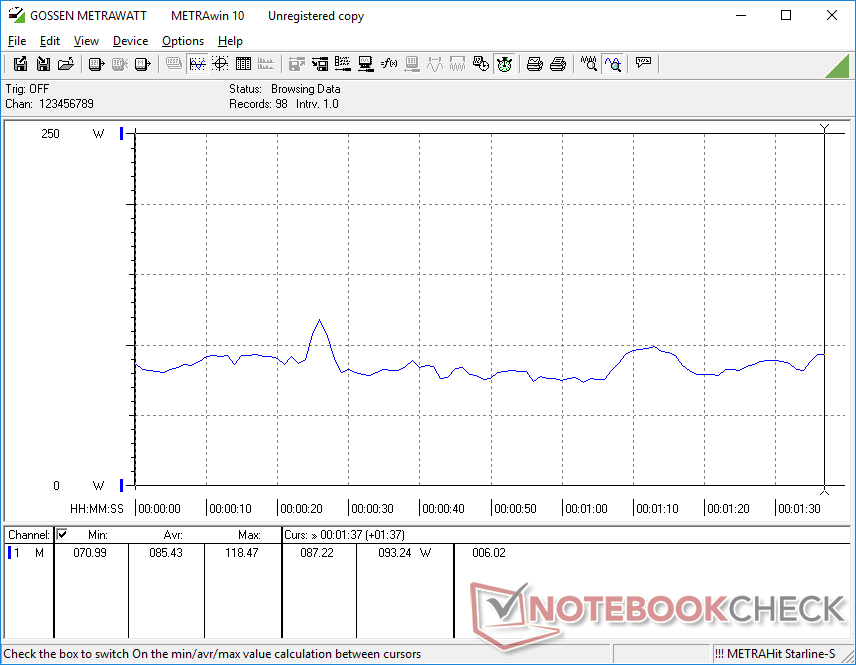
GPU:s klockfrekvens, temperatur och strömförbrukning på kortet skulle stabiliseras vid 1582 MHz, 69 C och 69 W när man körde Witcher 3. Vi kan inte nå i närheten av TGP-målet på 90 W som systemet siktar på, inte ens i Extreme Performance-läget.
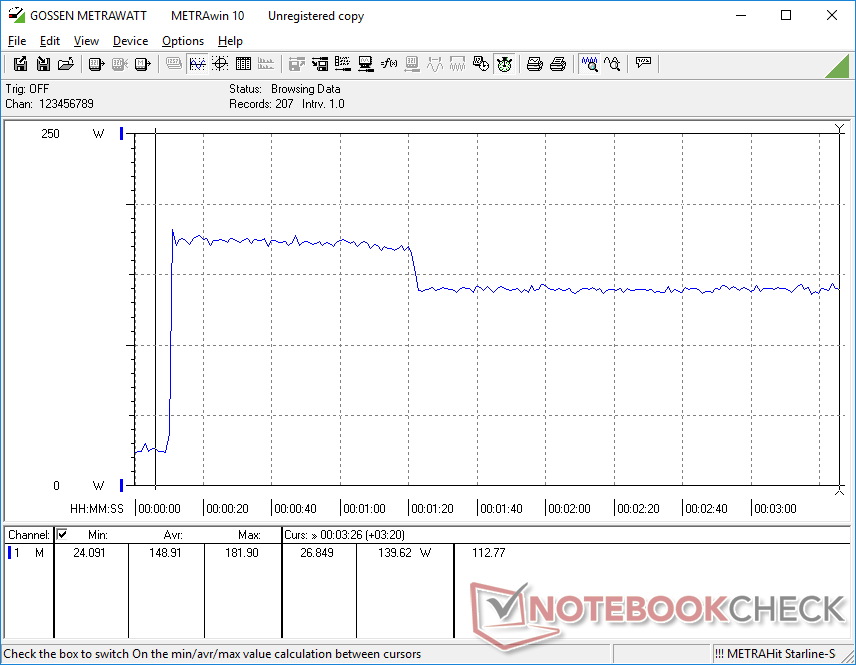
Att köra på batteri minskar prestandan. Ett Fire Strike -test på batteridrift skulle ge fysik- och grafikresultat på 17799 respektive 10557 poäng, jämfört med 25683 och 19597 poäng när det är på nätspänning.
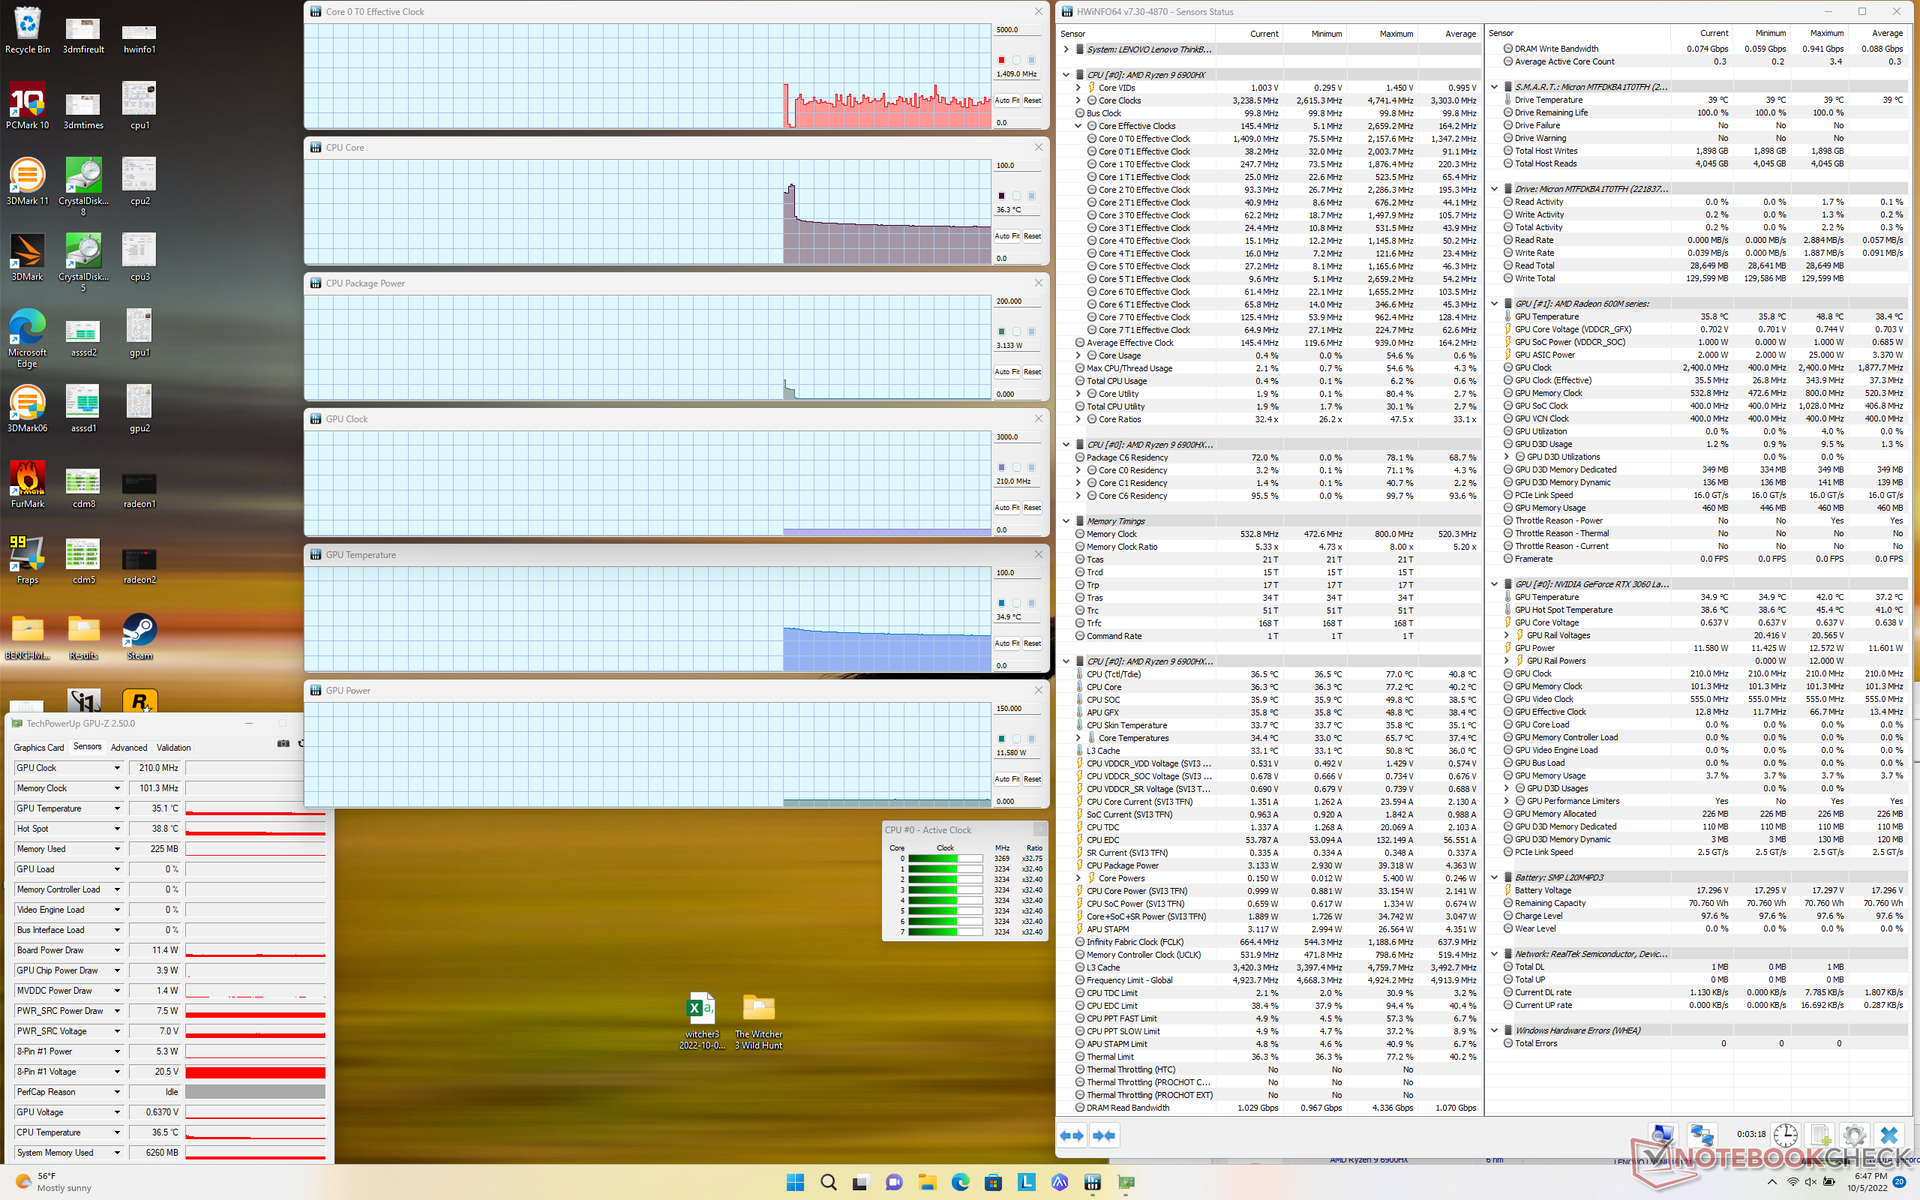
| CPU-klocka (GHz) | GPU-klocka (MHz) | Genomsnittlig CPU-temperatur (°C) | Genomsnittlig GPU-temperatur (°C) | |
| Systemets tomgång | -- | -- | 36 | 34 |
| Prime95 Stress | 3.7 | -- | 82 | 58 |
| Prime95 + FurMark Stress | 3.1 | ~1275 | 79 | 73 |
| Witcher 3 Stress | ~2,5 | 1582 | 77 | 69 |
Högtalare
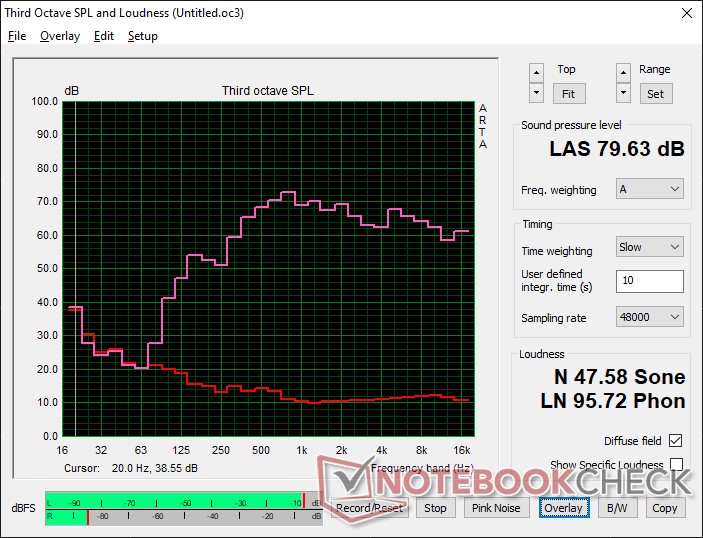
Lenovo ThinkBook 16p G3 ARH ljudanalys
(±) | högtalarljudstyrkan är genomsnittlig men bra (79.6 dB)
Bas 100 - 315 Hz
(±) | reducerad bas - i genomsnitt 13.4% lägre än medianen
(±) | linjäriteten för basen är genomsnittlig (11.9% delta till föregående frekvens)
Mellan 400 - 2000 Hz
(+) | balanserad mellan - endast 4.8% från medianen
(+) | mids är linjära (5.5% delta till föregående frekvens)
Högsta 2 - 16 kHz
(+) | balanserade toppar - endast 1.6% från medianen
(+) | toppar är linjära (4.6% delta till föregående frekvens)
Totalt 100 - 16 000 Hz
(+) | det totala ljudet är linjärt (13% skillnad mot median)
Jämfört med samma klass
» 26% av alla testade enheter i den här klassen var bättre, 5% liknande, 70% sämre
» Den bästa hade ett delta på 5%, genomsnittet var 17%, sämst var 45%
Jämfört med alla testade enheter
» 13% av alla testade enheter var bättre, 3% liknande, 85% sämre
» Den bästa hade ett delta på 4%, genomsnittet var 23%, sämst var 134%
Apple MacBook Pro 16 2021 M1 Pro ljudanalys
(+) | högtalare kan spela relativt högt (84.7 dB)
Bas 100 - 315 Hz
(+) | bra bas - bara 3.8% från medianen
(+) | basen är linjär (5.2% delta till föregående frekvens)
Mellan 400 - 2000 Hz
(+) | balanserad mellan - endast 1.3% från medianen
(+) | mids är linjära (2.1% delta till föregående frekvens)
Högsta 2 - 16 kHz
(+) | balanserade toppar - endast 1.9% från medianen
(+) | toppar är linjära (2.7% delta till föregående frekvens)
Totalt 100 - 16 000 Hz
(+) | det totala ljudet är linjärt (4.6% skillnad mot median)
Jämfört med samma klass
» 0% av alla testade enheter i den här klassen var bättre, 0% liknande, 100% sämre
» Den bästa hade ett delta på 5%, genomsnittet var 17%, sämst var 45%
Jämfört med alla testade enheter
» 0% av alla testade enheter var bättre, 0% liknande, 100% sämre
» Den bästa hade ett delta på 4%, genomsnittet var 23%, sämst var 134%
Energiförvaltning
Effektförbrukning
Förbrukningen vid tomgång på skrivbordet varierar mellan 10 W och 24 W beroende på strömprofil och ljusstyrka, jämfört med endast 10 W till 19 W för Gen 2-modellen. Den totala förbrukningen är betydligt lägre än för Legion 5 Pro 16 som har samma GeForce RTX 3060 GPU men en snabbare Intel 12th gen Core i7 CPU
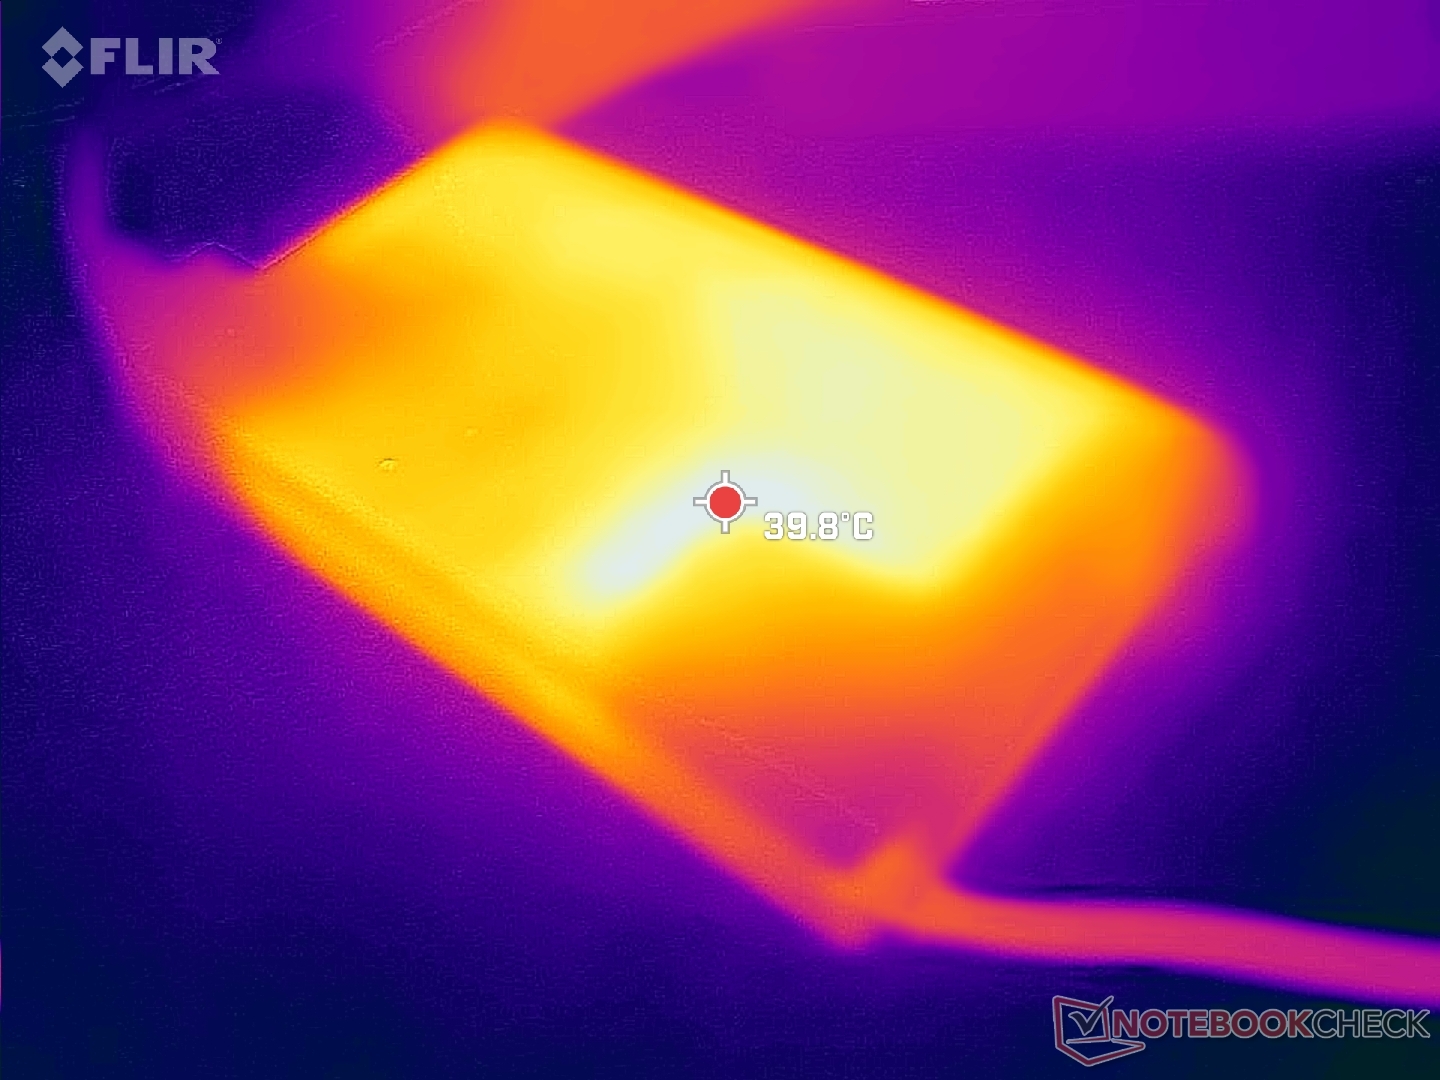
Vi kan nå maximalt 182 W från den medelstora (~16 x 8,8 x 2,8 cm) 230 W AC-adaptern när CPU:n och GPU:n vardera är 100 procent utnyttjade.
| Av/Standby | |
| Låg belastning | |
| Hög belastning |
|
Förklaring:
min: | |
| Lenovo ThinkBook 16p G3 ARH R9 6900HX, GeForce RTX 3060 Laptop GPU, Micron 3400 1TB MTFDKBA1T0TFH, IPS, 2560x1600, 16" | HP Envy 16 h0112nr i7-12700H, GeForce RTX 3060 Laptop GPU, Micron 3400 1TB MTFDKBA1T0TFH, OLED, 3840x2400, 16" | Lenovo ThinkBook 16p G2 ACH R9 5900HX, GeForce RTX 3060 Laptop GPU, WDC PC SN730 SDBPNTY-1T00, IPS, 2560x1600, 16" | Lenovo IdeaPad 5 Pro 16ARH7 R5 6600HS, Radeon 660M, Samsung PM9A1 MZVL2512HCJQ, IPS, 2560x1600, 16" | Acer Swift X SFX16-51G-5388 i5-11320H, GeForce RTX 3050 4GB Laptop GPU, Samsung PM991 MZVLQ512HBLU, , 1920x1080, 16.1" | Lenovo Legion 5 Pro 16IAH7H i7-12700H, GeForce RTX 3060 Laptop GPU, 2x Samsung PM9A1 MZVL21T0HCLR (RAID 0), IPS, 2560x1600, 16" | |
|---|---|---|---|---|---|---|
| Power Consumption | -6% | 4% | 52% | 39% | -77% | |
| Idle Minimum * (Watt) | 10.3 | 10 3% | 13.2 -28% | 4 61% | 7 32% | 22.8 -121% |
| Idle Average * (Watt) | 16 | 10.9 32% | 17 -6% | 7 56% | 10.1 37% | 26.5 -66% |
| Idle Maximum * (Watt) | 24 | 27.8 -16% | 18.6 22% | 13 46% | 15 37% | 41 -71% |
| Load Average * (Watt) | 85.4 | 116.4 -36% | 88.8 -4% | 61 29% | 63.3 26% | 191 -124% |
| Witcher 3 ultra * (Watt) | 132.2 | 133.7 -1% | 123 7% 123 7% | 42.8 68% | 63.3 52% | 194.7 -47% |
| Load Maximum * (Watt) | 181.9 | 209.8 -15% | 132 27% | 88 52% | 94 48% | 238 -31% |
* ... mindre är bättre
Power Consumption Witcher 3 / Stresstest
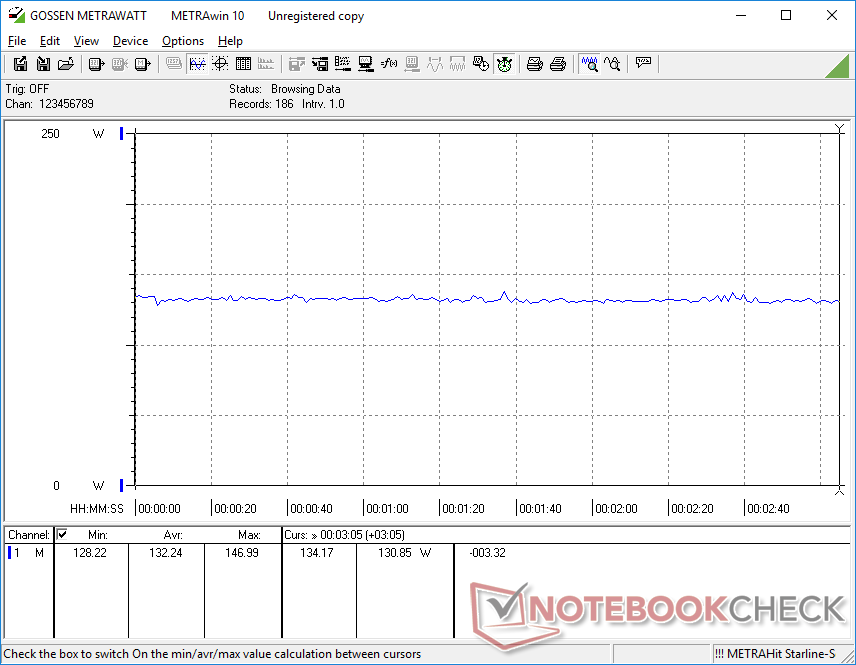
Power Consumption external Monitor
Batteritid
WLAN-tiden är ungefär 2 timmar kortare än vad vi registrerade på Gen 2-modellen trots att de har samma 71 Wh-batterier. Den högre uppdateringsfrekvensen på vår skärm (165 Hz jämfört med 60 Hz) kan delvis vara orsaken till den kortare batteritiden
Laddning från tom till full kapacitet tar ungefär 1,5 till 2 timmar. Systemet kan inte laddas via USB-C.
| Lenovo ThinkBook 16p G3 ARH R9 6900HX, GeForce RTX 3060 Laptop GPU, 71 Wh | HP Envy 16 h0112nr i7-12700H, GeForce RTX 3060 Laptop GPU, 83 Wh | Lenovo ThinkBook 16p G2 ACH R9 5900HX, GeForce RTX 3060 Laptop GPU, 71 Wh | Lenovo IdeaPad 5 Pro 16ARH7 R5 6600HS, Radeon 660M, 75 Wh | Acer Swift X SFX16-51G-5388 i5-11320H, GeForce RTX 3050 4GB Laptop GPU, 58.7 Wh | Lenovo Legion 5 Pro 16IAH7H i7-12700H, GeForce RTX 3060 Laptop GPU, 80 Wh | |
|---|---|---|---|---|---|---|
| Batteridrifttid | 22% | 31% | 51% | 25% | -45% | |
| WiFi v1.3 (h) | 6.5 | 7.9 22% | 8.5 31% | 9.8 51% | 8.1 25% | 3.6 -45% |
| Reader / Idle (h) | 17.8 | |||||
| Load (h) | 1.6 | 2 | 1.5 | 0.6 | ||
| H.264 (h) | 7 | 8.4 | 4.1 | |||
| Gaming (h) | 1.1 | |||||
| Witcher 3 ultra (h) | 2.1 |
För
Emot
Bedömning - överväg förra årets modell i stället
Till skillnad från prestandasprånget från 11:e generationen Intel till 12:e generationen Intel ger språnget från AMD Zen 3 till Zen 3+ i bästa fall bara små fördelar. Det faktum att Ryzen 9 5900HX i 2021 ThinkBook 16p Gen 2 kan prestera inom 5 procent på Ryzen 9 6900HX i 2022 ThinkBook 16p Gen 3 gör att den senaste modellen blir en tuffare rekommendation om processorprestanda är vad du är ute efter.
Förändringarna på andra håll i 2022-modellen är dock väl värda att nämna. Särskilt den nya 165 Hz G-Sync-panelen är en betydande uppgradering jämfört med 60 Hz-panelen för en mycket smidigare spelupplevelse. Vi uppskattar också den extra HDMI-porten, men övergången till lödda RAM-minne kan i slutändan uppröra vissa användare. Vi misstänker att Lenovo valde icke-löst RAM-minne för att stödja en något större kylningslösning för den snabbare 90 W TGP GPU:n.
Prestandauppdateringen på årsbasis från ThinkBook 16p Gen 2 är för liten för att vara märkbar under de flesta omständigheter. Det nya och mer imponerande 165 Hz-skärmalternativet bidrar dock till att skilja ThinkBook 16p Gen 3 från de flesta andra bärbara 16-tumsdatorer som för närvarande finns på marknaden.
Användare kan spara lite pengar och få nästan samma prestanda som Gen 3-modellen genom att köpa en äldre men visuellt identisk Gen 2-version. Tänk på att Lenovo tar ut en premie för ThinkBook 15p Gen 3 för tillfället jämfört med de konkurrerande Dell Inspiron 16 Plus 7620 eller HP Envy 16. Lenovo-modellen inkluderar panelalternativet 165 Hz som för närvarande inte finns på de ovannämnda Dell- eller HP-alternativen.
Pris och tillgänglighet
ThinkBook 16p är ännu inte allmänt tillgänglig via tredjepartskanaler som Amazon, Best Buy eller Newegg. Vi rekommenderar att du köper direkt från Lenovo som för närvarande levererar Ryzen 5 6600H- och Ryzen 7 6800H-konfigurationer från 2460 USD.
Lenovo ThinkBook 16p G3 ARH
- 10/08/2022 v7 (old)
Allen Ngo
Price comparison

