Recension av Lenovo IdeaPad Gaming 3 15IAH7: En av de mest kraftfulla bärbara datorerna med RTX 3050 Ti

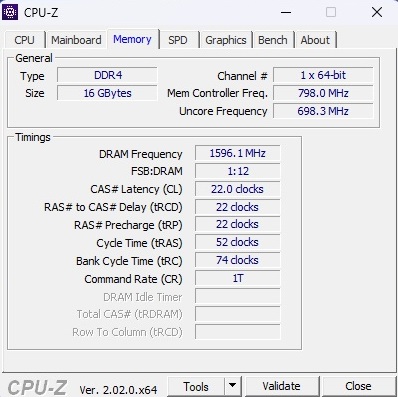
Även om det finns flera bärbara datorer för spel i prisklassen runt 1 000 euro (~978 dollar), så har de flesta av dem inte en skärm med en anständig ljusstyrka och en solid färgtäckning. Från tid till annan kan vi dock hitta ett positivt undantag som IdeaPad Gaming 3 15IAH7 som vi testade, som erbjuder en Core i5-12500H, aGeForce RTX 3050 Ti, 16 GB DDR4 RAM-minne (tyvärr endast i enkelkanalläge) och en 512 GB NVMe SSD. Den 15,6 tum stora IPS-skärmen har en uppdateringsfrekvens på 165 Hz, vilket lovar bra svarstider, och en upplösning på 1920 x 1080 pixlar.
IdeaPad Gaming 3 15IAH7 konkurrerar med andra bärbara datorer med RTX 3050 Ti, t.ex HP Victus 16-e0145ng, denDell G15 5515, och Dell Inspiron 16 Plus 7620. Vi inkluderar även syskonmodellen 15ARH7 (Ryzen 5 6600H & RTX 3050) i våra diagram som en jämförelseenhet.
Potentiella konkurrenter i jämförelse
Gradering | Datum | Modell | Vikt | Höjd | Storlek | Upplösning | Pris |
|---|---|---|---|---|---|---|---|
| 82.8 % v7 (old) | 10/2022 | Lenovo IdeaPad Gaming 3 15IAH7 i5-12500H, GeForce RTX 3050 Ti Laptop GPU | 2.4 kg | 26 mm | 15.60" | 1920x1080 | |
| 80.8 % v7 (old) | 09/2022 | Lenovo IdeaPad Gaming 3 15ARH7 R5 6600H, GeForce RTX 3050 4GB Laptop GPU | 2.4 kg | 21.8 mm | 15.60" | 1920x1080 | |
| 82.7 % v7 (old) | 12/2023 | Dell G15 5515 R7 5800H, GeForce RTX 3050 Ti Laptop GPU | 2.4 kg | 24.9 mm | 15.60" | 1920x1080 | |
| 82.3 % v7 (old) | 05/2022 | HP Victus 16-e0145ng R5 5600H, GeForce RTX 3050 Ti Laptop GPU | 2.4 kg | 23.5 mm | 16.10" | 1920x1080 | |
| 87.4 % v7 (old) | 08/2022 | Dell Inspiron 16 Plus 7620 i7-12700H, GeForce RTX 3050 Ti Laptop GPU | 2.1 kg | 18.99 mm | 16.00" | 3072x1920 |
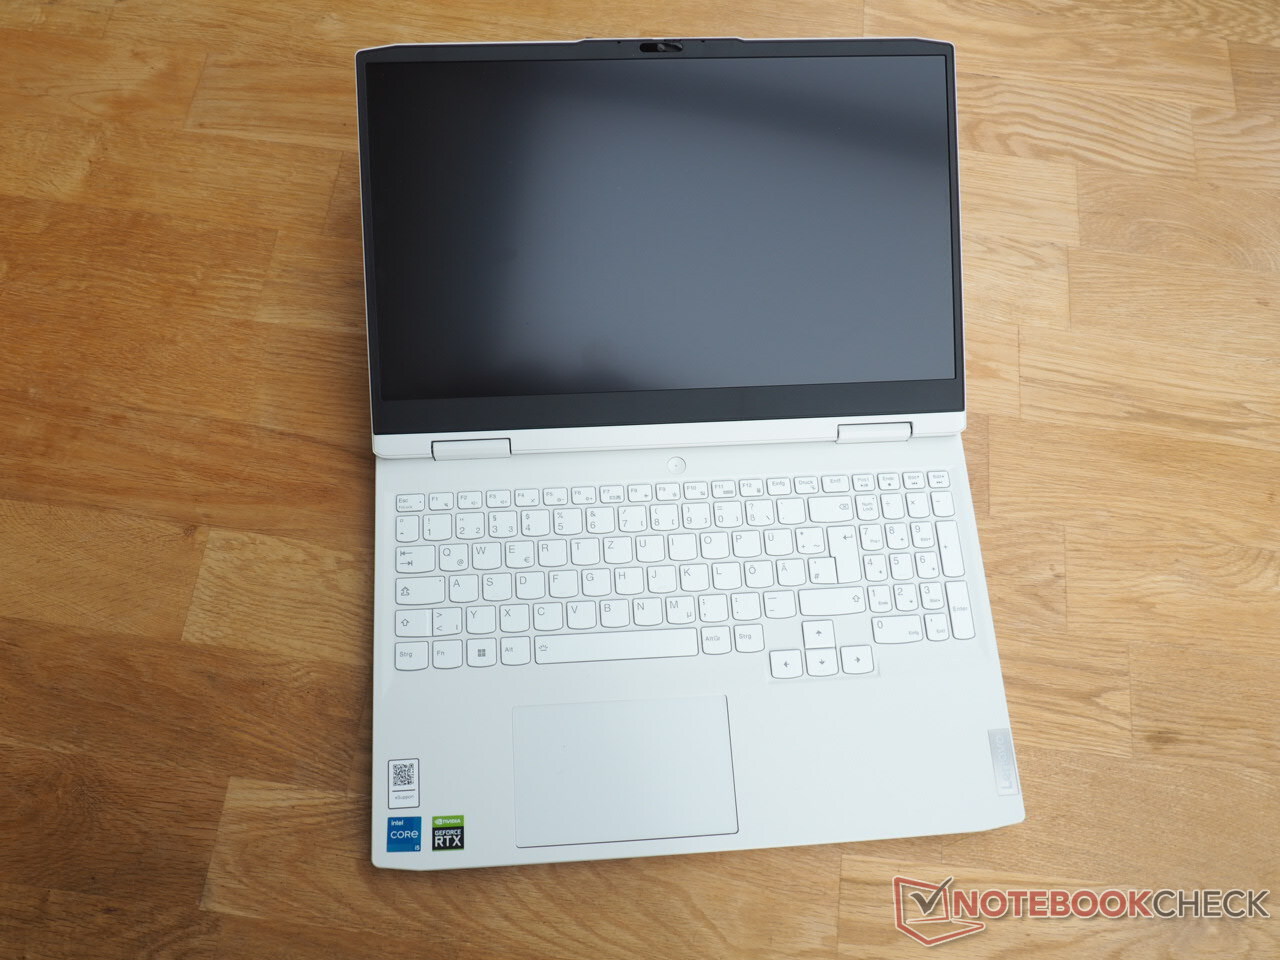
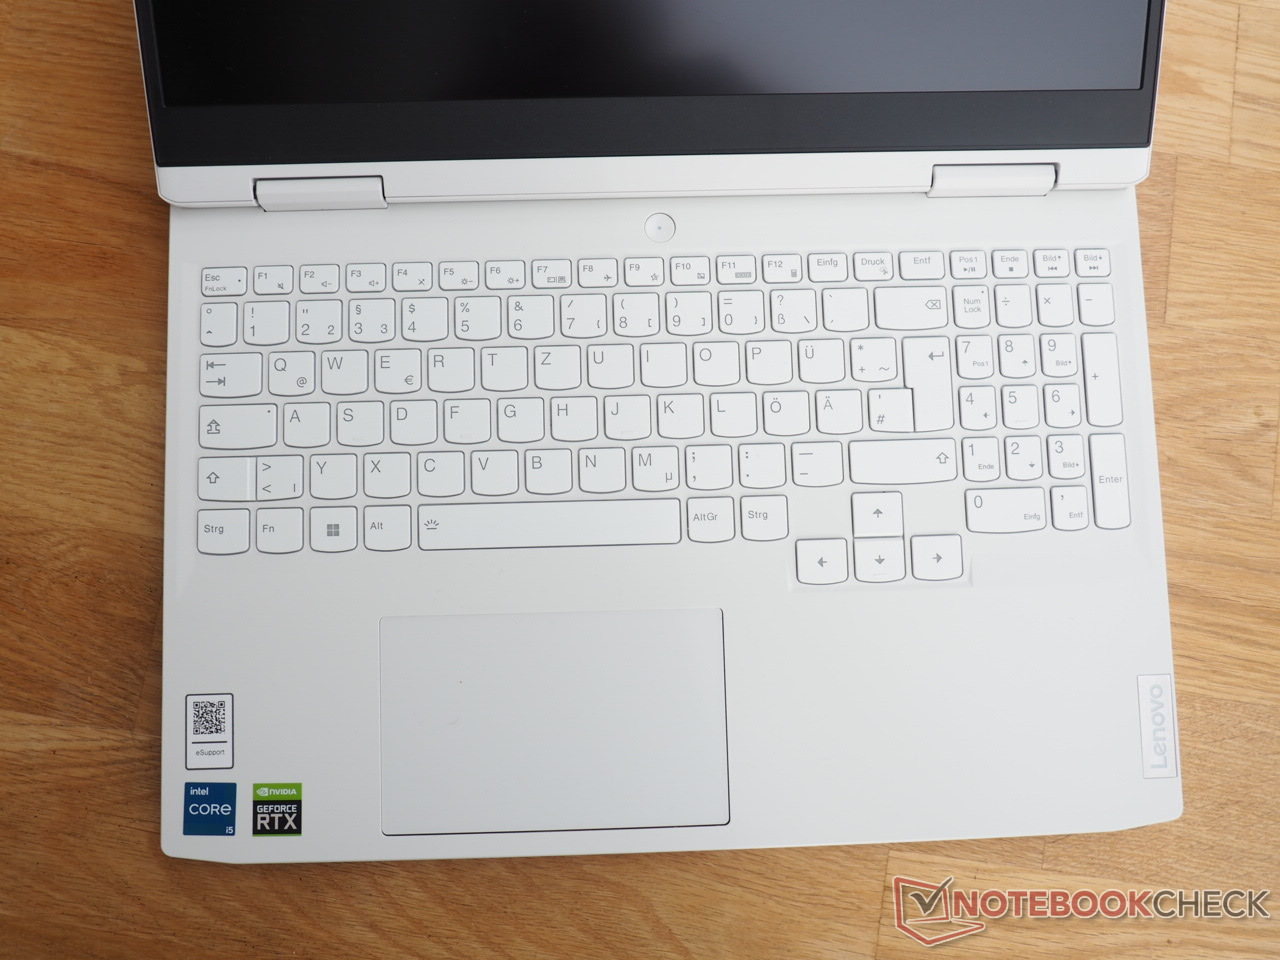
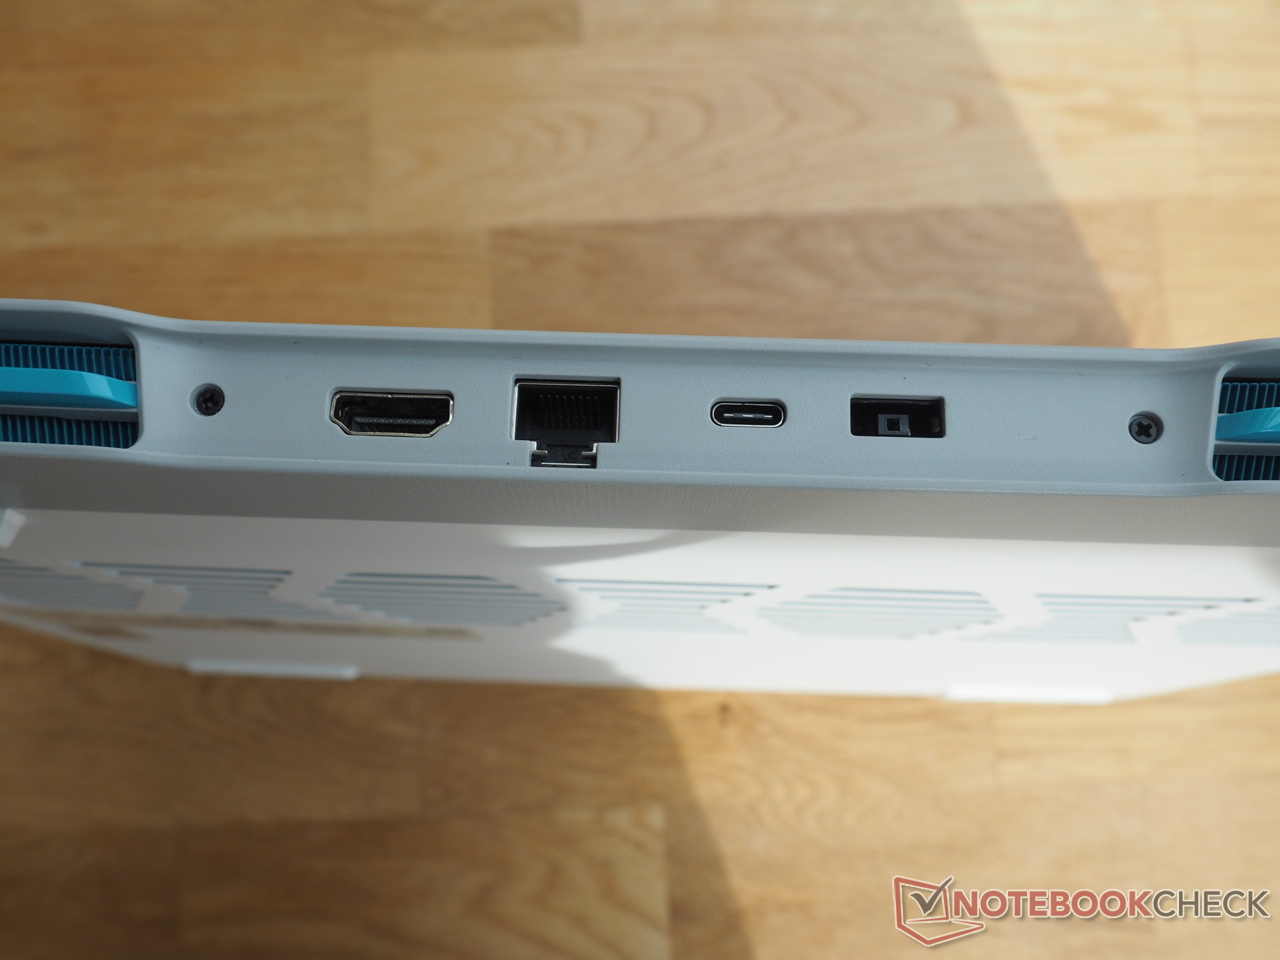
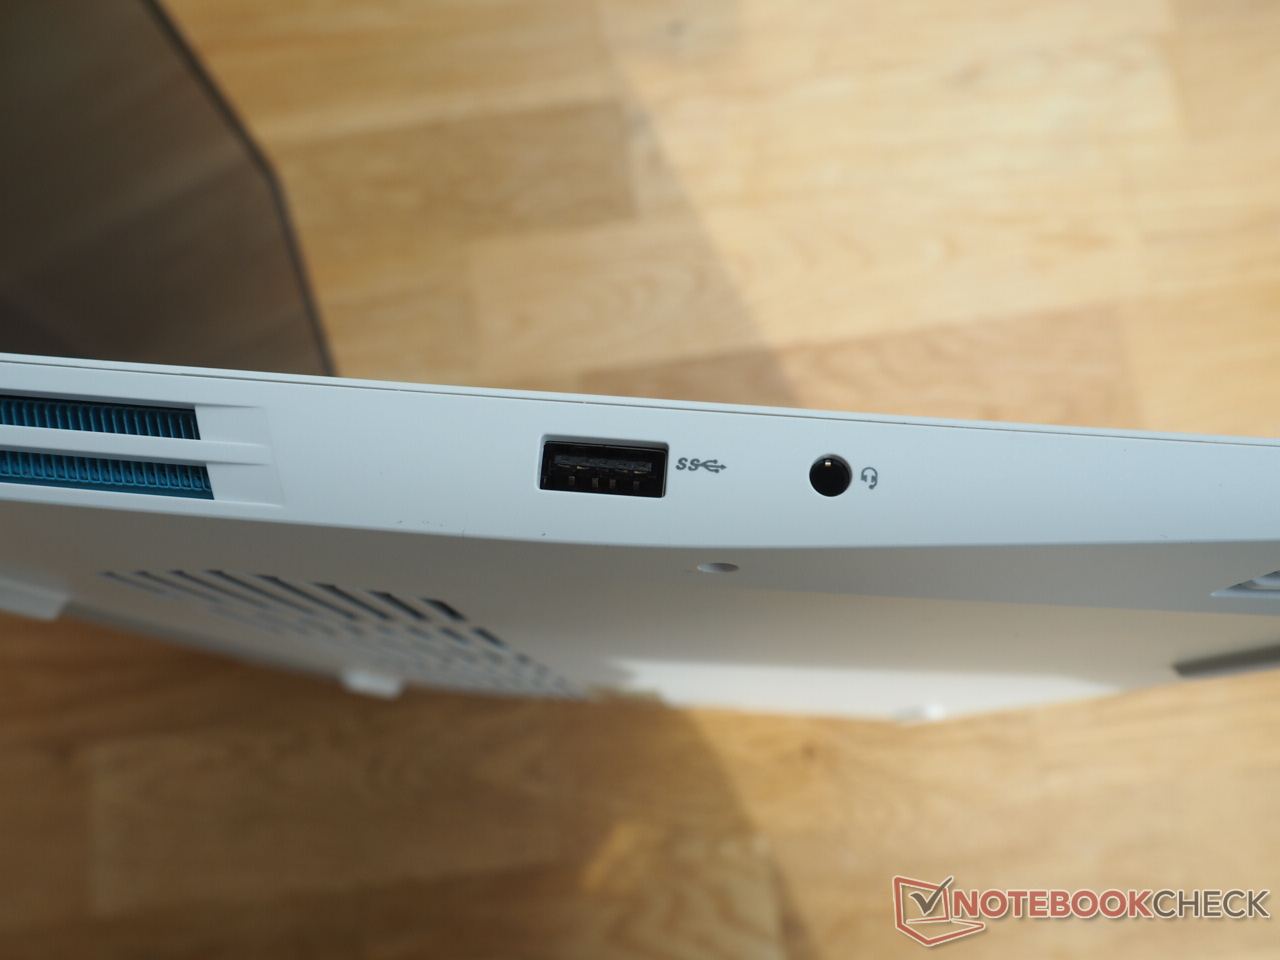
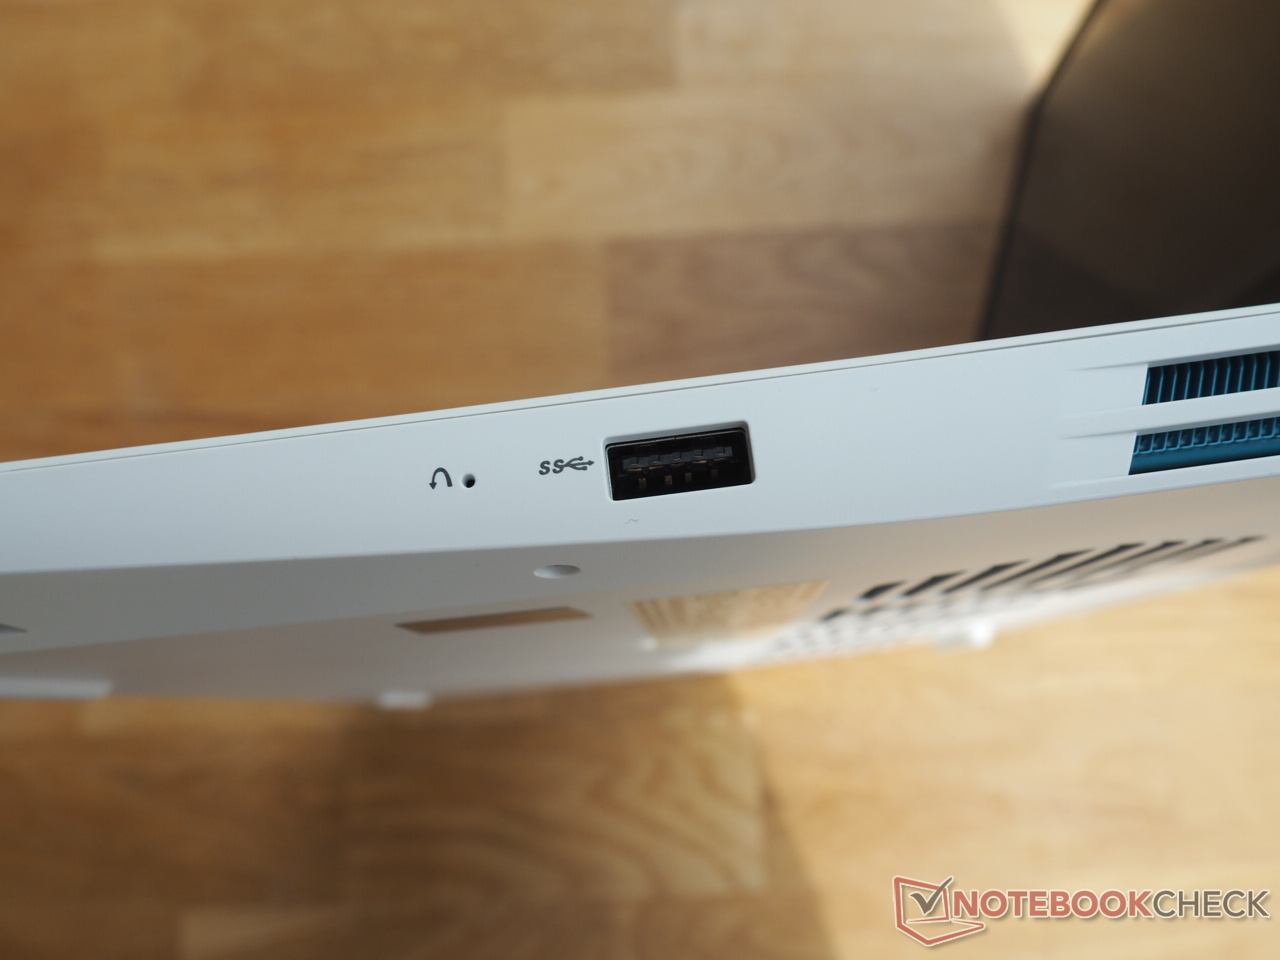
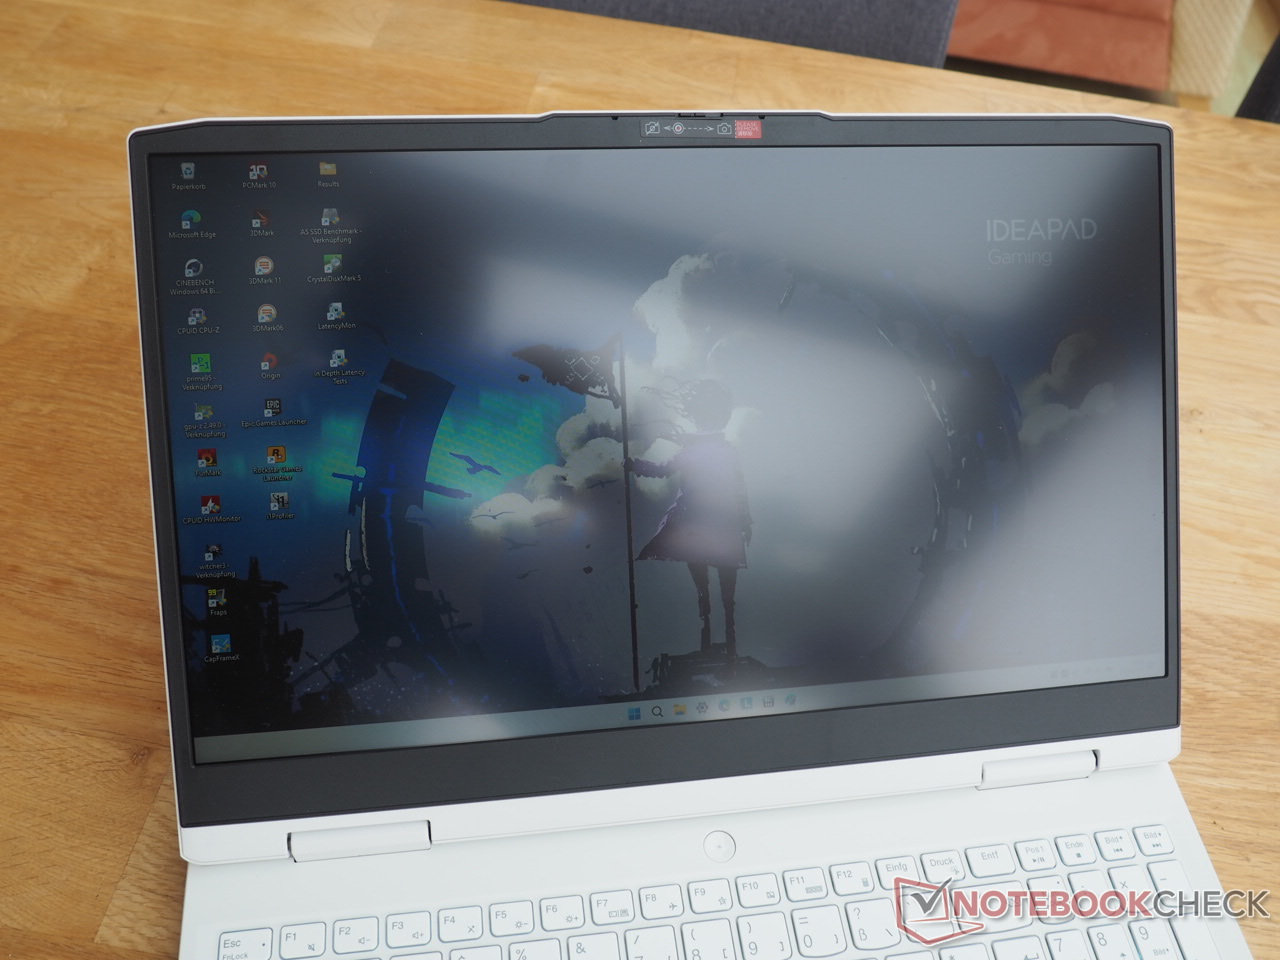
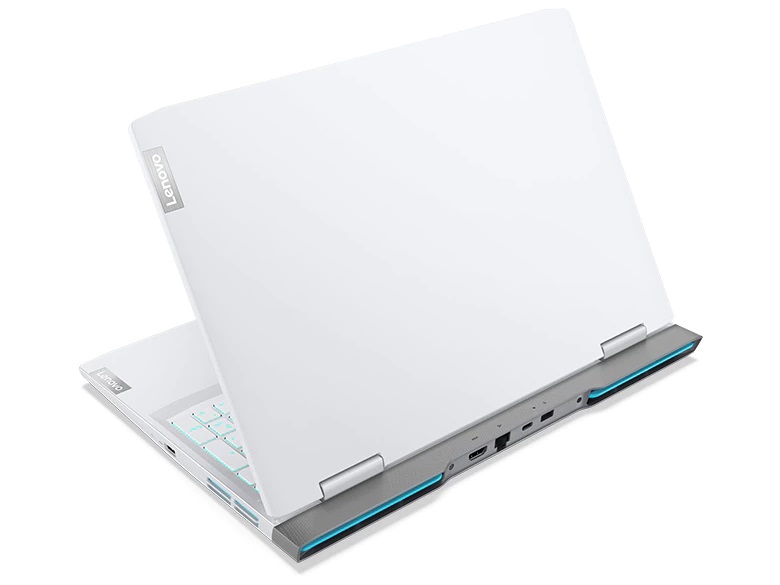
Eftersom fallet är identiskt med syskonmodellen ovan, bortsett från färgen (Glacier White i stället för Onyx Grey) och tangentbordslayouten (German i stället för US), kommer vi inte att diskutera fallet, utrustningen och inmatningsenheterna närmare här. Du kan hitta motsvarande information i recension av syskonmodellen.
Webbkamera


Skärm
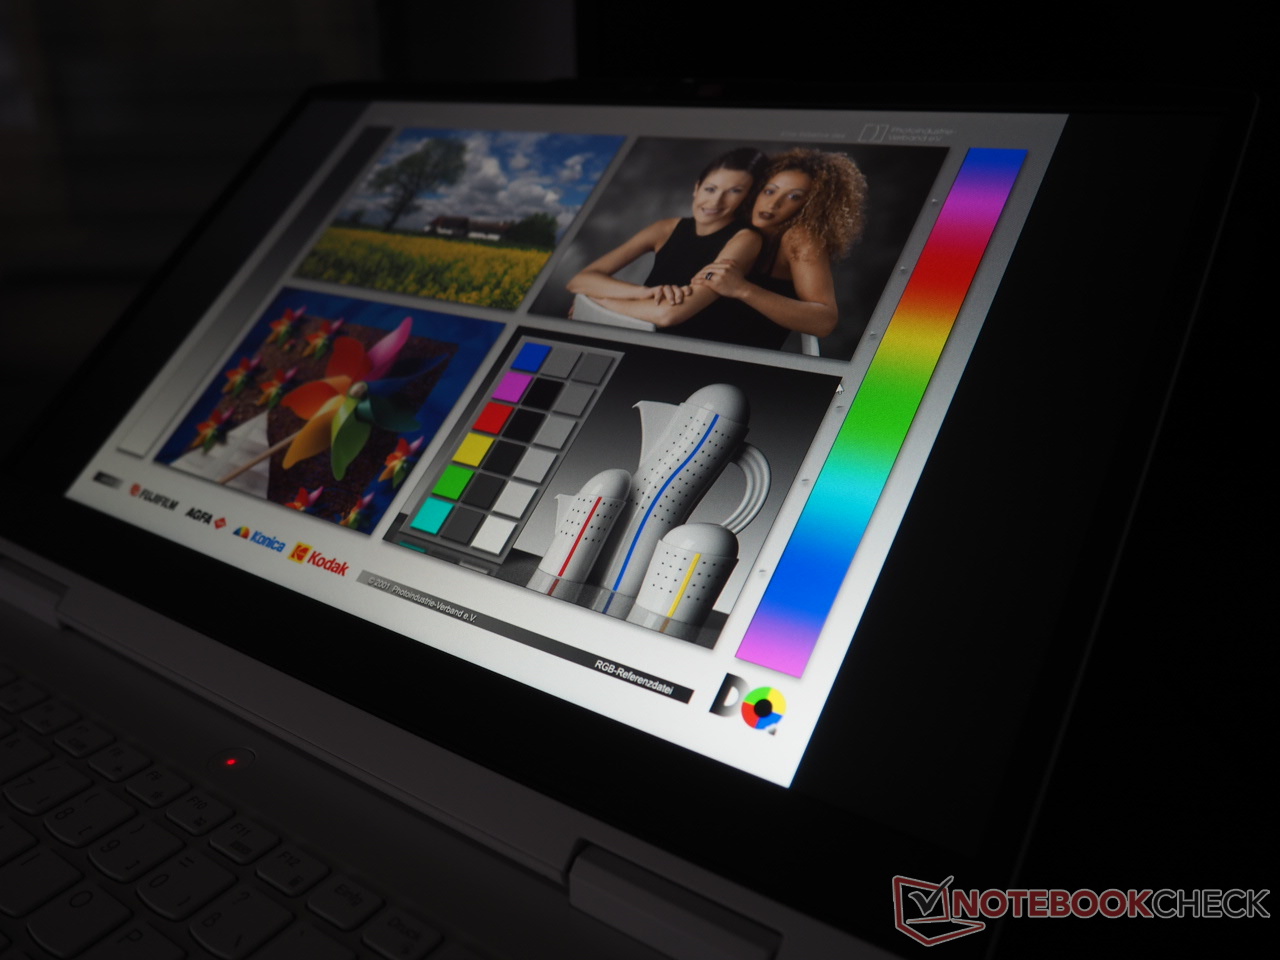
När du tittar på jämförelsen kan du lätt se att prisvärda bärbara speldatorer ofta har en svag skärm.
| |||||||||||||||||||||||||
Distribution av ljusstyrkan: 92 %
Mitt på batteriet: 338 cd/m²
Kontrast: 1252:1 (Svärta: 0.27 cd/m²)
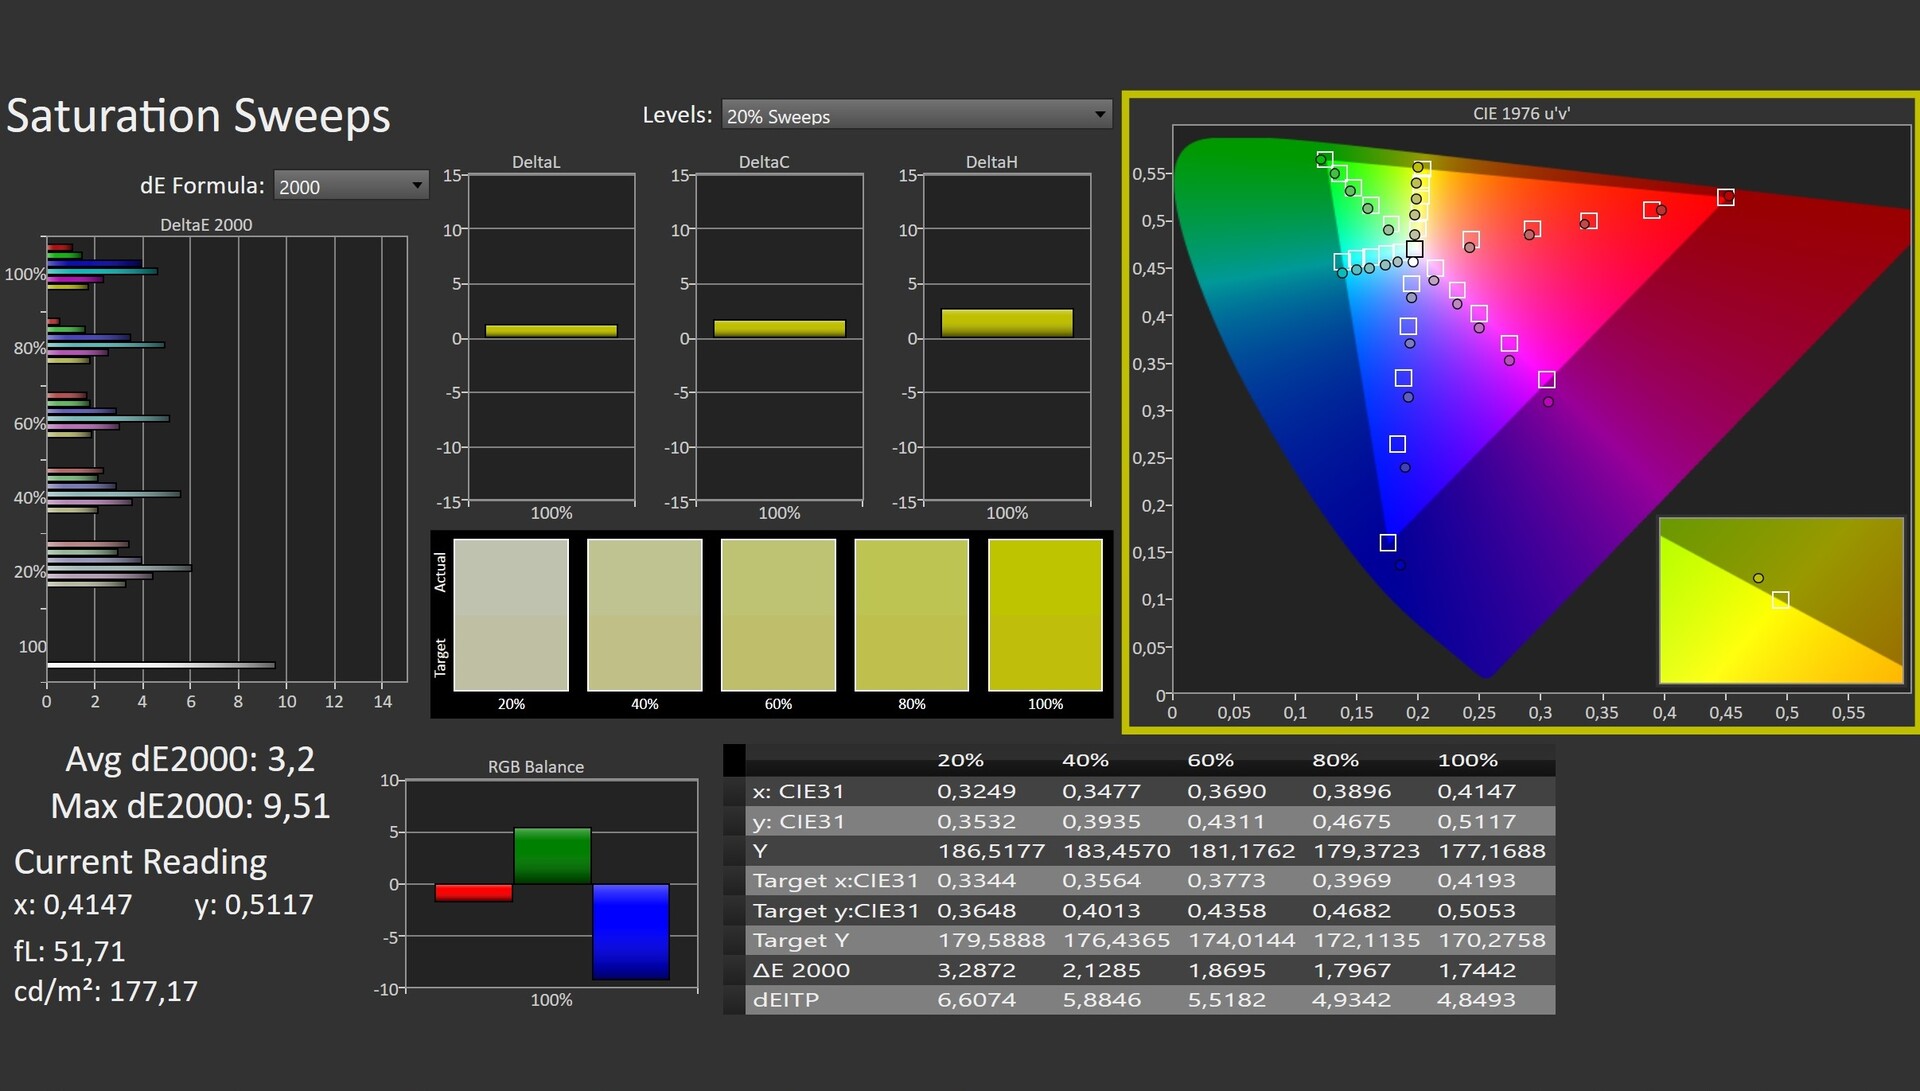
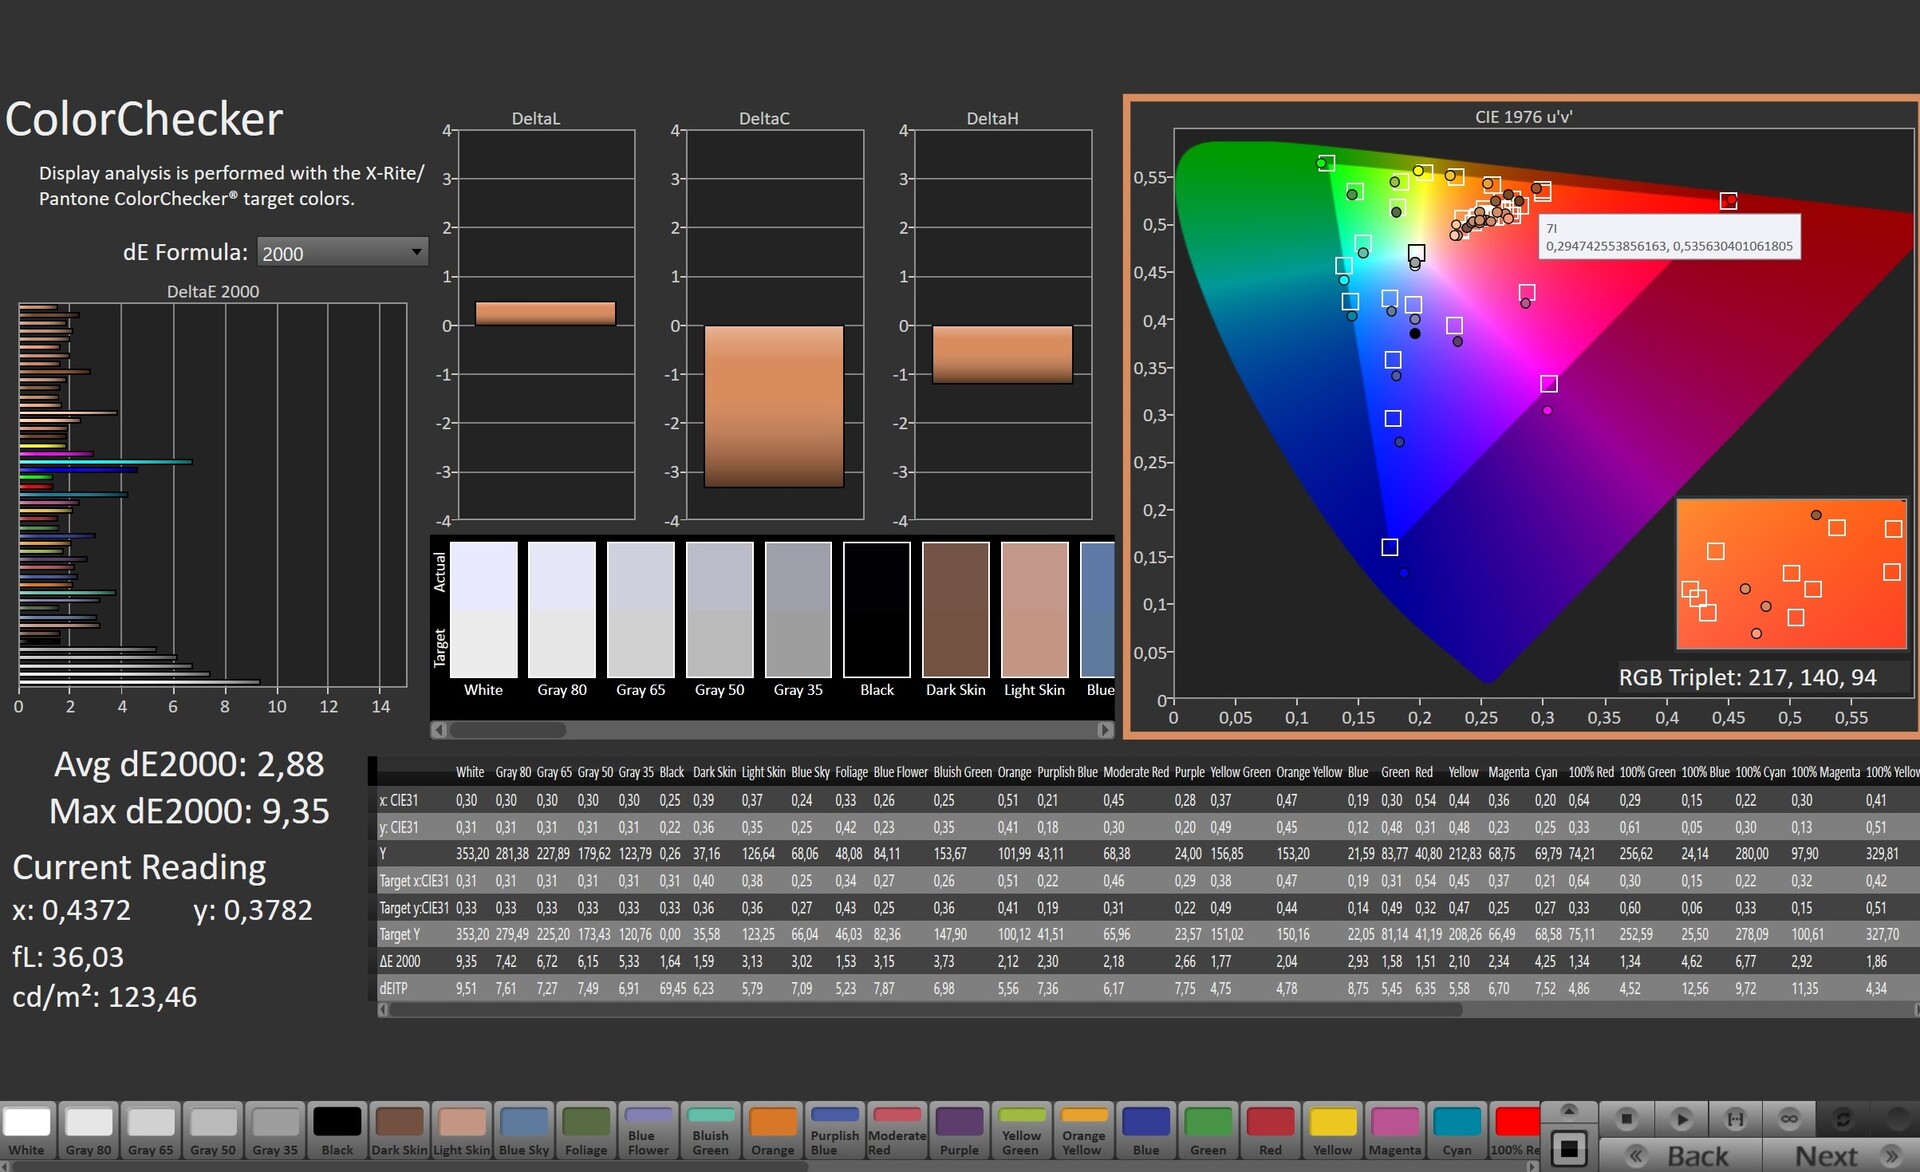
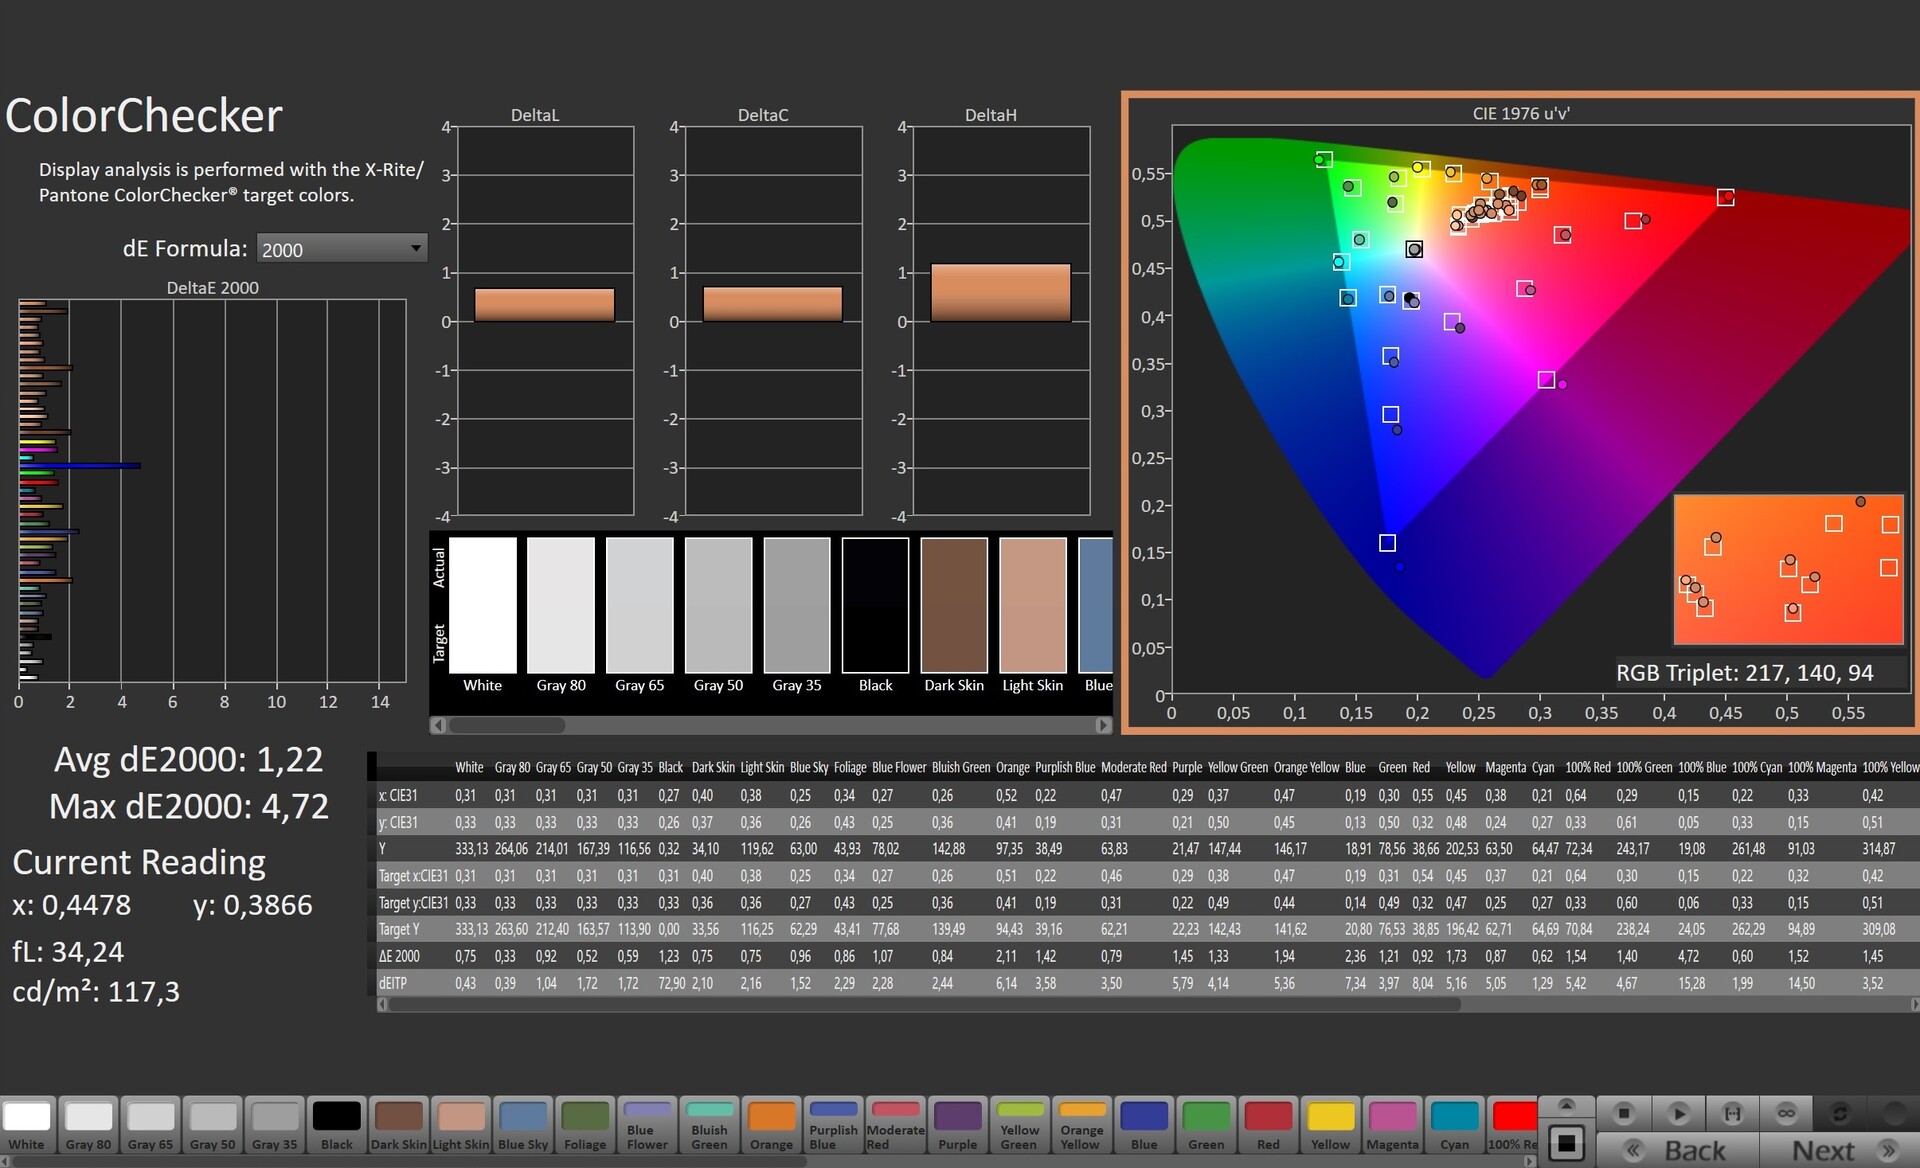
ΔE ColorChecker Calman: 2.88 | ∀{0.5-29.43 Ø4.73}
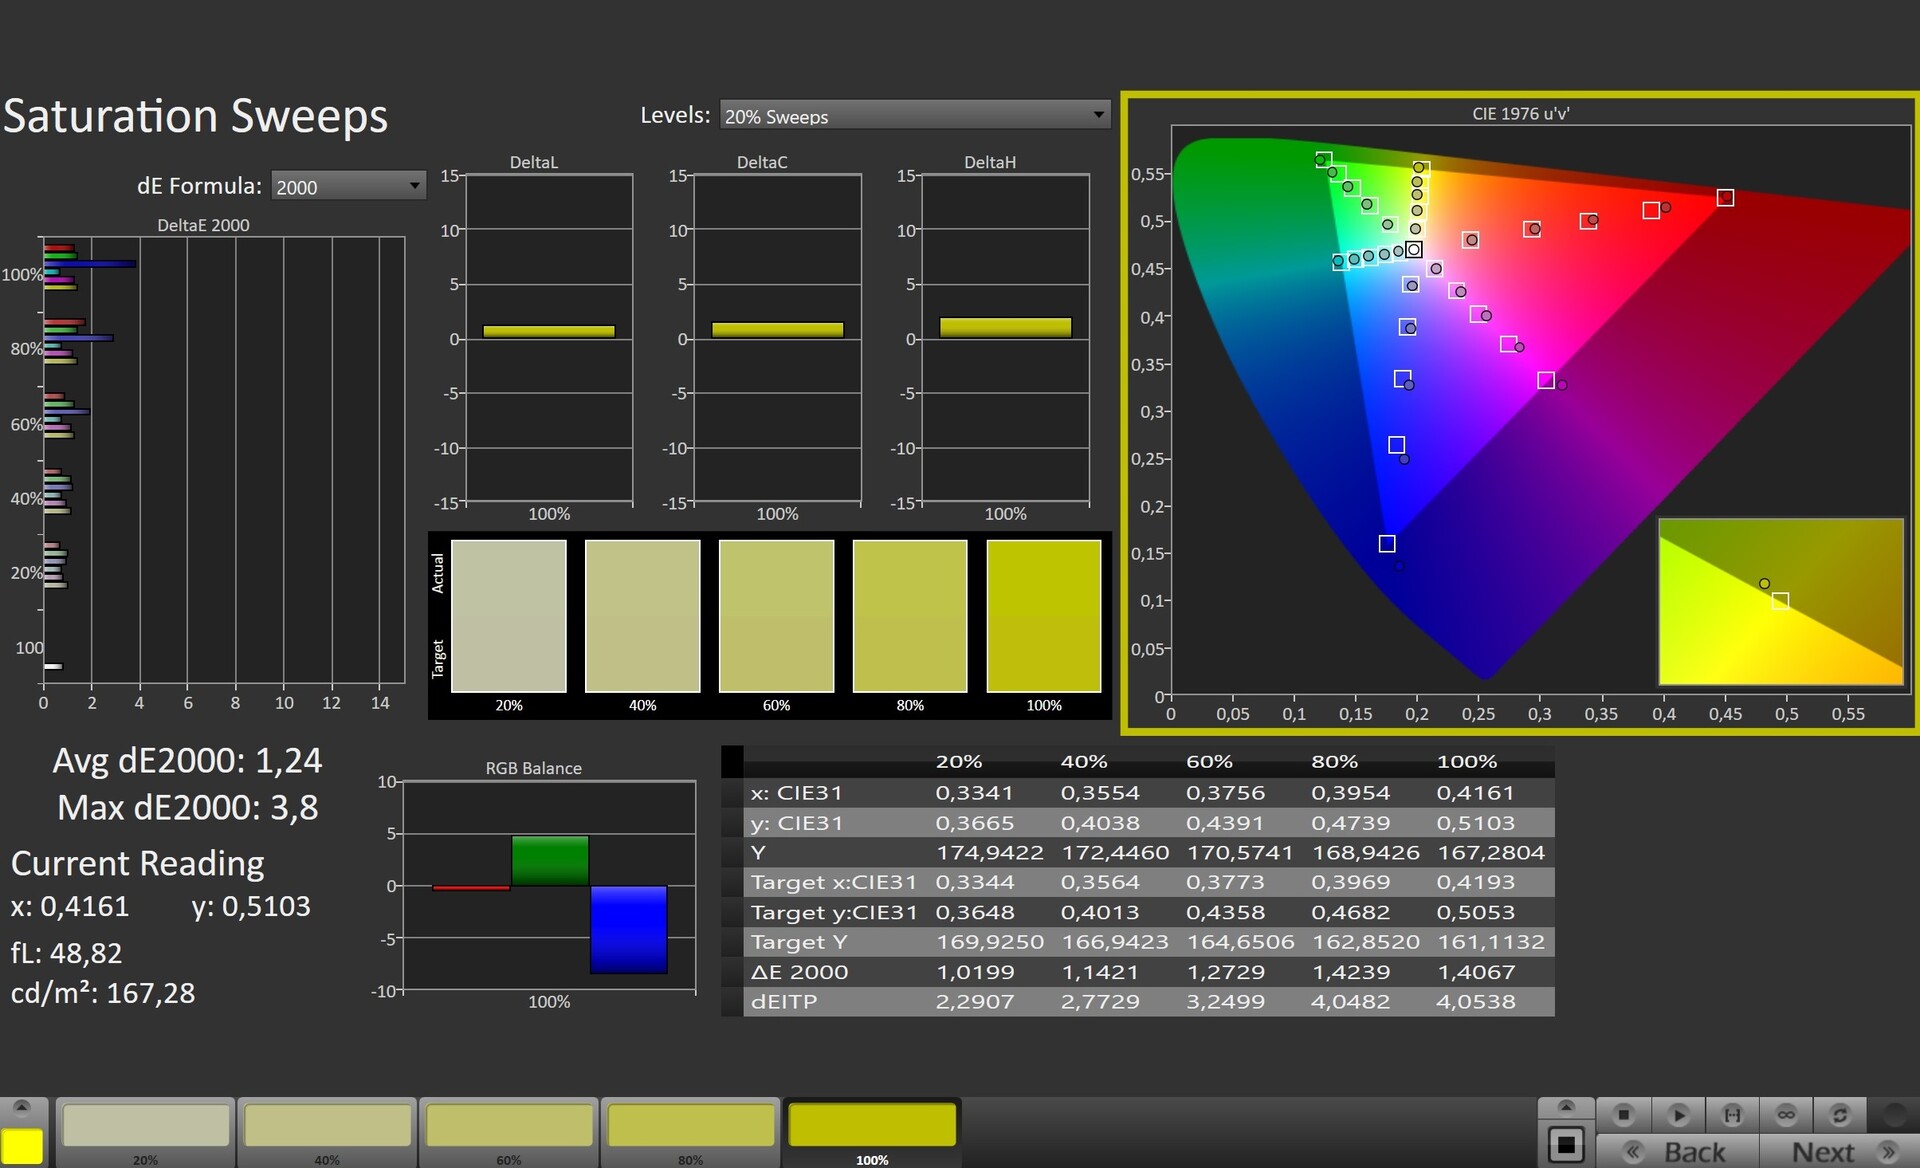
calibrated: 1.22
ΔE Greyscale Calman: 5 | ∀{0.09-98 Ø4.97}
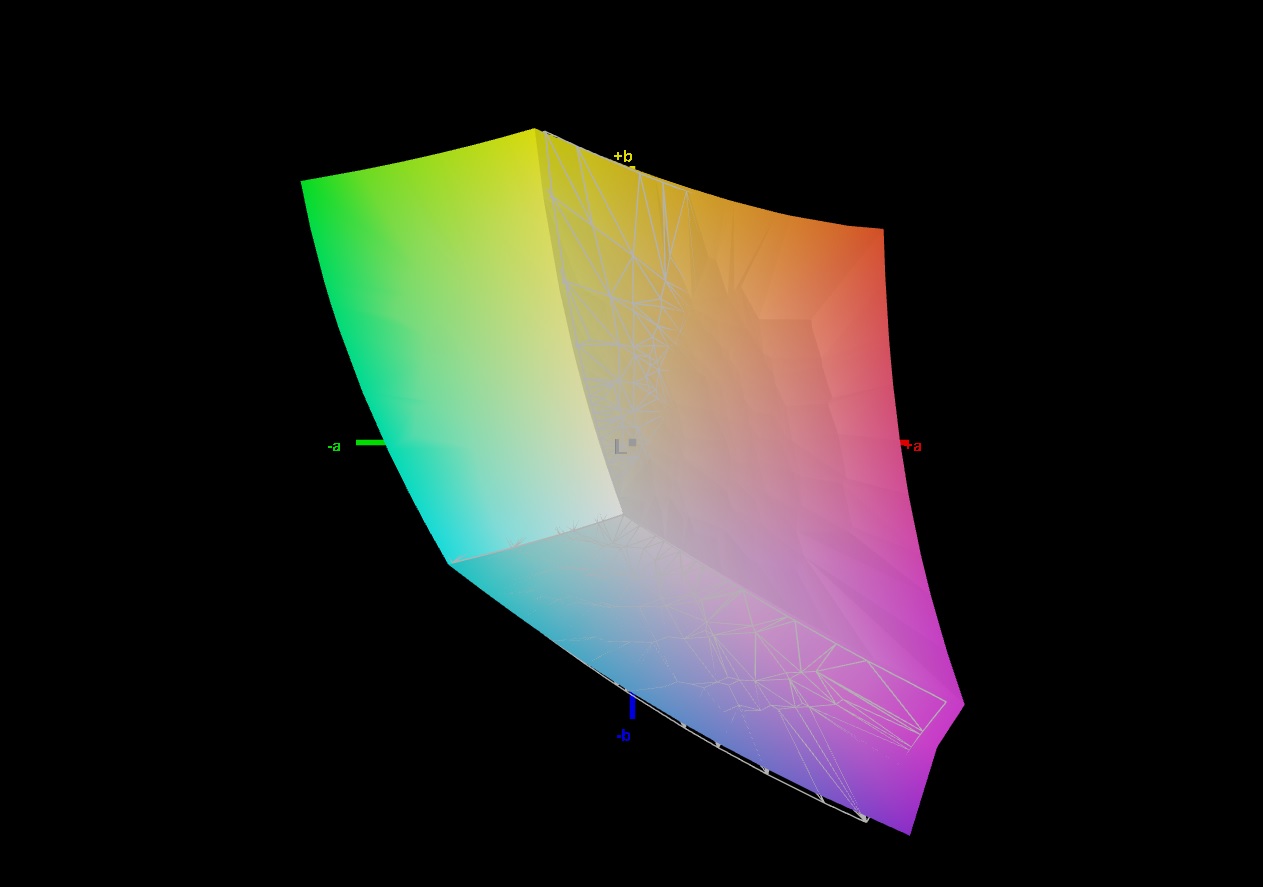
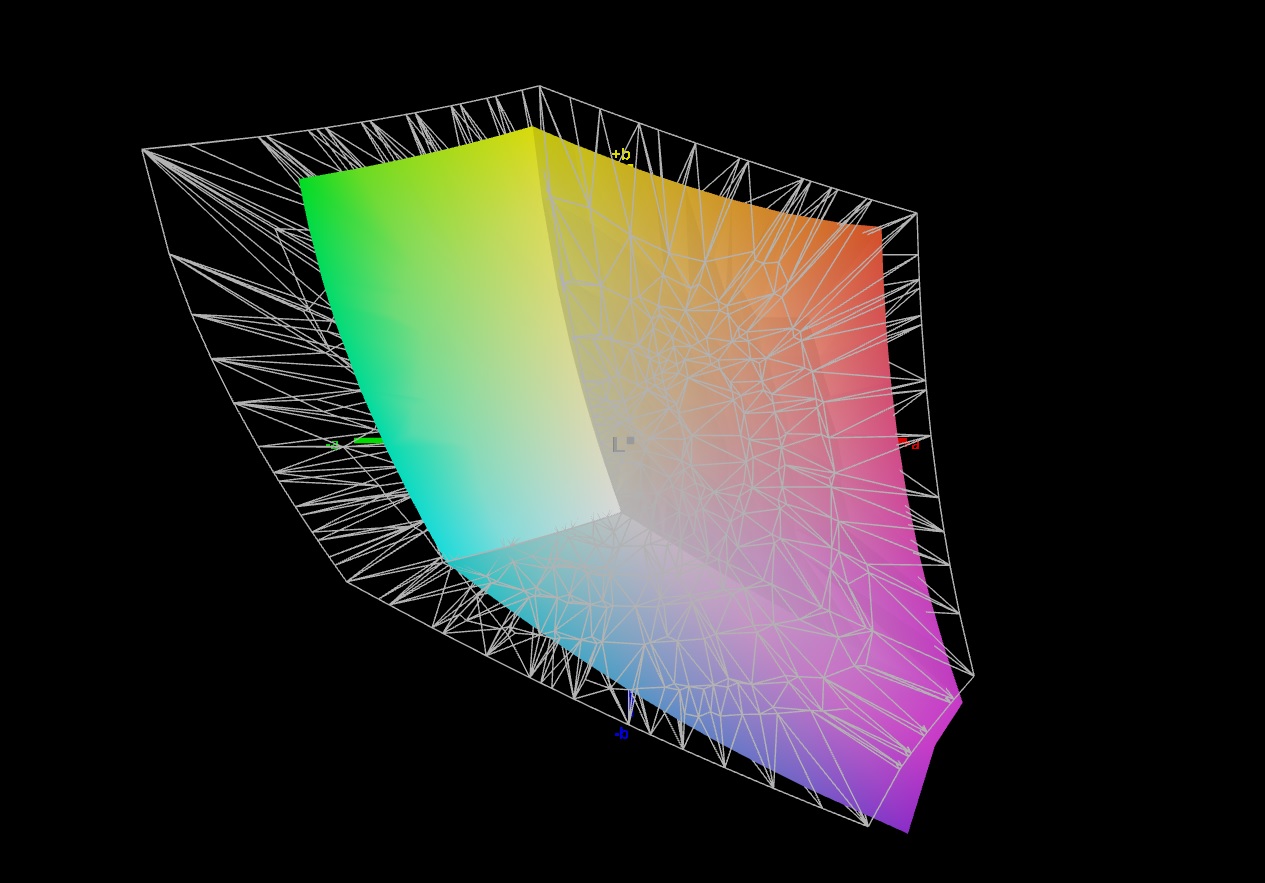
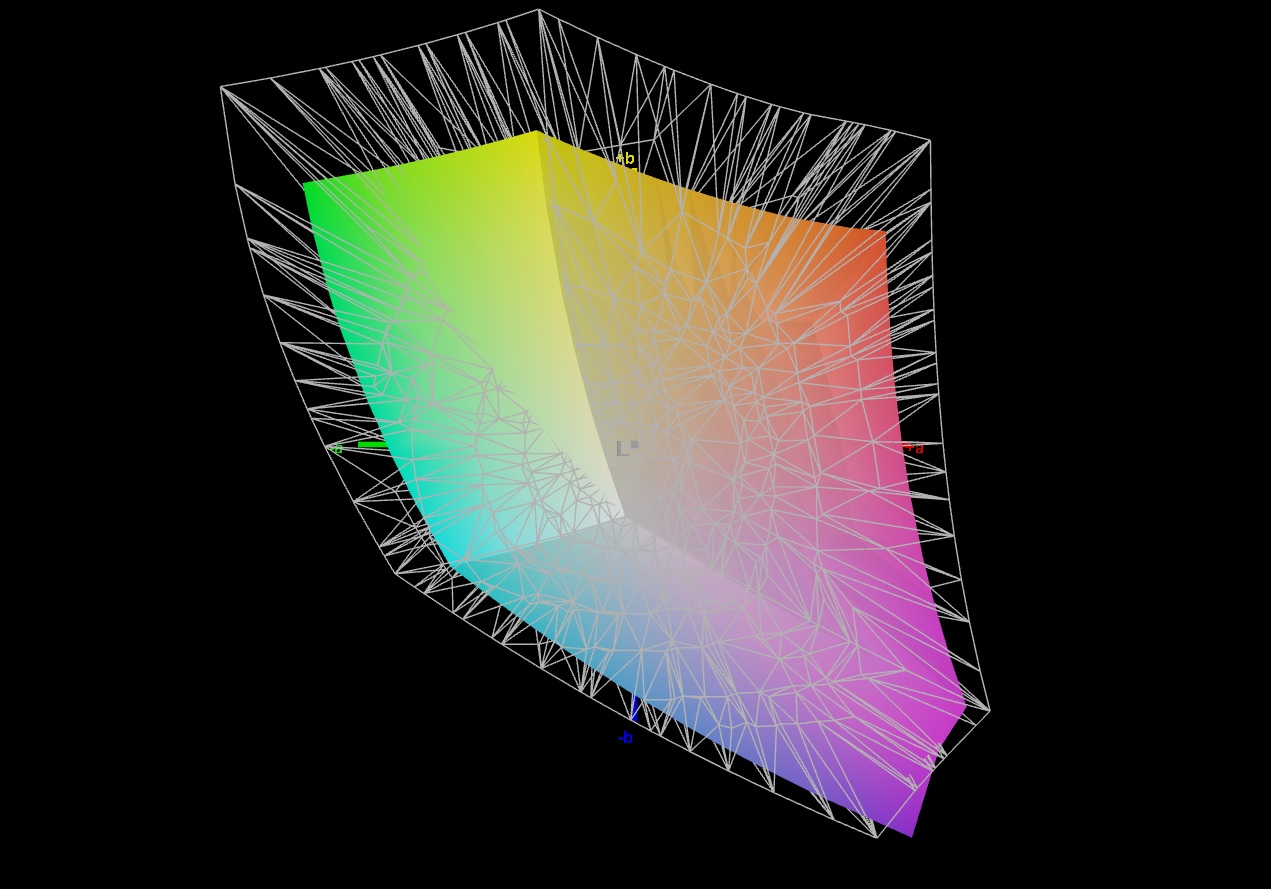
69.9% AdobeRGB 1998 (Argyll 3D)
99.2% sRGB (Argyll 3D)
69.1% Display P3 (Argyll 3D)
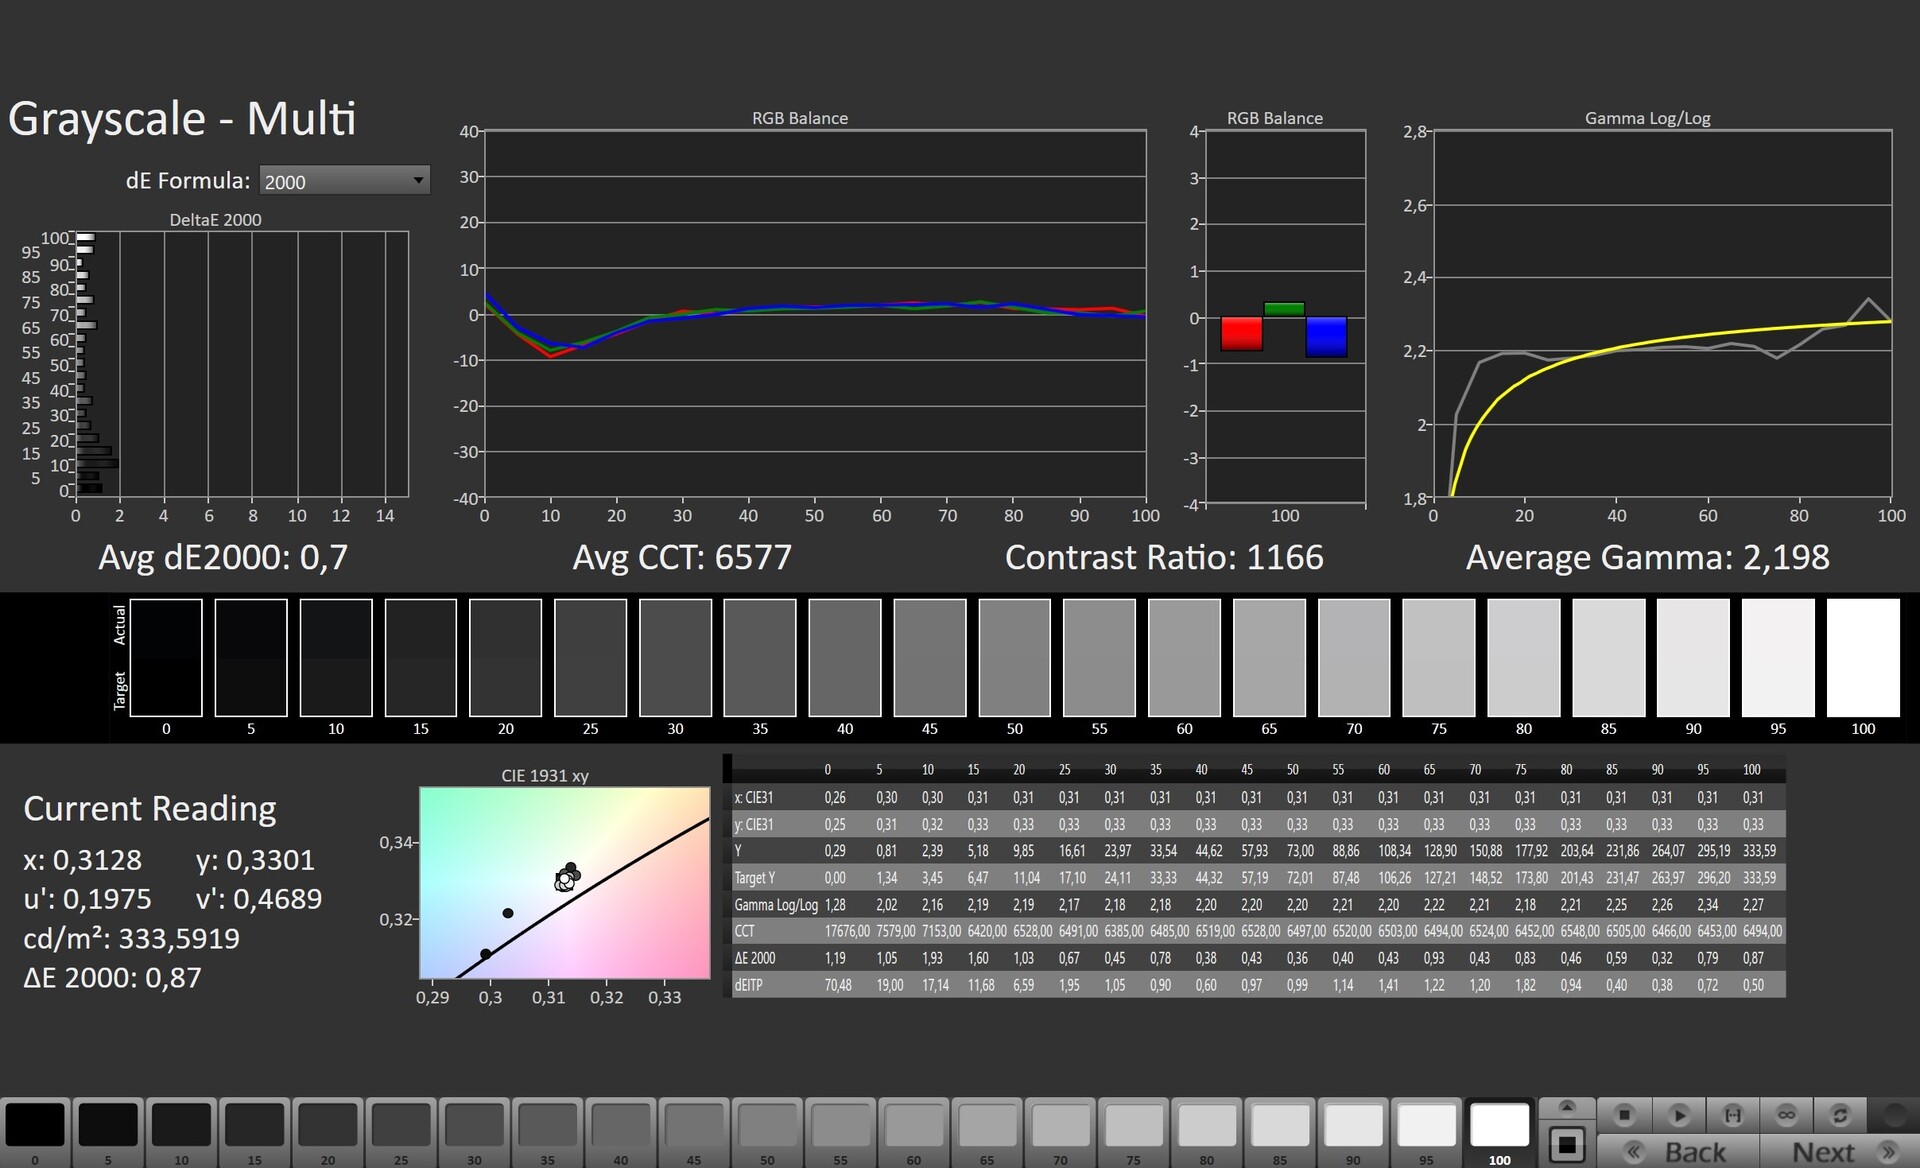
Gamma: 2.162
CCT: 7497 K
| Lenovo IdeaPad Gaming 3 15IAH7 Lenovo LEN156FHD, IPS, 1920x1080, 15.6" | Lenovo IdeaPad Gaming 3 15ARH7 LEN156FHD, IPS, 1920x1080, 15.6" | Dell G15 5515 BOE092A, IPS, 1920x1080, 15.6" | HP Victus 16-e0145ng CMN1609, IPS, 1920x1080, 16.1" | Dell Inspiron 16 Plus 7620 BOE NE16N41, IPS, 3072x1920, 16" | |
|---|---|---|---|---|---|
| Display | -42% | -43% | -39% | 2% | |
| Display P3 Coverage (%) | 69.1 | 39.4 -43% | 39.1 -43% | 41.6 -40% | 70.8 2% |
| sRGB Coverage (%) | 99.2 | 58 -42% | 56.9 -43% | 61.9 -38% | 99.5 0% |
| AdobeRGB 1998 Coverage (%) | 69.9 | 40.7 -42% | 40.4 -42% | 43 -38% | 73.2 5% |
| Response Times | -90% | -97% | -130% | -213% | |
| Response Time Grey 50% / Grey 80% * (ms) | 13 ? | 20.8 ? -60% | 25.2 ? -94% | 29.6 ? -128% | 38 ? -192% |
| Response Time Black / White * (ms) | 8.4 ? | 18.4 ? -119% | 16.8 ? -100% | 19.4 ? -131% | 28 ? -233% |
| PWM Frequency (Hz) | 200 ? | ||||
| Screen | -45% | -64% | -66% | 21% | |
| Brightness middle (cd/m²) | 338 | 287.8 -15% | 278 -18% | 257 -24% | 288.9 -15% |
| Brightness (cd/m²) | 329 | 268 -19% | 262 -20% | 239 -27% | 276 -16% |
| Brightness Distribution (%) | 92 | 86 -7% | 83 -10% | 88 -4% | 92 0% |
| Black Level * (cd/m²) | 0.27 | 0.3 -11% | 0.36 -33% | 0.25 7% | 0.26 4% |
| Contrast (:1) | 1252 | 959 -23% | 772 -38% | 1028 -18% | 1111 -11% |
| Colorchecker dE 2000 * | 2.88 | 6.3 -119% | 5.74 -99% | 6.91 -140% | 1.88 35% |
| Colorchecker dE 2000 max. * | 9.35 | 21.32 -128% | 19.63 -110% | 22.27 -138% | 4.37 53% |
| Colorchecker dE 2000 calibrated * | 1.22 | 2.53 -107% | 4.7 -285% | 3.61 -196% | 0.42 66% |
| Greyscale dE 2000 * | 5 | 4 20% | 3.1 38% | 7.5 -50% | 1.4 72% |
| Gamma | 2.162 102% | 2.21 100% | 2.011 109% | 2.125 104% | 2.3 96% |
| CCT | 7497 87% | 6762 96% | 6207 105% | 6025 108% | 6634 98% |
| Totalt genomsnitt (program/inställningar) | -59% /
-51% | -68% /
-64% | -78% /
-69% | -63% /
-16% |
* ... mindre är bättre
Små färgrymder och låg ljusstyrka är vanligt förekommande i 1 000 euro-segmentet. Men så är inte fallet med IdeaPad Gaming 15 15IAH7: Omkring 100 % sRGB-täckning och en genomsnittlig ljusstyrka på 329 cd/m² gör rättvisa åt den bärbara datorns pris.
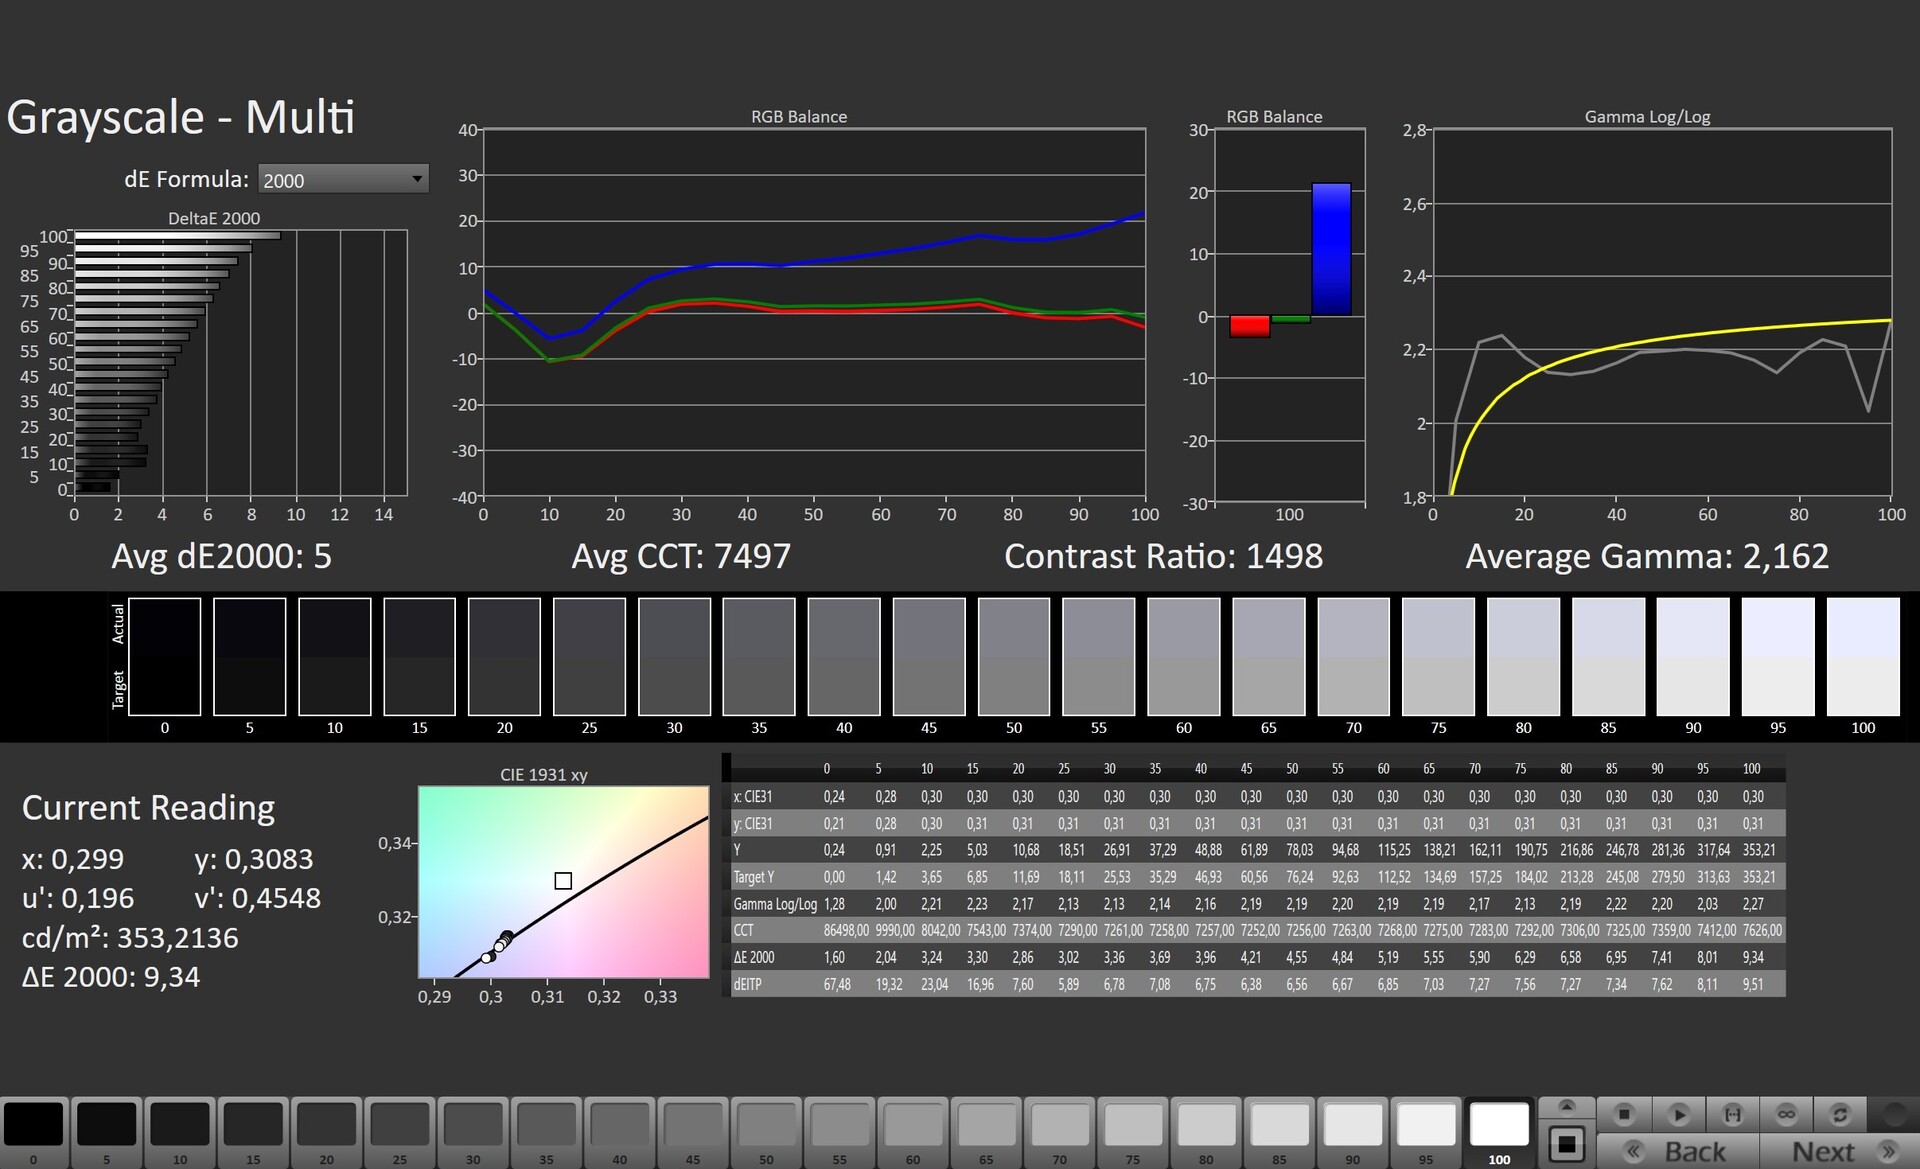
Den 15-tums bärbara datorn gör också en bra figur i de övriga disciplinerna. En svarstid på 8-13 ms är definitivt ett bra värde. Detsamma gäller även kontrasten på 1252:1, som också ligger över genomsnittet.
Det enda du kan klaga på är färgprecisionen. Vid leverans har 165-Hz-panelen en tydlig blå nyans. Detta kan dock korrigeras med en kalibrering (vår ICC-fil är länkad för gratis nedladdning ovan till höger, bredvid diagrammet för fördelning av ljusstyrka). Vår testenhet uppvisar ingen skärmblödning eller PWM-flimmer.
Visa svarstider
| ↔ Svarstid svart till vitt | ||
|---|---|---|
| 8.4 ms ... stiga ↗ och falla ↘ kombinerat | ↗ 4.2 ms stiga | 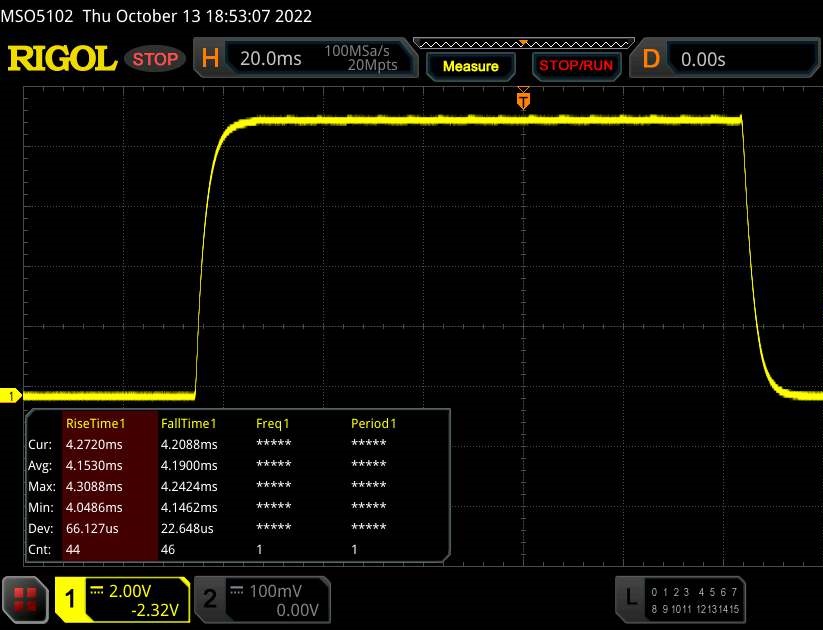 |
| ↘ 4.2 ms hösten | ||
| Skärmen visar snabba svarsfrekvenser i våra tester och bör passa för spel. I jämförelse sträcker sig alla testade enheter från 0.1 (minst) till 240 (maximalt) ms. » 24 % av alla enheter är bättre. Det betyder att den uppmätta svarstiden är bättre än genomsnittet av alla testade enheter (19.9 ms). | ||
| ↔ Svarstid 50 % grått till 80 % grått | ||
| 13 ms ... stiga ↗ och falla ↘ kombinerat | ↗ 6.3 ms stiga | 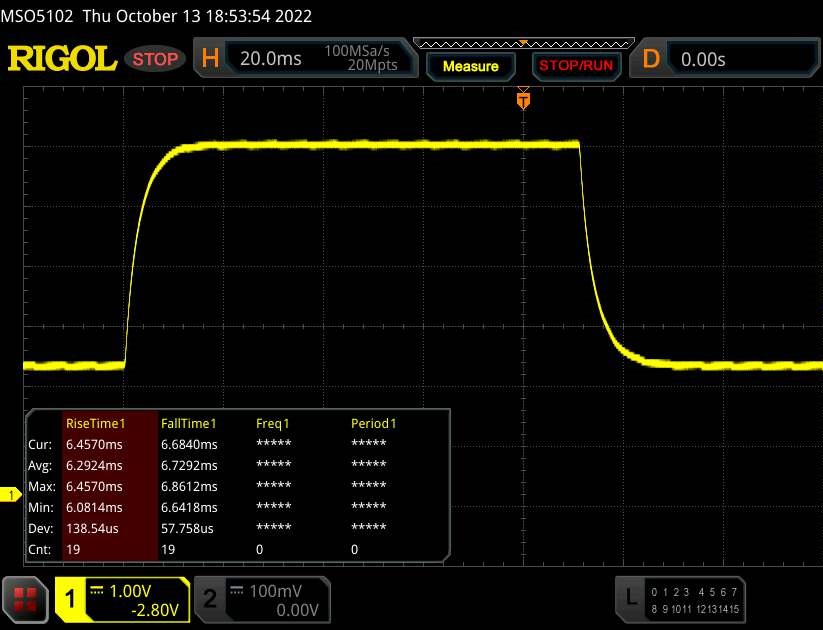 |
| ↘ 6.7 ms hösten | ||
| Skärmen visar bra svarsfrekvens i våra tester, men kan vara för långsam för konkurrenskraftiga spelare. I jämförelse sträcker sig alla testade enheter från 0.165 (minst) till 636 (maximalt) ms. » 26 % av alla enheter är bättre. Det betyder att den uppmätta svarstiden är bättre än genomsnittet av alla testade enheter (31.1 ms). | ||
Skärmflimmer / PWM (Puls-Width Modulation)
| Skärmflimmer / PWM upptäcktes inte |  | ||
Som jämförelse: 52 % av alla testade enheter använder inte PWM för att dämpa skärmen. Om PWM upptäcktes mättes ett medelvärde av 7784 (minst: 5 - maximum: 343500) Hz. | |||
Prestanda
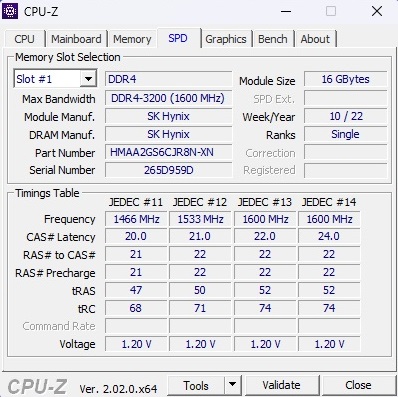
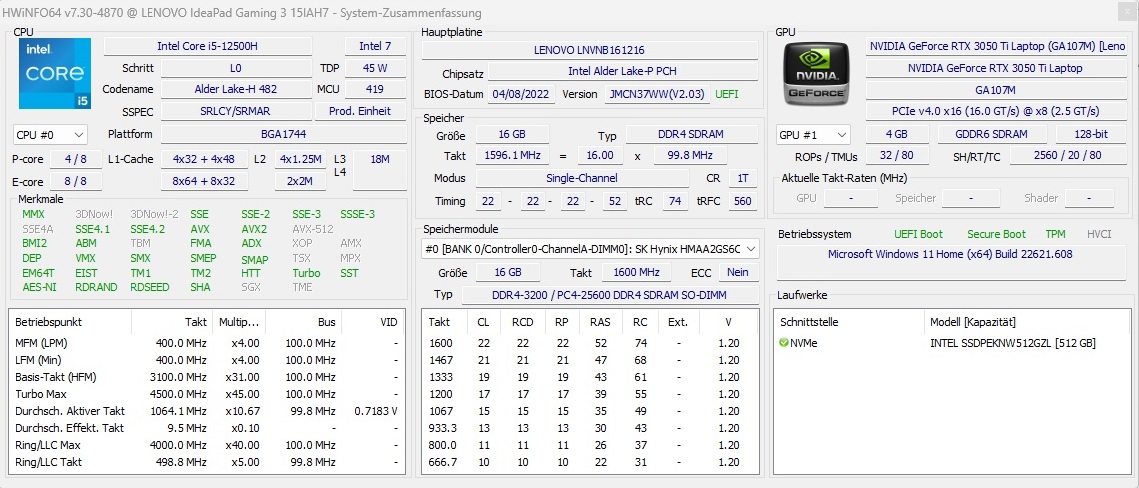
IdeaPad Gaming 3 15IAH7 har en prestanda som placerar den i mellanklassen. Processorn med gott om kärnor och 16 GB arbetsminne bör erbjuda tillräckliga reserver för kommande år, även om Lenovo av prestandaskäl borde ha använt dubbelkanals RAM-minne i stället för en enda RAM-modul. Även om den inbyggda M.2-SSD:n endast kommer i 2242-formatet erbjuder höljet fortfarande utrymme för en klassisk 2280-SSD. Grafikkortet lämnar blandade intryck. Å ena sidan erbjuder RTX 3050 Ti ett solitt pris-prestandaförhållande, men å andra sidan är 4 GB VRAM inte särskilt framtidssäkert.
Testvillkor
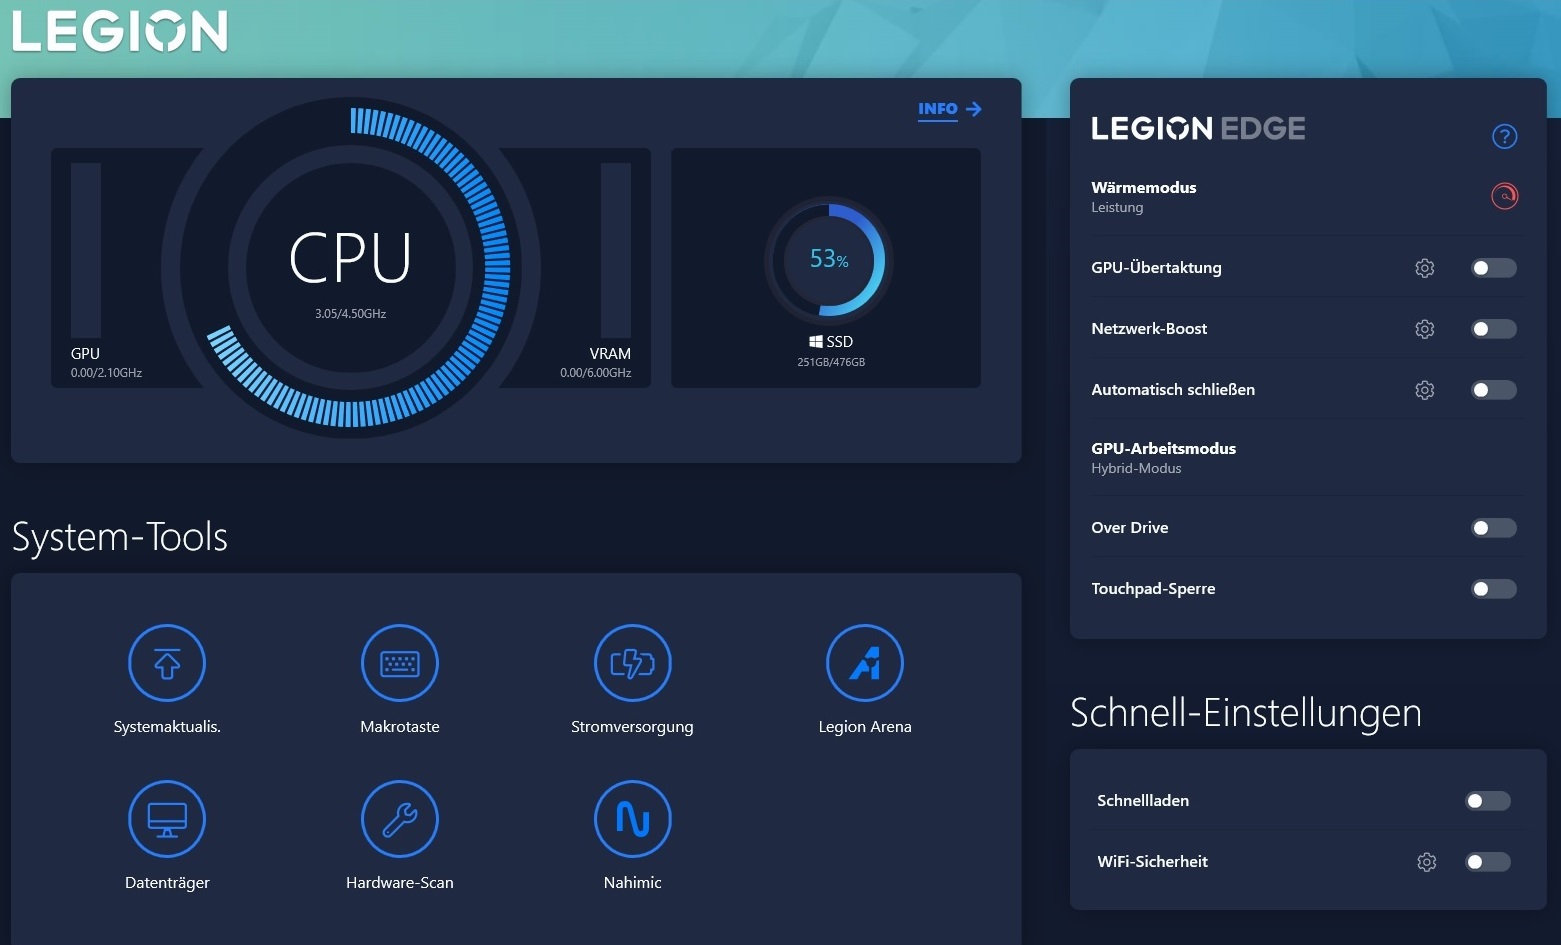
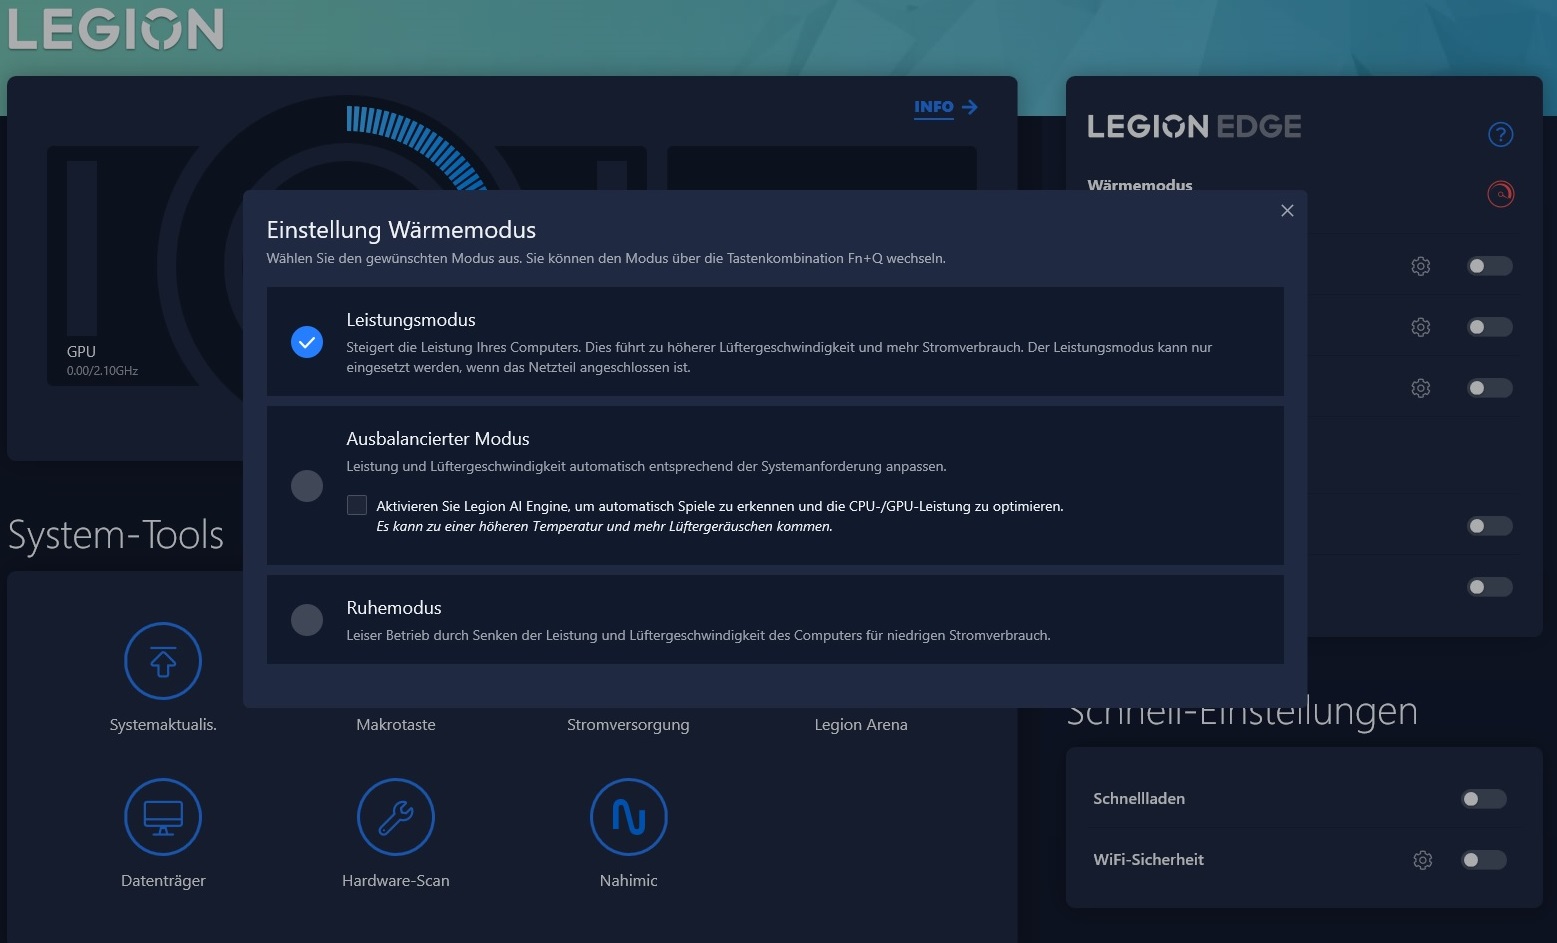
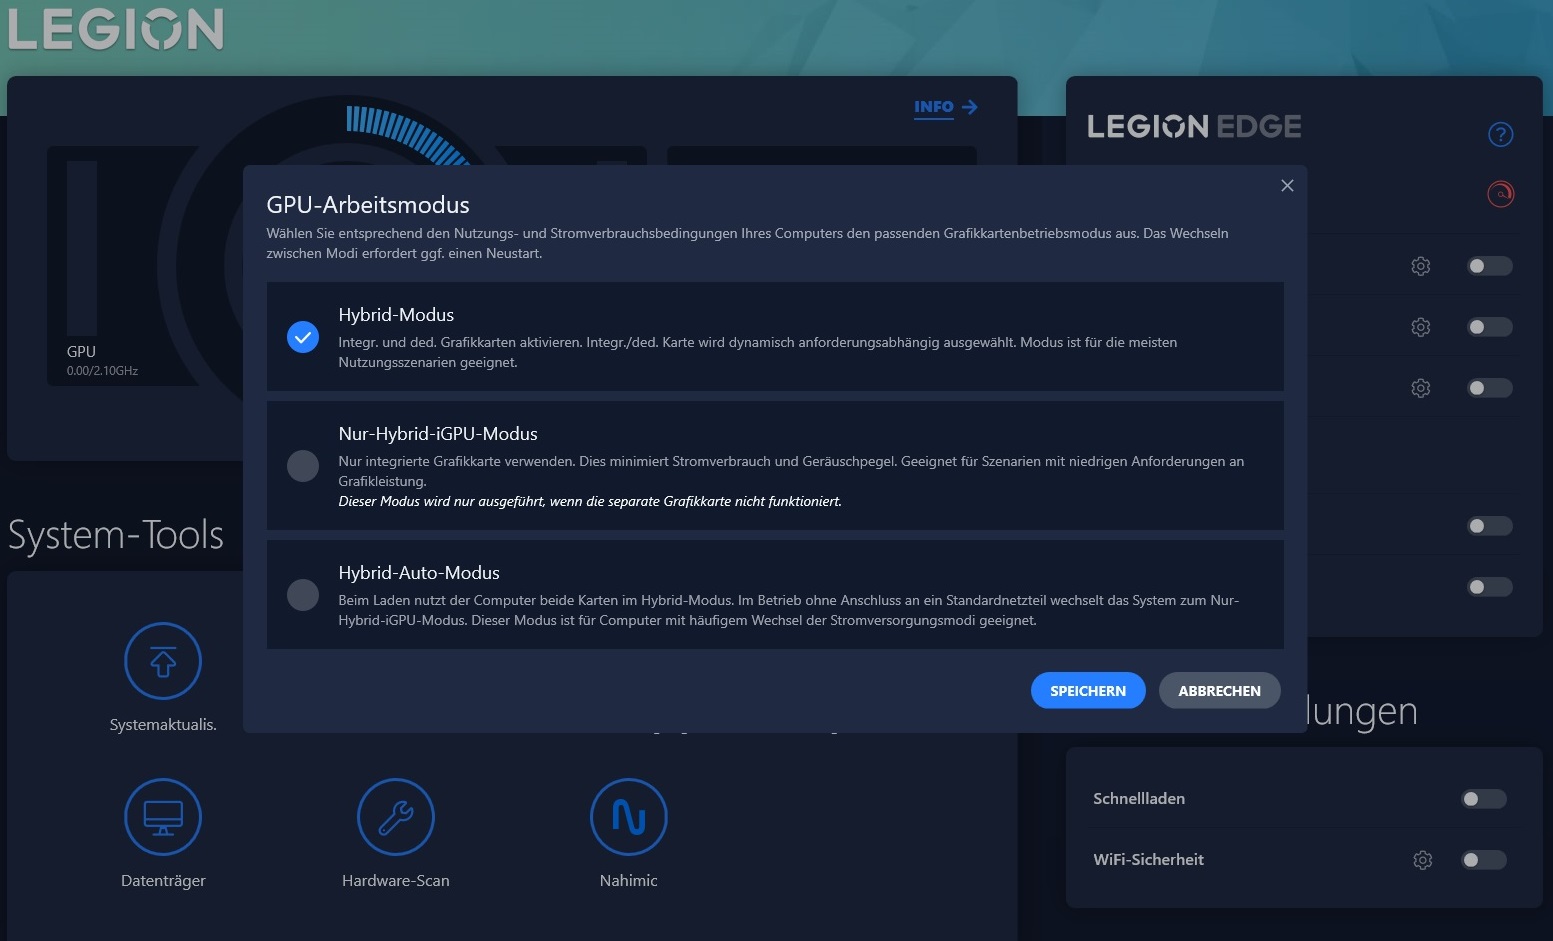
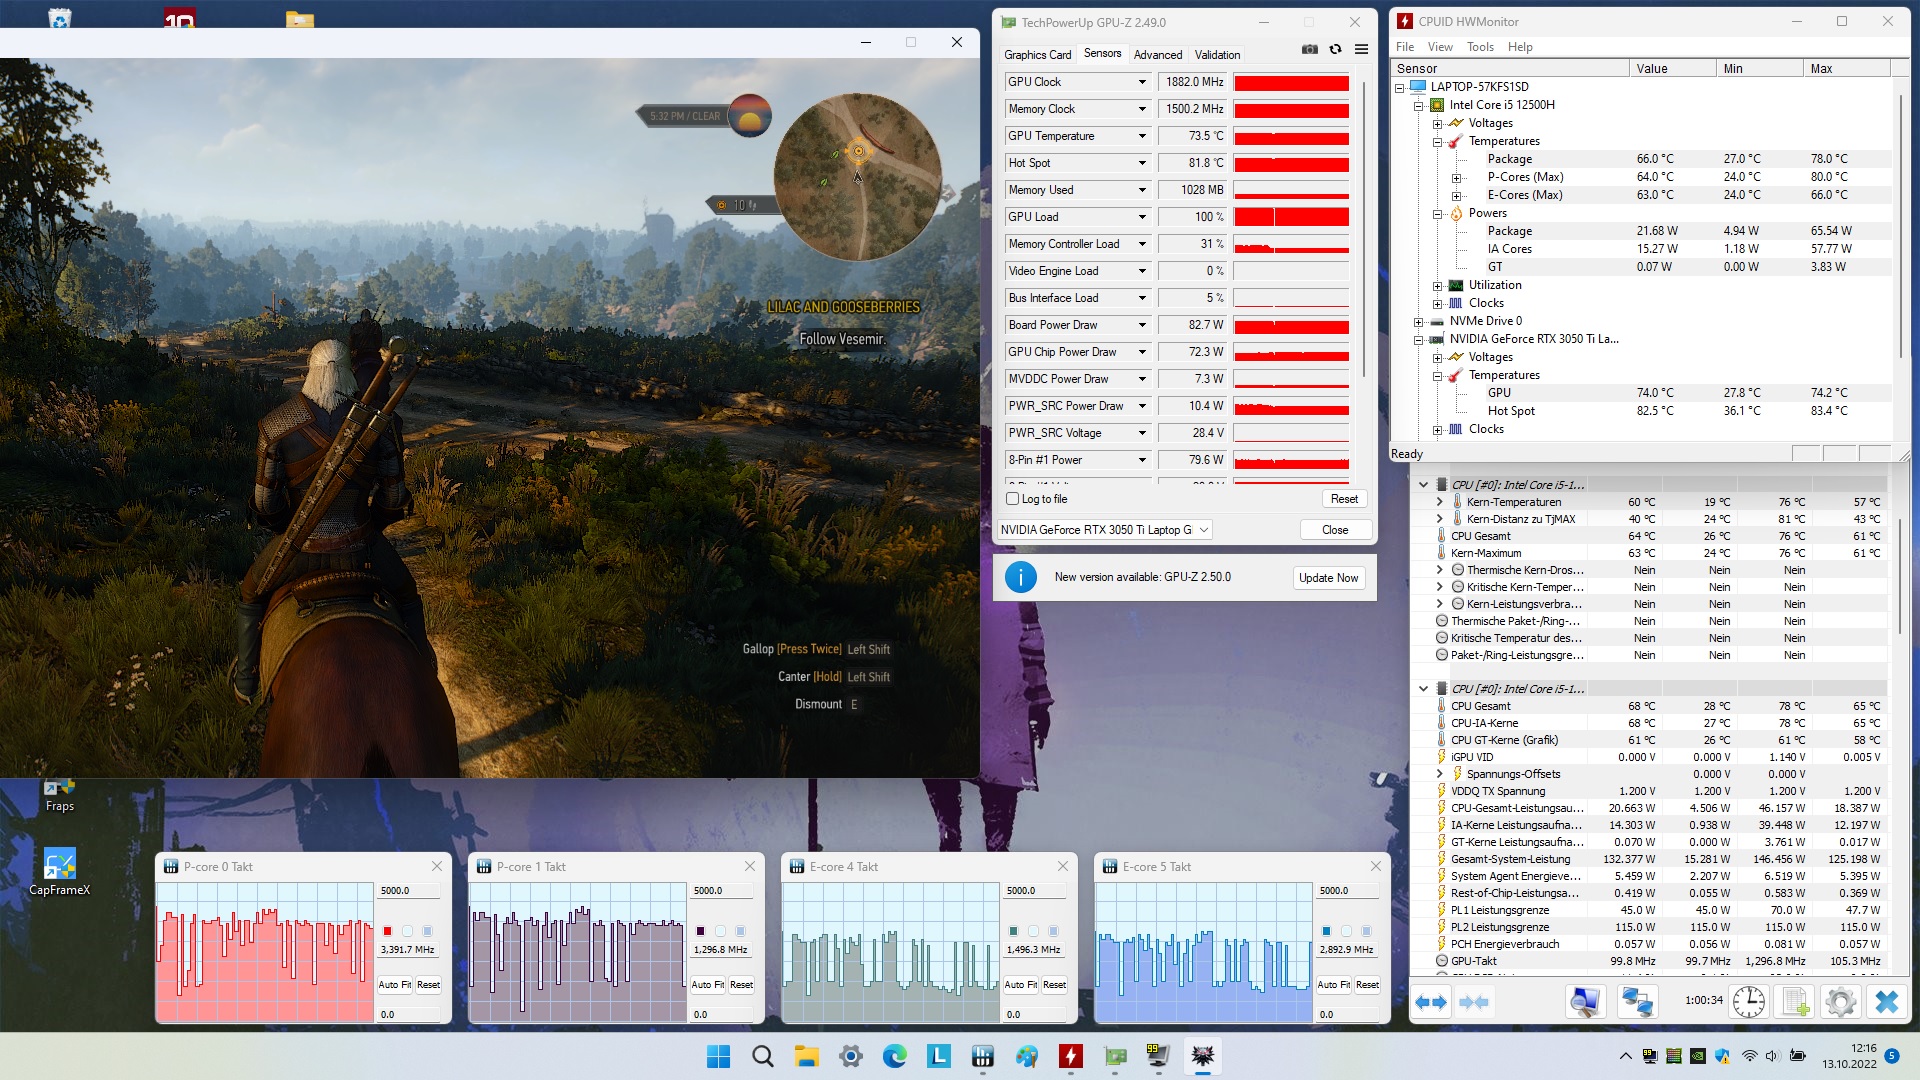
Den förinstallerade Lenovo Vantage-programvaran erbjuder dussintals inställningsalternativ, varav strömläge och GPU-läge är särskilt relevanta. Om vi inte listar något annat, utförs alla våra mätningar med prestandaläget och den vanliga hybridgrafikomkopplingen aktiverad. Med tanke på den låga prestandaförminskningen (se diagram) rekommenderar vi dock snarare att du använder det balanserade läget (Adjusted profile) i praktiken. I läget Silent är enhetens drift återigen betydligt tystare. Trots en minskning av bildfrekvensen med cirka 30 % är många spel fortfarande spelbara.
| Witcher 3 (FHD/Ultra) | Ljudnivå | Prestanda |
| Prestandaläge | 46 dB(A) | basis (~60 FPS) |
| Justerat läge | 43 dB(A) | -7% (~56 FPS) |
| Tyst läge | 34 dB(A) | -30 % (~42 FPS) |
Processor
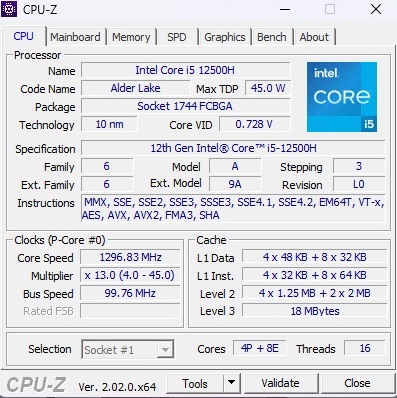
Core i5-12500H är en 12-kärnig modell från Intels Alder Lake-generation med 4 prestandakärnor (inkl. hyperthreading) och 8 effektivitetskärnor (utan hyperthreading) och har en TDP på 45 watt. I CPU-testerna levererar 10-nm-chipet en mycket bra prestanda. Eftersom prestandan också förblir stabil konstant placerar sig IdeaPad Gaming 3 15IAH7 till och med före Core i7-12700Hi Dell Inspiron 16 Plus efter ett tag i Cinebench-slingan och uppnår förstaplatsen. Ryzen-CPU:erna hos de andra konkurrenterna (R5 5600H, R5 6600H & R7 5800H) hamnar något på efterkälken.
Cinebench R15 Multi Constant Load Test
* ... mindre är bättre
AIDA64: FP32 Ray-Trace | FPU Julia | CPU SHA3 | CPU Queen | FPU SinJulia | FPU Mandel | CPU AES | CPU ZLib | FP64 Ray-Trace | CPU PhotoWorxx
| Performance rating | |
| Genomsnitt av klass Gaming | |
| Dell G15 5515 | |
| Dell Inspiron 16 Plus 7620 | |
| Lenovo IdeaPad Gaming 3 15IAH7 | |
| Lenovo IdeaPad Gaming 3 15ARH7 | |
| Genomsnitt Intel Core i5-12500H | |
| HP Victus 16-e0145ng | |
| AIDA64 / FP32 Ray-Trace | |
| Genomsnitt av klass Gaming (10227 - 85542, n=107, senaste 2 åren) | |
| Dell G15 5515 | |
| Lenovo IdeaPad Gaming 3 15IAH7 | |
| Dell Inspiron 16 Plus 7620 | |
| Lenovo IdeaPad Gaming 3 15ARH7 | |
| Genomsnitt Intel Core i5-12500H (6851 - 13947, n=9) | |
| HP Victus 16-e0145ng | |
| AIDA64 / FPU Julia | |
| Genomsnitt av klass Gaming (51376 - 238426, n=107, senaste 2 åren) | |
| Dell G15 5515 | |
| Lenovo IdeaPad Gaming 3 15ARH7 | |
| HP Victus 16-e0145ng | |
| Lenovo IdeaPad Gaming 3 15IAH7 | |
| Dell Inspiron 16 Plus 7620 | |
| Genomsnitt Intel Core i5-12500H (29874 - 68178, n=9) | |
| AIDA64 / CPU SHA3 | |
| Genomsnitt av klass Gaming (2180 - 9817, n=107, senaste 2 åren) | |
| Lenovo IdeaPad Gaming 3 15IAH7 | |
| Dell G15 5515 | |
| Genomsnitt Intel Core i5-12500H (2287 - 3337, n=9) | |
| Dell Inspiron 16 Plus 7620 | |
| Lenovo IdeaPad Gaming 3 15ARH7 | |
| HP Victus 16-e0145ng | |
| AIDA64 / CPU Queen | |
| Genomsnitt av klass Gaming (49785 - 173351, n=98, senaste 2 åren) | |
| Dell G15 5515 | |
| Dell Inspiron 16 Plus 7620 | |
| Lenovo IdeaPad Gaming 3 15IAH7 | |
| Genomsnitt Intel Core i5-12500H (77935 - 80703, n=9) | |
| Lenovo IdeaPad Gaming 3 15ARH7 | |
| HP Victus 16-e0145ng | |
| AIDA64 / FPU SinJulia | |
| Genomsnitt av klass Gaming (4424 - 33636, n=107, senaste 2 åren) | |
| Dell G15 5515 | |
| Lenovo IdeaPad Gaming 3 15ARH7 | |
| HP Victus 16-e0145ng | |
| Dell Inspiron 16 Plus 7620 | |
| Lenovo IdeaPad Gaming 3 15IAH7 | |
| Genomsnitt Intel Core i5-12500H (6590 - 7431, n=9) | |
| AIDA64 / FPU Mandel | |
| Genomsnitt av klass Gaming (25115 - 128721, n=107, senaste 2 åren) | |
| Dell G15 5515 | |
| Lenovo IdeaPad Gaming 3 15ARH7 | |
| HP Victus 16-e0145ng | |
| Lenovo IdeaPad Gaming 3 15IAH7 | |
| Dell Inspiron 16 Plus 7620 | |
| Genomsnitt Intel Core i5-12500H (18252 - 34041, n=9) | |
| AIDA64 / CPU AES | |
| Dell G15 5515 | |
| Lenovo IdeaPad Gaming 3 15IAH7 | |
| Genomsnitt av klass Gaming (39258 - 247074, n=107, senaste 2 åren) | |
| Lenovo IdeaPad Gaming 3 15ARH7 | |
| Genomsnitt Intel Core i5-12500H (50298 - 111567, n=9) | |
| Dell Inspiron 16 Plus 7620 | |
| HP Victus 16-e0145ng | |
| AIDA64 / CPU ZLib | |
| Genomsnitt av klass Gaming (574 - 2531, n=107, senaste 2 åren) | |
| Dell Inspiron 16 Plus 7620 | |
| Lenovo IdeaPad Gaming 3 15IAH7 | |
| Genomsnitt Intel Core i5-12500H (746 - 924, n=9) | |
| Dell G15 5515 | |
| Lenovo IdeaPad Gaming 3 15ARH7 | |
| HP Victus 16-e0145ng | |
| AIDA64 / FP64 Ray-Trace | |
| Genomsnitt av klass Gaming (5509 - 45446, n=107, senaste 2 åren) | |
| Dell G15 5515 | |
| Lenovo IdeaPad Gaming 3 15IAH7 | |
| Dell Inspiron 16 Plus 7620 | |
| Lenovo IdeaPad Gaming 3 15ARH7 | |
| Genomsnitt Intel Core i5-12500H (3848 - 7405, n=9) | |
| HP Victus 16-e0145ng | |
| AIDA64 / CPU PhotoWorxx | |
| Genomsnitt av klass Gaming (12271 - 89891, n=107, senaste 2 åren) | |
| Dell Inspiron 16 Plus 7620 | |
| Genomsnitt Intel Core i5-12500H (13686 - 43813, n=9) | |
| HP Victus 16-e0145ng | |
| Lenovo IdeaPad Gaming 3 15ARH7 | |
| Dell G15 5515 | |
| Lenovo IdeaPad Gaming 3 15IAH7 | |
Systemets prestanda
Enligt PCMark 10 är systemprestandan också respektabel. Med 6 755 poäng är det bara Dell Inspiron 16 Plus som slår det. Subjektivt sett reagerar operativsystemet bekvämt snabbt.
CrossMark: Overall | Productivity | Creativity | Responsiveness
| PCMark 10 / Score | |
| Genomsnitt av klass Gaming (5828 - 11574, n=94, senaste 2 åren) | |
| Dell Inspiron 16 Plus 7620 | |
| Lenovo IdeaPad Gaming 3 15IAH7 | |
| Lenovo IdeaPad Gaming 3 15ARH7 | |
| Dell G15 5515 | |
| HP Victus 16-e0145ng | |
| PCMark 10 / Essentials | |
| Genomsnitt av klass Gaming (8810 - 12600, n=98, senaste 2 åren) | |
| Dell Inspiron 16 Plus 7620 | |
| Lenovo IdeaPad Gaming 3 15IAH7 | |
| HP Victus 16-e0145ng | |
| Dell G15 5515 | |
| Lenovo IdeaPad Gaming 3 15ARH7 | |
| PCMark 10 / Productivity | |
| Genomsnitt av klass Gaming (6845 - 18766, n=96, senaste 2 åren) | |
| Lenovo IdeaPad Gaming 3 15IAH7 | |
| Dell Inspiron 16 Plus 7620 | |
| Lenovo IdeaPad Gaming 3 15ARH7 | |
| Dell G15 5515 | |
| HP Victus 16-e0145ng | |
| PCMark 10 / Digital Content Creation | |
| Genomsnitt av klass Gaming (7602 - 19657, n=96, senaste 2 åren) | |
| Dell Inspiron 16 Plus 7620 | |
| Lenovo IdeaPad Gaming 3 15IAH7 | |
| HP Victus 16-e0145ng | |
| Dell G15 5515 | |
| Lenovo IdeaPad Gaming 3 15ARH7 | |
| CrossMark / Overall | |
| Genomsnitt av klass Gaming (1366 - 2409, n=96, senaste 2 åren) | |
| Dell Inspiron 16 Plus 7620 | |
| Lenovo IdeaPad Gaming 3 15ARH7 | |
| CrossMark / Productivity | |
| Genomsnitt av klass Gaming (1386 - 2254, n=96, senaste 2 åren) | |
| Dell Inspiron 16 Plus 7620 | |
| Lenovo IdeaPad Gaming 3 15ARH7 | |
| CrossMark / Creativity | |
| Genomsnitt av klass Gaming (1343 - 2729, n=96, senaste 2 åren) | |
| Dell Inspiron 16 Plus 7620 | |
| Lenovo IdeaPad Gaming 3 15ARH7 | |
| CrossMark / Responsiveness | |
| Genomsnitt av klass Gaming (1226 - 2334, n=96, senaste 2 åren) | |
| Dell Inspiron 16 Plus 7620 | |
| Lenovo IdeaPad Gaming 3 15ARH7 | |
| PCMark 10 Score | 6755 poäng | |
Hjälp | ||
| AIDA64 / Memory Copy | |
| Genomsnitt av klass Gaming (21750 - 129946, n=107, senaste 2 åren) | |
| Dell Inspiron 16 Plus 7620 | |
| Genomsnitt Intel Core i5-12500H (23850 - 66598, n=9) | |
| HP Victus 16-e0145ng | |
| Dell G15 5515 | |
| Lenovo IdeaPad Gaming 3 15ARH7 | |
| Lenovo IdeaPad Gaming 3 15IAH7 | |
| AIDA64 / Memory Read | |
| Genomsnitt av klass Gaming (22956 - 118858, n=107, senaste 2 åren) | |
| Dell Inspiron 16 Plus 7620 | |
| Genomsnitt Intel Core i5-12500H (24879 - 68013, n=9) | |
| HP Victus 16-e0145ng | |
| Dell G15 5515 | |
| Lenovo IdeaPad Gaming 3 15ARH7 | |
| Lenovo IdeaPad Gaming 3 15IAH7 | |
| AIDA64 / Memory Write | |
| Genomsnitt av klass Gaming (22297 - 135096, n=107, senaste 2 åren) | |
| Dell Inspiron 16 Plus 7620 | |
| Genomsnitt Intel Core i5-12500H (23543 - 58797, n=9) | |
| HP Victus 16-e0145ng | |
| Dell G15 5515 | |
| Lenovo IdeaPad Gaming 3 15ARH7 | |
| Lenovo IdeaPad Gaming 3 15IAH7 | |
| AIDA64 / Memory Latency | |
| Genomsnitt av klass Gaming (75.3 - 259, n=107, senaste 2 åren) | |
| Genomsnitt Intel Core i5-12500H (83.8 - 114.7, n=9) | |
| Dell Inspiron 16 Plus 7620 | |
| Lenovo IdeaPad Gaming 3 15IAH7 | |
| Lenovo IdeaPad Gaming 3 15ARH7 | |
| Dell G15 5515 | |
| HP Victus 16-e0145ng | |
* ... mindre är bättre
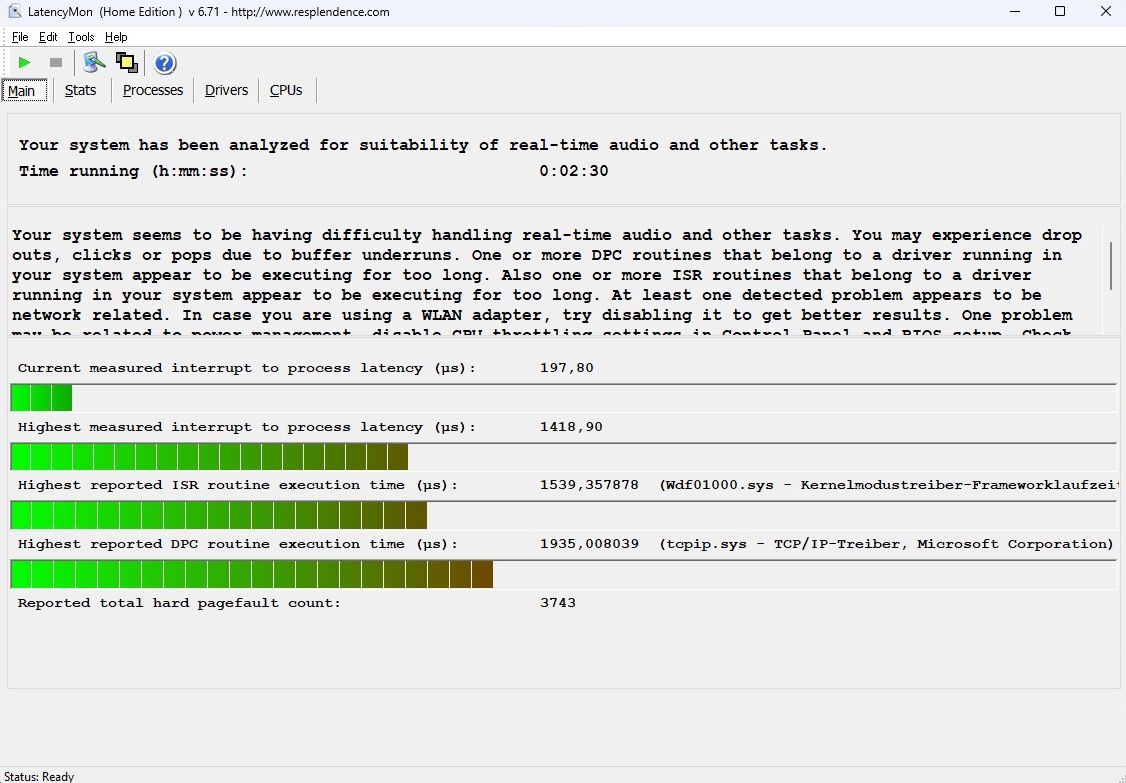
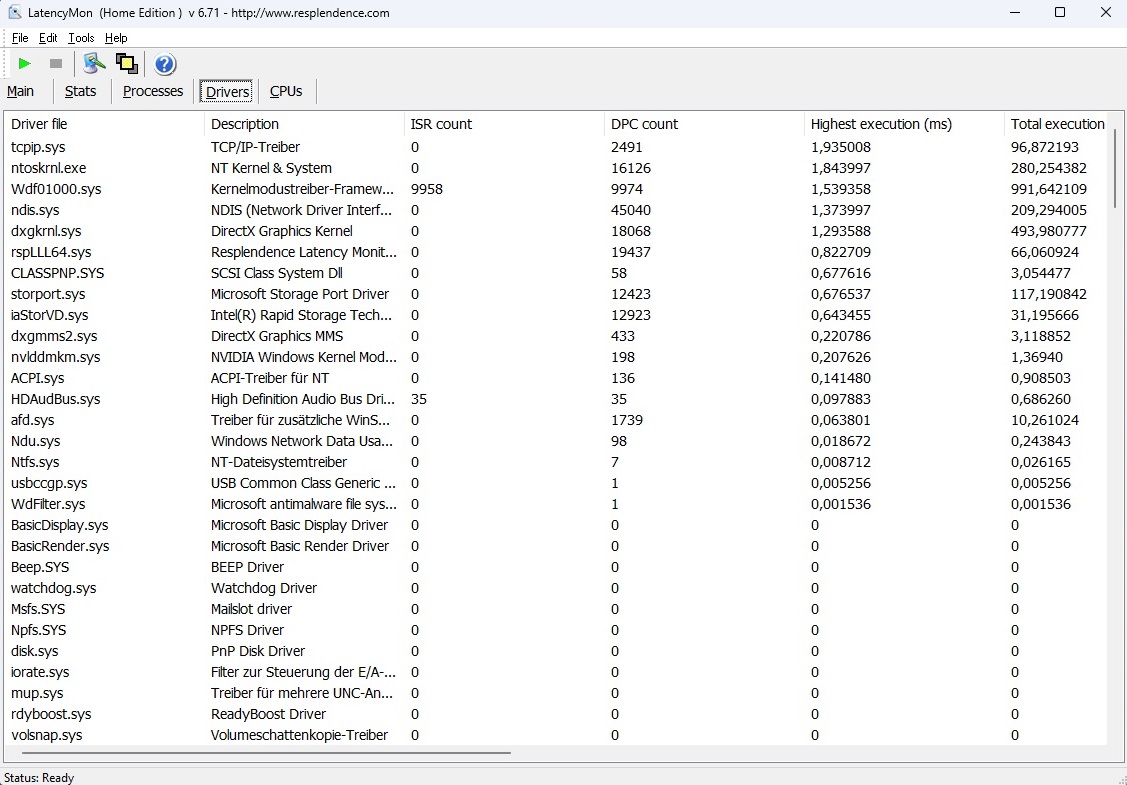
DPC-latenstider
I testet för latenstid klarar sig den bärbara 15-tumsdatorn inte så bra. Verktyget LatencyMon nämner potentiella problem med ljud- och videobearbetning i realtid. Det är dock bara väldigt få användare som bör påverkas av dessa tillämpningsscenarier.
| DPC Latencies / LatencyMon - interrupt to process latency (max), Web, Youtube, Prime95 | |
| Lenovo IdeaPad Gaming 3 15IAH7 | |
| Dell Inspiron 16 Plus 7620 | |
| HP Victus 16-e0145ng | |
| Lenovo IdeaPad Gaming 3 15ARH7 | |
| Dell G15 5515 | |
* ... mindre är bättre
Lösning för lagring
SSD-prestandan hamnar i mitten av vårt jämförelsefält. Modellen med 512 GB från Intel (660p) är varken särskilt snabb eller särskilt långsam för en NVMe-enhet. Det är bra att - liksom CPU-hastigheten - SSD-hastigheten också håller sig relativt konstant.

* ... mindre är bättre
Constant Performance Reading: DiskSpd Read Loop, Queue Depth 8
Grafikkort
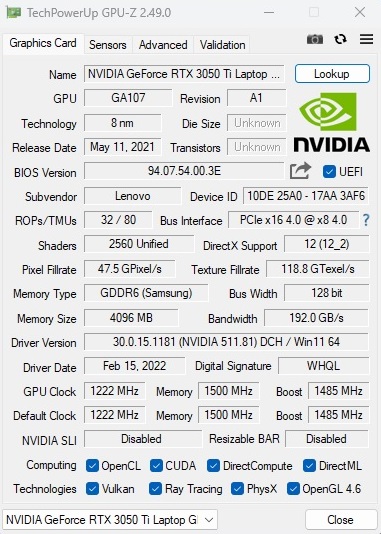
Prestandan hos Nvidias Ampere GPU:er beror till stor del på den justerade TGP. Lenovo beslutade sig för ett relativt högt värde i IdeaPad Gaming 3, vilket gynnar benchmarkresultaten. 85 watt är ganska mycket för en RTX 3050 Ti. Den 15-tums bärbara datorn klarar sig motsvarande bra i 3DMarks benchmarks. Om man lägger ihop alla värden är RTX 3050 Ti nästan 25 % snabbare än det nuvarande genomsnittet för det här grafikkortet. Till viss del kompenserar detta för att man redan nu kan få enheter med RTX 3060, som innehåller 6 i stället för 4 GB VRAM, i 1000 eurosegmentet.
| 3DMark 11 Performance | 19254 poäng | |
| 3DMark Cloud Gate Standard Score | 48874 poäng | |
| 3DMark Fire Strike Score | 14086 poäng | |
| 3DMark Time Spy Score | 6213 poäng | |
Hjälp | ||
* ... mindre är bättre
Spelprestanda
Den positiva trenden från de syntetiska grafiktesterna fortsätter i våra speltester. Även om prestandan i vissa spel kan bli avsevärt lidande av RAM-minnet med en kanal (varför vi rekommenderar att byta till 2x 8 GB), går spel som inte är RAM-tunga också betydligt snabbare än på ett RTX 3050 Ti med lägre TGP.
| The Witcher 3 | |
| 1920x1080 High Graphics & Postprocessing (Nvidia HairWorks Off) | |
| Genomsnitt av klass Gaming (181 - 341, n=3, senaste 2 åren) | |
| Lenovo IdeaPad Gaming 3 15IAH7 | |
| Dell Inspiron 16 Plus 7620 | |
| Lenovo IdeaPad Gaming 3 15ARH7 | |
| HP Victus 16-e0145ng | |
| Dell G15 5515 | |
| Genomsnitt NVIDIA GeForce RTX 3050 Ti Laptop GPU (30 - 110, n=26) | |
| 1920x1080 Ultra Graphics & Postprocessing (HBAO+) | |
| Genomsnitt av klass Gaming (95 - 240, n=8, senaste 2 åren) | |
| Lenovo IdeaPad Gaming 3 15IAH7 | |
| Dell Inspiron 16 Plus 7620 | |
| Dell G15 5515 | |
| Lenovo IdeaPad Gaming 3 15ARH7 | |
| HP Victus 16-e0145ng | |
| Genomsnitt NVIDIA GeForce RTX 3050 Ti Laptop GPU (19 - 58.5, n=29) | |
Vi märker inga anmärkningsvärda beteenden som sticker ut i vårt 60-minuters konstant test med Witcher 3. I grund och botten kan IdeaPad Gaming 3 15IAH7 hantera nästan alla moderna spel med höga till maximala detaljer i den ursprungliga upplösningen på 1920 x 1080 pixlar, så länge du klarar dig utan ray tracing (där RTX 3050 Ti uppvisar betydande svagheter).
The Witcher 3 FPS Chart
| låg | med. | hög | ultra | |
|---|---|---|---|---|
| GTA V (2015) | 160.7 | 130.6 | 73.5 | |
| The Witcher 3 (2015) | 173 | 110 | 58.5 | |
| Dota 2 Reborn (2015) | 145.9 | 127.3 | 113.8 | 107.8 |
| Final Fantasy XV Benchmark (2018) | 81.5 | 58.8 | ||
| X-Plane 11.11 (2018) | 109.9 | 98.1 | 81.1 | |
| Strange Brigade (2018) | 145.5 | 117.3 | 101.3 | |
| Ghostwire Tokyo (2022) | 79.5 | 76.8 | 75.9 | |
| Tiny Tina's Wonderlands (2022) | 92.1 | 67.2 | 51.7 | |
| Vampire Bloodhunt (2022) | 111.8 | 110.9 | 106.1 | |
| F1 22 (2022) | 111 | 92 | 32 | |
| The Quarry (2022) | 69.7 | 58.3 | 45.8 |
Utsläpp
Bullerutsläpp
I prestandaläget är den bärbara 15-tums datorn inte särskilt tyst. Redan vid tomgång kan du höra mycket fläktljud på 29-32 dB(A). Under belastning producerar enheten en massiv ljudvolym på 42 till 54 dB(A), även om andra bärbara datorer för spel, som Victus 16, blir lika högljudda. Tack vare de två andra strömlägena kan enheten dock lätt och snabbt tystas ner.
Ljudnivå
| Låg belastning |
| 29 / 30 / 32 dB(A) |
| Hög belastning |
| 42 / 54 dB(A) |
 | ||
30 dB tyst 40 dB(A) hörbar 50 dB(A) högt ljud |
||
min: | ||
| Lenovo IdeaPad Gaming 3 15IAH7 GeForce RTX 3050 Ti Laptop GPU, i5-12500H | Lenovo IdeaPad Gaming 3 15ARH7 GeForce RTX 3050 4GB Laptop GPU, R5 6600H | Dell G15 5515 GeForce RTX 3050 Ti Laptop GPU, R7 5800H | HP Victus 16-e0145ng GeForce RTX 3050 Ti Laptop GPU, R5 5600H | Dell Inspiron 16 Plus 7620 GeForce RTX 3050 Ti Laptop GPU, i7-12700H | |
|---|---|---|---|---|---|
| Noise | 11% | 7% | 0% | 4% | |
| av / miljö * (dB) | 25 | 23.3 7% | 24 4% | 26 -4% | 23.3 7% |
| Idle Minimum * (dB) | 29 | 23.8 18% | 25 14% | 26 10% | 25.7 11% |
| Idle Average * (dB) | 30 | 23.8 21% | 26 13% | 28 7% | 26.1 13% |
| Idle Maximum * (dB) | 32 | 27.2 15% | 30 6% | 34 -6% | 30.6 4% |
| Load Average * (dB) | 42 | 34.8 17% | 44 -5% | 44 -5% | 46.2 -10% |
| Witcher 3 ultra * (dB) | 46 | 49.3 -7% | 44 4% | 48 -4% | 49.2 -7% |
| Load Maximum * (dB) | 54 | 49.4 9% | 48 11% | 53 2% | 49.4 9% |
* ... mindre är bättre
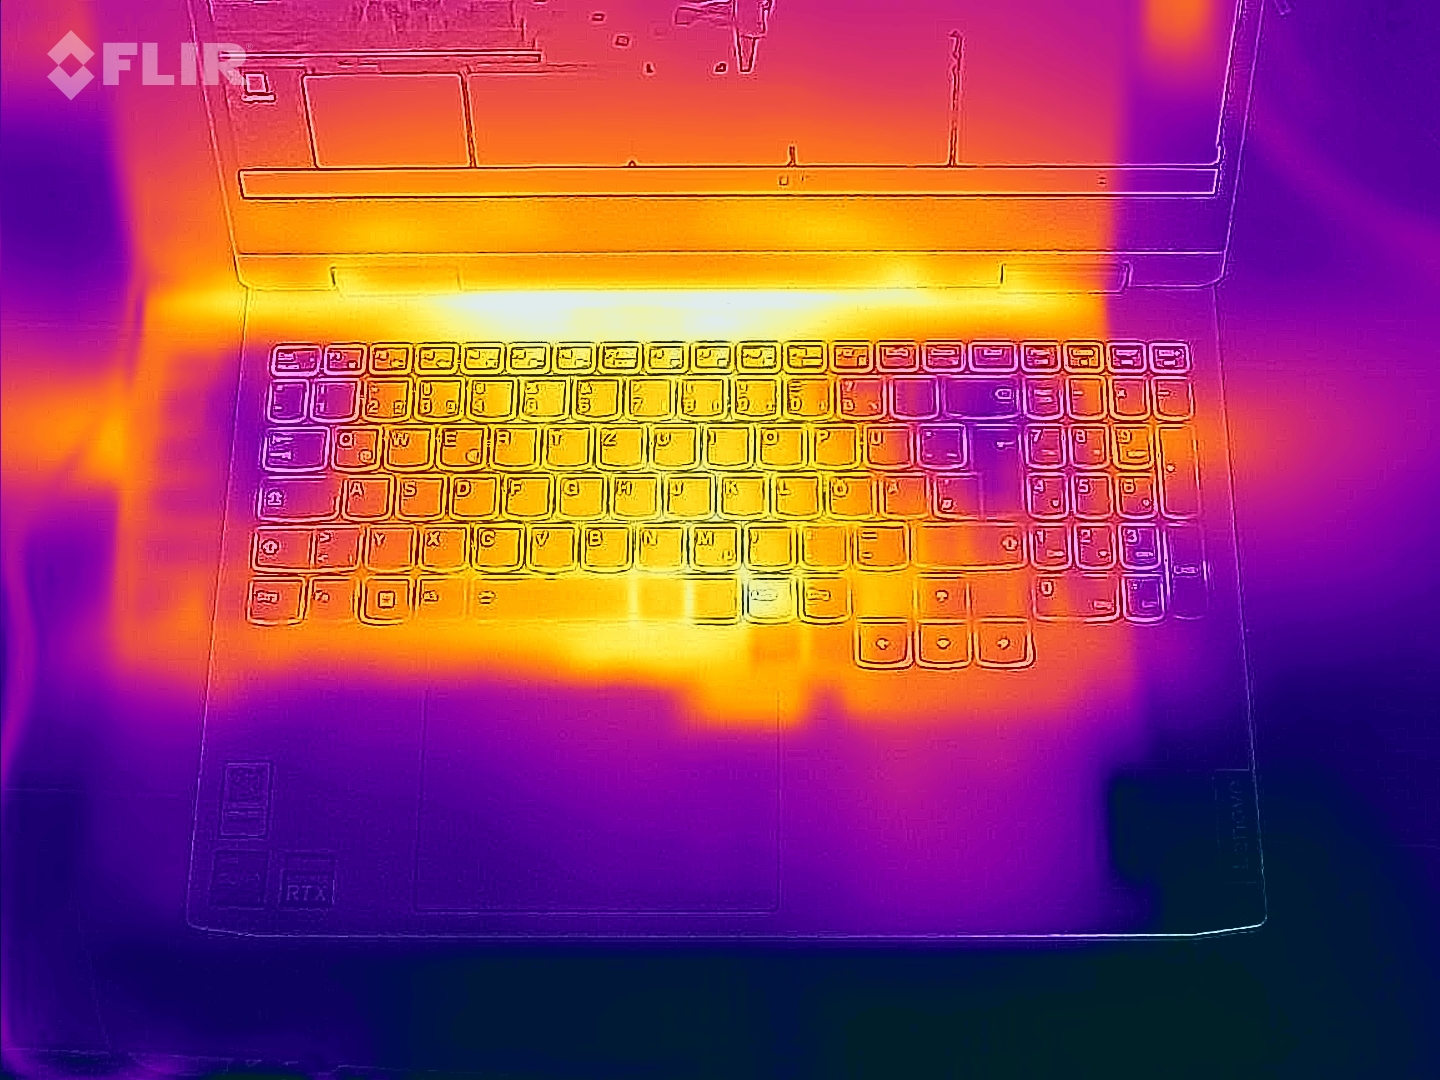
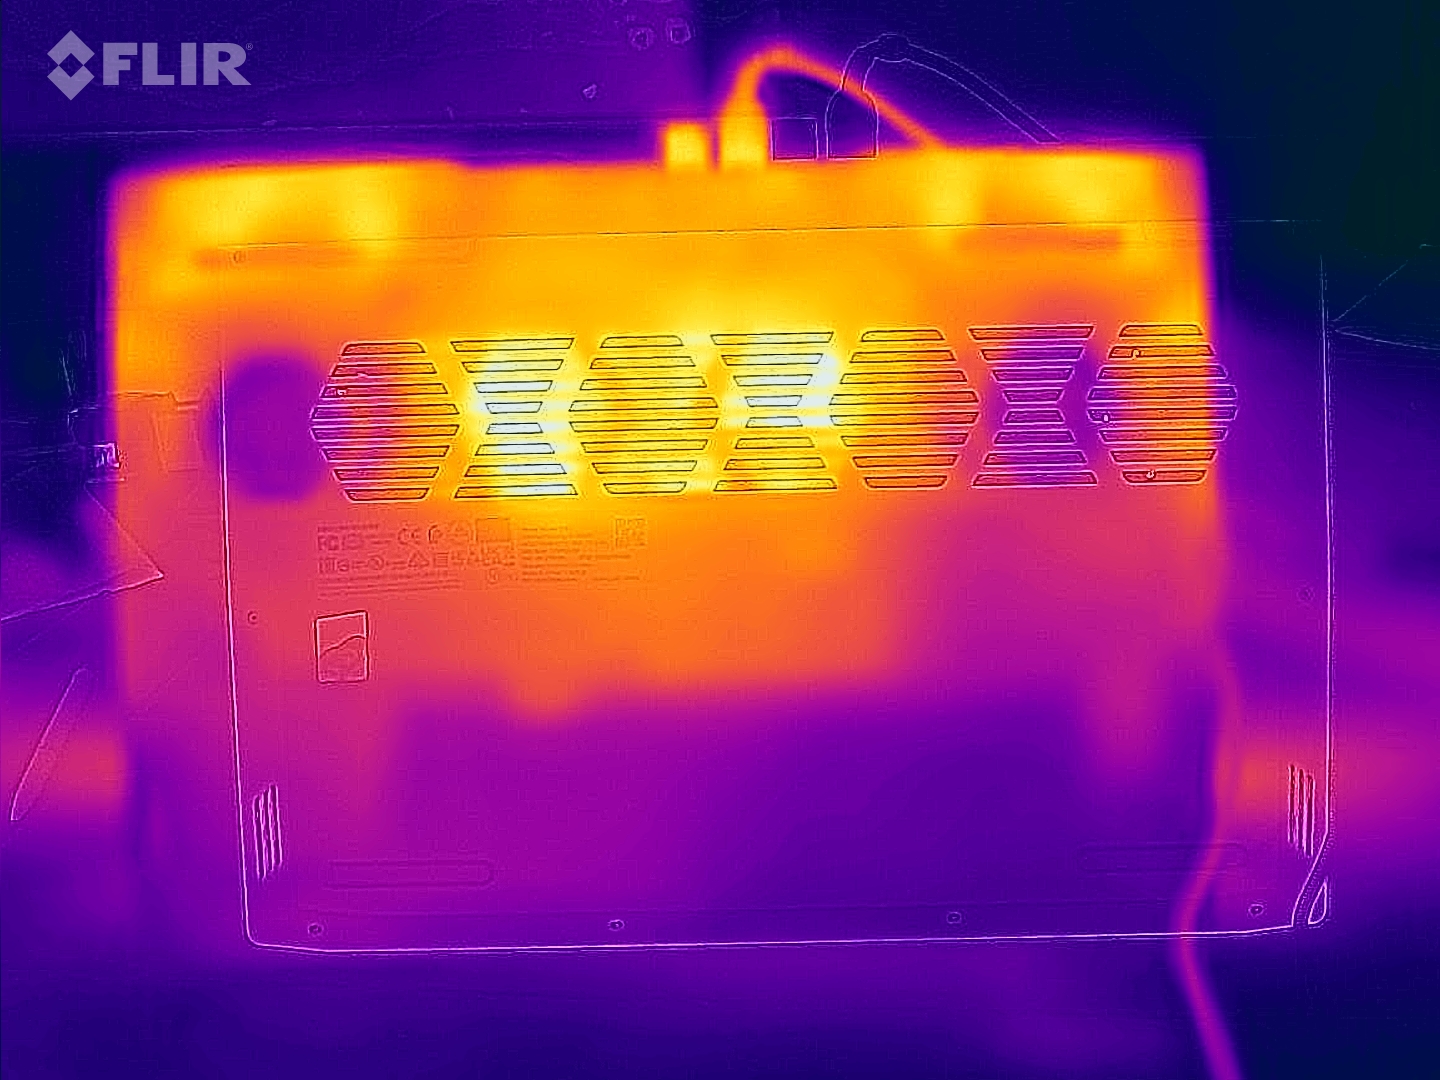
Temperaturer
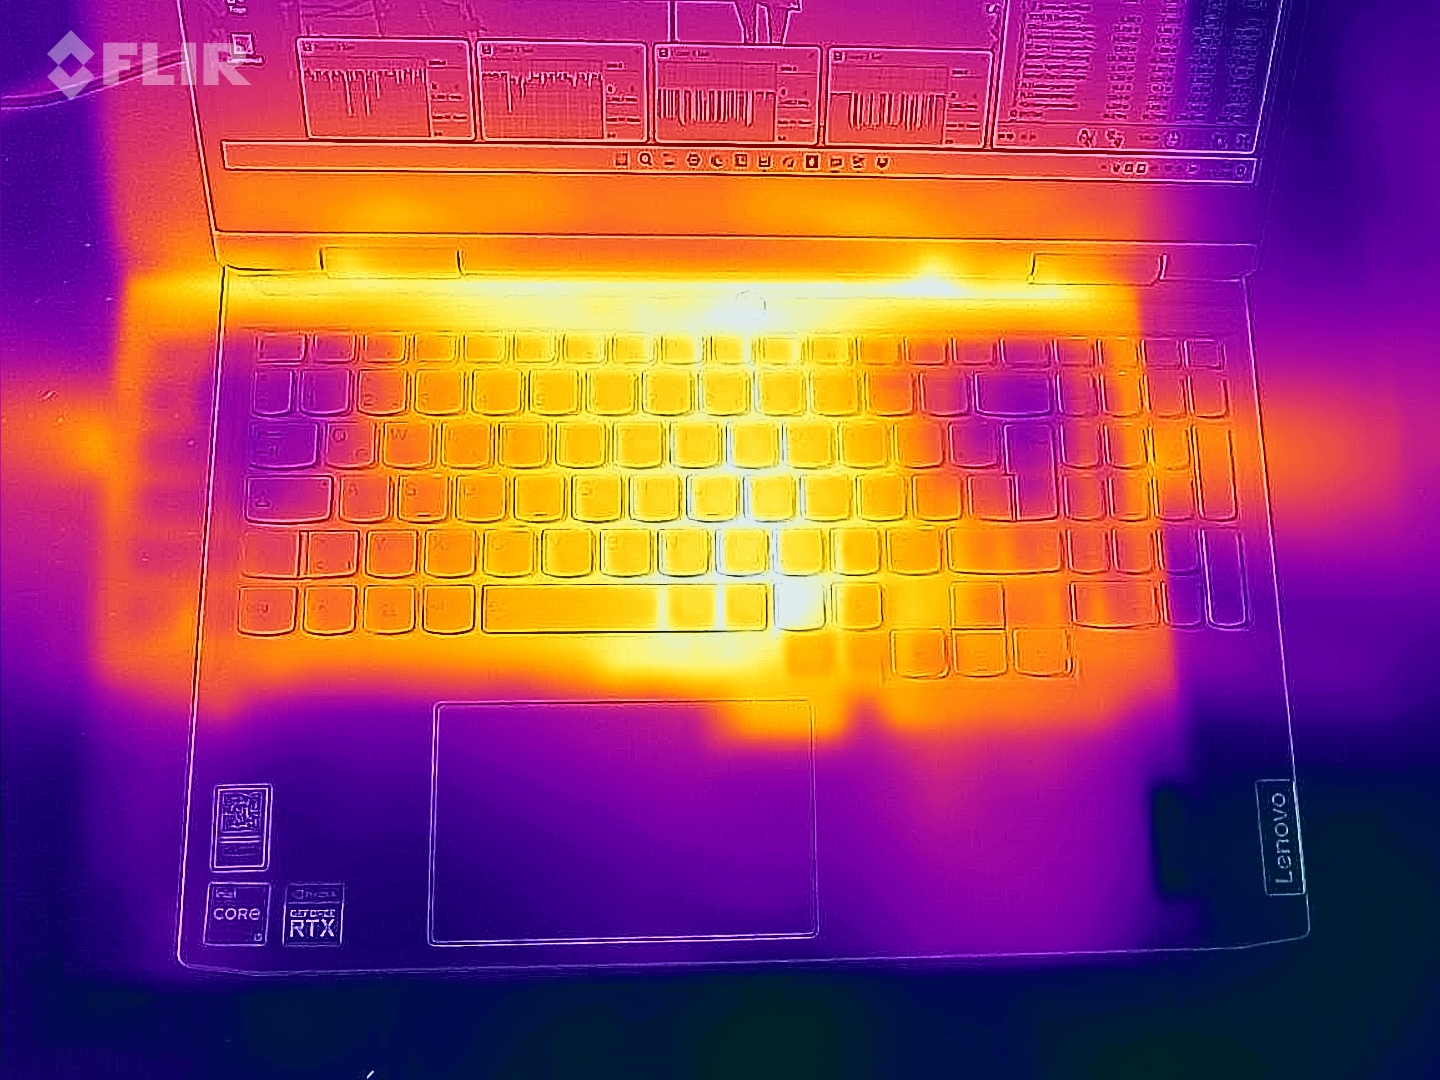
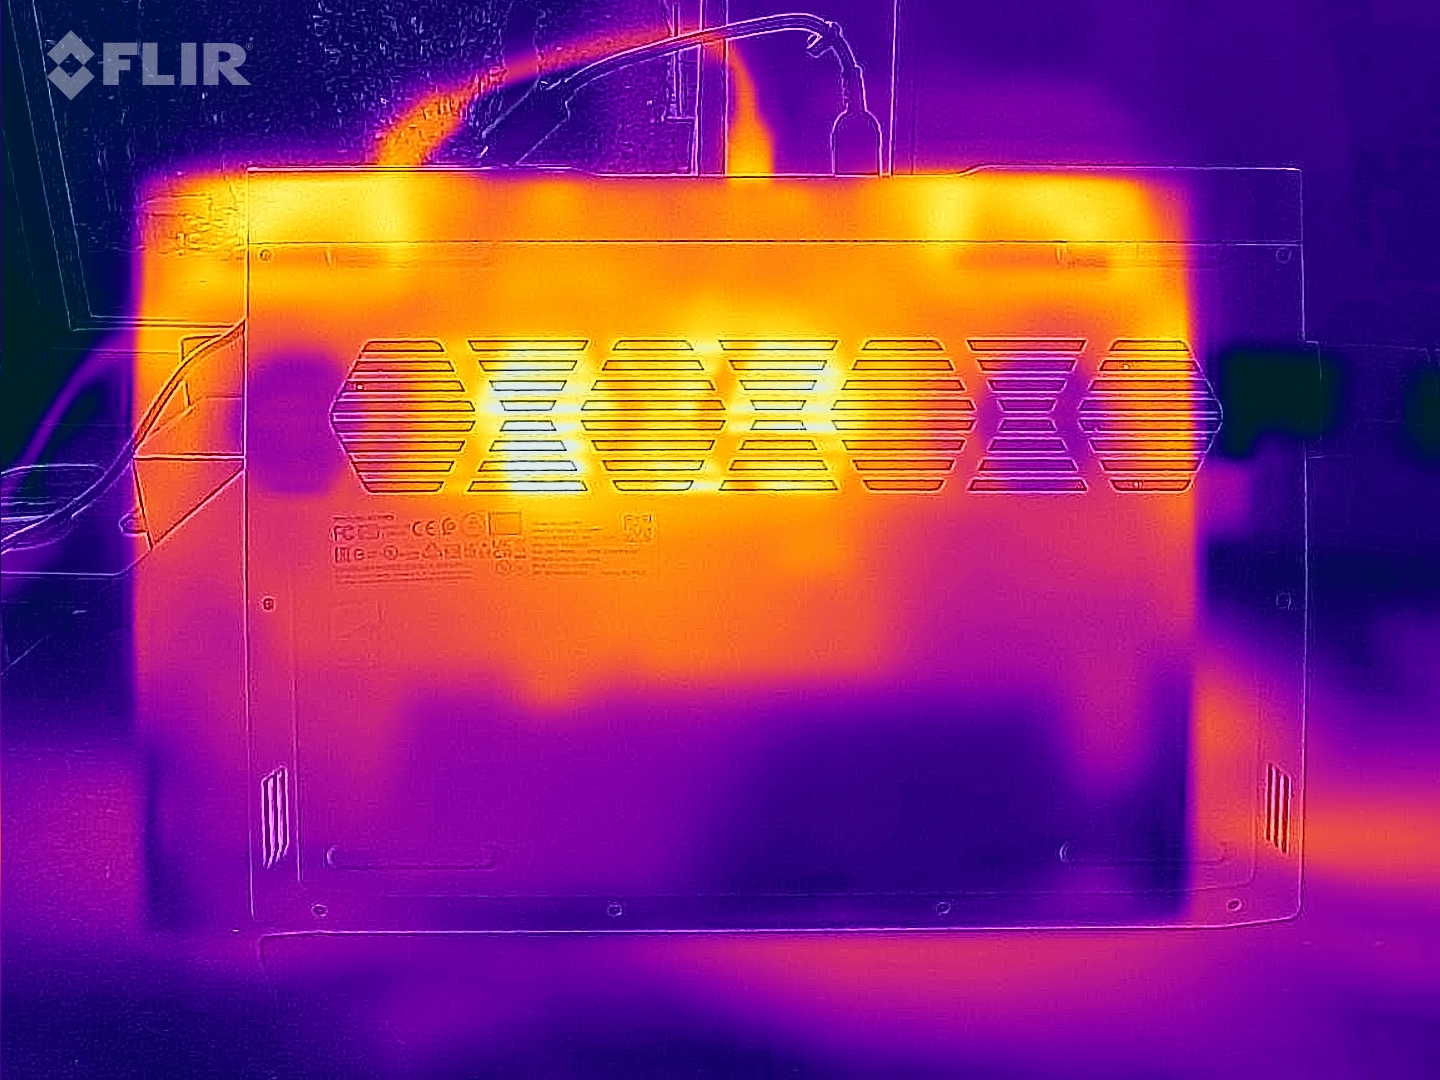
Temperaturutvecklingen är också typisk för en bärbar dator för spel. Medan Lenovo-enheten förblir behagligt sval vid tomgångsdrift, når temperaturen upp till 47 °C på ovansidan och 52 °C på undersidan vid 3D-drift. Du bör alltså inte försöka spela med den bärbara datorn i knät.
(-) Den maximala temperaturen på ovansidan är 47 °C / 117 F, jämfört med genomsnittet av 40.4 °C / 105 F , allt från 21.2 till 68.8 °C för klassen Gaming.
(-) Botten värms upp till maximalt 52 °C / 126 F, jämfört med genomsnittet av 43.2 °C / 110 F
(+) Vid tomgångsbruk är medeltemperaturen för ovansidan 24.2 °C / 76 F, jämfört med enhetsgenomsnittet på 33.9 °C / ### class_avg_f### F.
(-) När du spelar The Witcher 3 är medeltemperaturen för ovansidan 39.2 °C / 103 F, jämfört med enhetsgenomsnittet på 33.9 °C / ## #class_avg_f### F.
(±) Handledsstöden och pekplattan kan bli väldigt varma vid beröring med maximalt 37 °C / 98.6 F.
(-) Medeltemperaturen för handledsstödsområdet på liknande enheter var 28.8 °C / 83.8 F (-8.2 °C / -14.8 F).
| Lenovo IdeaPad Gaming 3 15IAH7 GeForce RTX 3050 Ti Laptop GPU, i5-12500H | Lenovo IdeaPad Gaming 3 15ARH7 GeForce RTX 3050 4GB Laptop GPU, R5 6600H | Dell G15 5515 GeForce RTX 3050 Ti Laptop GPU, R7 5800H | HP Victus 16-e0145ng GeForce RTX 3050 Ti Laptop GPU, R5 5600H | Dell Inspiron 16 Plus 7620 GeForce RTX 3050 Ti Laptop GPU, i7-12700H | |
|---|---|---|---|---|---|
| Heat | -3% | -3% | -25% | -8% | |
| Maximum Upper Side * (°C) | 47 | 47.6 -1% | 50 -6% | 54 -15% | 46 2% |
| Maximum Bottom * (°C) | 52 | 46.6 10% | 49 6% | 47 10% | 45.8 12% |
| Idle Upper Side * (°C) | 25 | 27.2 -9% | 26 -4% | 41 -64% | 29.2 -17% |
| Idle Bottom * (°C) | 24 | 27.2 -13% | 26 -8% | 31 -29% | 31 -29% |
* ... mindre är bättre
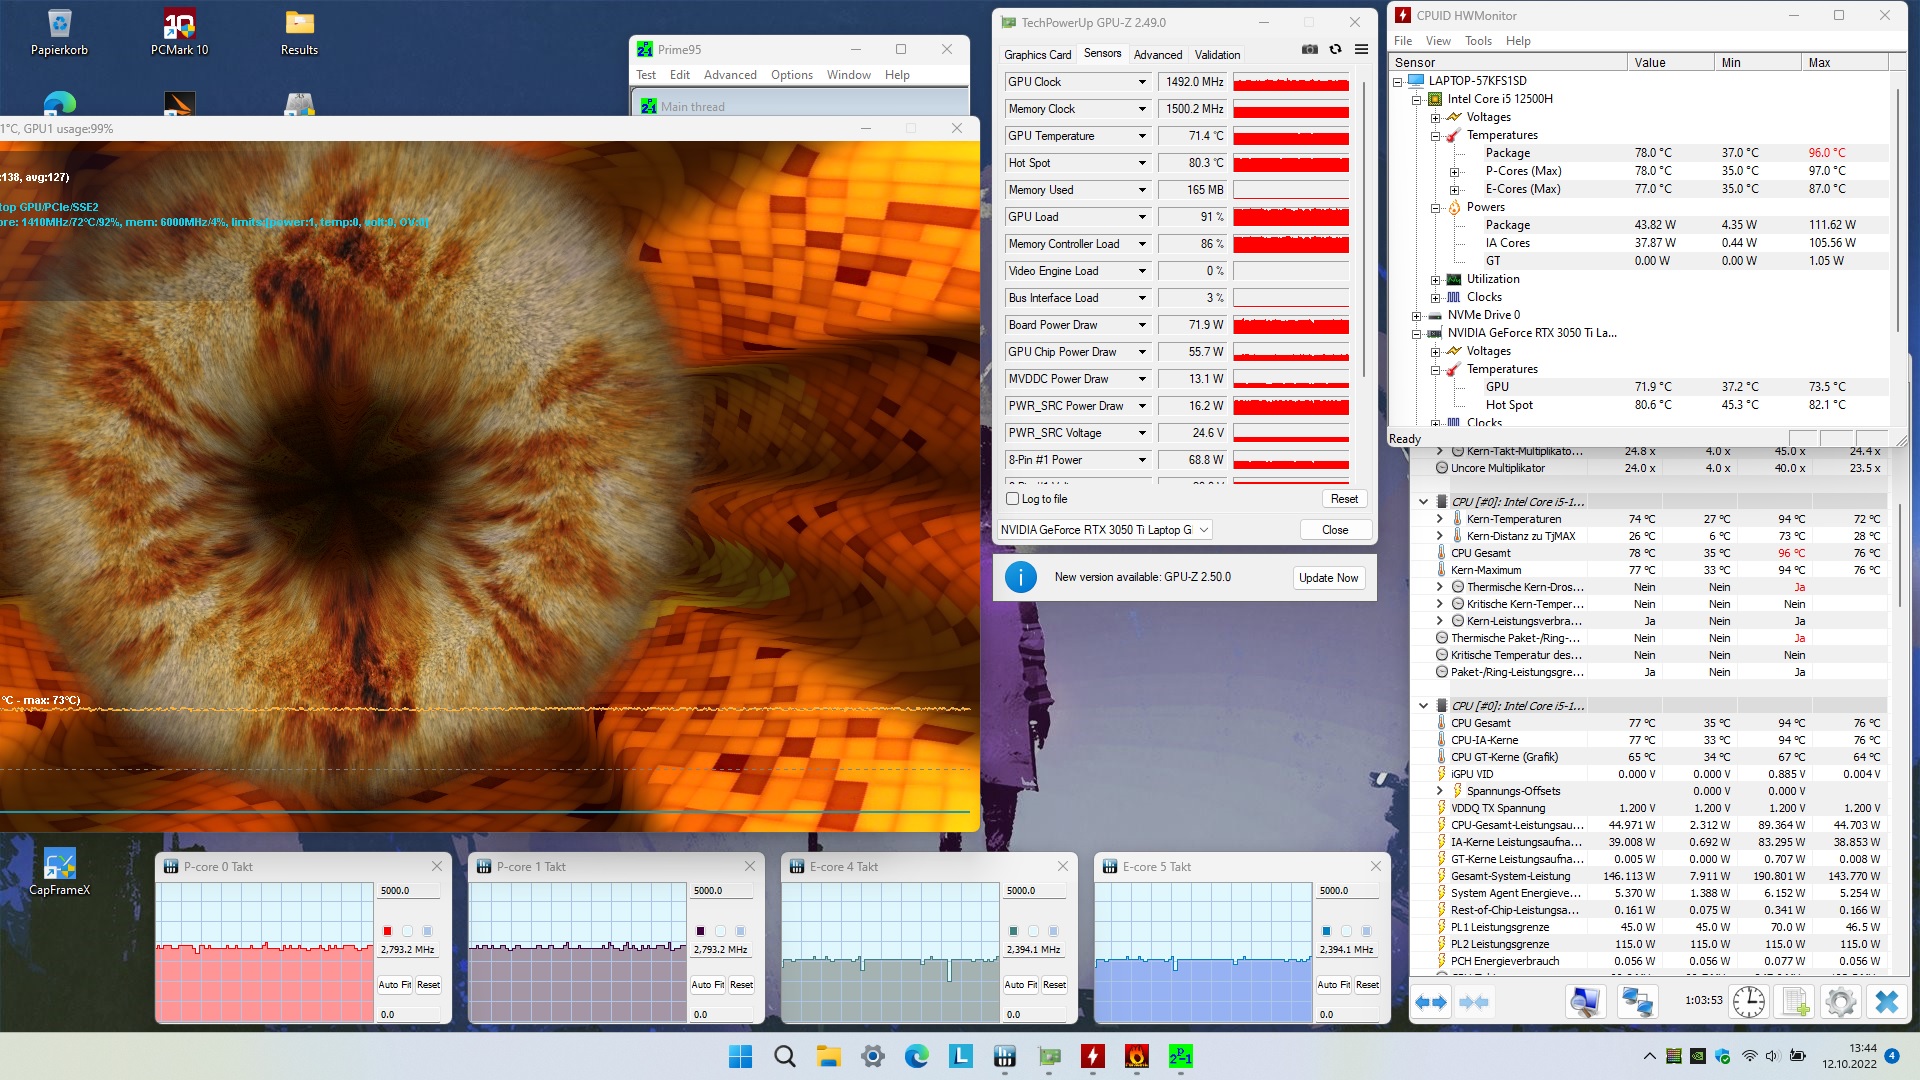
Stresstest
Stresstestet med en timmes FurMark & Prime95 avslöjar inget konstigt. Den 15-tums bärbara datorn håller sig borta från throttling och kritiska hårdvaruvärden. Vi skulle betrakta omkring 71 °C för GPU:n och 78 °C för CPU:n vid full belastning som måttliga värden.
Högtalare
Lenovo IdeaPad Gaming 3 15IAH7 ljudanalys
(+) | högtalare kan spela relativt högt (83 dB)
Bas 100 - 315 Hz
(-) | nästan ingen bas - i genomsnitt 17.1% lägre än medianen
(±) | linjäriteten för basen är genomsnittlig (12.8% delta till föregående frekvens)
Mellan 400 - 2000 Hz
(±) | högre mellan - i genomsnitt 5.6% högre än median
(+) | mids är linjära (4.5% delta till föregående frekvens)
Högsta 2 - 16 kHz
(+) | balanserade toppar - endast 2% från medianen
(+) | toppar är linjära (4.6% delta till föregående frekvens)
Totalt 100 - 16 000 Hz
(+) | det totala ljudet är linjärt (14.4% skillnad mot median)
Jämfört med samma klass
» 27% av alla testade enheter i den här klassen var bättre, 7% liknande, 66% sämre
» Den bästa hade ett delta på 6%, genomsnittet var 18%, sämst var 132%
Jämfört med alla testade enheter
» 18% av alla testade enheter var bättre, 4% liknande, 78% sämre
» Den bästa hade ett delta på 4%, genomsnittet var 24%, sämst var 134%
Dell G15 5515 ljudanalys
(±) | högtalarljudstyrkan är genomsnittlig men bra (76 dB)
Bas 100 - 315 Hz
(-) | nästan ingen bas - i genomsnitt 22% lägre än medianen
(±) | linjäriteten för basen är genomsnittlig (14.9% delta till föregående frekvens)
Mellan 400 - 2000 Hz
(+) | balanserad mellan - endast 2.8% från medianen
(+) | mids är linjära (3% delta till föregående frekvens)
Högsta 2 - 16 kHz
(+) | balanserade toppar - endast 1.4% från medianen
(+) | toppar är linjära (3.7% delta till föregående frekvens)
Totalt 100 - 16 000 Hz
(±) | linjäriteten för det totala ljudet är genomsnittlig (16.8% skillnad mot median)
Jämfört med samma klass
» 44% av alla testade enheter i den här klassen var bättre, 11% liknande, 46% sämre
» Den bästa hade ett delta på 6%, genomsnittet var 18%, sämst var 132%
Jämfört med alla testade enheter
» 29% av alla testade enheter var bättre, 8% liknande, 63% sämre
» Den bästa hade ett delta på 4%, genomsnittet var 24%, sämst var 134%
Energihantering
Effektförbrukning
Strömförbrukningen sticker inte heller ut. Även om Gaming 3 i genomsnitt förbrukar något mer ström än andra bärbara RTX 3050 Ti-datorer, beror detta främst på den högre TGP.
| Av/Standby | |
| Låg belastning | |
| Hög belastning |
|
Förklaring:
min: | |
| Lenovo IdeaPad Gaming 3 15IAH7 GeForce RTX 3050 Ti Laptop GPU, i5-12500H | Lenovo IdeaPad Gaming 3 15ARH7 GeForce RTX 3050 4GB Laptop GPU, R5 6600H | Dell G15 5515 GeForce RTX 3050 Ti Laptop GPU, R7 5800H | HP Victus 16-e0145ng GeForce RTX 3050 Ti Laptop GPU, R5 5600H | Dell Inspiron 16 Plus 7620 GeForce RTX 3050 Ti Laptop GPU, i7-12700H | Genomsnitt av klass Gaming | |
|---|---|---|---|---|---|---|
| Power Consumption | 8% | 7% | 5% | 6% | -53% | |
| Idle Minimum * (Watt) | 8 | 7.7 4% | 5 37% | 7 12% | 6.8 15% | 13.2 ? -65% |
| Idle Average * (Watt) | 10 | 9.1 9% | 9 10% | 9 10% | 9.6 4% | 18.9 ? -89% |
| Idle Maximum * (Watt) | 16 | 15.6 2% | 20 -25% | 15 6% | 17 -6% | 24.3 ? -52% |
| Load Average * (Watt) | 99 | 90.7 8% | 94 5% | 93 6% | 117.5 -19% | 108.3 ? -9% |
| Witcher 3 ultra * (Watt) | 144.6 | 122.9 15% | 123 15% | 134.5 7% | 113.1 22% | |
| Load Maximum * (Watt) | 168 | 155.2 8% | 172 -2% | 185 -10% | 137.4 18% | 254 ? -51% |
* ... mindre är bättre
Power Consumption The Witcher 3 / Stress Test
Power Consumption With External Monitor
Batteritid
Beroende på modell har IdeaPad antingen ett 45-Wh- eller ett 60-Wh-batteri. I motsats till sitt AMD-syskon kan den testade Intel-versionen lyckligtvis göra mål med det kraftfullare batteriet. På grund av den högre förbrukningen håller sig dock skillnaderna inom ramarna. Med knappt 6 timmar visar sig batteritiden under trådlös internetsurfning vid en skärmens ljusstyrka reducerad till 150 cd/m² till och med vara något lägre än AMD-versionens. De andra konkurrenterna ligger också före i detta avseende.
| Lenovo IdeaPad Gaming 3 15IAH7 GeForce RTX 3050 Ti Laptop GPU, i5-12500H, 60 Wh | Lenovo IdeaPad Gaming 3 15ARH7 GeForce RTX 3050 4GB Laptop GPU, R5 6600H, 45 Wh | Dell G15 5515 GeForce RTX 3050 Ti Laptop GPU, R7 5800H, 56 Wh | HP Victus 16-e0145ng GeForce RTX 3050 Ti Laptop GPU, R5 5600H, 70 Wh | Dell Inspiron 16 Plus 7620 GeForce RTX 3050 Ti Laptop GPU, i7-12700H, 86 Wh | Genomsnitt av klass Gaming | |
|---|---|---|---|---|---|---|
| Batteridrifttid | 10% | 36% | 20% | 63% | 19% | |
| WiFi v1.3 (h) | 5.9 | 6.5 10% | 8 36% | 7.1 20% | 9.6 63% | 7.04 ? 19% |
| Reader / Idle (h) | 2.4 | 13.5 | 18.6 | 8.71 ? | ||
| Load (h) | 0.9 | 1.5 | 1.2 | 1.47 ? | ||
| H.264 (h) | 8.8 | 8.26 ? |
För
Emot
Omdöme
Om man bortser från den mediokra kvaliteten på fodralet när det gäller material och utförande, har Lenovo skapat en lyckad bärbar dator för spel till lågpris med IdeaPad Gaming 3 15IAH7.
Tack vare höga TDP:er och ständig utveckling av prestanda kanCore i5-12500Hoch GeForce RTX 3050 Tikan visa sin fulla kraft, medan de (oftast långsammare) konkurrenterna däremot ger en bättre batteritid. Dock kan knappast någon av de alternativa bärbara datorerna nå upp till bildkvaliteten hos Gaming 3. De flesta av konkurrenterna hamnar på efterkälken när det gäller färgrymd och ljusstyrka. I vårt jämförelsefält är det bara Dell Inspiron 16 Plusi närheten av den bärbara datorn från Lenovo.
Den som förväntar sig en bra skärm men inte vill spendera för mycket pengar på en spellaptop bör titta närmare på IdeaPad Gaming 3 15IAH7.
Pris och tillgänglighet
Vid tidpunkten för detta test finns IdeaPad Gaming 3 15IAH7 med Core i5-12500H, GeForce RTX 3050 Ti, 8 GB RAM och 512 GB SSD för $1031 från BestBuy.
Lenovo IdeaPad Gaming 3 15IAH7
- 10/14/2022 v7 (old)
Florian Glaser
Price comparison

