Recension av Eurocom Raptor X17 laptop: MSI och Asus ROG-alternativet

Efter att nyligen ha testat 15,6-tums Raptor X15är vi nu redo att ta oss an dess storebror Raptor X17 på 17,3 tum. Dess chassi är en ny design (X370) som vi ännu inte har sett från andra märken vid tidpunkten för granskningen. Trots detta förväntar vi oss fullt ut att andra återförsäljare som Schenker så småningom kommer att erbjuda samma chassi under olika varumärken för marknader utomlands.
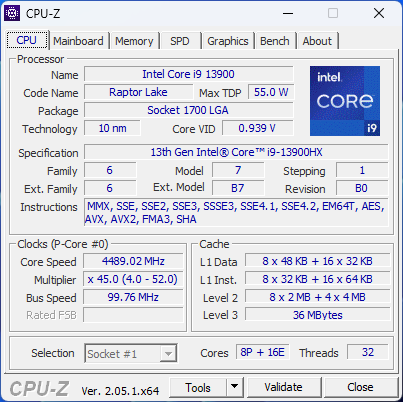
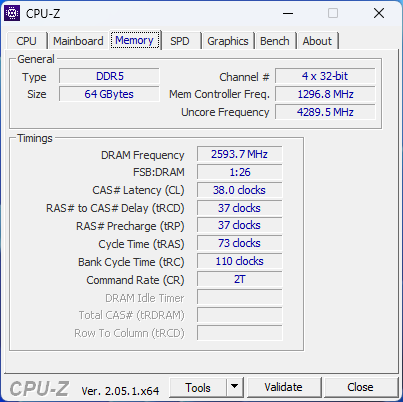
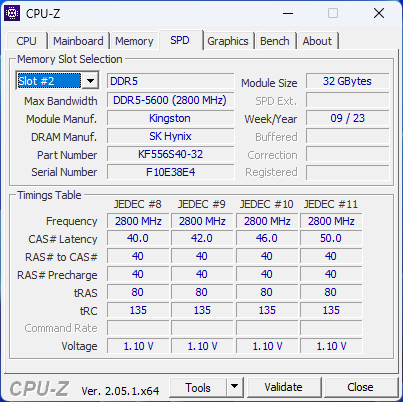
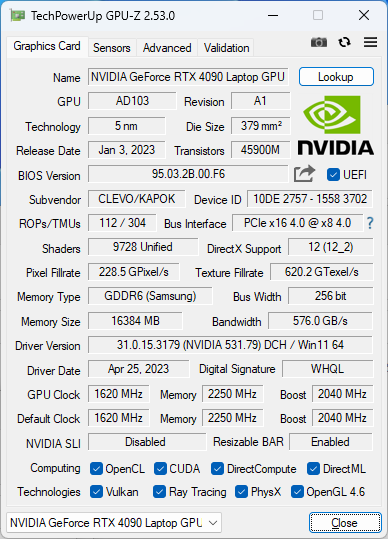
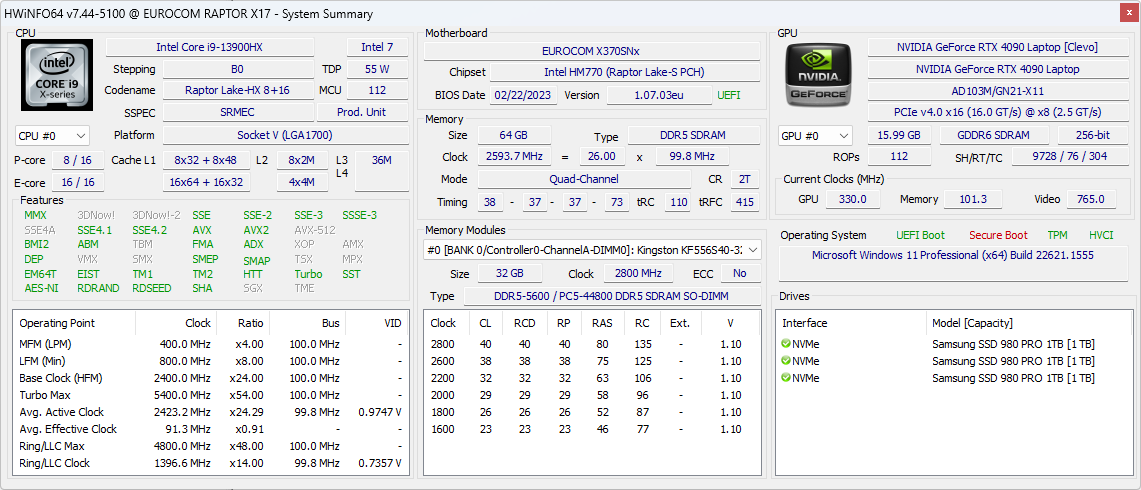
Vår konfiguration i granskningen är en high-end SKU med 13th gen Raptor Lake Core i9-13900HX CPU, 175 W GeForce RTX 4090 GPU, 64 GB DDR5 RAM, 3x 1 TB SSD-enheter och 1440p 240 Hz-skärm för cirka 6600 USD. Naturligtvis kan användare konfigurera med mindre RAM och lagring och en i7-13700HX eller en RTX 4080 för lägre startpriser.
Konkurrenterna till Raptor X17 inkluderar andra tunna till mellanstora bärbara 17-tums gamingdatorer som t.ex Razer Blade 17, Asus ROG Strix Scar 17, Gigabyte Aorus 17Xeller MSI GS77.
Fler recensioner från Eurocom:
Potentiella konkurrenter i jämförelse
Gradering | Datum | Modell | Vikt | Höjd | Storlek | Upplösning | Pris |
|---|---|---|---|---|---|---|---|
| 82.8 % v7 (old) | 05/2023 | Eurocom Raptor X17 i9-13900HX, GeForce RTX 4090 Laptop GPU | 3.5 kg | 24.9 mm | 17.30" | 2560x1440 | |
| 88.3 % v7 (old) | 04/2023 | Asus ROG Strix Scar 17 G733PY-XS96 R9 7945HX, GeForce RTX 4090 Laptop GPU | 2.9 kg | 28.3 mm | 17.30" | 2560x1440 | |
| 86 % v7 (old) | 04/2023 | Aorus 17X AZF i9-13900HX, GeForce RTX 4090 Laptop GPU | 2.9 kg | 21.8 mm | 17.30" | 2560x1440 | |
| 88.3 % v7 (old) | 03/2023 | MSI GE78HX 13VH-070US i9-13950HX, GeForce RTX 4080 Laptop GPU | 3 kg | 23 mm | 17.00" | 2560x1600 | |
| 89.9 % v7 (old) | 03/2023 | Eluktronics Mech-17 GP2 i9-13900HX, GeForce RTX 4090 Laptop GPU | 2.9 kg | 27 mm | 17.00" | 2560x1600 | |
| 86.1 % v7 (old) | 01/2023 | Alienware m17 R5 (R9 6900HX, RX 6850M XT) R9 6900HX, Radeon RX 6850M XT | 3.4 kg | 26.7 mm | 17.00" | 3840x2160 |
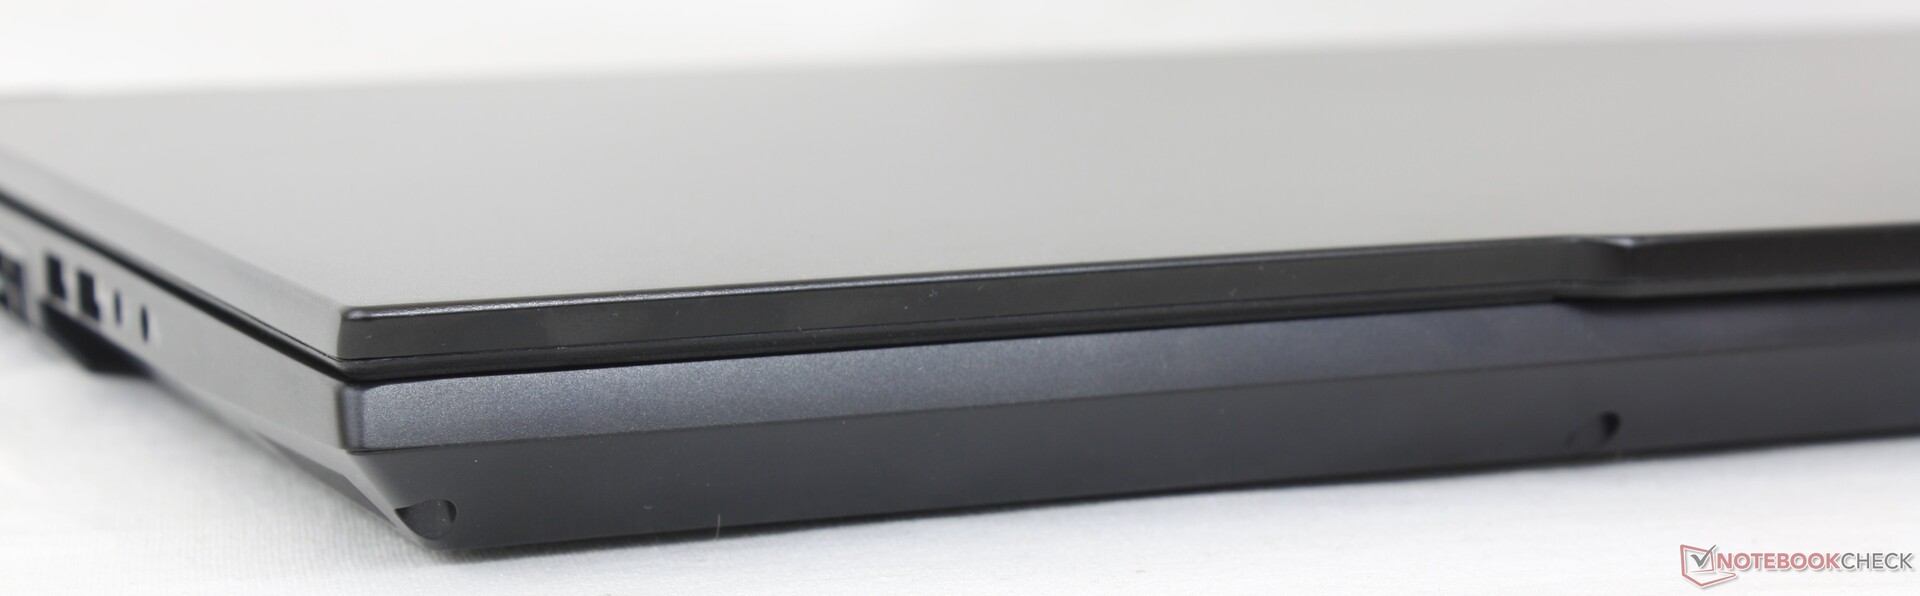
Case - En nystart
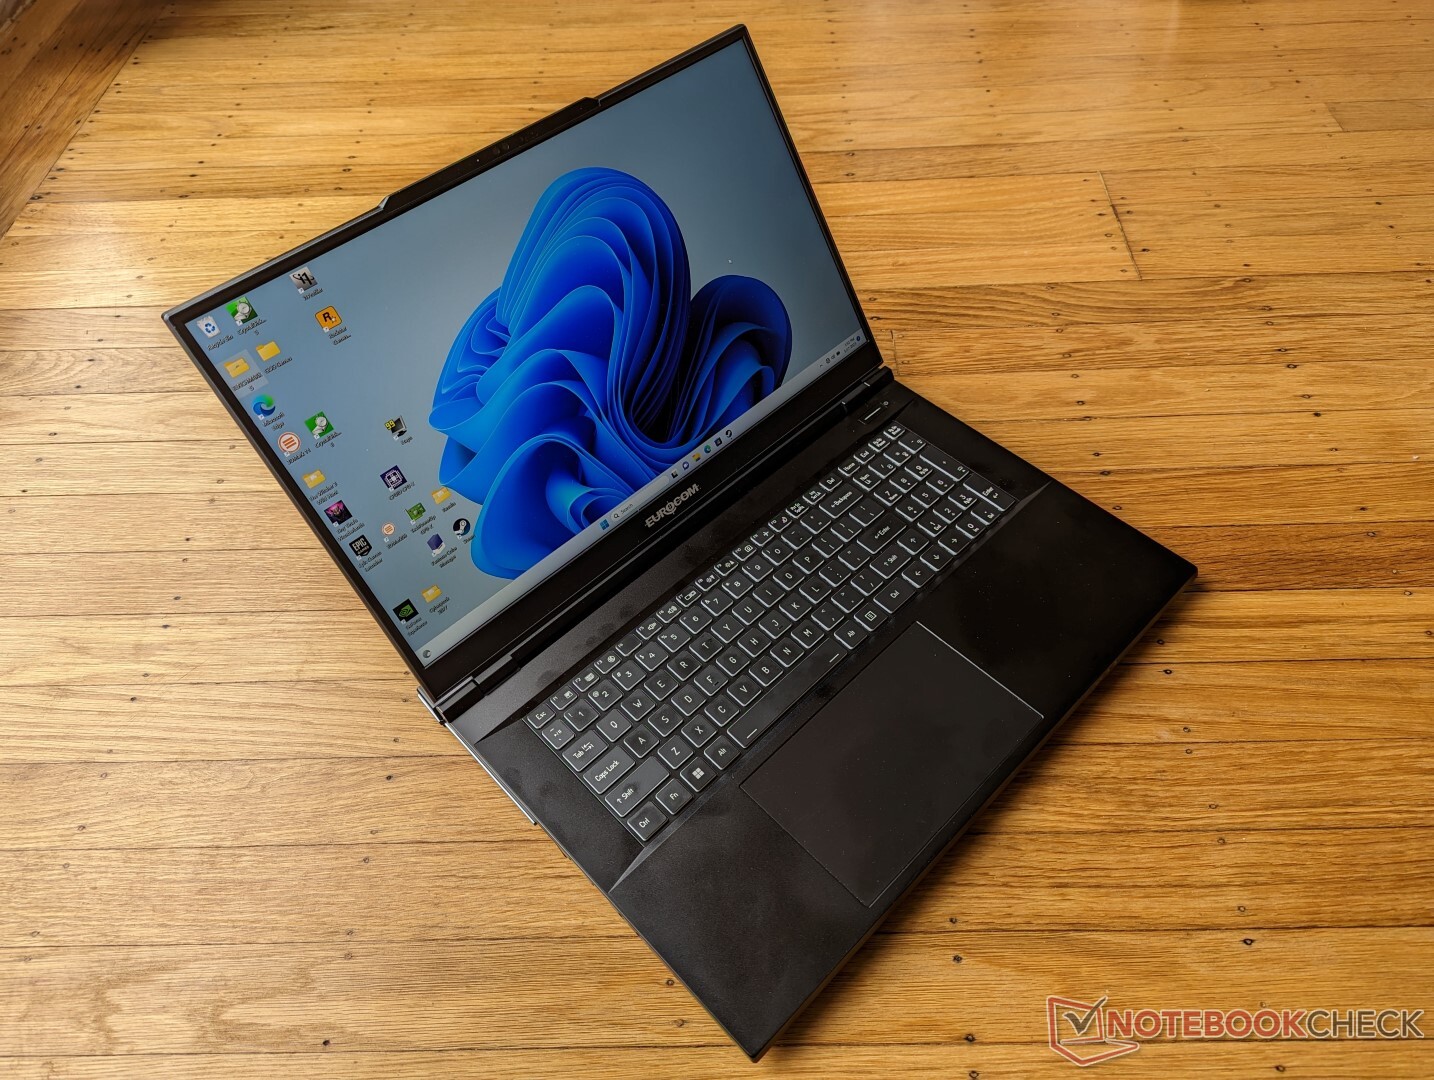
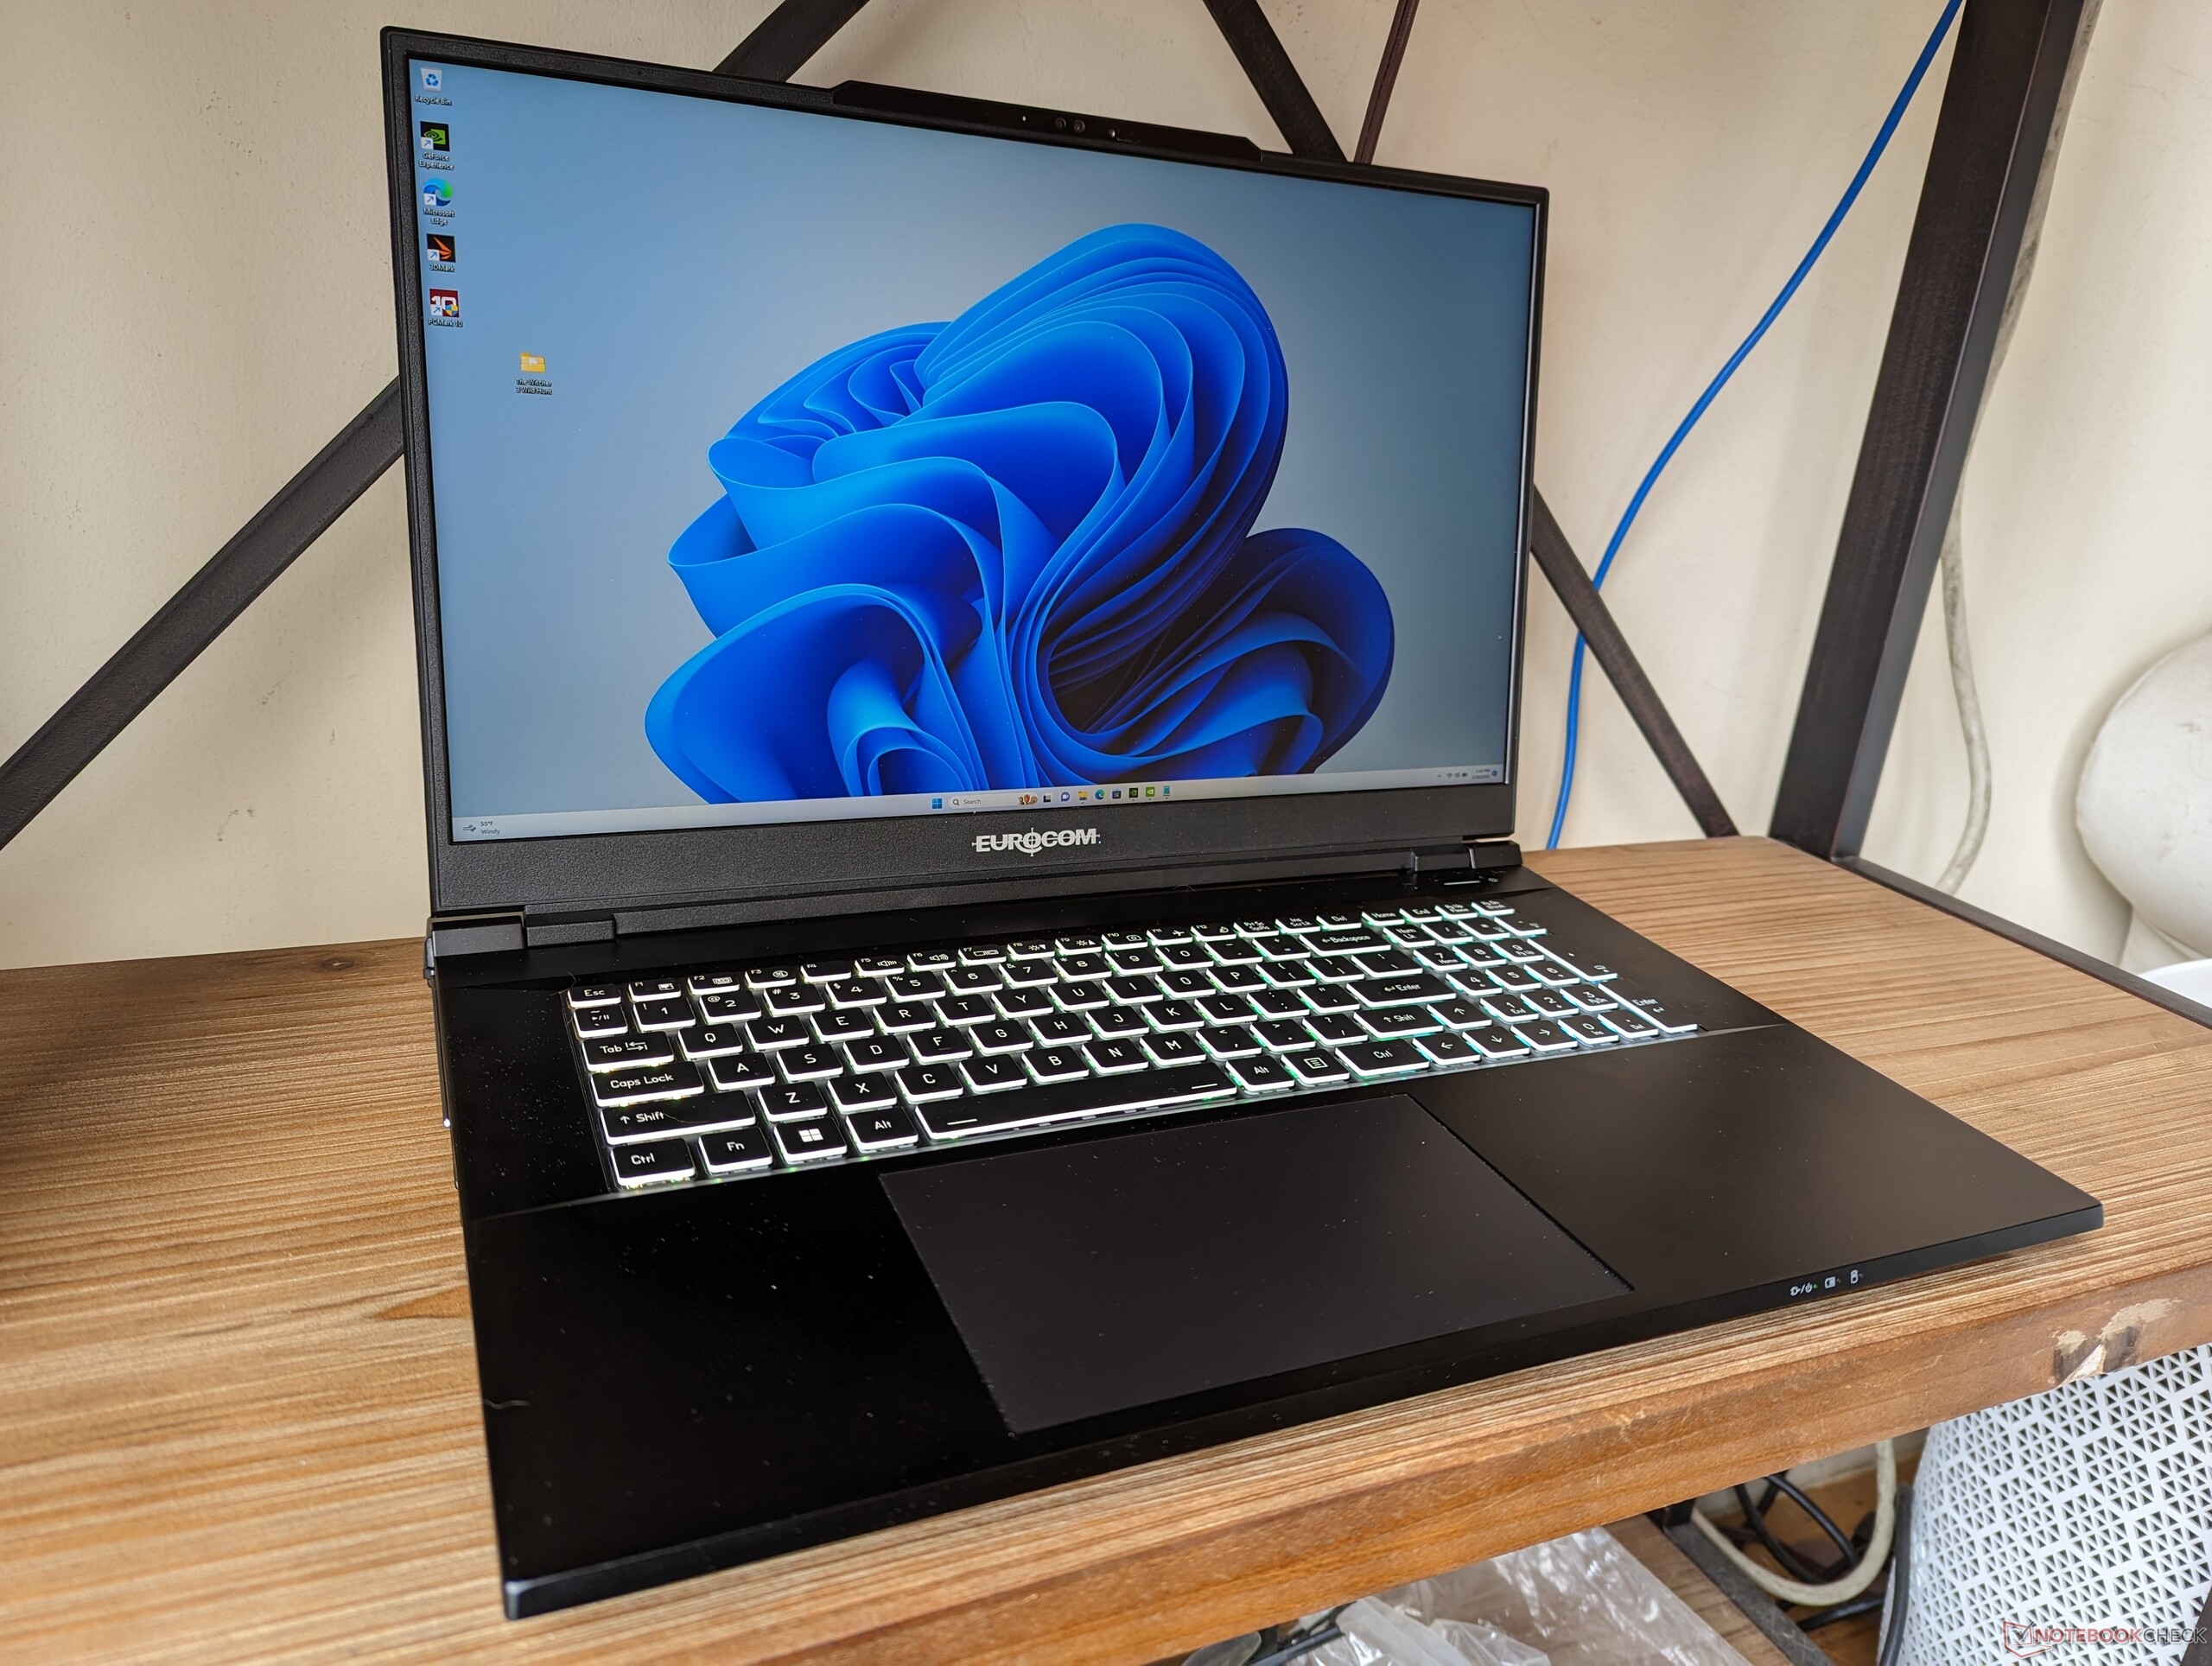
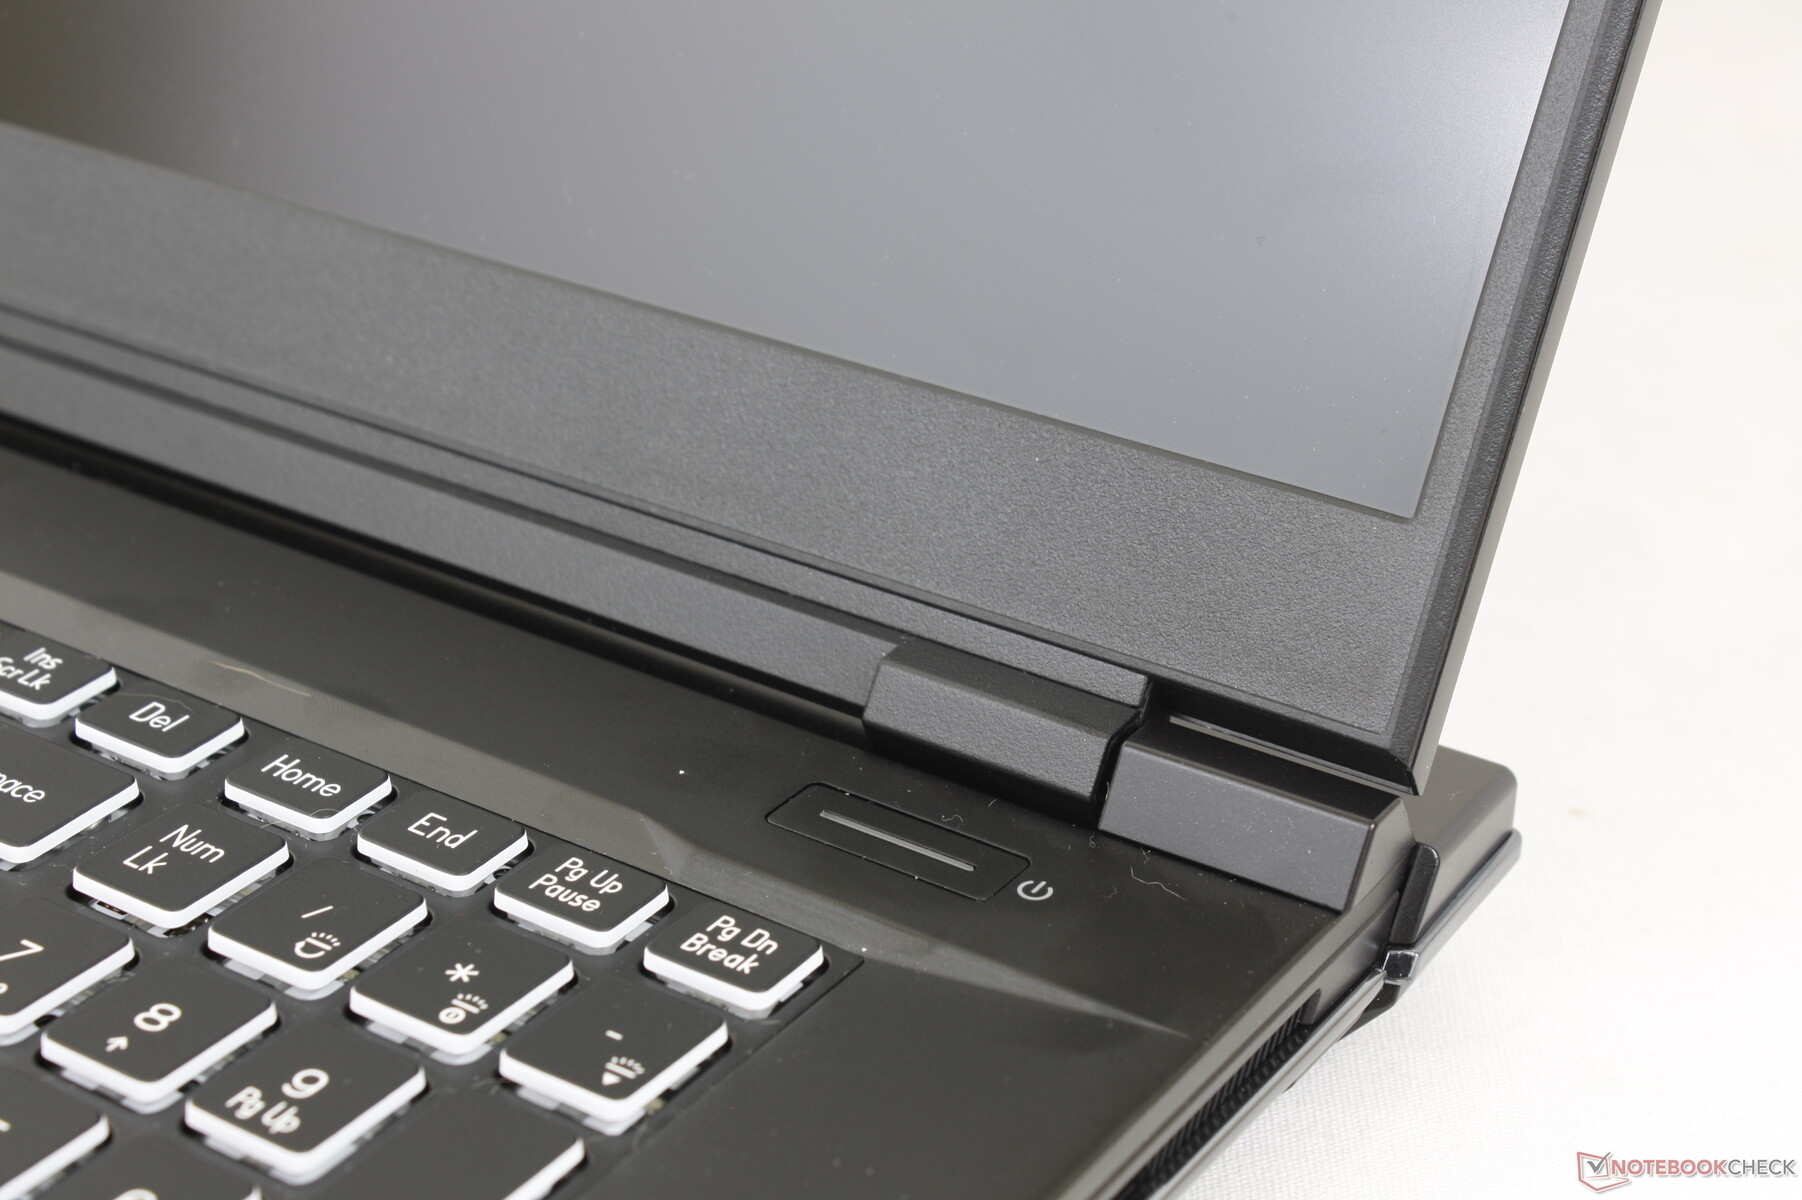
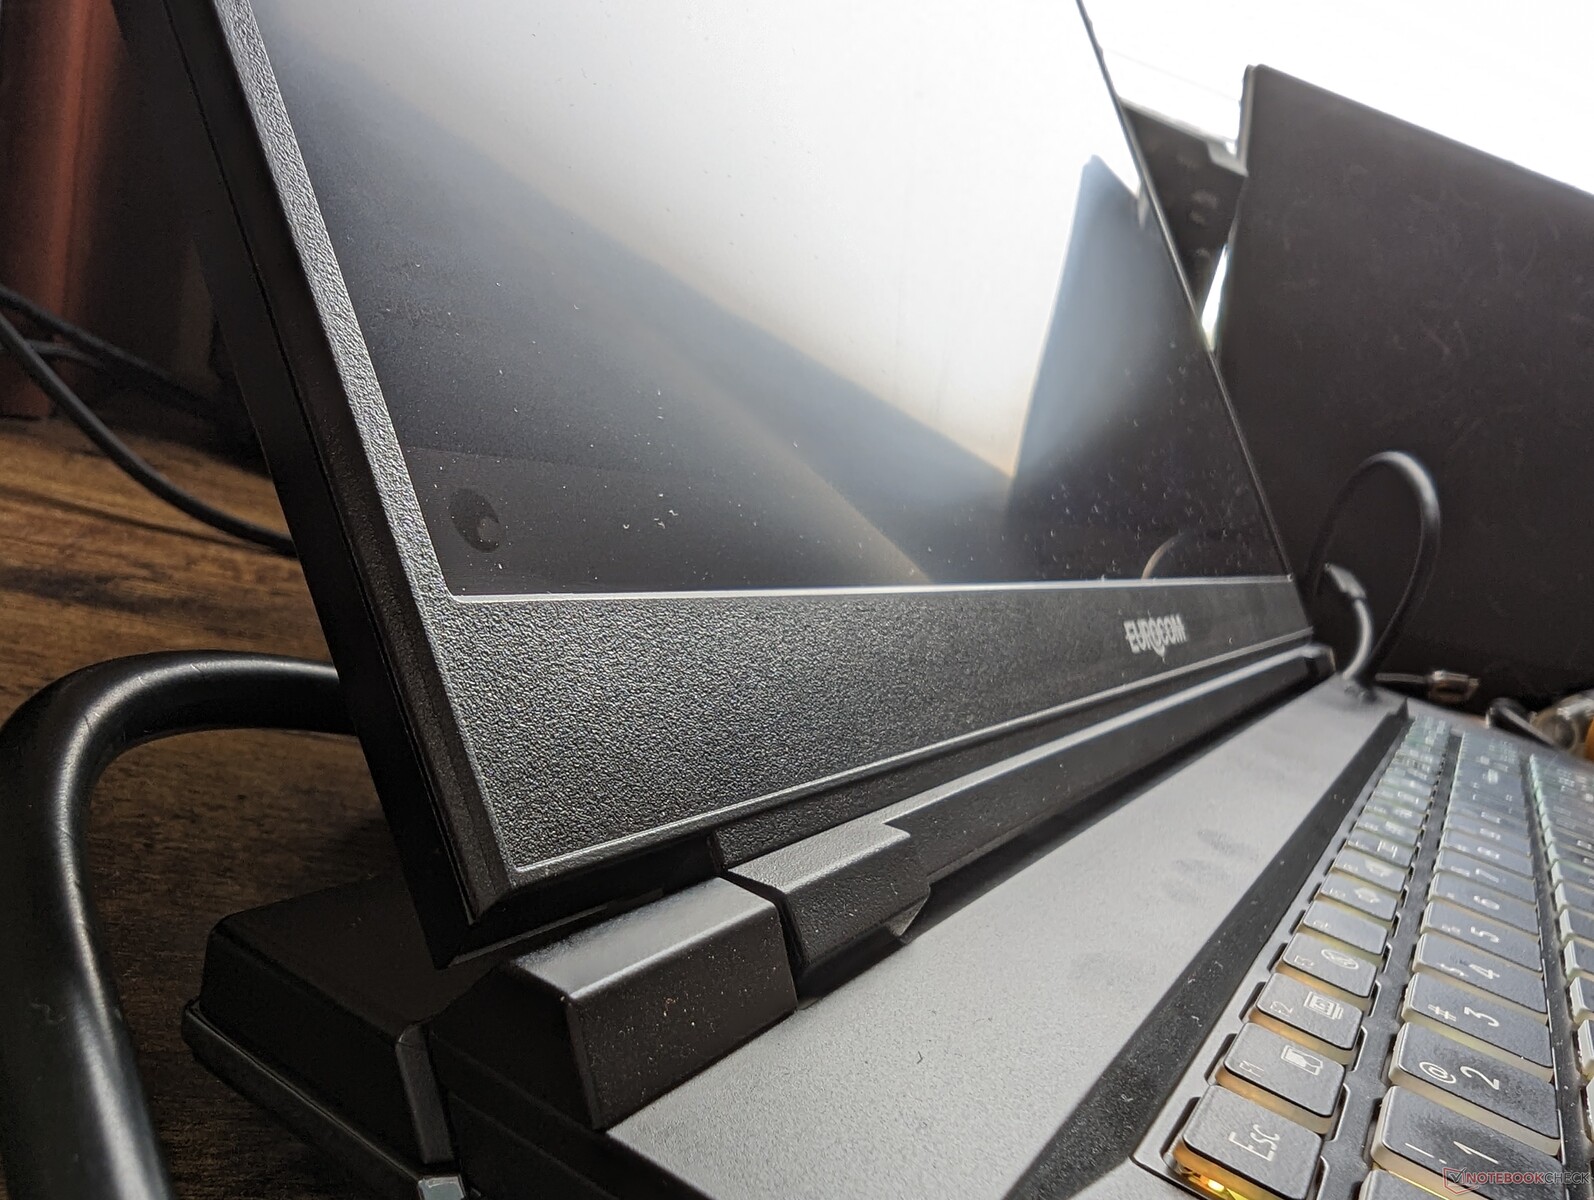
Raptor X17 är förmodligen den snyggaste bärbara dator vi sett från Eurocom. Det superlena och mestadels metallskelettet står i stark kontrast till de äldre och tjockare ABS-designerna från samma företag. Chassiets styvhet är också utmärkt med minimal böjning längs basen och det yttre locket för solida första intryck.
Den kanske svagaste aspekten av chassit är gångjärnet eftersom skärmen vacklar lite mer aggressivt när man justerar vinklar jämfört med de styvare och större gångjärnen på en Asus ROG laptop. Tangentbordets mittpunkt skulle också böja sig något när man applicerar tryck med ett finger, vilket påverkar tangentåterkopplingen negativt när man skriver. Förhoppningsvis kan eventuella framtida omkonstruktioner åtgärda dessa problem.
Med sina 3,5 kg är Raptor X17 en av de tyngre bärbara datorerna för spel i sin storleksklass och överträffar till och med den 3,4 kg tunga bärbara datorn Alienware m17 R5. Mest anmärkningsvärt är att systemet är något mindre än ROG Strix Scar 17 G733 och ändå är det 20 procent tyngre för en mycket tät känsla. Om du vill ha något betydligt lättare och mindre kan användare överväga följande Razer Blade 17 i stället.
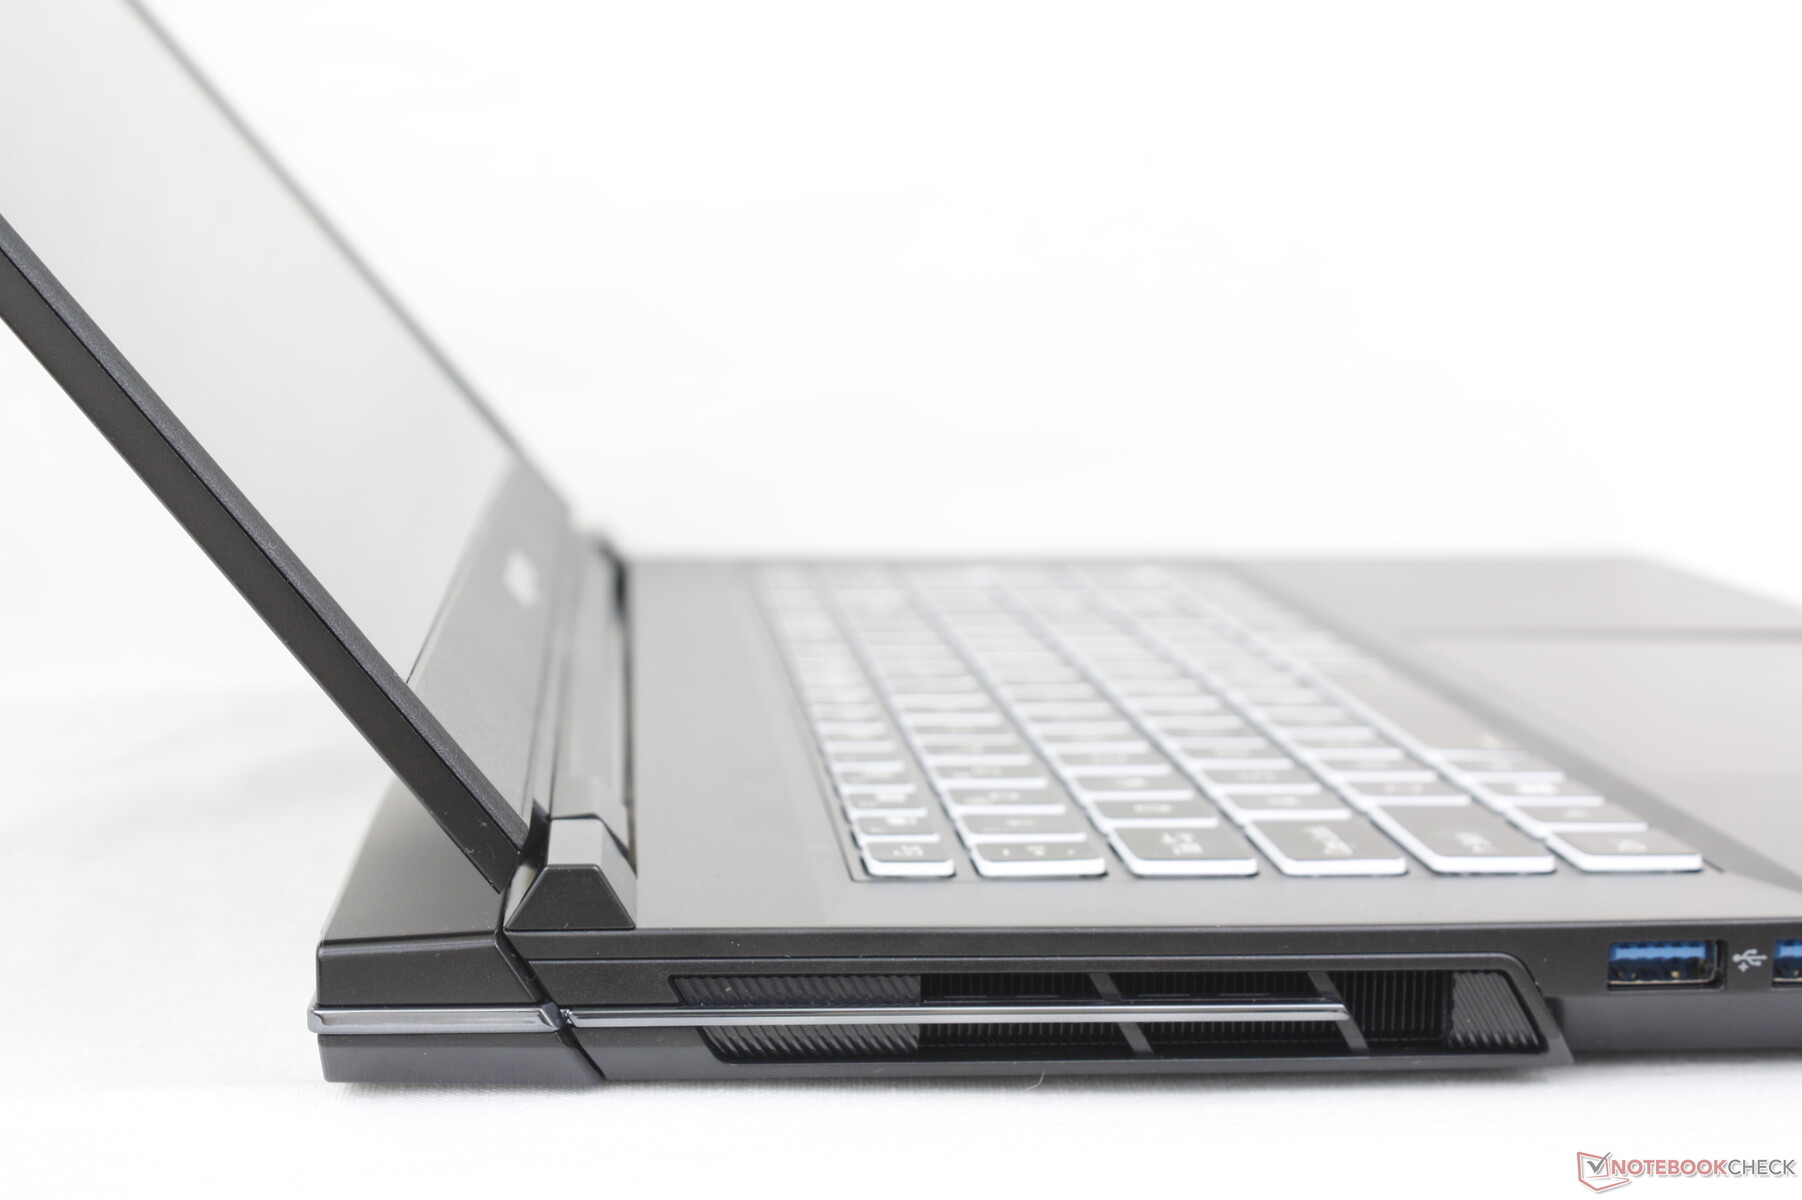
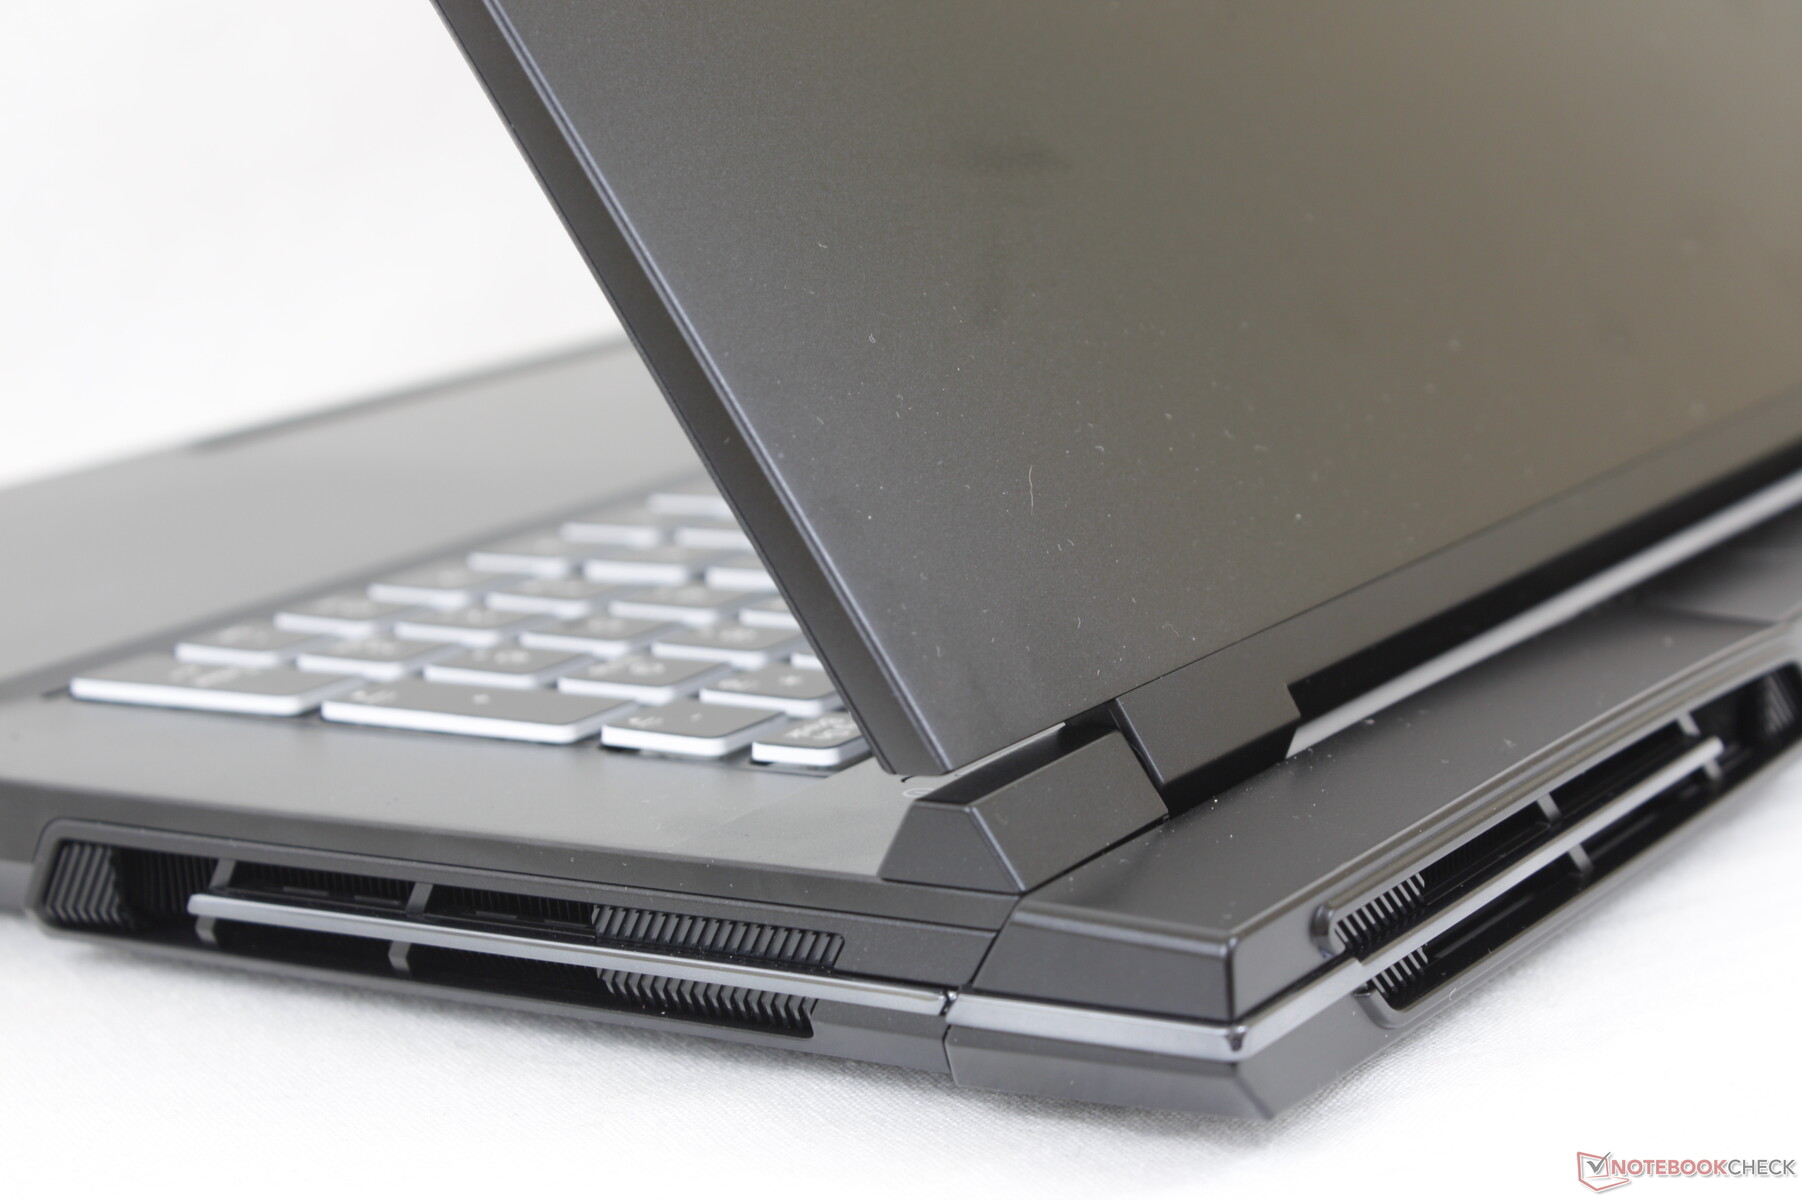
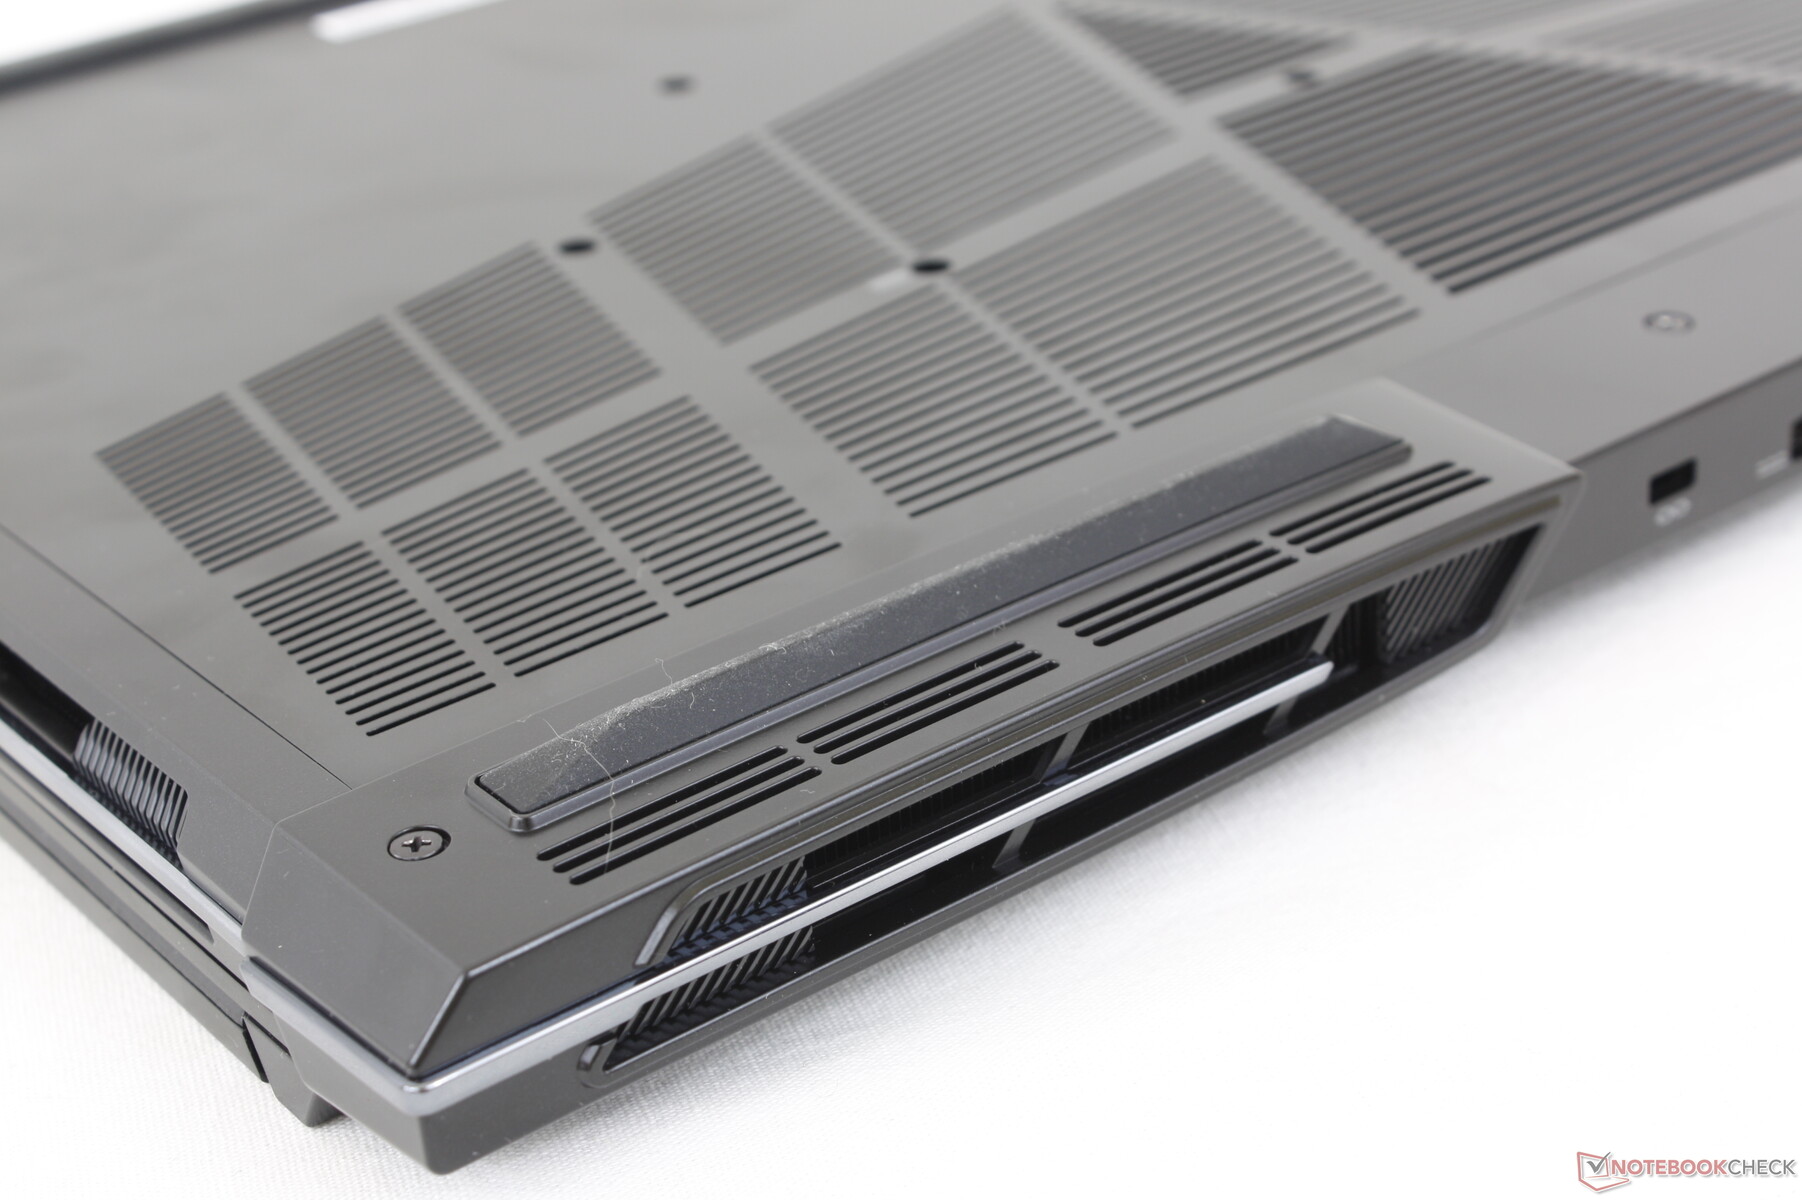
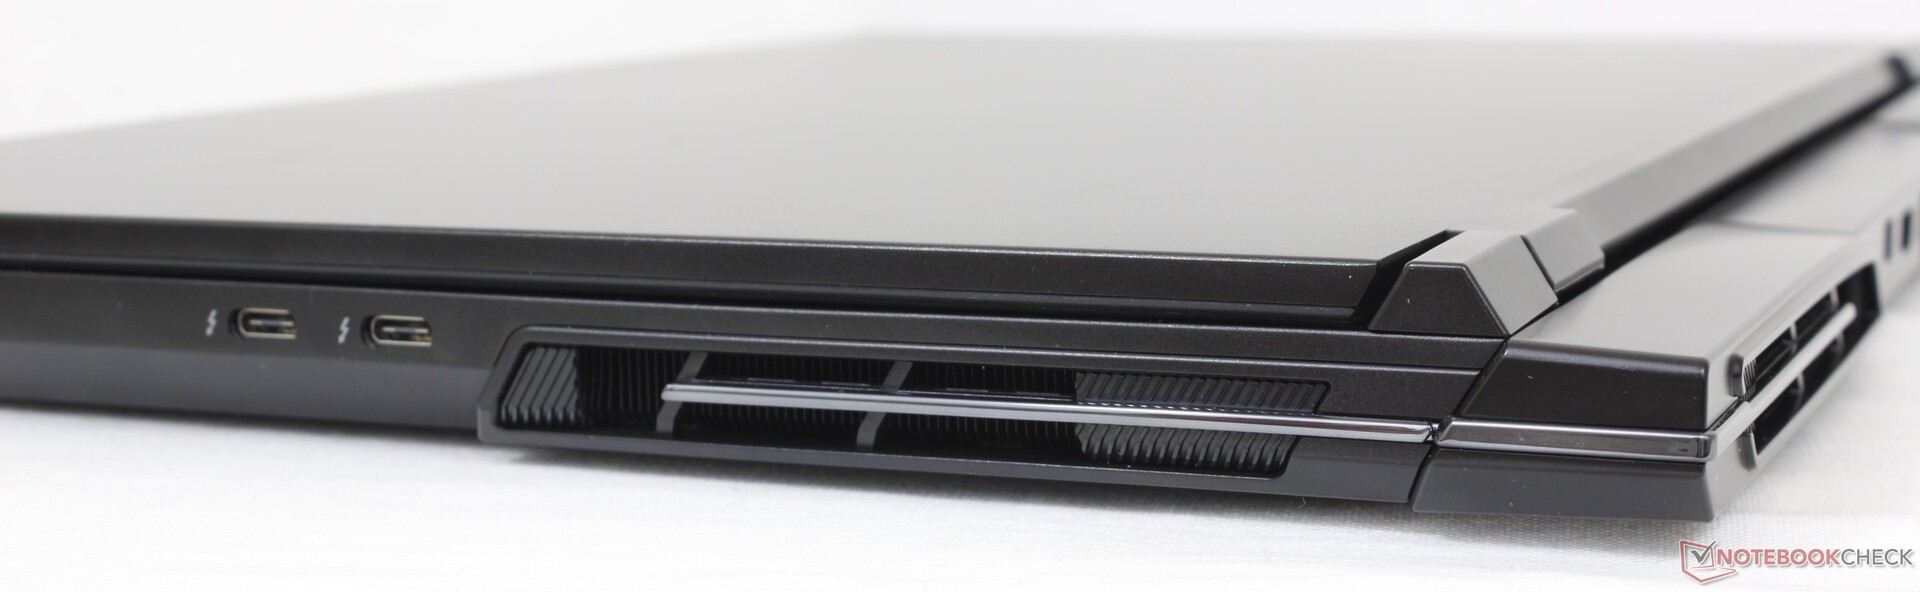
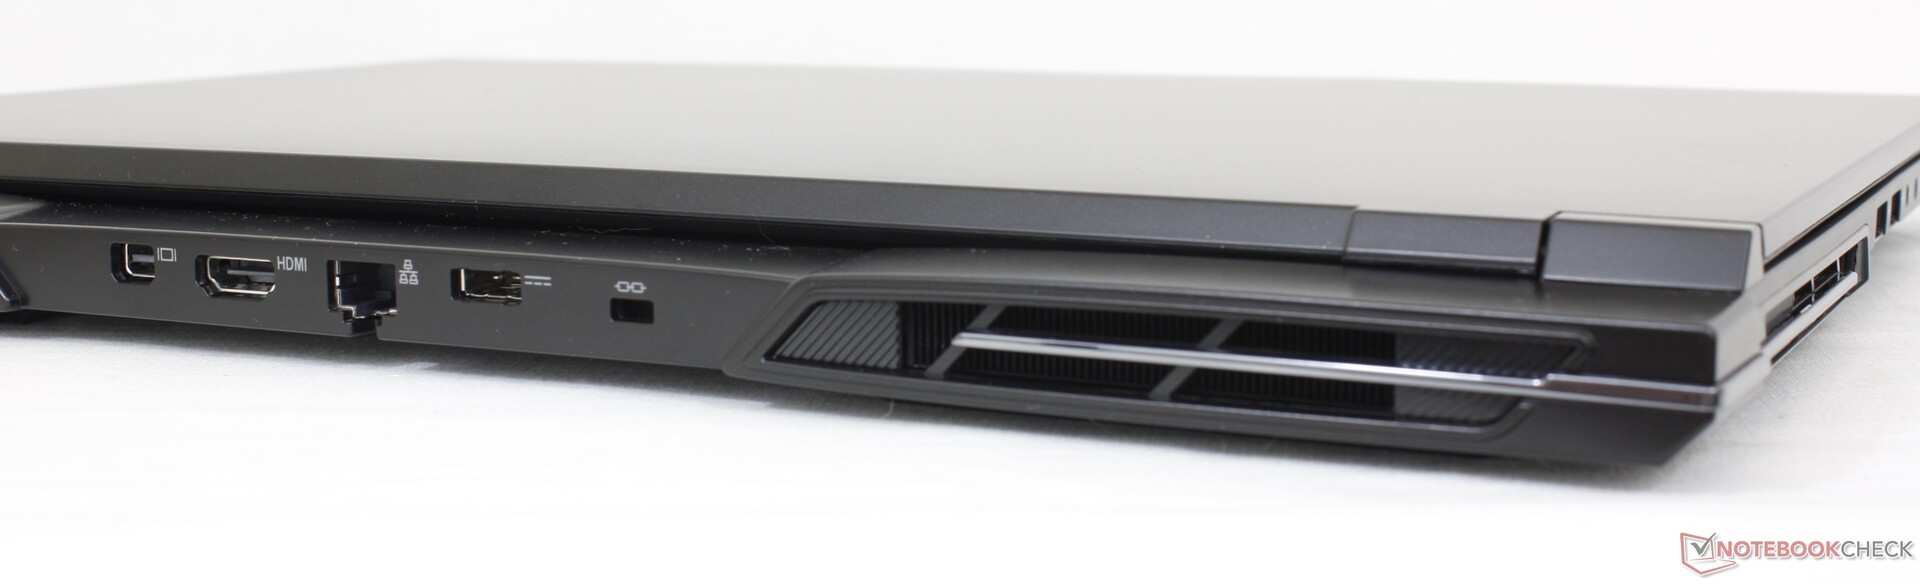
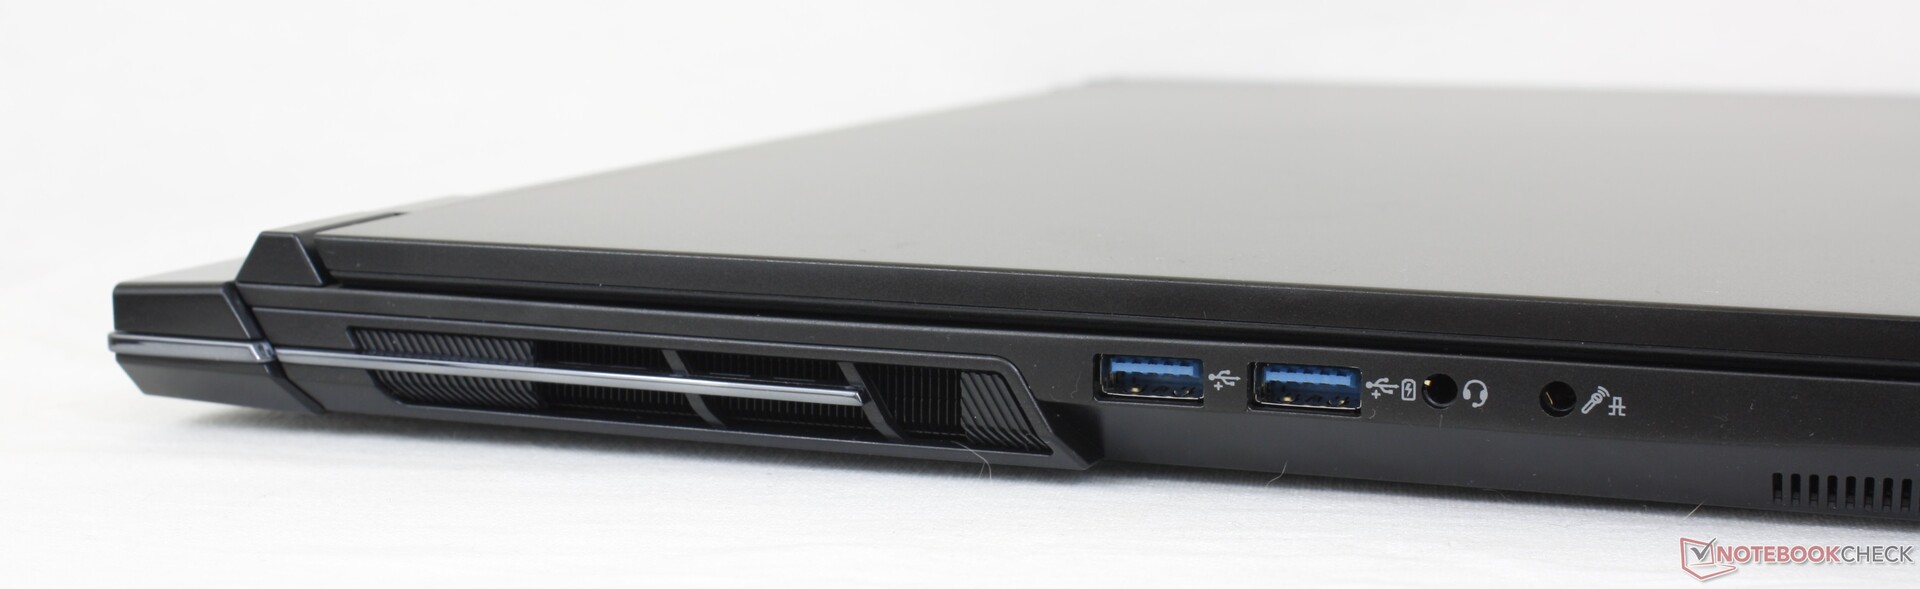
Uppkoppling - lite av varje
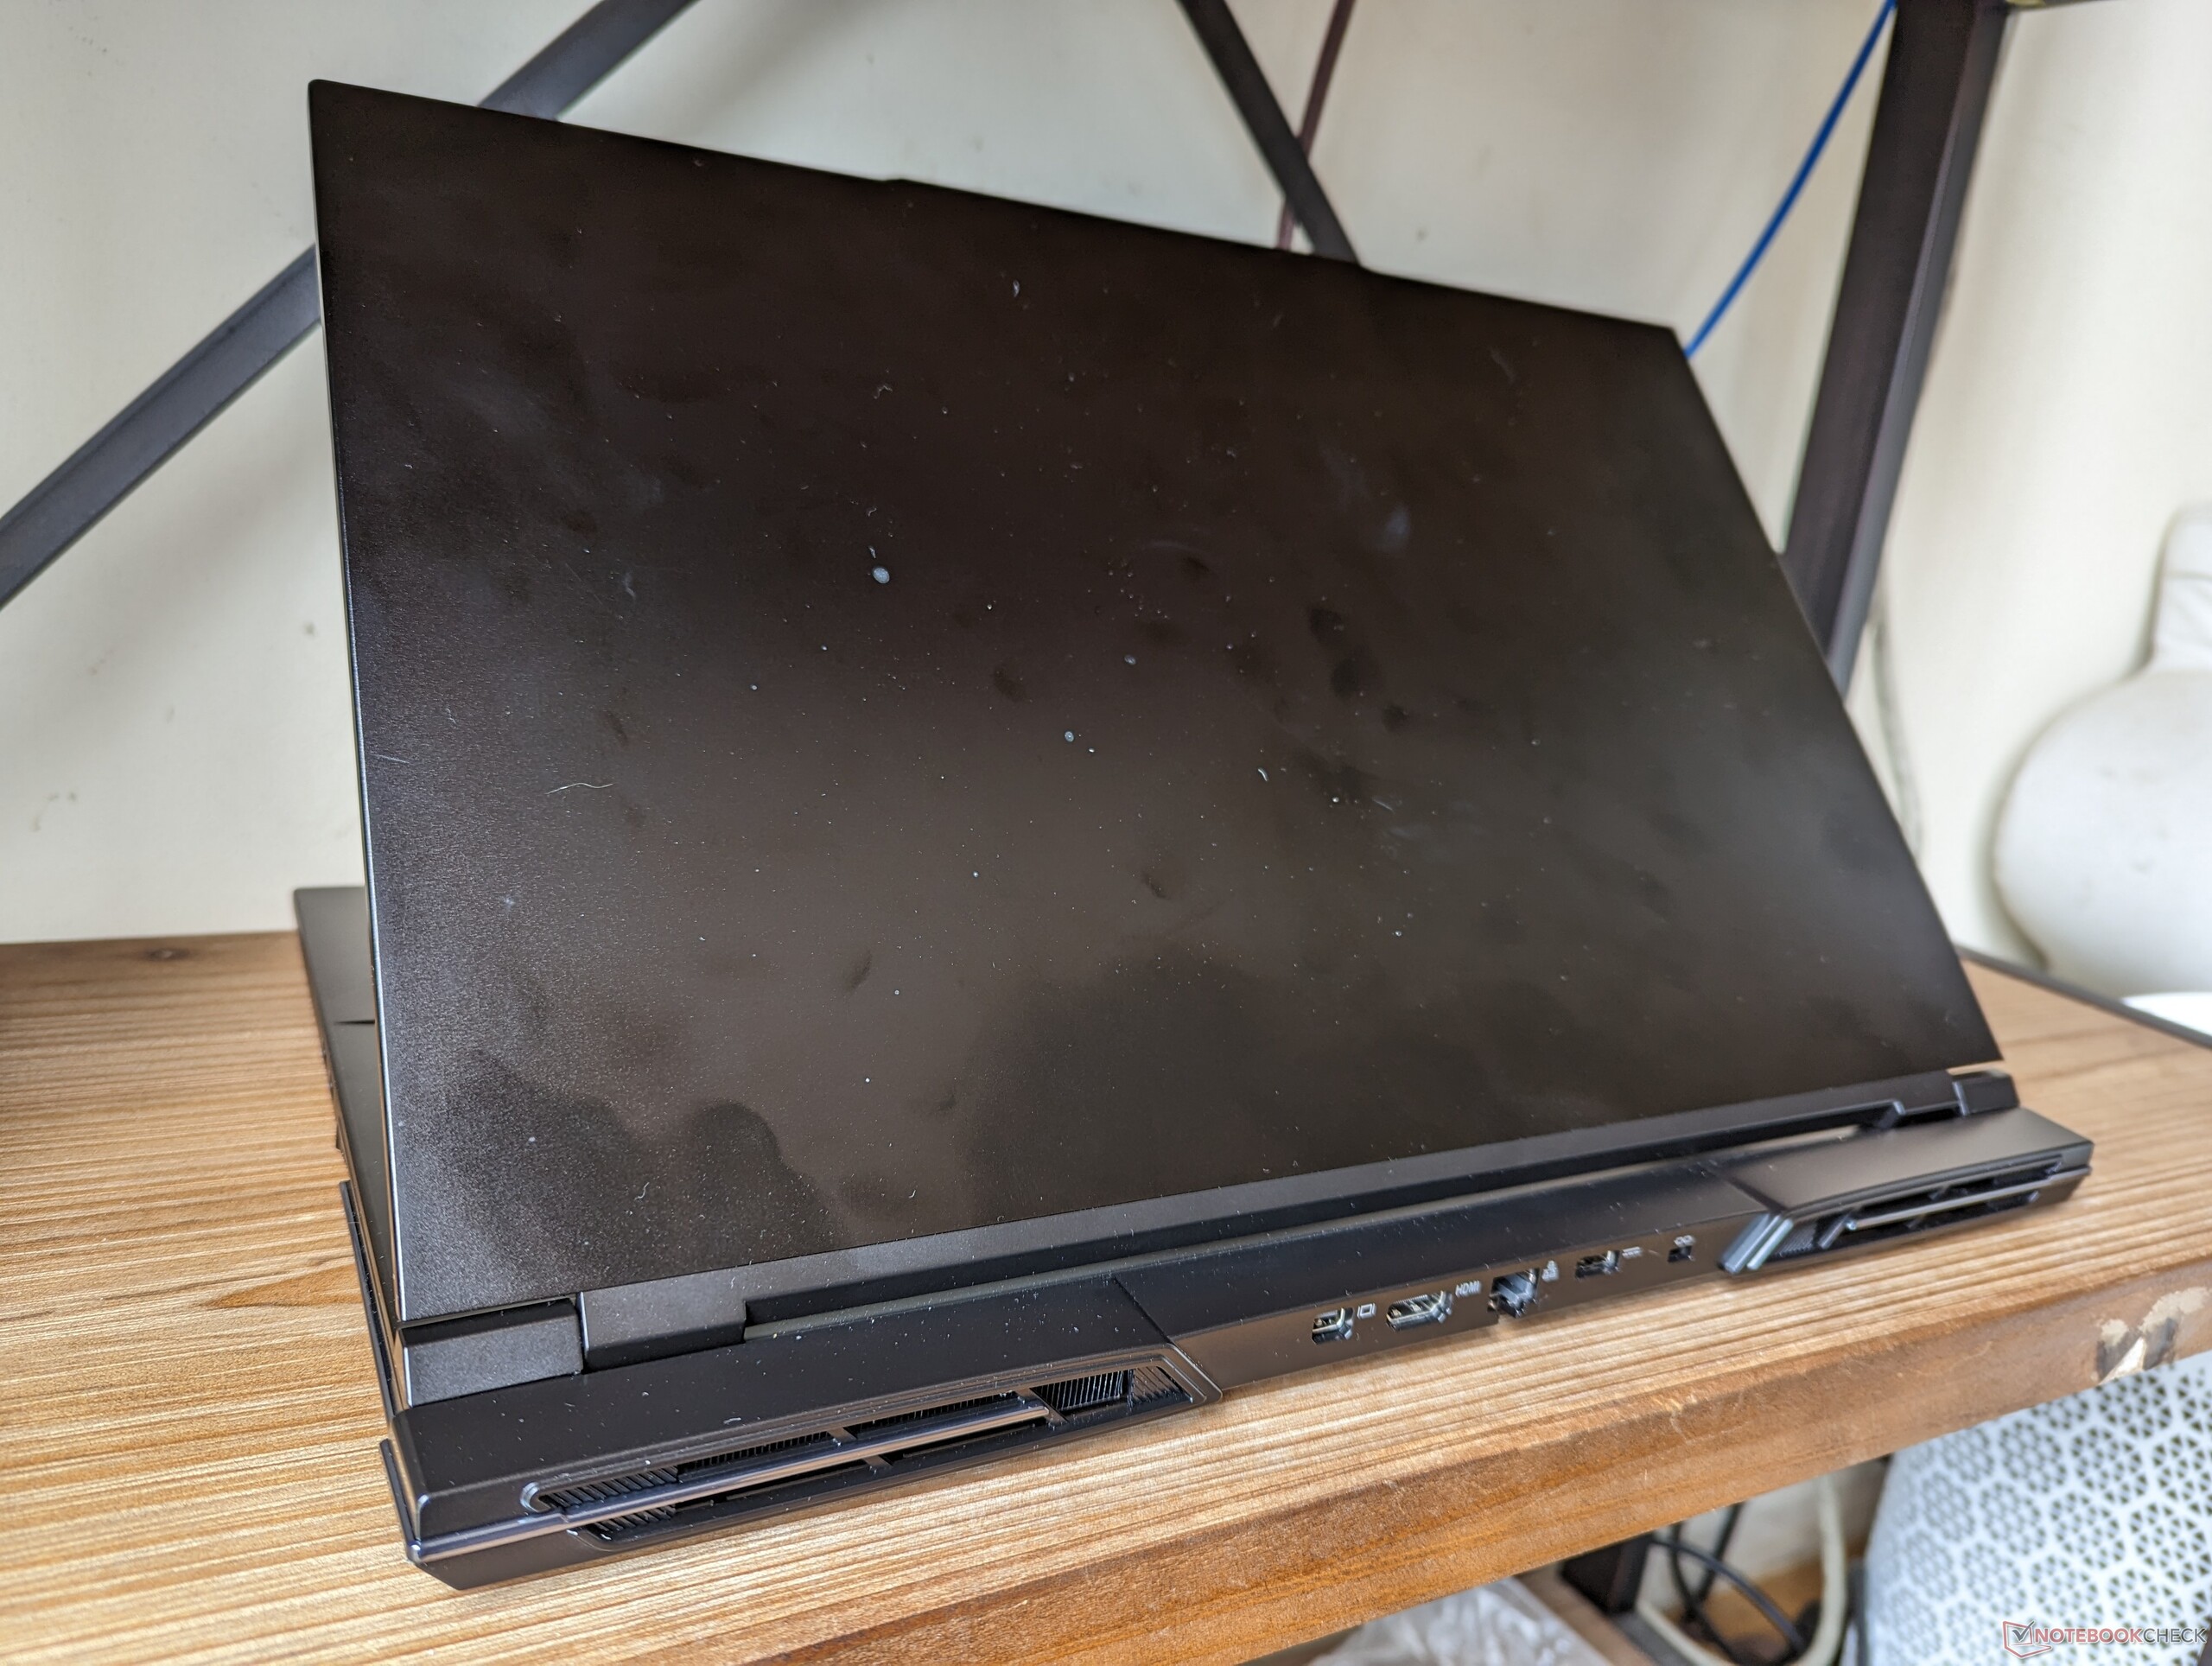
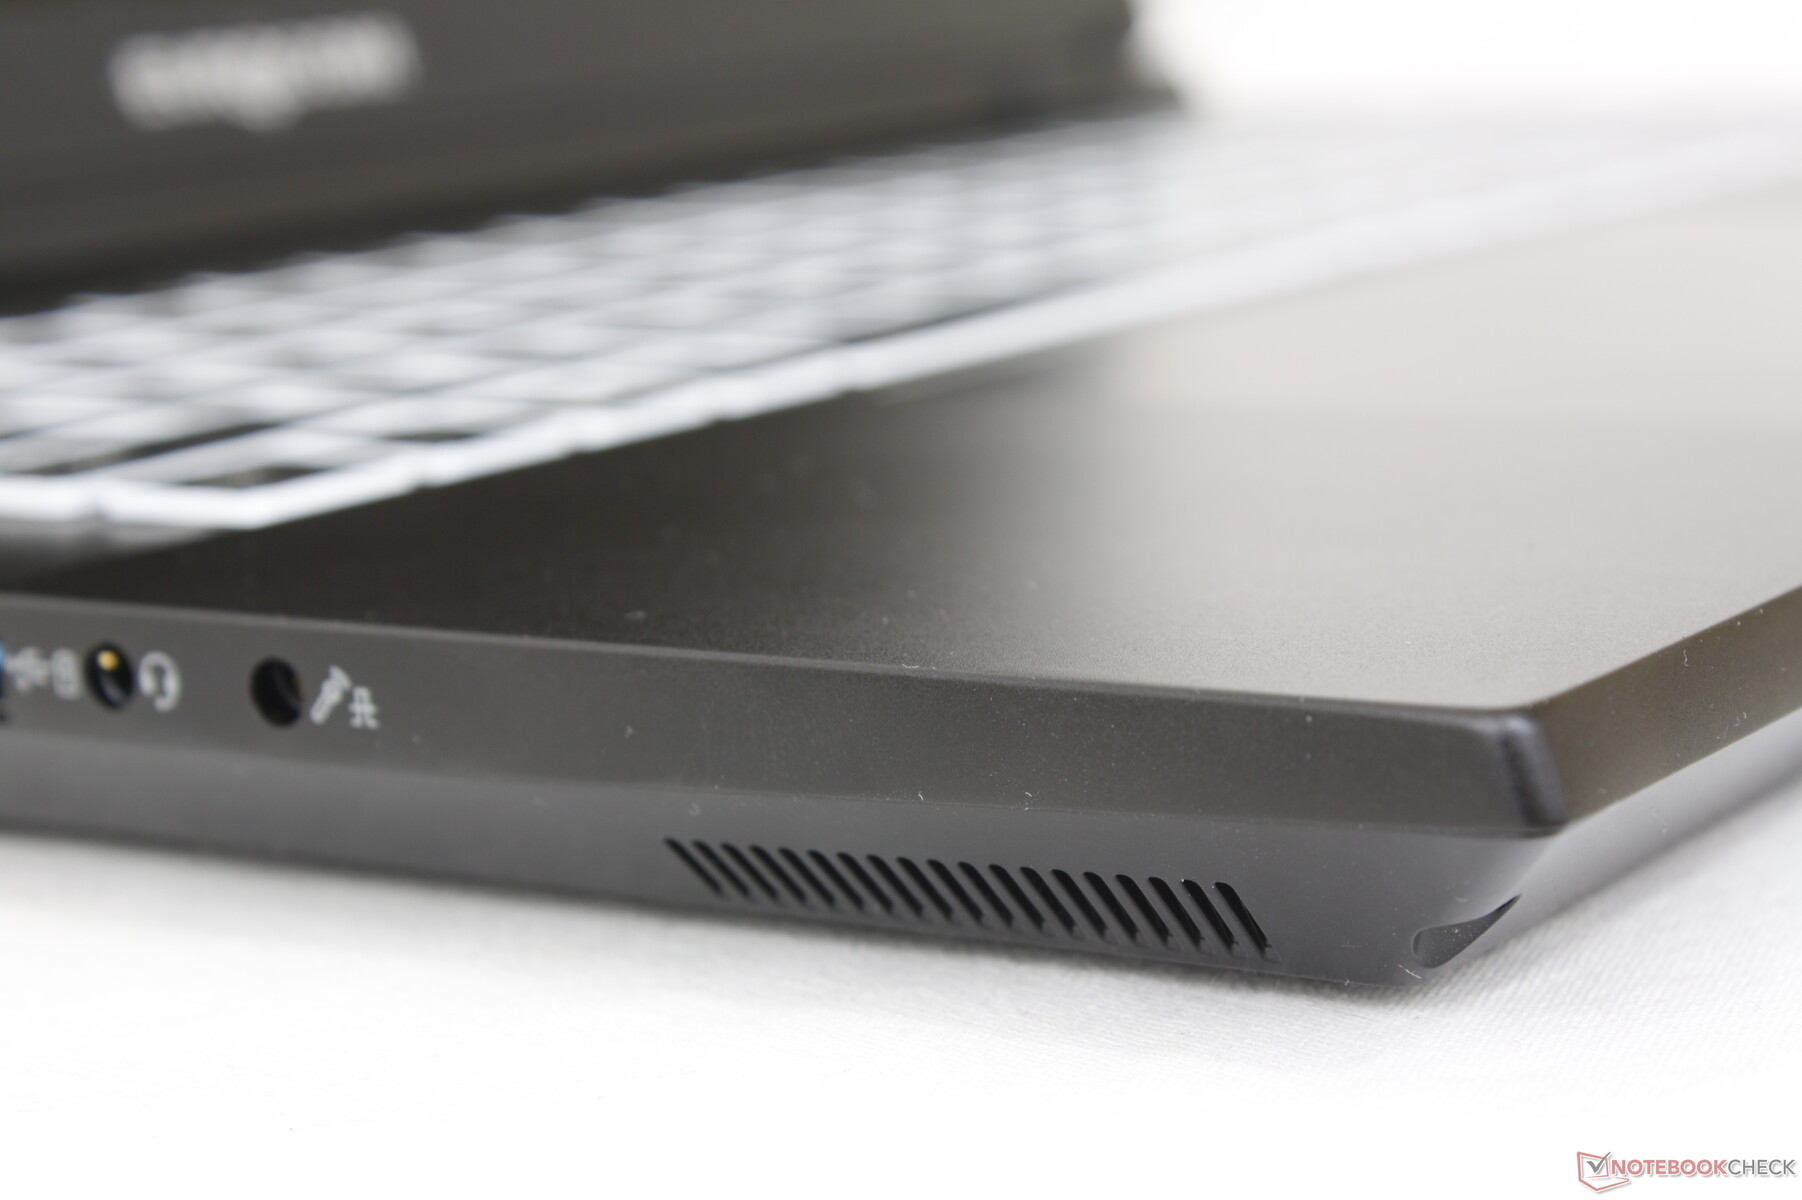
Portalternativen är mer varierade än på de flesta andra bärbara 17-tums gamingdatorer. Det är till exempel ovanligt att hitta en modell med både mini DisplayPort och RJ-45. Alla USB-portar finns längs sidorna av chassit medan baksidan rymmer nästan allt annat.
Kommunikation
| Networking | |
| iperf3 transmit AXE11000 | |
| Aorus 17X AZF | |
| Eluktronics Mech-17 GP2 | |
| MSI GE78HX 13VH-070US | |
| Eurocom Raptor X17 | |
| Alienware m17 R5 (R9 6900HX, RX 6850M XT) | |
| Asus ROG Strix Scar 17 G733PY-XS96 | |
| iperf3 receive AXE11000 | |
| Aorus 17X AZF | |
| Eluktronics Mech-17 GP2 | |
| Asus ROG Strix Scar 17 G733PY-XS96 | |
| MSI GE78HX 13VH-070US | |
| Eurocom Raptor X17 | |
| Alienware m17 R5 (R9 6900HX, RX 6850M XT) | |
| iperf3 transmit AXE11000 6GHz | |
| Asus ROG Strix Scar 17 G733PY-XS96 | |
| MSI GE78HX 13VH-070US | |
| Eurocom Raptor X17 | |
| iperf3 receive AXE11000 6GHz | |
| MSI GE78HX 13VH-070US | |
| Asus ROG Strix Scar 17 G733PY-XS96 | |
| Eurocom Raptor X17 | |
Webbkamera
Webbkameran på 2 MP är typisk för de flesta andra bärbara datorer oavsett pris. IR är åtminstone inbyggd för stöd för Hello och det finns en elektronisk slutare för att skydda privatlivet. Förhoppningsvis kommer nästa generations modeller att integrera 5 MP-webbkameror, ungefär som på de senaste Razer Blade 18.

")
")
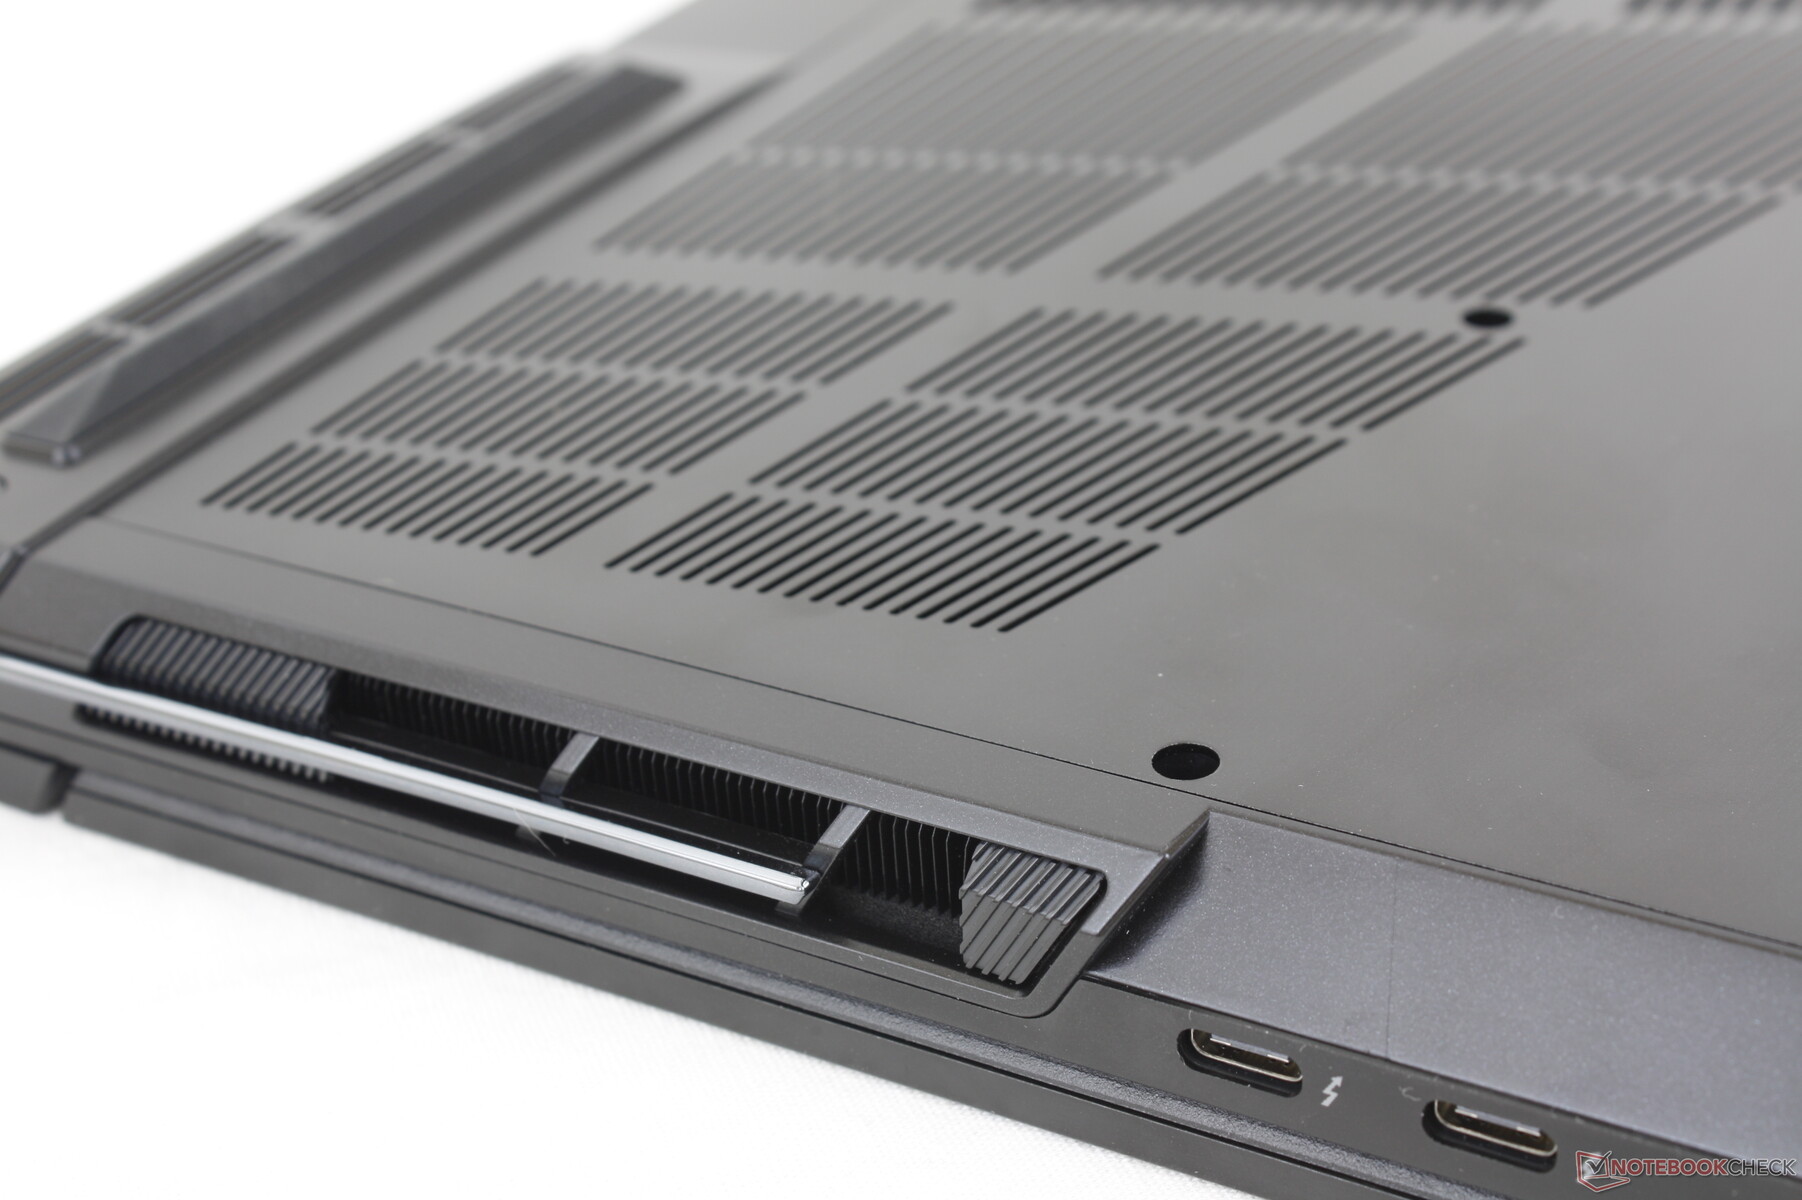
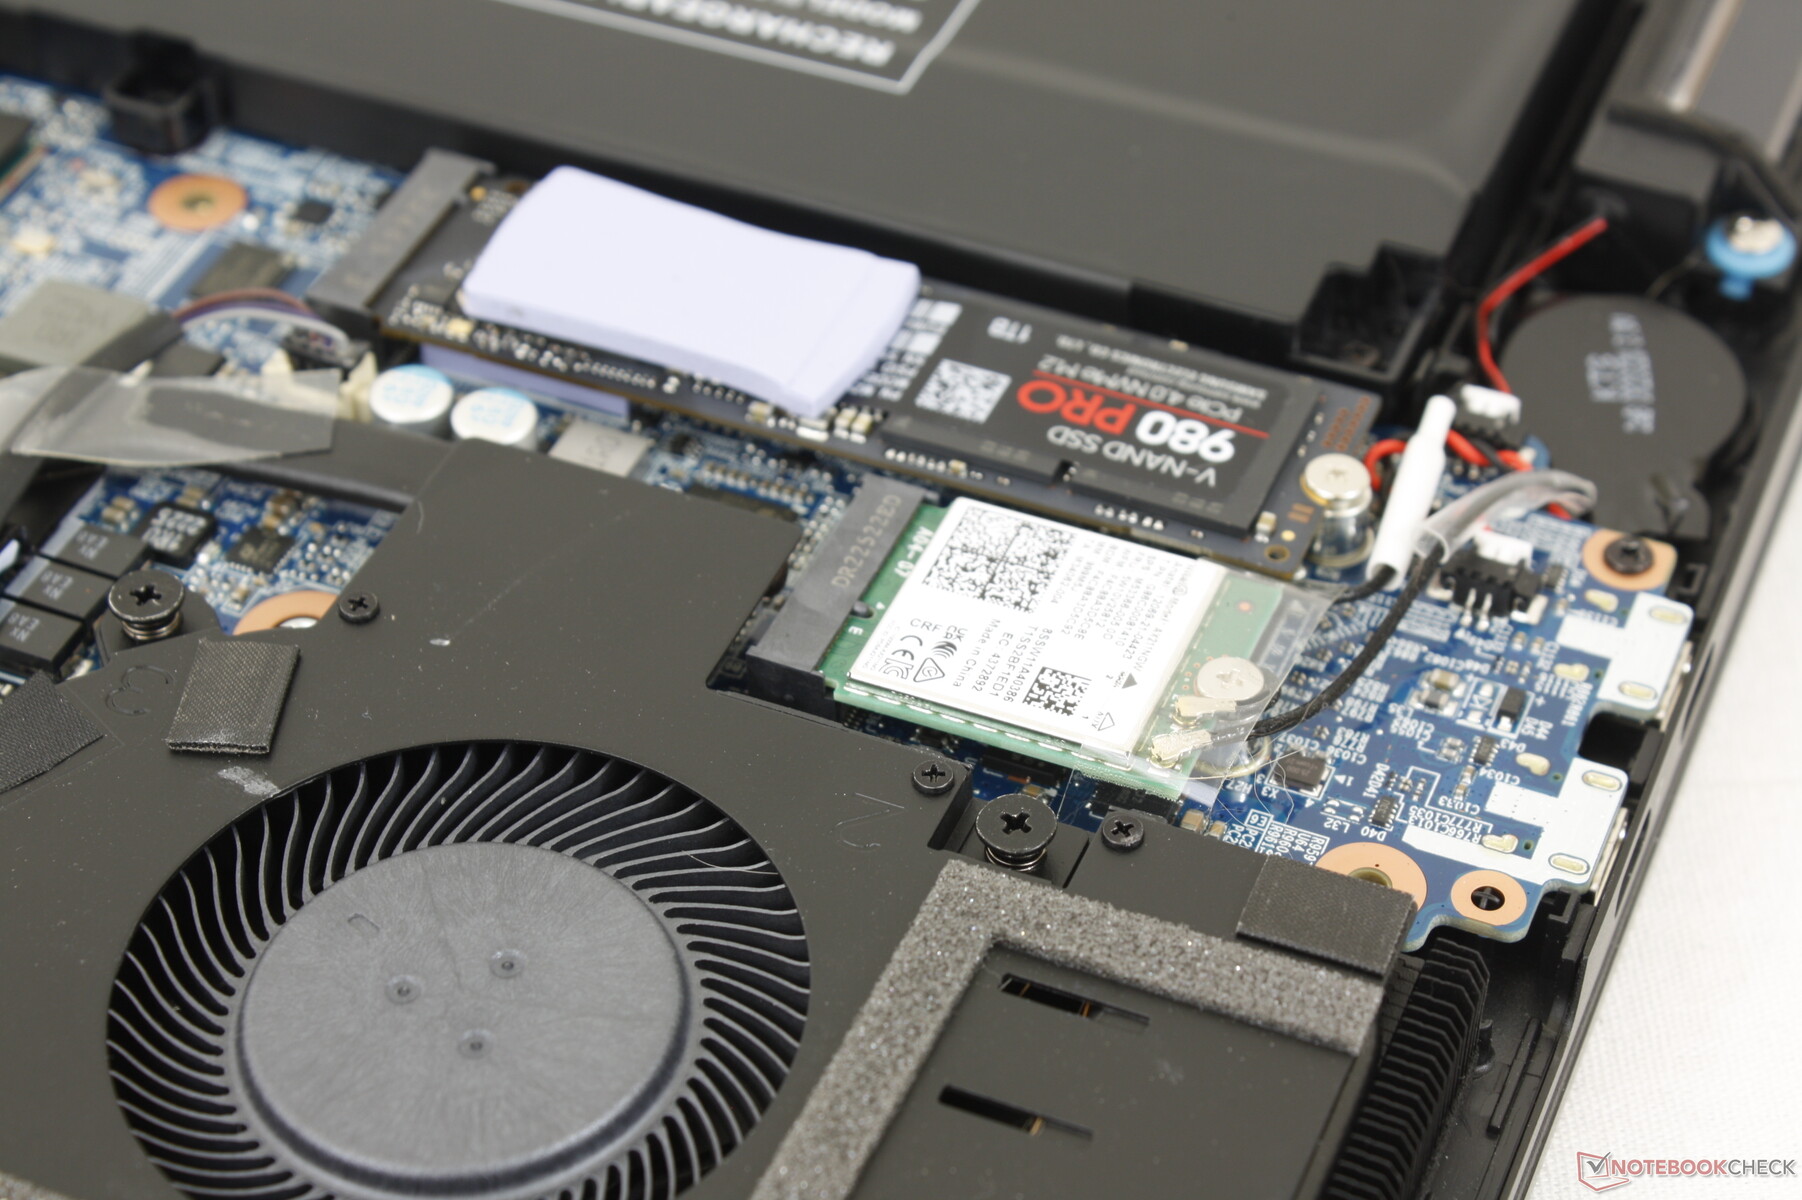
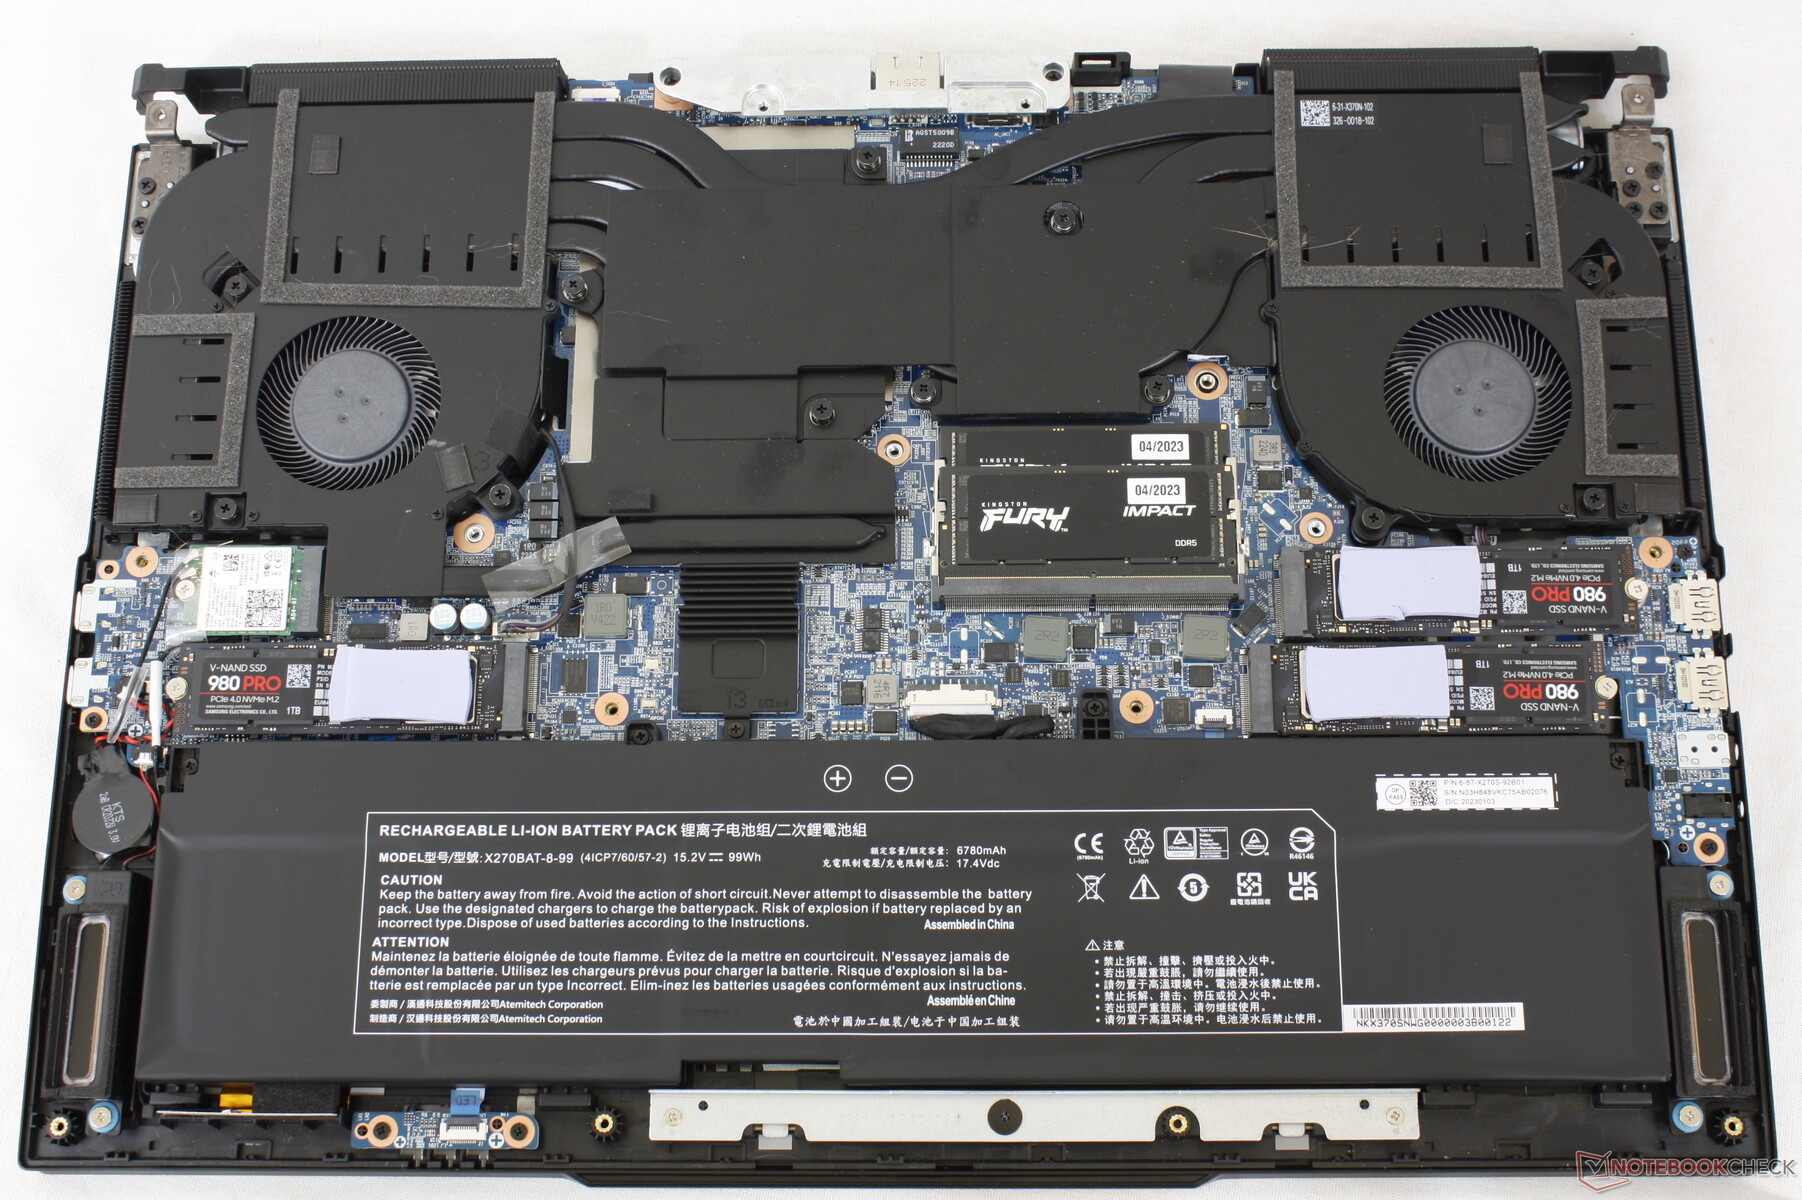
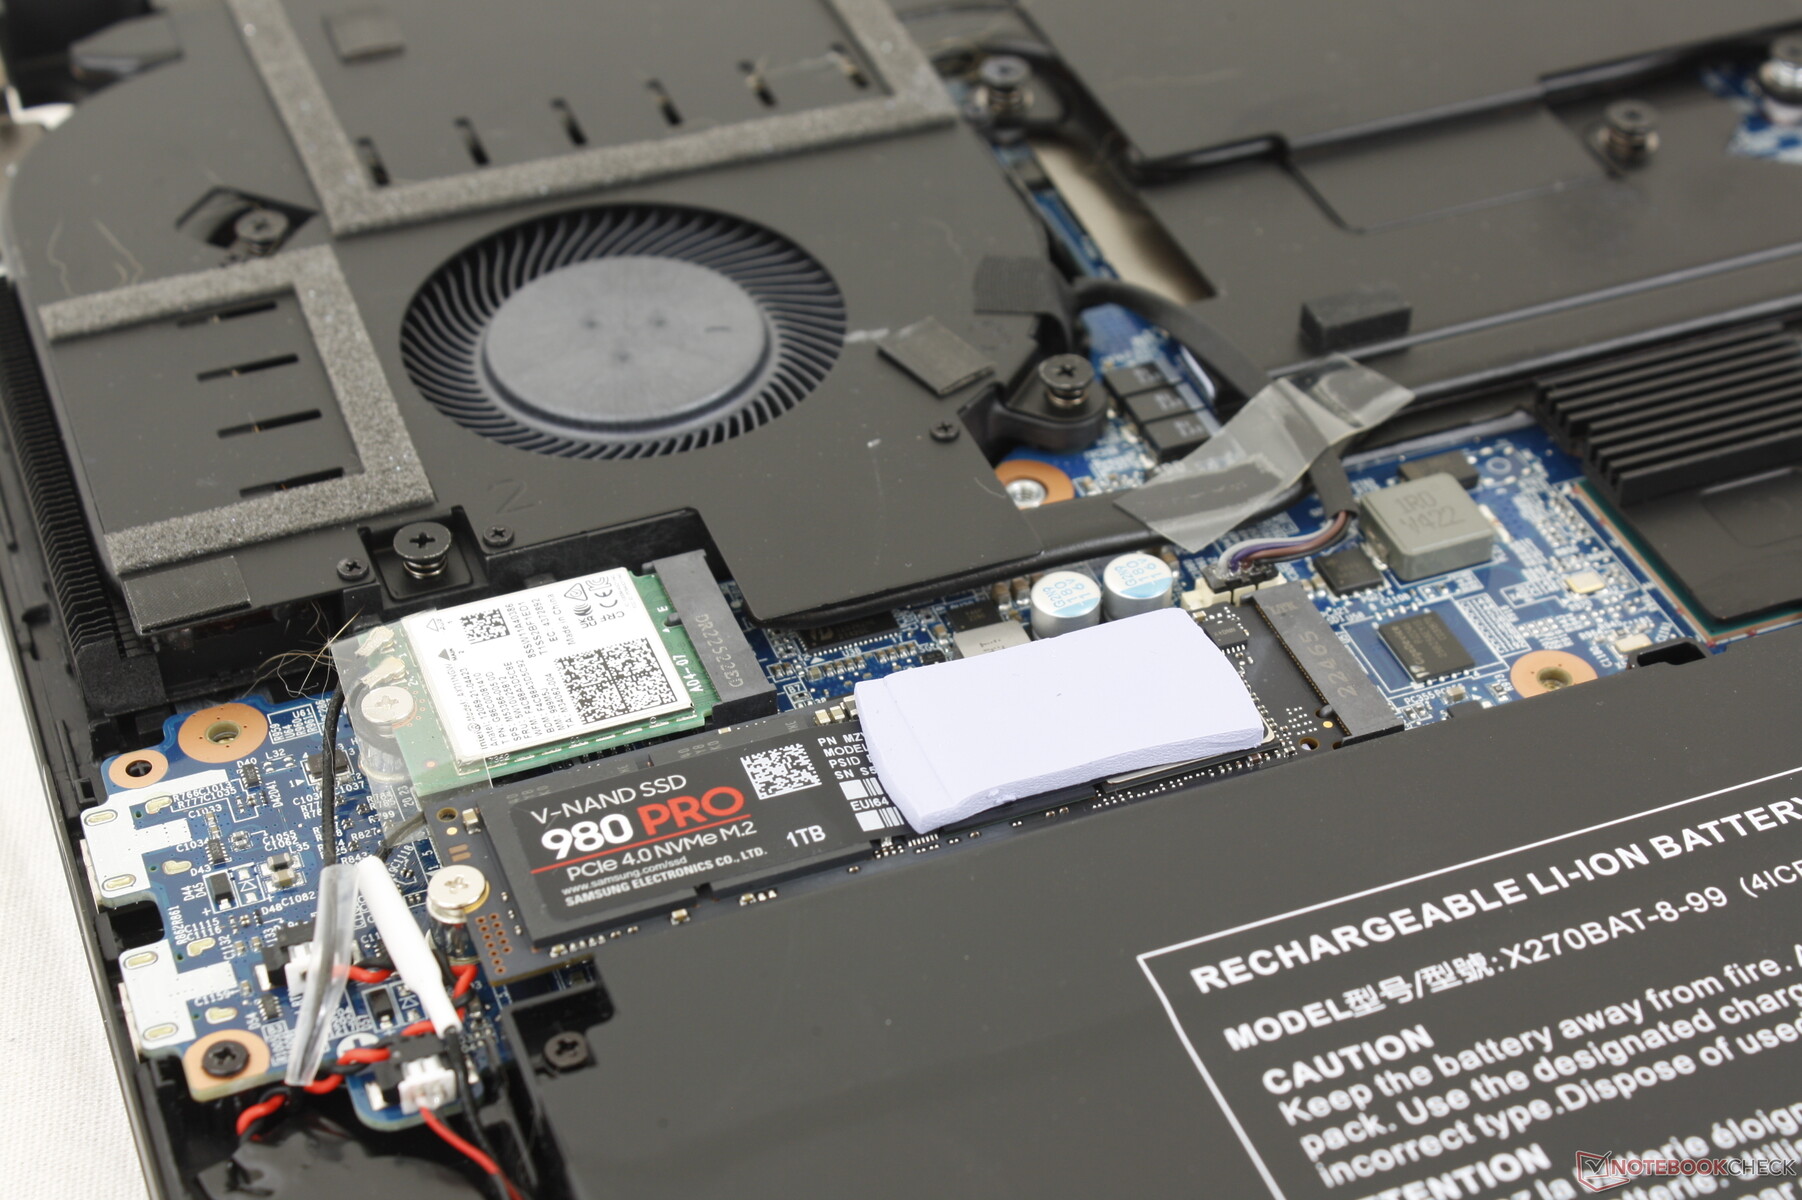
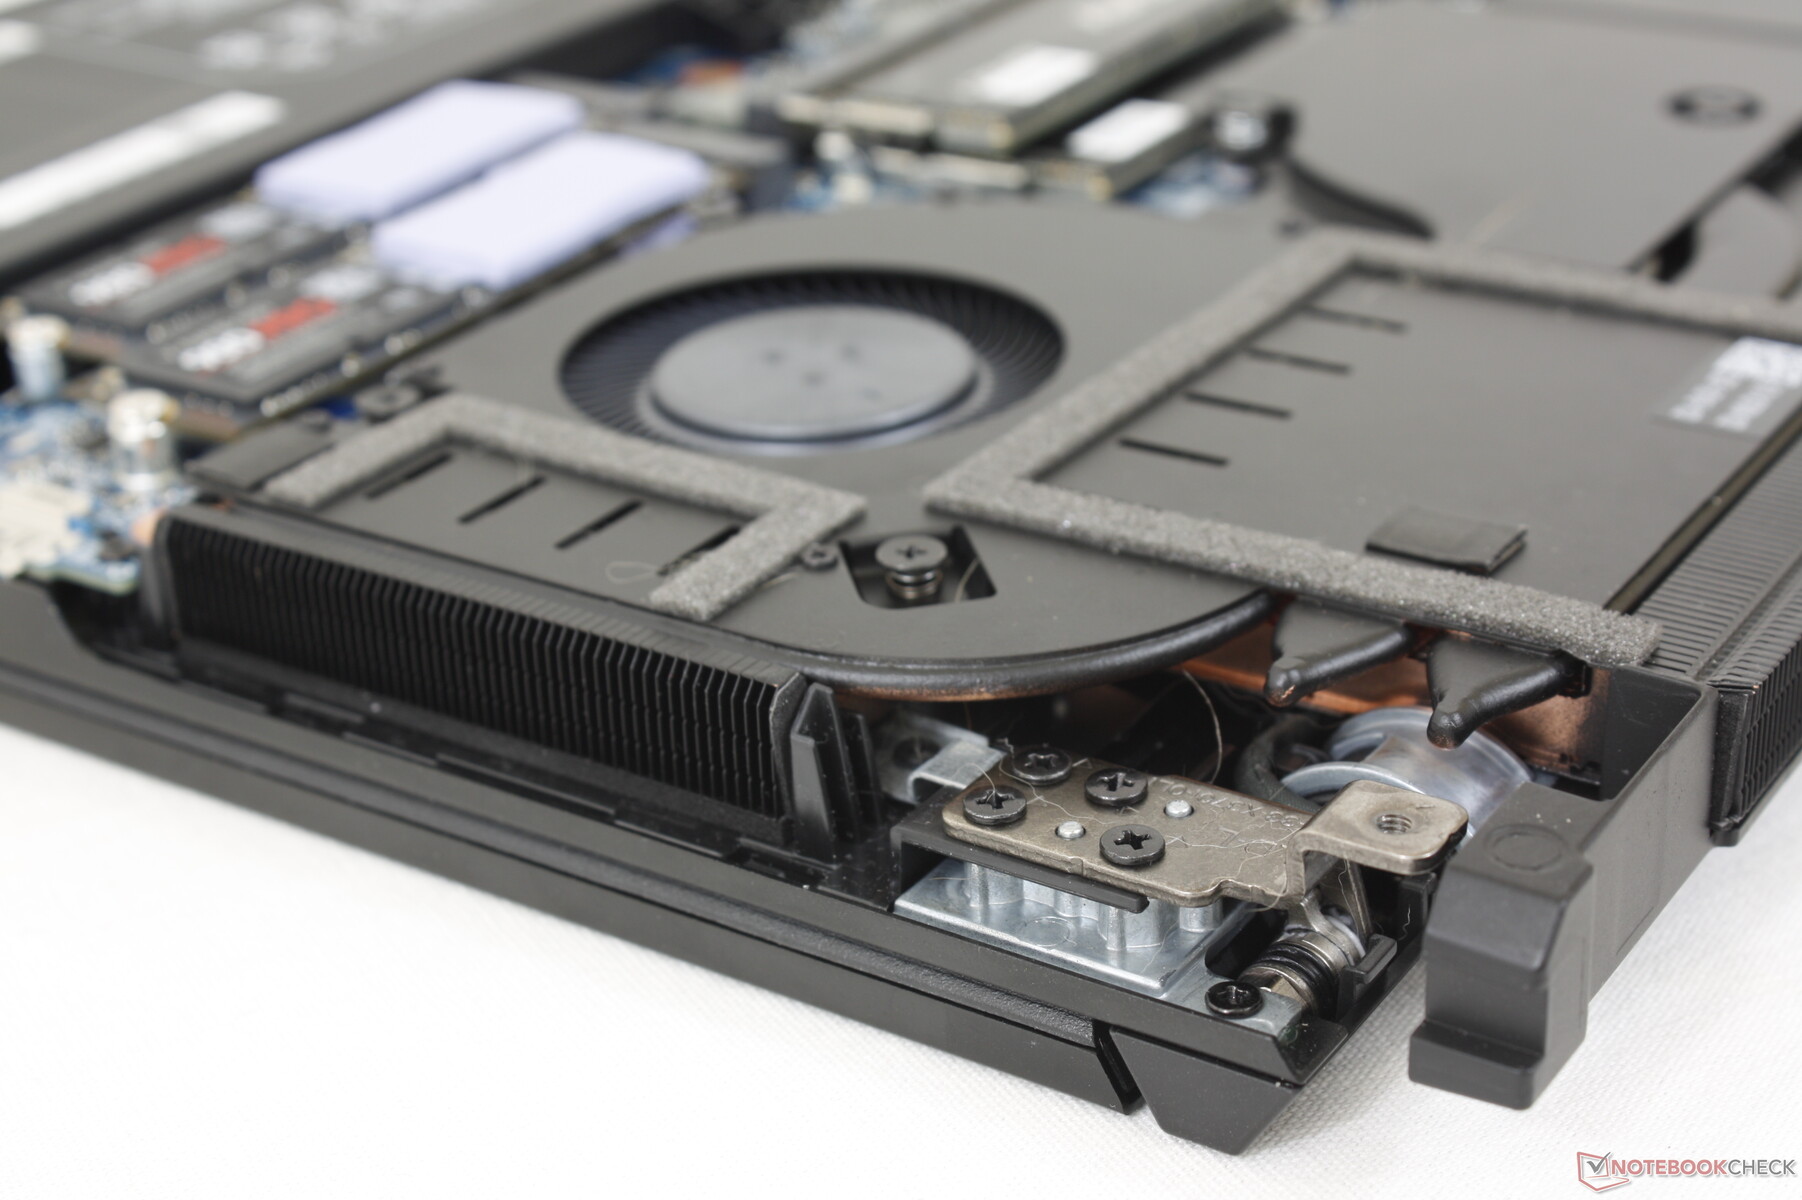
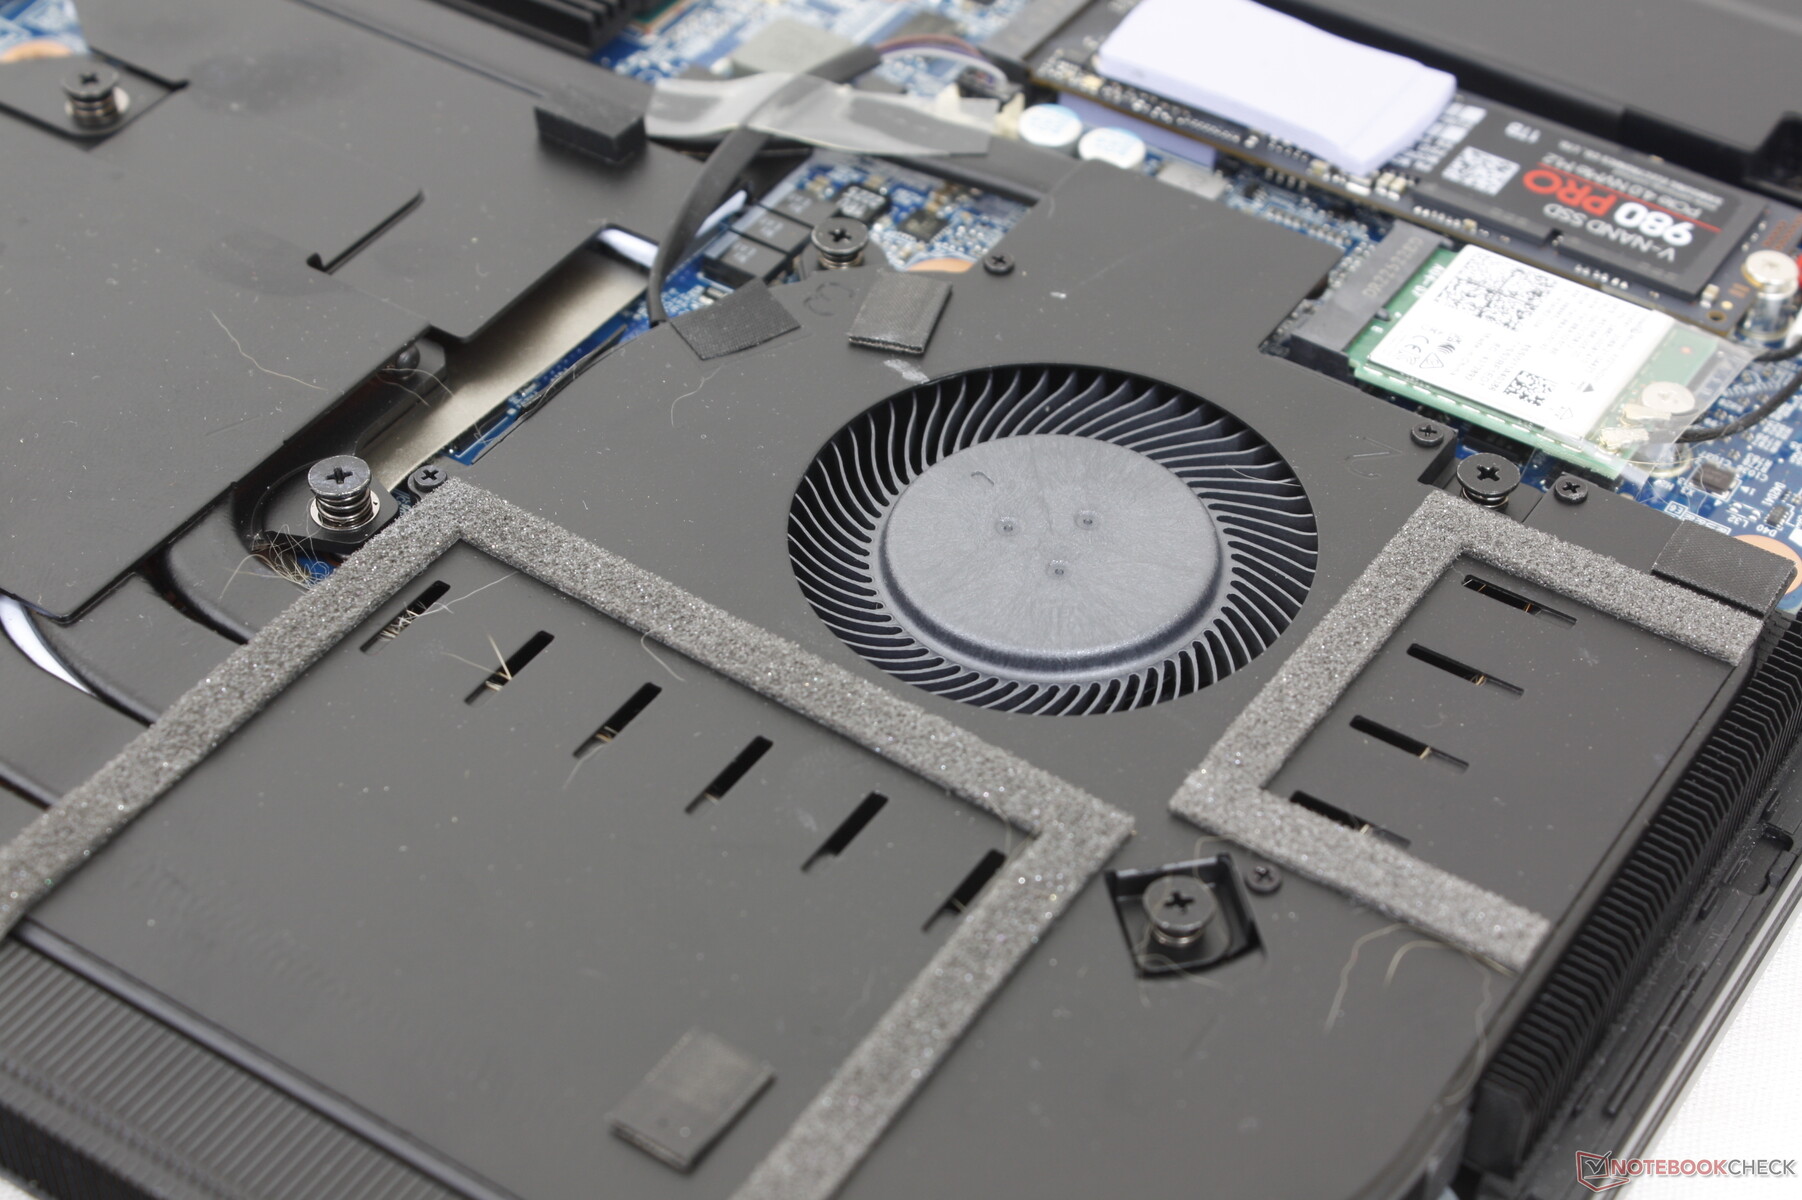
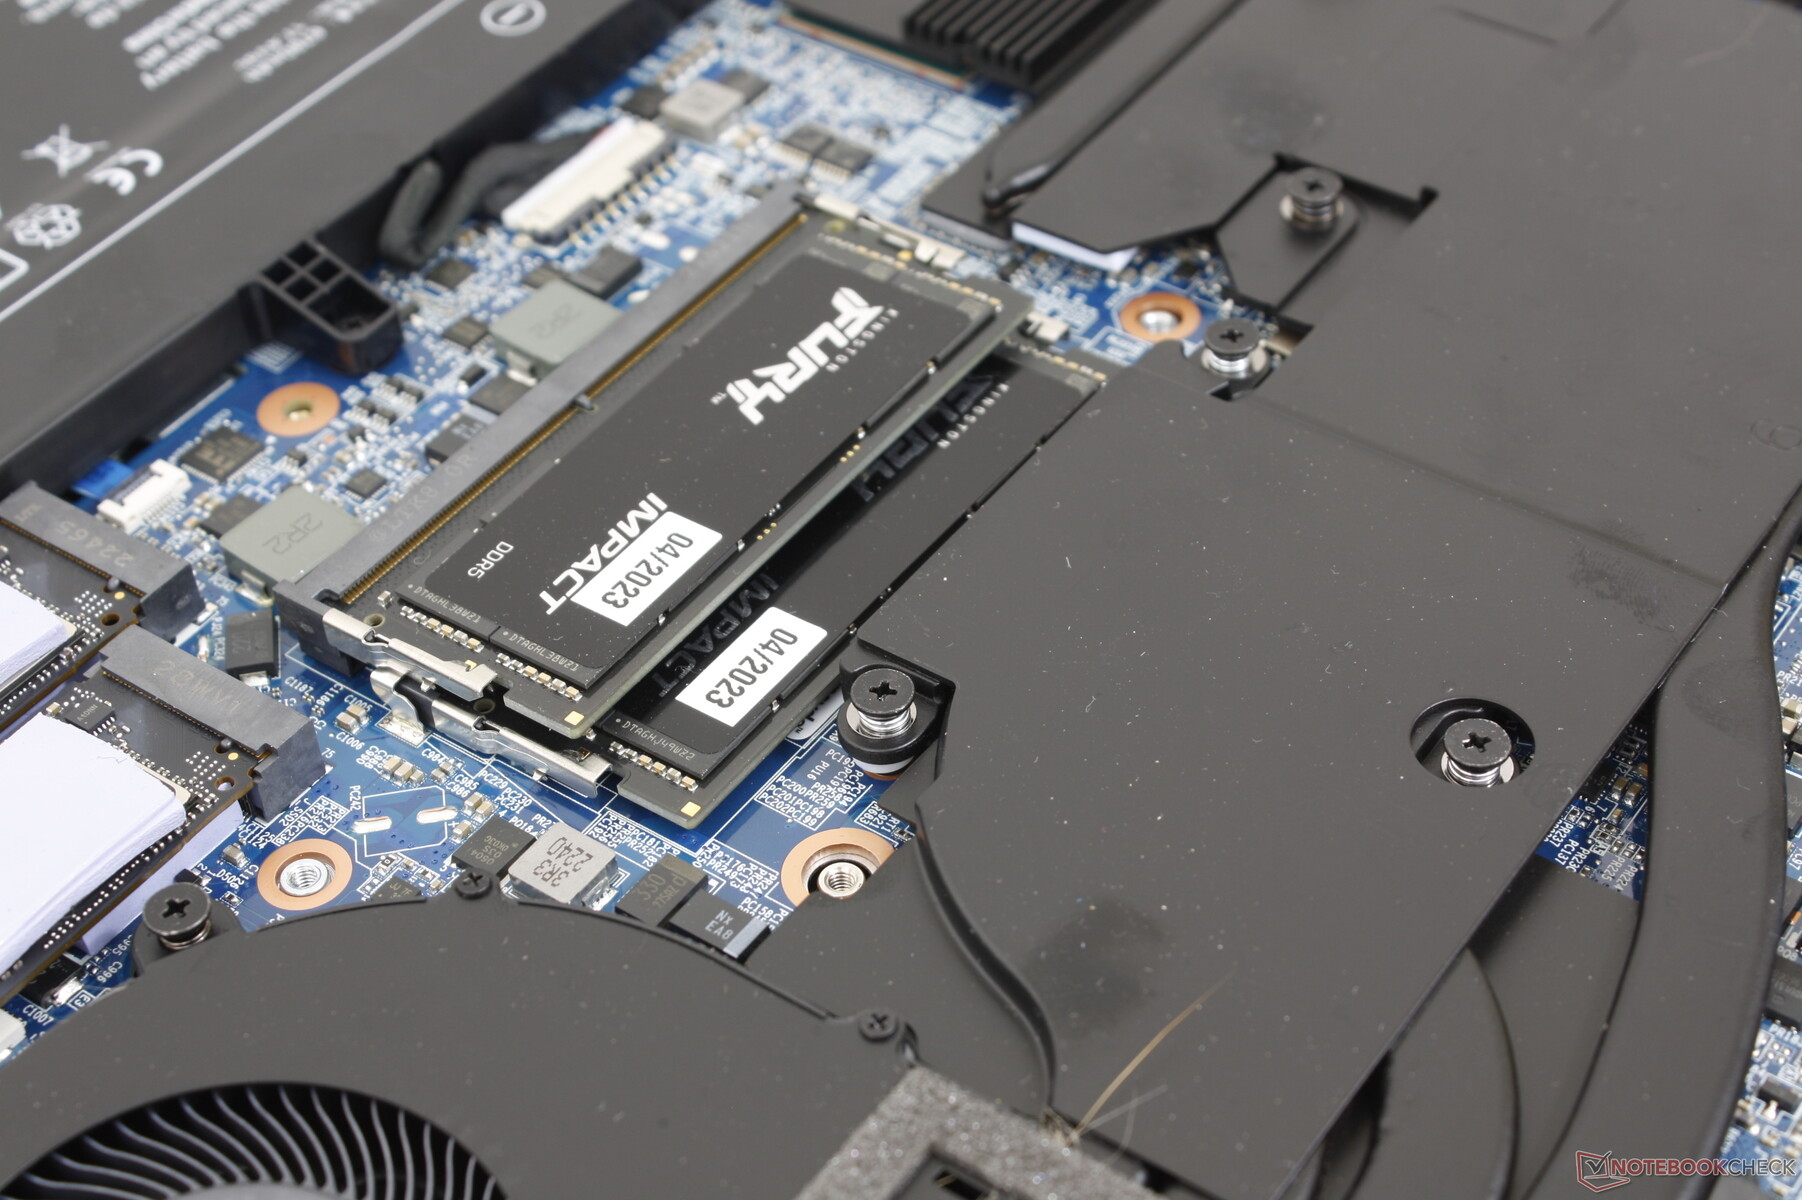
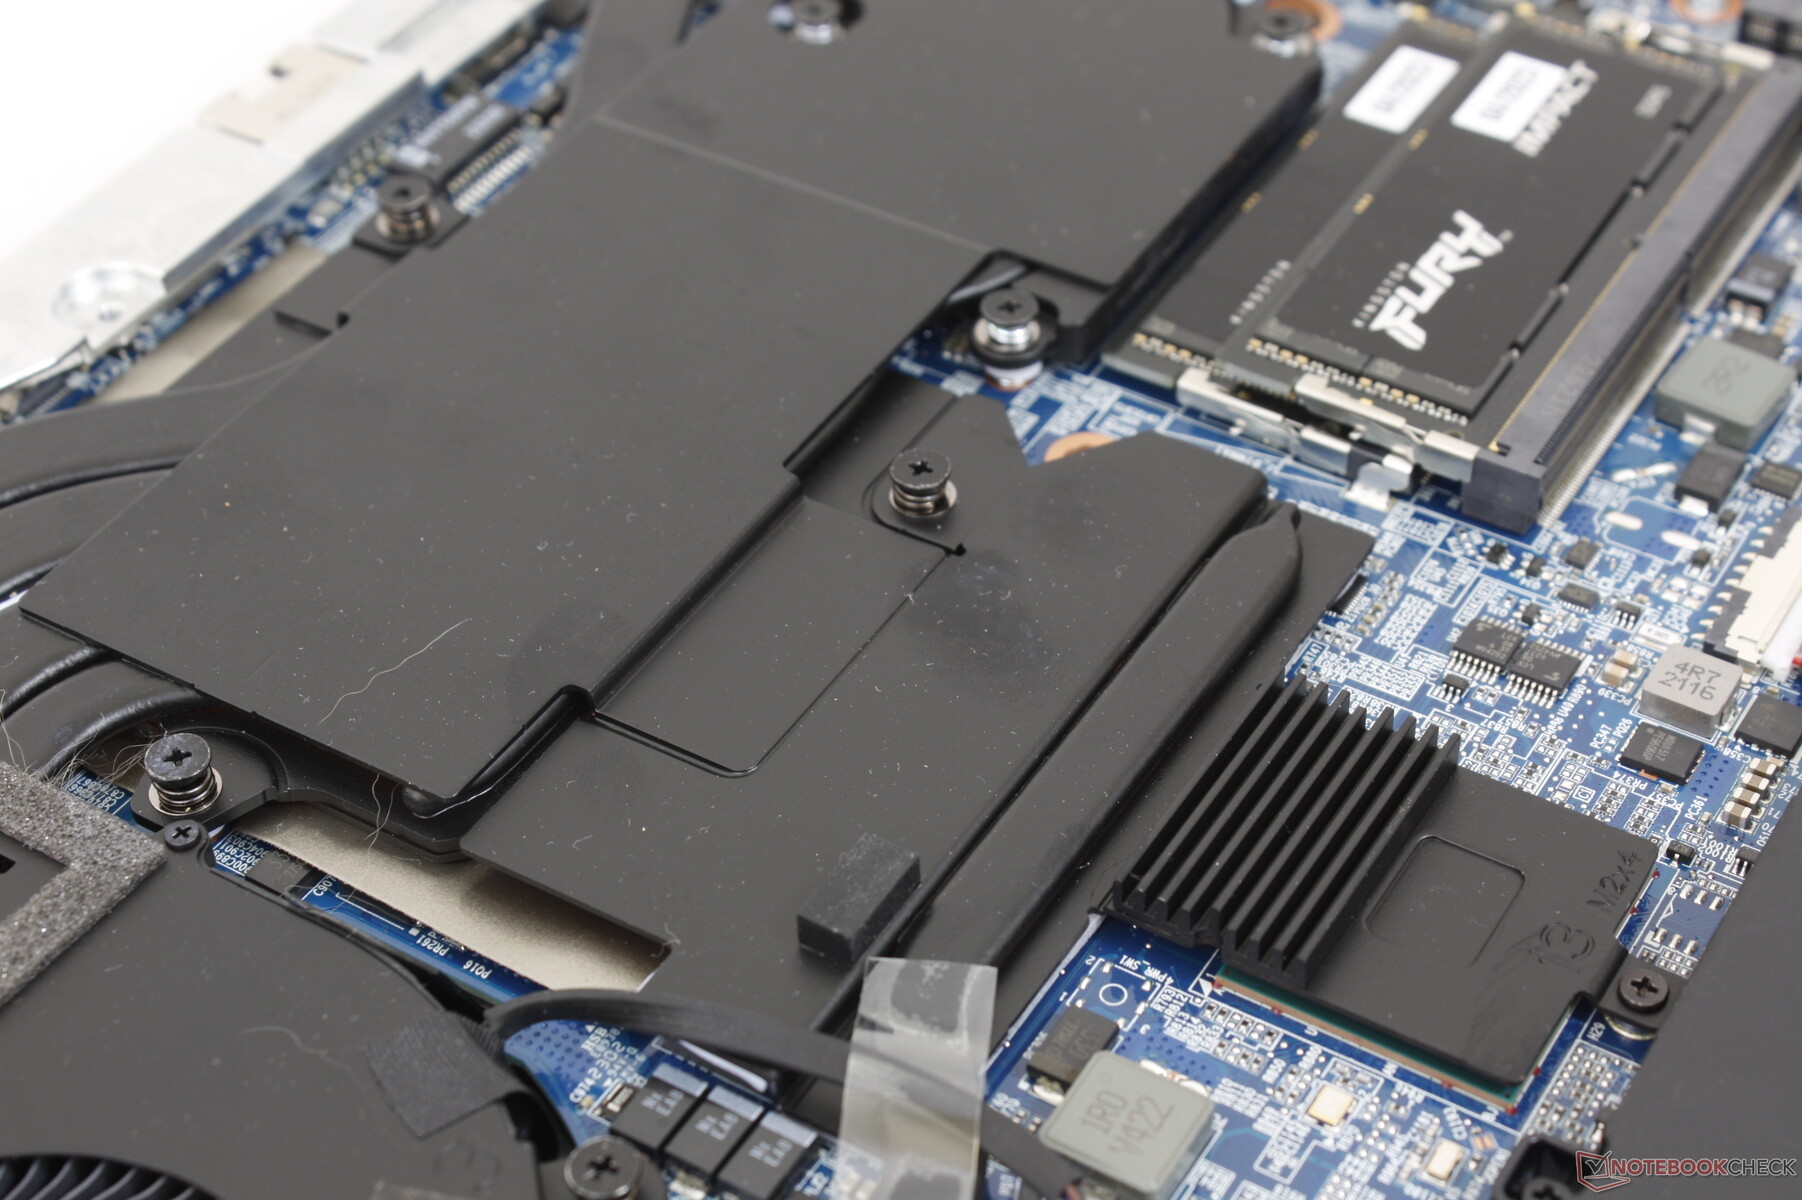
Underhåll
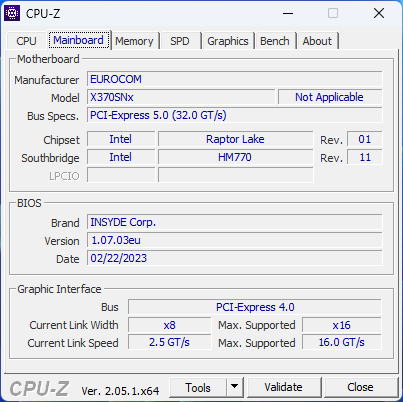
Bottenpanelen är säkrad med 16 Philips-skruvar för att det ska vara relativt enkelt att ta bort den. Väl inne har användaren tillgång till den avtagbara WLAN-modulen, 2x SODIMM-platser och 3x PCIe4 x4 M.2 2280-platser. Systemet stöder inte PCIe5-hastigheter till skillnad från de senaste MSI GE- och GT-uppdateringarna.
Tillbehör och garanti
I förpackningen ingår en cd med drivrutiner för enheten, ett USB-minne med Windows 11-drivrutiner och en sammetstork, förutom de vanliga papperen och nätadaptern. Den begränsade standardgarantin på ett år gäller med möjlighet till förlängning upp till tre år.
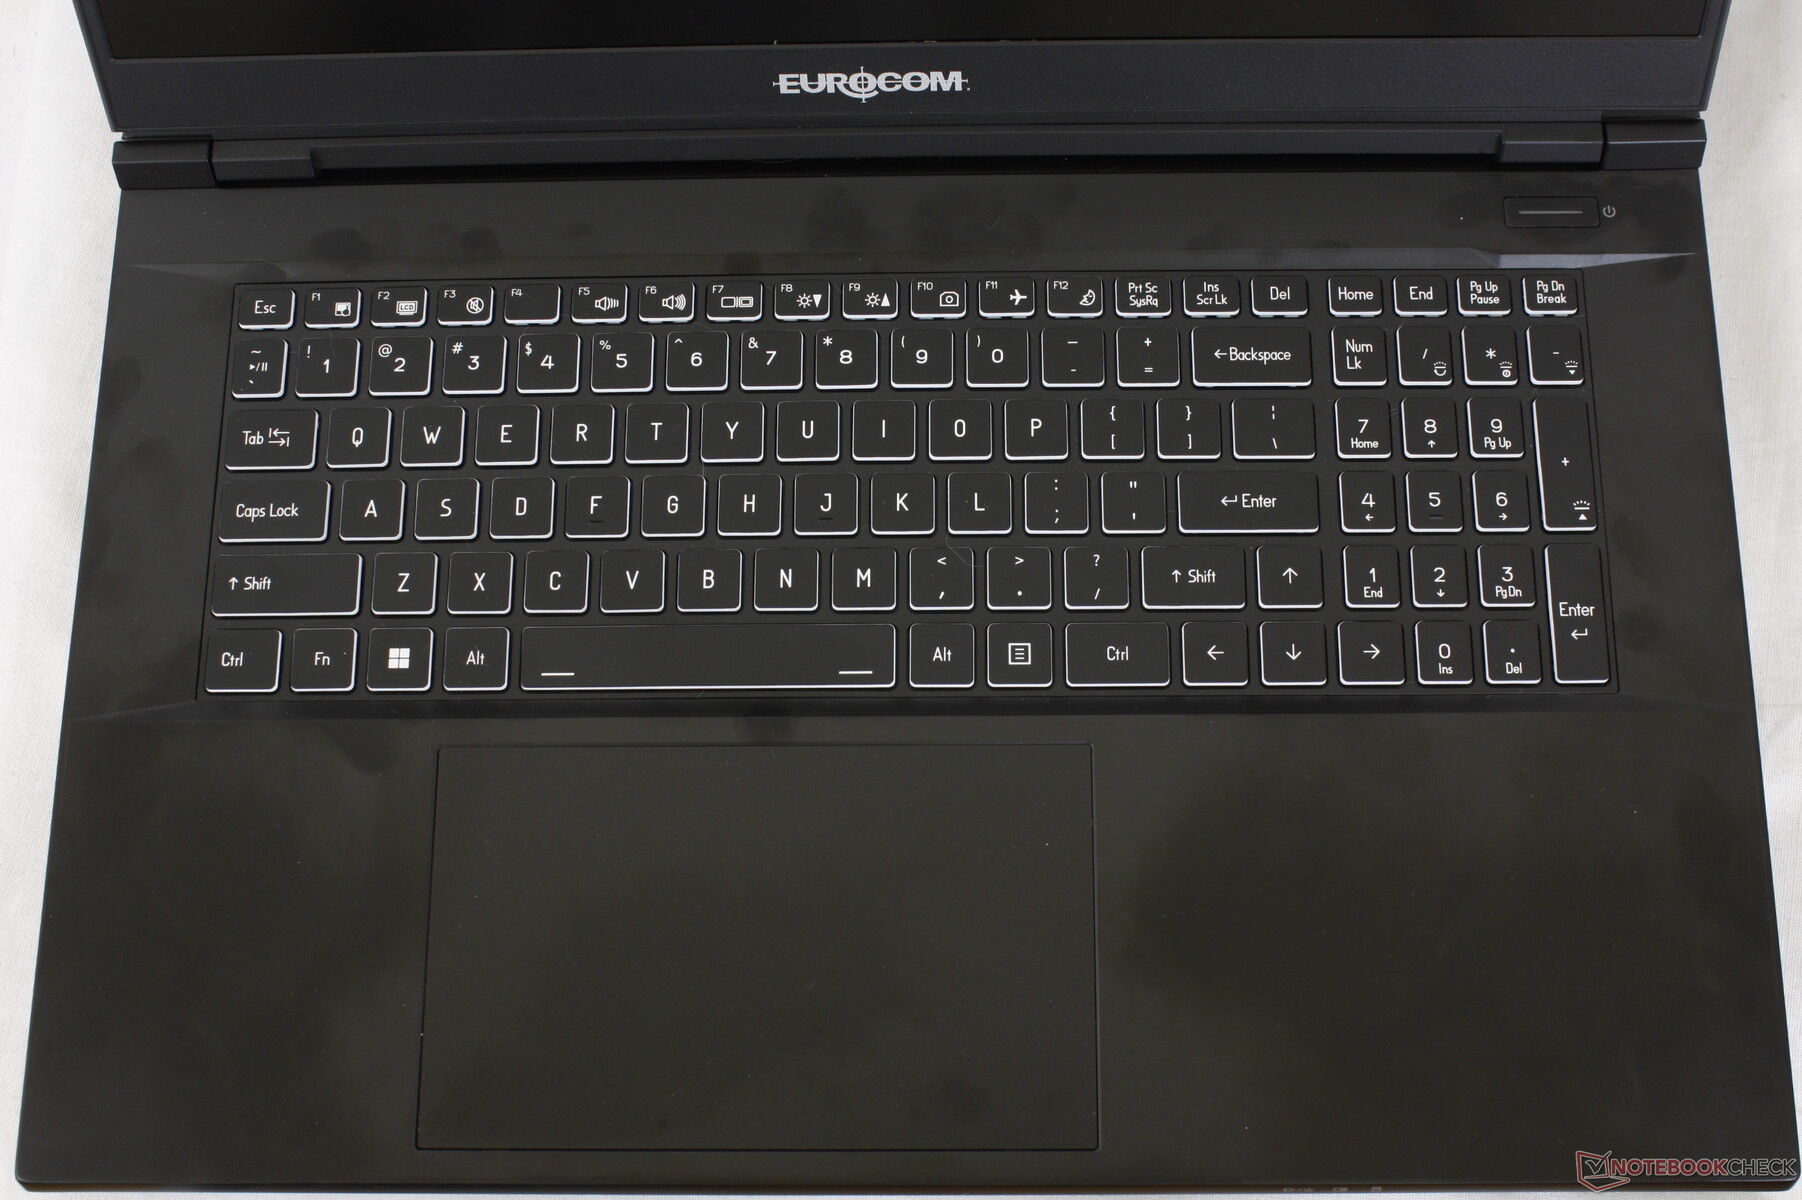
Inmatningsenheter - Traditionell Eurocom
Tangentbord
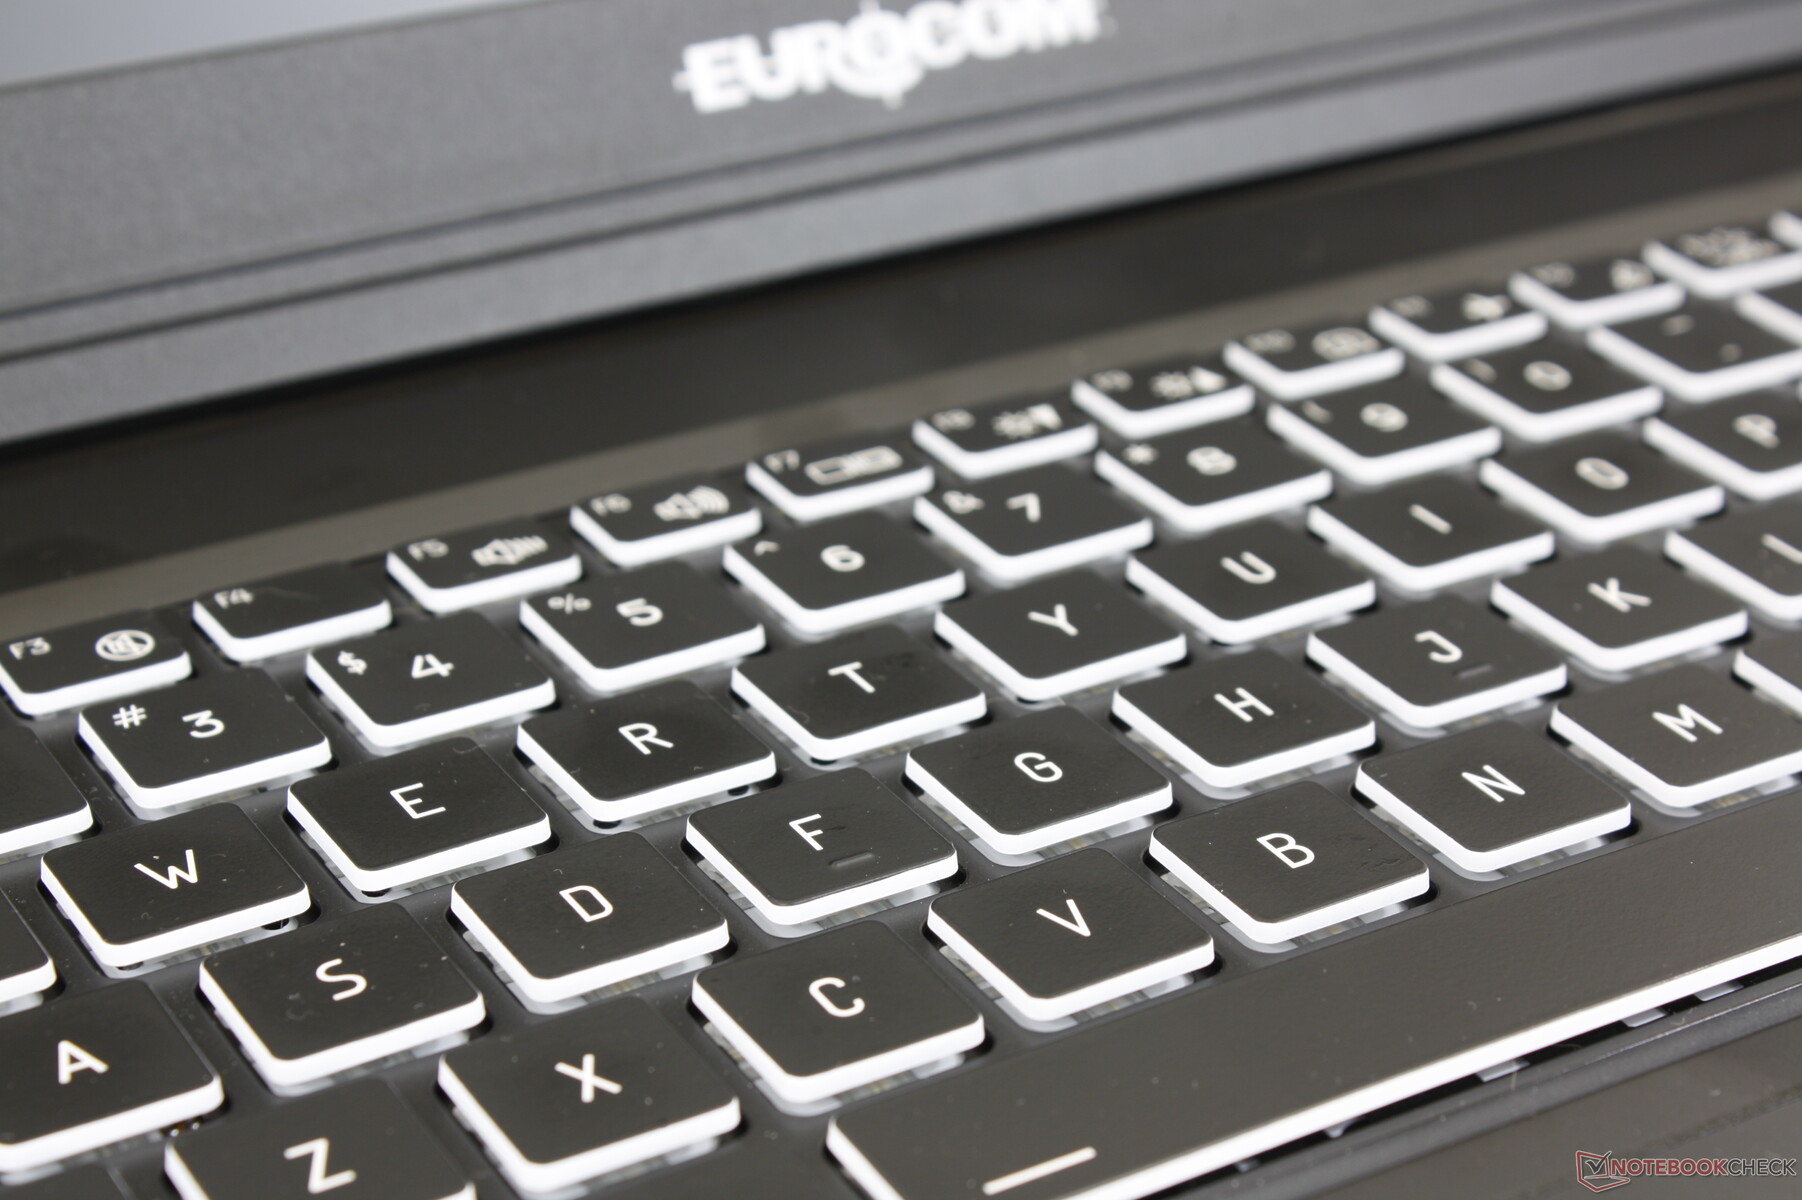
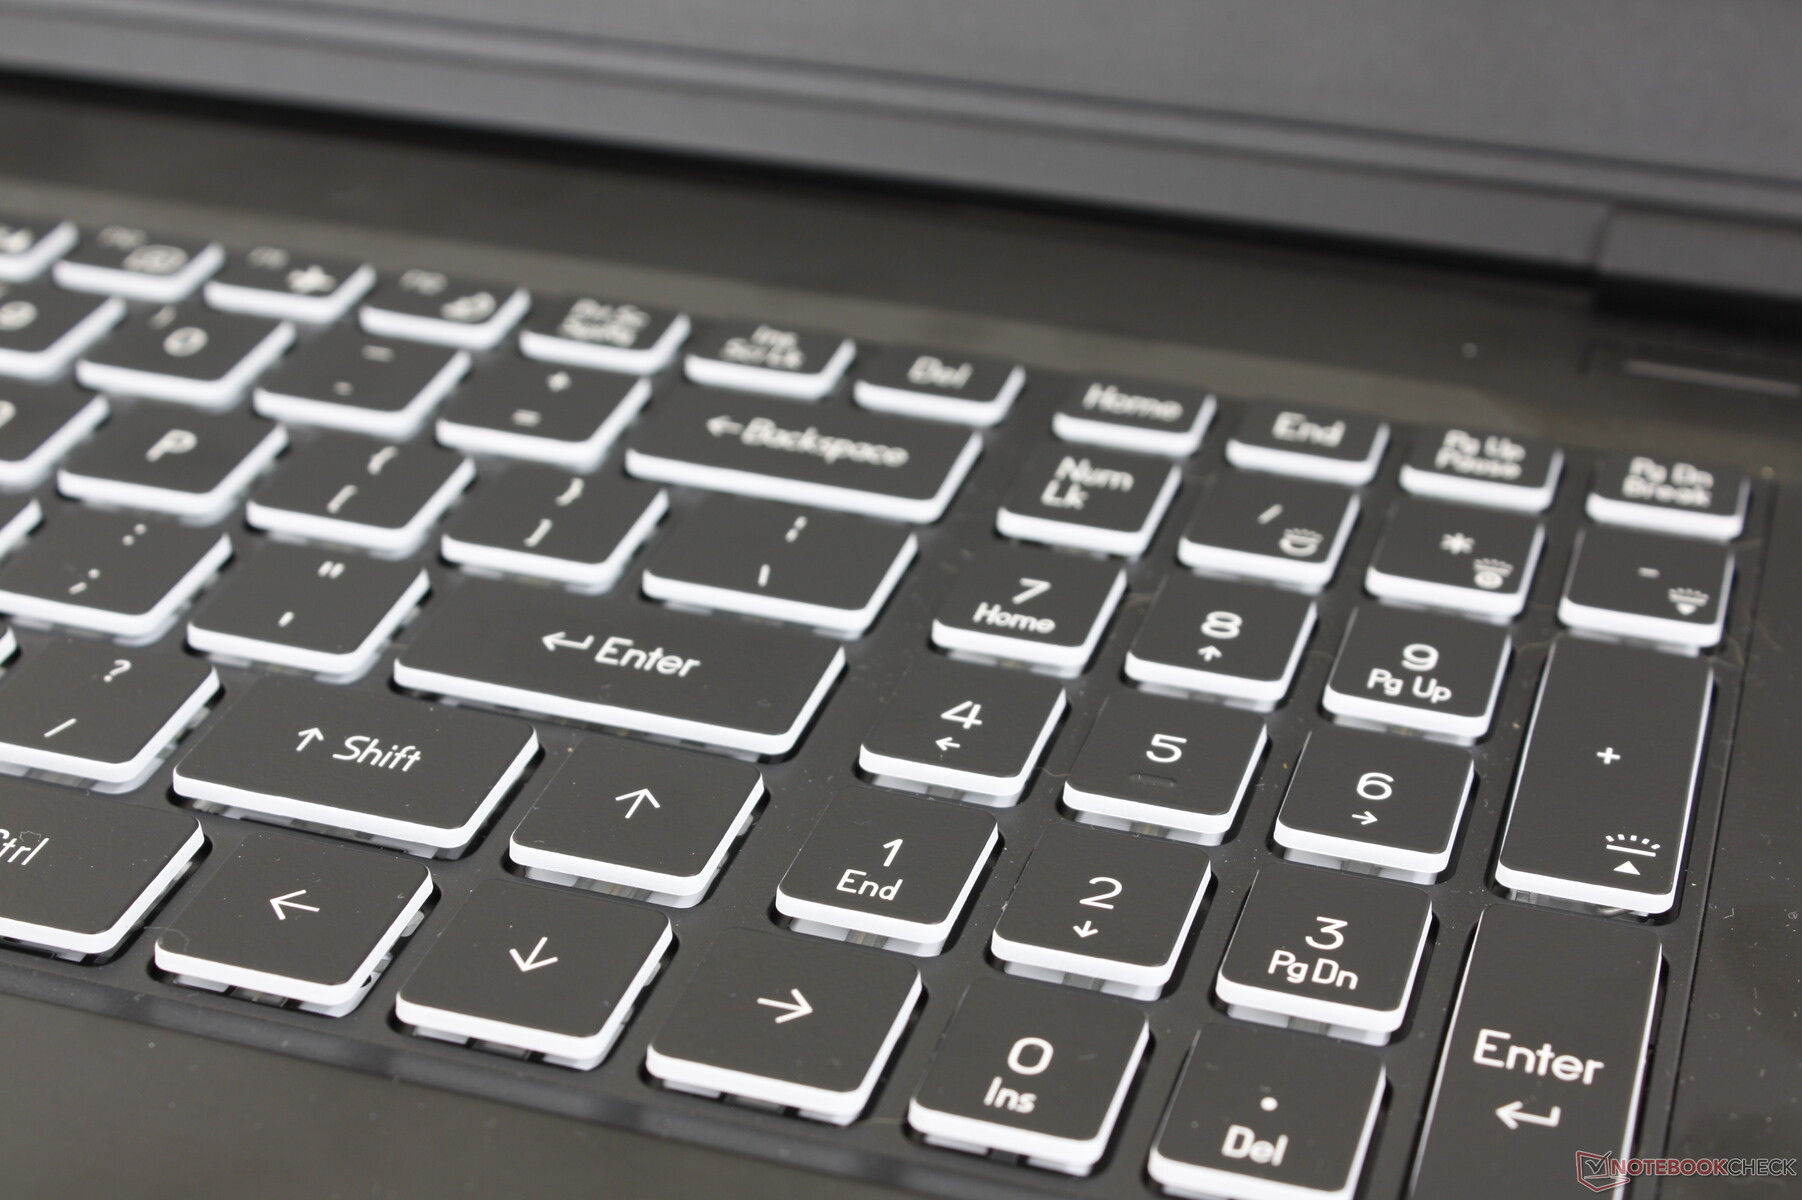
Skrivupplevelsen är enhetlig för de flesta Eurocom-modeller eftersom den underliggande ODM-tekniken är densamma. Raptor X17 har samma membranbaserade tangentbord som Raptor X15 trots skillnaderna i skärmstorlek, vilket är synd eftersom numpad-tangenterna fortfarande är smalare och mer trånga än de huvudsakliga QWERTY-tangenterna.
Tangentåterkopplingen är mjukare än tangenterna på MSI GE78 eller Asus ROG Strix Scar 17. Klirr är relativt tyst som ett resultat, vilket vissa maskinskrivare kanske föredrar, men hardcore-spelare kan bli besvikna över bristen på "klickighet".
Pekplatta
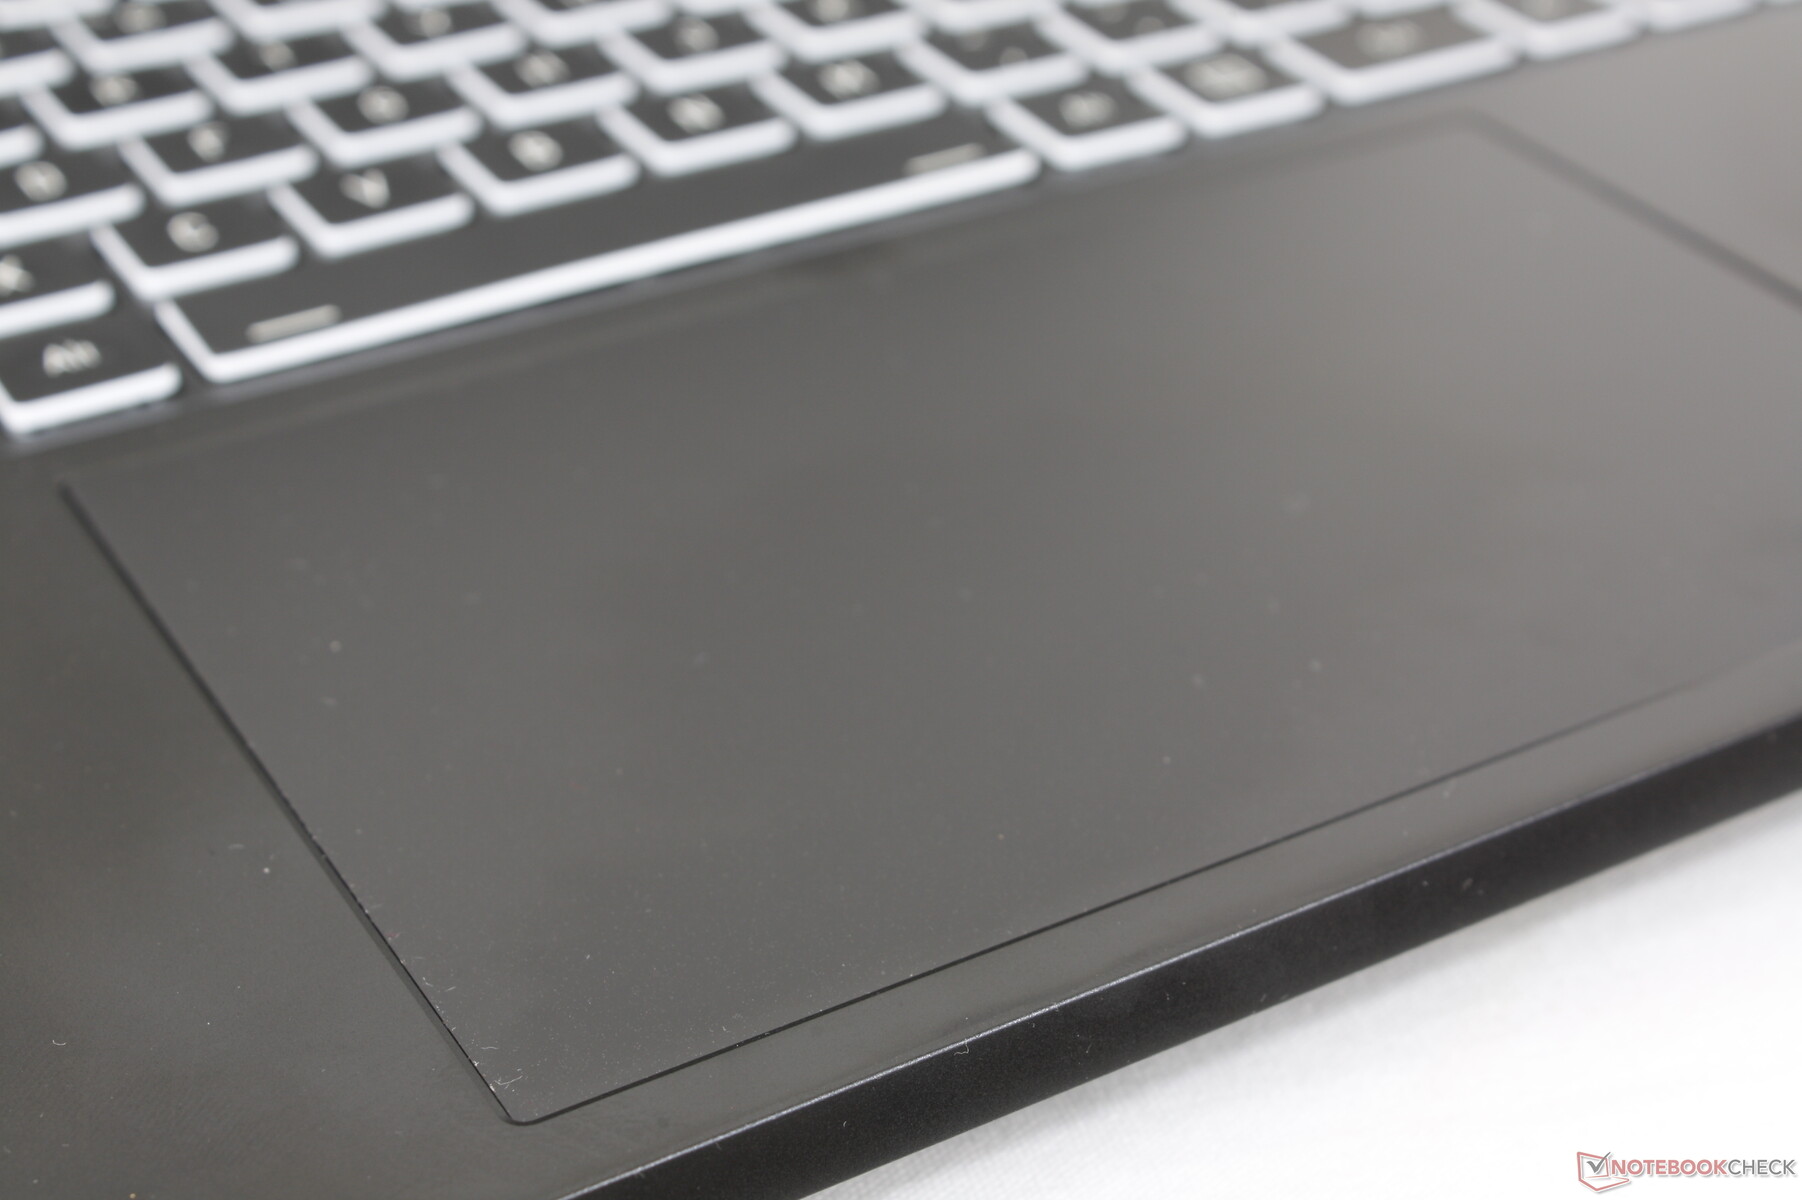
Klickplattan är stor, 15 x 9 cm, jämfört med den mindre klickplattan på 13 x 8,2 cm på MSI GE78 HX. Glidningen är jämn vid medelhöga till höga hastigheter medan det finns en liten stickning vid lägre hastigheter för att hjälpa till med precisionen.
Återkopplingen när du klickar på klickplattan är på den mjuka sidan med en ytlig rörelse, inte olikt den på Razer Blade 17. Drag- och släpphandlingar är därför lite besvärliga att utföra trots den stora ytan. En dedikerad USB-mus är fortfarande rätt väg att gå när det är möjligt.
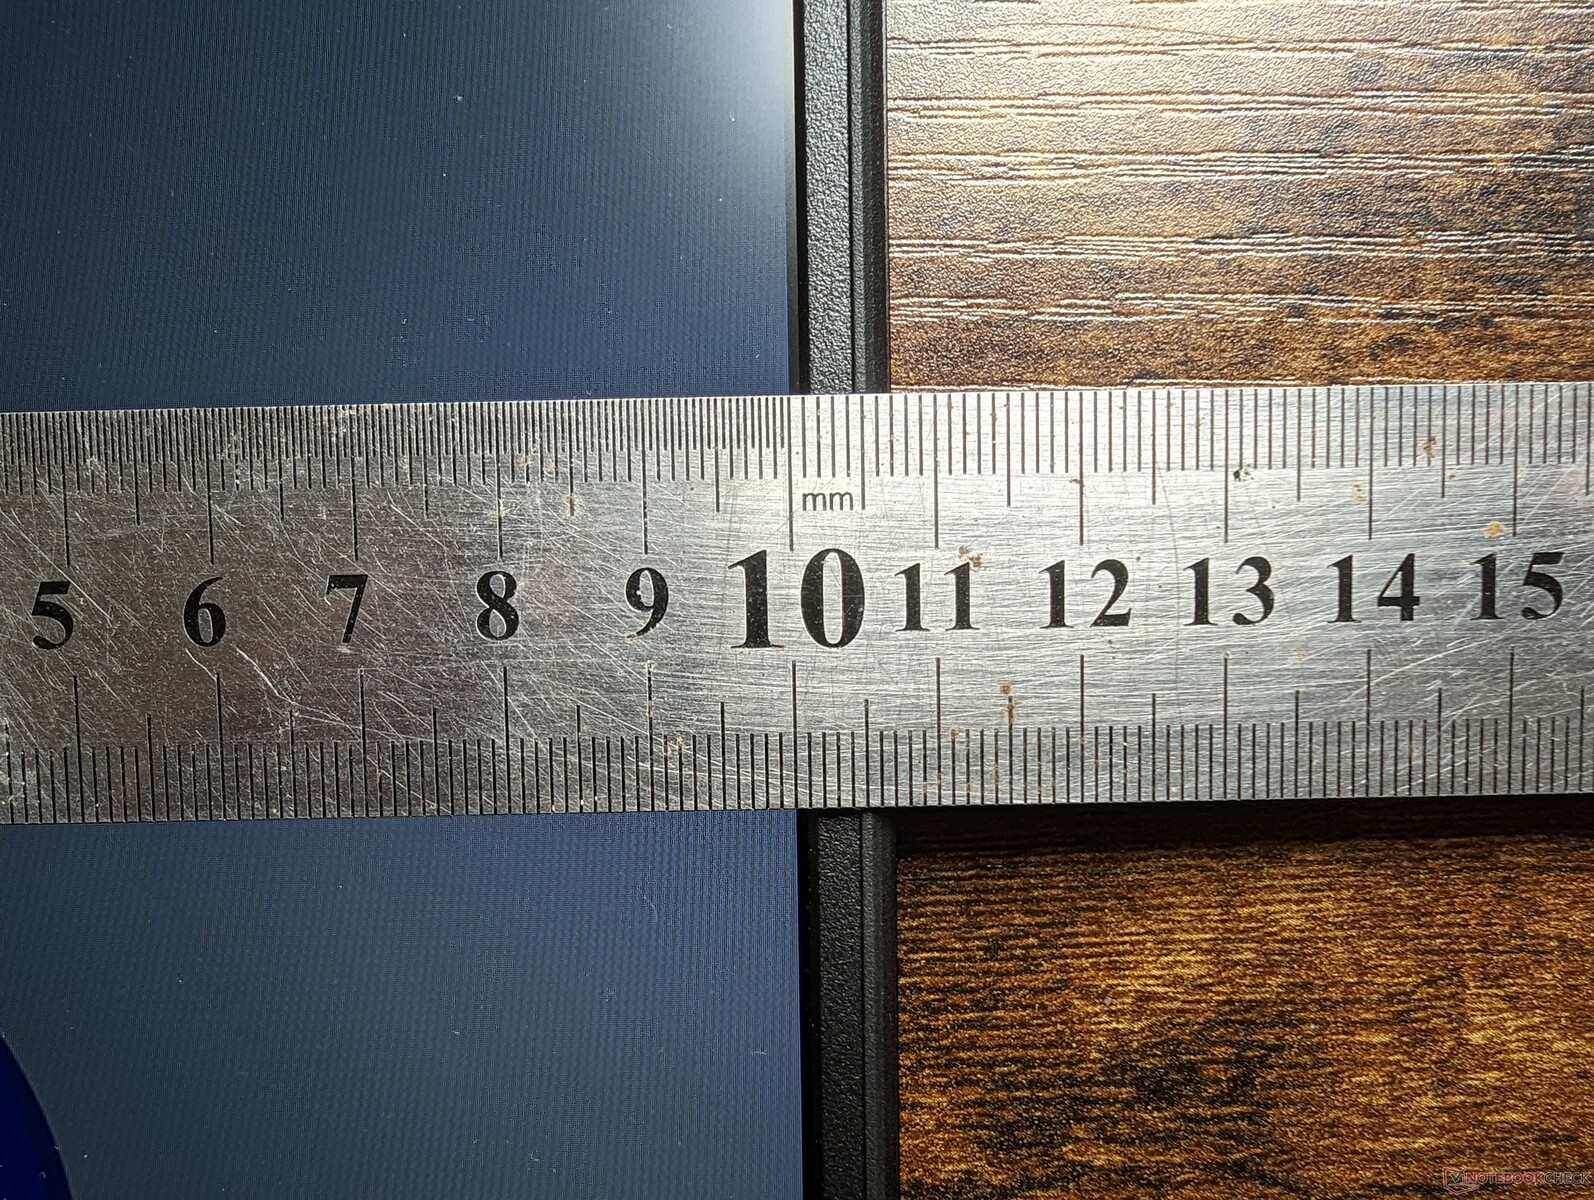
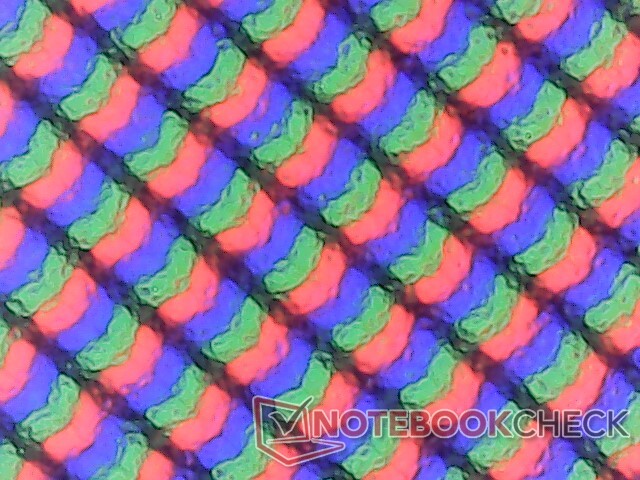
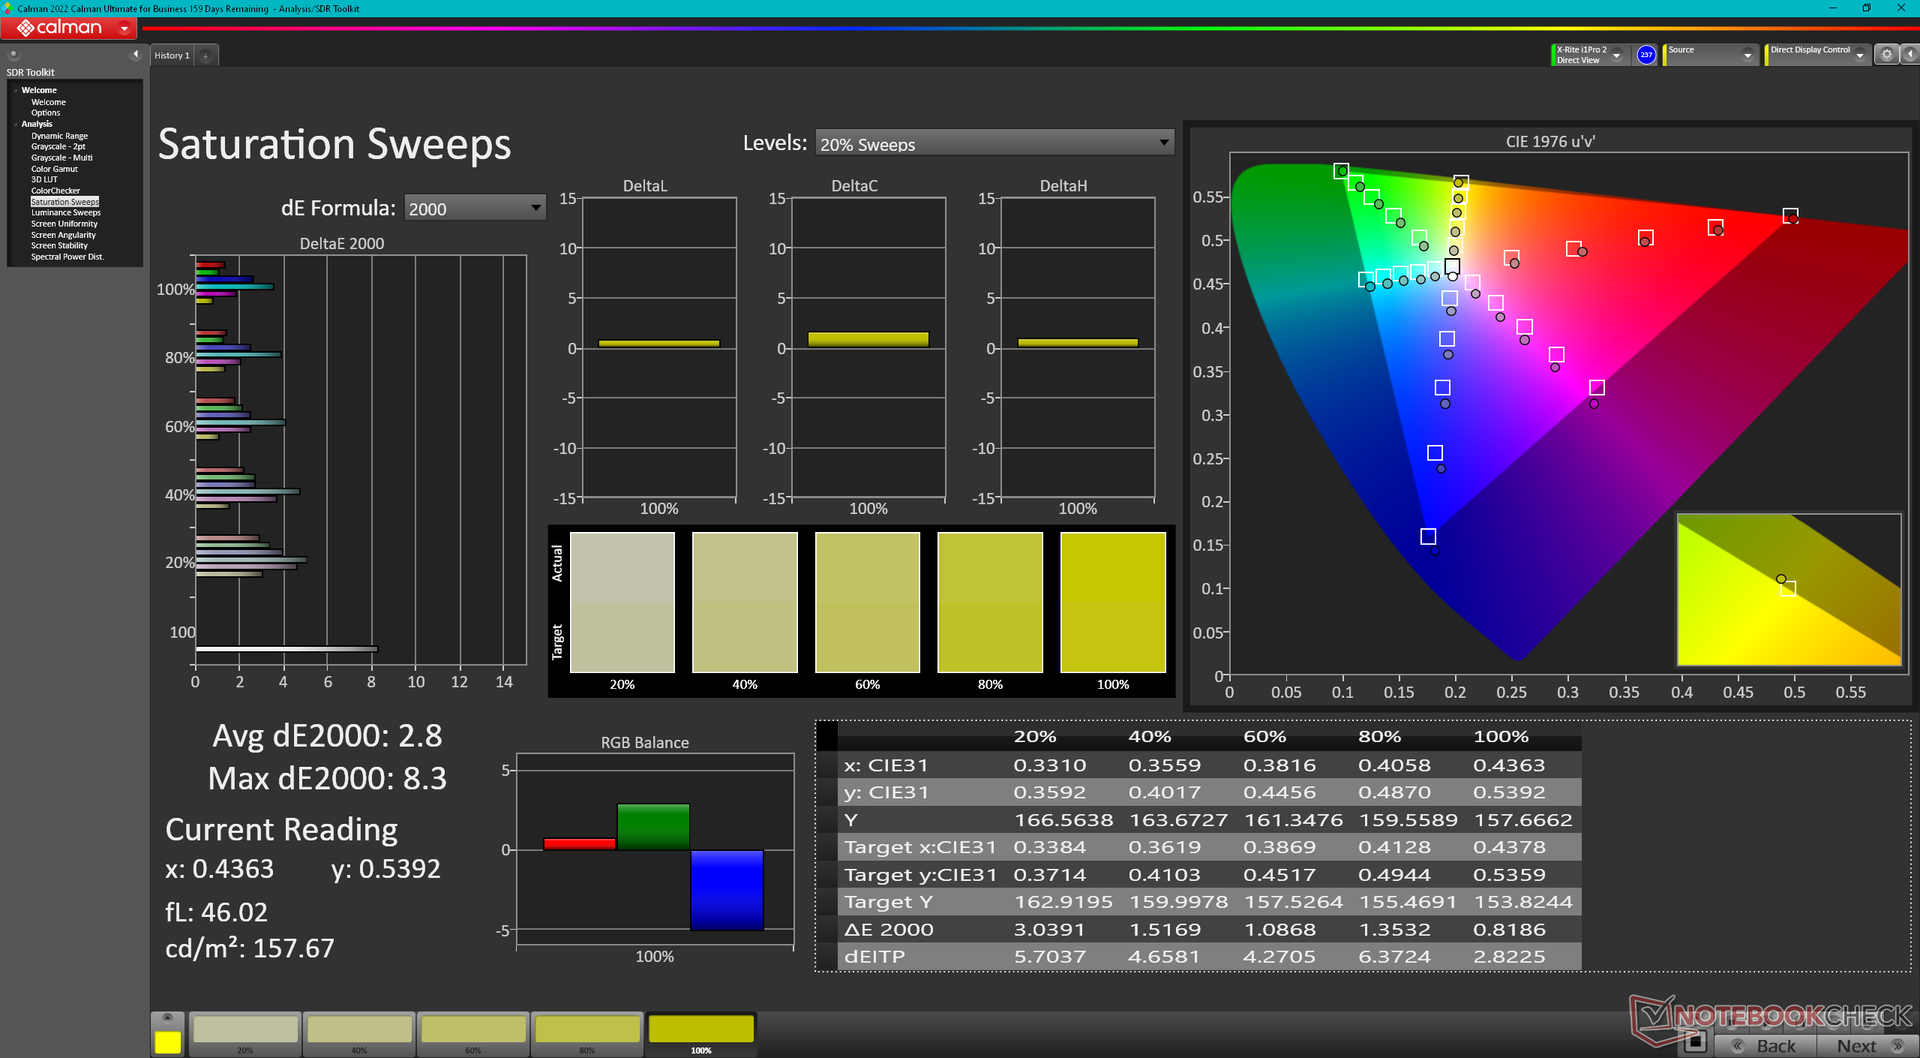
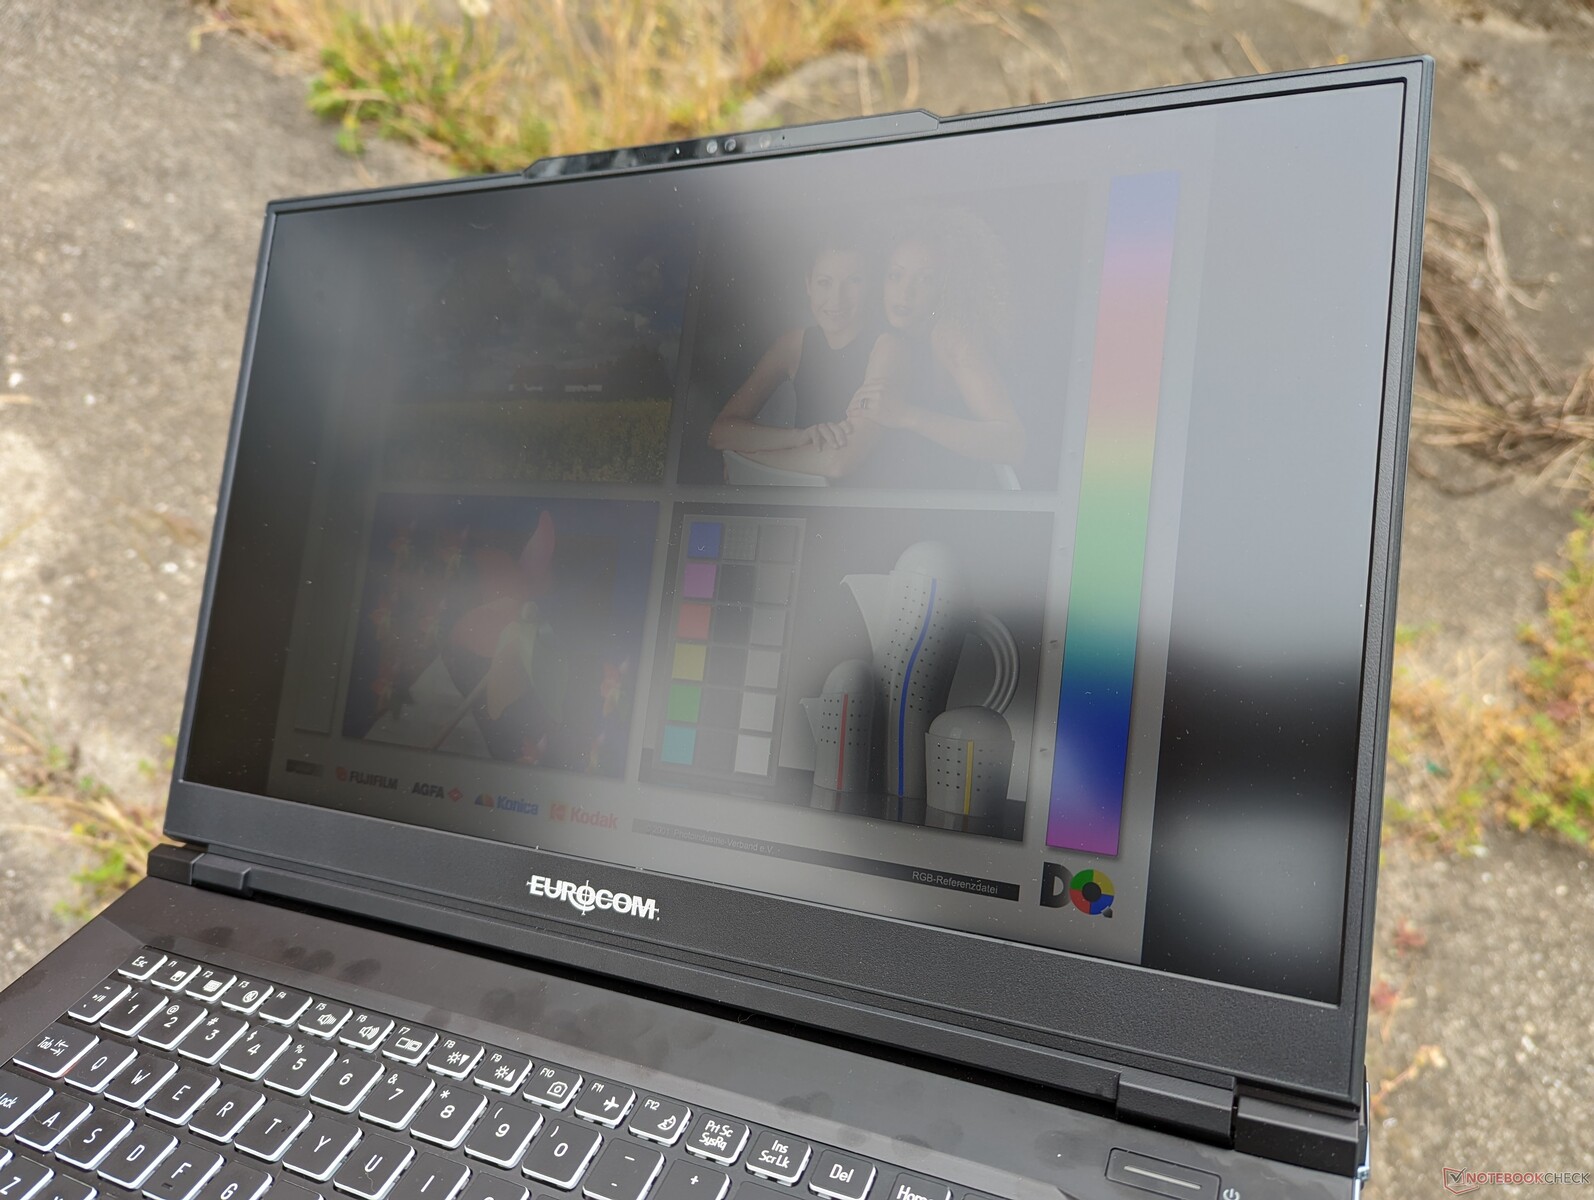
Skärm - 240 Hz, QHD, G-Sync, fullständiga DCI-P3-färger
Det finns två visningsalternativ: QHD vid 240 Hz eller 4K UHD vid 144 Hz, båda med 100 % DCI-P3-färger och stöd för G-Sync. Vår specifika testenhet levereras med det förstnämnda alternativet.
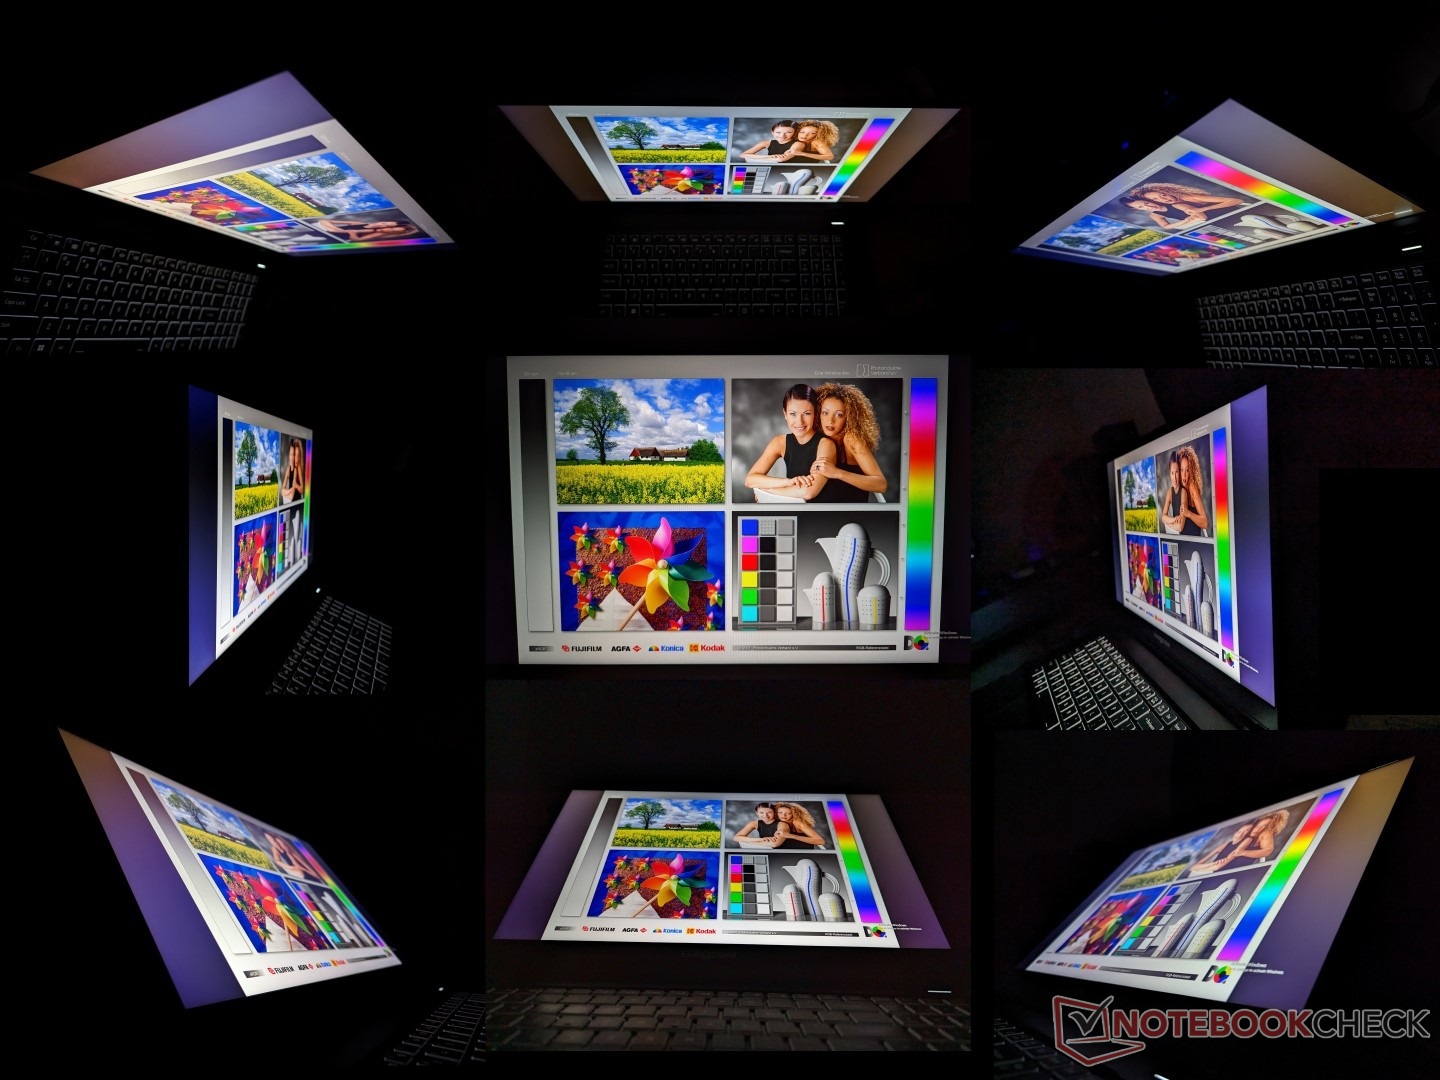
Vårt system använder en mycket likadan IPS-panel från BOE som den som finns påROG Strix Scar 17 (NE173QHM-NZ1 vs. NE173QHM-NZ2). Vi kan inte märka några större skillnader mellan de två panelerna ner till deras snabba uppdateringsfrekvenser, snabba svarstider, breda färgtäckningar, mål för ljusstyrka och hyggliga kontrastförhållanden. Det är en högklassig panel som passar för både spel och innehållsredigering.
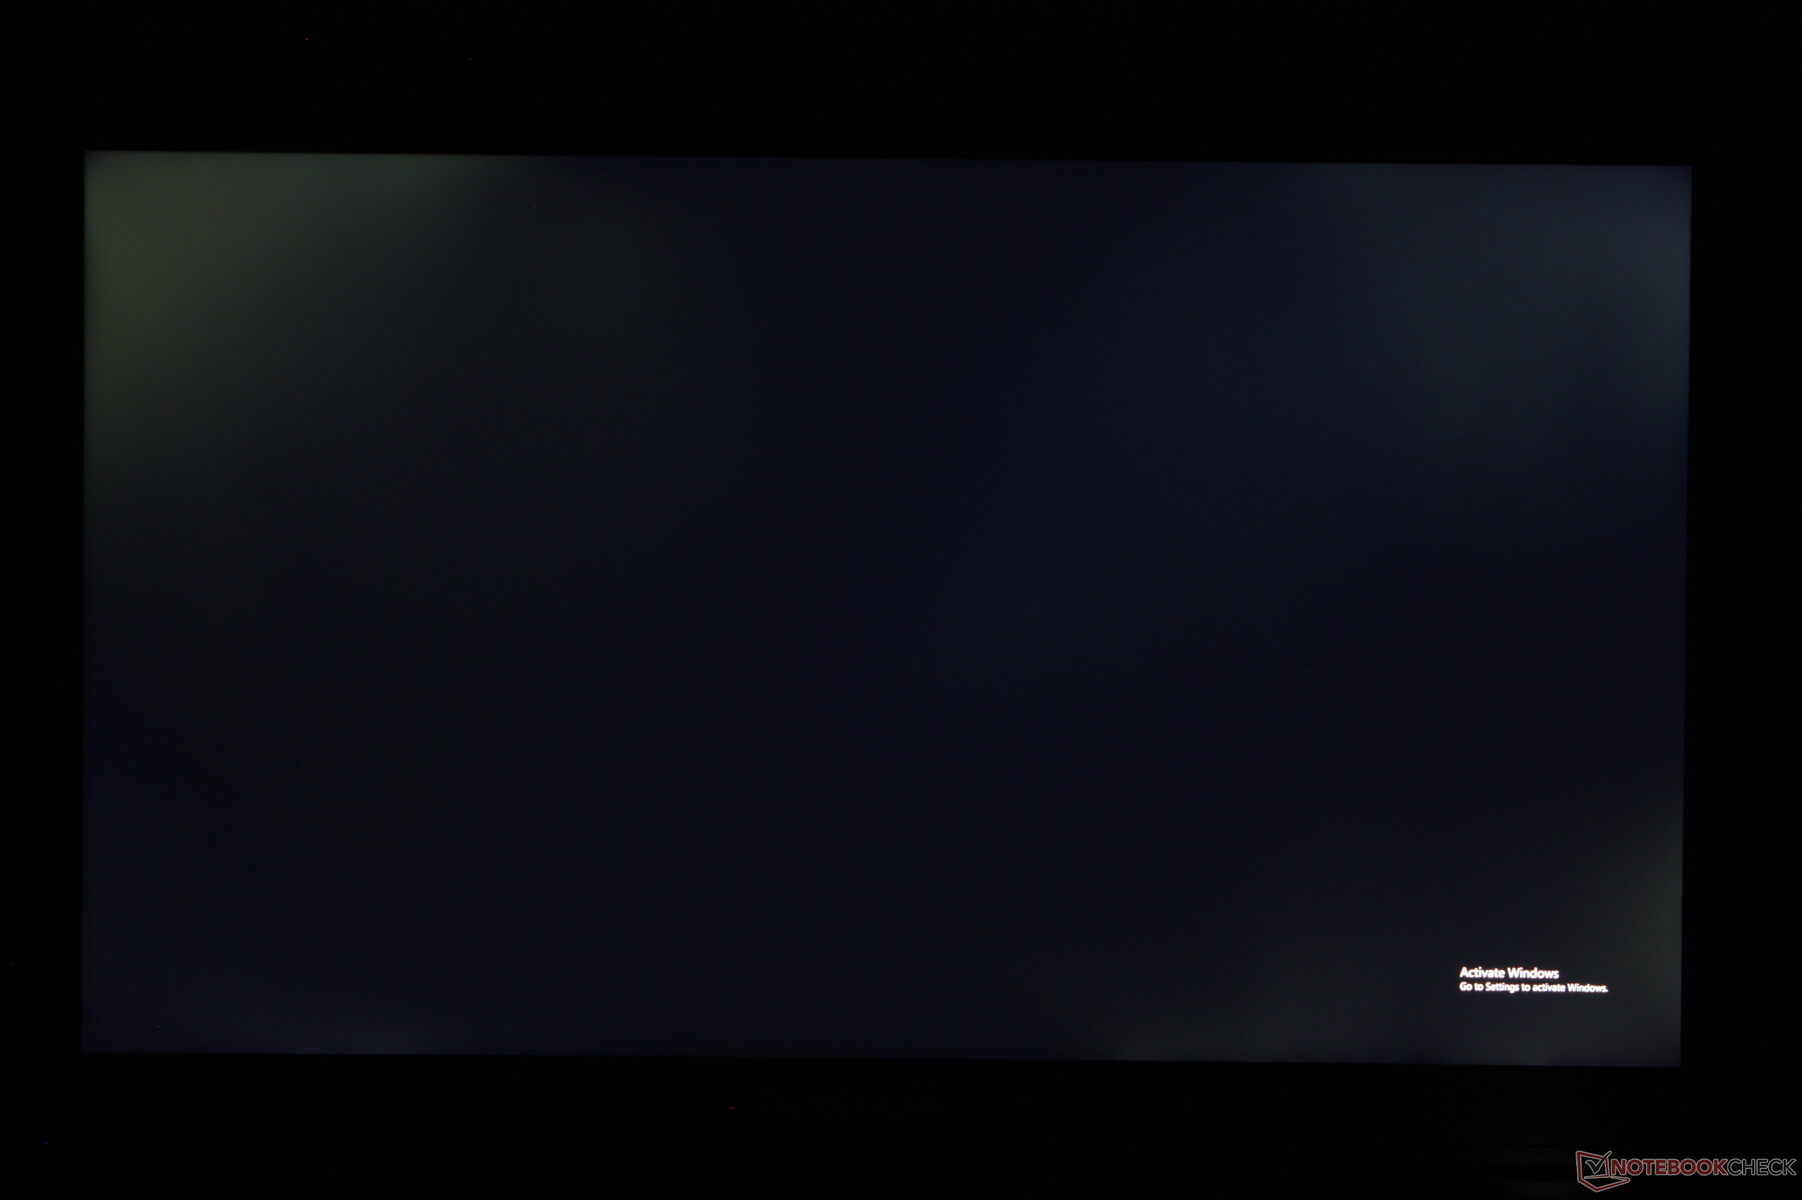
Ett klagomål vi har gäller den märkbara bakgrundsbelysningsblödningen på vår testenhet. Även om en viss blödning är att vänta från de flesta IPS-paneler är den allvarligare här än på andra bärbara datorer vi har testat som är under halva priset.
| |||||||||||||||||||||||||
Distribution av ljusstyrkan: 75 %
Mitt på batteriet: 312.6 cd/m²
Kontrast: 1202:1 (Svärta: 0.26 cd/m²)
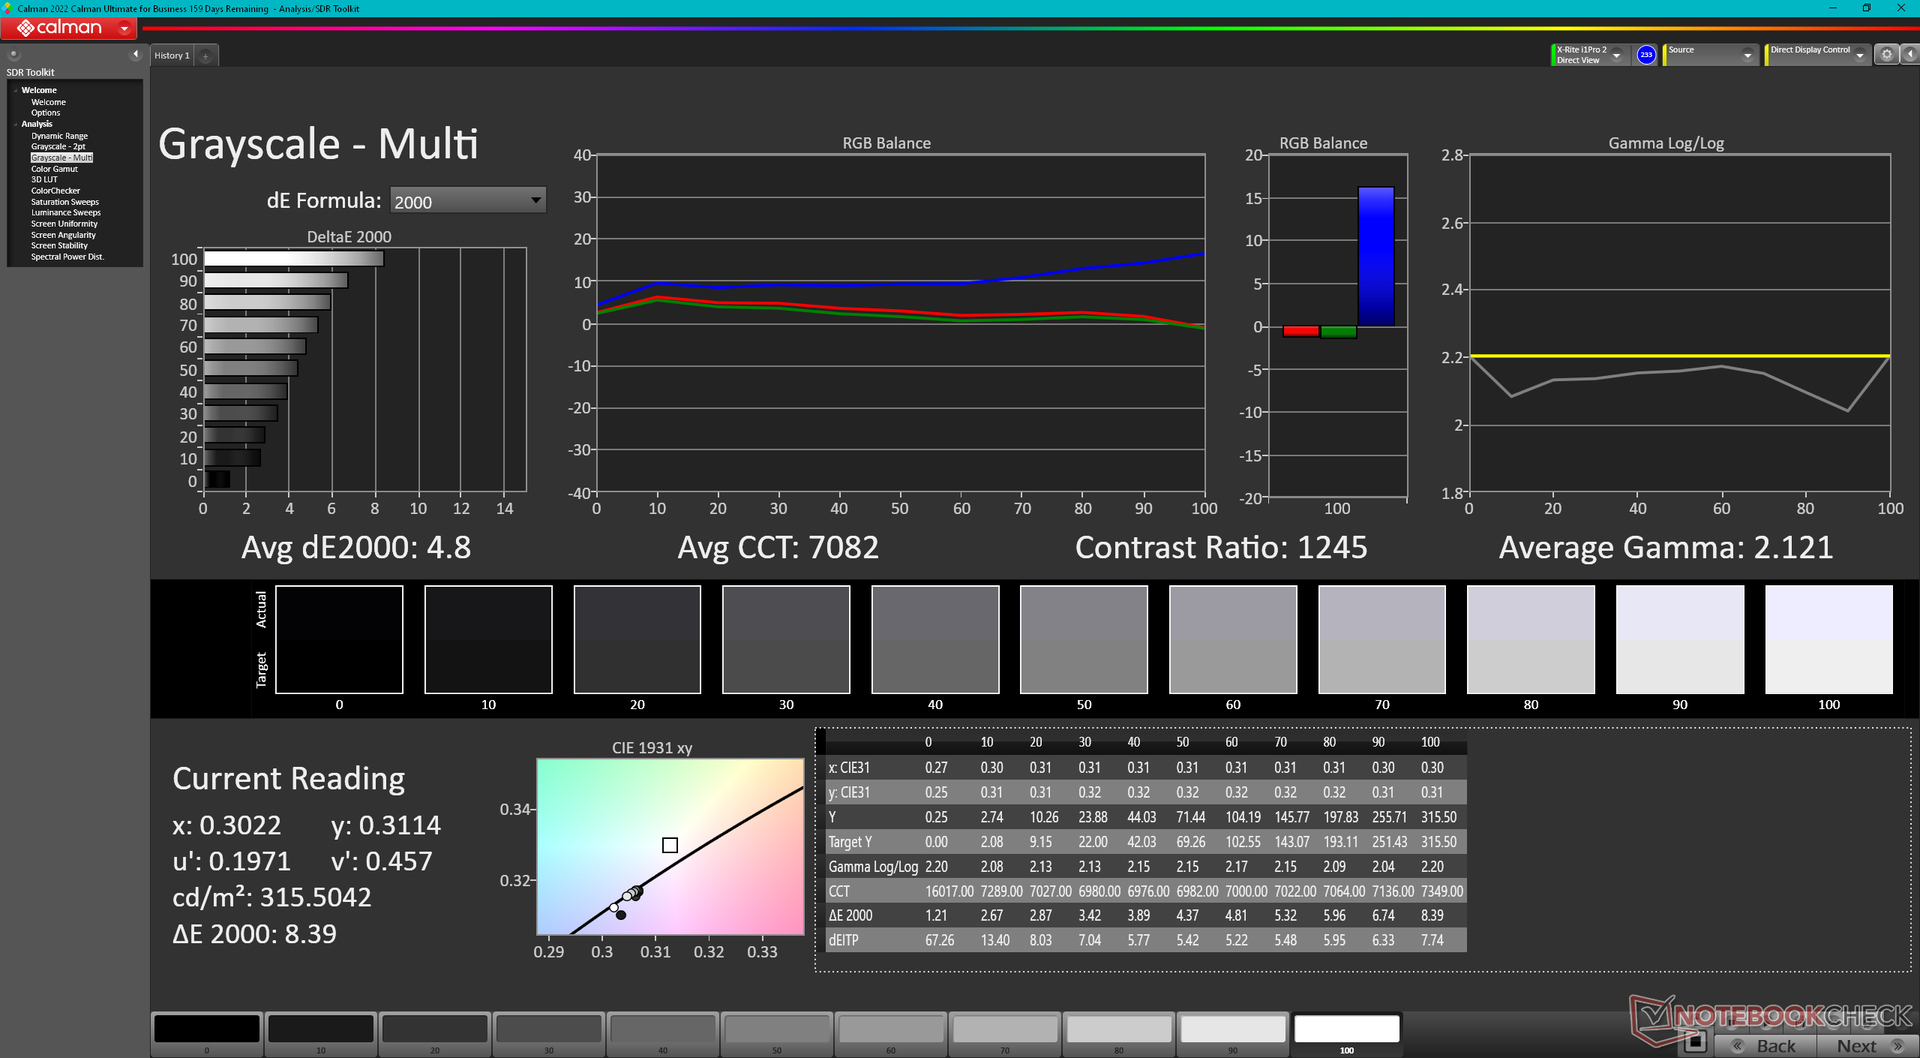
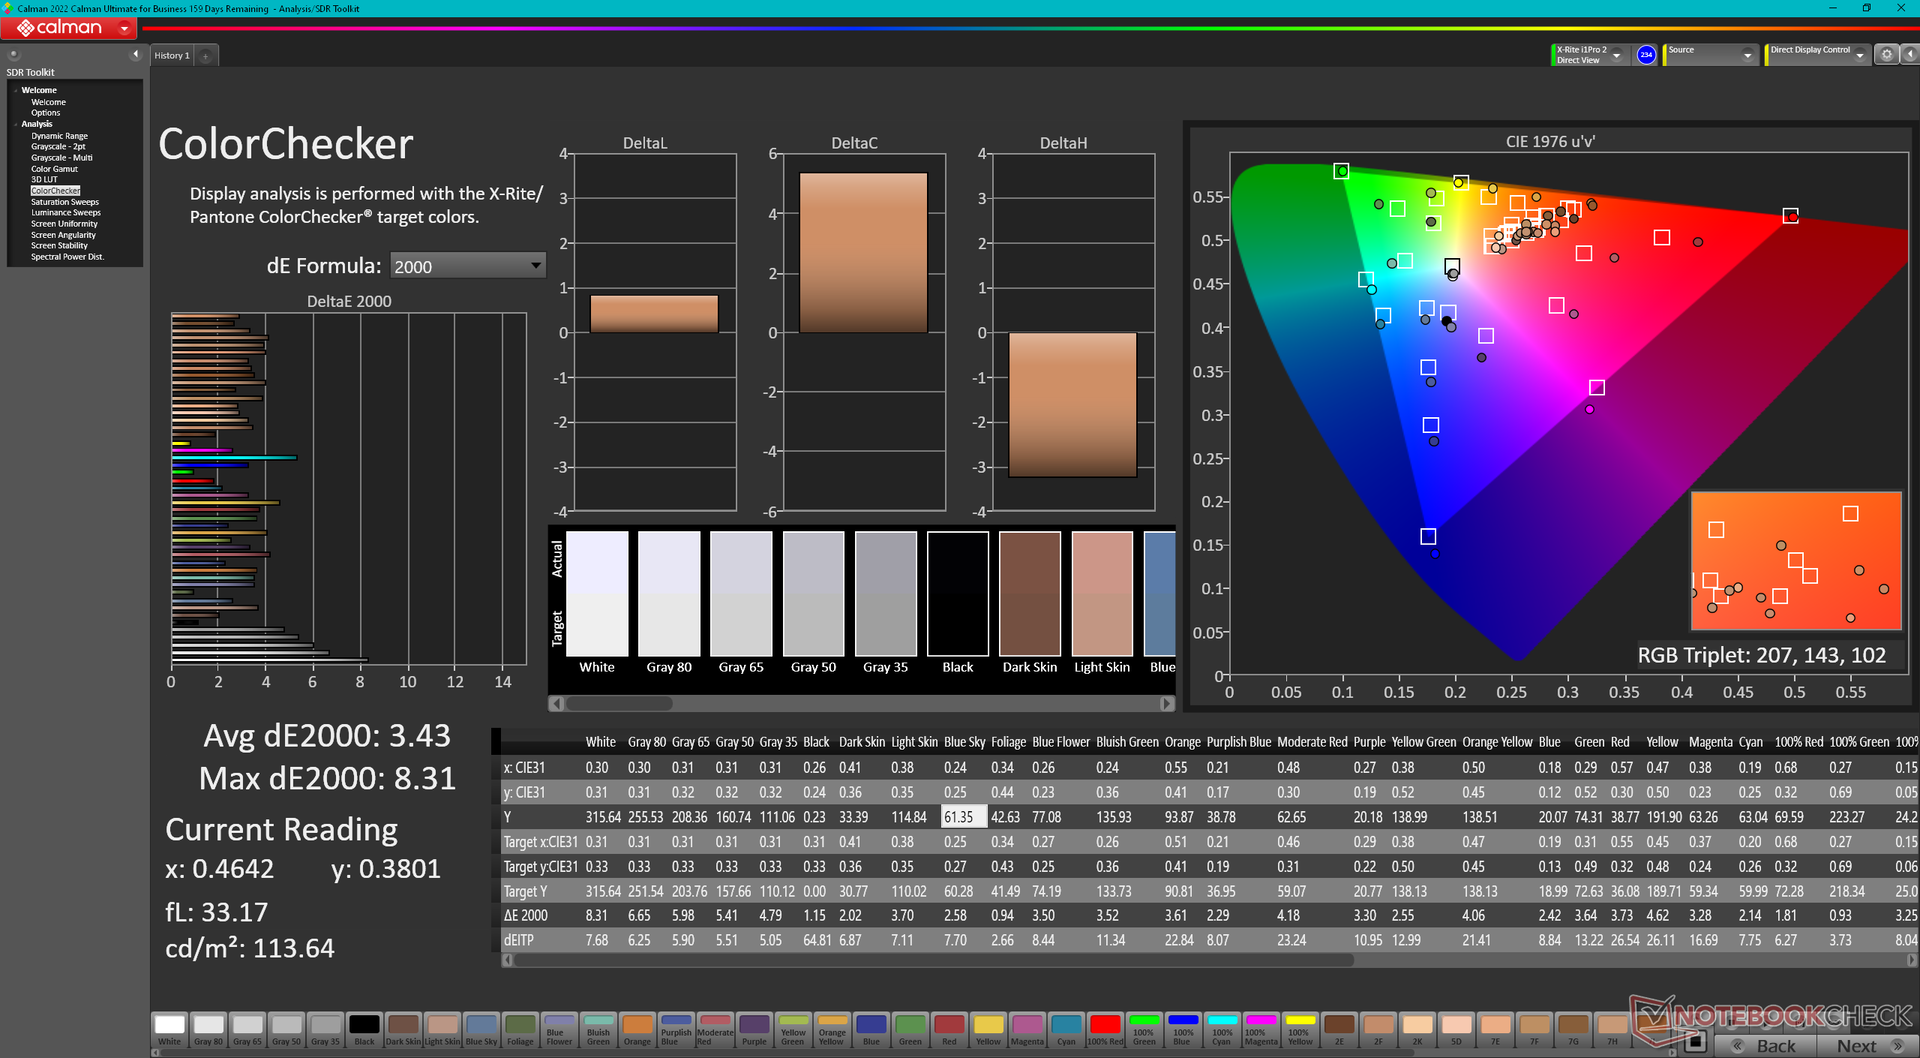
ΔE ColorChecker Calman: 3.43 | ∀{0.5-29.43 Ø4.71}
calibrated: 0.74
ΔE Greyscale Calman: 4.8 | ∀{0.09-98 Ø4.96}
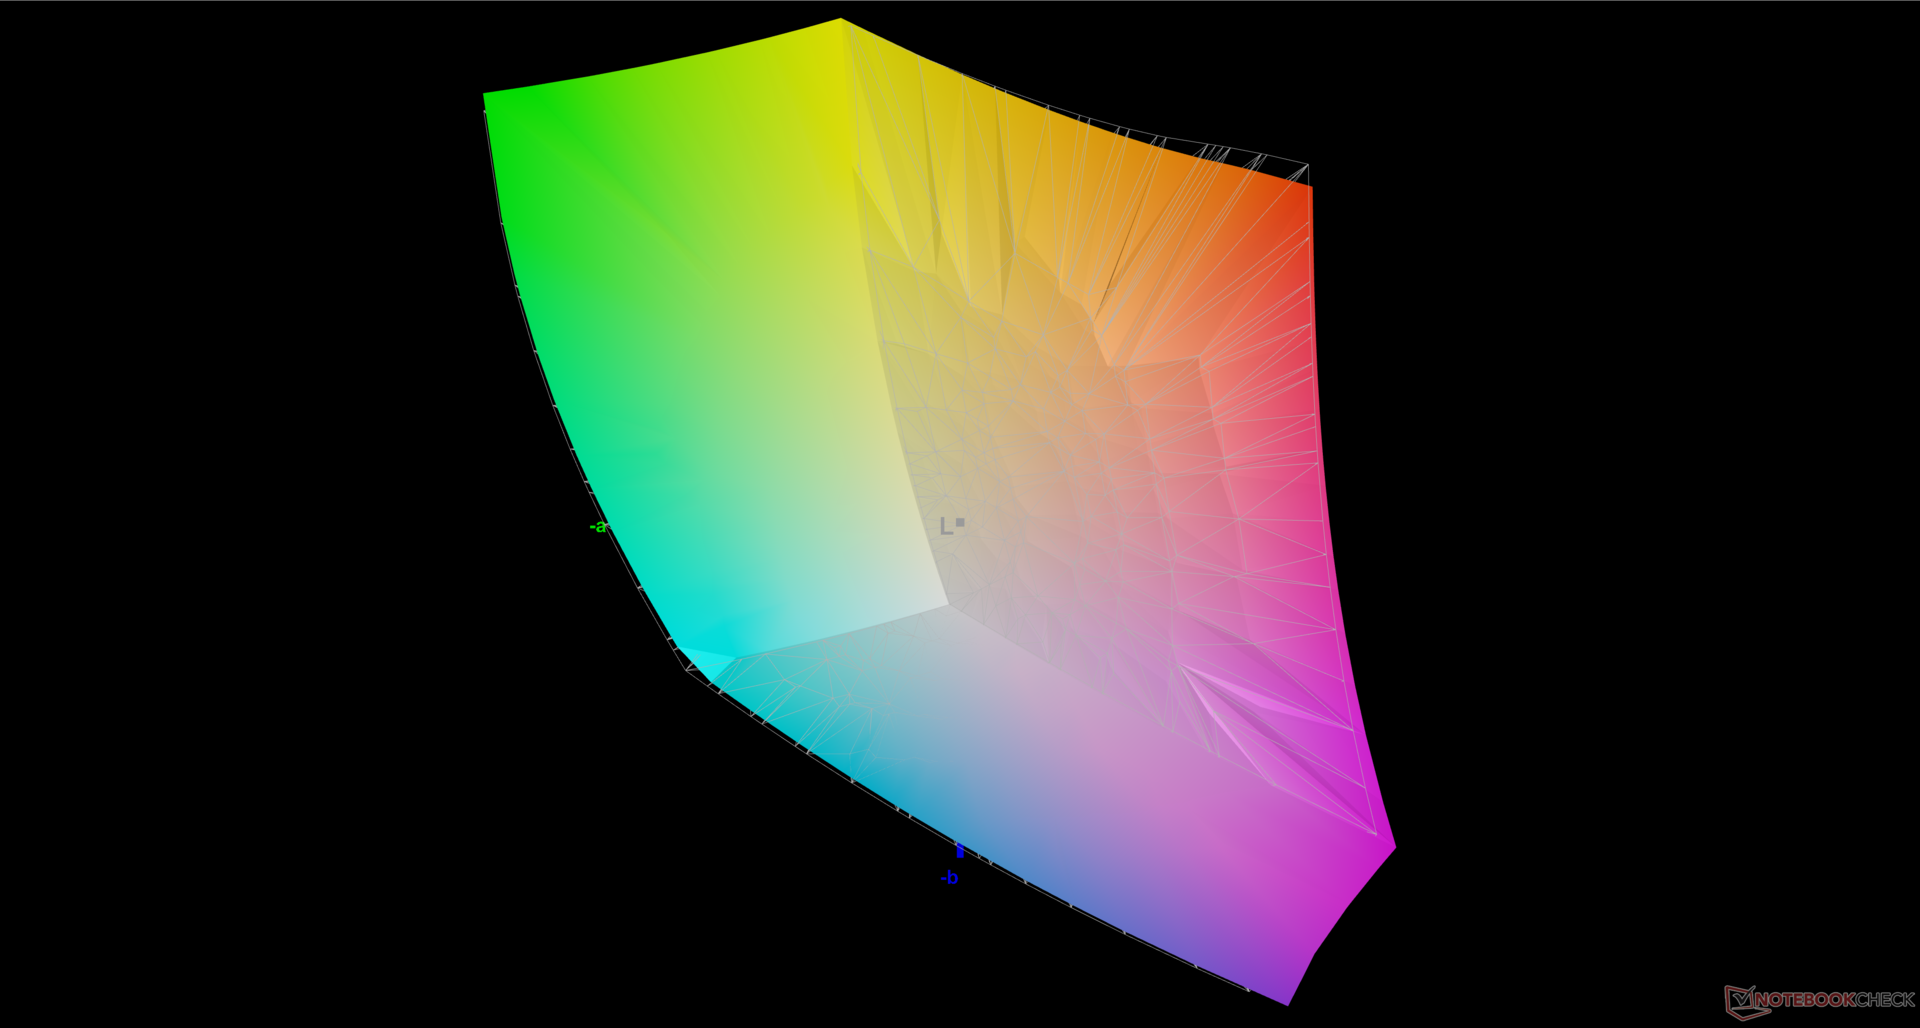
85.4% AdobeRGB 1998 (Argyll 3D)
99.9% sRGB (Argyll 3D)
97.8% Display P3 (Argyll 3D)
Gamma: 2.12
CCT: 7082 K
| Eurocom Raptor X17 BOE NE173QHM-NZ1, IPS, 2560x1440, 17.3" | Asus ROG Strix Scar 17 G733PY-XS96 NE173QHM-NZ2, IPS, 2560x1440, 17.3" | Aorus 17X AZF BOE09F9, IPS, 2560x1440, 17.3" | MSI GE78HX 13VH-070US AU Optronics B170QAN01.2, IPS, 2560x1600, 17" | Eluktronics Mech-17 GP2 BOE NE170QDM-NZ1, IPS, 2560x1600, 17" | Alienware m17 R5 (R9 6900HX, RX 6850M XT) AU Optronics AUODBA3, IPS, 3840x2160, 17" | |
|---|---|---|---|---|---|---|
| Display | 0% | -1% | 0% | -16% | 1% | |
| Display P3 Coverage (%) | 97.8 | 98 0% | 96.7 -1% | 97.6 0% | 69.1 -29% | 97.2 -1% |
| sRGB Coverage (%) | 99.9 | 100 0% | 99.9 0% | 99.9 0% | 99.7 0% | 99.6 0% |
| AdobeRGB 1998 Coverage (%) | 85.4 | 85.6 0% | 84.5 -1% | 86.5 1% | 69.8 -18% | 88.4 4% |
| Response Times | 20% | -3% | 52% | 8% | -20% | |
| Response Time Grey 50% / Grey 80% * (ms) | 13.3 ? | 6.2 ? 53% | 14 ? -5% | 4.2 ? 68% | 12 ? 10% | 16.4 ? -23% |
| Response Time Black / White * (ms) | 10 ? | 11.4 ? -14% | 10.1 ? -1% | 6.4 ? 36% | 9.4 ? 6% | 11.6 ? -16% |
| PWM Frequency (Hz) | ||||||
| Screen | 25% | 6% | -13% | 19% | -67% | |
| Brightness middle (cd/m²) | 312.6 | 322.5 3% | 294 -6% | 398.6 28% | 417.3 33% | 484 55% |
| Brightness (cd/m²) | 292 | 317 9% | 276 -5% | 384 32% | 387 33% | 449 54% |
| Brightness Distribution (%) | 75 | 86 15% | 90 20% | 89 19% | 87 16% | 87 16% |
| Black Level * (cd/m²) | 0.26 | 0.29 -12% | 0.28 -8% | 0.46 -77% | 0.42 -62% | 0.55 -112% |
| Contrast (:1) | 1202 | 1112 -7% | 1050 -13% | 867 -28% | 994 -17% | 880 -27% |
| Colorchecker dE 2000 * | 3.43 | 1.15 66% | 2.81 18% | 4.05 -18% | 2.14 38% | 4.8 -40% |
| Colorchecker dE 2000 max. * | 8.31 | 3.03 64% | 5.7 31% | 8.68 -4% | 4.09 51% | 7.48 10% |
| Colorchecker dE 2000 calibrated * | 0.74 | 0.56 24% | 0.86 -16% | 1.02 -38% | 0.42 43% | 4.74 -541% |
| Greyscale dE 2000 * | 4.8 | 1.7 65% | 3.4 29% | 6.5 -35% | 3.1 35% | 5.5 -15% |
| Gamma | 2.12 104% | 2.27 97% | 2.301 96% | 2.11 104% | 2.19 100% | 2.42 91% |
| CCT | 7082 92% | 6299 103% | 7389 88% | 7518 86% | 6040 108% | 6148 106% |
| Totalt genomsnitt (program/inställningar) | 15% /
19% | 1% /
3% | 13% /
-1% | 4% /
10% | -29% /
-45% |
* ... mindre är bättre

Skärmen är inte förkalibrerad i förpackningen. Istället tar Eurocom extra betalt för fabrikskalibrering, vilket vi tycker är absurt med tanke på det redan höga priset. Andra tillverkare som MSI, Asus, Dell och andra erbjuder förkalibrering som standard för många av sina respektive modeller.
Visa svarstider
| ↔ Svarstid svart till vitt | ||
|---|---|---|
| 10 ms ... stiga ↗ och falla ↘ kombinerat | ↗ 5 ms stiga | 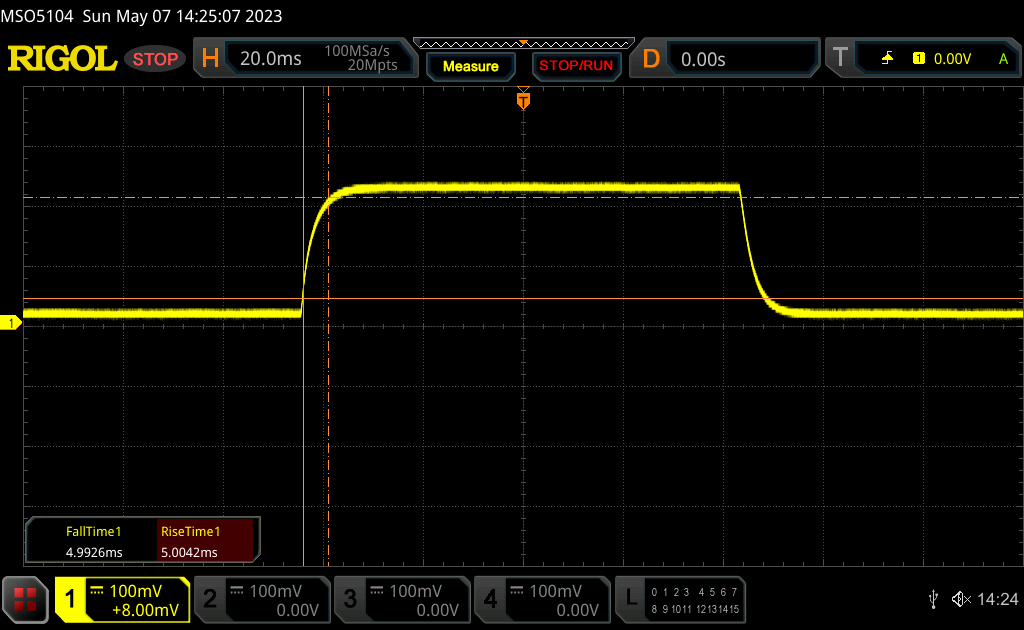 |
| ↘ 5 ms hösten | ||
| Skärmen visar bra svarsfrekvens i våra tester, men kan vara för långsam för konkurrenskraftiga spelare. I jämförelse sträcker sig alla testade enheter från 0.1 (minst) till 240 (maximalt) ms. » 27 % av alla enheter är bättre. Det betyder att den uppmätta svarstiden är bättre än genomsnittet av alla testade enheter (19.8 ms). | ||
| ↔ Svarstid 50 % grått till 80 % grått | ||
| 13.3 ms ... stiga ↗ och falla ↘ kombinerat | ↗ 6 ms stiga | 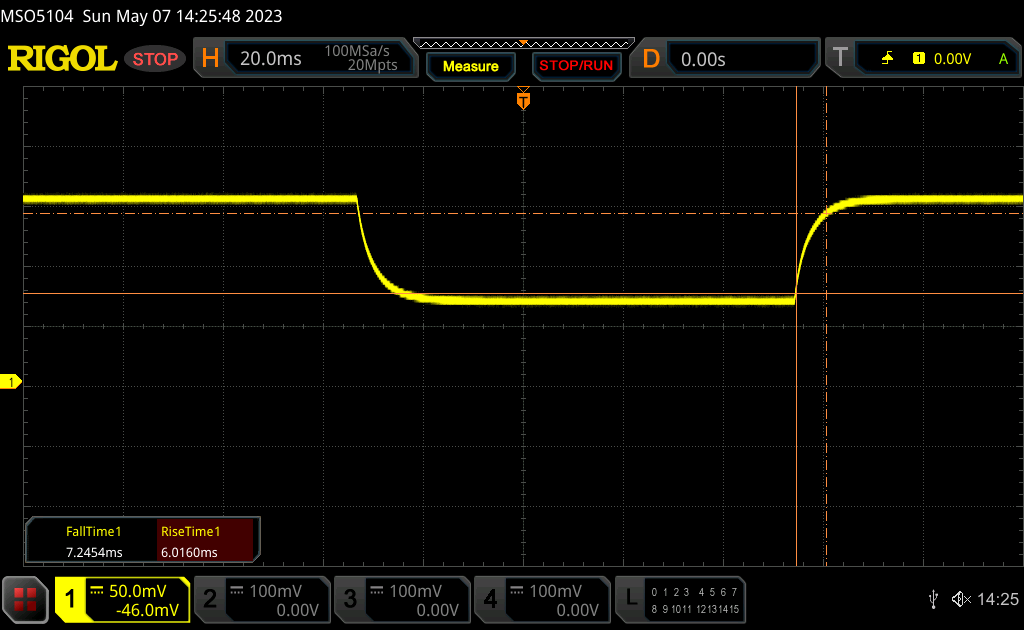 |
| ↘ 7.3 ms hösten | ||
| Skärmen visar bra svarsfrekvens i våra tester, men kan vara för långsam för konkurrenskraftiga spelare. I jämförelse sträcker sig alla testade enheter från 0.165 (minst) till 636 (maximalt) ms. » 27 % av alla enheter är bättre. Det betyder att den uppmätta svarstiden är bättre än genomsnittet av alla testade enheter (31 ms). | ||
Skärmflimmer / PWM (Puls-Width Modulation)
| Skärmflimmer / PWM upptäcktes inte | 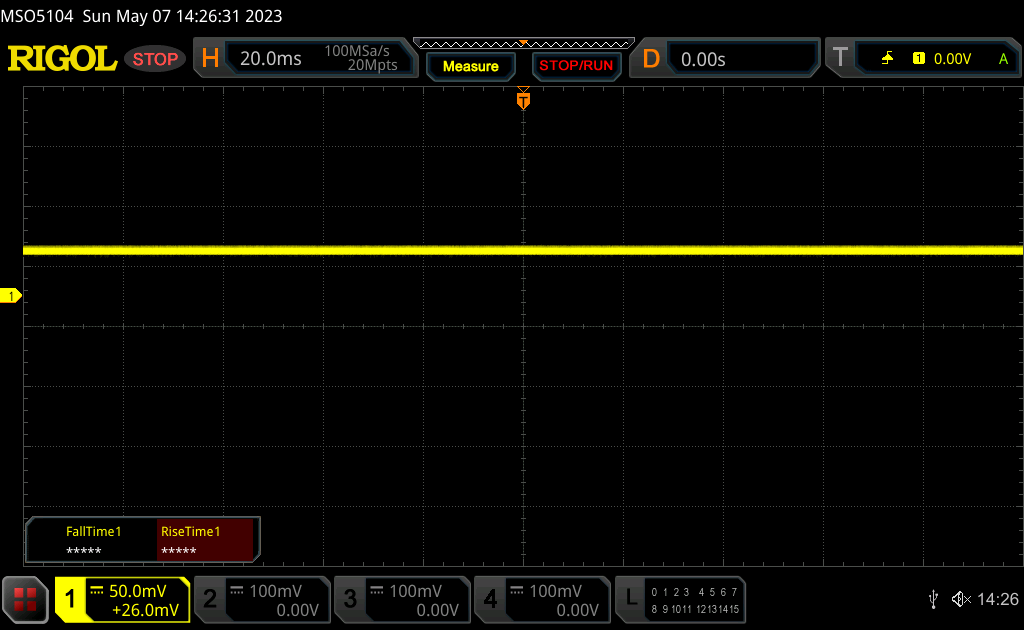 | ||
Som jämförelse: 52 % av alla testade enheter använder inte PWM för att dämpa skärmen. Om PWM upptäcktes mättes ett medelvärde av 7754 (minst: 5 - maximum: 343500) Hz. | |||
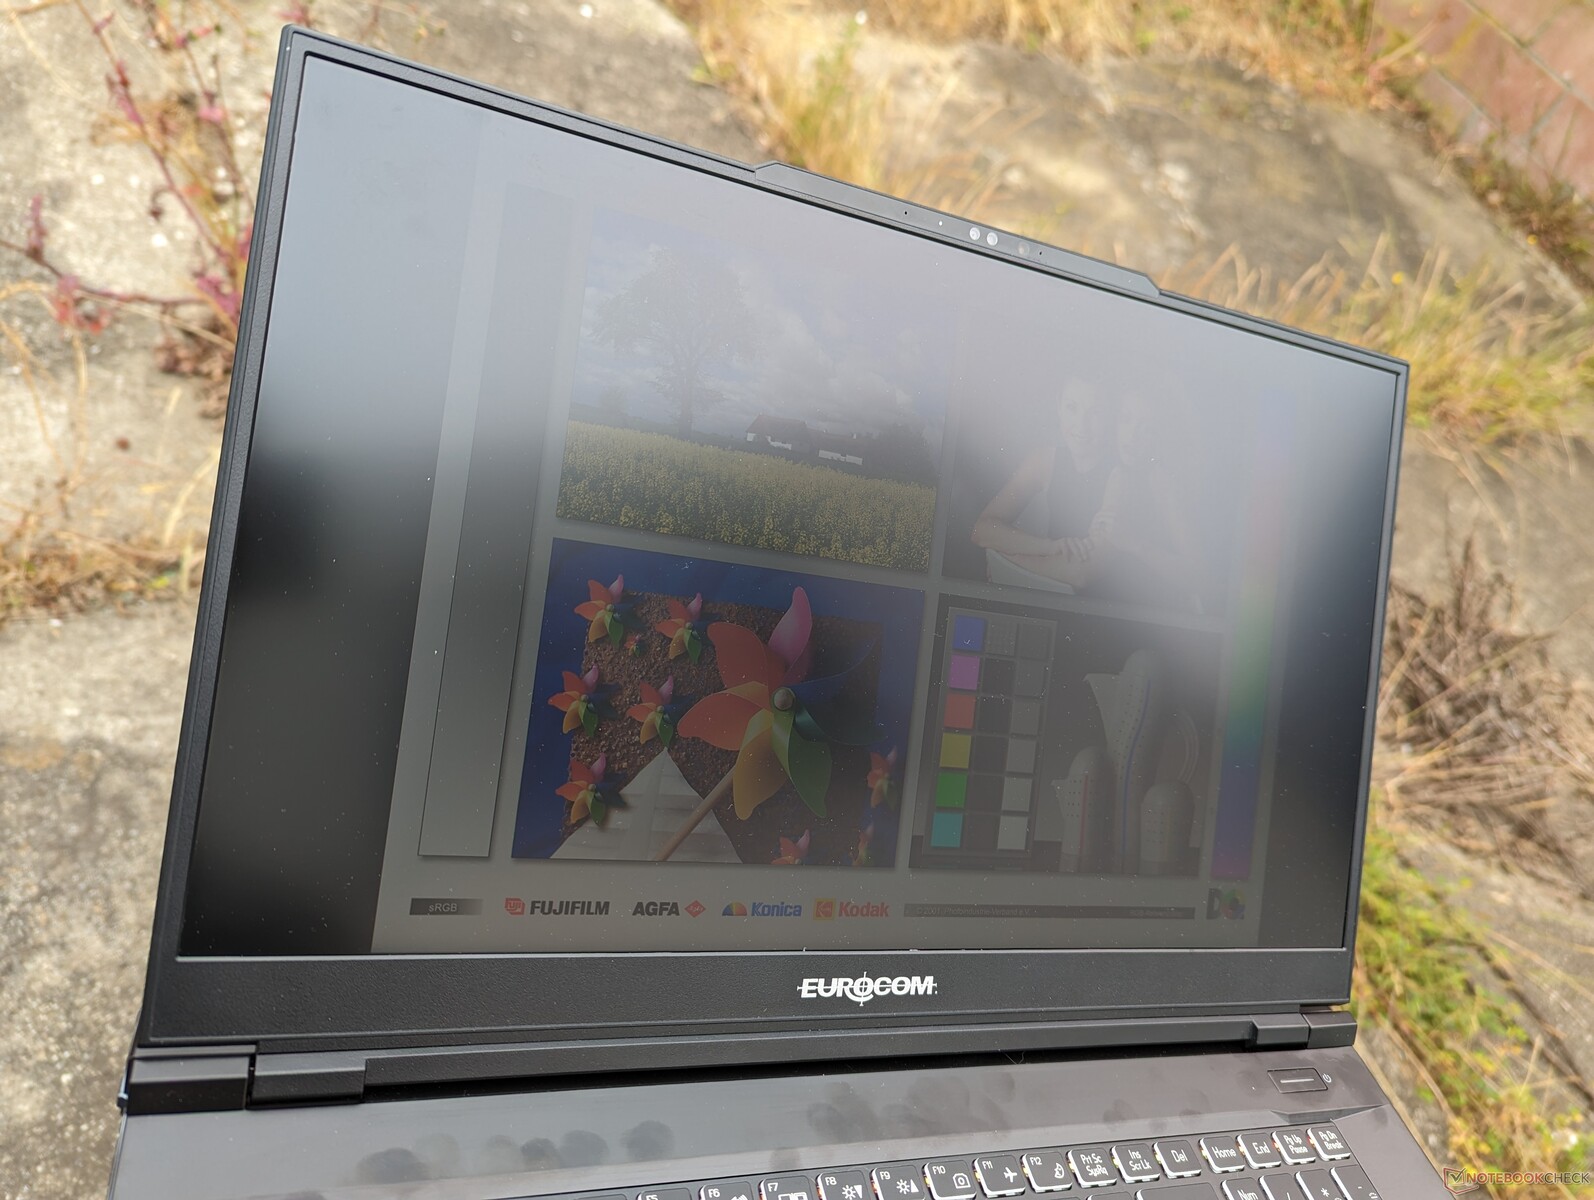
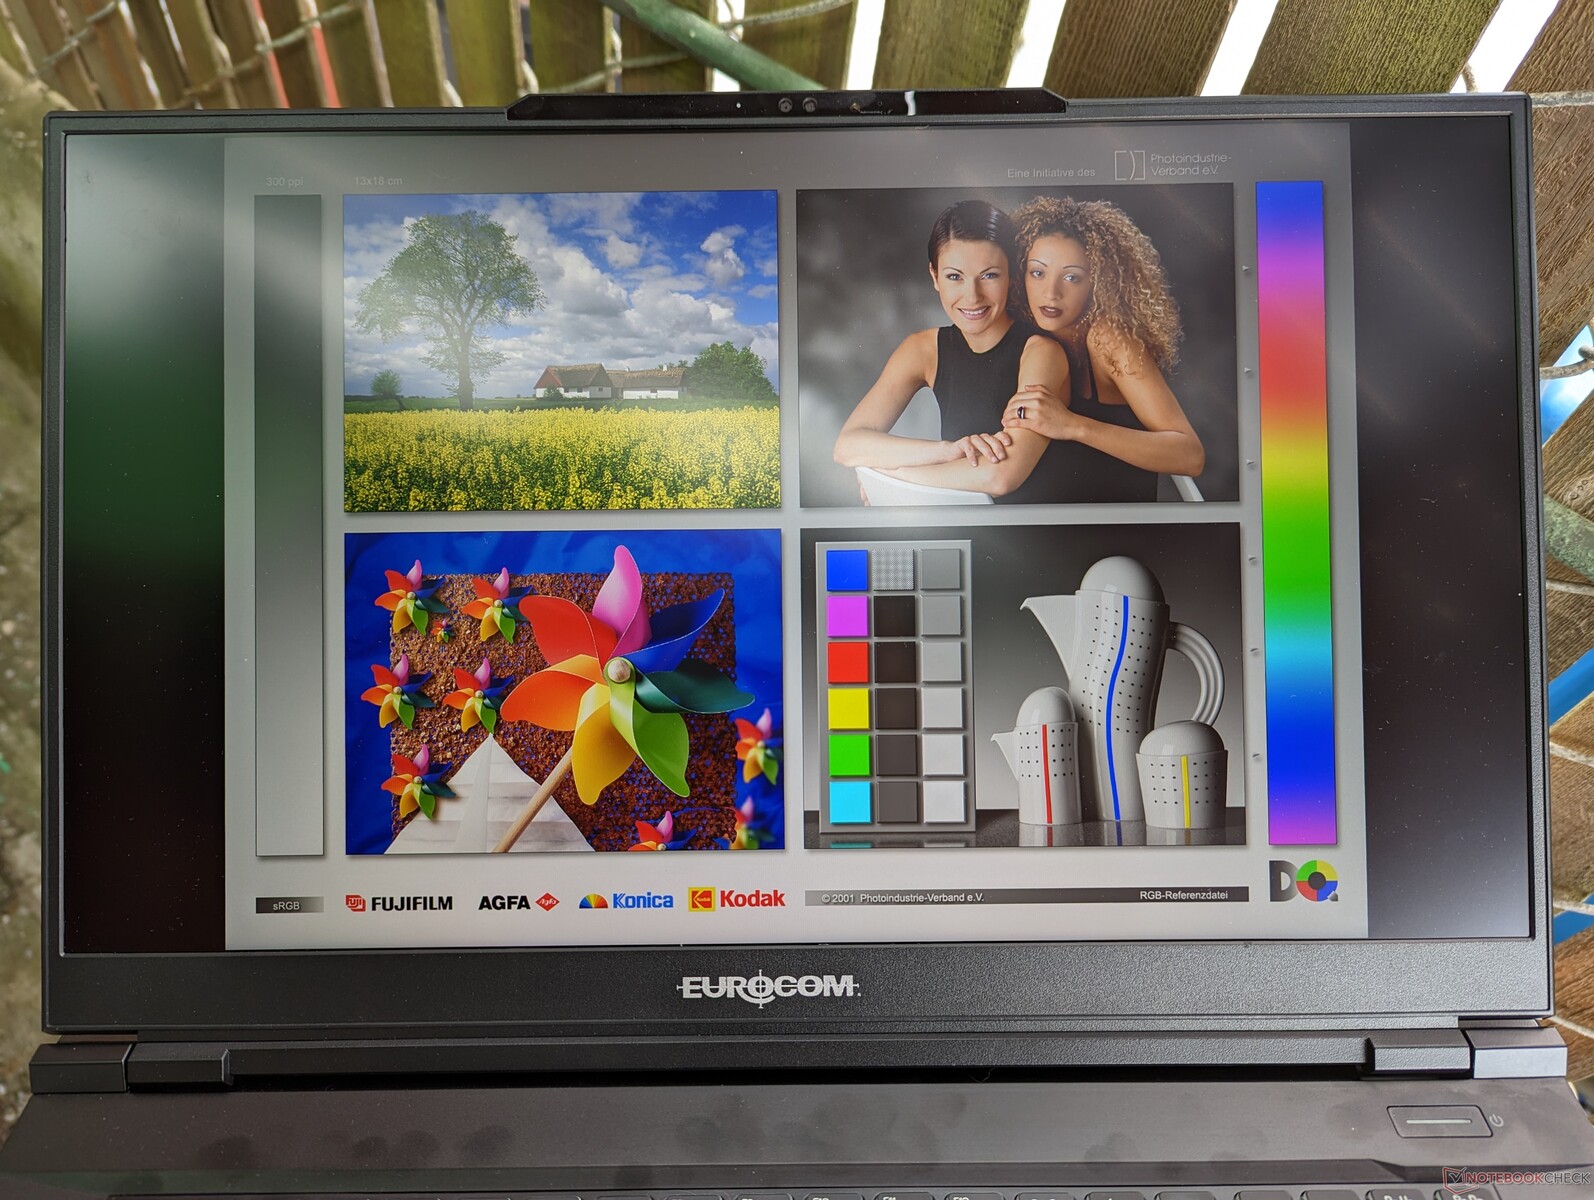
Synligheten utomhus är typisk för de flesta bärbara datorer för spel eftersom 300 nits är genomsnittligt för kategorin. Panelerna på vissa konkurrerande modeller kan nå upp till 500 nits, som till exempel påAlienware m17 R5 eller Razer Blade 17 för att det ska vara lättare att se utomhus, men vi ser inte detta som en stor fördel jämfört med Eurocom med tanke på storleken och vikten på bärbara 17-tums gamingdatorer.
Prestanda - Raptor Lake för Raptor X17
Provningsförhållanden
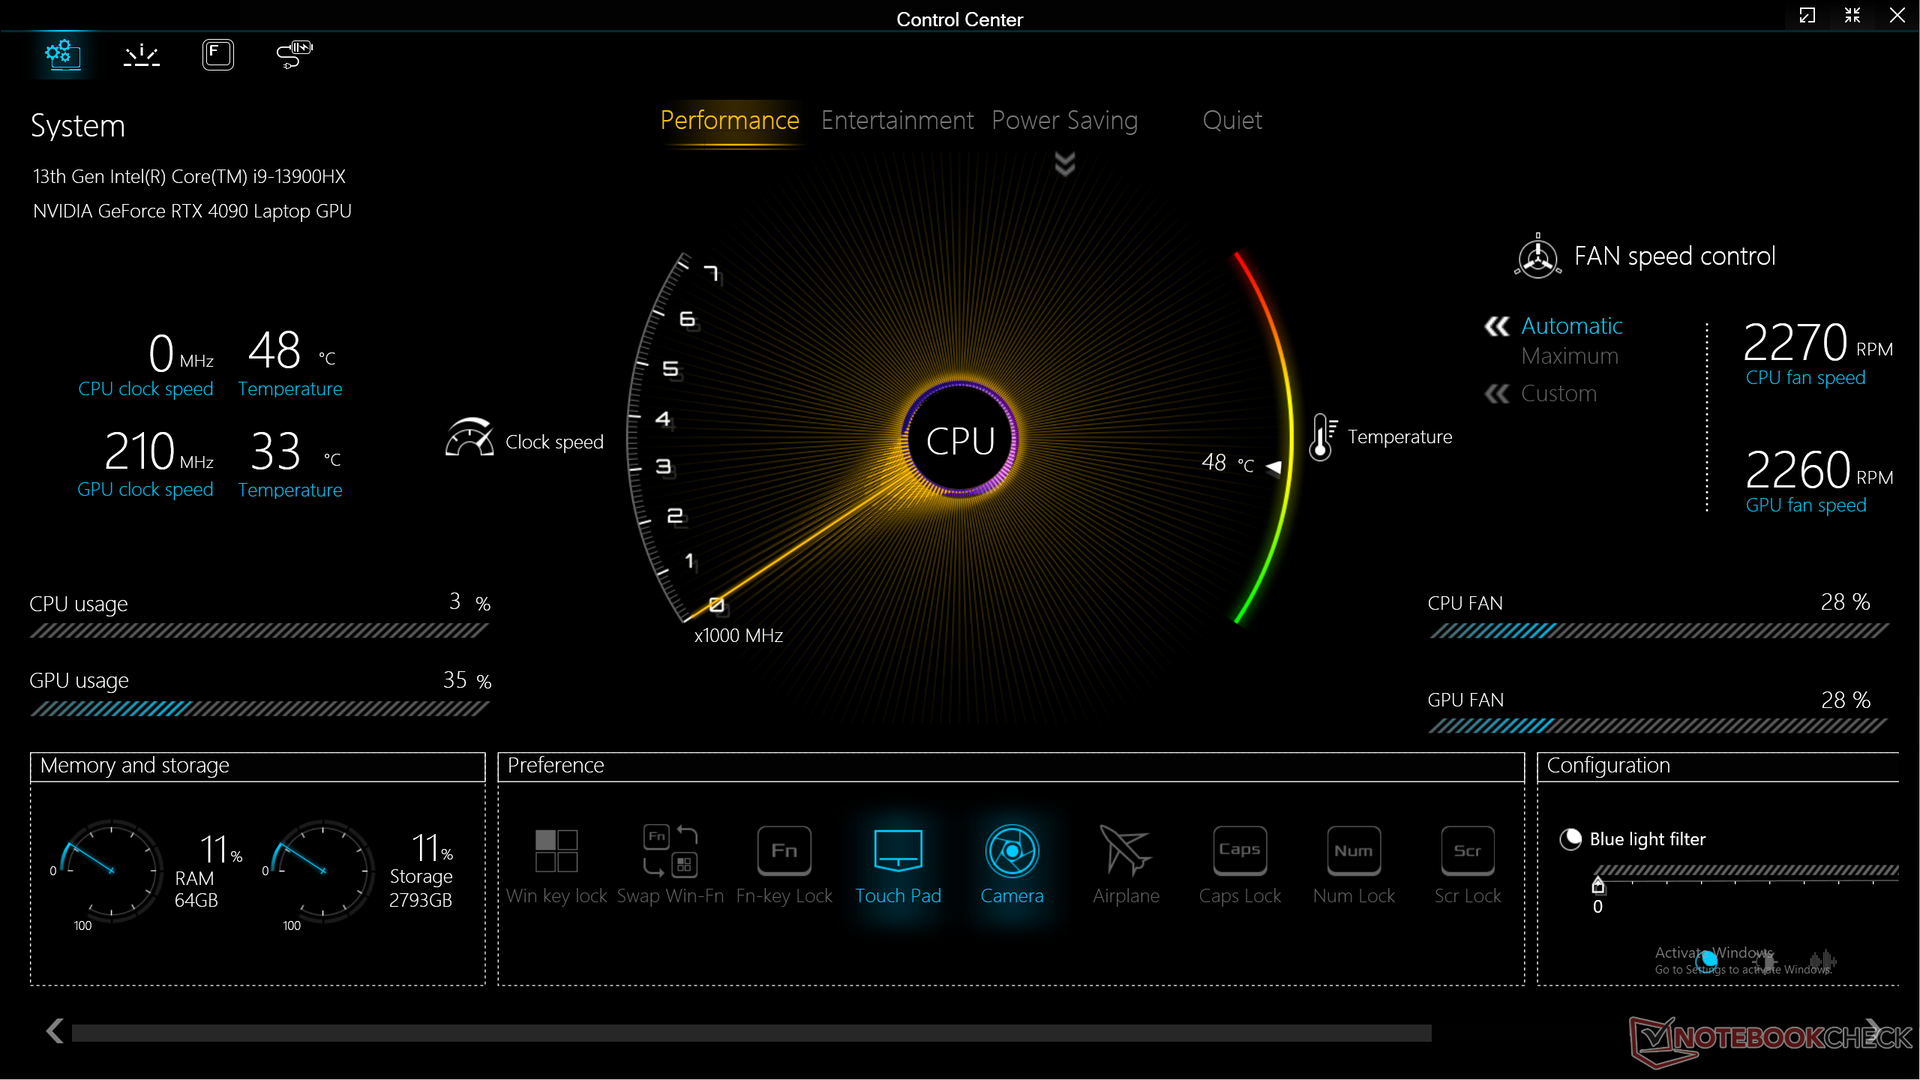
Vi ställde in vår enhet i prestandaläge via både Control Center och Windows innan vi körde benchmarks nedan. Det är irriterande att Control Centers ströminställningar inte är kopplade till Windows ströminställningar, vilket innebär att det kan uppstå en viss konflikt om de båda inställningarna inte är identiska. Det är till exempel möjligt att ställa in Windows i energisparläge och Control Center i prestandaläge samtidigt. OEM-tillverkare som Dell har redan tagit itu med detta problem i sin Alienware-serie.
Vi ställde också in vår enhet på dGPU-läge före benchmarking. Raptor X17 stöder hybridgrafikläge (Optimus), dGPU-läge och dynamiskt läge (även kallat Advanced Optimus). Även om vi uppskattar alternativen är inställningarna begravda djupt i flera lager av undermenyer i BIOS. I jämförelse har konkurrenter som MSI och Asus liknande inställningar i sina respektive Control Center-program för enklare åtkomst.
Processor
TheCore i9-13900HX i vår enhet presterar något långsammare än andra bärbara datorer med samma processor med cirka 5 procent. Oavsett detta är det fortfarande en av de snabbaste processorerna i H-serien på marknaden och konkurrerar med de konkurrerande Ryzen 9 7945HX. Uppgradering från förra årets Core i9-12900HX kommer att öka prestandan för flera trådar med cirka 20 procent.
Hållbar prestanda är utmärkt, särskilt om man jämför med Aorus 17X som levereras med samma Core i9-13900HX. CineBench R15 xT loop-poängen skulle vara jämnare på vår enhet under hela stresstestet, vilket framgår av jämförelsediagrammet nedan.
Nedgradering till konfigurationen Core i7-13700HX från vår Core i9-13900HX förväntas minska prestandan för flera trådar med cirka 20-25 procent
.Cinebench R15 Multi Loop
Cinebench R23: Multi Core | Single Core
Cinebench R20: CPU (Multi Core) | CPU (Single Core)
Cinebench R15: CPU Multi 64Bit | CPU Single 64Bit
Blender: v2.79 BMW27 CPU
7-Zip 18.03: 7z b 4 | 7z b 4 -mmt1
Geekbench 5.5: Multi-Core | Single-Core
HWBOT x265 Benchmark v2.2: 4k Preset
LibreOffice : 20 Documents To PDF
R Benchmark 2.5: Overall mean
* ... mindre är bättre
AIDA64: FP32 Ray-Trace | FPU Julia | CPU SHA3 | CPU Queen | FPU SinJulia | FPU Mandel | CPU AES | CPU ZLib | FP64 Ray-Trace | CPU PhotoWorxx
| Performance rating | |
| Asus ROG Strix Scar 17 G733PY-XS96 | |
| Eluktronics Mech-17 GP2 | |
| MSI GE78HX 13VH-070US | |
| Genomsnitt Intel Core i9-13900HX | |
| Eurocom Raptor X17 | |
| Aorus 17X AZF | |
| Alienware m17 R5 (R9 6900HX, RX 6850M XT) | |
| AIDA64 / FP32 Ray-Trace | |
| Asus ROG Strix Scar 17 G733PY-XS96 | |
| MSI GE78HX 13VH-070US | |
| Eluktronics Mech-17 GP2 | |
| Genomsnitt Intel Core i9-13900HX (17589 - 27615, n=22) | |
| Eurocom Raptor X17 | |
| Aorus 17X AZF | |
| Alienware m17 R5 (R9 6900HX, RX 6850M XT) | |
| AIDA64 / FPU Julia | |
| Asus ROG Strix Scar 17 G733PY-XS96 | |
| MSI GE78HX 13VH-070US | |
| Eluktronics Mech-17 GP2 | |
| Eurocom Raptor X17 | |
| Genomsnitt Intel Core i9-13900HX (88686 - 137015, n=22) | |
| Alienware m17 R5 (R9 6900HX, RX 6850M XT) | |
| Aorus 17X AZF | |
| AIDA64 / CPU SHA3 | |
| Asus ROG Strix Scar 17 G733PY-XS96 | |
| Eluktronics Mech-17 GP2 | |
| MSI GE78HX 13VH-070US | |
| Eurocom Raptor X17 | |
| Genomsnitt Intel Core i9-13900HX (4362 - 7029, n=22) | |
| Aorus 17X AZF | |
| Alienware m17 R5 (R9 6900HX, RX 6850M XT) | |
| AIDA64 / CPU Queen | |
| Asus ROG Strix Scar 17 G733PY-XS96 | |
| Eluktronics Mech-17 GP2 | |
| MSI GE78HX 13VH-070US | |
| Eurocom Raptor X17 | |
| Genomsnitt Intel Core i9-13900HX (125644 - 141385, n=22) | |
| Aorus 17X AZF | |
| Alienware m17 R5 (R9 6900HX, RX 6850M XT) | |
| AIDA64 / FPU SinJulia | |
| Asus ROG Strix Scar 17 G733PY-XS96 | |
| Eluktronics Mech-17 GP2 | |
| MSI GE78HX 13VH-070US | |
| Genomsnitt Intel Core i9-13900HX (12334 - 17179, n=22) | |
| Eurocom Raptor X17 | |
| Aorus 17X AZF | |
| Alienware m17 R5 (R9 6900HX, RX 6850M XT) | |
| AIDA64 / FPU Mandel | |
| Asus ROG Strix Scar 17 G733PY-XS96 | |
| MSI GE78HX 13VH-070US | |
| Eluktronics Mech-17 GP2 | |
| Genomsnitt Intel Core i9-13900HX (43850 - 69202, n=22) | |
| Eurocom Raptor X17 | |
| Alienware m17 R5 (R9 6900HX, RX 6850M XT) | |
| Aorus 17X AZF | |
| AIDA64 / CPU AES | |
| Eluktronics Mech-17 GP2 | |
| Asus ROG Strix Scar 17 G733PY-XS96 | |
| Aorus 17X AZF | |
| Genomsnitt Intel Core i9-13900HX (89413 - 237881, n=22) | |
| MSI GE78HX 13VH-070US | |
| Eurocom Raptor X17 | |
| Alienware m17 R5 (R9 6900HX, RX 6850M XT) | |
| AIDA64 / CPU ZLib | |
| Asus ROG Strix Scar 17 G733PY-XS96 | |
| MSI GE78HX 13VH-070US | |
| Eluktronics Mech-17 GP2 | |
| Eurocom Raptor X17 | |
| Genomsnitt Intel Core i9-13900HX (1284 - 1958, n=22) | |
| Aorus 17X AZF | |
| Alienware m17 R5 (R9 6900HX, RX 6850M XT) | |
| AIDA64 / FP64 Ray-Trace | |
| Asus ROG Strix Scar 17 G733PY-XS96 | |
| MSI GE78HX 13VH-070US | |
| Eluktronics Mech-17 GP2 | |
| Genomsnitt Intel Core i9-13900HX (9481 - 15279, n=22) | |
| Eurocom Raptor X17 | |
| Aorus 17X AZF | |
| Alienware m17 R5 (R9 6900HX, RX 6850M XT) | |
| AIDA64 / CPU PhotoWorxx | |
| Eurocom Raptor X17 | |
| Aorus 17X AZF | |
| MSI GE78HX 13VH-070US | |
| Genomsnitt Intel Core i9-13900HX (42994 - 51994, n=22) | |
| Eluktronics Mech-17 GP2 | |
| Asus ROG Strix Scar 17 G733PY-XS96 | |
| Alienware m17 R5 (R9 6900HX, RX 6850M XT) | |
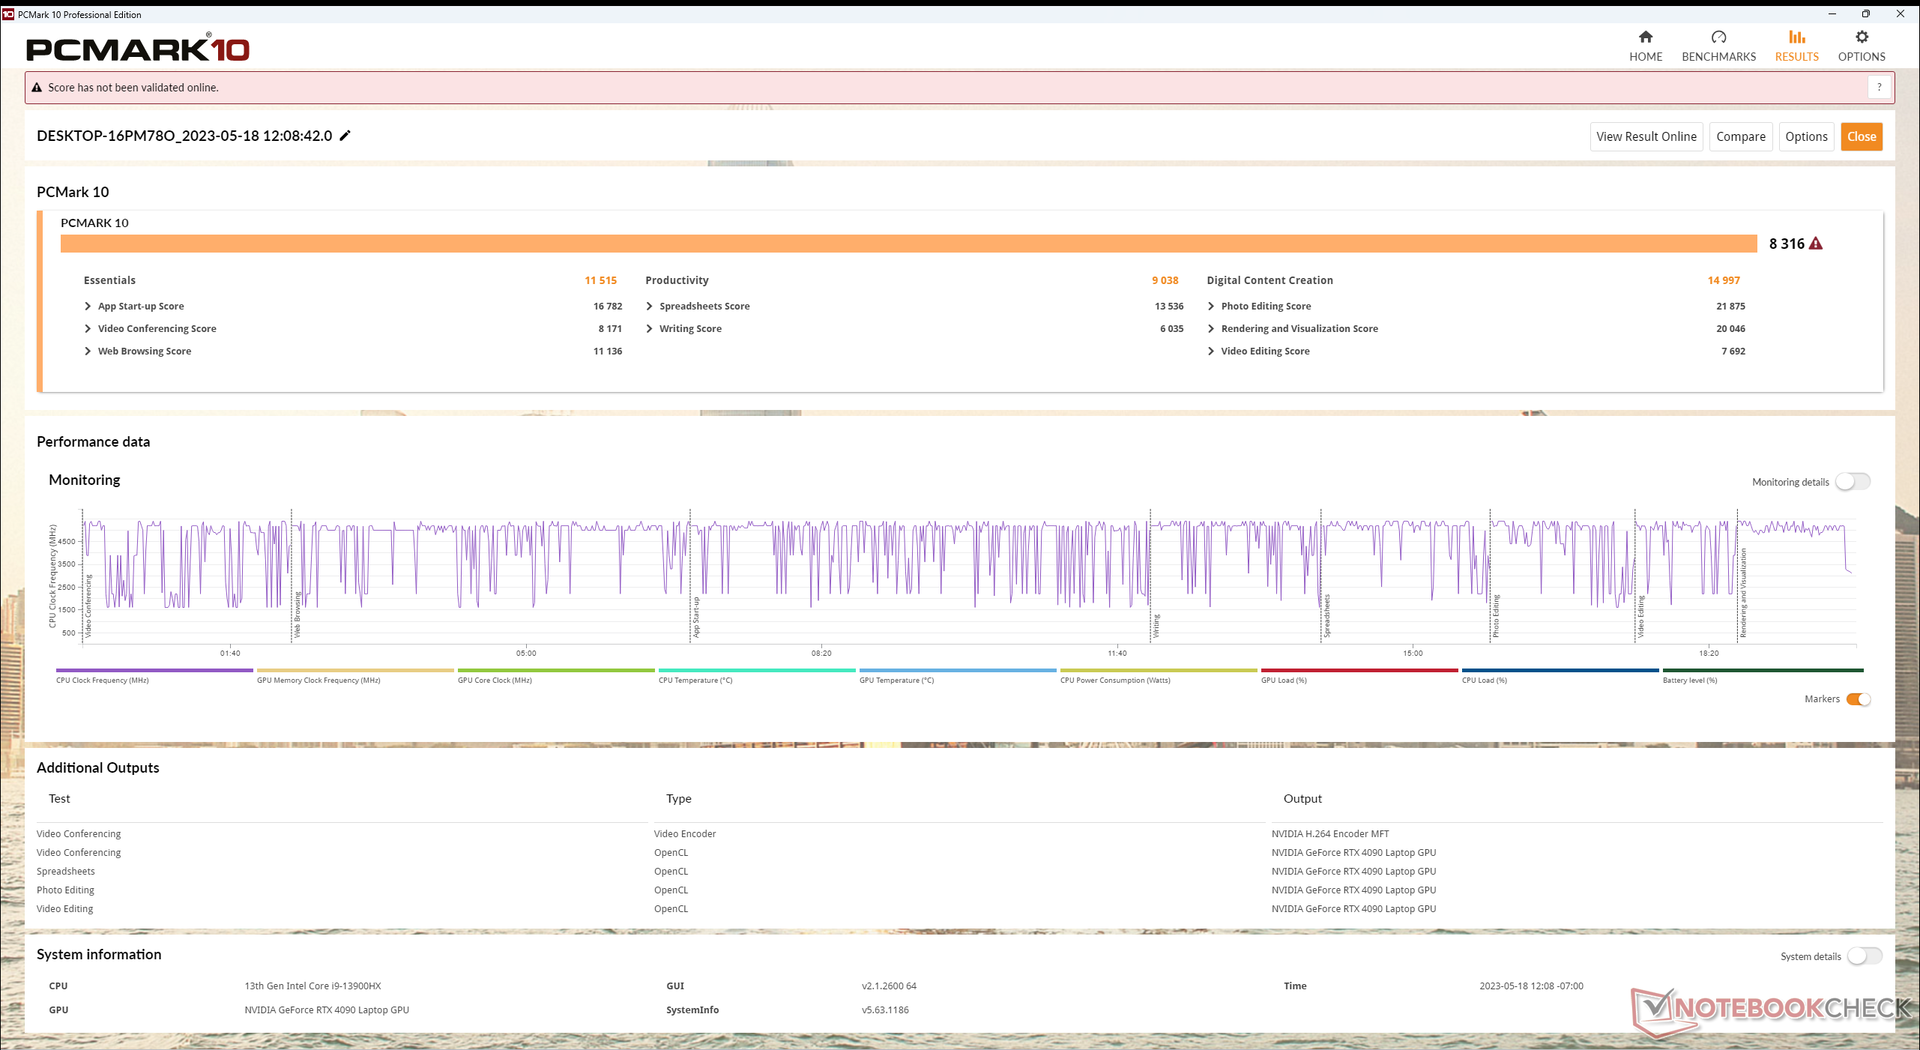
Systemets prestanda
Utvärdera systemets prestanda med hjälp av PCMark 10 benchmarks. Jämför med liknande konfigurationer (Är prestandan på den förväntade nivån?) och jämför med redan granskade enheter (länkar!) med hjälp av vår benchmark-databas (->benchmark-lista!!)
Varför presterar en enhet bra eller dåligt? Subjektiv prestanda i typiska tillämpningar (snappy? surfning med flera flikar och krävande tillämpningar, 4k Youtube).
Kort granskning:
Analys PCMark 10, jämförelse konkurrens. Max. 250 tecken
CrossMark: Overall | Productivity | Creativity | Responsiveness
| PCMark 10 / Score | |
| Eluktronics Mech-17 GP2 | |
| MSI GE78HX 13VH-070US | |
| Asus ROG Strix Scar 17 G733PY-XS96 | |
| Genomsnitt Intel Core i9-13900HX, NVIDIA GeForce RTX 4090 Laptop GPU (7690 - 9331, n=8) | |
| Eurocom Raptor X17 | |
| Aorus 17X AZF | |
| Alienware m17 R5 (R9 6900HX, RX 6850M XT) | |
| PCMark 10 / Essentials | |
| Eluktronics Mech-17 GP2 | |
| Eurocom Raptor X17 | |
| MSI GE78HX 13VH-070US | |
| Genomsnitt Intel Core i9-13900HX, NVIDIA GeForce RTX 4090 Laptop GPU (10972 - 11983, n=8) | |
| Aorus 17X AZF | |
| Asus ROG Strix Scar 17 G733PY-XS96 | |
| Alienware m17 R5 (R9 6900HX, RX 6850M XT) | |
| PCMark 10 / Productivity | |
| Eluktronics Mech-17 GP2 | |
| MSI GE78HX 13VH-070US | |
| Genomsnitt Intel Core i9-13900HX, NVIDIA GeForce RTX 4090 Laptop GPU (9038 - 11680, n=8) | |
| Aorus 17X AZF | |
| Asus ROG Strix Scar 17 G733PY-XS96 | |
| Alienware m17 R5 (R9 6900HX, RX 6850M XT) | |
| Eurocom Raptor X17 | |
| PCMark 10 / Digital Content Creation | |
| Asus ROG Strix Scar 17 G733PY-XS96 | |
| Eluktronics Mech-17 GP2 | |
| MSI GE78HX 13VH-070US | |
| Eurocom Raptor X17 | |
| Genomsnitt Intel Core i9-13900HX, NVIDIA GeForce RTX 4090 Laptop GPU (10605 - 16395, n=8) | |
| Alienware m17 R5 (R9 6900HX, RX 6850M XT) | |
| Aorus 17X AZF | |
| CrossMark / Overall | |
| Eluktronics Mech-17 GP2 | |
| Aorus 17X AZF | |
| Genomsnitt Intel Core i9-13900HX, NVIDIA GeForce RTX 4090 Laptop GPU (1825 - 2295, n=8) | |
| Asus ROG Strix Scar 17 G733PY-XS96 | |
| MSI GE78HX 13VH-070US | |
| Eurocom Raptor X17 | |
| Alienware m17 R5 (R9 6900HX, RX 6850M XT) | |
| CrossMark / Productivity | |
| Aorus 17X AZF | |
| Eluktronics Mech-17 GP2 | |
| Genomsnitt Intel Core i9-13900HX, NVIDIA GeForce RTX 4090 Laptop GPU (1666 - 2166, n=8) | |
| MSI GE78HX 13VH-070US | |
| Asus ROG Strix Scar 17 G733PY-XS96 | |
| Eurocom Raptor X17 | |
| Alienware m17 R5 (R9 6900HX, RX 6850M XT) | |
| CrossMark / Creativity | |
| Eluktronics Mech-17 GP2 | |
| Genomsnitt Intel Core i9-13900HX, NVIDIA GeForce RTX 4090 Laptop GPU (2162 - 2514, n=8) | |
| Asus ROG Strix Scar 17 G733PY-XS96 | |
| Aorus 17X AZF | |
| Eurocom Raptor X17 | |
| MSI GE78HX 13VH-070US | |
| Alienware m17 R5 (R9 6900HX, RX 6850M XT) | |
| CrossMark / Responsiveness | |
| Aorus 17X AZF | |
| Eluktronics Mech-17 GP2 | |
| Genomsnitt Intel Core i9-13900HX, NVIDIA GeForce RTX 4090 Laptop GPU (1441 - 2275, n=8) | |
| MSI GE78HX 13VH-070US | |
| Asus ROG Strix Scar 17 G733PY-XS96 | |
| Eurocom Raptor X17 | |
| Alienware m17 R5 (R9 6900HX, RX 6850M XT) | |
| PCMark 10 Score | 8316 poäng | |
Hjälp | ||
| AIDA64 / Memory Copy | |
| Aorus 17X AZF | |
| MSI GE78HX 13VH-070US | |
| Eurocom Raptor X17 | |
| Genomsnitt Intel Core i9-13900HX (67716 - 79193, n=22) | |
| Eluktronics Mech-17 GP2 | |
| Alienware m17 R5 (R9 6900HX, RX 6850M XT) | |
| Asus ROG Strix Scar 17 G733PY-XS96 | |
| AIDA64 / Memory Read | |
| Aorus 17X AZF | |
| MSI GE78HX 13VH-070US | |
| Genomsnitt Intel Core i9-13900HX (73998 - 88462, n=22) | |
| Eurocom Raptor X17 | |
| Eluktronics Mech-17 GP2 | |
| Asus ROG Strix Scar 17 G733PY-XS96 | |
| Alienware m17 R5 (R9 6900HX, RX 6850M XT) | |
| AIDA64 / Memory Write | |
| Aorus 17X AZF | |
| MSI GE78HX 13VH-070US | |
| Eurocom Raptor X17 | |
| Genomsnitt Intel Core i9-13900HX (65472 - 77045, n=22) | |
| Eluktronics Mech-17 GP2 | |
| Asus ROG Strix Scar 17 G733PY-XS96 | |
| Alienware m17 R5 (R9 6900HX, RX 6850M XT) | |
| AIDA64 / Memory Latency | |
| Alienware m17 R5 (R9 6900HX, RX 6850M XT) | |
| Eluktronics Mech-17 GP2 | |
| Genomsnitt Intel Core i9-13900HX (75.3 - 91.1, n=22) | |
| MSI GE78HX 13VH-070US | |
| Eurocom Raptor X17 | |
| Asus ROG Strix Scar 17 G733PY-XS96 | |
| Aorus 17X AZF | |
* ... mindre är bättre
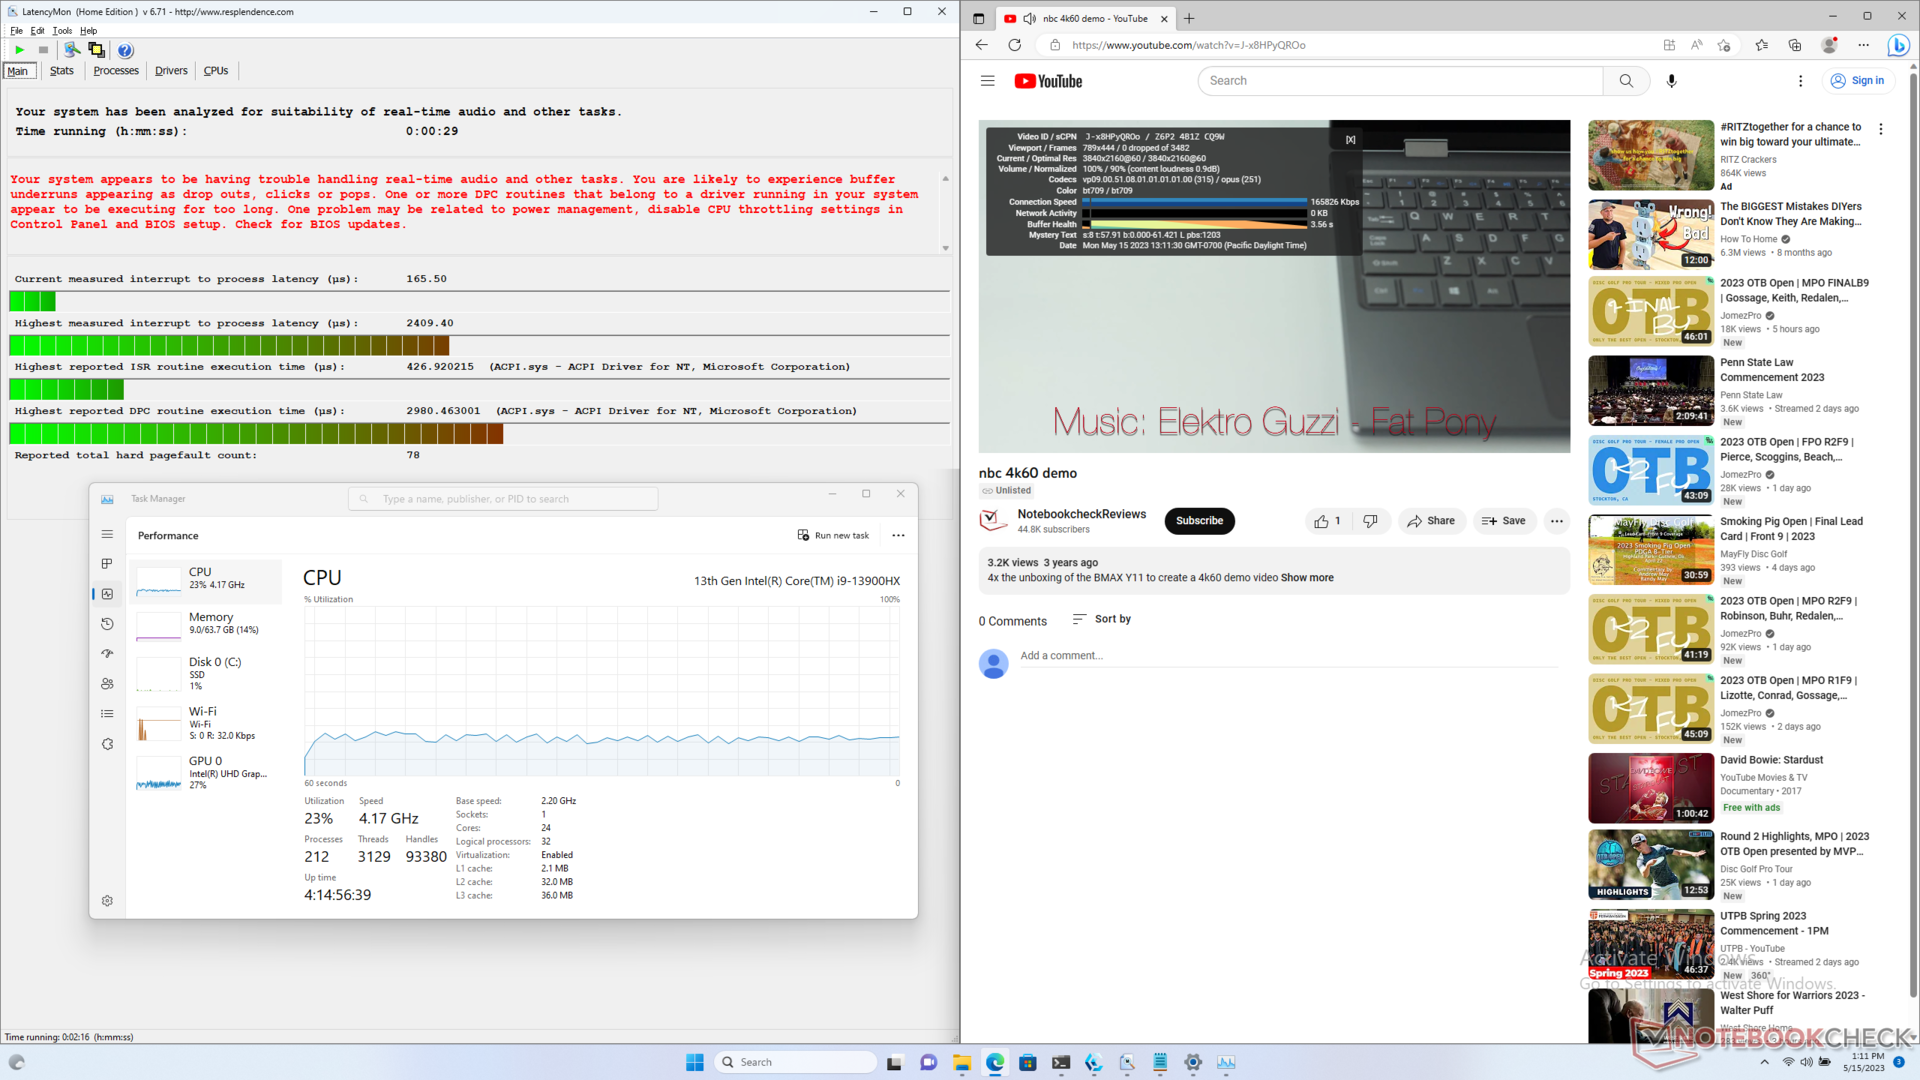
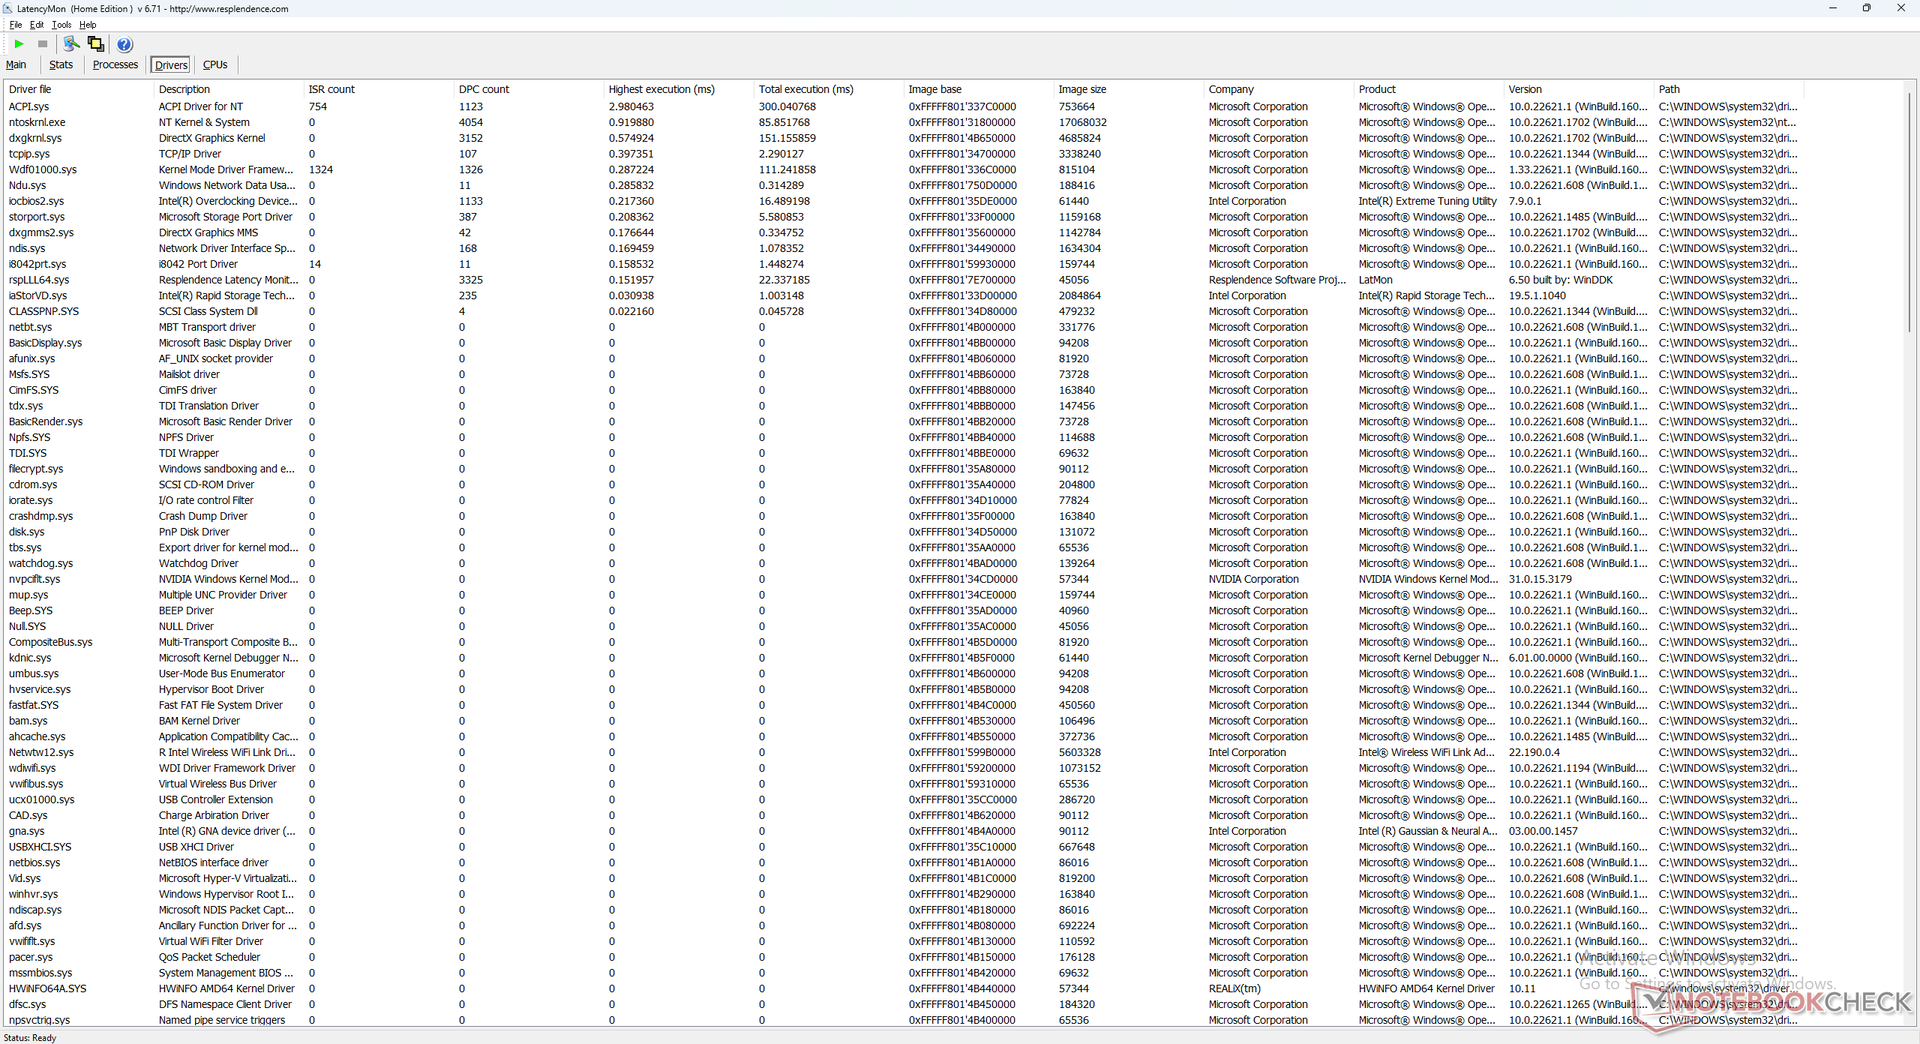
DPC-latenstid
LatencyMon avslöjar DPC-problem när du öppnar flera webbläsarflikar på vår hemsida. uppspelning av 4K-video vid 60 FPS är annars perfekt med lågt CPU-utnyttjande och inga tappade bilder.
| DPC Latencies / LatencyMon - interrupt to process latency (max), Web, Youtube, Prime95 | |
| Aorus 17X AZF | |
| MSI GE78HX 13VH-070US | |
| Eurocom Raptor X17 | |
| Asus ROG Strix Scar 17 G733PY-XS96 | |
| Alienware m17 R5 (R9 6900HX, RX 6850M XT) | |
| Eluktronics Mech-17 GP2 | |
* ... mindre är bättre
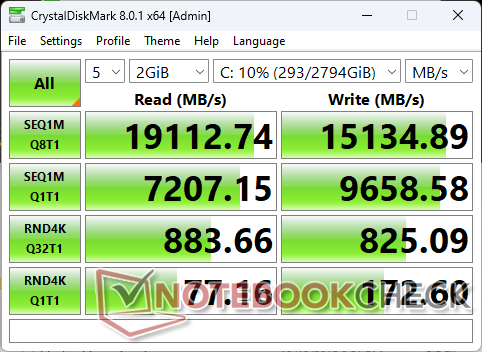
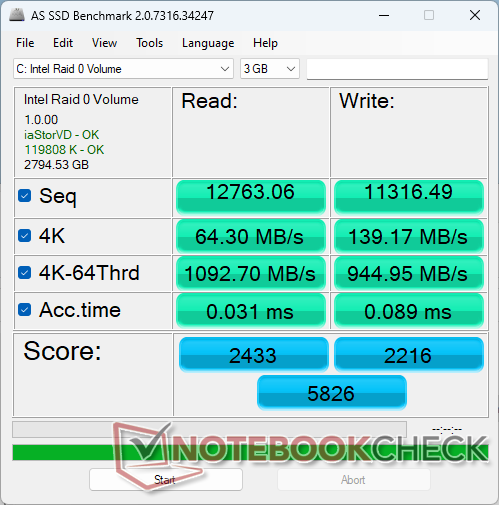
Lagringsenheter - 3x PCIe4 x4 NVMe SSD-enheter
Vår enhet är konfigurerad med tre Samsung 980 Pro PCIe4 x4 NVMe SSD-diskar i RAID 0 för att maximera prestandan. Detta är faktiskt en av de få bärbara datorer för spel som stöder så många enheter i RAID-konfiguration. Maximala överföringshastigheter når upp till cirka 19 000 MB/s, men räkna med att prestandan kommer att pendla mellan 15 000 och 18 000 MB/s när du är stressad, vilket fortfarande är imponerande. Vi kan inte märka några större strypningsproblem i detta avseende.


| Drive Performance rating - Percent | |
| Aorus 17X AZF | |
| MSI GE78HX 13VH-070US | |
| Eurocom Raptor X17 | |
| Asus ROG Strix Scar 17 G733PY-XS96 | |
| Eluktronics Mech-17 GP2 | |
| Alienware m17 R5 (R9 6900HX, RX 6850M XT) | |
* ... mindre är bättre
Disk Throttling: DiskSpd Read Loop, Queue Depth 8
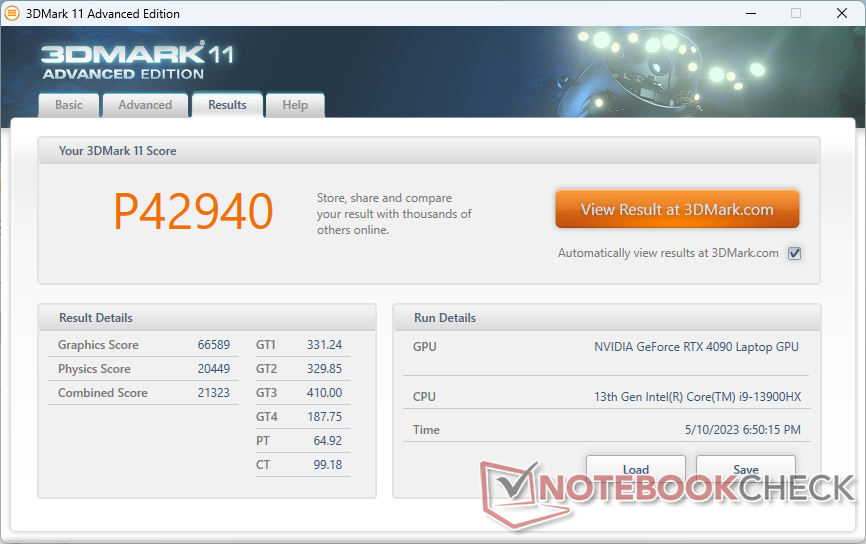
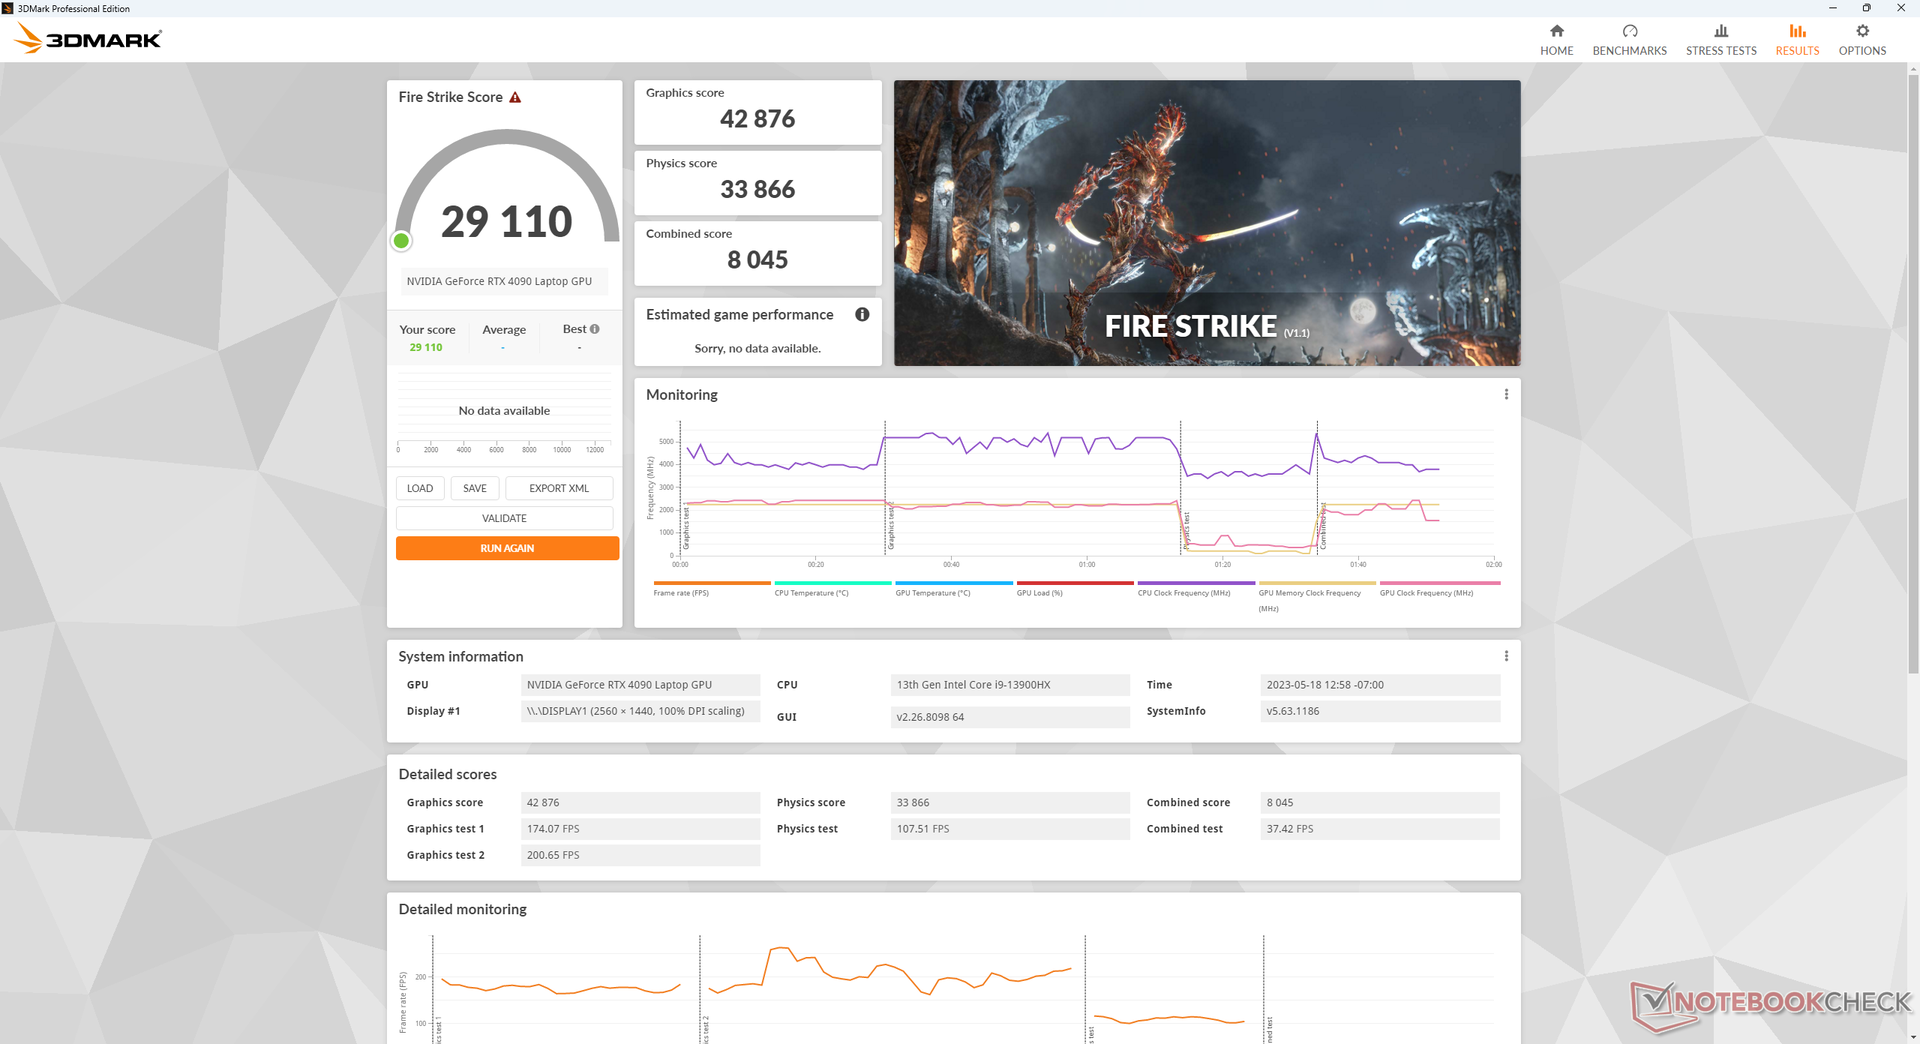
GPU-prestanda - 175 W TGP Graphics
Grafikprestanda ligger inom några få procentenheter från den genomsnittliga bärbara datorn i vår databas med samma GeForce RTX 4090 GPU. Att köra i underhållningsläge istället för prestandaläge skulle minska grafikprestandan med cirka 4 till 5 procent. En "riktig" stationär dator GeForce RTX 4090 är fortfarande betydligt snabbare än vår mobila RTX 4090 med cirka 60-80 procent på grund av de kraftiga termiska begränsningarna för mobila grafikkretsar.
Observera att en nedgradering till mobila GeForce RTX 4080 konfigurationen endast skulle minska grafikprestandan med cirka 5-10 procent. Således kan det mobila RTX 4080 vara värt att överväga eftersom prestandan är så likartad mellan de två grafikprocessorerna.
| 3DMark Performance rating - Percent | |
| Palit GeForce RTX 4090 GameRock OC -2! | |
| Asus ROG Strix Scar 17 G733PY-XS96 | |
| Genomsnitt NVIDIA GeForce RTX 4090 Laptop GPU | |
| Eurocom Raptor X17 | |
| MSI GE78HX 13VH-070US | |
| MSI Titan GT77 12UHS -1! | |
| Alienware x17 RTX 3080 P48E -1! | |
| Alienware m17 R5 (R9 6900HX, RX 6850M XT) -2! | |
| Acer Nitro 5 AN515-46-R1A1 -1! | |
| Asus ROG Strix G15 G513QY -2! | |
| MSI GT76 Titan DT 10SGS -1! | |
| MSI Pulse GL76 12UGK | |
| Asus TUF A15 FA507 | |
| 3DMark 11 Performance | 42940 poäng | |
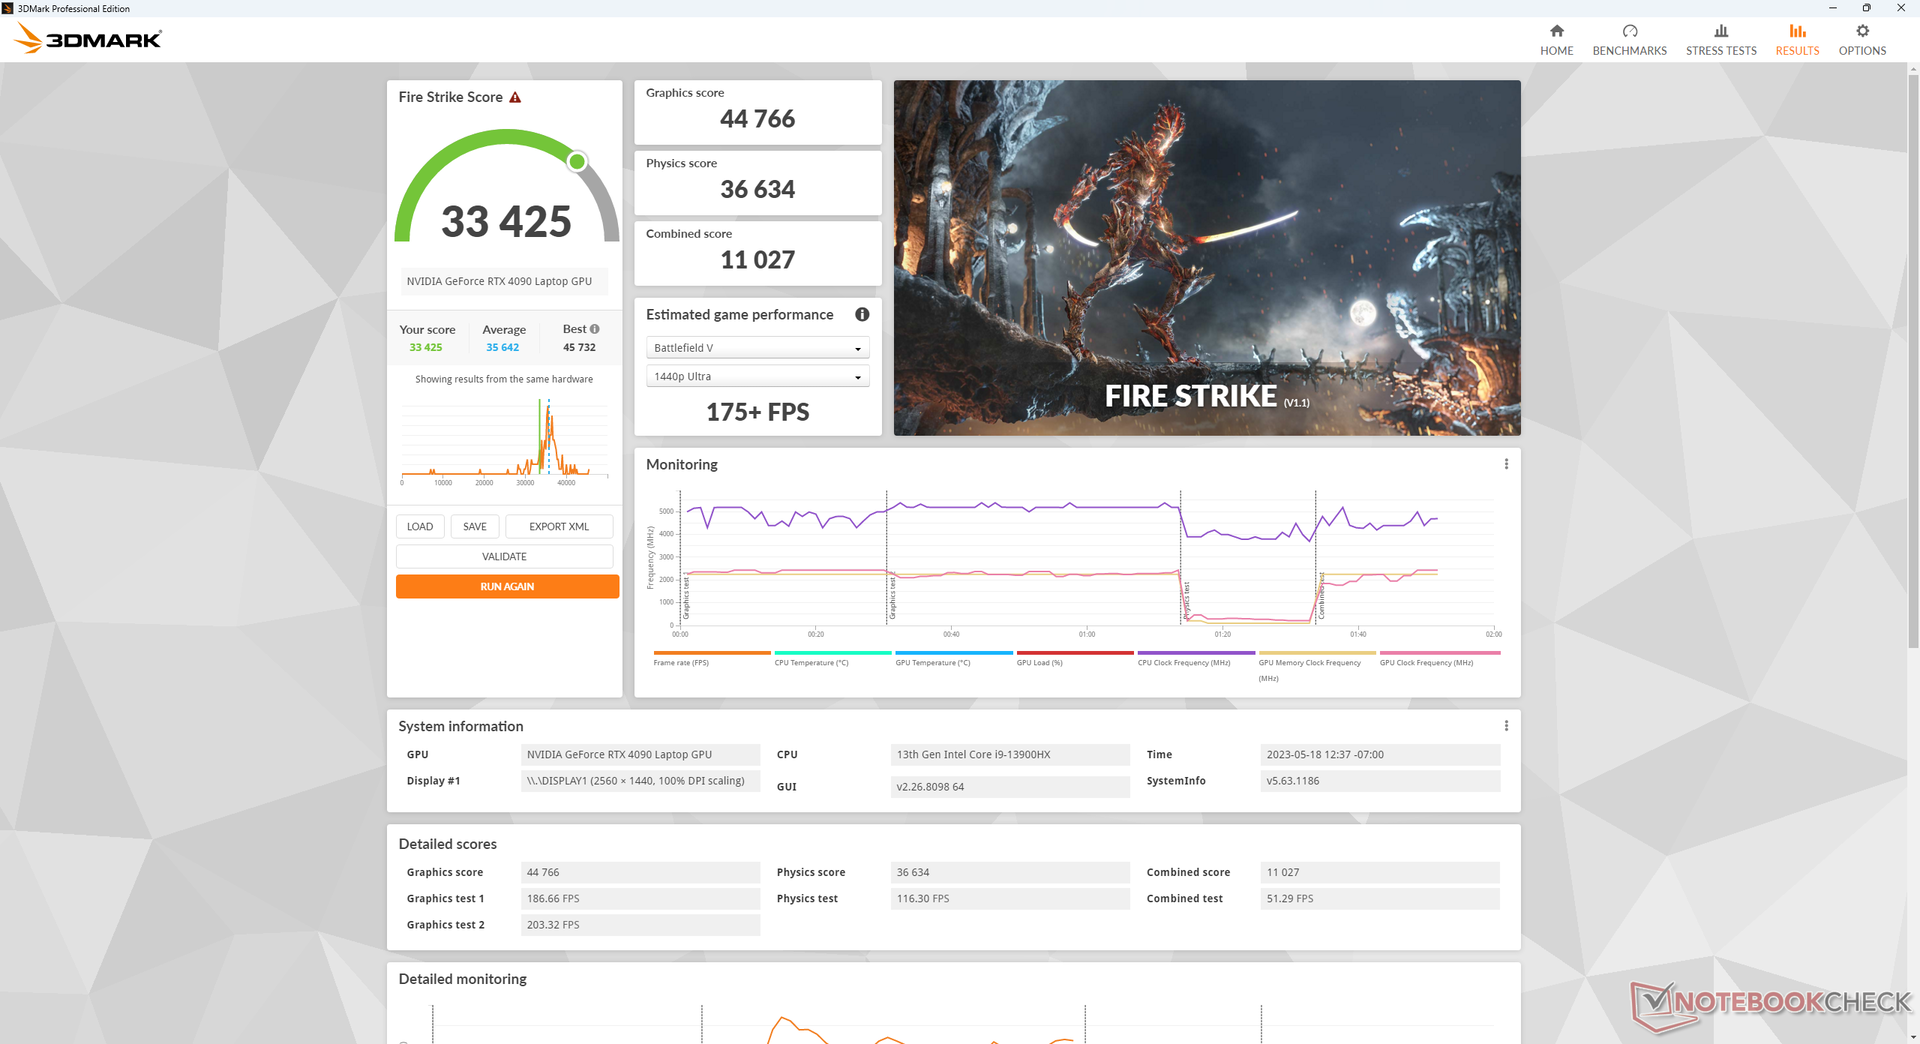
| 3DMark Fire Strike Score | 33425 poäng | |
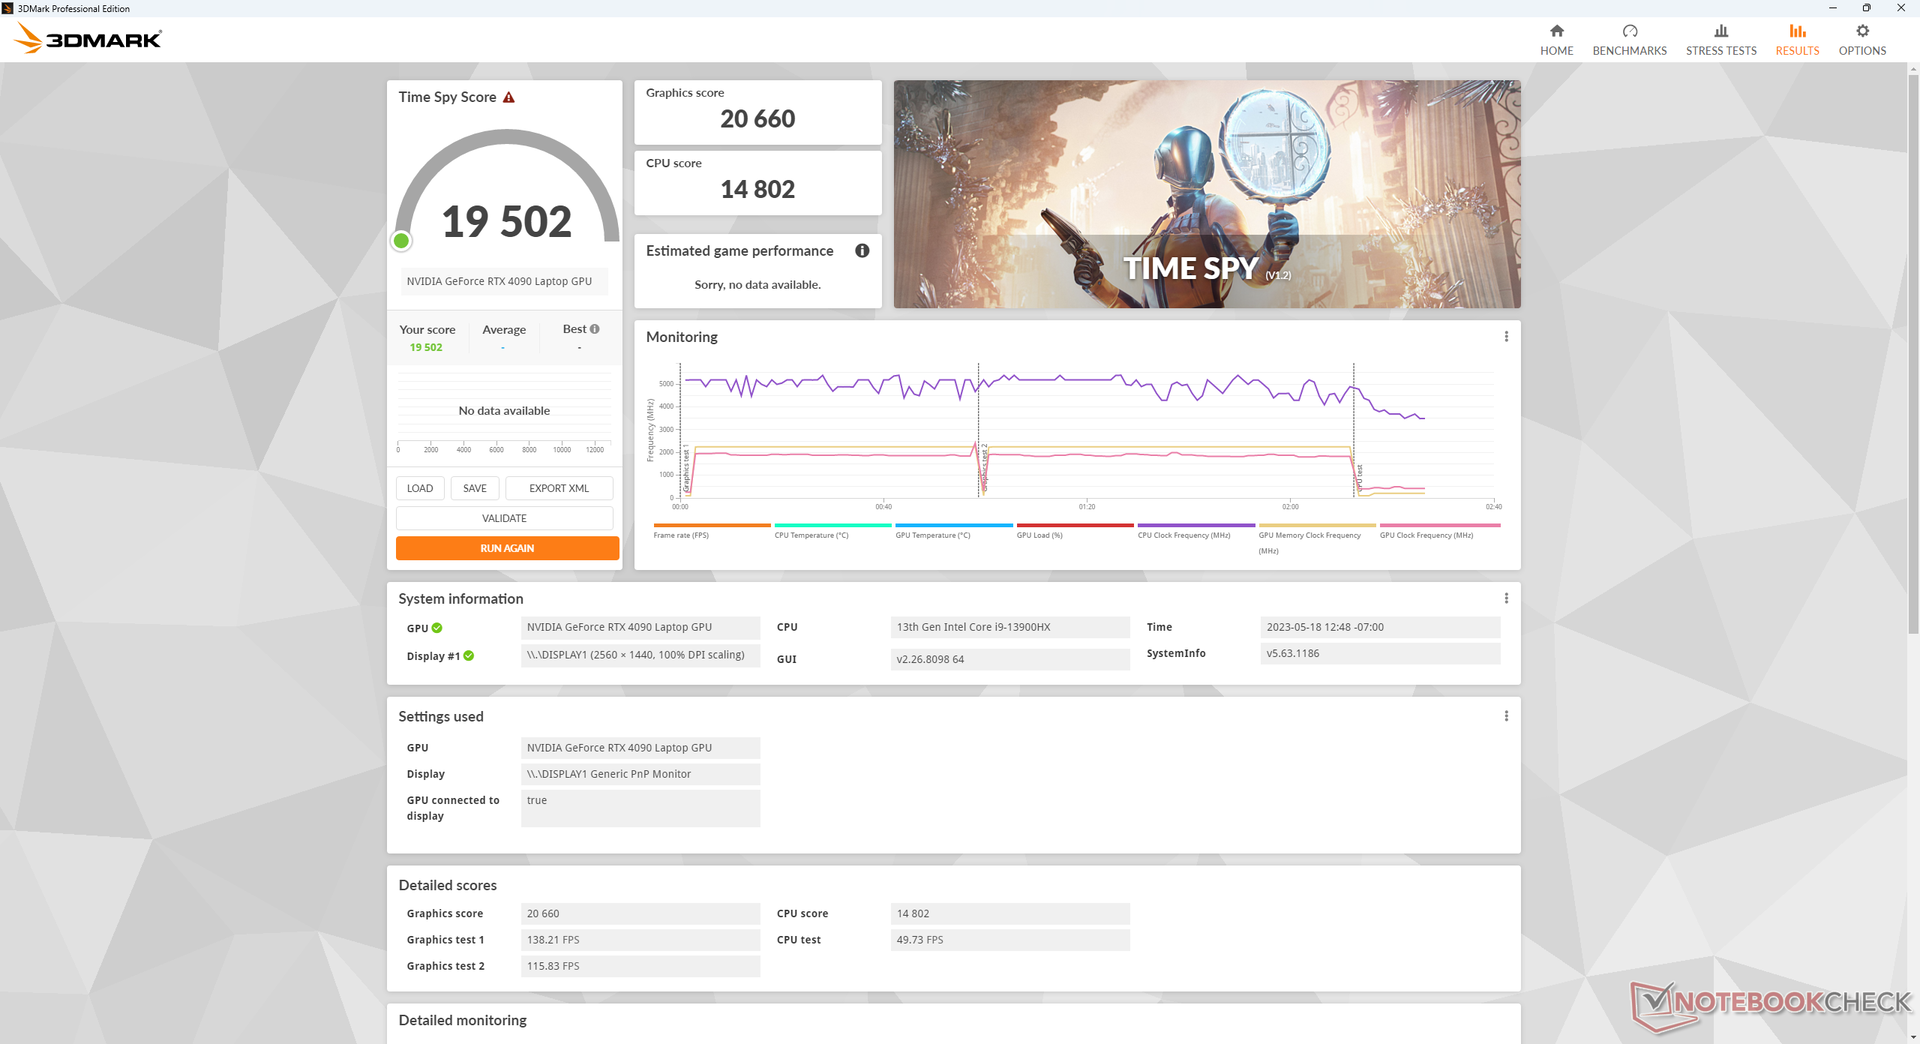
| 3DMark Time Spy Score | 19502 poäng | |
Hjälp | ||
* ... mindre är bättre
Spelprestanda
Även om det mobila RTX 4090 inte alls är lika snabbt som ett stationärt RTX 4090 är det fortfarande tillräckligt snabbt för de mest krävande titlarna som F1 22, Returnal eller Cyberpunk 2077. Mer specifikt verkar det mobila RTX 4090 vara idealiskt för att sikta in sig på 1440p vid 120 FPS eller 4K vid 60 FPS vid höga till ultra inställningar. Du kommer att vilja köra i dGPU-läge eller Advanced Optimus-läge när det är möjligt, särskilt eftersom G-Sync inte är tillgängligt i hybridgrafikläge.
| The Witcher 3 - 1920x1080 Ultra Graphics & Postprocessing (HBAO+) | |
| Palit GeForce RTX 4090 GameRock OC | |
| Eurocom Raptor X17 | |
| Asus ROG Strix Scar 17 G733PY-XS96 | |
| MSI GE78HX 13VH-070US | |
| MSI Titan GT77 12UHS | |
| Alienware m17 R5 (R9 6900HX, RX 6850M XT) | |
| MSI GT76 Titan DT 10SGS | |
| Asus ROG Strix G15 G513QY | |
| Acer Nitro 5 AN515-46-R1A1 | |
| Alienware x17 RTX 3080 P48E | |
| MSI Pulse GL76 12UGK | |
| Asus TUF A15 FA507 | |
| GTA V - 1920x1080 Highest AA:4xMSAA + FX AF:16x | |
| Palit GeForce RTX 4090 GameRock OC | |
| Eurocom Raptor X17 | |
| MSI Titan GT77 12UHS | |
| Asus ROG Strix Scar 17 G733PY-XS96 | |
| MSI Pulse GL76 12UGK | |
| MSI GE78HX 13VH-070US | |
| MSI GT76 Titan DT 10SGS | |
| Alienware x17 RTX 3080 P48E | |
| Alienware m17 R5 (R9 6900HX, RX 6850M XT) | |
| Acer Nitro 5 AN515-46-R1A1 | |
| Asus TUF A15 FA507 | |
| Asus ROG Strix G15 G513QY | |
| Final Fantasy XV Benchmark - 1920x1080 High Quality | |
| Palit GeForce RTX 4090 GameRock OC | |
| Eurocom Raptor X17 | |
| Asus ROG Strix Scar 17 G733PY-XS96 | |
| MSI GE78HX 13VH-070US | |
| MSI Titan GT77 12UHS | |
| Alienware m17 R5 (R9 6900HX, RX 6850M XT) | |
| Acer Nitro 5 AN515-46-R1A1 | |
| MSI GT76 Titan DT 10SGS | |
| Alienware x17 RTX 3080 P48E | |
| Asus ROG Strix G15 G513QY | |
| MSI Pulse GL76 12UGK | |
| Asus TUF A15 FA507 | |
| Strange Brigade - 1920x1080 ultra AA:ultra AF:16 | |
| Palit GeForce RTX 4090 GameRock OC | |
| Eurocom Raptor X17 | |
| MSI GE78HX 13VH-070US | |
| Alienware m17 R5 (R9 6900HX, RX 6850M XT) | |
| MSI Titan GT77 12UHS | |
| Alienware x17 RTX 3080 P48E | |
| MSI GT76 Titan DT 10SGS | |
| Asus ROG Strix G15 G513QY | |
| Acer Nitro 5 AN515-46-R1A1 | |
| MSI Pulse GL76 12UGK | |
| Asus TUF A15 FA507 | |
| Dota 2 Reborn - 1920x1080 ultra (3/3) best looking | |
| Palit GeForce RTX 4090 GameRock OC | |
| Eurocom Raptor X17 | |
| MSI Titan GT77 12UHS | |
| MSI GT76 Titan DT 10SGS | |
| MSI GE78HX 13VH-070US | |
| Asus ROG Strix Scar 17 G733PY-XS96 | |
| Alienware x17 RTX 3080 P48E | |
| MSI Pulse GL76 12UGK | |
| Asus TUF A15 FA507 | |
| Acer Nitro 5 AN515-46-R1A1 | |
| Alienware m17 R5 (R9 6900HX, RX 6850M XT) | |
Witcher 3 FPS Chart
| låg | med. | hög | ultra | QHD | 4K | |
|---|---|---|---|---|---|---|
| GTA V (2015) | 187.2 | 186.4 | 183.7 | 139.5 | 134.3 | 173.6 |
| The Witcher 3 (2015) | 512.8 | 448.8 | 388.1 | 207.2 | 163.8 | |
| Dota 2 Reborn (2015) | 234 | 207 | 199.4 | 184.9 | 178.5 | |
| Final Fantasy XV Benchmark (2018) | 219 | 204 | 172.2 | 149 | 88.8 | |
| X-Plane 11.11 (2018) | 192.9 | 172.1 | 136.2 | 117.3 | ||
| Strange Brigade (2018) | 439 | 351 | 341 | 328 | 300 | 155.2 |
| Cyberpunk 2077 1.6 (2022) | 114 | 109.4 | 103.7 | 91 | 87.3 | 47.3 |
| Tiny Tina's Wonderlands (2022) | 271.8 | 238.8 | 203.3 | 183.1 | 130.7 | 68.7 |
| F1 22 (2022) | 210 | 209 | 199 | 120.8 | 90.2 | 44.3 |
| Returnal (2023) | 145 | 153 | 159 | 141 | 115 | 69 |
Utsläpp
Systemljud - mycket högt när du spelar
Fläktarna är alltid aktiva oavsett effektinställning eller belastning på skärmen. Även om man till exempel har ställt in det tysta läget, kommer fläktljudet fortfarande att vara minst 33 dB(A) mot en tyst bakgrund på 23 dB(A). Den här nivån är högre än på de flesta andra bärbara datorer för spel och den är hörbar i kontorsmiljöer. Om man ställer in läget Prestanda eller Underhållning skulle fläktarna pulsera regelbundet även om man bara surfar eller videostreamar. Du kommer definitivt att vilja vara på en lägre effektinställning när det är möjligt när de extra hästkrafterna inte behövs.
Spel i läget Prestanda ger upphov till ett fläktljud på nästan 61 dB(A), vilket är betydligt högre än konkurrerande bärbara datorer för spel, som Alienware m17 R5 ellerMSI GE78HX. Området 50+ dB(A) är högt men tolerabelt med ett par bra hörlurar, men 60+ dB(A) gör det extremt svårt att spela bullerkänsliga spel som Fortnite eller Overwatch där fotsteg och andra ljudköer är viktiga för spelandet.
Om man ändrar effektinställningen från prestandaläge till underhållningsläge minskar fläktljudet bara något från 60,7 dB(A) till 59,7 dB(A). Skillnaden är så liten att du lika gärna kan köra på prestandaläget när du spelar och hoppa över underhållningsläget helt och hållet.
Ljudnivå
| Låg belastning |
| 33.1 / 33.1 / 40.7 dB(A) |
| Hög belastning |
| 59.9 / 61 dB(A) |
 | ||
30 dB tyst 40 dB(A) hörbar 50 dB(A) högt ljud |
||
min: | ||
| Eurocom Raptor X17 GeForce RTX 4090 Laptop GPU, i9-13900HX, 3x Samsung SSD 980 Pro 1TB (RAID 0) | Asus ROG Strix Scar 17 G733PY-XS96 GeForce RTX 4090 Laptop GPU, R9 7945HX, SK hynix PC801 HFS001TEJ9X101N | Aorus 17X AZF GeForce RTX 4090 Laptop GPU, i9-13900HX, Gigabyte AG470S1TB-SI B10 | MSI GE78HX 13VH-070US GeForce RTX 4080 Laptop GPU, i9-13950HX, Samsung PM9A1 MZVL22T0HBLB | Eluktronics Mech-17 GP2 GeForce RTX 4090 Laptop GPU, i9-13900HX, Samsung PM9A1 MZVL21T0HCLR | Alienware m17 R5 (R9 6900HX, RX 6850M XT) Radeon RX 6850M XT, R9 6900HX, SSSTC CA6-8D1024 | |
|---|---|---|---|---|---|---|
| Noise | 22% | 10% | 16% | 16% | 23% | |
| av / miljö * (dB) | 23.3 | 22.7 3% | 25 -7% | 23.4 -0% | 25.2 -8% | 23 1% |
| Idle Minimum * (dB) | 33.1 | 23.5 29% | 28 15% | 24.2 27% | 28 15% | 23 31% |
| Idle Average * (dB) | 33.1 | 27.7 16% | 29 12% | 25.6 23% | 28 15% | 28.11 15% |
| Idle Maximum * (dB) | 40.7 | 27.7 32% | 34 16% | 31 24% | 30.4 25% | 28.11 31% |
| Load Average * (dB) | 59.9 | 30.5 49% | 51 15% | 43.3 28% | 41 32% | 30.62 49% |
| Witcher 3 ultra * (dB) | 60.8 | 51.4 15% | 57 6% | 56.3 7% | 50.7 17% | 49.75 18% |
| Load Maximum * (dB) | 61 | 54.1 11% | 54 11% | 59.1 3% | 52.6 14% | 50.17 18% |
* ... mindre är bättre
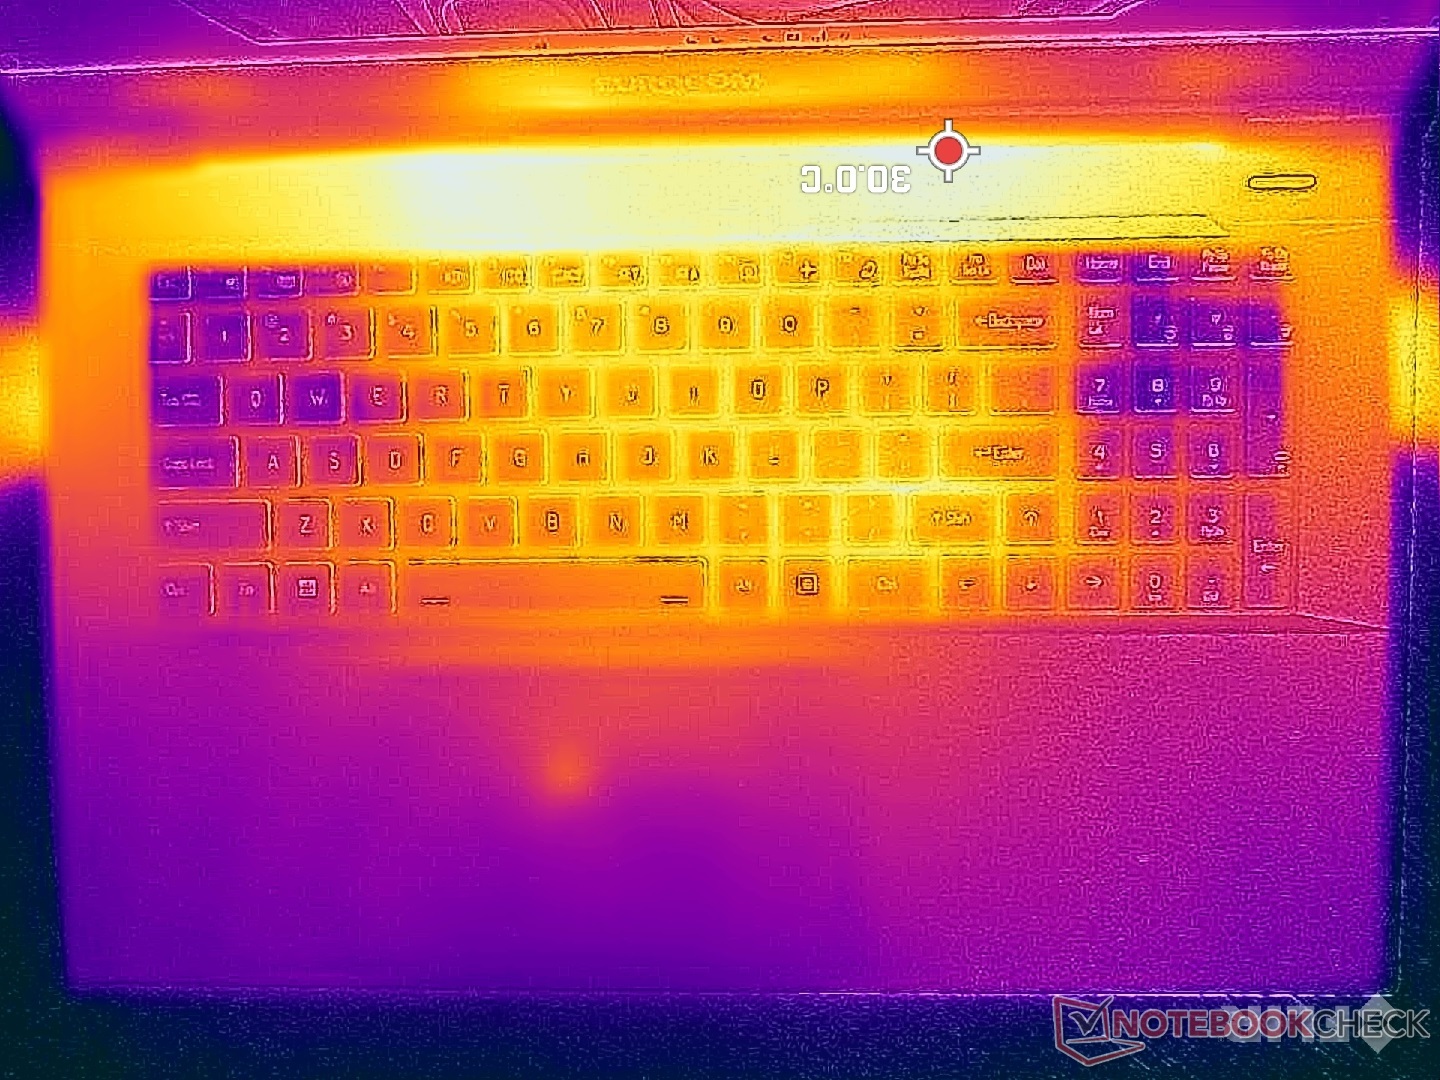
Temperatur
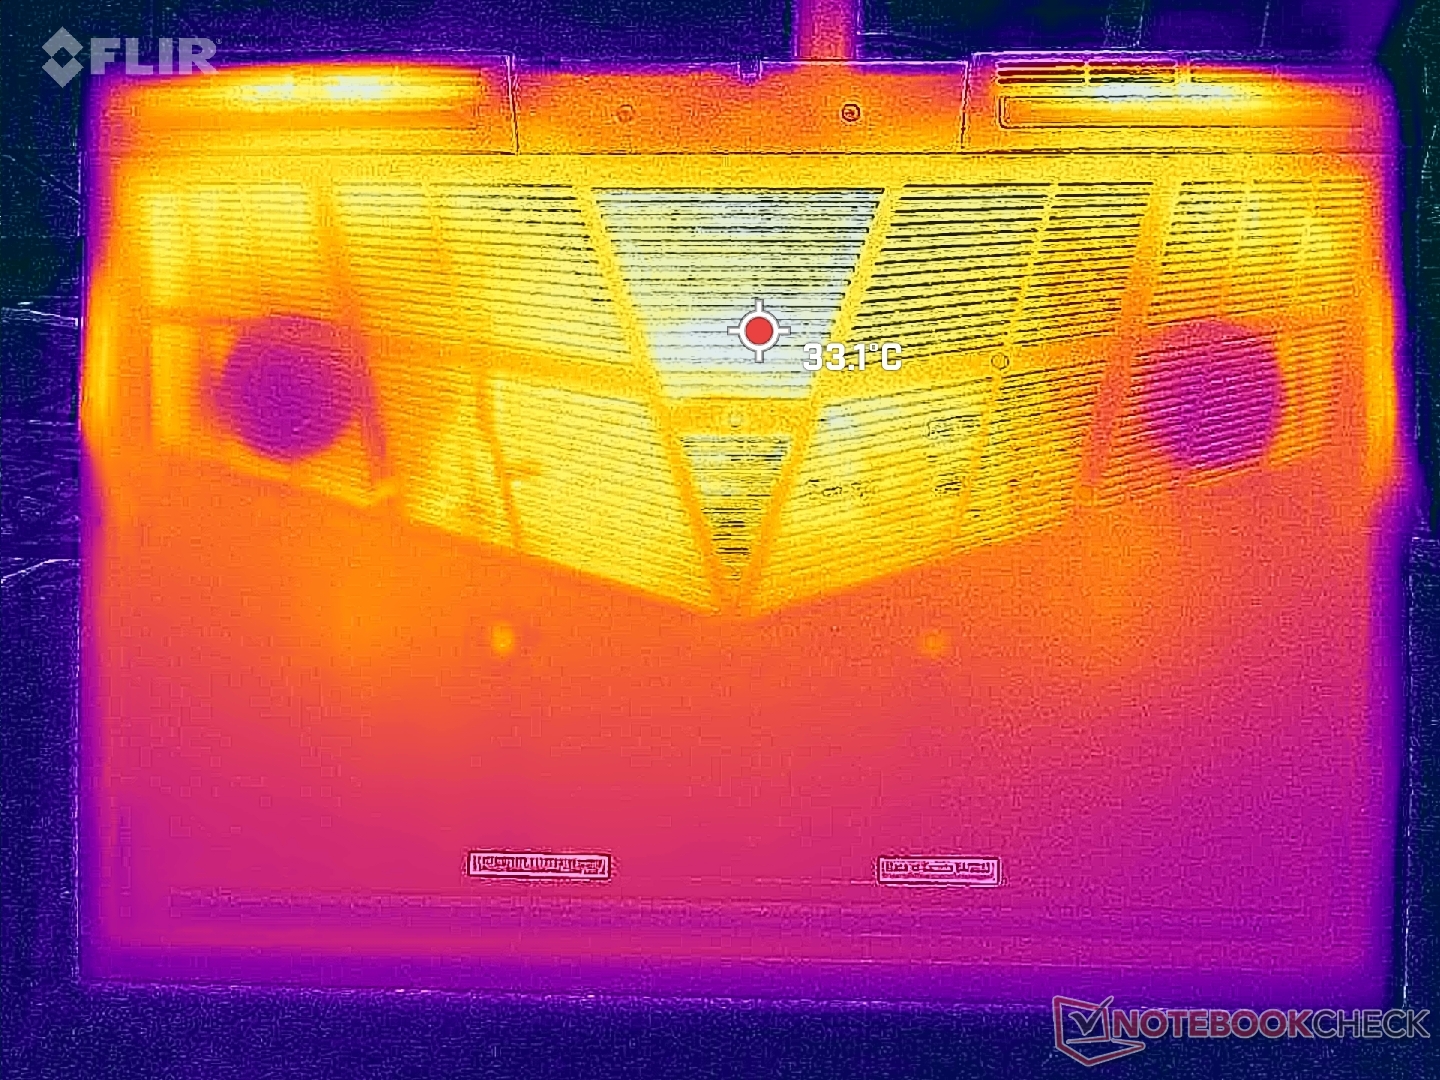
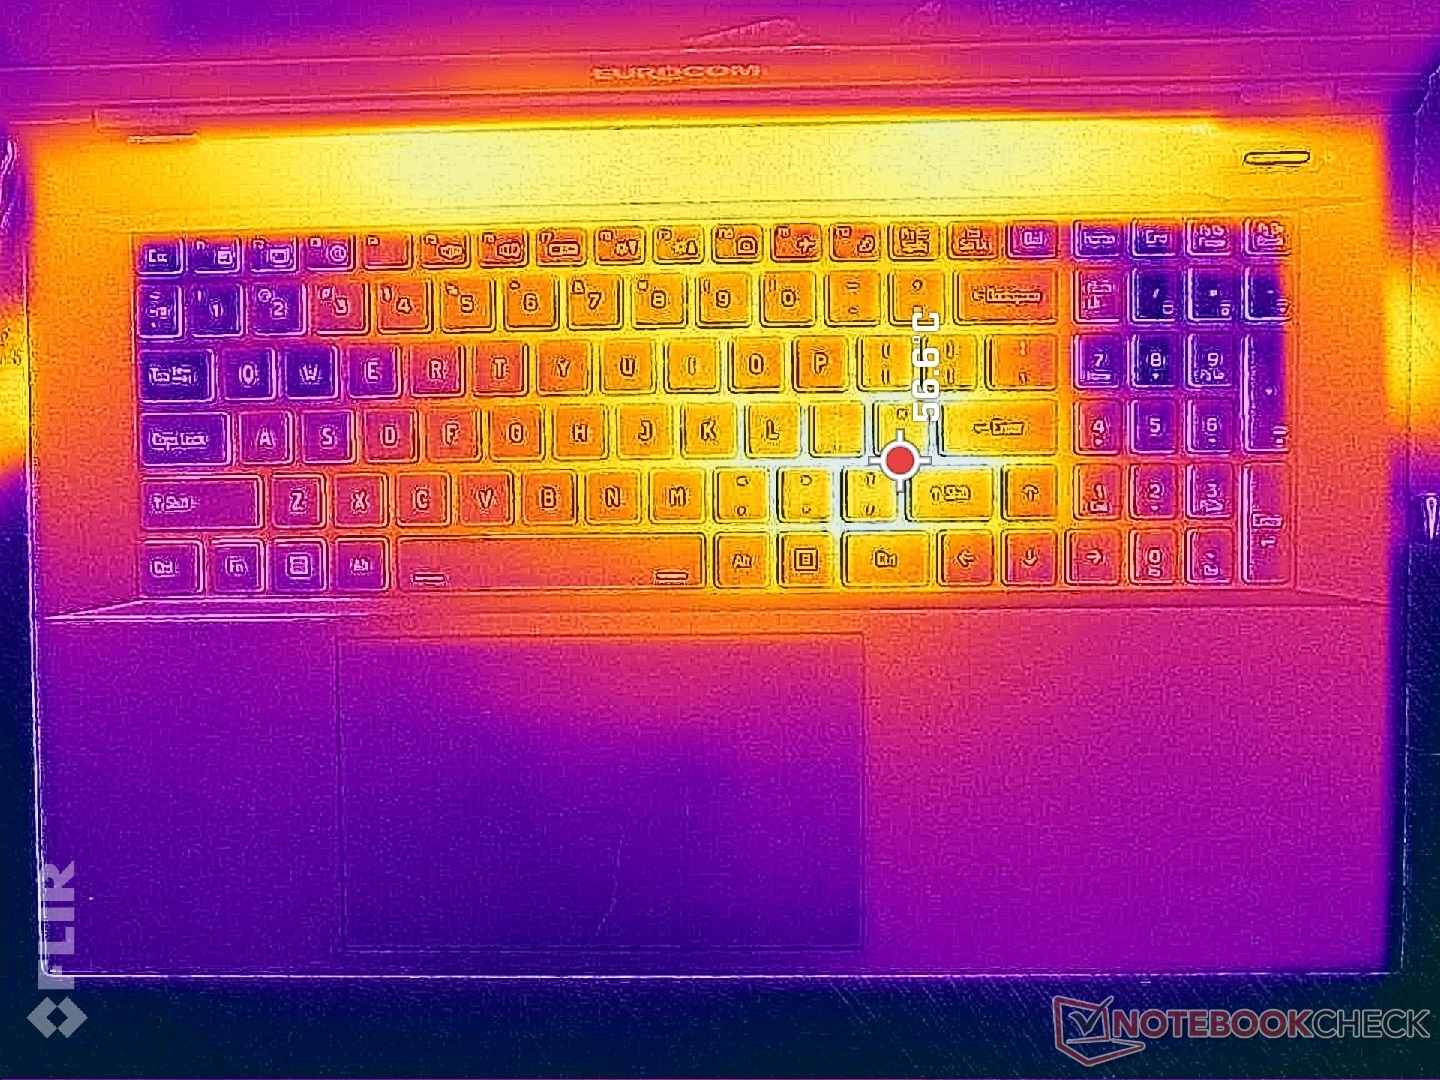
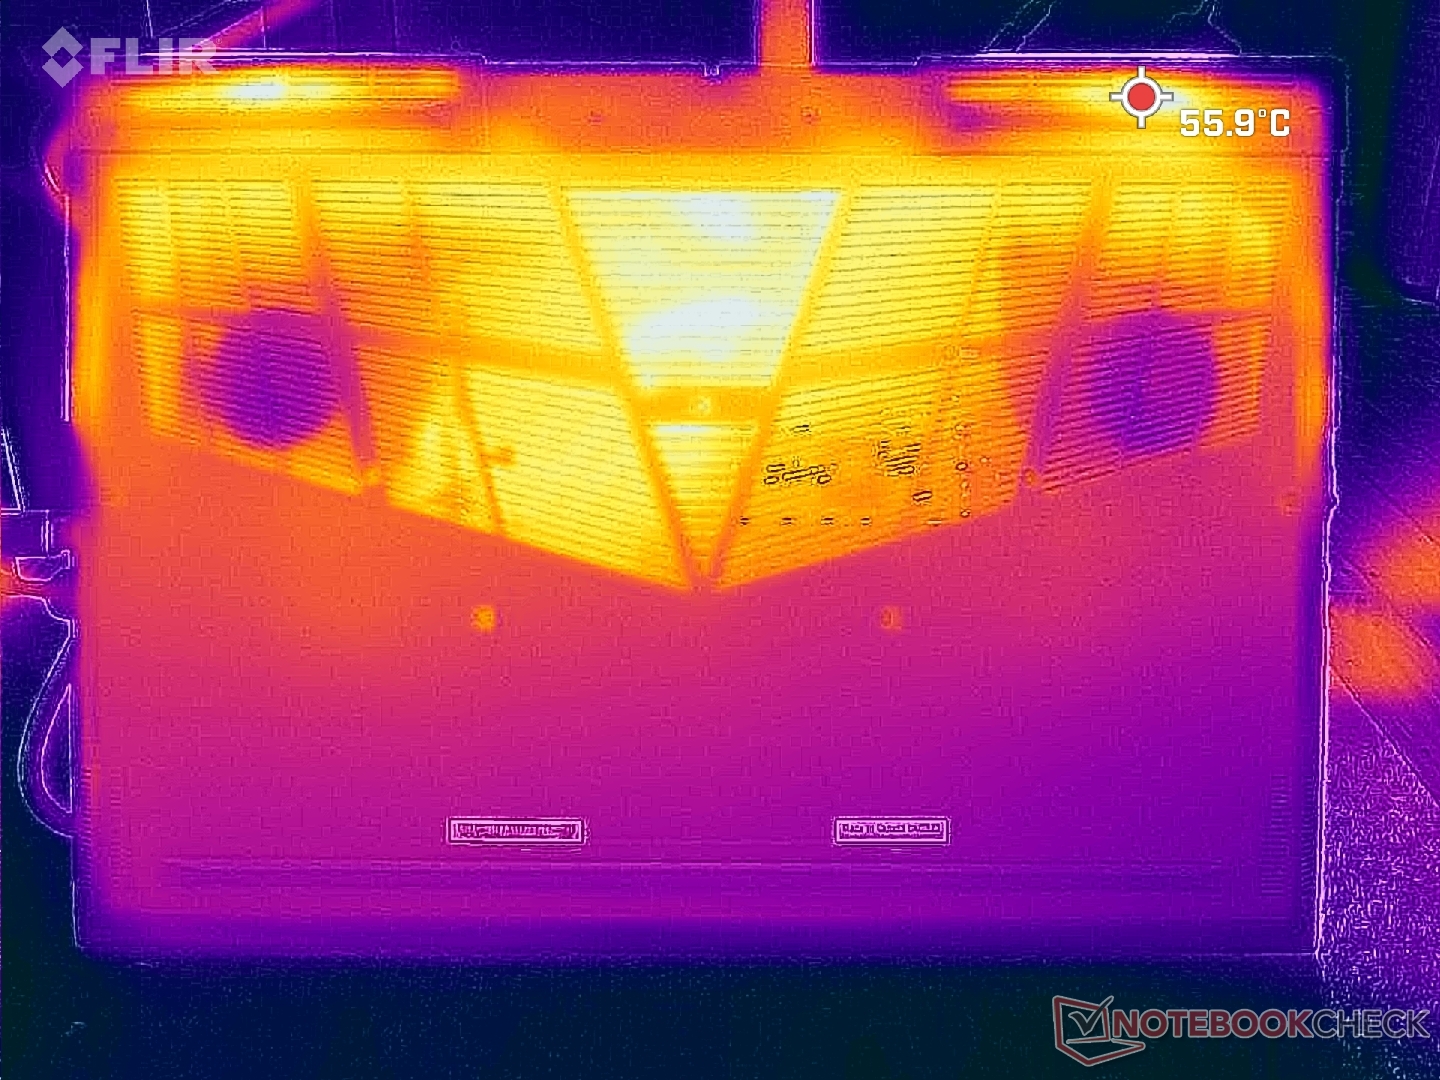
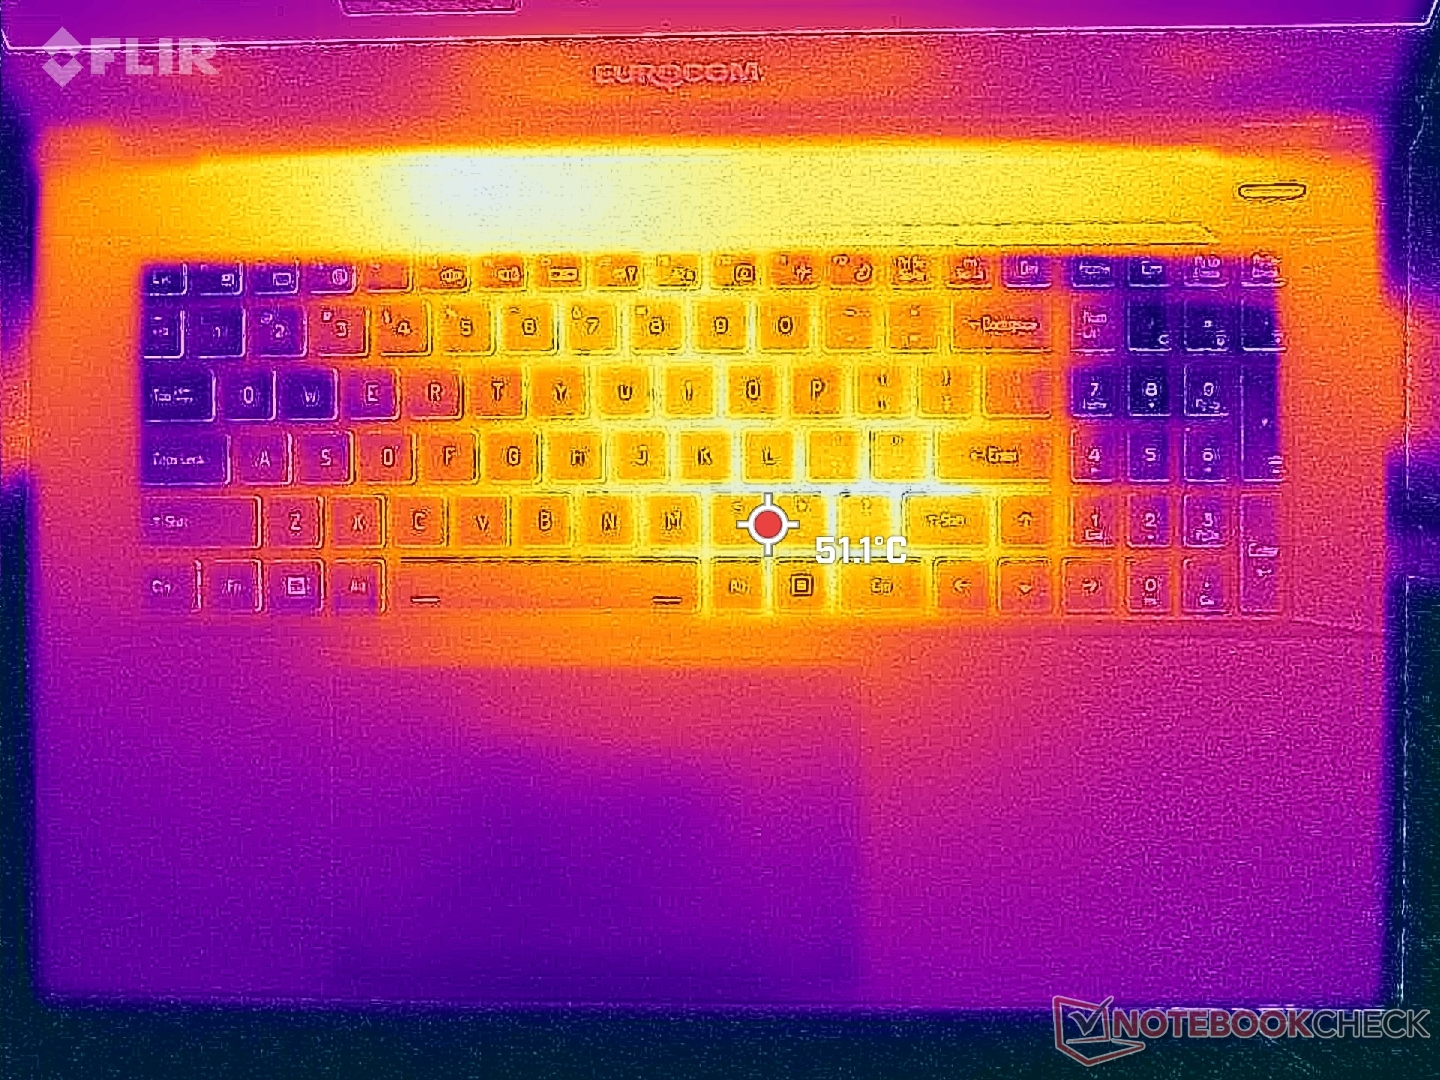
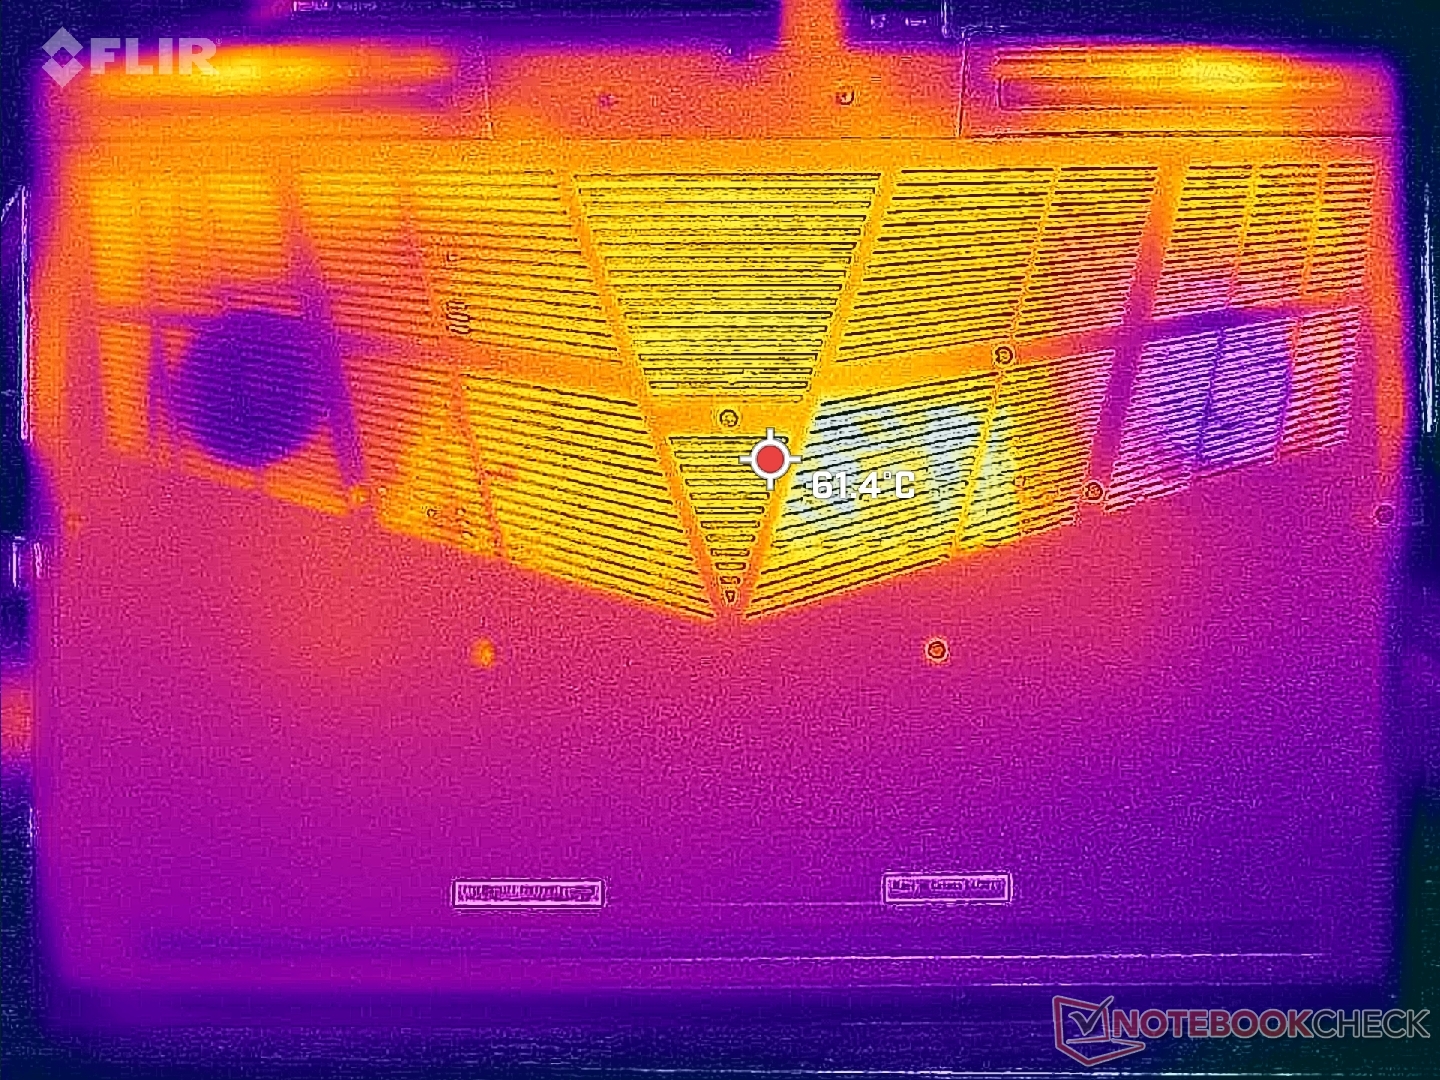
Yttemperaturerna är varmast i mitten av tangentbordet eftersom både CPU och GPU ligger direkt under tangentbordet. Varma punkter kan nå över 56 C i detta område jämfört med 46 C och 35 C påAorus 17X och MSI Raider GE78 HX, respektive. Tack och lov är handflatorna, WASD-tangenterna och numpad-områdena inte alls lika varma för att hålla händerna bekväma när du spelar.
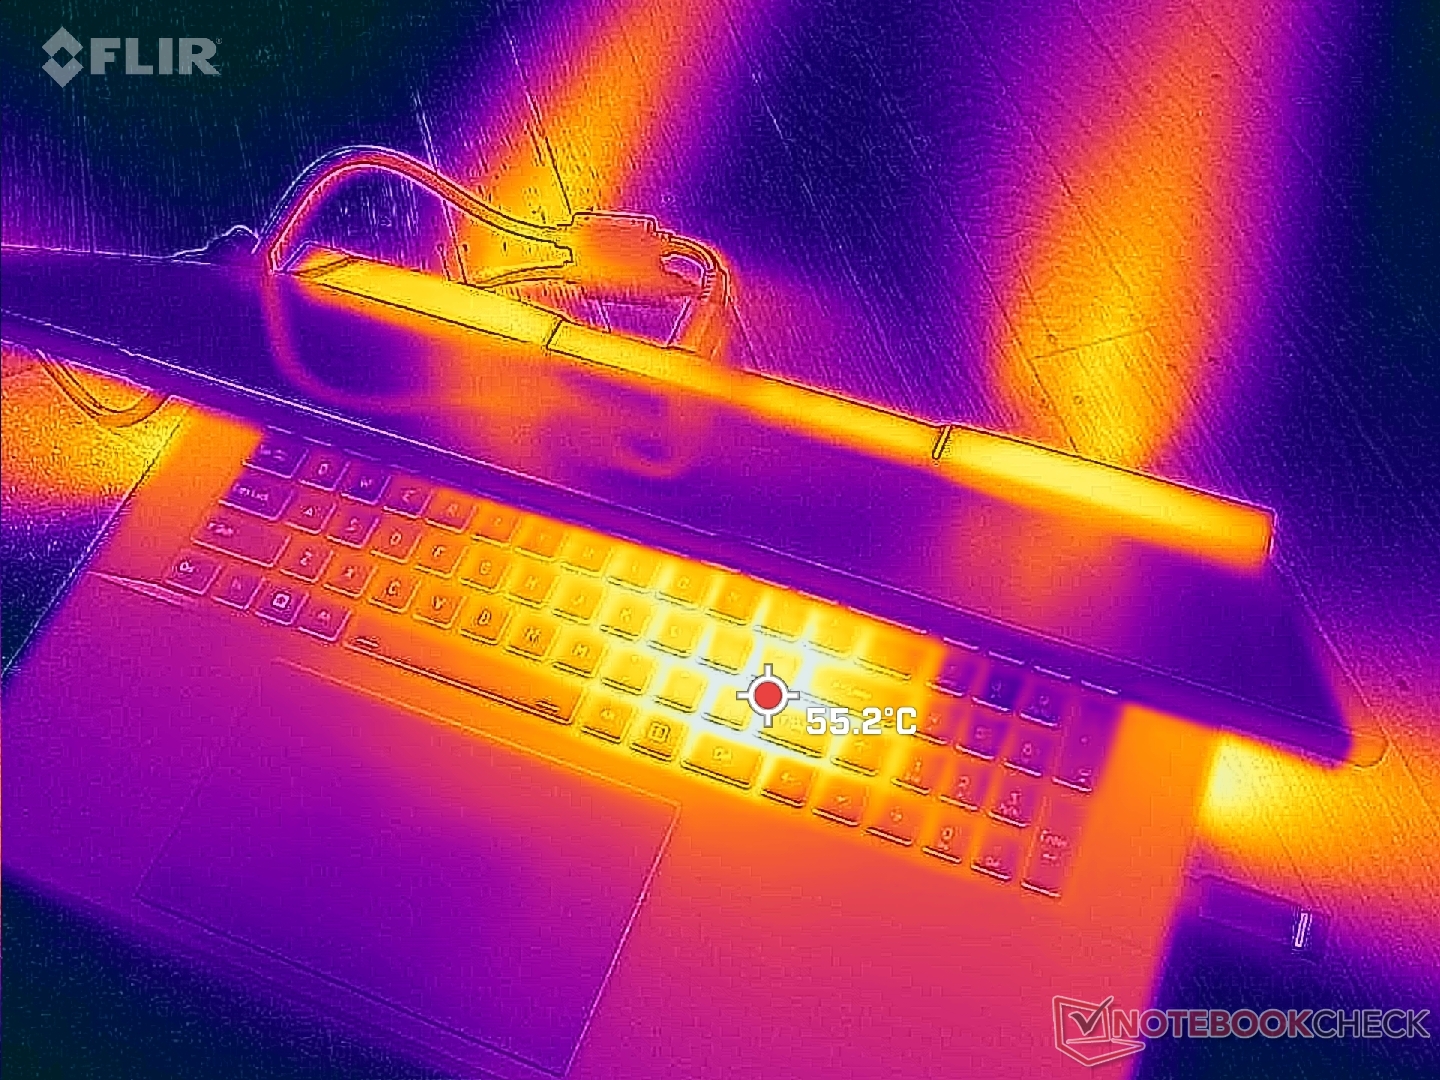
(-) Den maximala temperaturen på ovansidan är 49.4 °C / 121 F, jämfört med genomsnittet av 40.4 °C / 105 F , allt från 21.2 till 68.8 °C för klassen Gaming.
(-) Botten värms upp till maximalt 55.2 °C / 131 F, jämfört med genomsnittet av 43.2 °C / 110 F
(+) Vid tomgångsbruk är medeltemperaturen för ovansidan 28.8 °C / 84 F, jämfört med enhetsgenomsnittet på 33.9 °C / ### class_avg_f### F.
(-) När du spelar The Witcher 3 är medeltemperaturen för ovansidan 40.4 °C / 105 F, jämfört med enhetsgenomsnittet på 33.9 °C / ## #class_avg_f### F.
(+) Handledsstöden och pekplattan är kallare än hudtemperaturen med maximalt 31.2 °C / 88.2 F och är därför svala att ta på.
(-) Medeltemperaturen för handledsstödsområdet på liknande enheter var 28.8 °C / 83.8 F (-2.4 °C / -4.4 F).
| Eurocom Raptor X17 Intel Core i9-13900HX, NVIDIA GeForce RTX 4090 Laptop GPU | Asus ROG Strix Scar 17 G733PY-XS96 AMD Ryzen 9 7945HX, NVIDIA GeForce RTX 4090 Laptop GPU | Aorus 17X AZF Intel Core i9-13900HX, NVIDIA GeForce RTX 4090 Laptop GPU | MSI GE78HX 13VH-070US Intel Core i9-13950HX, NVIDIA GeForce RTX 4080 Laptop GPU | Eluktronics Mech-17 GP2 Intel Core i9-13900HX, NVIDIA GeForce RTX 4090 Laptop GPU | Alienware m17 R5 (R9 6900HX, RX 6850M XT) AMD Ryzen 9 6900HX, AMD Radeon RX 6850M XT | |
|---|---|---|---|---|---|---|
| Heat | 24% | 8% | 14% | 15% | 4% | |
| Maximum Upper Side * (°C) | 49.4 | 34.6 30% | 47 5% | 37.4 24% | 39 21% | 53 -7% |
| Maximum Bottom * (°C) | 55.2 | 35.6 36% | 51 8% | 45 18% | 44 20% | 56 -1% |
| Idle Upper Side * (°C) | 33.4 | 27.2 19% | 30 10% | 29.8 11% | 31 7% | 30 10% |
| Idle Bottom * (°C) | 33.4 | 30 10% | 31 7% | 32.4 3% | 29.8 11% | 29 13% |
* ... mindre är bättre
Stresstest
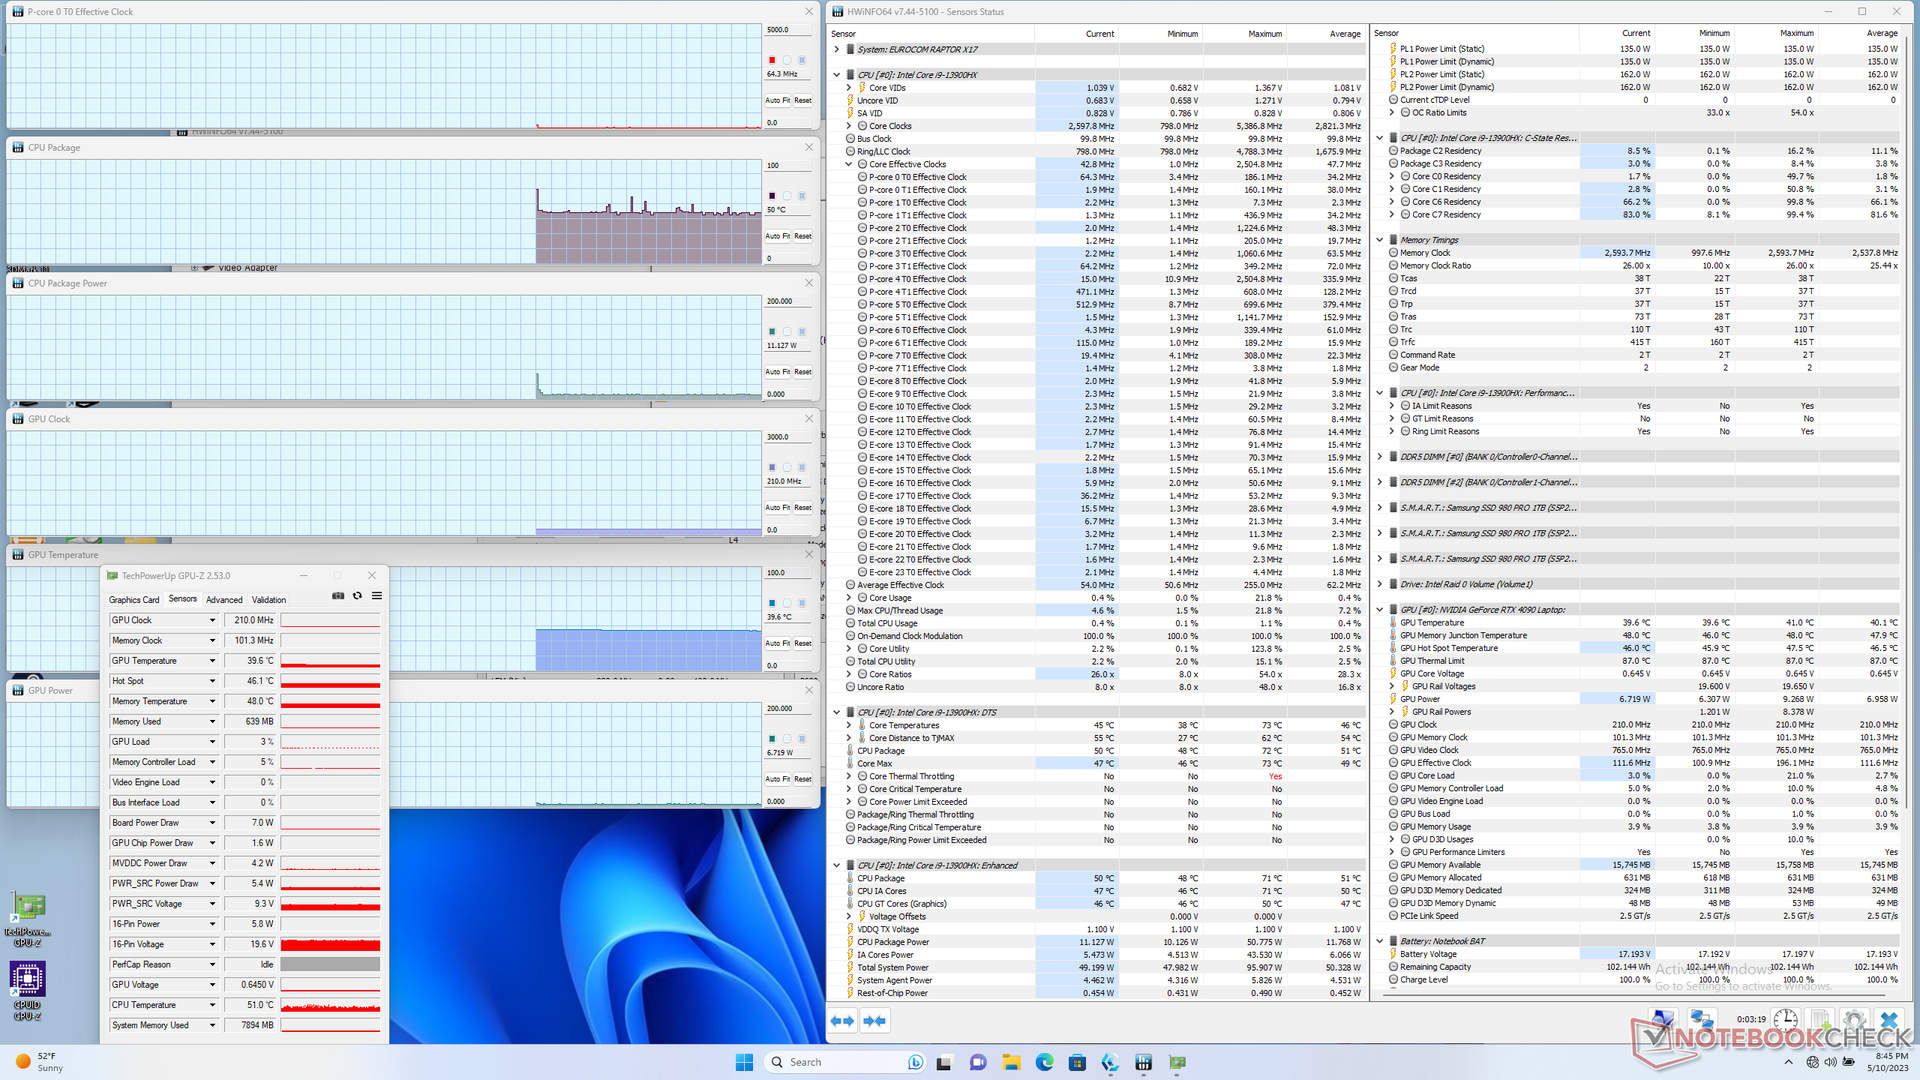
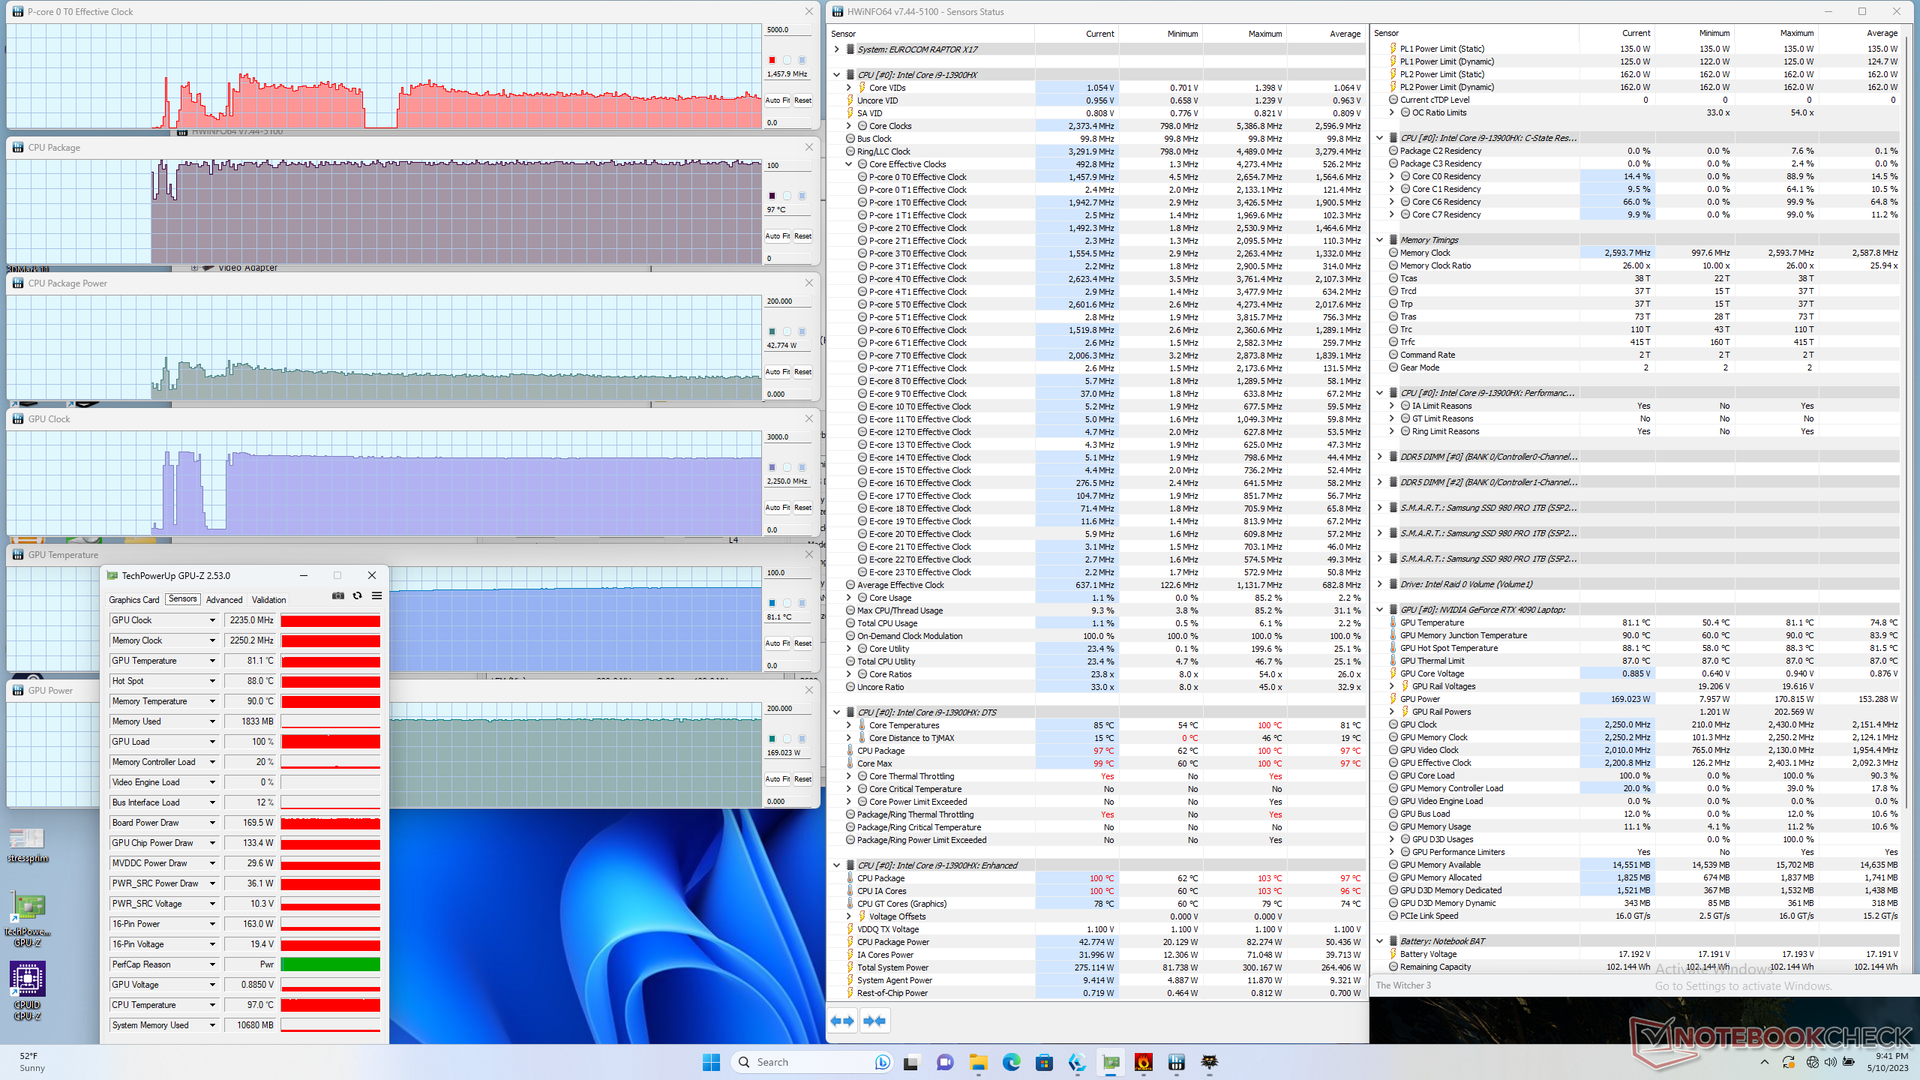
När Prime95 kördes för att stressa processorn ökade klockfrekvensen och kortets strömförbrukning till 4 GHz respektive 155 W under en kort stund innan den snabbt sjönk till 3,3 GHz och 110 W. Kärnans temperatur förblev mycket varm, 97 C, vilket sannolikt är orsaken till den mycket kortvariga maximala Turbo Boost. Om man upprepar det här testet på MSI GE78HX eller Eluktronics Mech-17 GP2 skulle resultera i liknande kärntemperaturer på över 90 C, vilket tyder på att de flesta CPU:er i 13:e generationens H-serie generellt sett är varmare än genomsnittet när de är belastade.
När man kör Witcher 3 på Performance-läget för att representera typiska spelbelastningar skulle GPU:n stabilisera sig vid 2235 MHz kärnklocka, 81 C och 170 W kortströmförbrukning mot ett TGP-mål på 175 W. Om du ställer in systemet på Balanced-läget (eller Entertainment-läget) skulle GPU:n sjunka till 2055 MHz klocka, 76 C och bara 146 W. Du måste alltså aktivera Performance-läget och uthärda det högre fläktljudet om du vill få ut det mesta av GPU:n.
Att köra på batteri begränsar prestandan. Ett Fire Strike -test på batterier skulle ge fysik- och grafikpoäng på 12863 respektive 10075 poäng, jämfört med 36634 respektive 44766 poäng när det är på strömnätet.
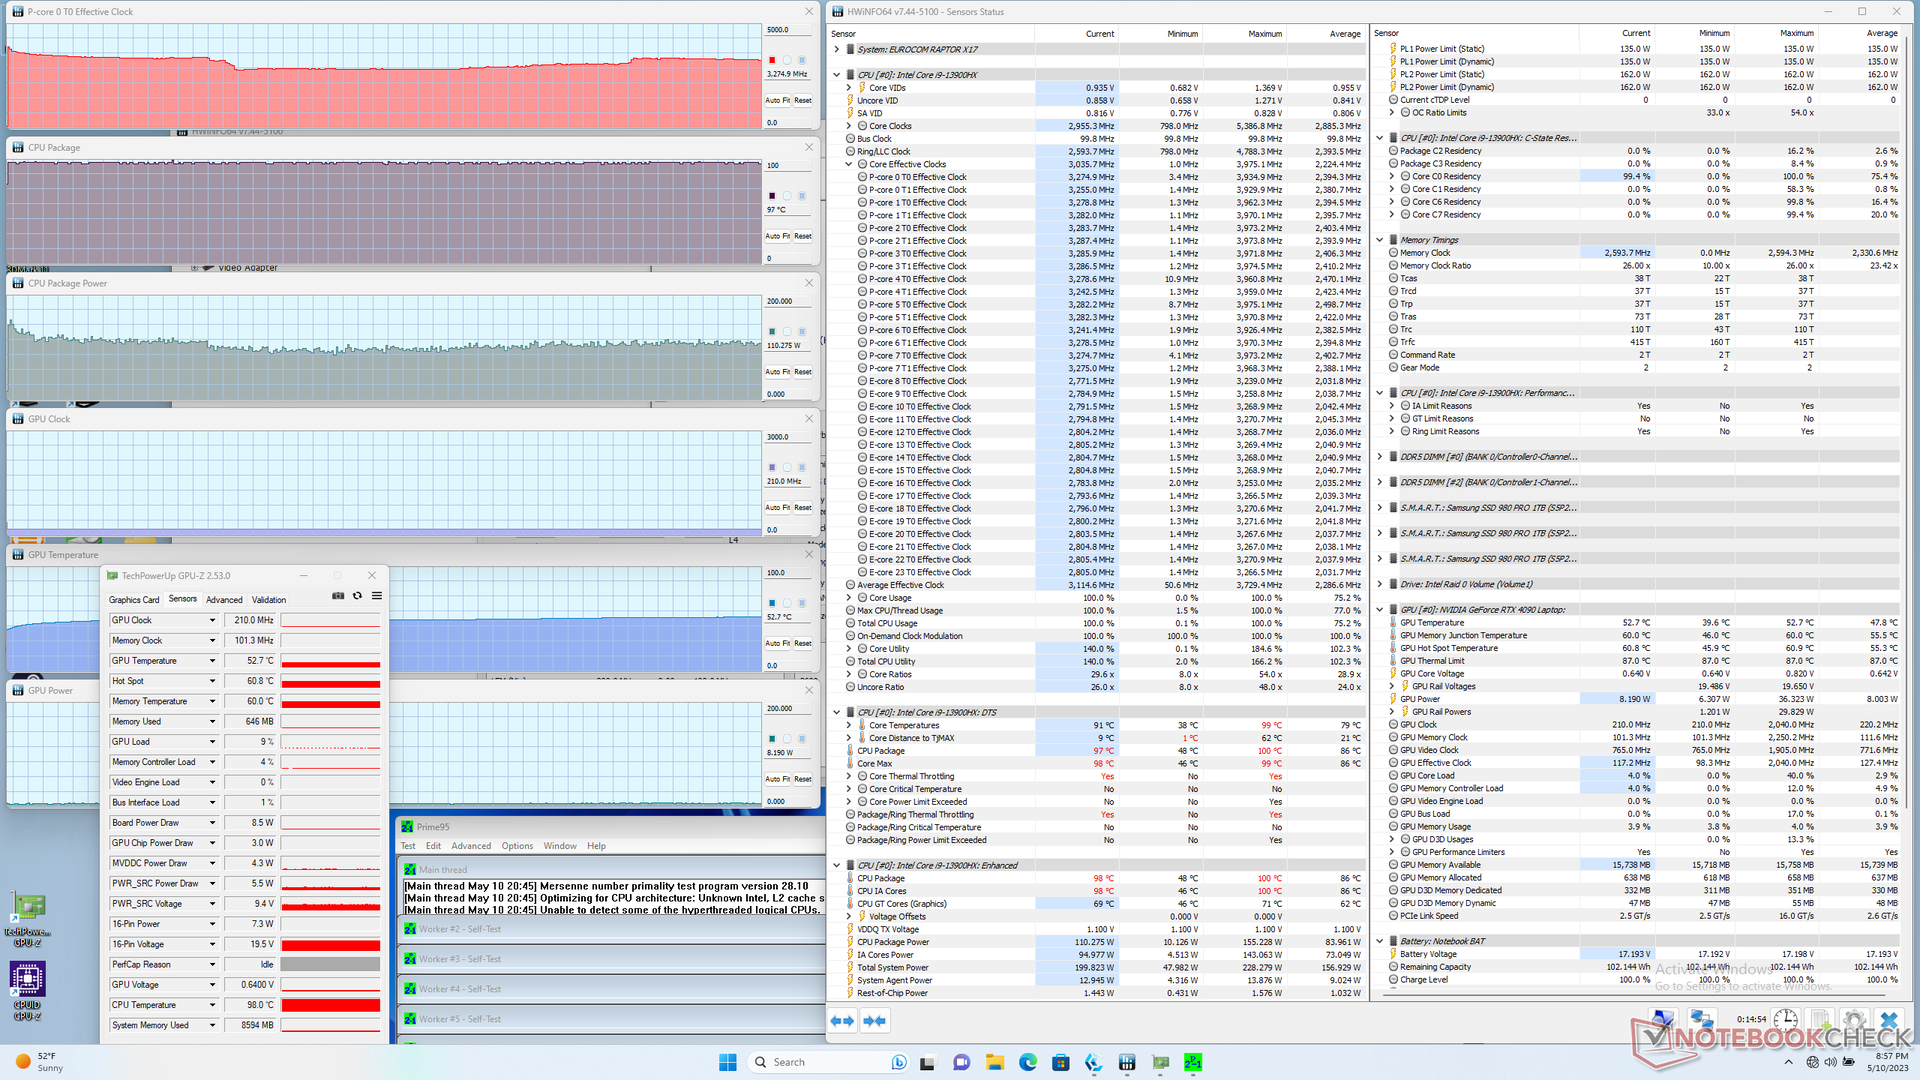
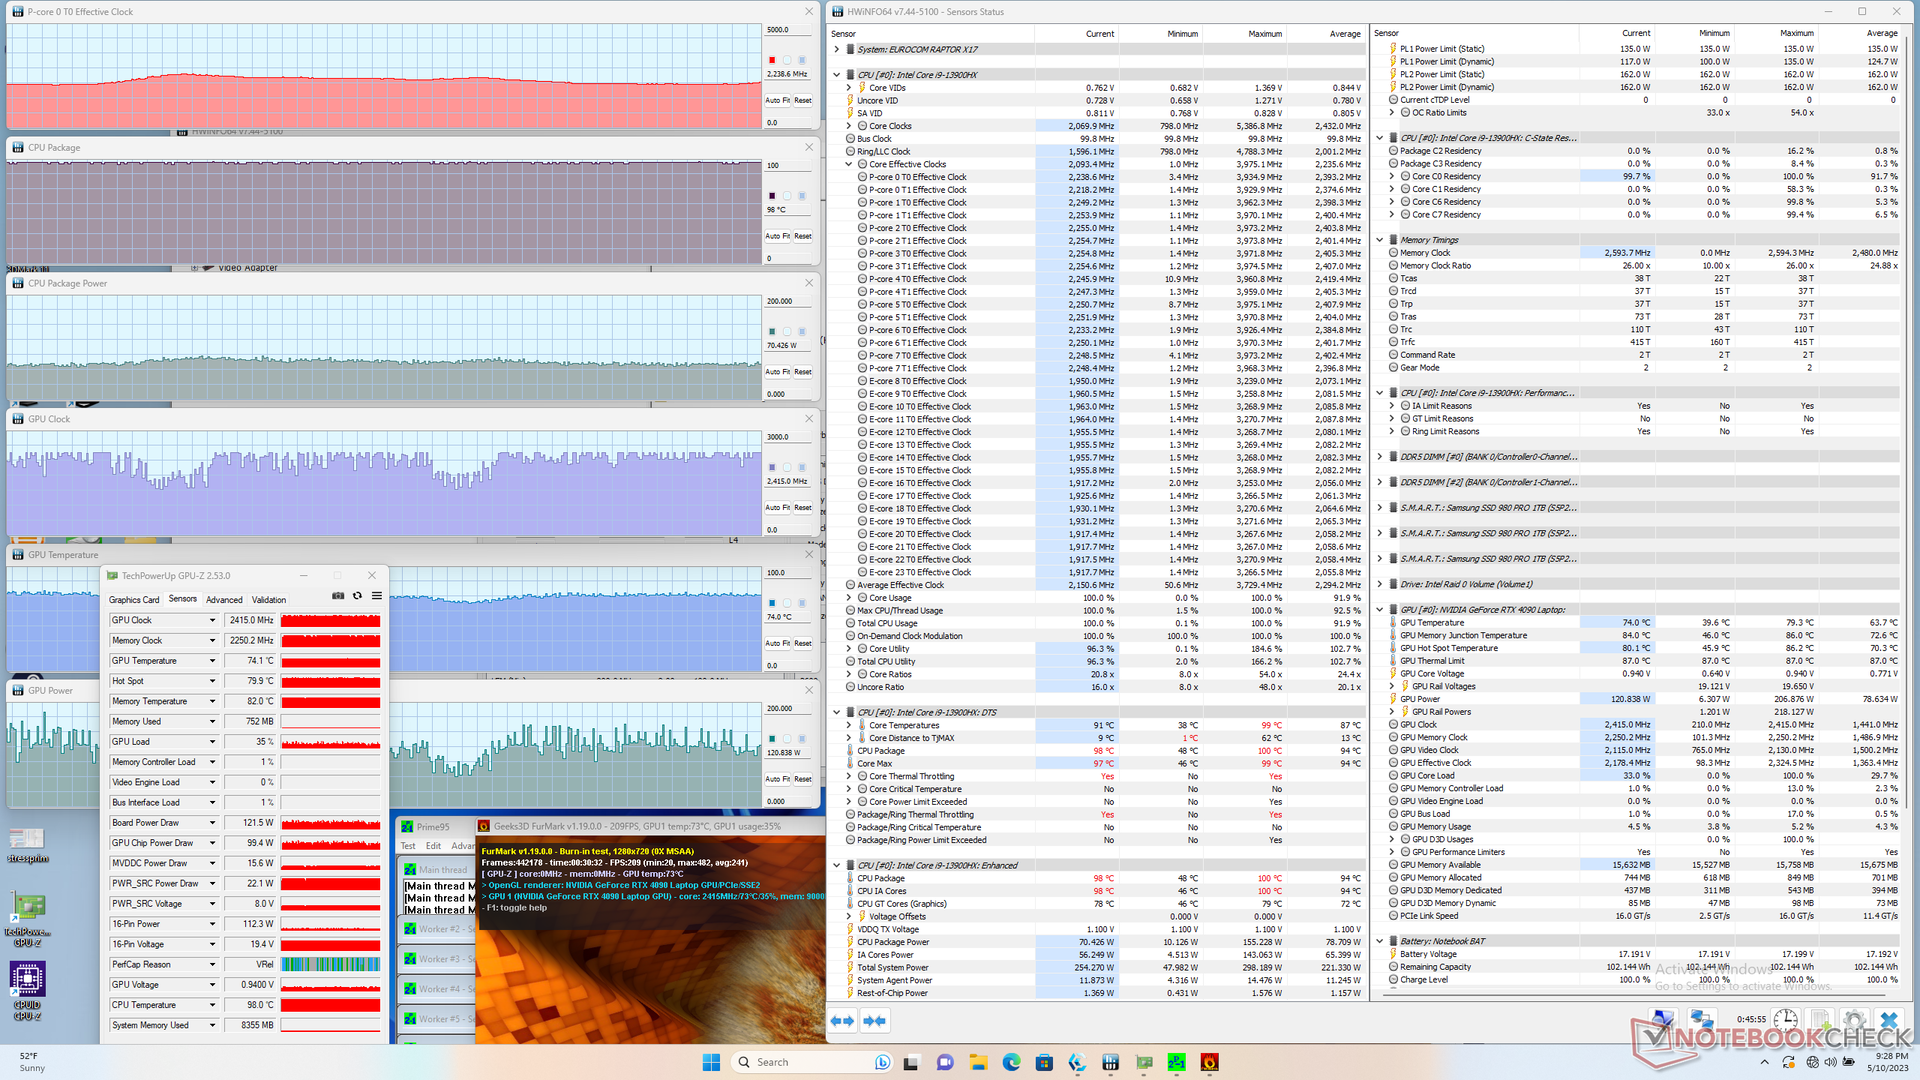
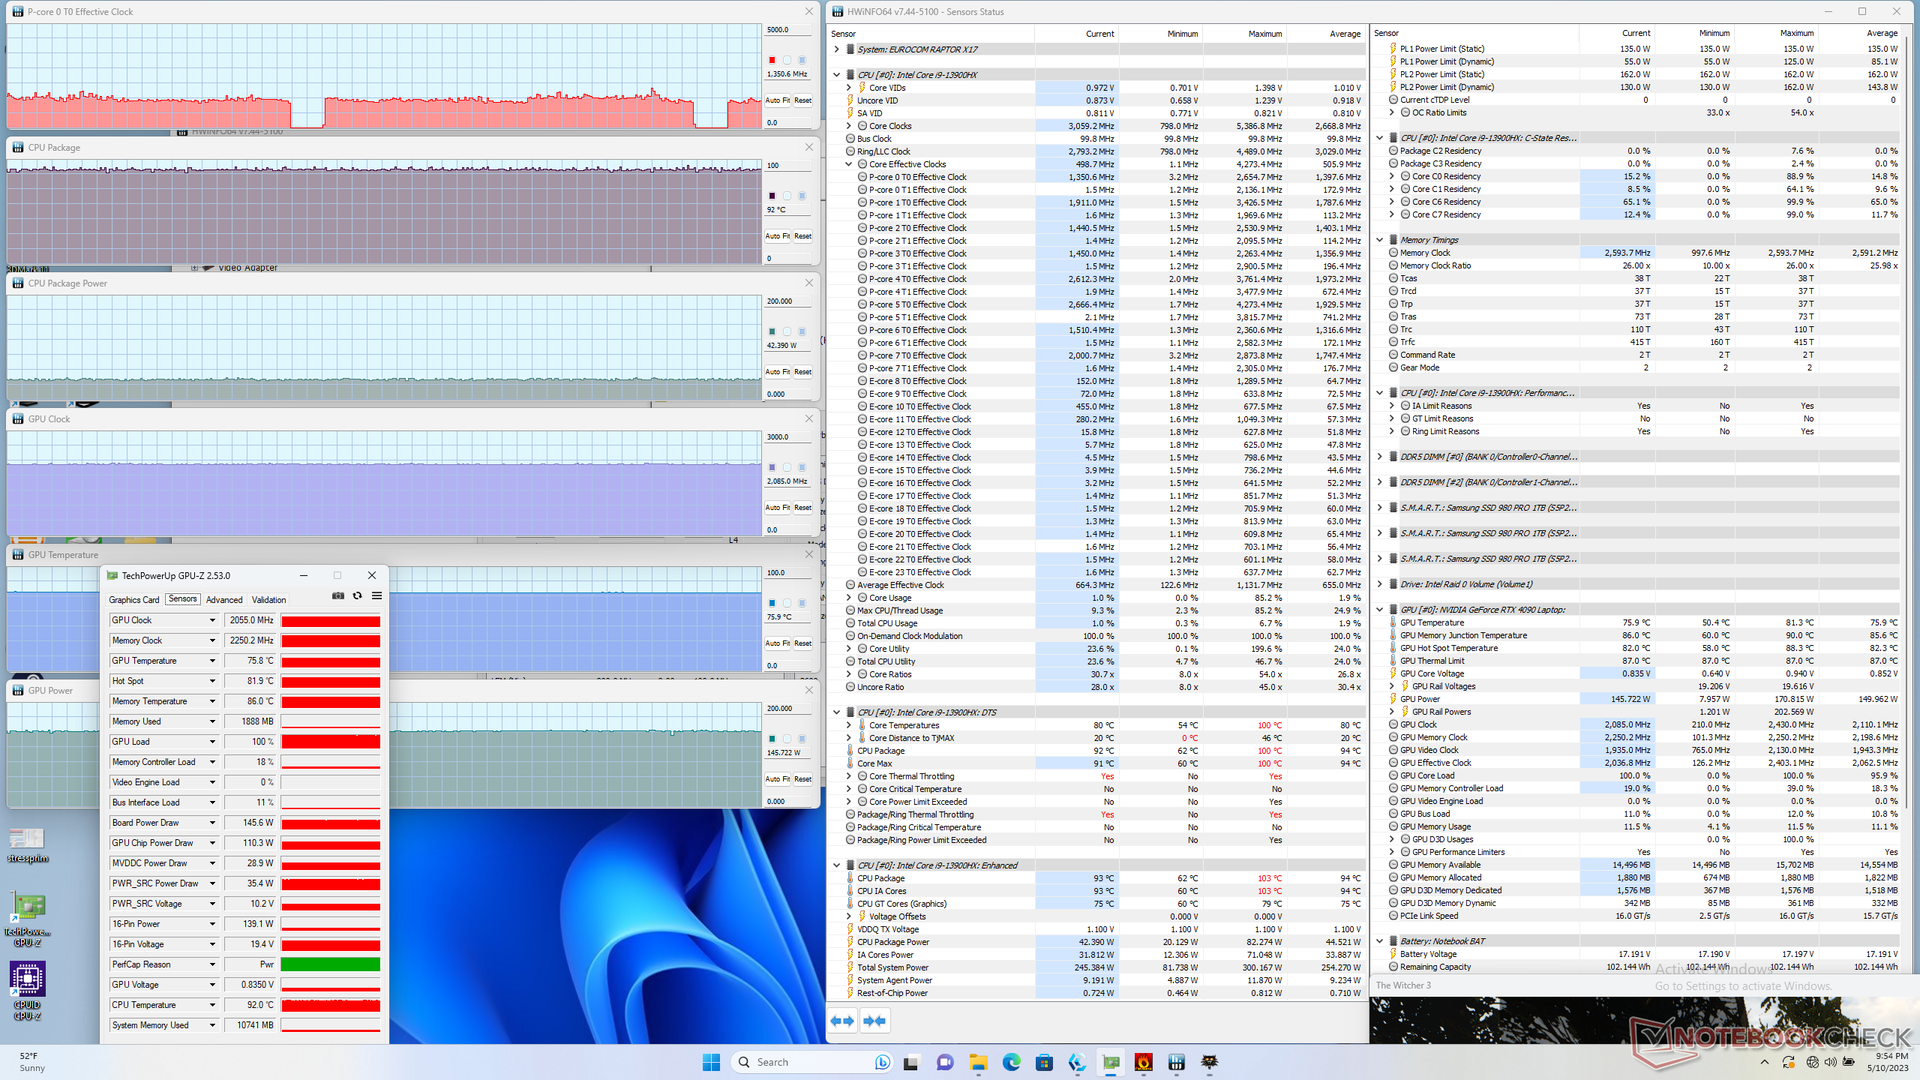
| CPU-klocka (GHz) | GPU-klocka (MHz) | Genomsnittlig CPU-temperatur (°C) | Genomsnittlig GPU-temperatur (°C) | |
| Systemets tomgång | -- | -- | 50 | 40 |
| Prime95 Stress | 3.3 | -- | 97 | 53 |
| Prime95 + FurMark Stress | 2.2 | 840 - 2400 | 98 | 74 |
| Witcher 3 Stress (balanserat läge) | 1,4 | 2055 | 92 | 76 |
| Witcher 3 Stress (prestationsläge) | 1.5 | 2250 | 97 | 81 |
Högtalare
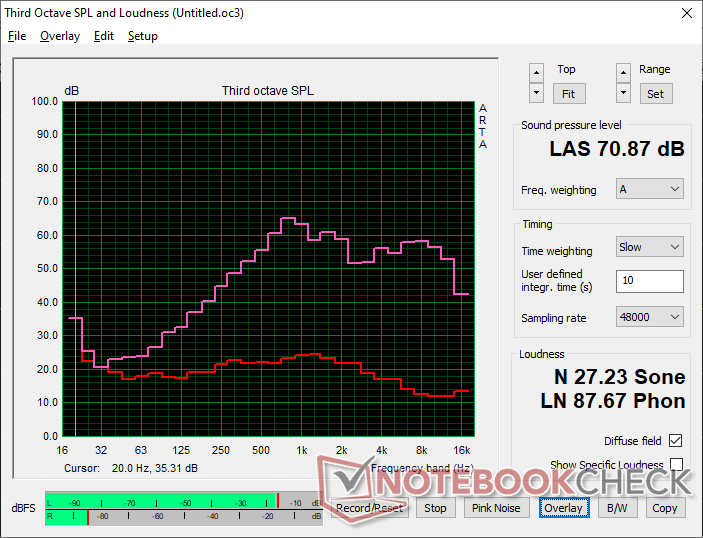
De integrerade högtalarna är en besvikelse. Inte bara är basåtergivningen dålig, utan den maximala volymen på 71 dB(A) är märkbart tystare än de flesta andra bärbara datorer för spel där 80 dB(A) eller högre är vanligt. Det här känns definitivt som ett snedsteg för den här nya chassidesignen.

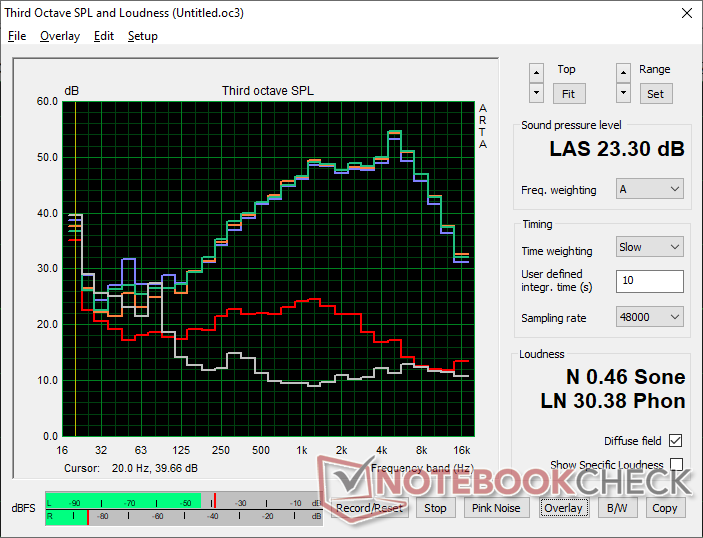
Eurocom Raptor X17 ljudanalys
(-) | inte särskilt höga högtalare (70.9 dB)
Bas 100 - 315 Hz
(-) | nästan ingen bas - i genomsnitt 15.5% lägre än medianen
(±) | linjäriteten för basen är genomsnittlig (10.3% delta till föregående frekvens)
Mellan 400 - 2000 Hz
(±) | högre mellan - i genomsnitt 5.4% högre än median
(±) | linjäriteten för mids är genomsnittlig (9.6% delta till föregående frekvens)
Högsta 2 - 16 kHz
(+) | balanserade toppar - endast 2.3% från medianen
(±) | linjäriteten för toppar är genomsnittlig (7.5% delta till föregående frekvens)
Totalt 100 - 16 000 Hz
(±) | linjäriteten för det totala ljudet är genomsnittlig (23.7% skillnad mot median)
Jämfört med samma klass
» 86% av alla testade enheter i den här klassen var bättre, 5% liknande, 10% sämre
» Den bästa hade ett delta på 6%, genomsnittet var 18%, sämst var 132%
Jämfört med alla testade enheter
» 71% av alla testade enheter var bättre, 6% liknande, 23% sämre
» Den bästa hade ett delta på 4%, genomsnittet var 23%, sämst var 134%
Apple MacBook Pro 16 2021 M1 Pro ljudanalys
(+) | högtalare kan spela relativt högt (84.7 dB)
Bas 100 - 315 Hz
(+) | bra bas - bara 3.8% från medianen
(+) | basen är linjär (5.2% delta till föregående frekvens)
Mellan 400 - 2000 Hz
(+) | balanserad mellan - endast 1.3% från medianen
(+) | mids är linjära (2.1% delta till föregående frekvens)
Högsta 2 - 16 kHz
(+) | balanserade toppar - endast 1.9% från medianen
(+) | toppar är linjära (2.7% delta till föregående frekvens)
Totalt 100 - 16 000 Hz
(+) | det totala ljudet är linjärt (4.6% skillnad mot median)
Jämfört med samma klass
» 0% av alla testade enheter i den här klassen var bättre, 0% liknande, 100% sämre
» Den bästa hade ett delta på 5%, genomsnittet var 17%, sämst var 45%
Jämfört med alla testade enheter
» 0% av alla testade enheter var bättre, 0% liknande, 100% sämre
» Den bästa hade ett delta på 4%, genomsnittet var 23%, sämst var 134%
Energiförvaltning
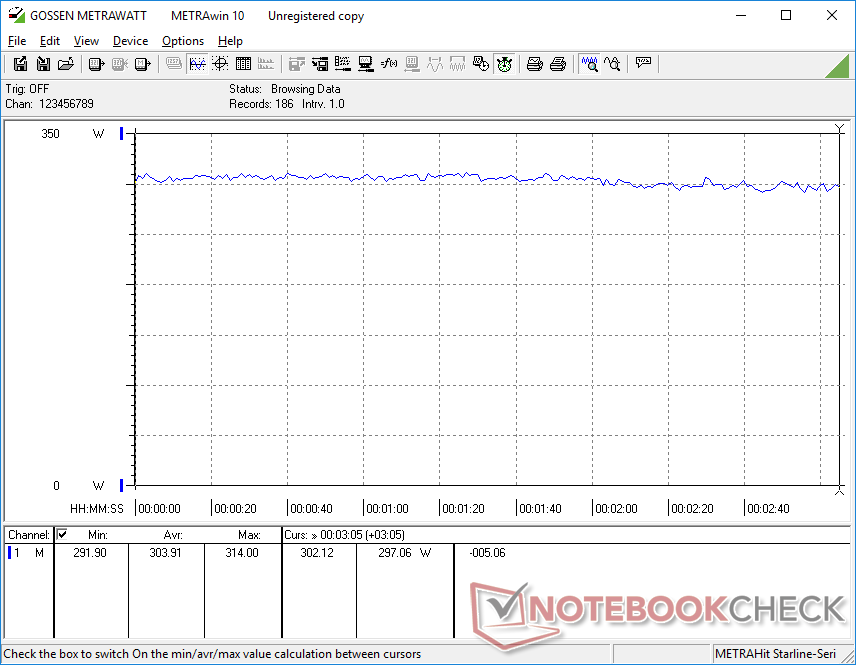
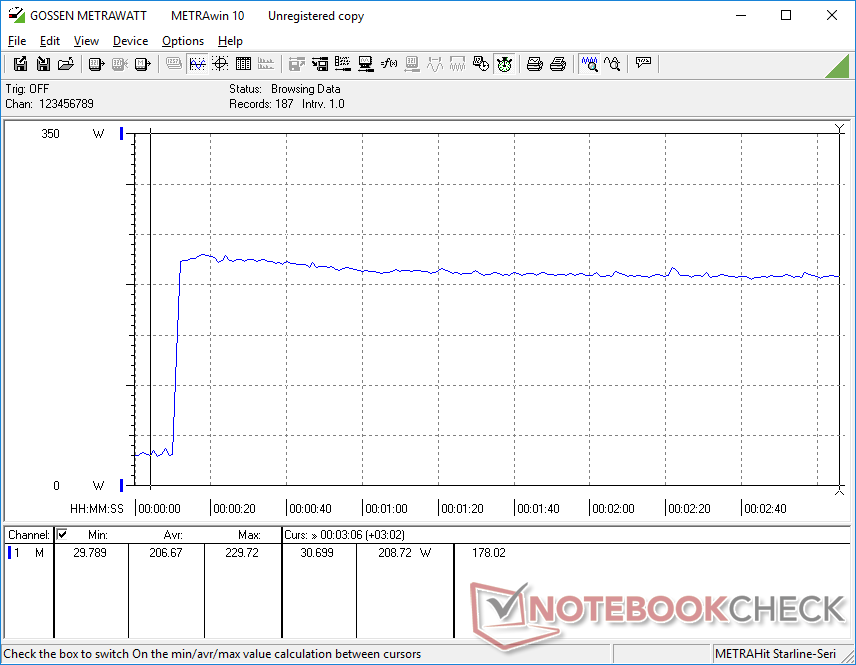
Strömförbrukning - Över 300 W vid spel
Tomgångskörning på skrivbordet förbrukar mellan 13 W och 43 W beroende på strömprofilen, GPU-inställningen och skärmens ljusstyrka. Faktum är att 43 W är ungefär lika mycket som en Core U-driven ultrabook som Samsung Galaxy Book3 15 på maximal belastning. Att helt enkelt byta från iGPU-läge till dGPU-läge skulle öka strömförbrukningen med cirka 9 W på Eurocom. Strömförbrukningen är därför mycket känslig för den aktiva strömprofilen.
Den genomsnittliga strömförbrukningen vid spelande är mycket hög, 304 W jämfört med 278 W vardera på de konkurrerandeAsus ROG Strix Scar 17 eller Aorus 17X med samma GeForce RTX 4090 GPU. De tre SSD-enheterna, den snabba uppdateringsfrekvensen på 240 Hz, den höga RAM-kapaciteten och den något högre GPU-strömförbrukningen bidrar alla till den högre förbrukningen på Eurocom.
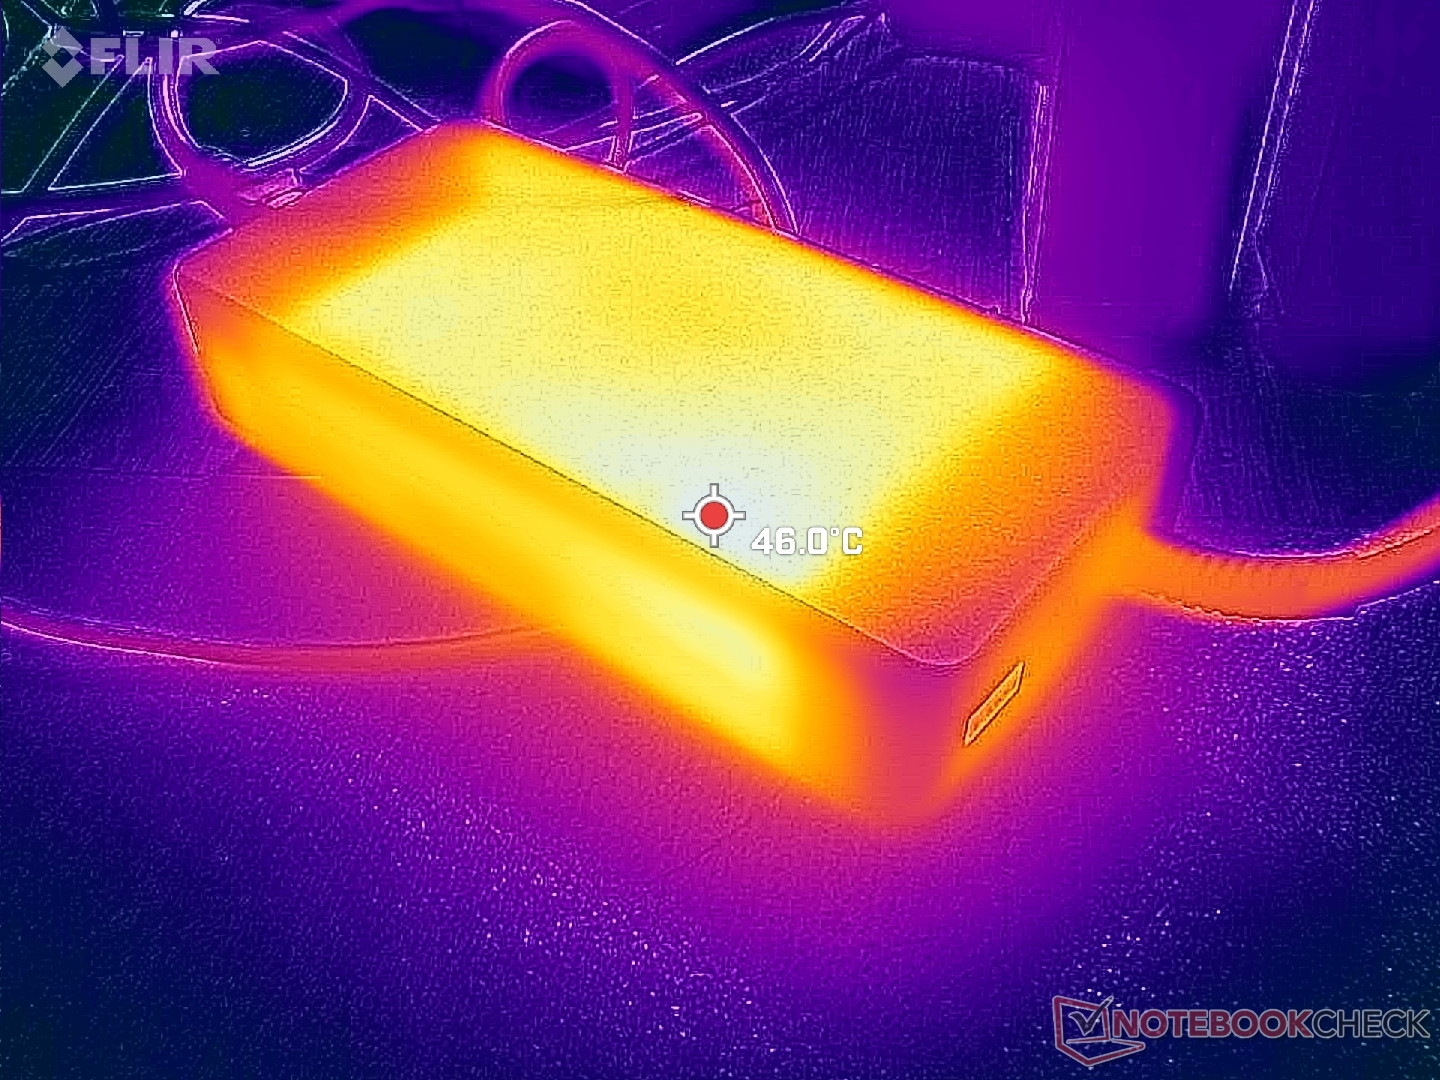
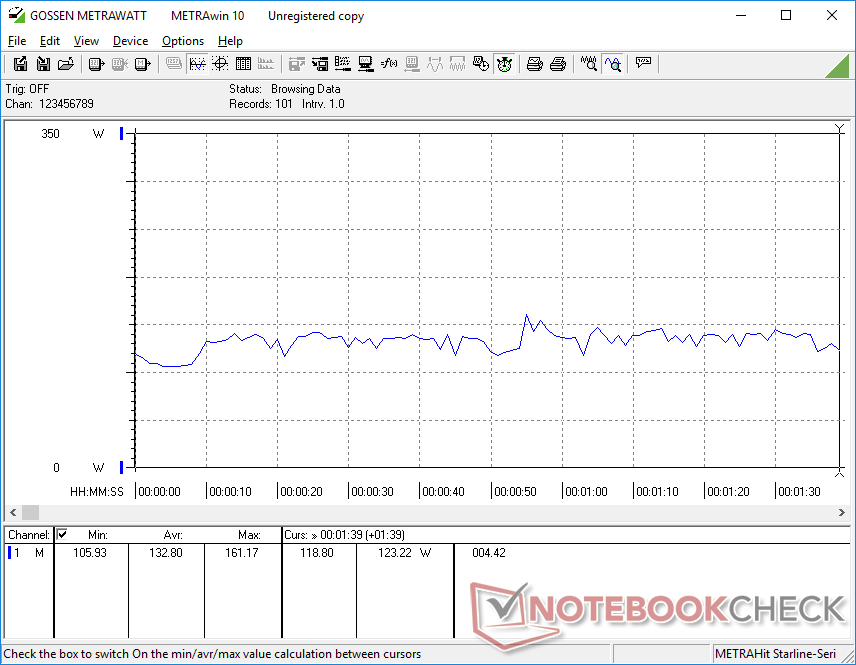
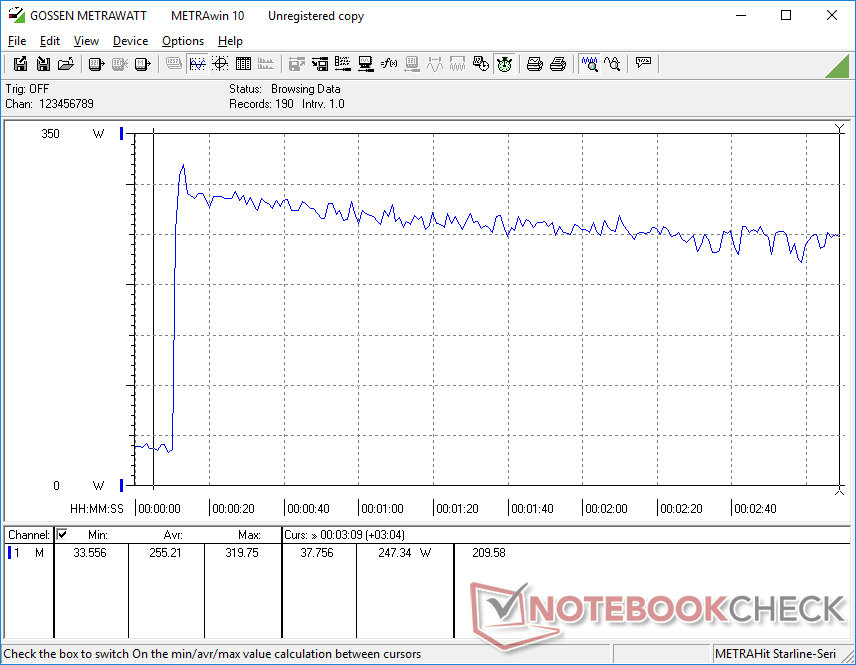
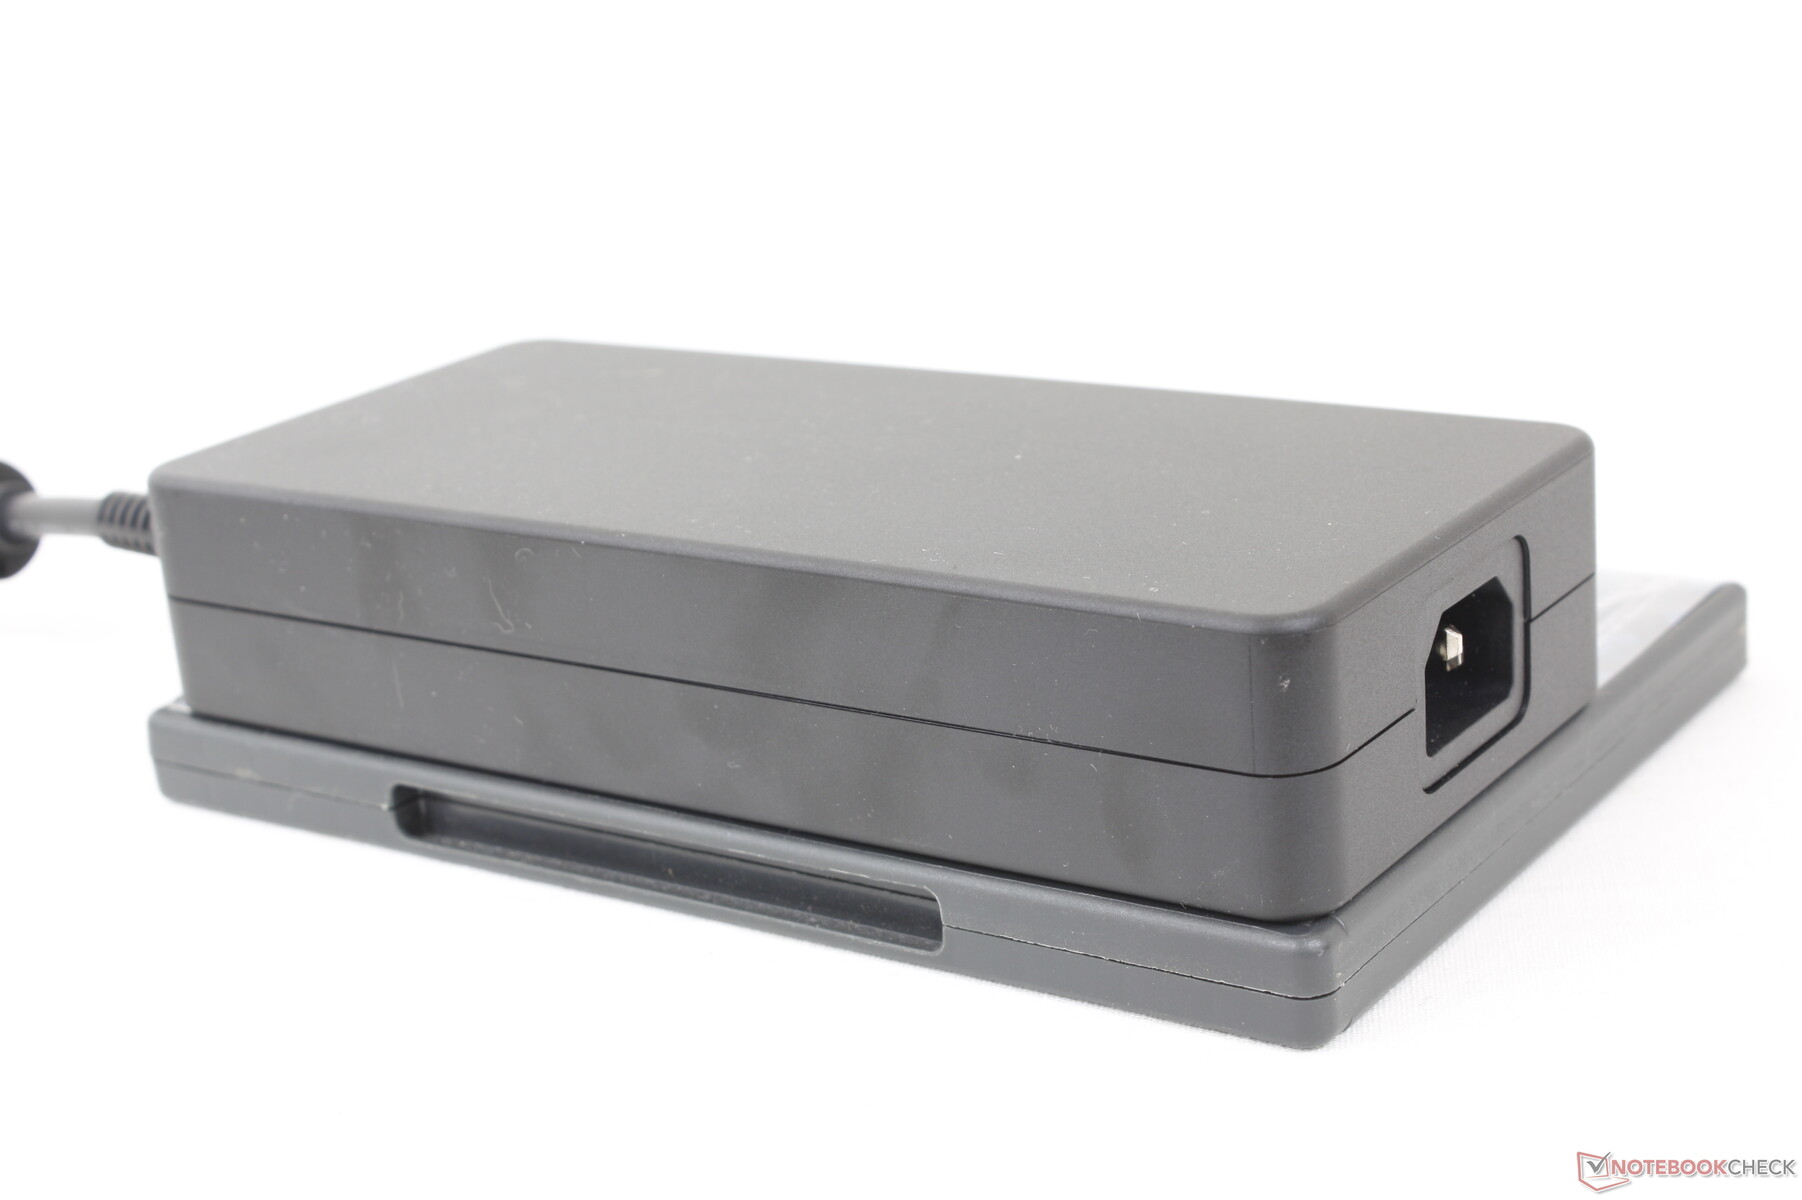
Vi kan registrera ett maximalt uttag på 320 W från den stora (~18,5 x 8,5 x 3,5 cm) 330 W AC-adaptern när både CPU och GPU är 100 procent utnyttjade. Denna hastighet skulle sjunka med tiden, vilket framgår av grafen nedan, på grund av termiska begränsningar.
| Av/Standby | |
| Låg belastning | |
| Hög belastning |
|
Förklaring:
min: | |
| Eurocom Raptor X17 i9-13900HX, GeForce RTX 4090 Laptop GPU, 3x Samsung SSD 980 Pro 1TB (RAID 0), IPS, 2560x1440, 17.3" | Asus ROG Strix Scar 17 G733PY-XS96 R9 7945HX, GeForce RTX 4090 Laptop GPU, SK hynix PC801 HFS001TEJ9X101N, IPS, 2560x1440, 17.3" | Aorus 17X AZF i9-13900HX, GeForce RTX 4090 Laptop GPU, Gigabyte AG470S1TB-SI B10, IPS, 2560x1440, 17.3" | MSI GE78HX 13VH-070US i9-13950HX, GeForce RTX 4080 Laptop GPU, Samsung PM9A1 MZVL22T0HBLB, IPS, 2560x1600, 17" | Eluktronics Mech-17 GP2 i9-13900HX, GeForce RTX 4090 Laptop GPU, Samsung PM9A1 MZVL21T0HCLR, IPS, 2560x1600, 17" | Alienware m17 R5 (R9 6900HX, RX 6850M XT) R9 6900HX, Radeon RX 6850M XT, SSSTC CA6-8D1024, IPS, 3840x2160, 17" | |
|---|---|---|---|---|---|---|
| Power Consumption | 5% | 13% | 3% | 5% | 27% | |
| Idle Minimum * (Watt) | 13.4 | 14.5 -8% | 11 18% | 16.1 -20% | 14 -4% | 13 3% |
| Idle Average * (Watt) | 22.2 | 21.1 5% | 17 23% | 24 -8% | 19.3 13% | 16.5 26% |
| Idle Maximum * (Watt) | 42.4 | 42.8 -1% | 29 32% | 34 20% | 36.8 13% | 17 60% |
| Load Average * (Watt) | 132.8 | 116.7 12% | 134 -1% | 123.6 7% | 117.2 12% | 93 30% |
| Witcher 3 ultra * (Watt) | 304 | 278 9% | 278 9% | 286 6% | 304 -0% | 239 21% |
| Load Maximum * (Watt) | 319.8 | 279.6 13% | 334 -4% | 285.7 11% | 342.5 -7% | 251 22% |
* ... mindre är bättre
Power Consumption Witcher 3 / Stresstest
Power Consumption external Monitor
Batteritid
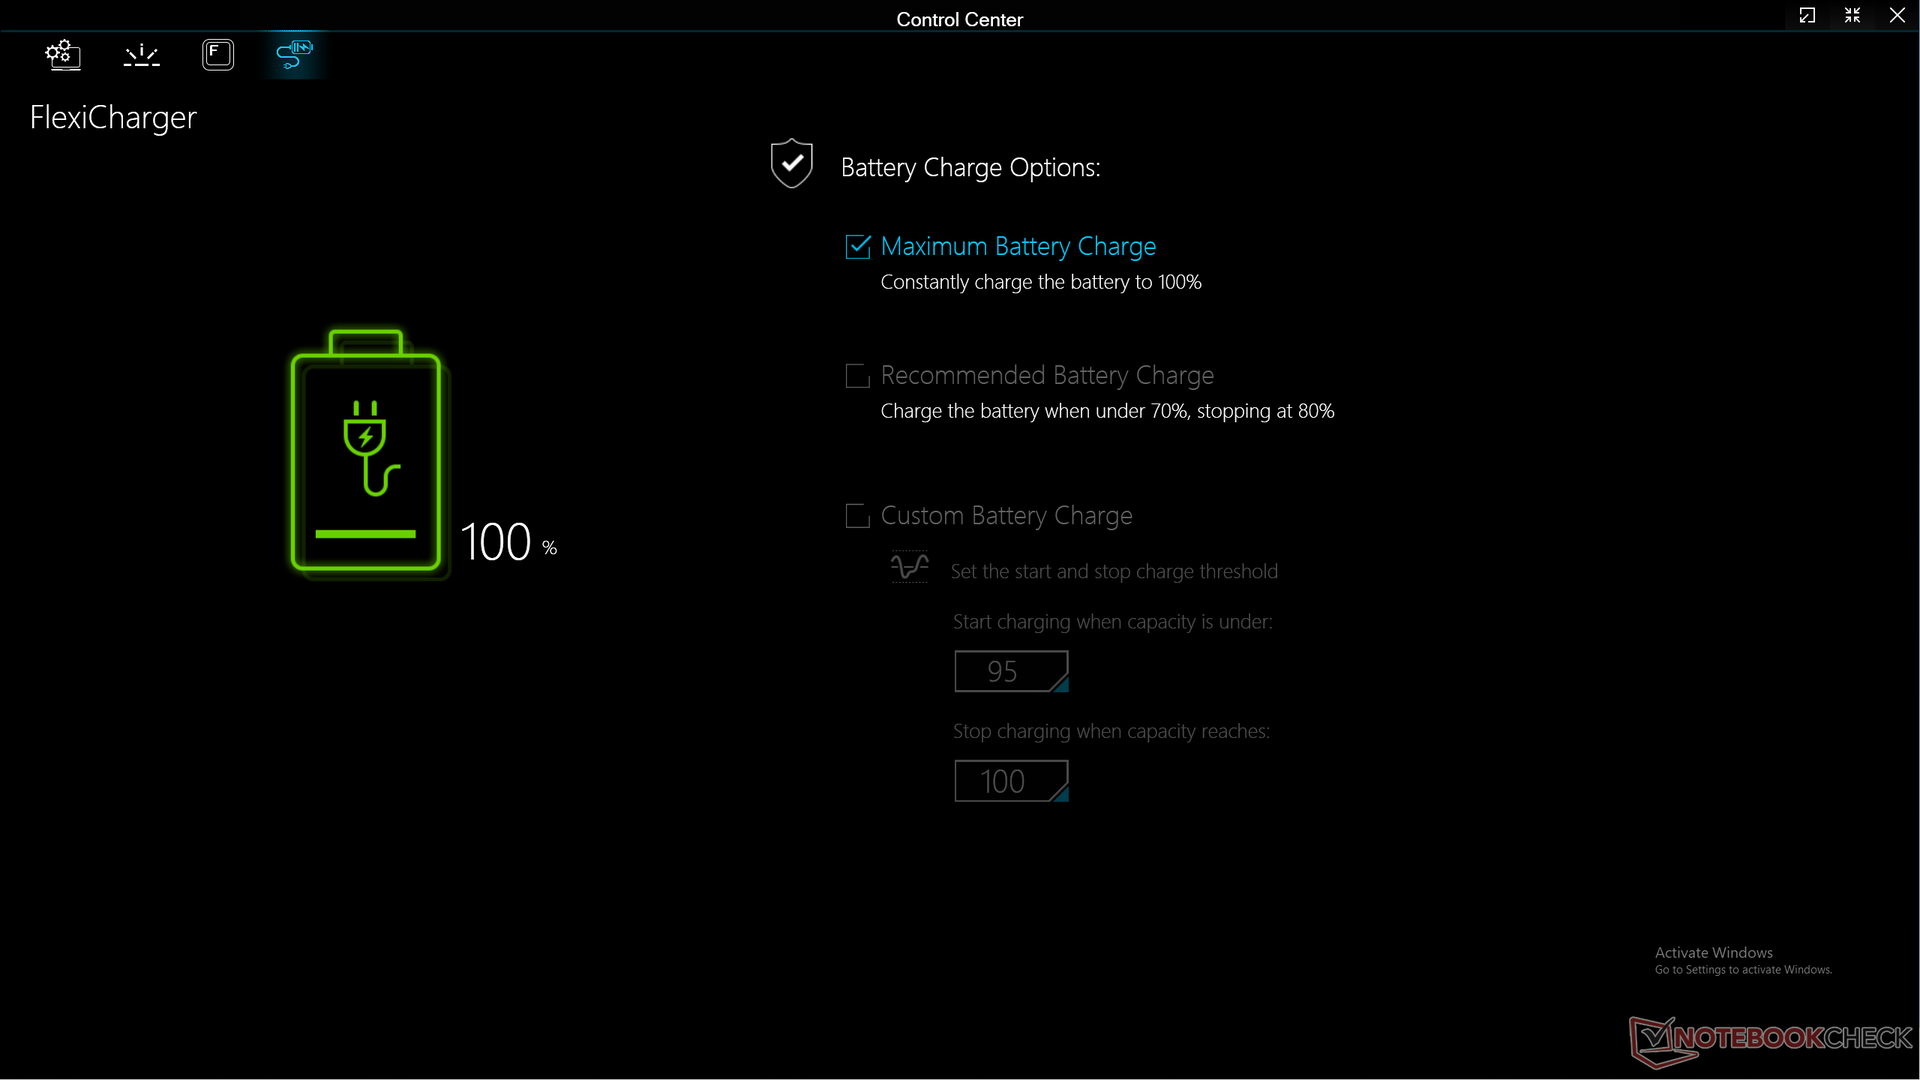
Körtiderna är ganska bra med tanke på hur kraftfulla de interna delarna är. Vi kan spela in knappt 5 timmars surfning på WLAN i den verkliga världen när vi använder den balanserade strömprofilen med iGPU:n aktiv. Trots detta kan konkurrerande modeller som Aorus 17X eller MSI GE78HX vardera hålla över en timme längre än vår Eurocom.
Laddning från tom till full kapacitet med den medföljande 330 W AC-adaptern är relativt långsam på 2 till 2,5 timmar. Laddning via USB-C-växelströmsadaptrar från tredje part stöds, men observera att det bara fungerar på bara en av de två USB-C-portarna (porten närmast baksidan).
| Eurocom Raptor X17 i9-13900HX, GeForce RTX 4090 Laptop GPU, 99 Wh | Asus ROG Strix Scar 17 G733PY-XS96 R9 7945HX, GeForce RTX 4090 Laptop GPU, 90 Wh | Aorus 17X AZF i9-13900HX, GeForce RTX 4090 Laptop GPU, 99 Wh | MSI GE78HX 13VH-070US i9-13950HX, GeForce RTX 4080 Laptop GPU, 99 Wh | Eluktronics Mech-17 GP2 i9-13900HX, GeForce RTX 4090 Laptop GPU, 99 Wh | Alienware m17 R5 (R9 6900HX, RX 6850M XT) R9 6900HX, Radeon RX 6850M XT, 97 Wh | |
|---|---|---|---|---|---|---|
| Batteridrifttid | -18% | 19% | -2% | 2% | 8% | |
| Reader / Idle (h) | 10.2 | 9 -12% | 7.3 -28% | |||
| WiFi v1.3 (h) | 5 | 4.1 -18% | 6.5 30% | 6.1 22% | 5.1 2% | 4.8 -4% |
| Load (h) | 1.5 | 2.1 40% | 1.5 0% | 1.8 20% | ||
| H.264 (h) | 6.7 | 4.9 |
För
Emot
Bedömning - Den är bra, men skulle kunna behöva mer TLC
Det bästa med Raptor X17 är dess mycket snabba prestanda i förhållande till den tunna profilen. Den kommer utan omsvep att köras mycket varm och mycket högljudd för att pressa ut så mycket prestanda som möjligt ur CPU och GPU som möjligt. Särskilt prestandajägare kommer sannolikt att uppskatta detta tillvägagångssätt samt stödet för upp till tre PCIe4 x4 NVMe SSD-enheter.
Tyvärr finns det en handfull nackdelar att ha i åtanke. Med över 60 dB(A) när man spelar är systemet märkbart högre än de flesta andra bärbara datorer för spel på marknaden. När konkurrerande modeller som t.ex.MSI GE78HX eller Asus ROG Strix Scar 17 kan erbjuda liknande processoralternativ samtidigt som de är 10 dB(A) tystare när de spelar, blir det svårare att sälja Raptor X17 framför många alternativ på marknaden. Den mycket tyngre vikten gör den inte heller någon tjänst.
Hårdvaran och prestandan är solid, men andra aspekter som de svaga högtalarna, de mycket högljudda fläktarna och den oreflekterade Control Center-mjukvaran återspeglar inte riktigt det höga priset.
Det finns ytterligare några detaljer som vi tycker kunde ha varit bättre också. De förvirrande strömprofilerna, det pulserande fläktbeteendet, de dolda GPU-lägena, den måttligt ojämna bakgrundsbelysningen och den valfria kalibrerade skärmen är alla olyckliga att se på en bärbar dator i den övre prisklassen som börjar på en bra bit över 3 000 USD. Eurocom säger att de för närvarande håller på att omforma BIOS-menyn och Control Center-programvaran, vilket förhoppningsvis bör åtgärda några av våra klagomål.
Pris och tillgänglighet
Eurocom levererar nu raptor X17 i Nordamerika från 3550 USD för baskonfigurationen upp till över 6000 USD i vår testenhet.
Eurocom Raptor X17
- 05/18/2023 v7 (old)
Allen Ngo
Genomskinlighet
Valet av enheter som ska granskas görs av vår redaktion. Testprovet gavs till författaren som ett lån av tillverkaren eller återförsäljaren för denna recension. Långivaren hade inget inflytande på denna recension och inte heller fick tillverkaren en kopia av denna recension innan publiceringen. Det fanns ingen skyldighet att publicera denna recension. Som ett oberoende medieföretag är Notebookcheck inte föremål för auktoritet från tillverkare, återförsäljare eller förlag.
This is how Notebookcheck is testingEvery year, Notebookcheck independently reviews hundreds of laptops and smartphones using standardized procedures to ensure that all results are comparable. We have continuously developed our test methods for around 20 years and set industry standards in the process. In our test labs, high-quality measuring equipment is utilized by experienced technicians and editors. These tests involve a multi-stage validation process. Our complex rating system is based on hundreds of well-founded measurements and benchmarks, which maintains objectivity.
Price comparison

