Medion Erazer Scout E20 recension: Prisvärd FHD gaming laptop med RTX 4050
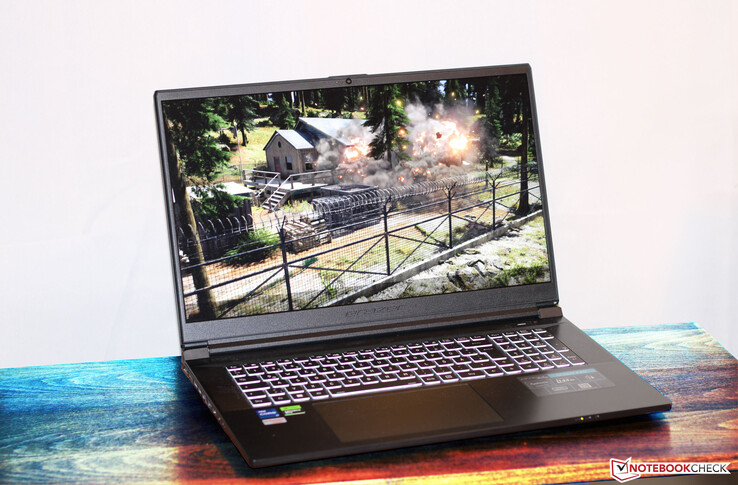
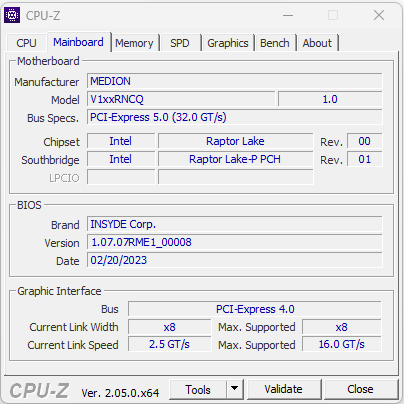
Även om Erazer Scout E20 i första hand betraktas som en bärbar dator för spel i instegssegmentet, kan den också användas på andra områden som kräver hög prestanda, till exempel rendering eller videobearbetning. Medion kombinerar en Raptor Lake-processor med en GeForce RTX 4050gPU för bärbara datorer och begär cirka 1 500 euro (~1 658 dollar) för hela paketet. Datorn är baserad på en barebone från Clevo (V170RNCQ). Bland konkurrenterna finns enheter som t.ex Gigabyte G7 KE, denMSI Katana 17 B13VFK, denAsus TUF Gaming A16 FA617, denLenovo Legion 5 15IAH7H 82RBochAcer Nitro 5 AN515-46-R1A1.
Possible Competitors in Comparison
Gradering | Datum | Modell | Vikt | Höjd | Storlek | Upplösning | Pris |
|---|---|---|---|---|---|---|---|
| 83 % v7 (old) | 05/2023 | Medion Erazer Scout E20 i7-13700H, GeForce RTX 4050 Laptop GPU | 2.8 kg | 29 mm | 17.30" | 1920x1080 | |
| 83.3 % v7 (old) | 01/2023 | Gigabyte G7 KE i5-12500H, GeForce RTX 3060 Laptop GPU | 2.6 kg | 25 mm | 17.30" | 1920x1080 | |
| 82.1 % v7 (old) | 02/2023 | MSI Katana 17 B13VFK i7-13620H, GeForce RTX 4060 Laptop GPU | 2.8 kg | 25.2 mm | 17.30" | 1920x1080 | |
| 86.2 % v7 (old) | 02/2023 | Asus TUF Gaming A16 FA617 R7 7735HS, Radeon RX 7600S | 2.2 kg | 27 mm | 16.00" | 1920x1200 | |
| 87.5 % v7 (old) | 11/2022 | Lenovo Legion 5 15IAH7H 82RB i7-12700H, GeForce RTX 3060 Laptop GPU | 2.4 kg | 19.99 mm | 15.60" | 1920x1080 | |
| 83.9 % v7 (old) | 11/2022 | Acer Nitro 5 AN515-46-R1A1 R7 6800H, GeForce RTX 3070 Ti Laptop GPU | 2.5 kg | 26.8 mm | 15.60" | 1920x1080 |
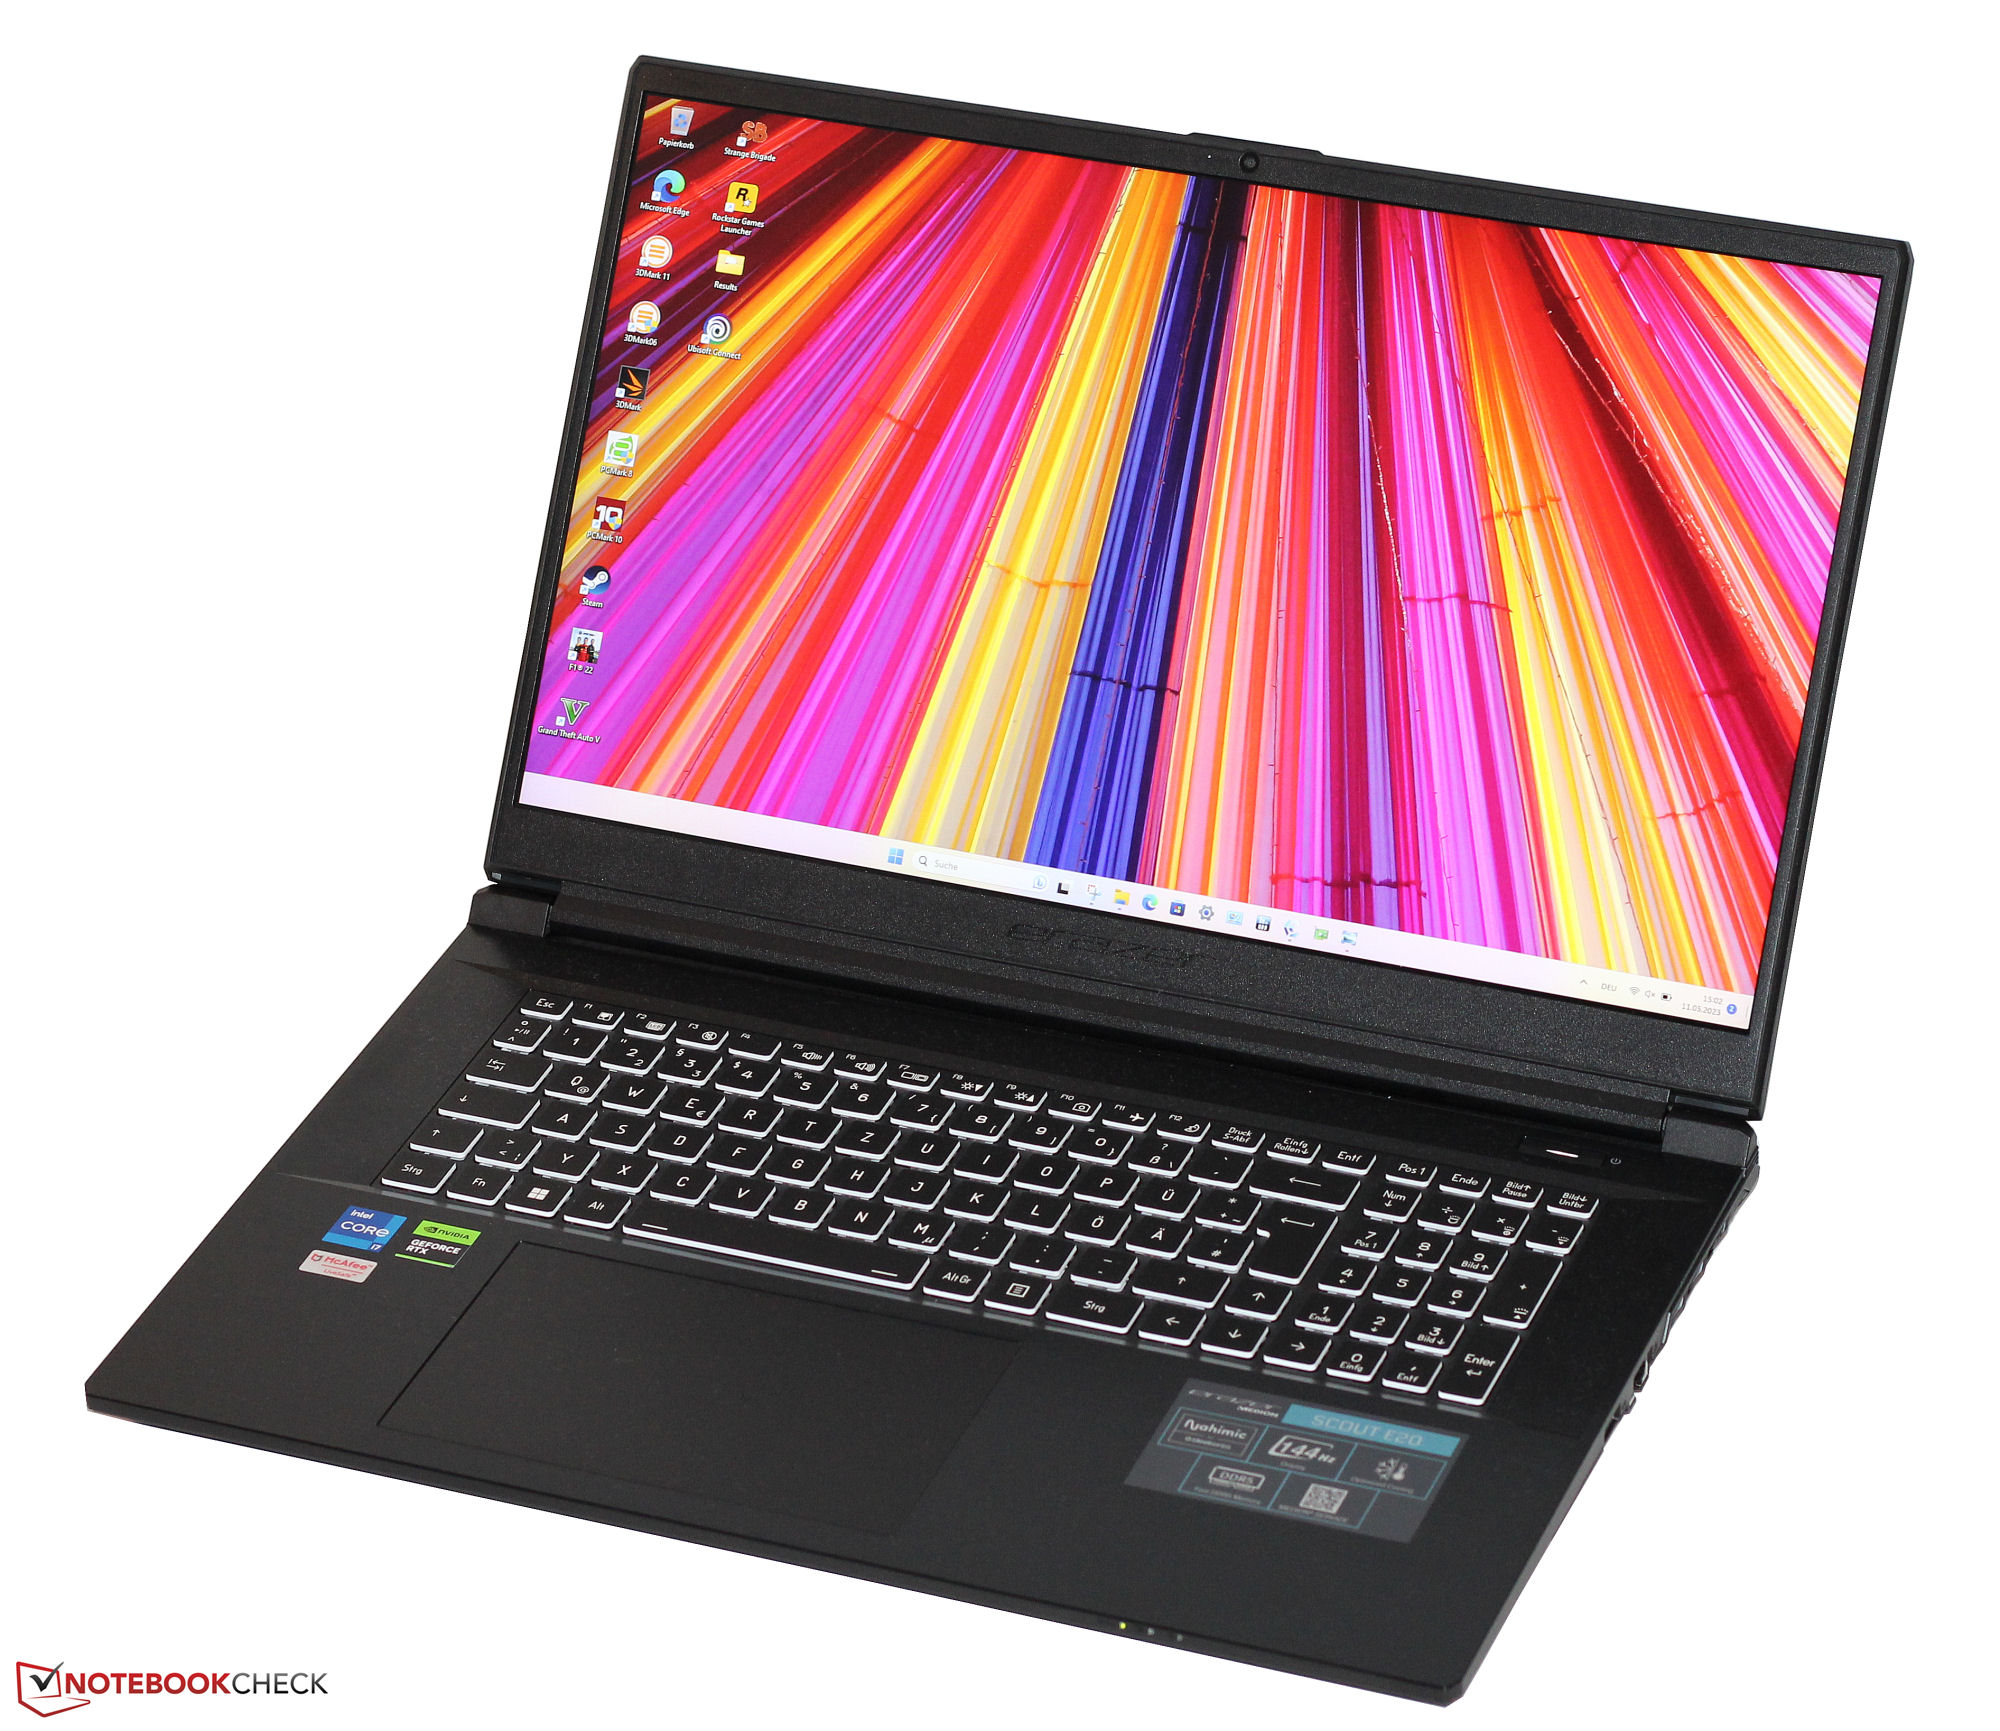
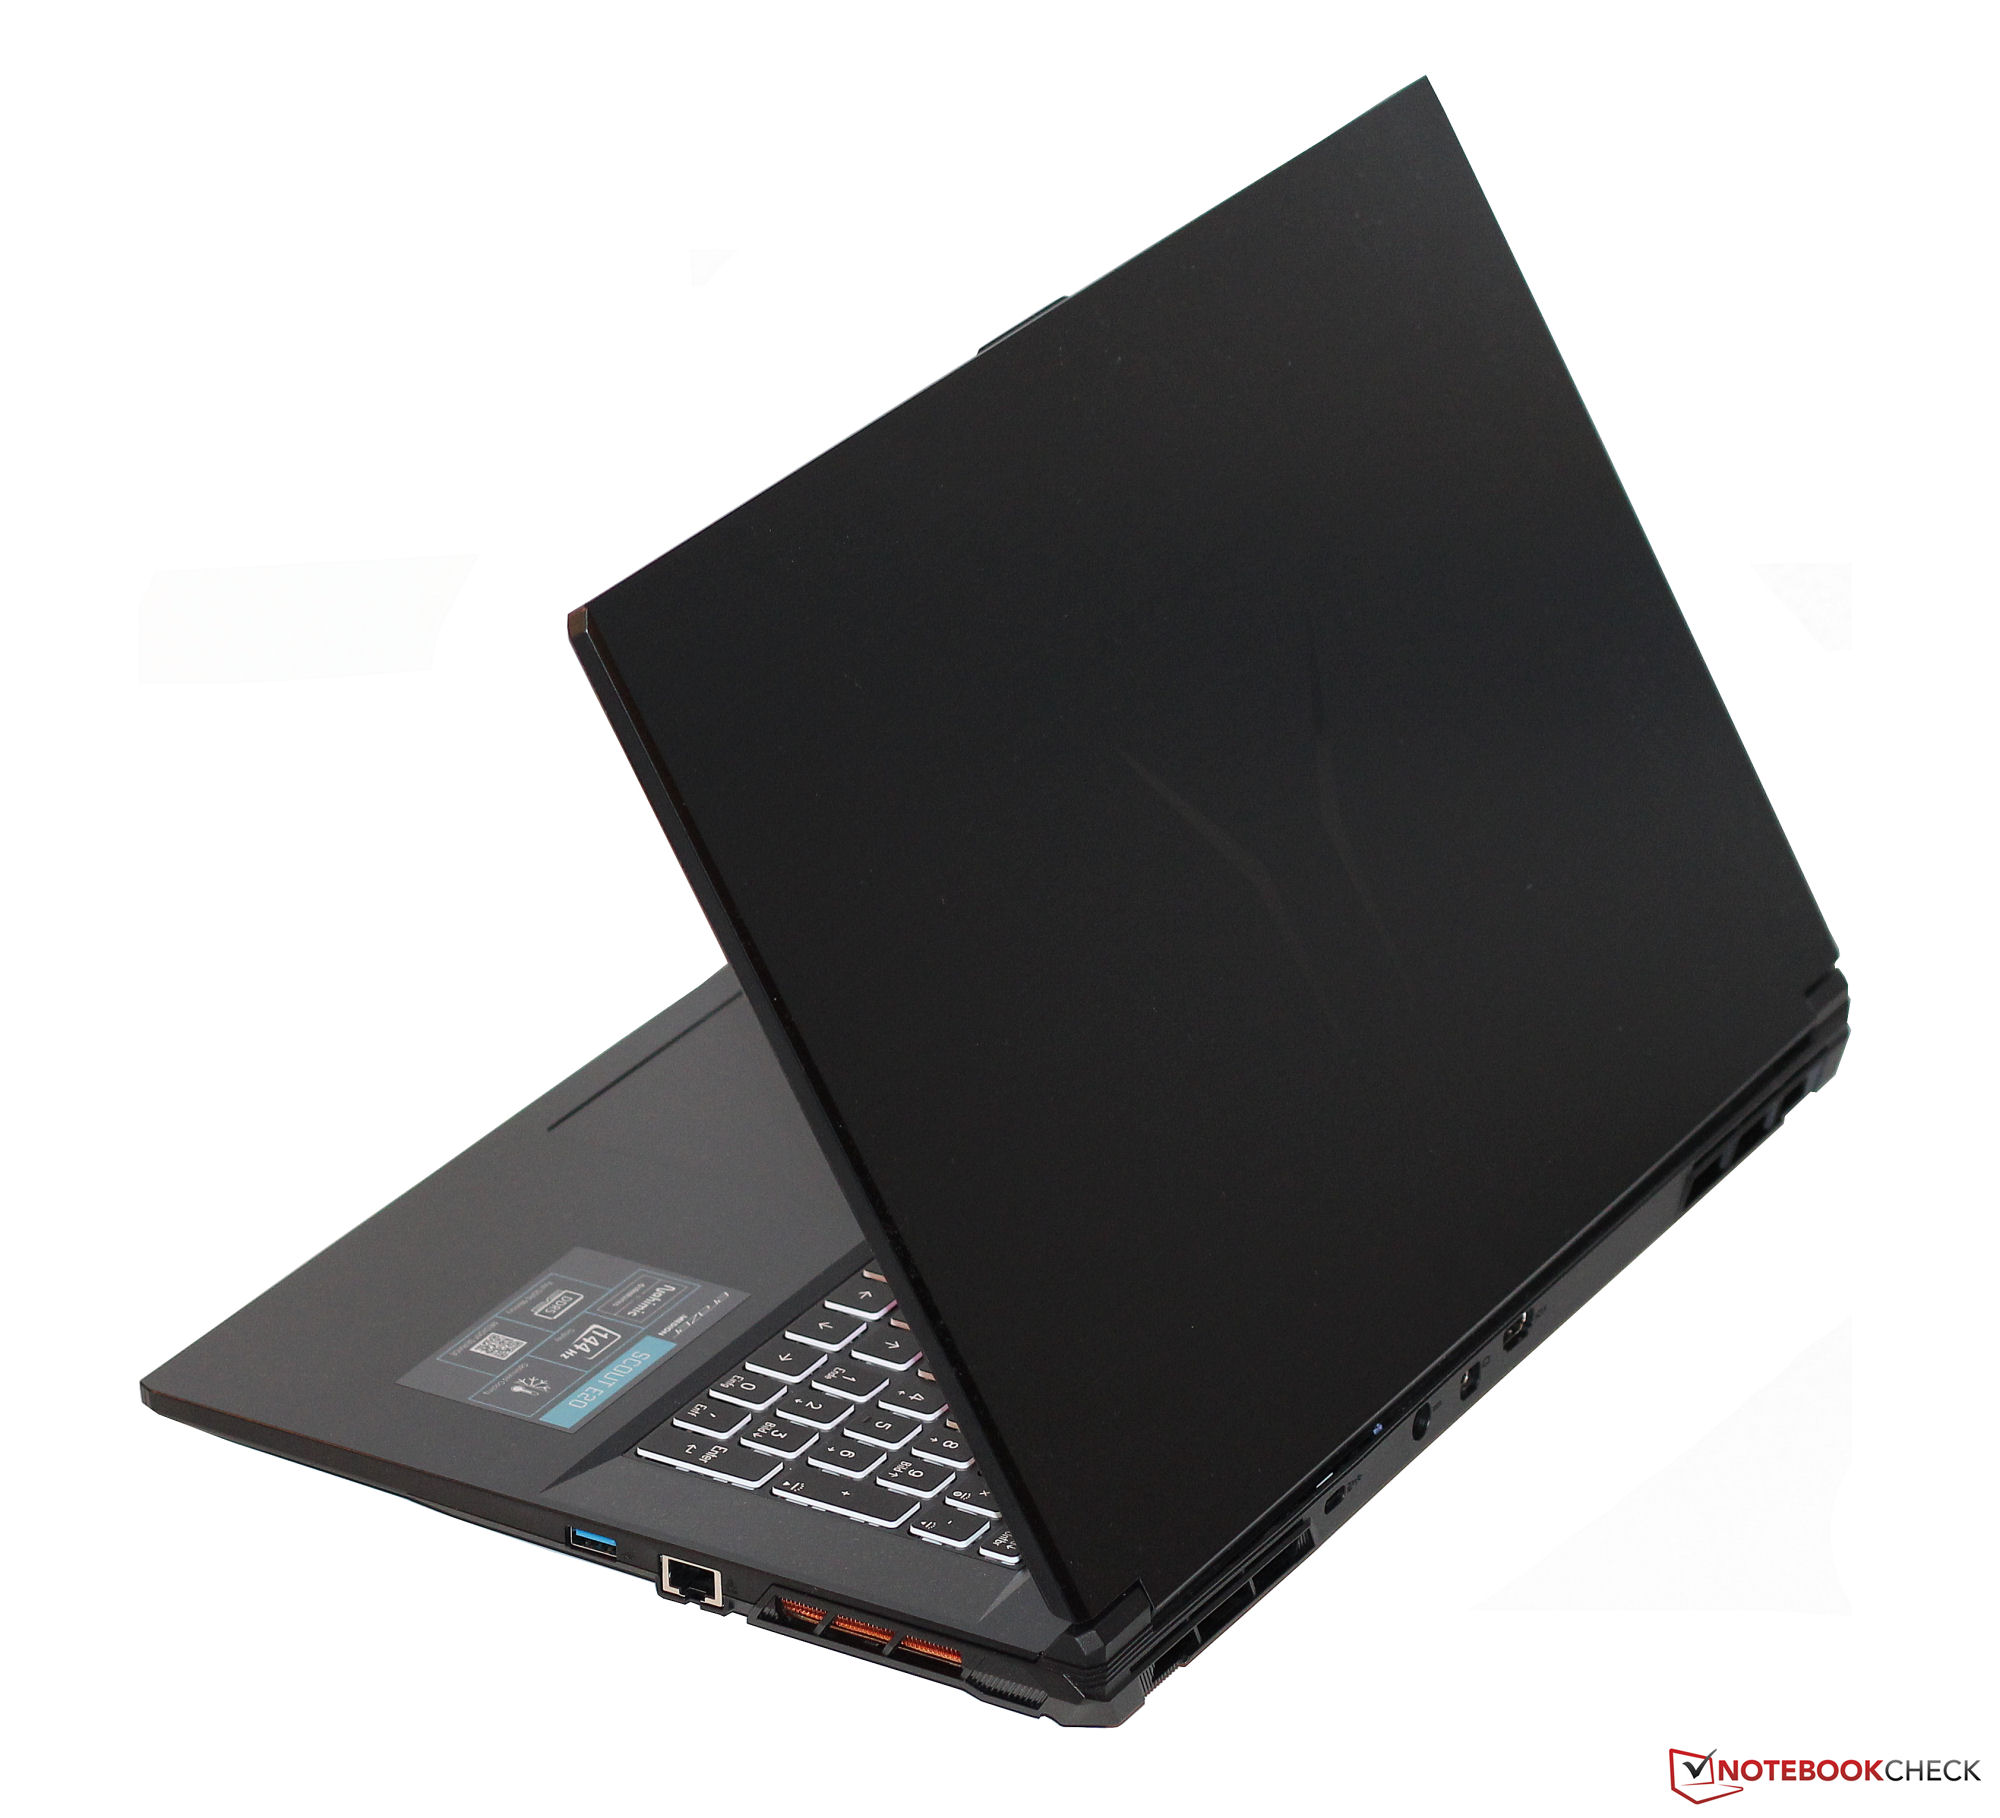
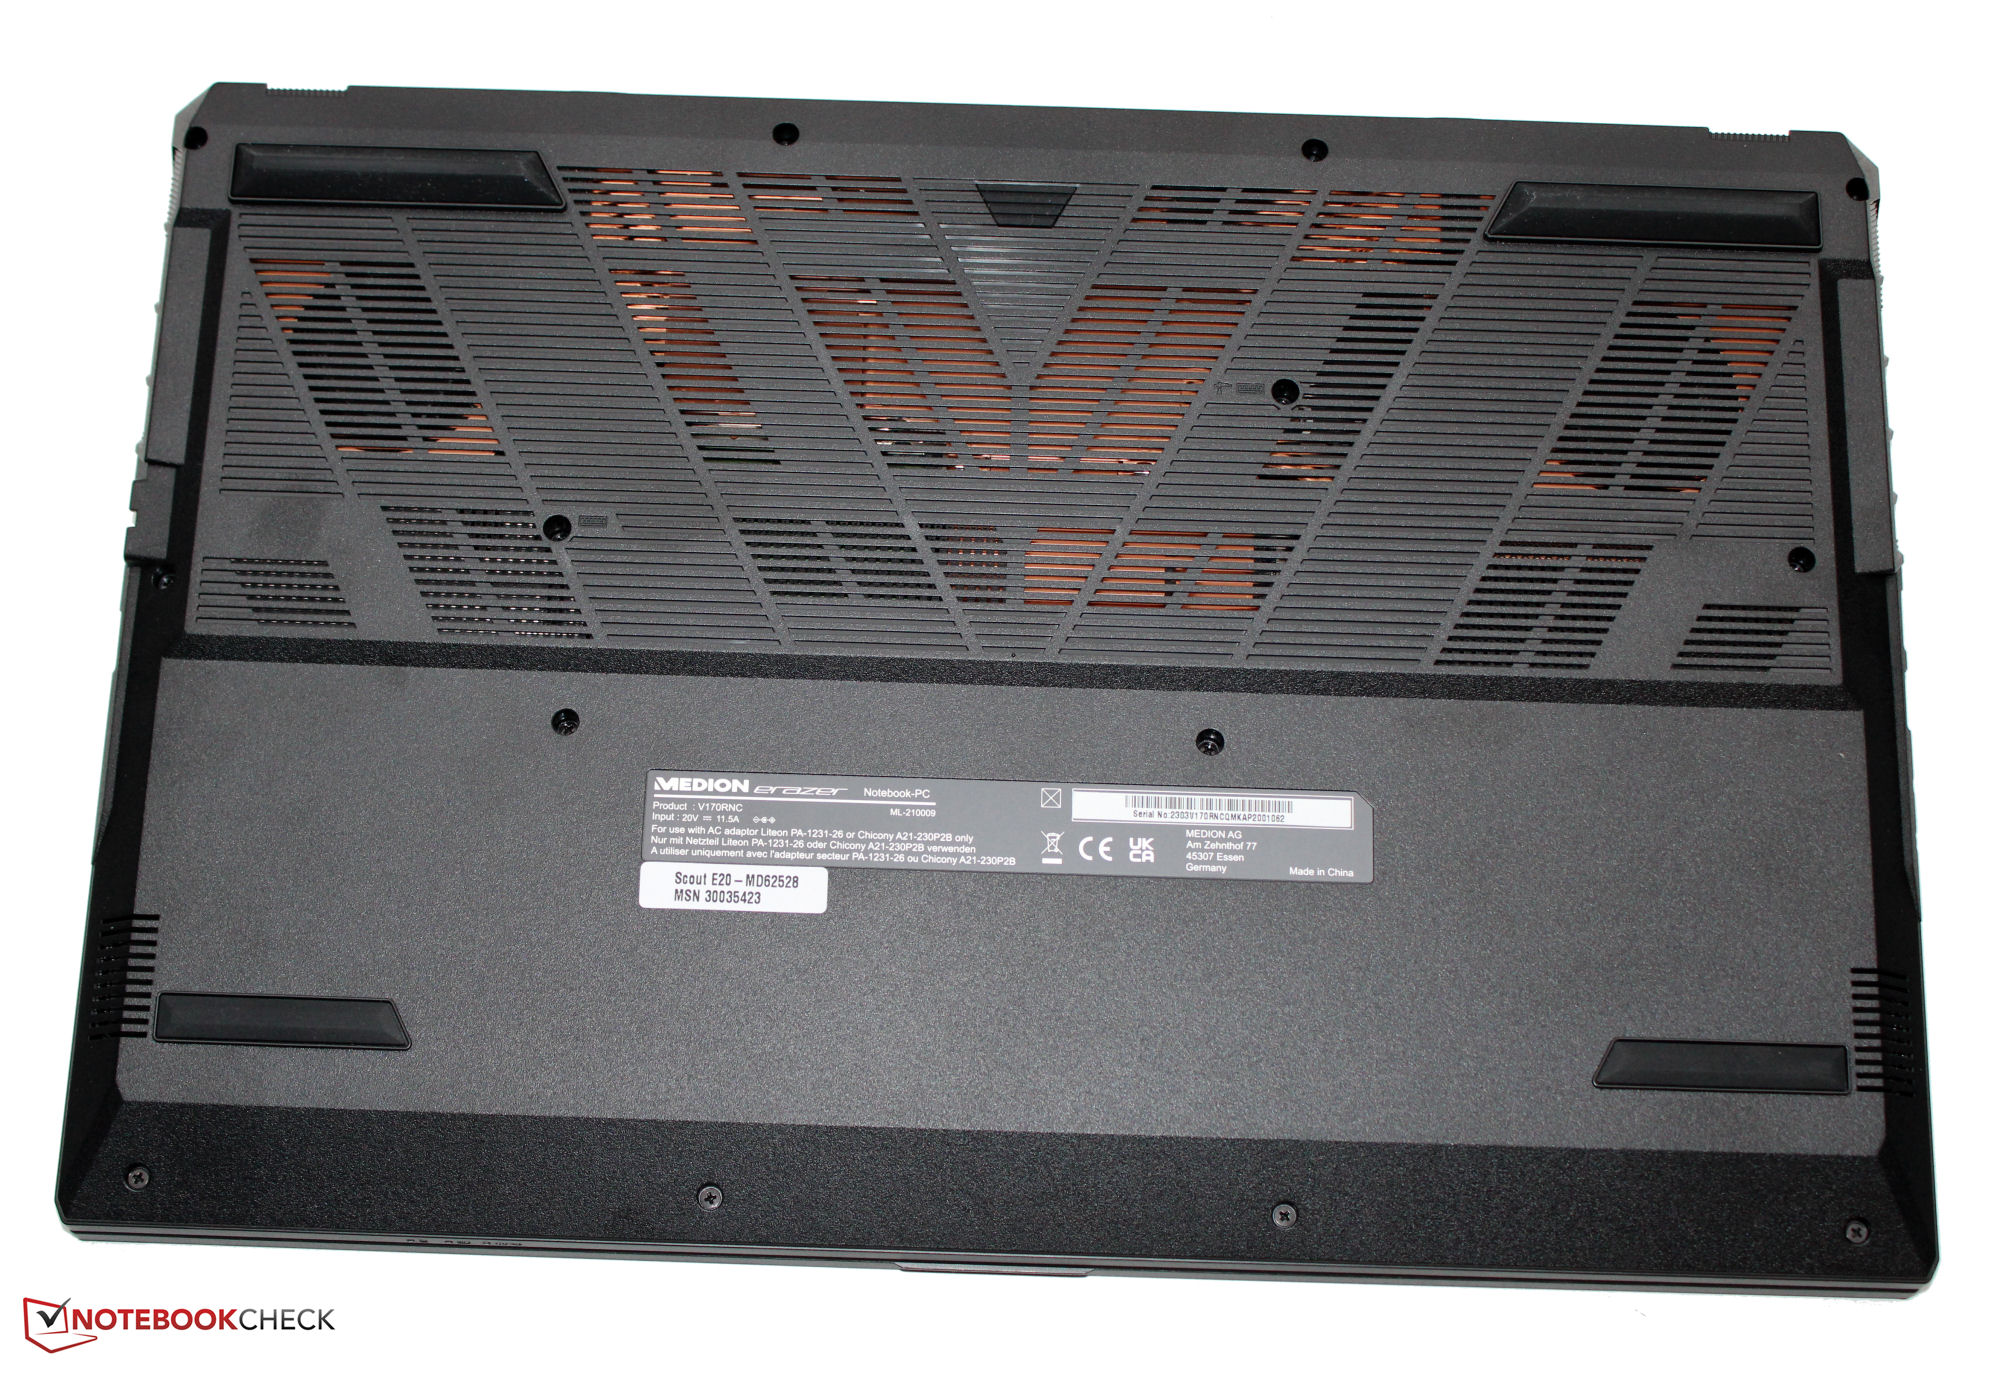
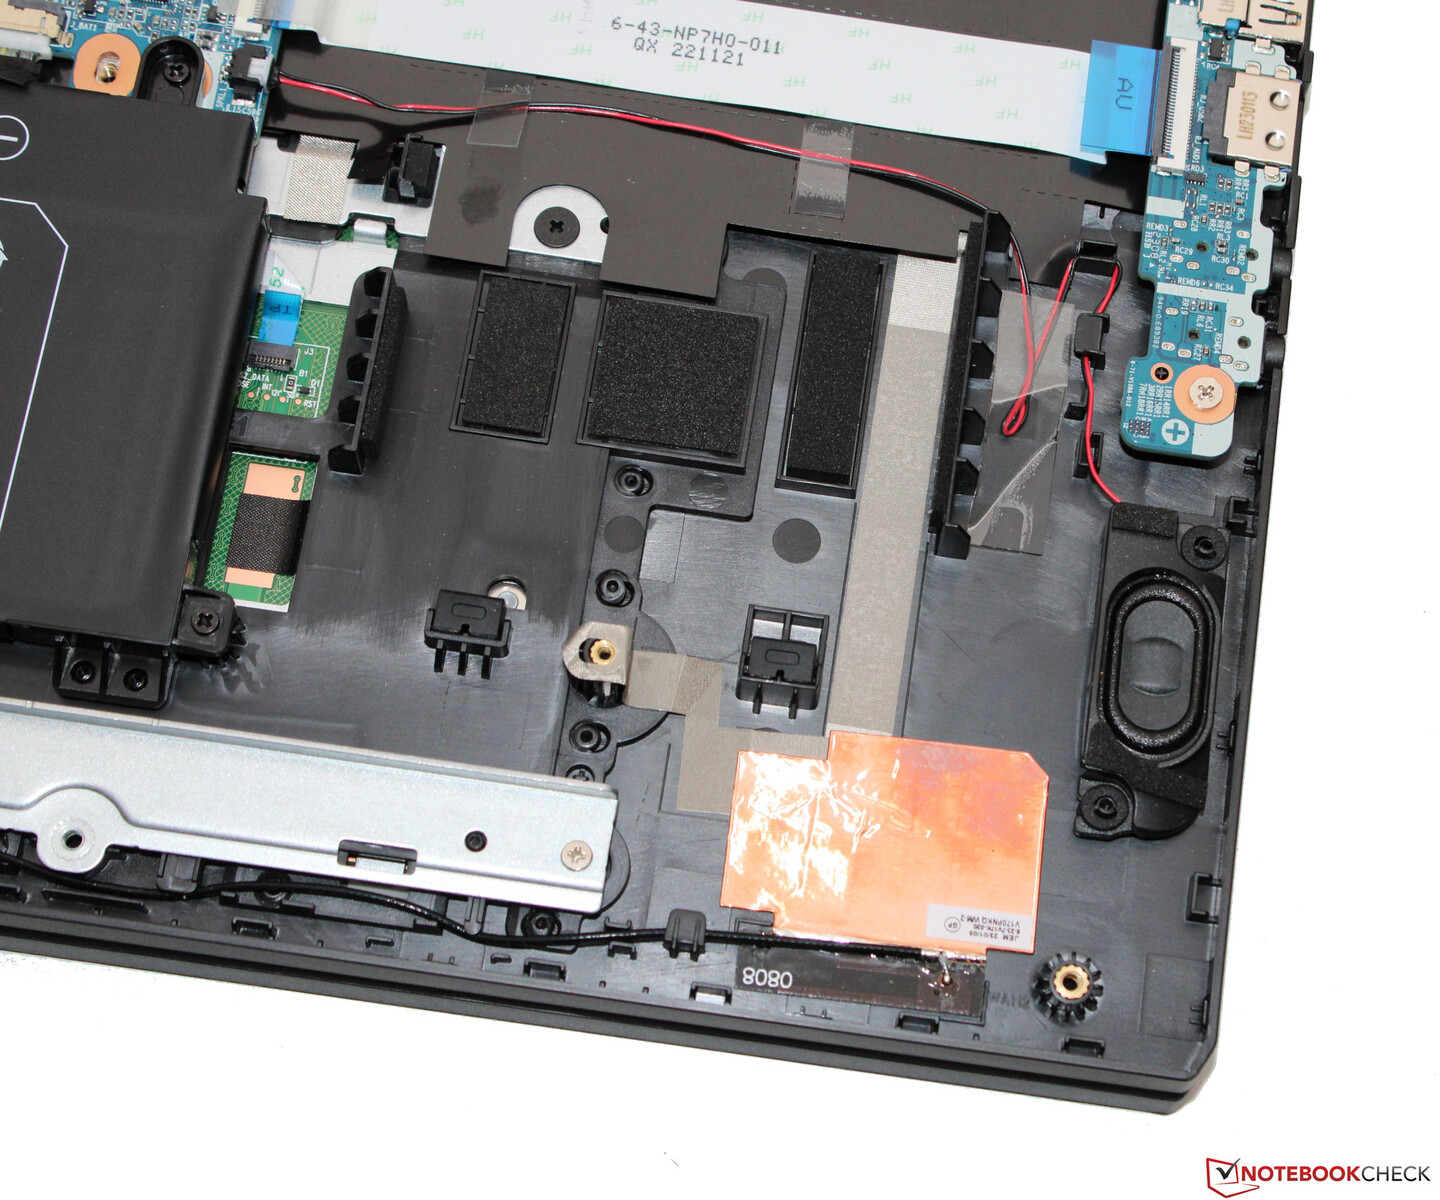
Hölje - Den bärbara datorn från Medion har ett hölje av plast
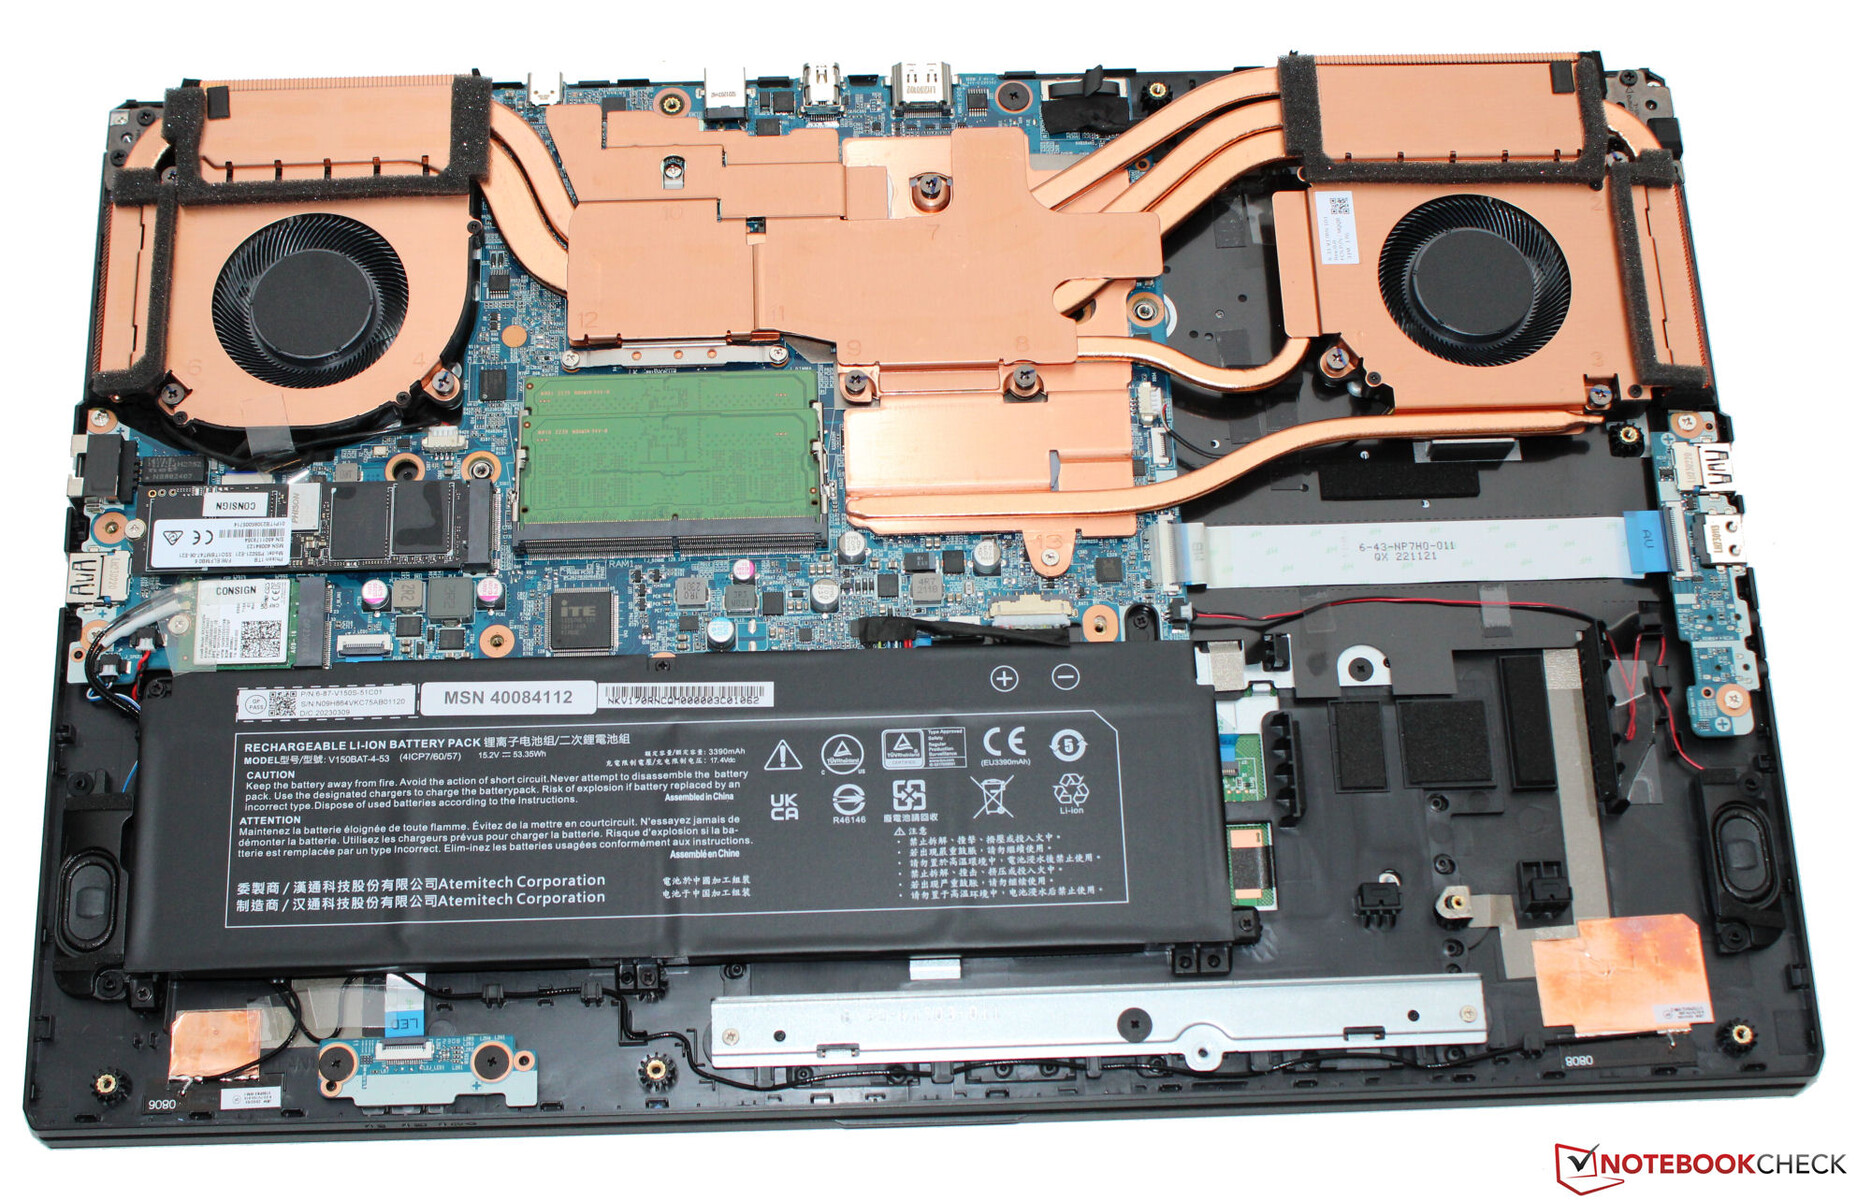
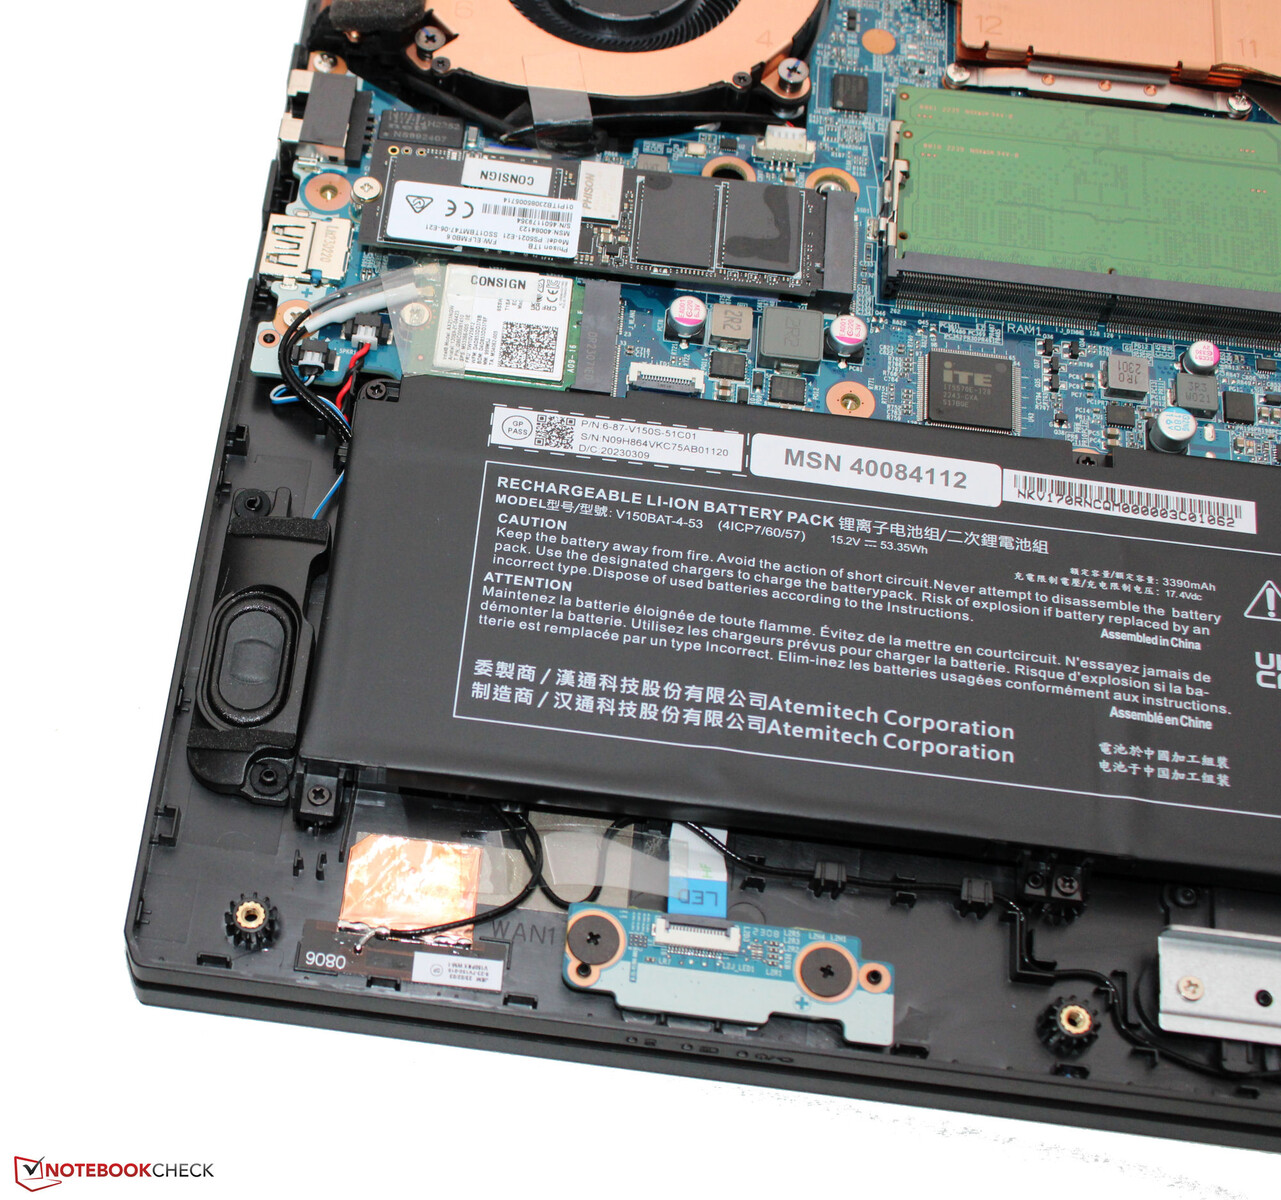
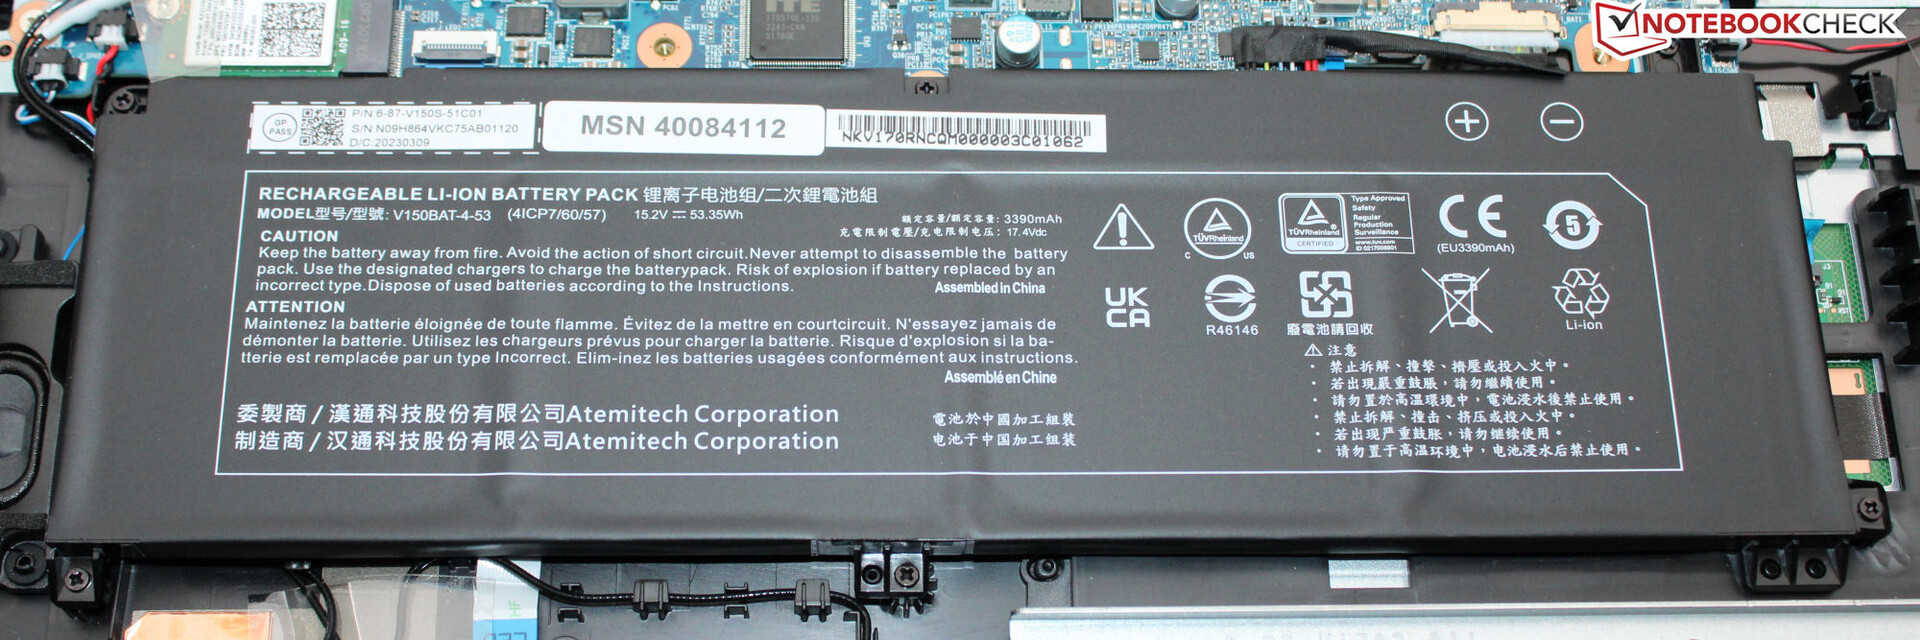
E20 kan inte erbjuda några material som ger ett högkvalitativt utseende, utan hela fodralet är tillverkat av svart plast. Medion använder sig av släta, matta ytor. Den anspråkslösa designen på den bärbara datorn skulle också göra det möjligt att använda den i affärsmiljöer. Bortsett från tangentbordsbelysningen innehåller den bärbara datorn ingen färgglad utsmyckning i form av LED-band. Batteriet (som är fastskruvat och inte limmat) och resten av utrustningen är åtkomliga efter att man tagit bort botten av fodralet.
Scout visar inte på några fel i tillverkningen. Sprickorna är jämna och det finns inga materialutsprång. Basenheten kan endast skeva något men locket mer påtagligt, även om detta fortfarande håller sig inom ramarna. Gångjärnen håller locket tätt på plats, med en maximal öppningsvinkel på cirka 135 grader. Locket kan öppnas med en enda hand.
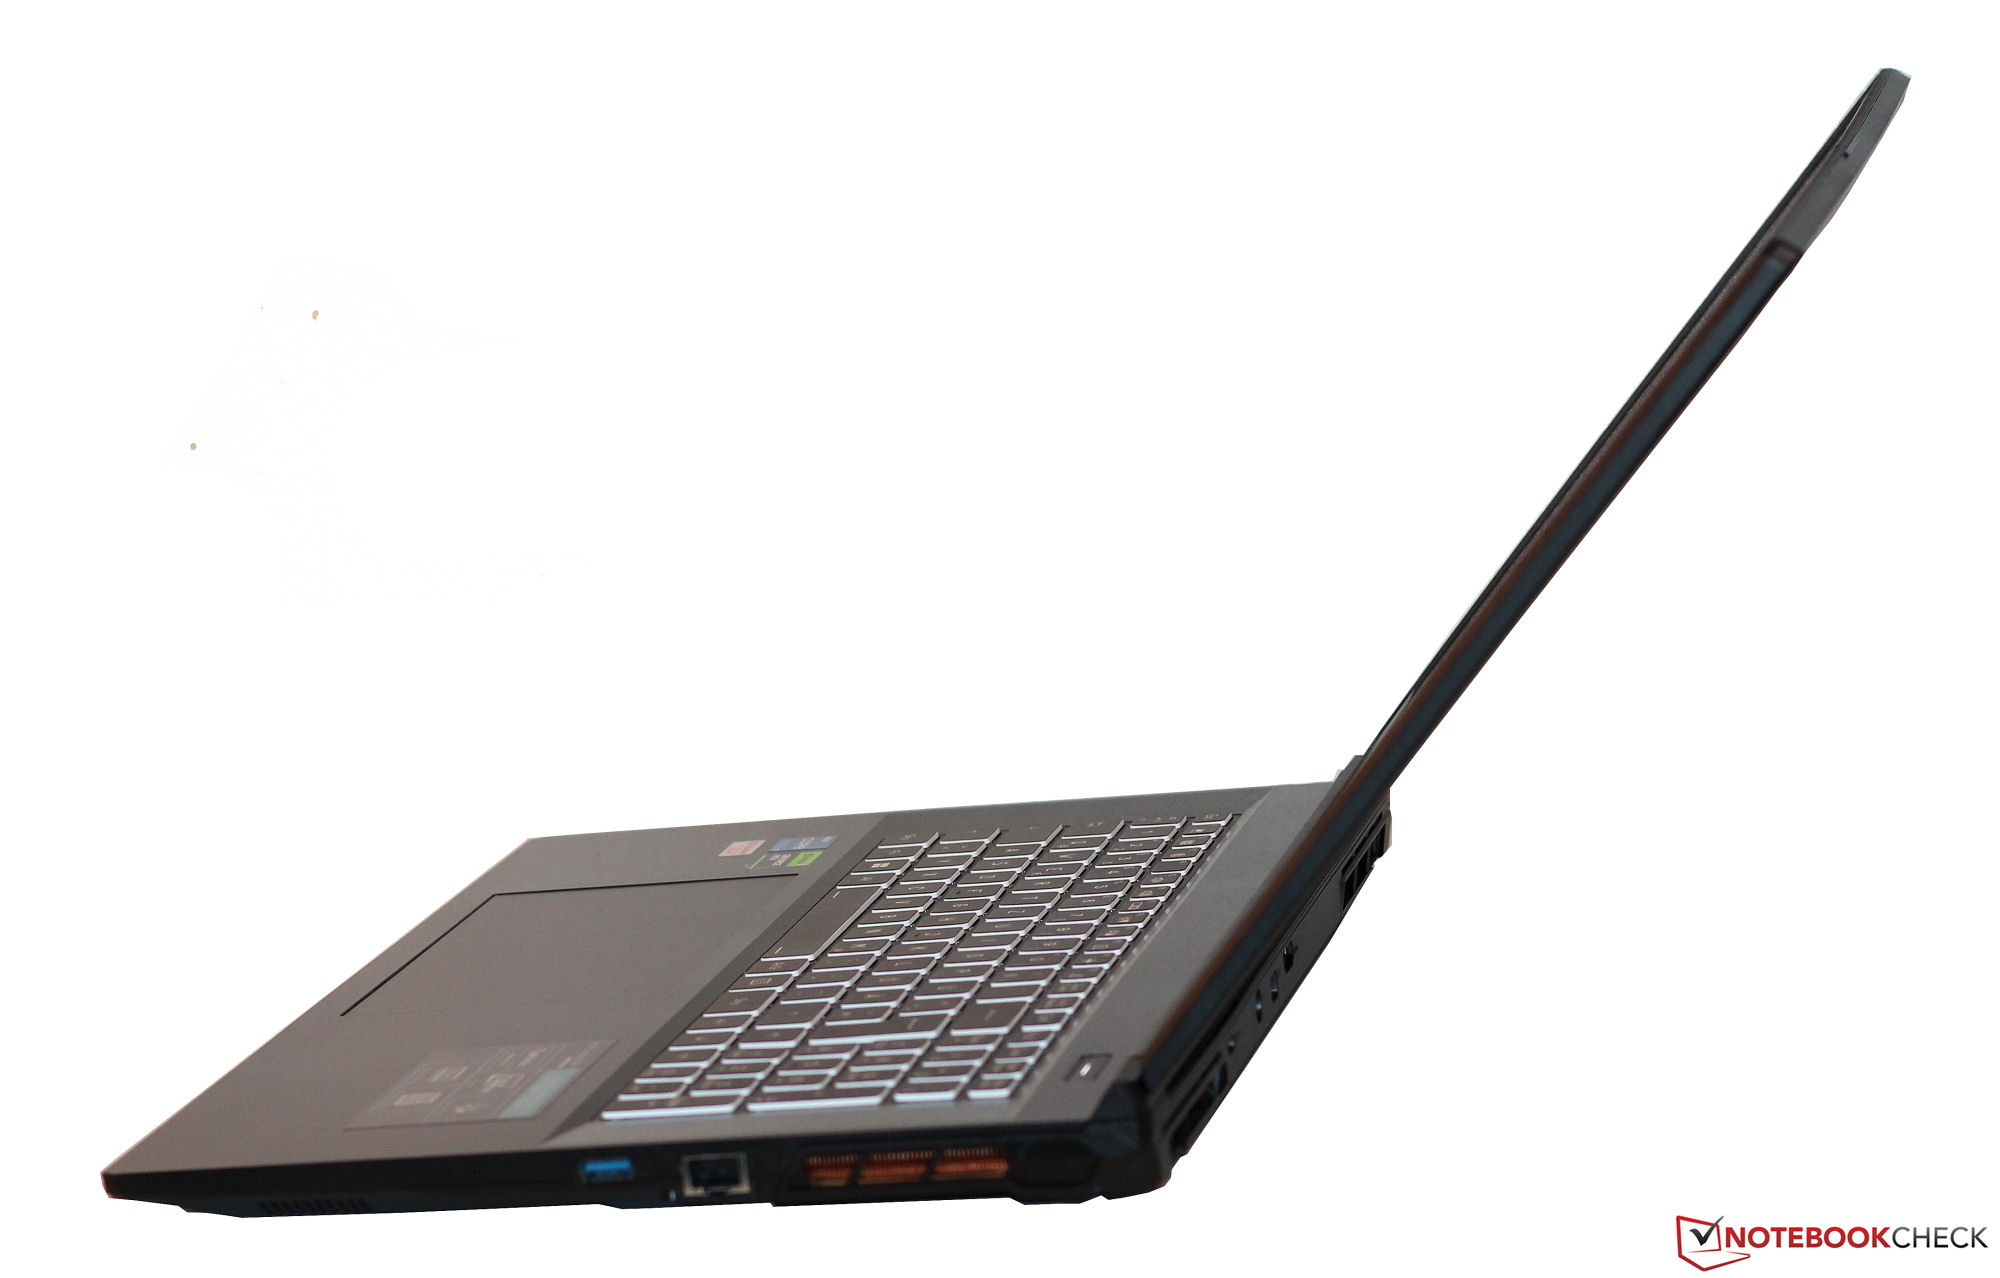
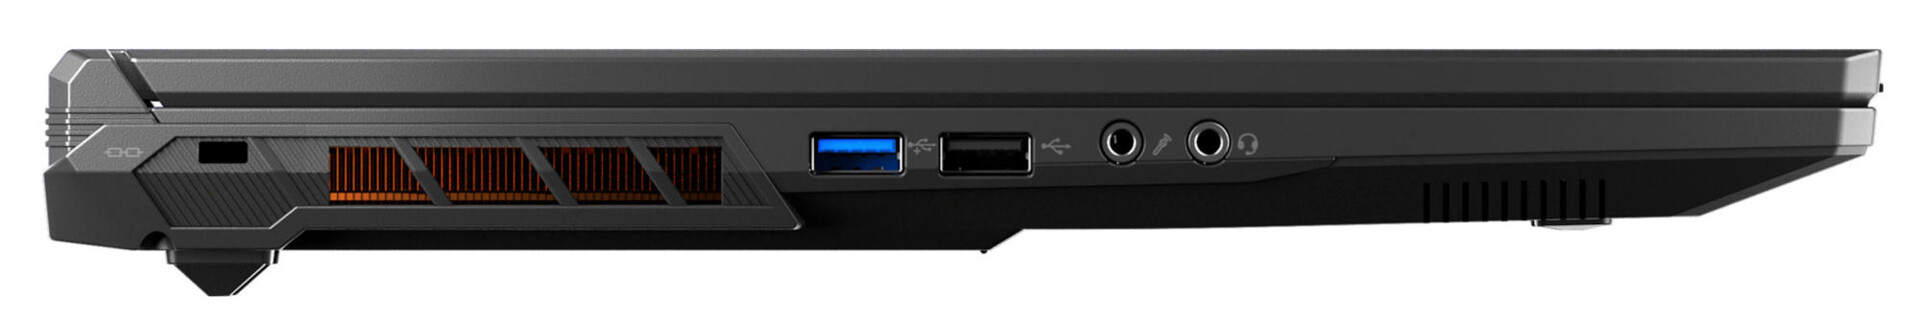
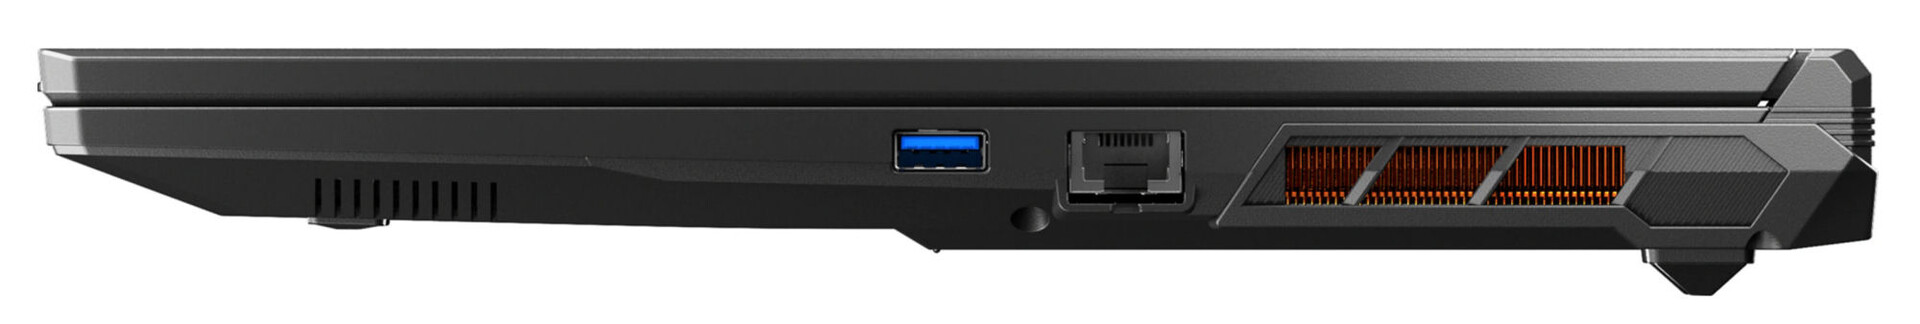
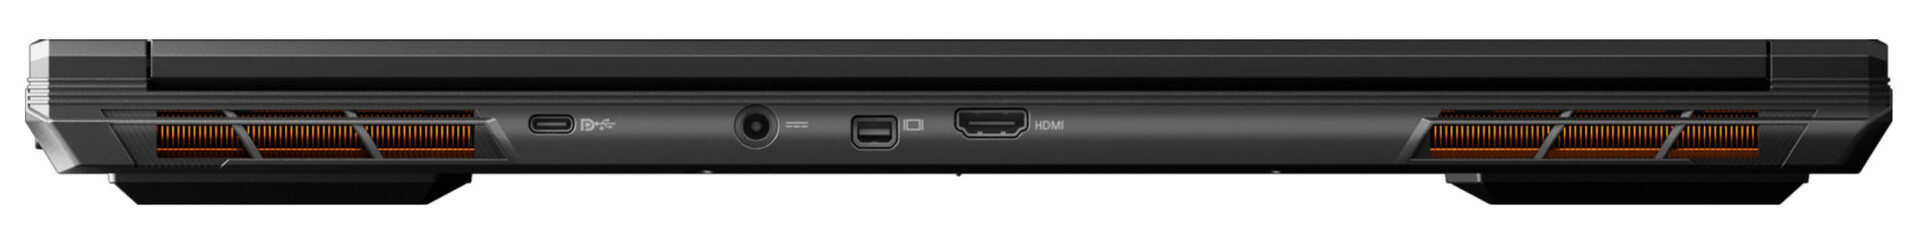
Utrustning - Ingen Thunderbolt för Erazer
Erazer har tre USB-A-portar (1x USB 2.0, 1x USB 3.2 Gen 1, 1x USB 3.2 Gen 2) och en enda USB-C-port (USB 3.2 Gen 2). Den sistnämnda kan visserligen ge ut en DisplayPort-signal, men har inget stöd för Power Delivery. Scout E20 innehåller totalt tre videoutgångsportar (HDMI 2.1, 2x DP). Anslutningsutrustningen kompletteras av två ljudportar och en Gigabit Ethernet-port. Det finns ingen läsare för lagringskort.
Videoportarna och strömanslutningen finns på baksidan av enheten, så motsvarande kablar skulle löpa på baksidan och inte vara i vägen.
Kommunikation
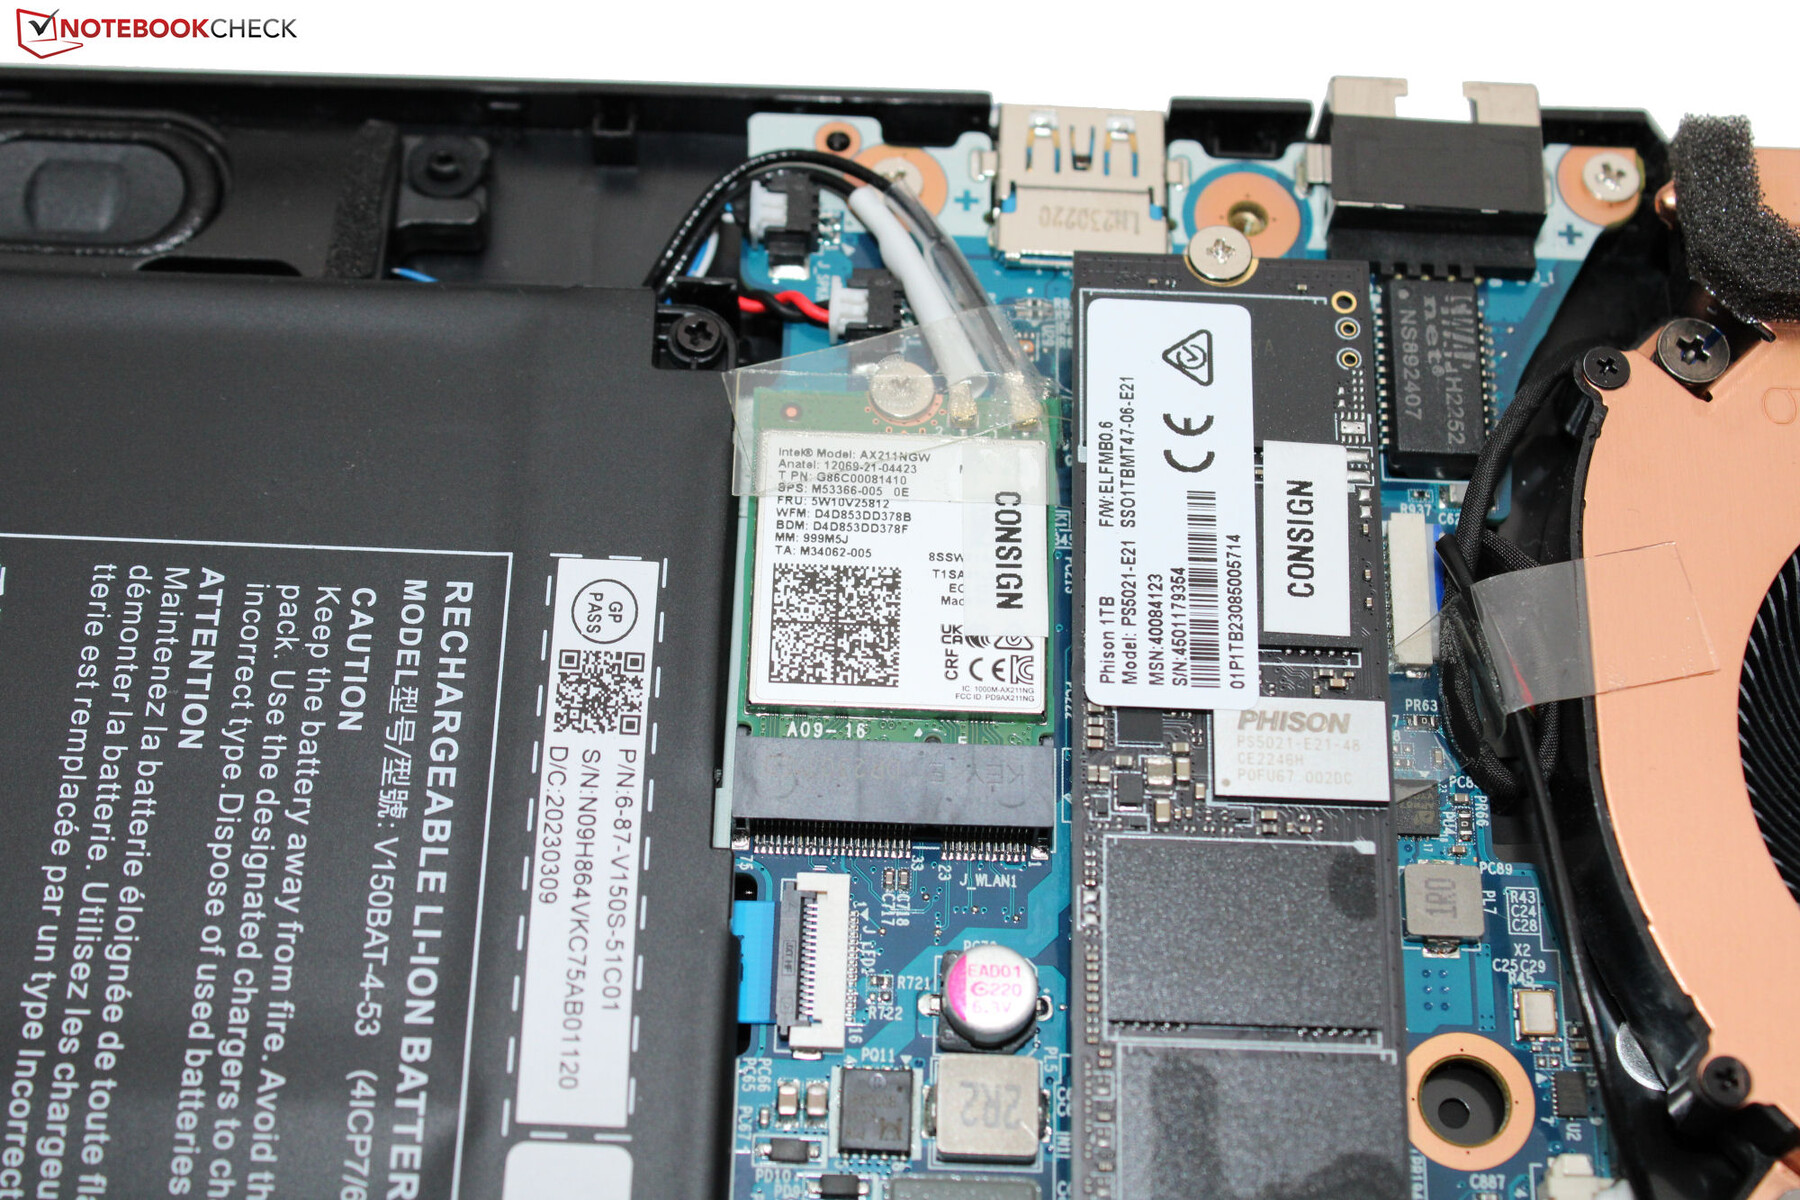
Under optimala förhållanden (utan andra WLAN-enheter i närheten och på nära avstånd mellan bärbar dator och serverdator) uppnås utmärkta WiFi-datahastigheter. Den bärbara datorn från Medion använder ett Intel AX211 WiFi-6E-chip, och trådbundna anslutningar hanteras också av ett Intel-chip (I219-V; 1 Gbit/s).
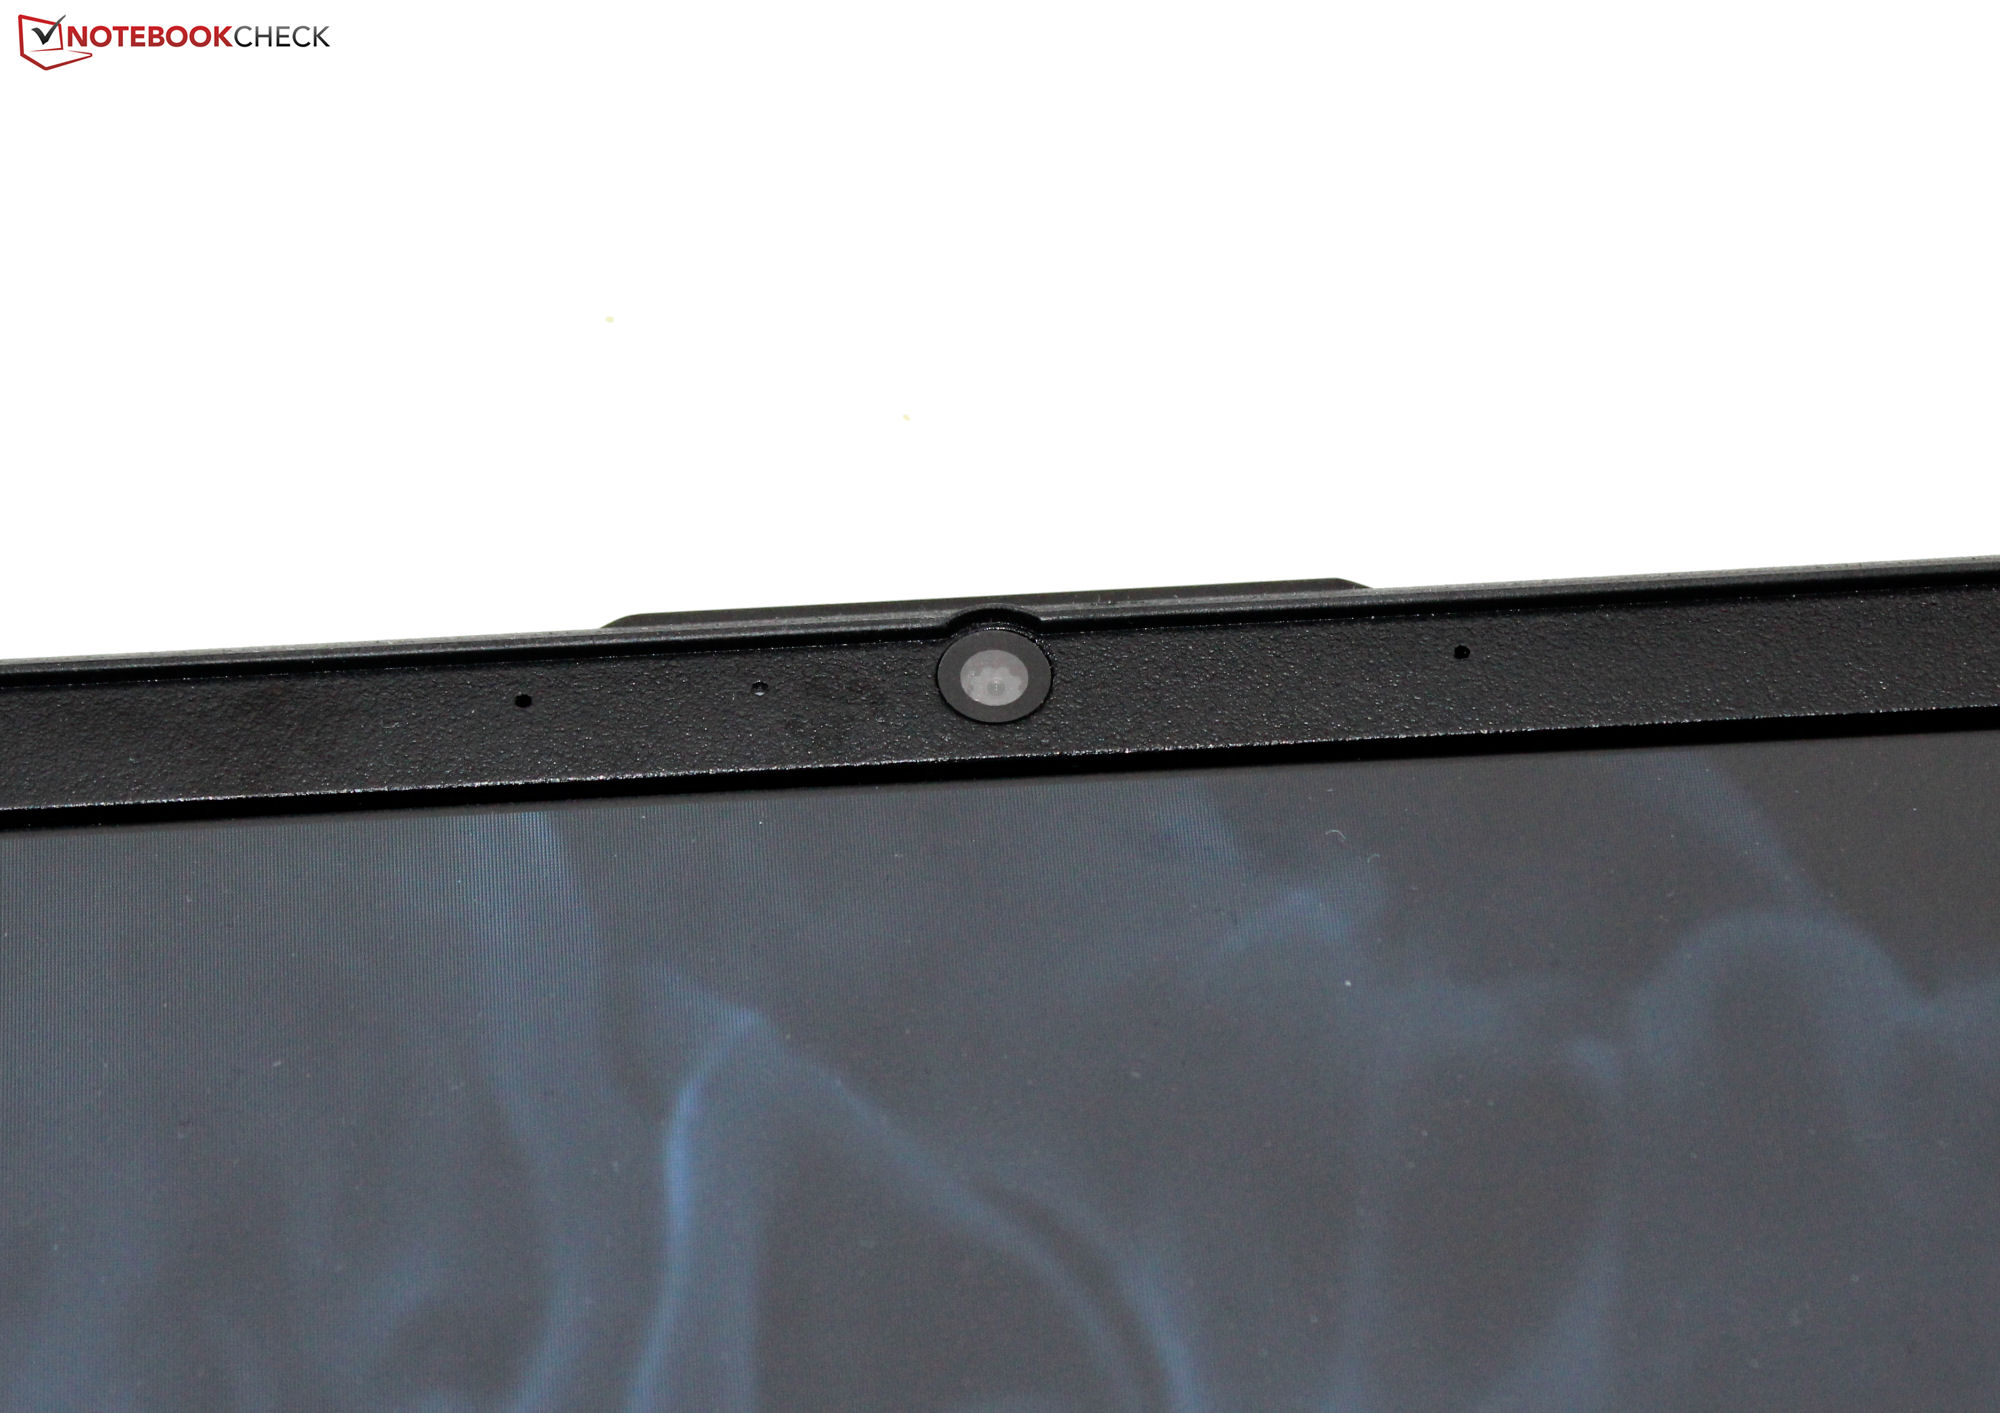
Webbkamera
Webbkameran på 0,9 MP har en maximal upplösning på 1 280 x 720 pixlar och har ingen mekanisk slutare. Den kvalitet som den kan leverera är standard, men resultaten visar åtminstone bara en relativt låg färgavvikelse.


Tillbehör
Den bärbara datorn innehåller inga ytterligare tillbehör förutom den vanliga dokumentationen, t.ex. snabbstartsinstruktioner och garantiinformation.
Underhåll
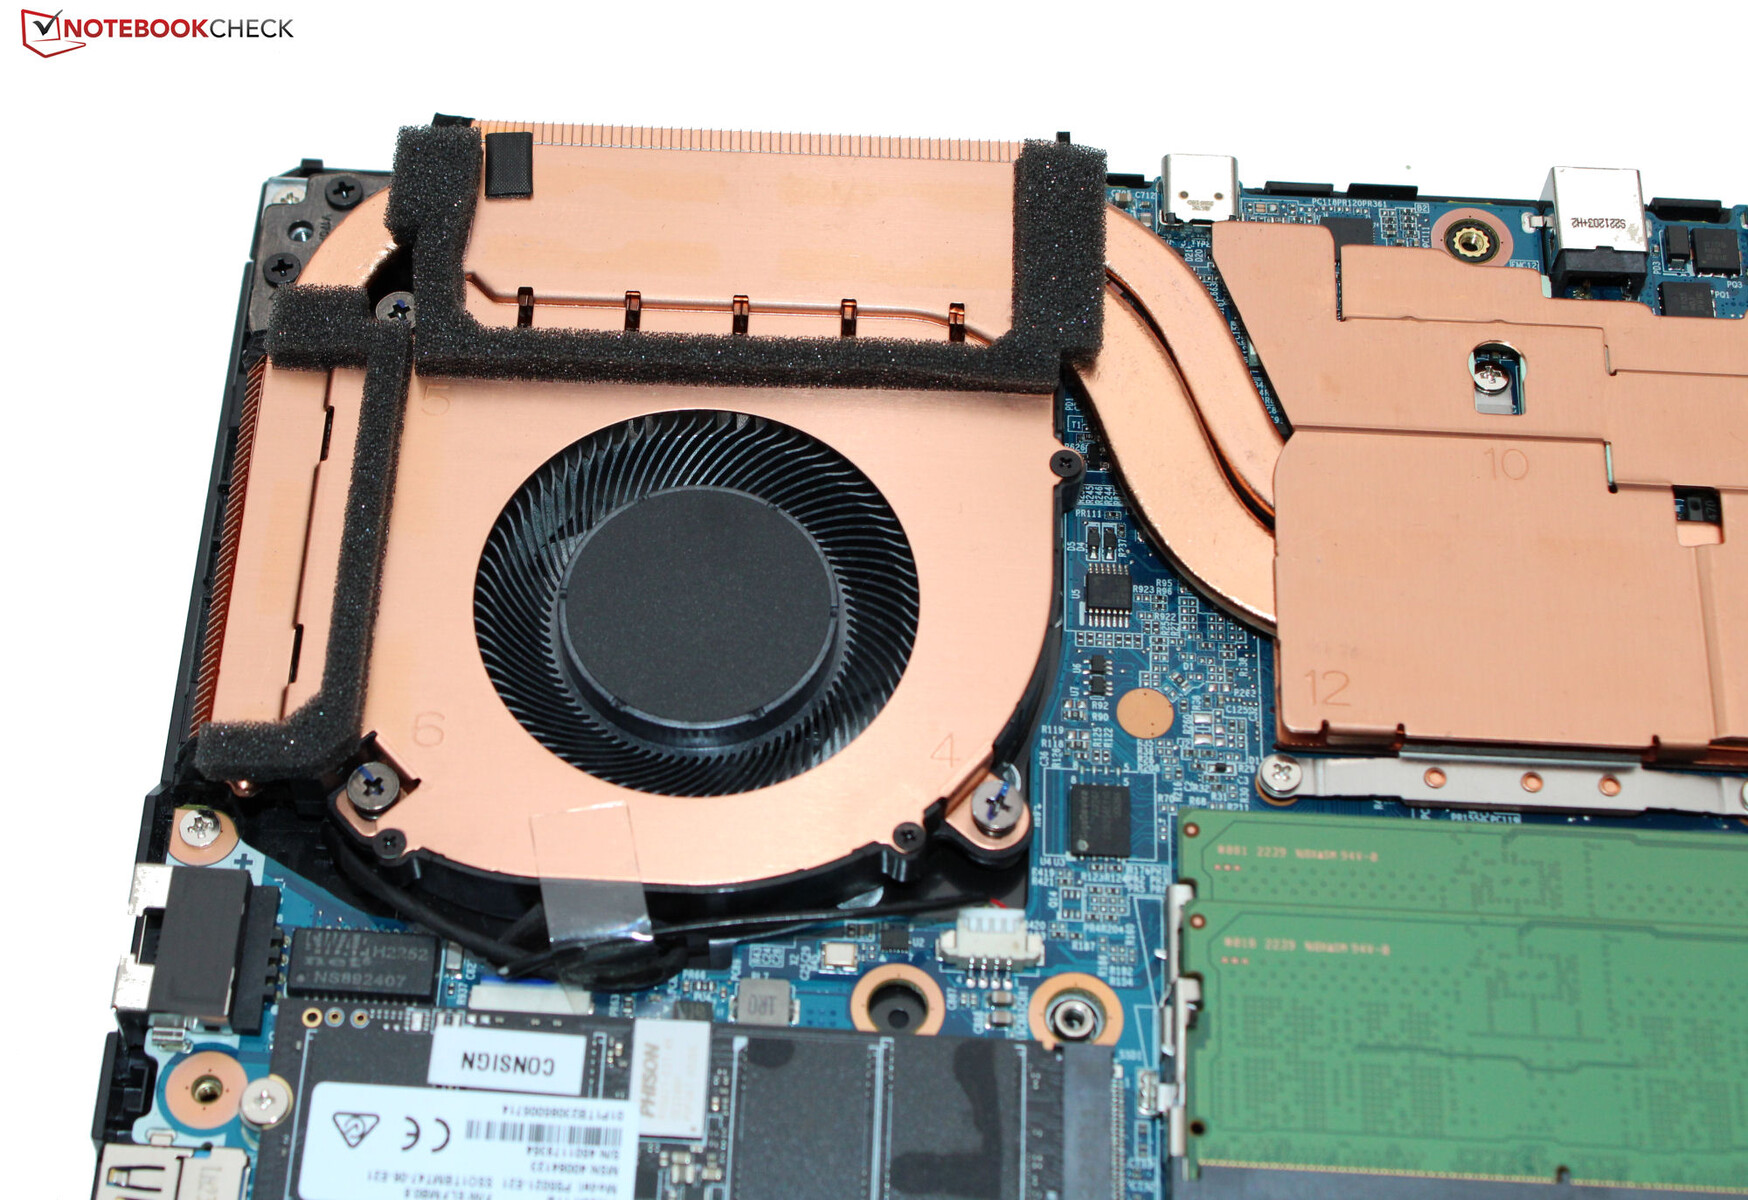
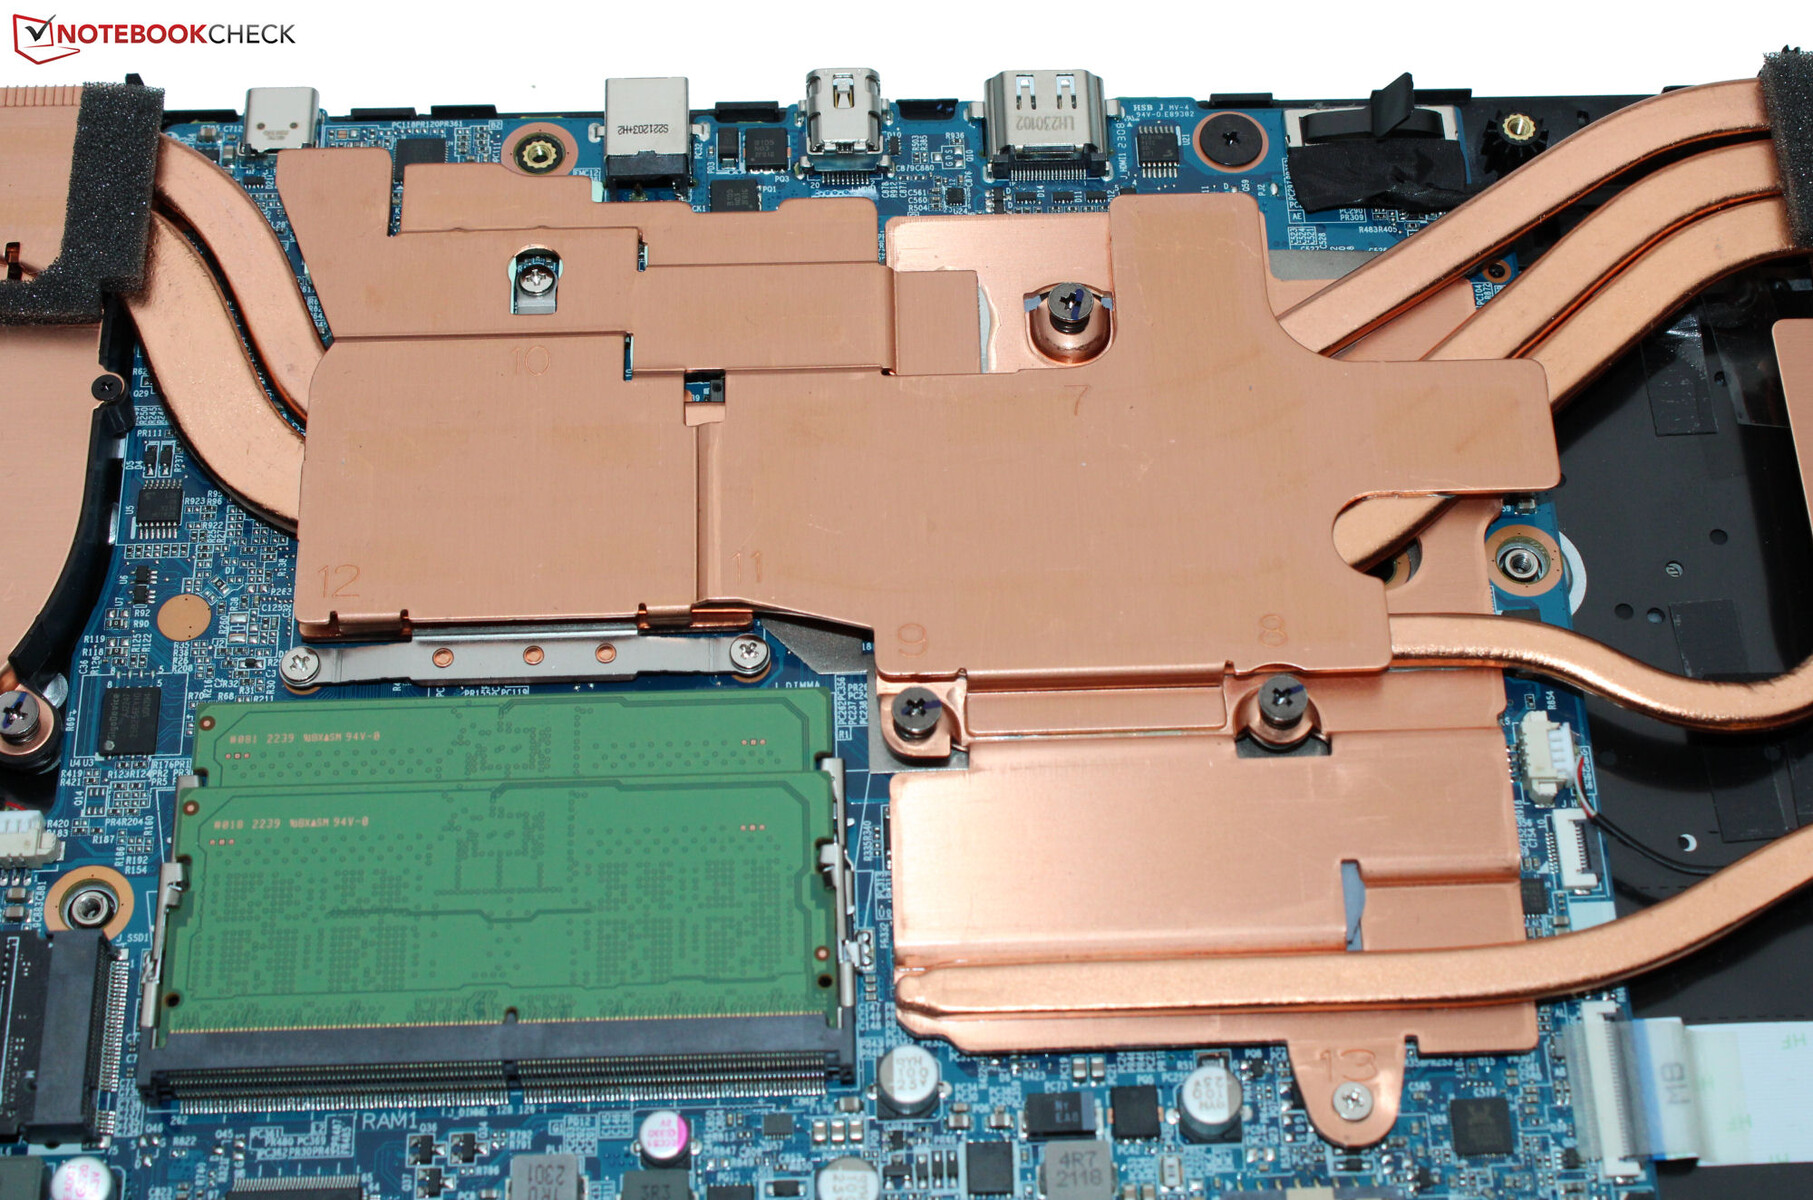
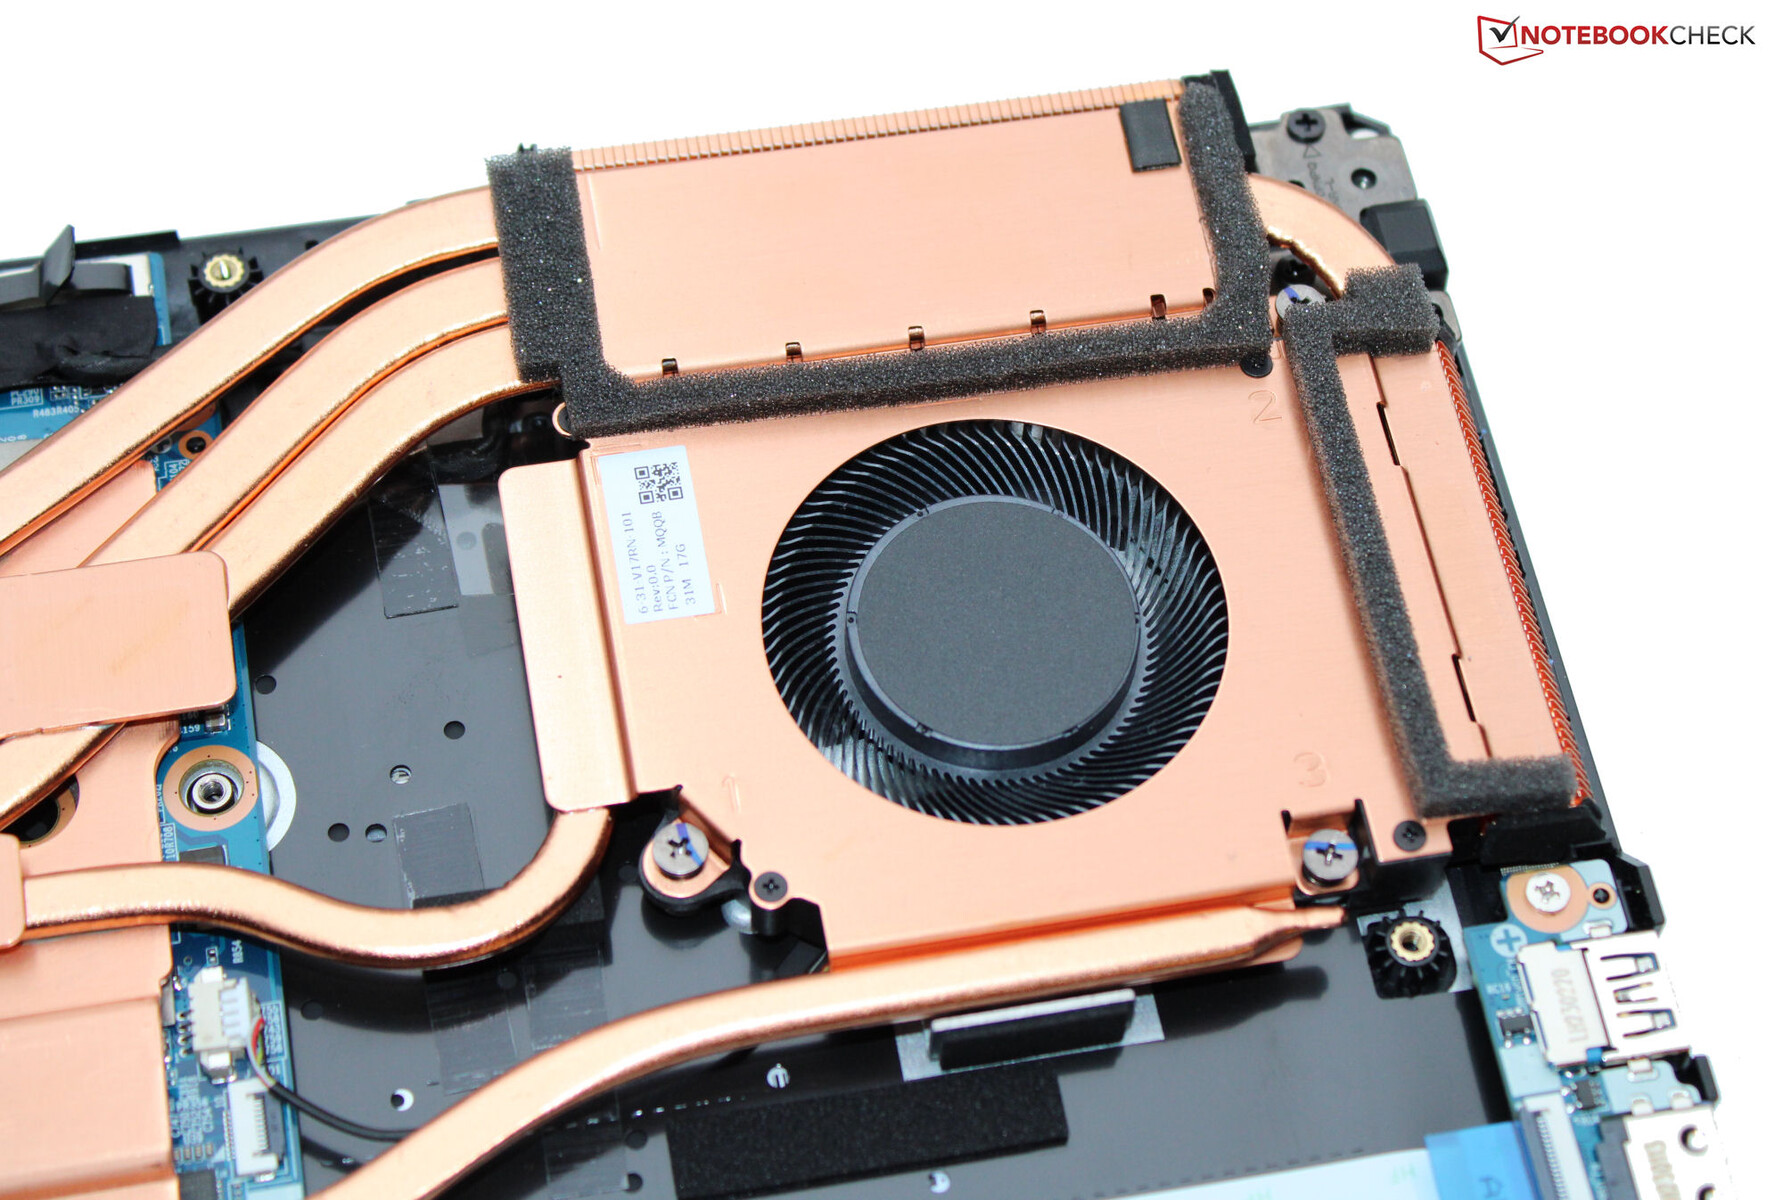
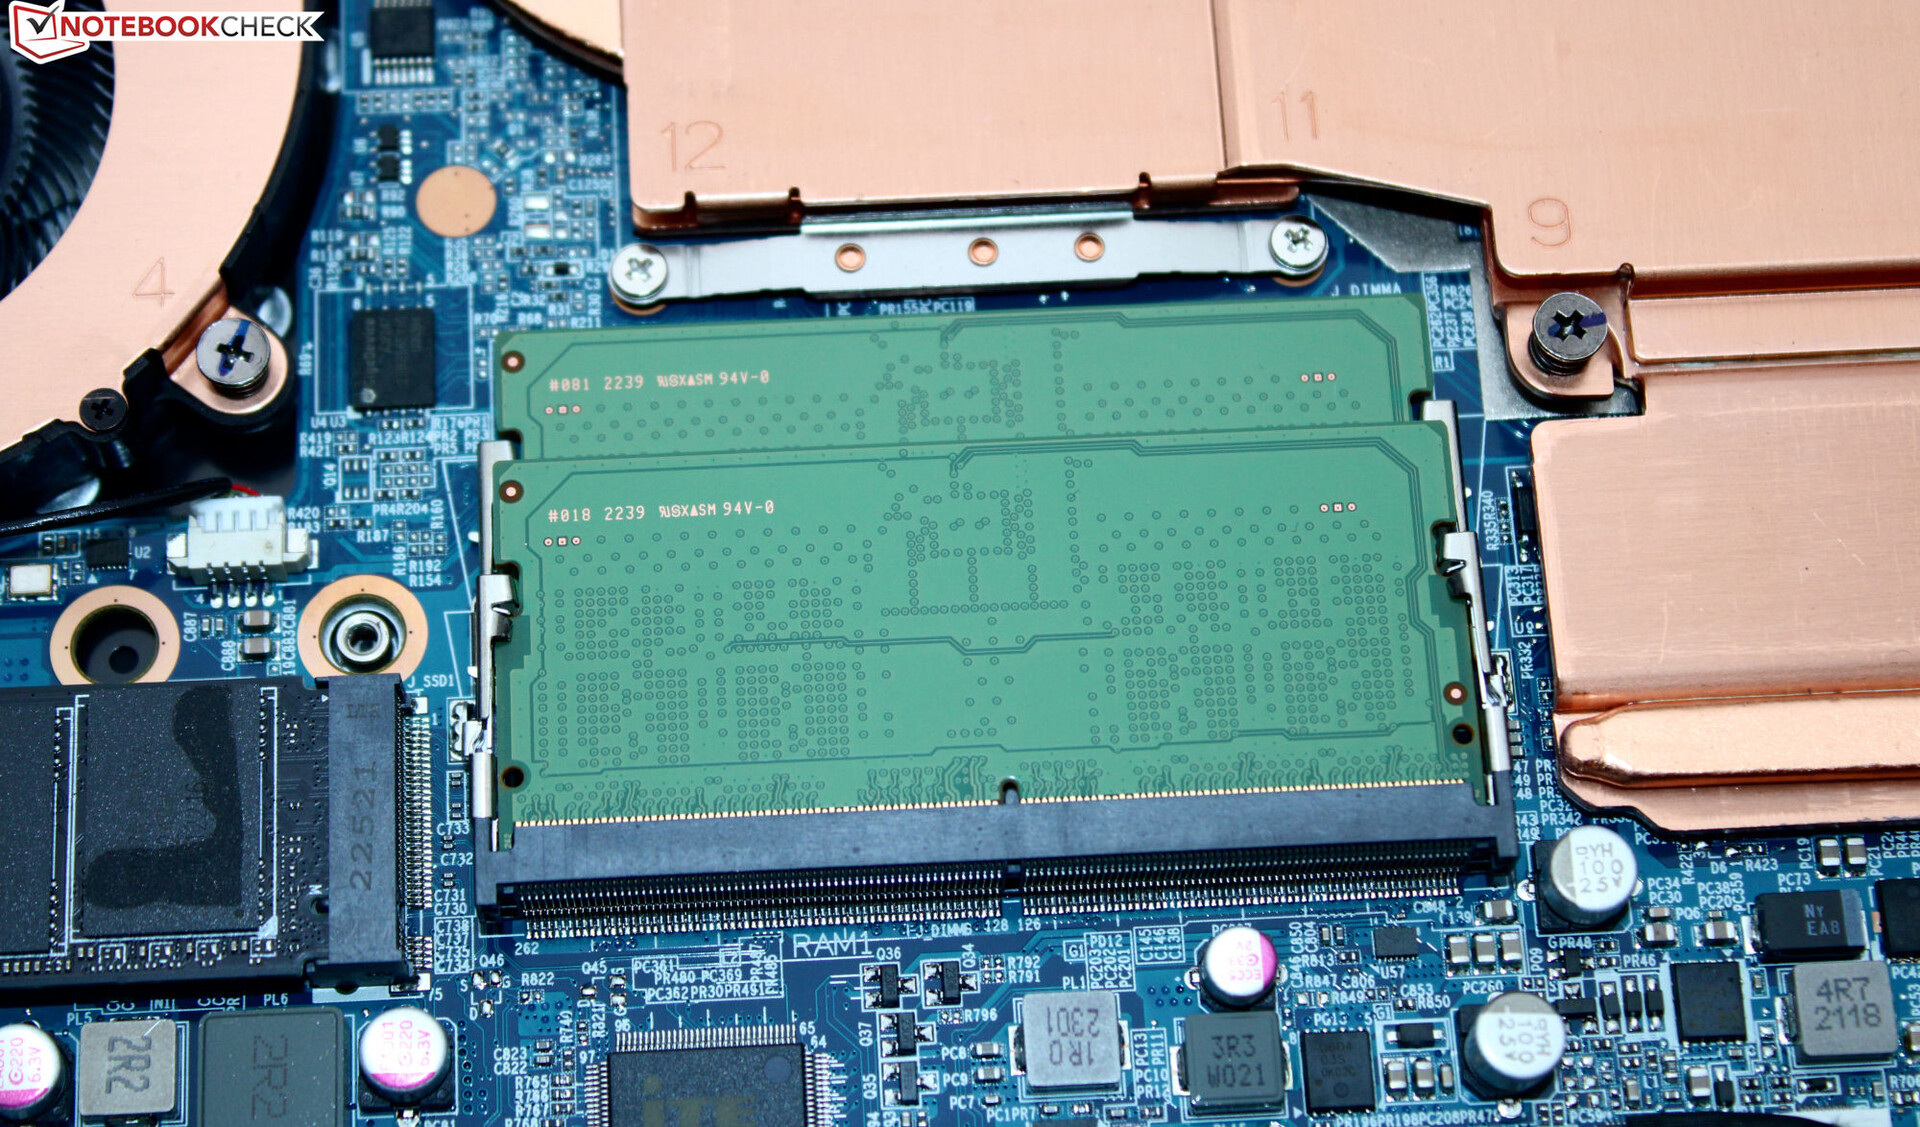
Efter att ha tagit bort flera skruvar på botten av höljet kan du ta bort bottenplattan med hjälp av ett verktyg som en platt spatel. Du får då tillgång till arbetsminnesbankerna (som båda är upptagna), PCIe 4 M.2-2280 SSD-enheten, WLAN-modulen, fläktarna och batteriet.
Garanti
Medion erbjuder en tvåårig garanti för Erazer. Garantiförlängningar finns tillgängliga, men du måste köpa dem tillsammans med den bärbara datorn från Medions webbshop. Det är inte möjligt att köpa dem senare.
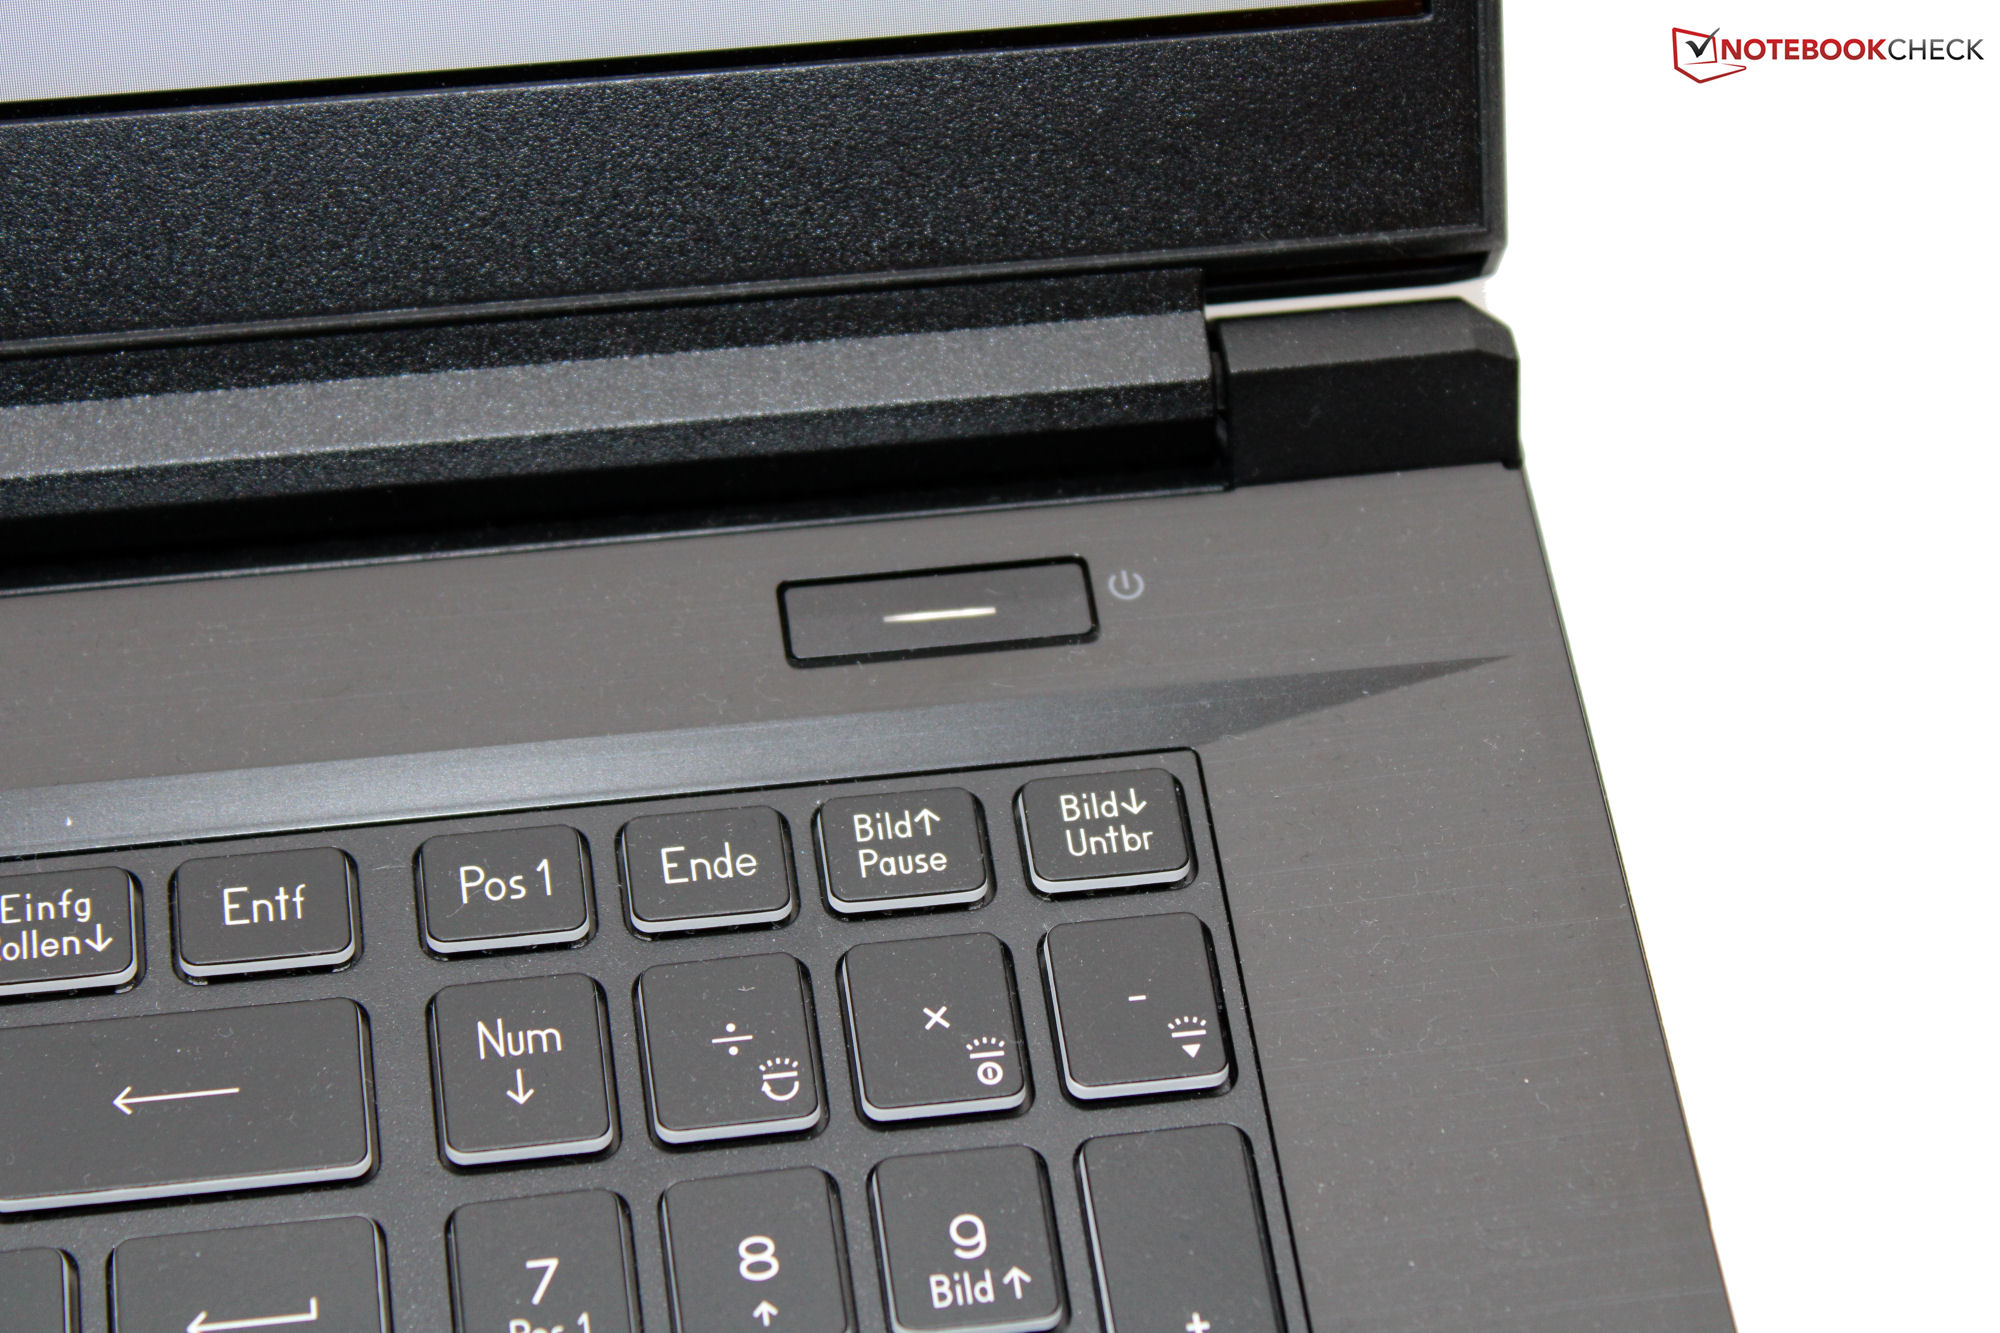
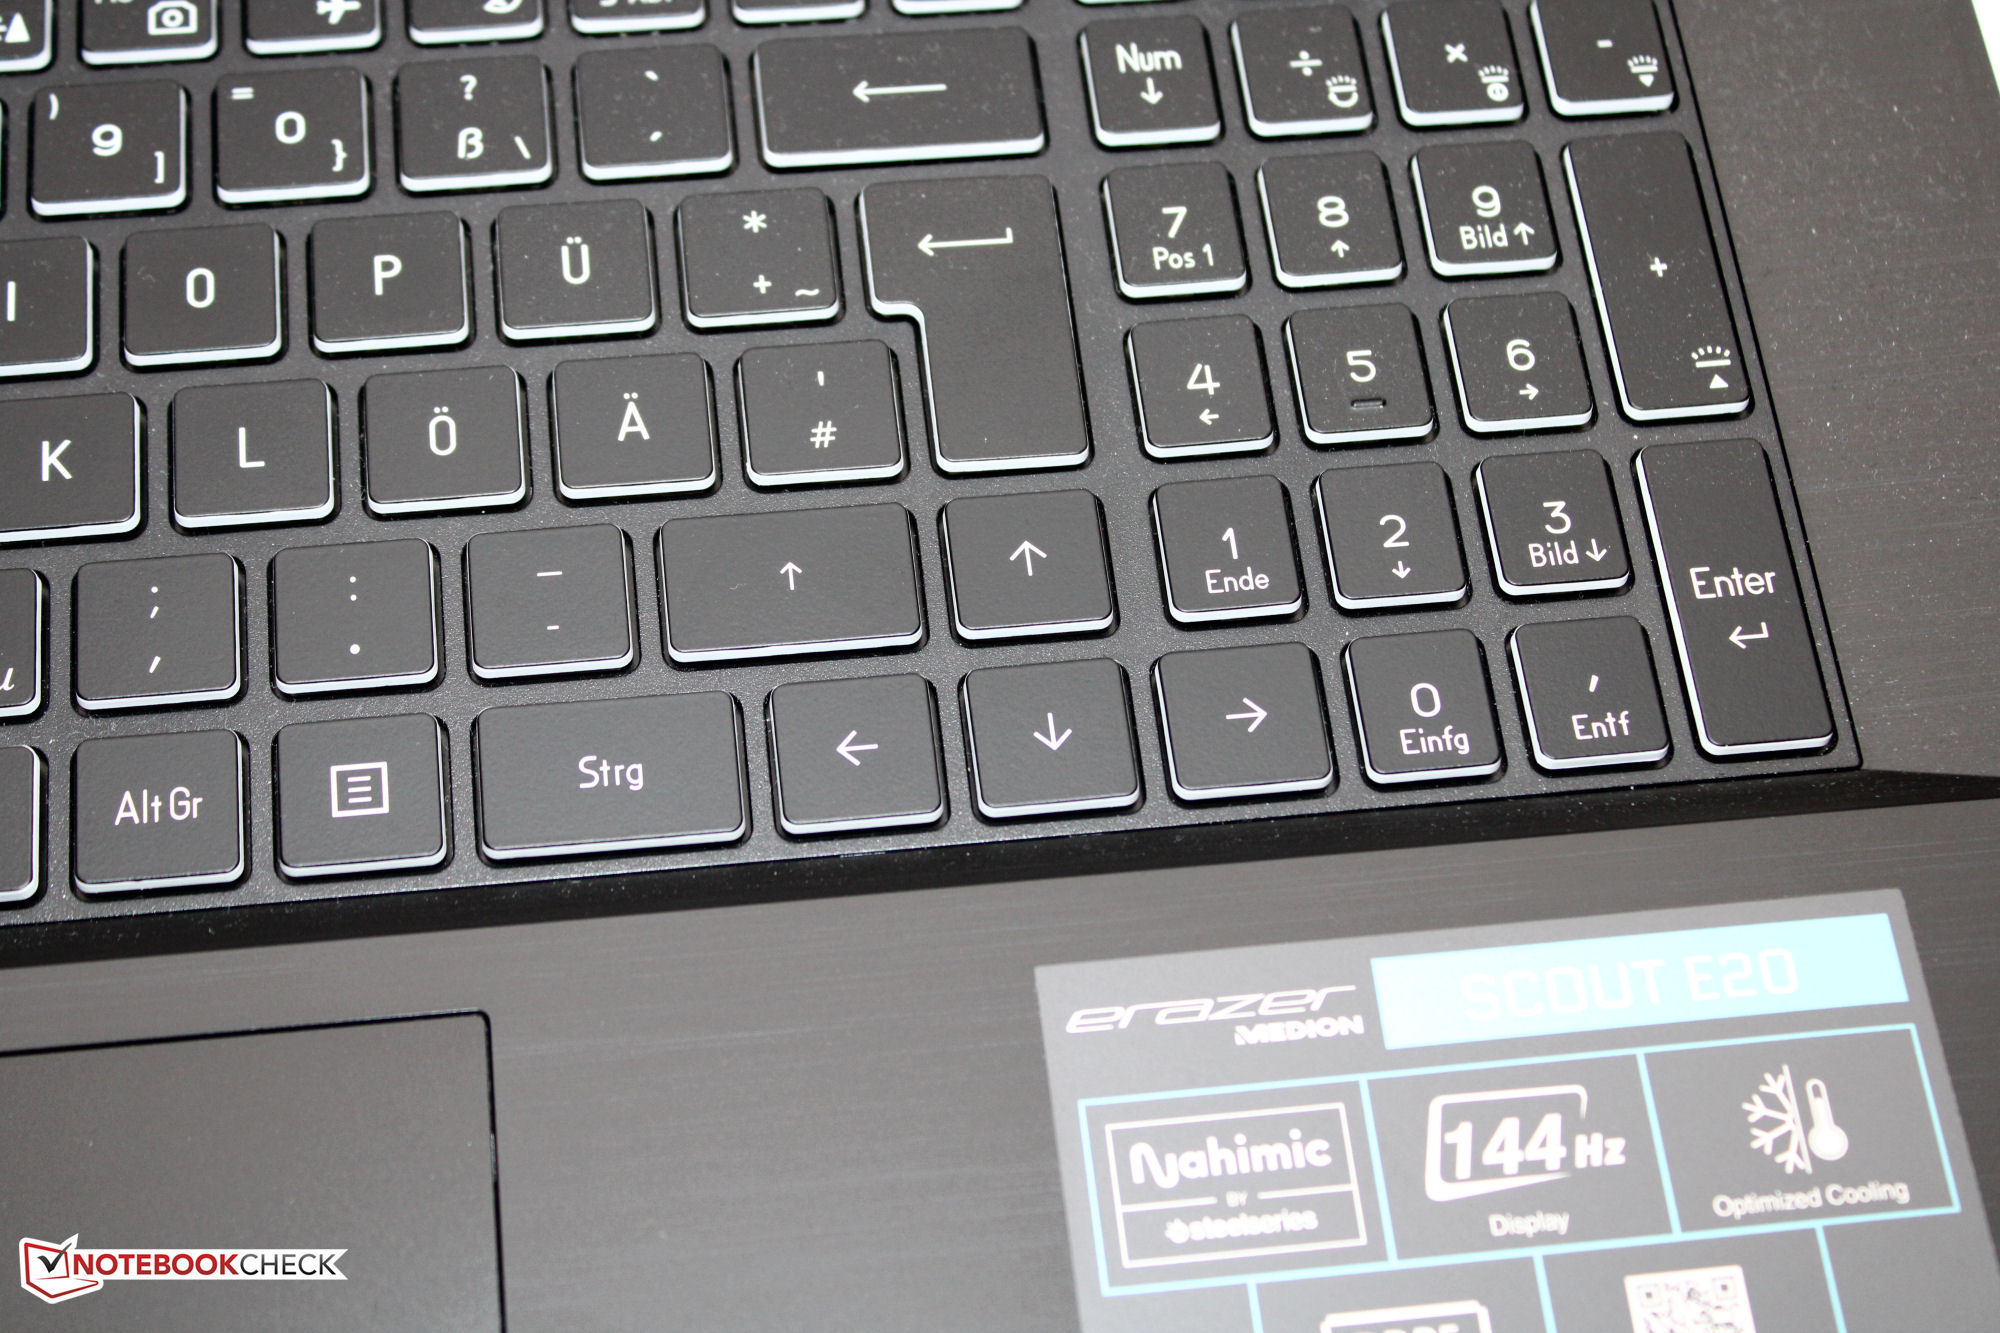
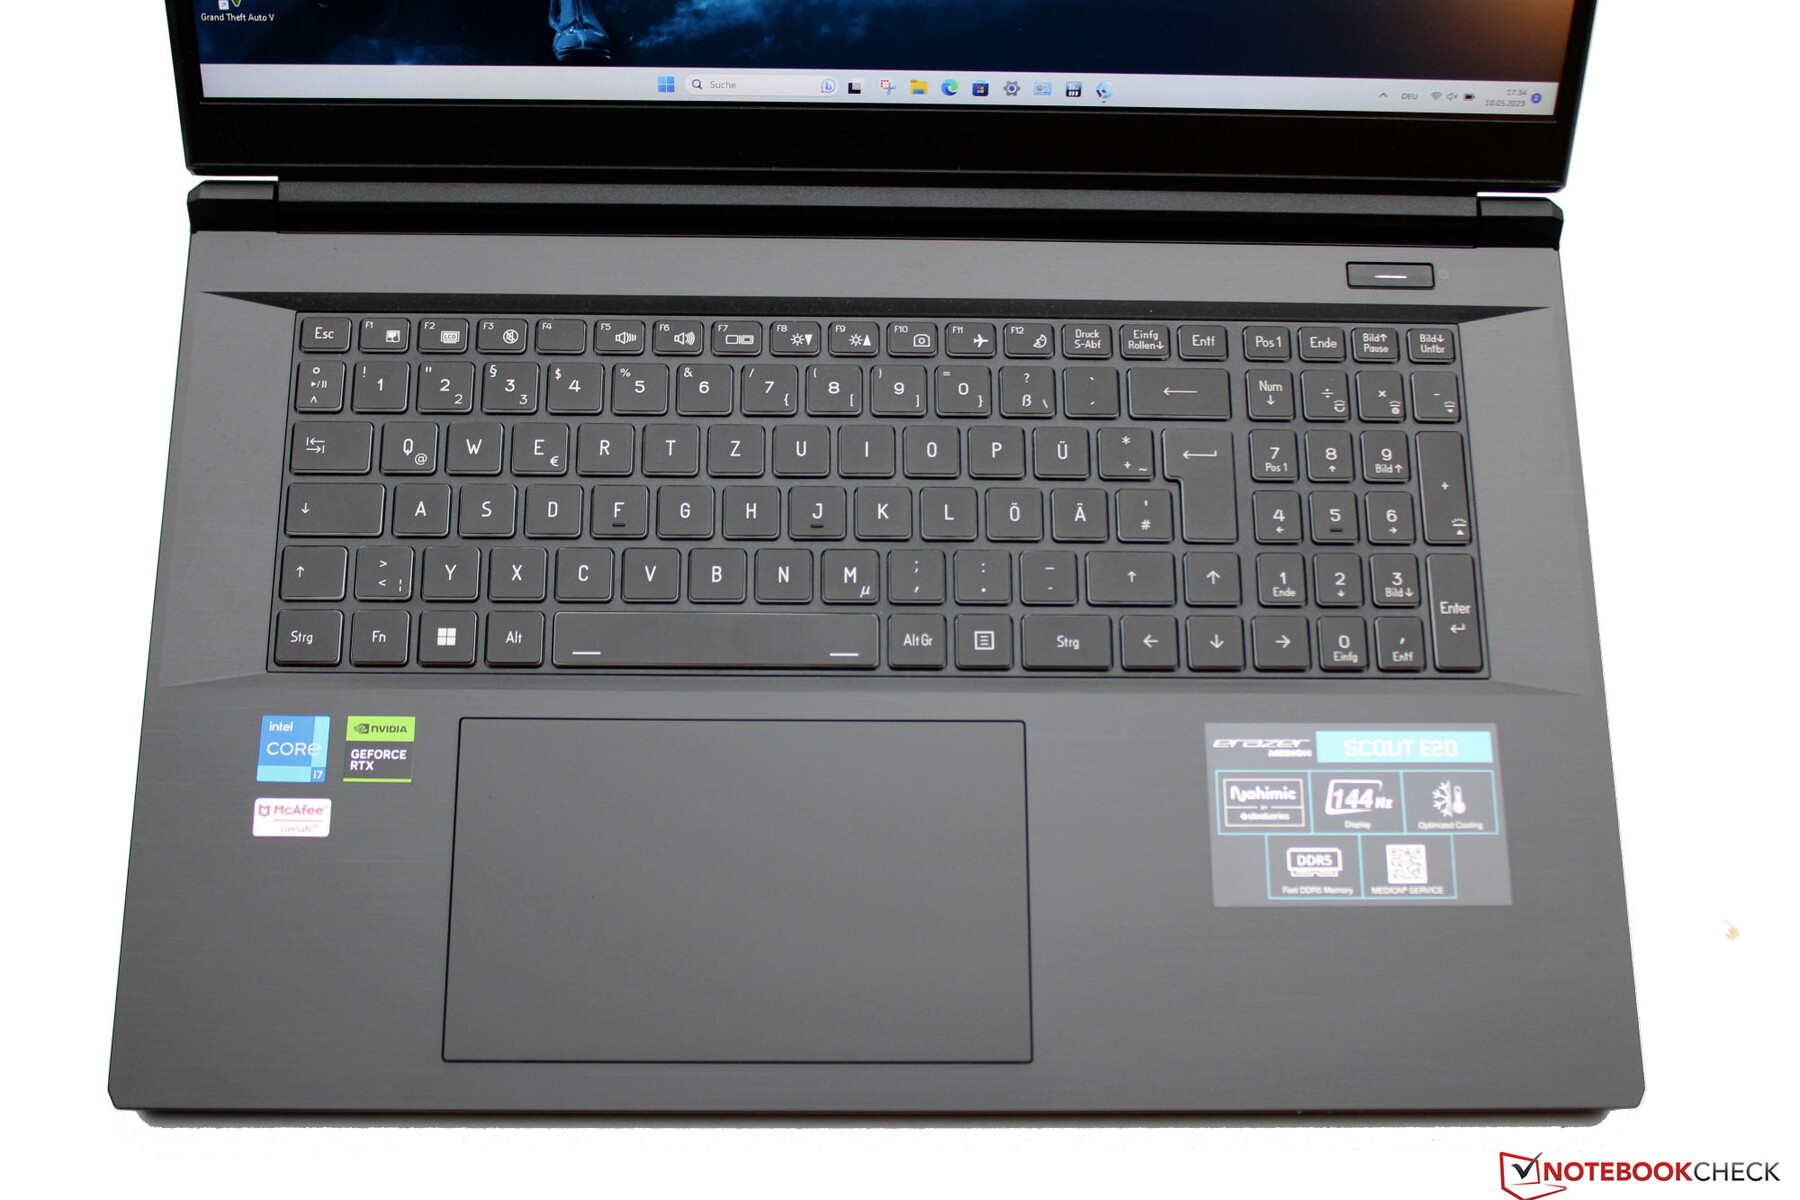
Inmatningsenheter - E20-tangentbord med RGB-belysning
Tangentbord
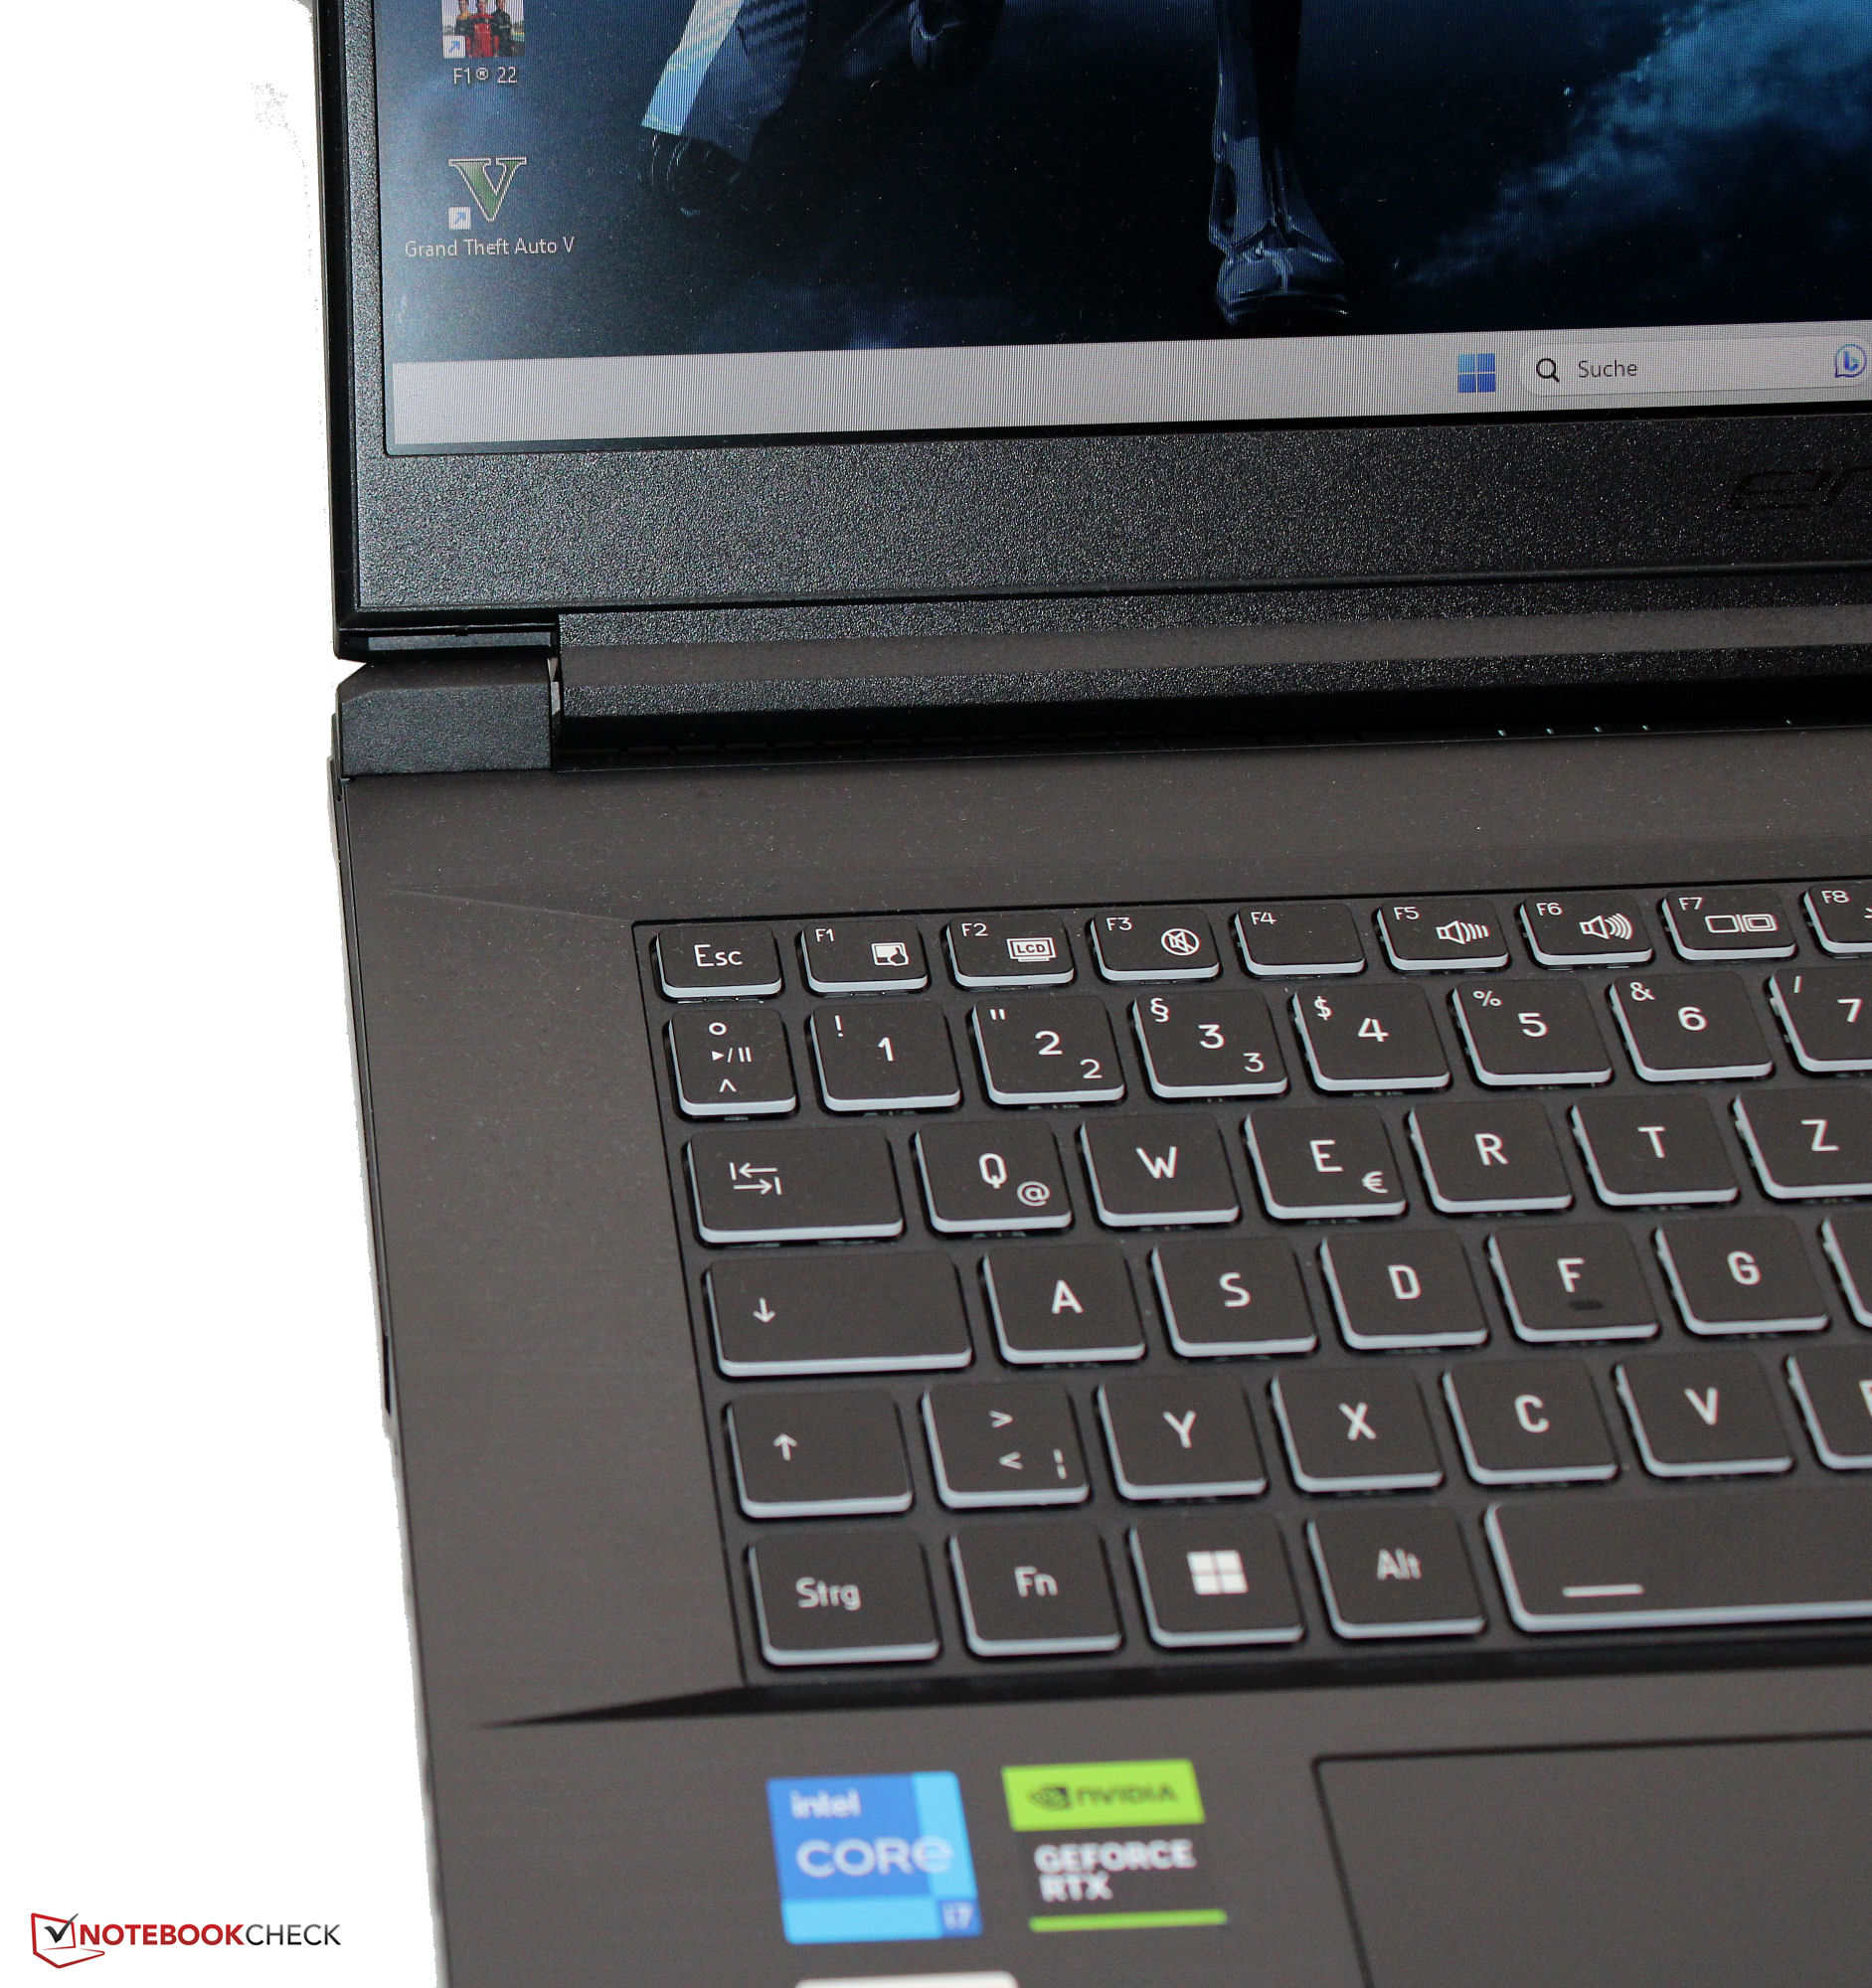
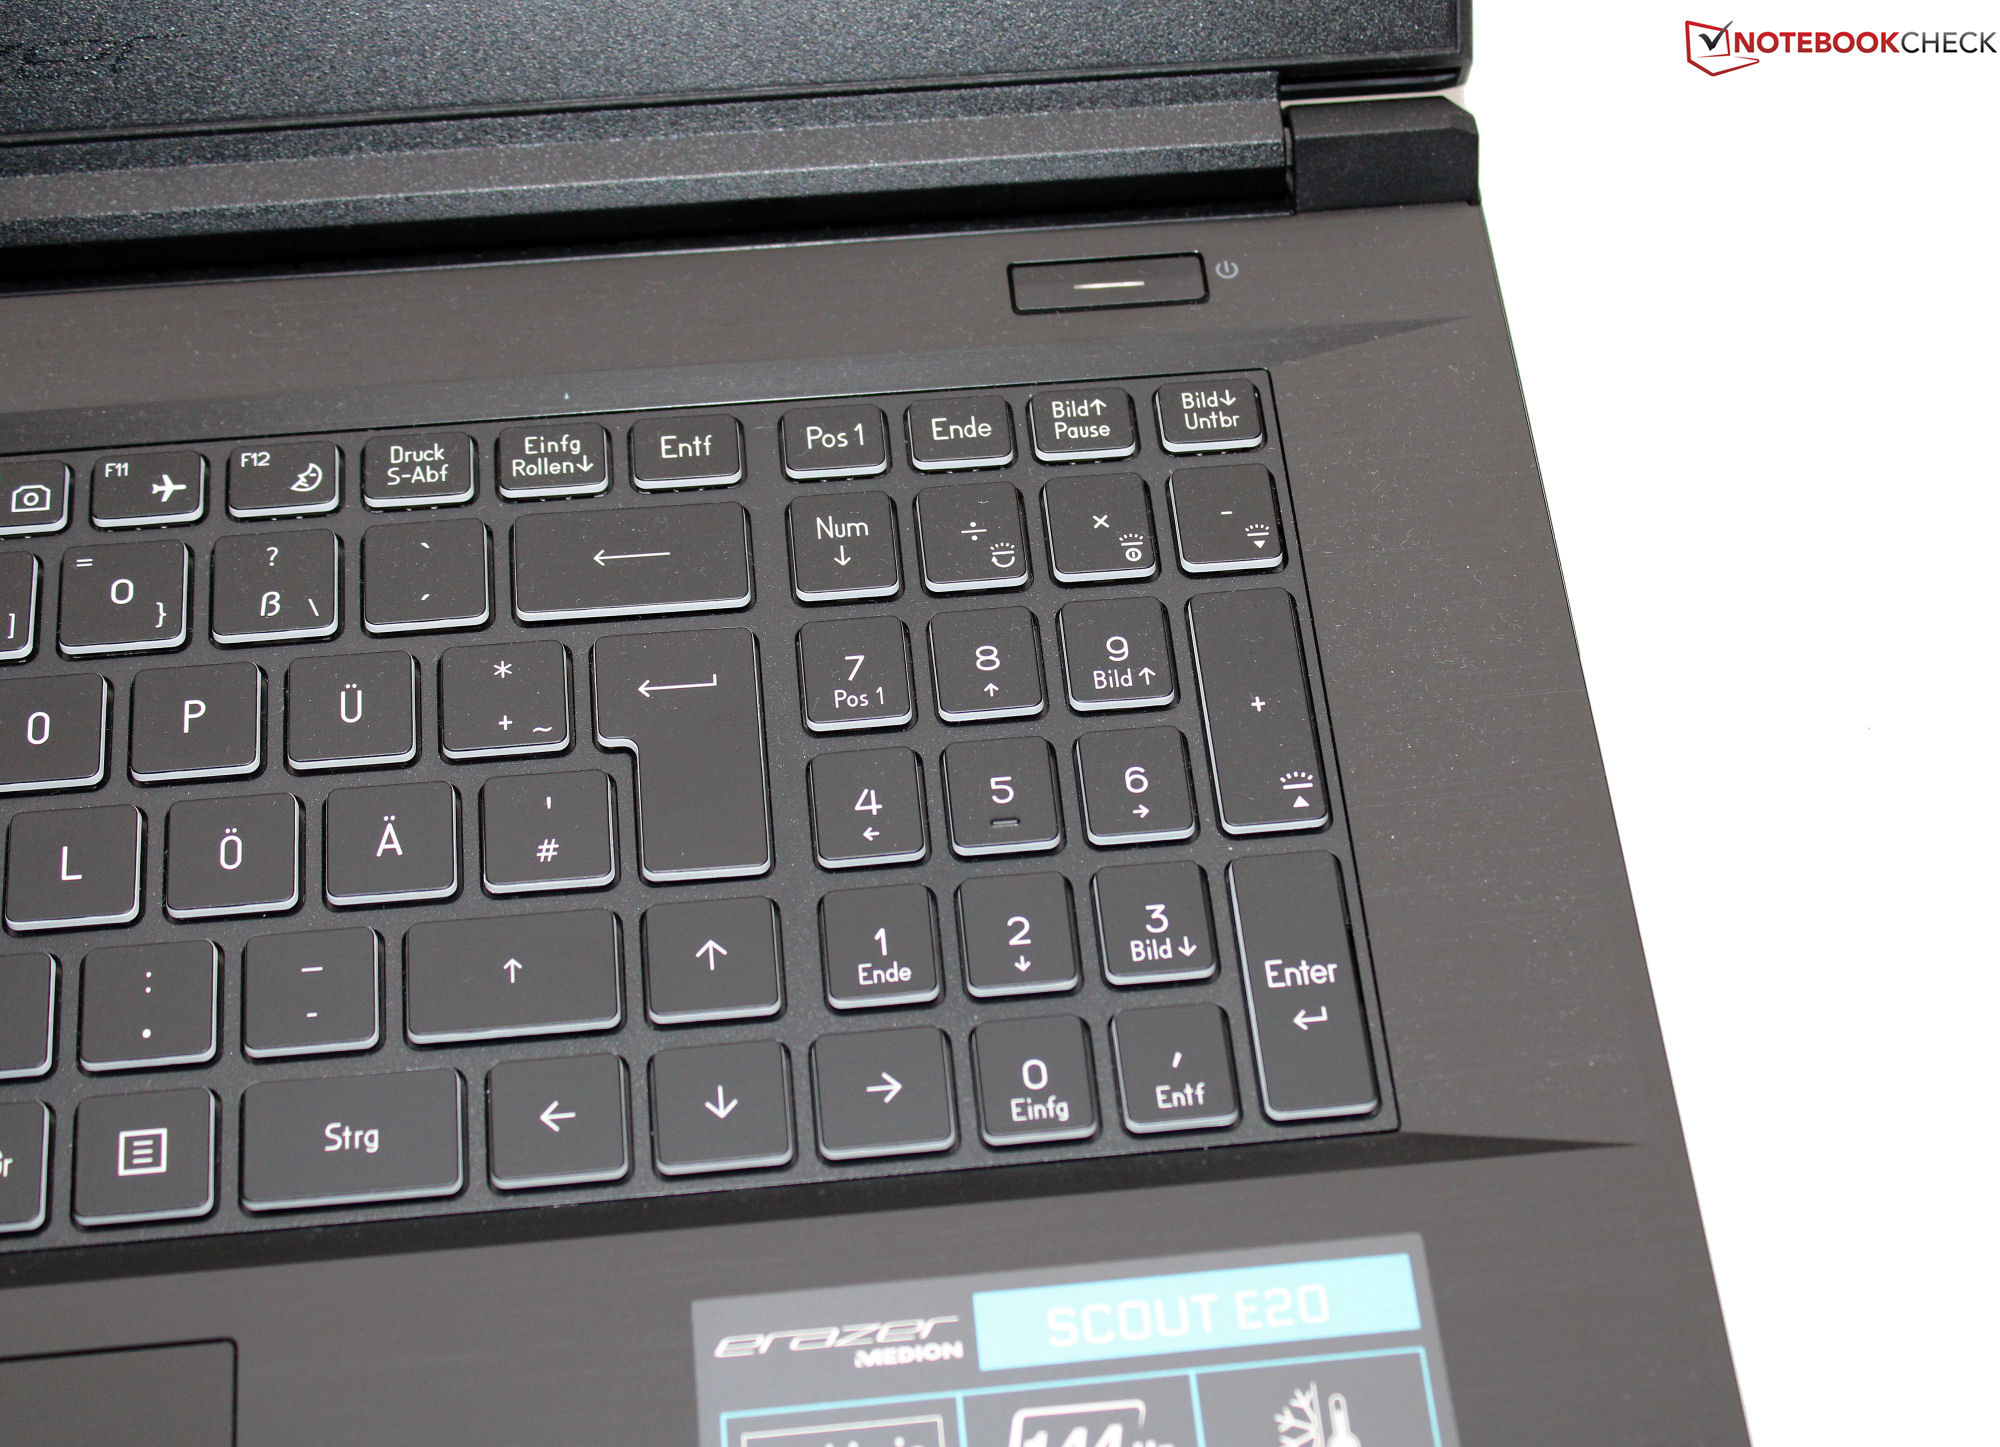
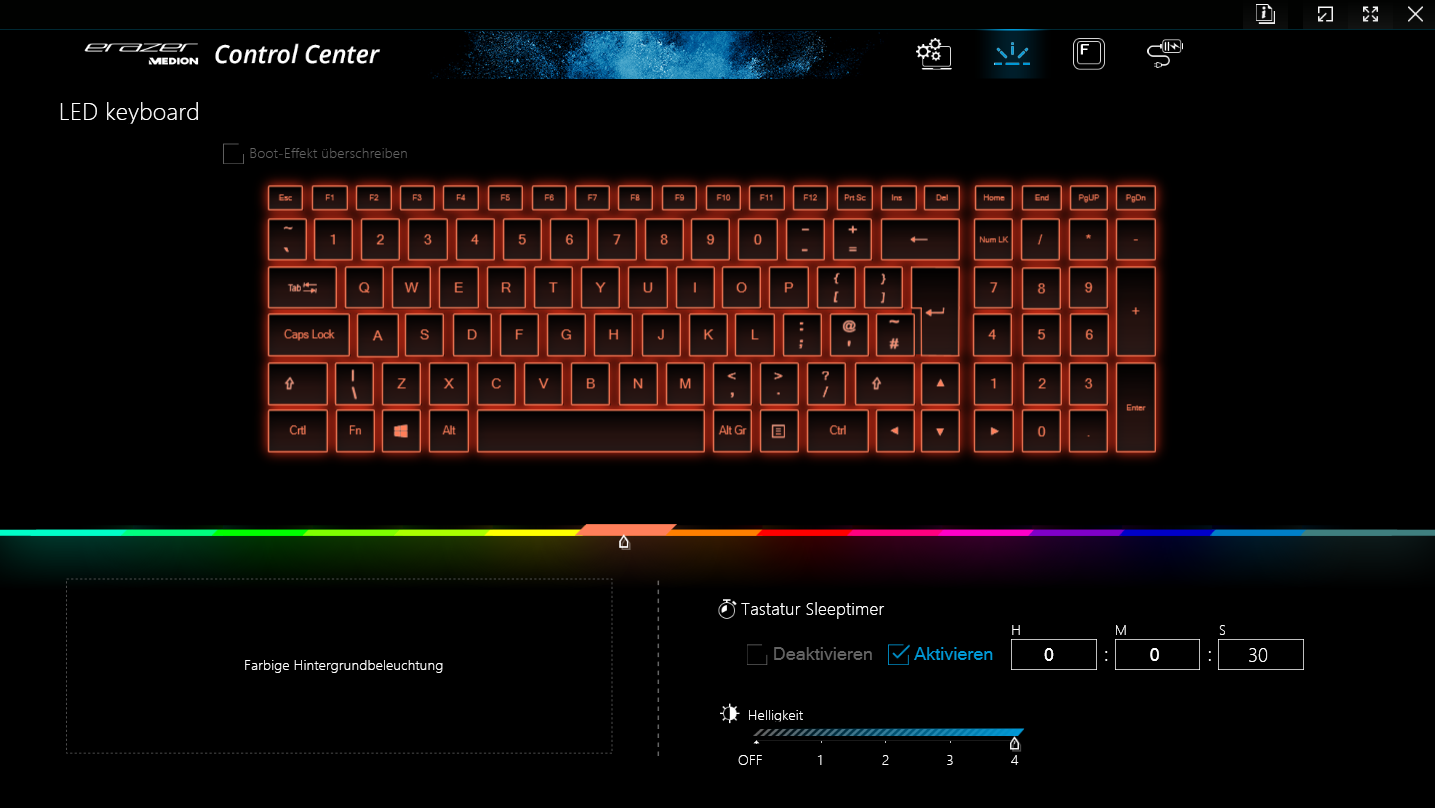
De släta, platta tangenterna på chiclet-tangentbordet (som har ett nummerblock) har en kort slaglängd och en tydlig tryckpunkt. Tangentmotståndet är okej. När du skriver har tangentbordet högst en minimal eftergift, vilket inte visar sig vara ett hinder. Tangentbordsbelysningen har fyra nivåer av ljusstyrka. Sammantaget har Medion här levererat ett tangentbord som är lämpligt för vardagliga uppgifter.
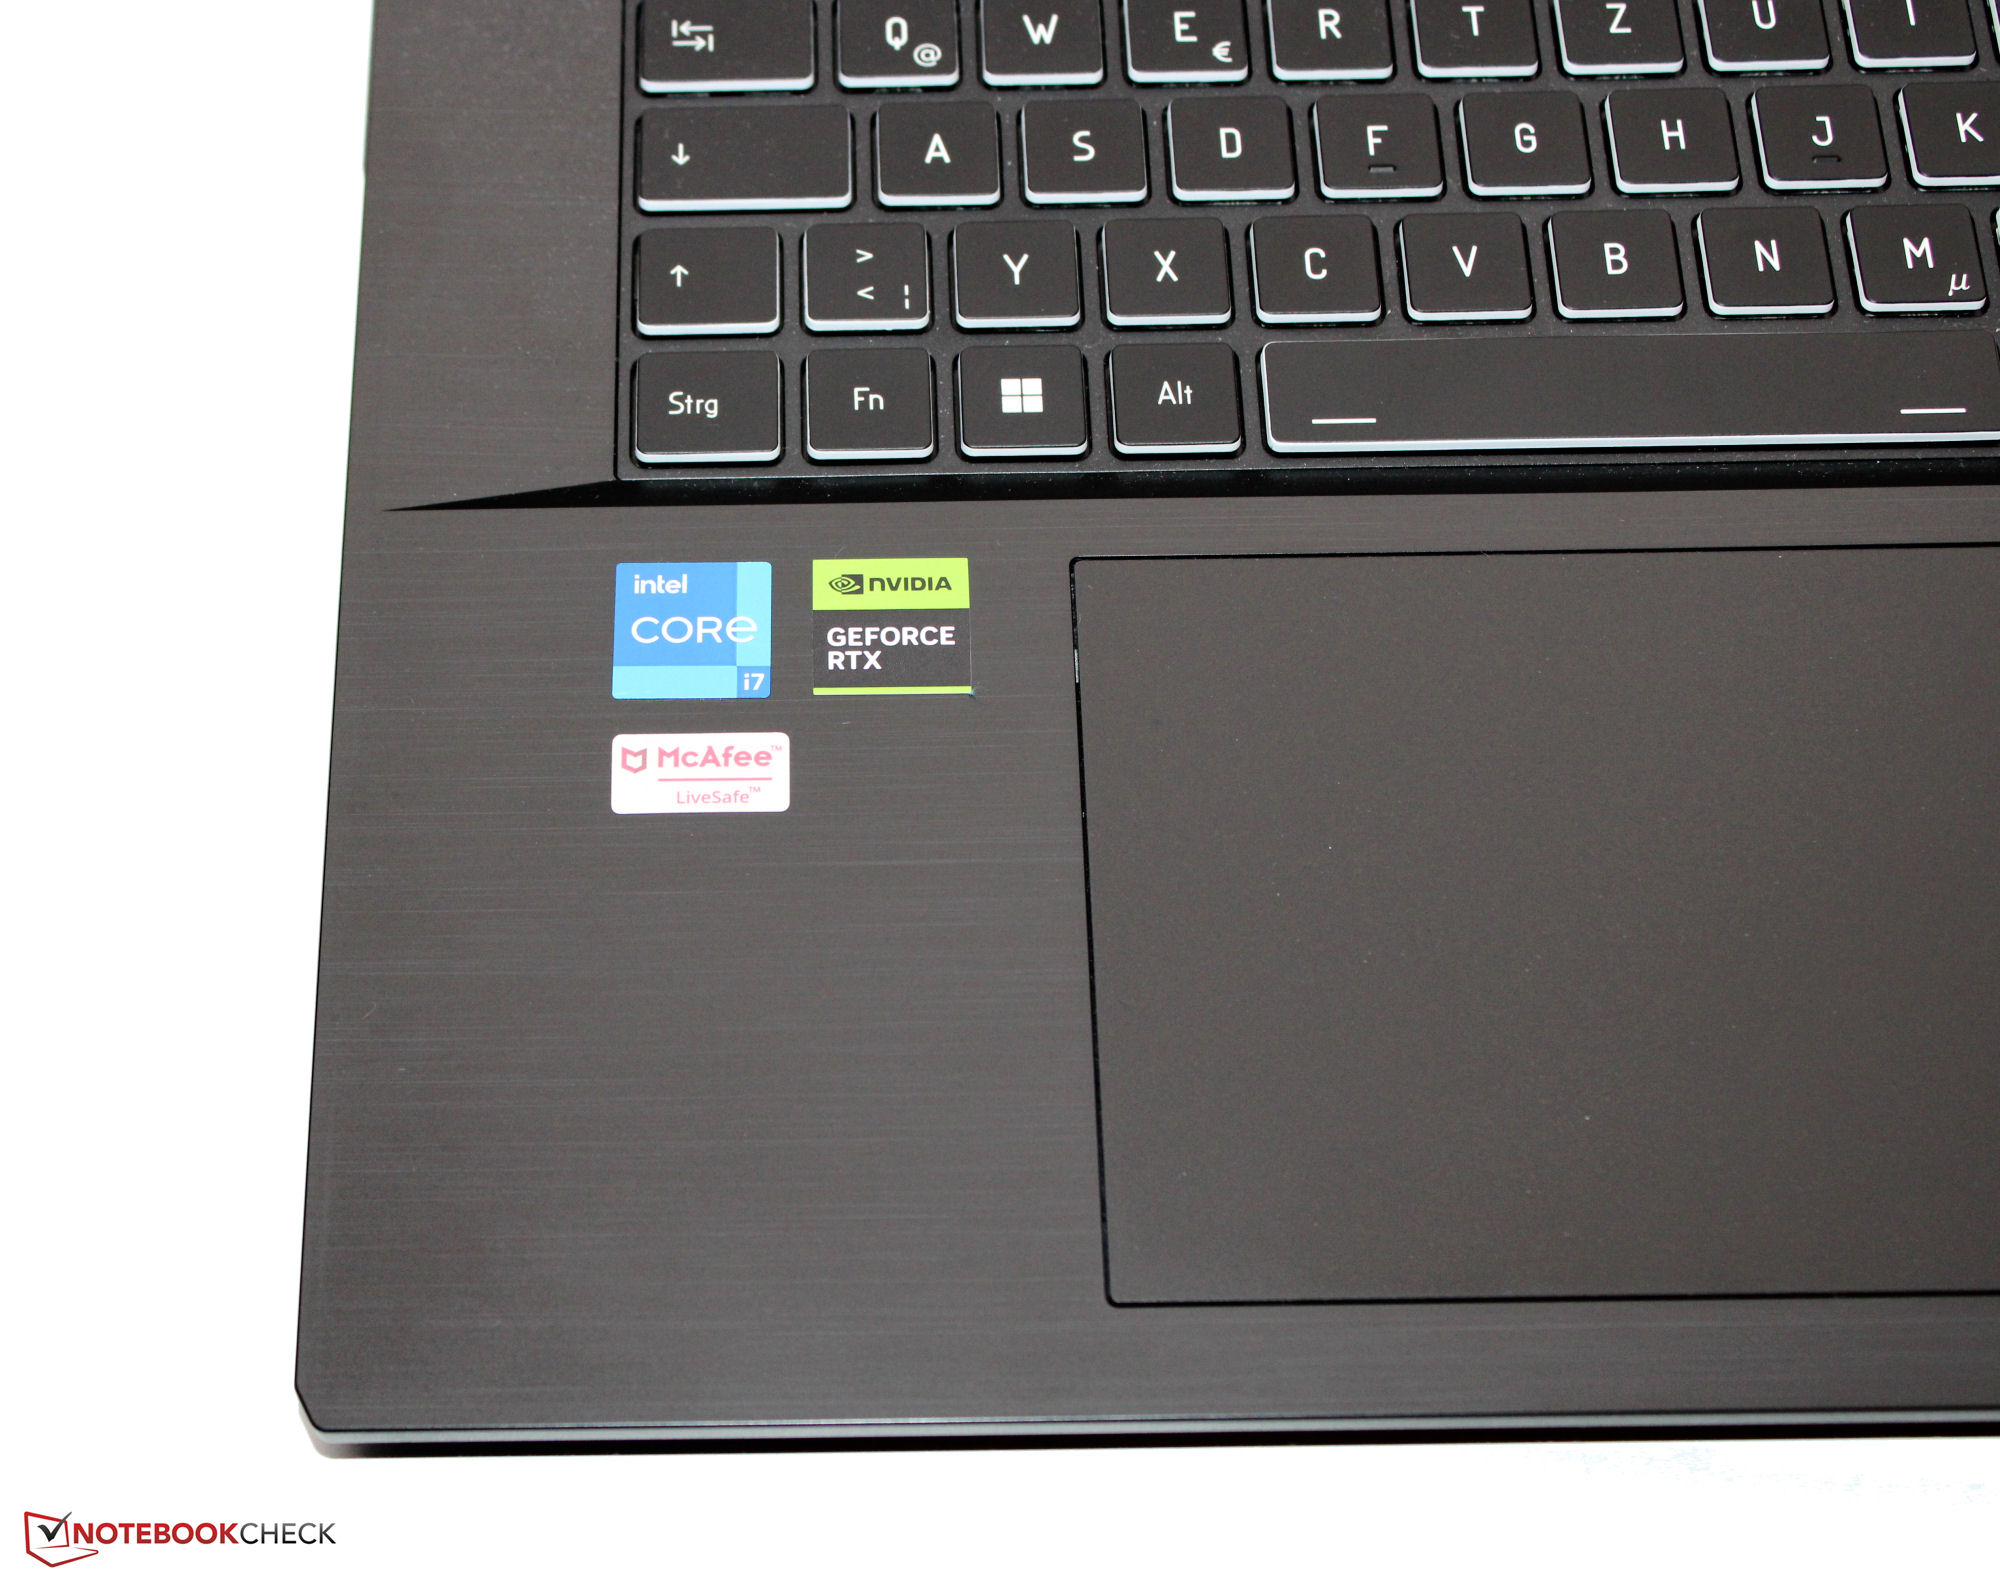
Pekplatta
En ClickPad på 15,1 x 9,2 cm (~6 x 3,6 in), vars släta yta gör det lättare att glida med fingrarna, fungerar som musersättning. Den reagerar också på inmatningar i hörnen och har en kort slaglängd och en tydlig tryckpunkt.
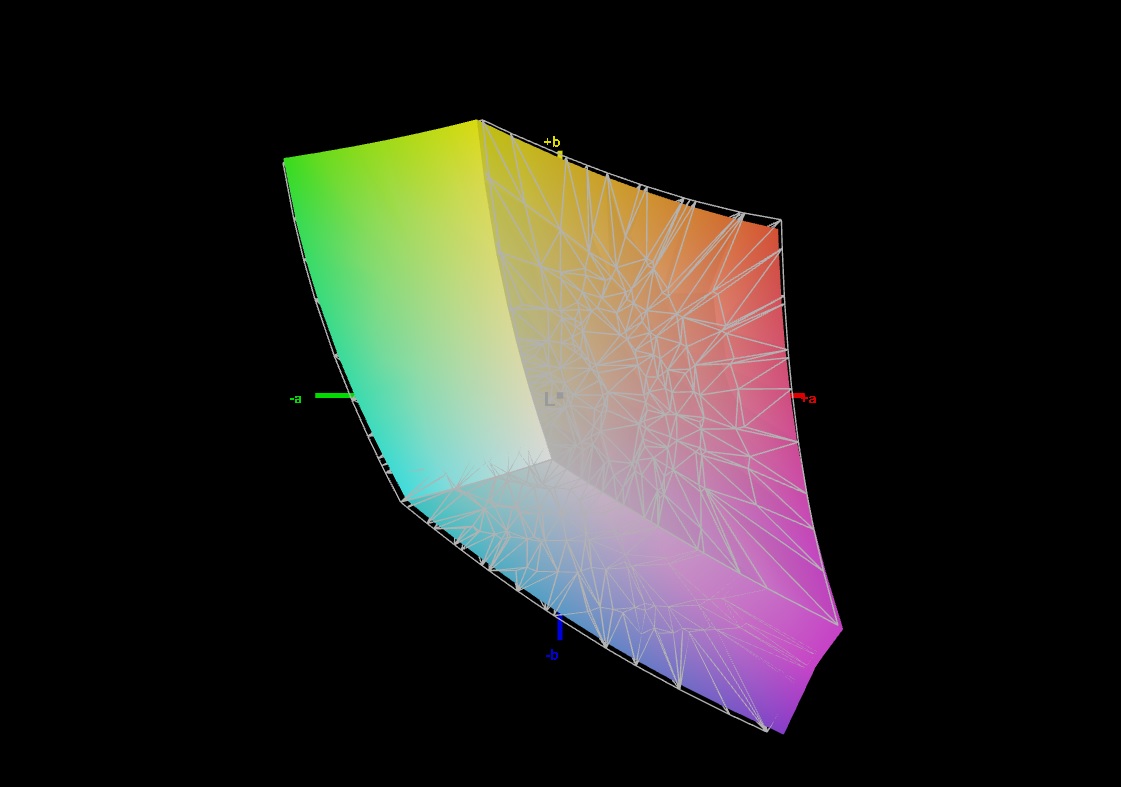
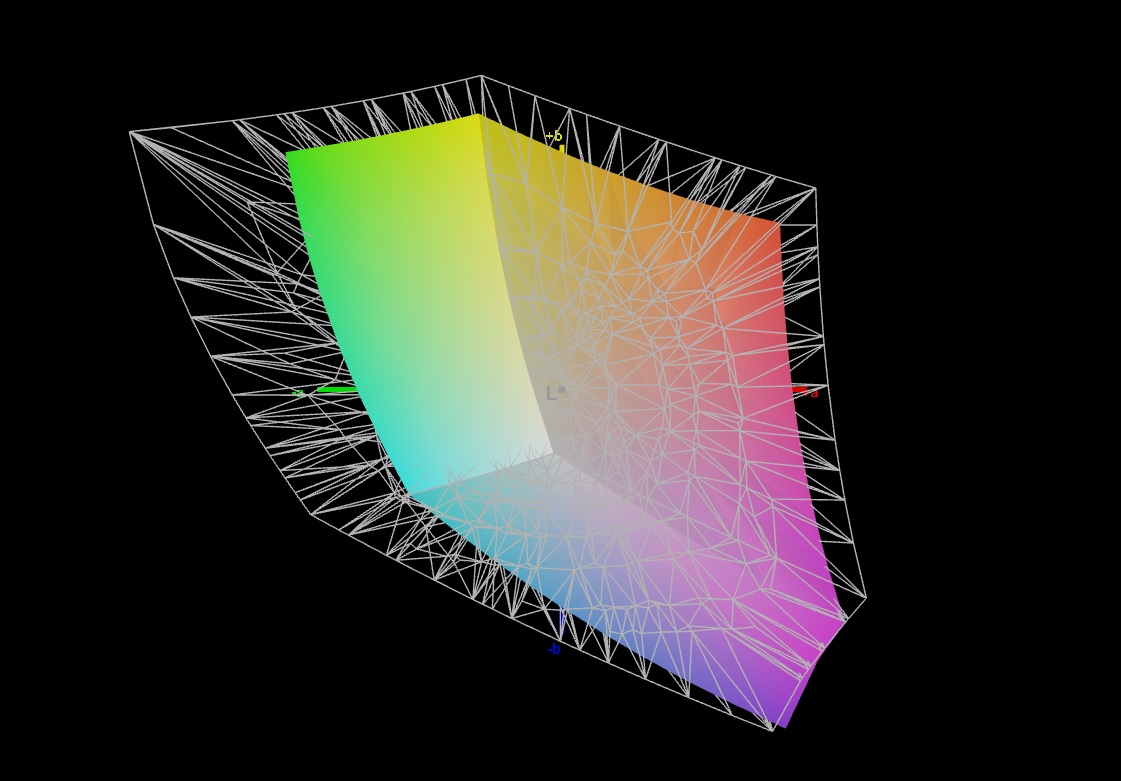
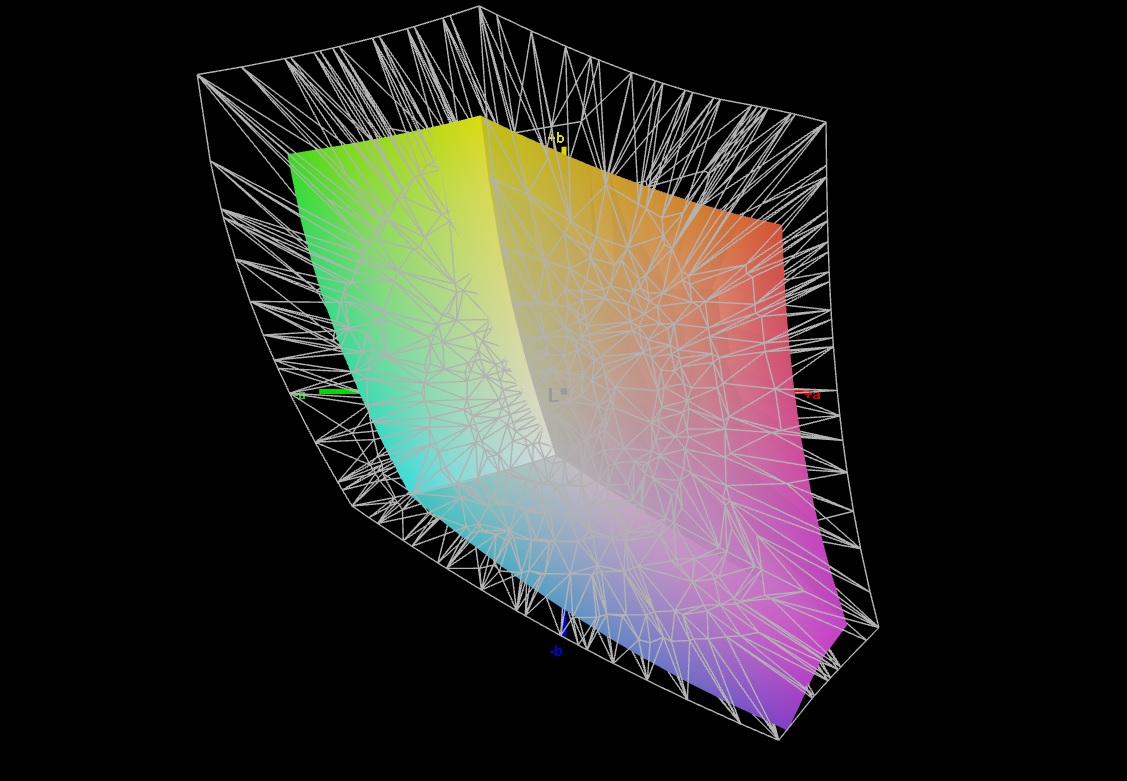
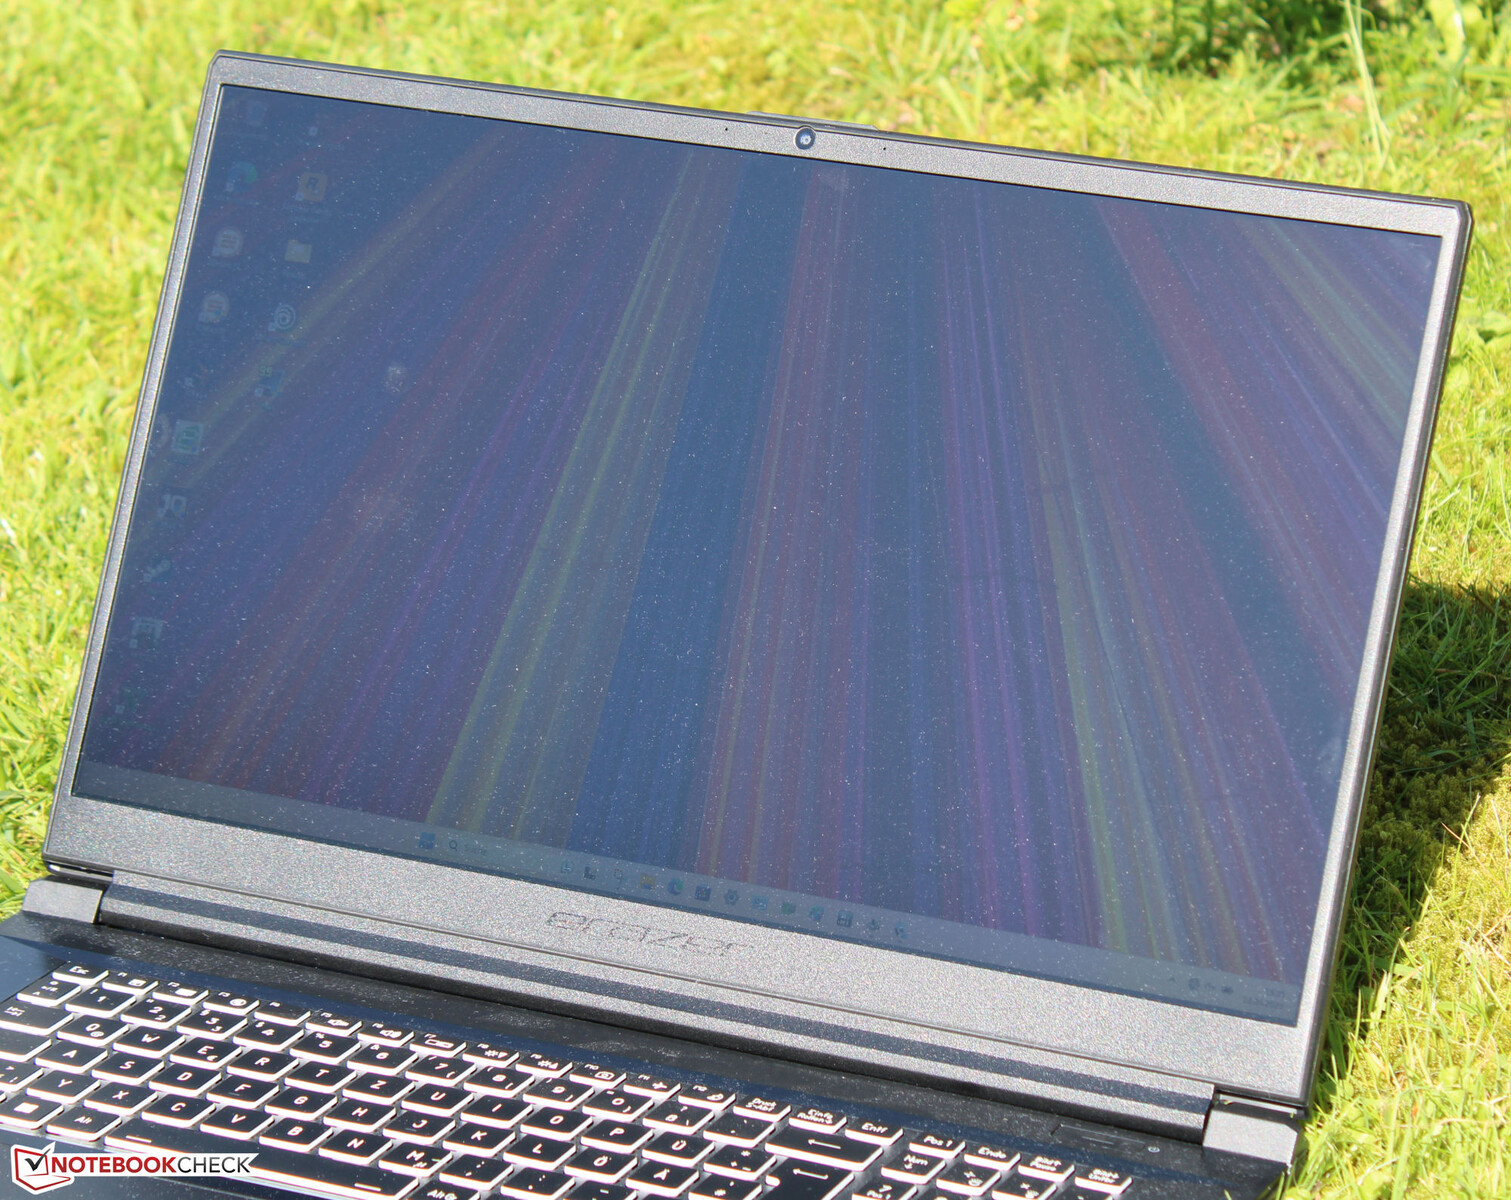
Skärm - FHD-panel med sRGB-täckning
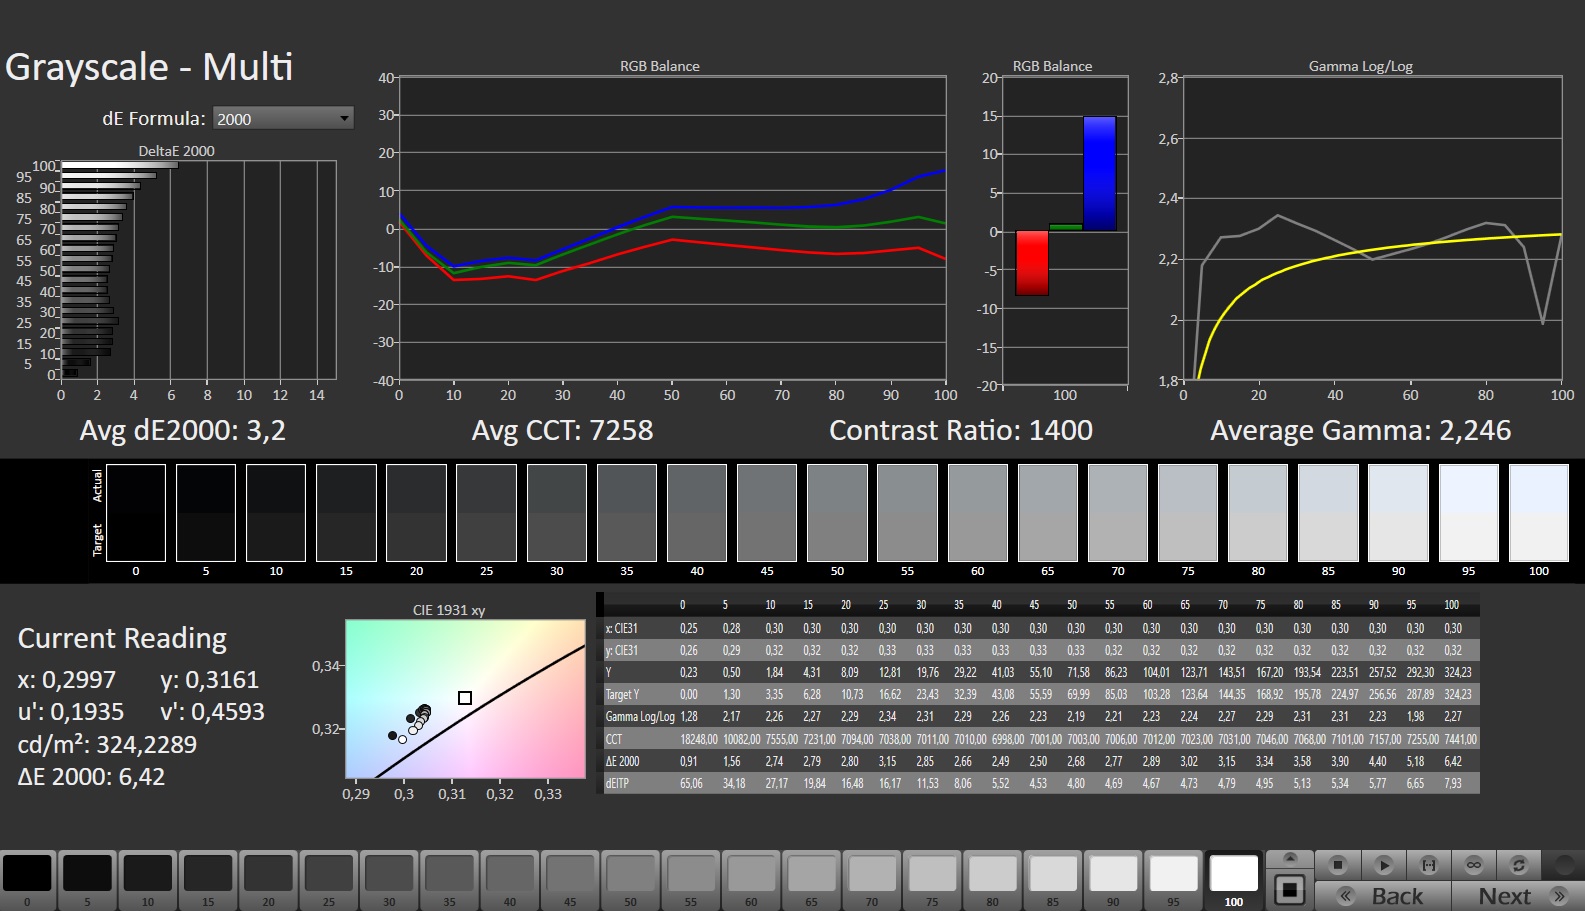
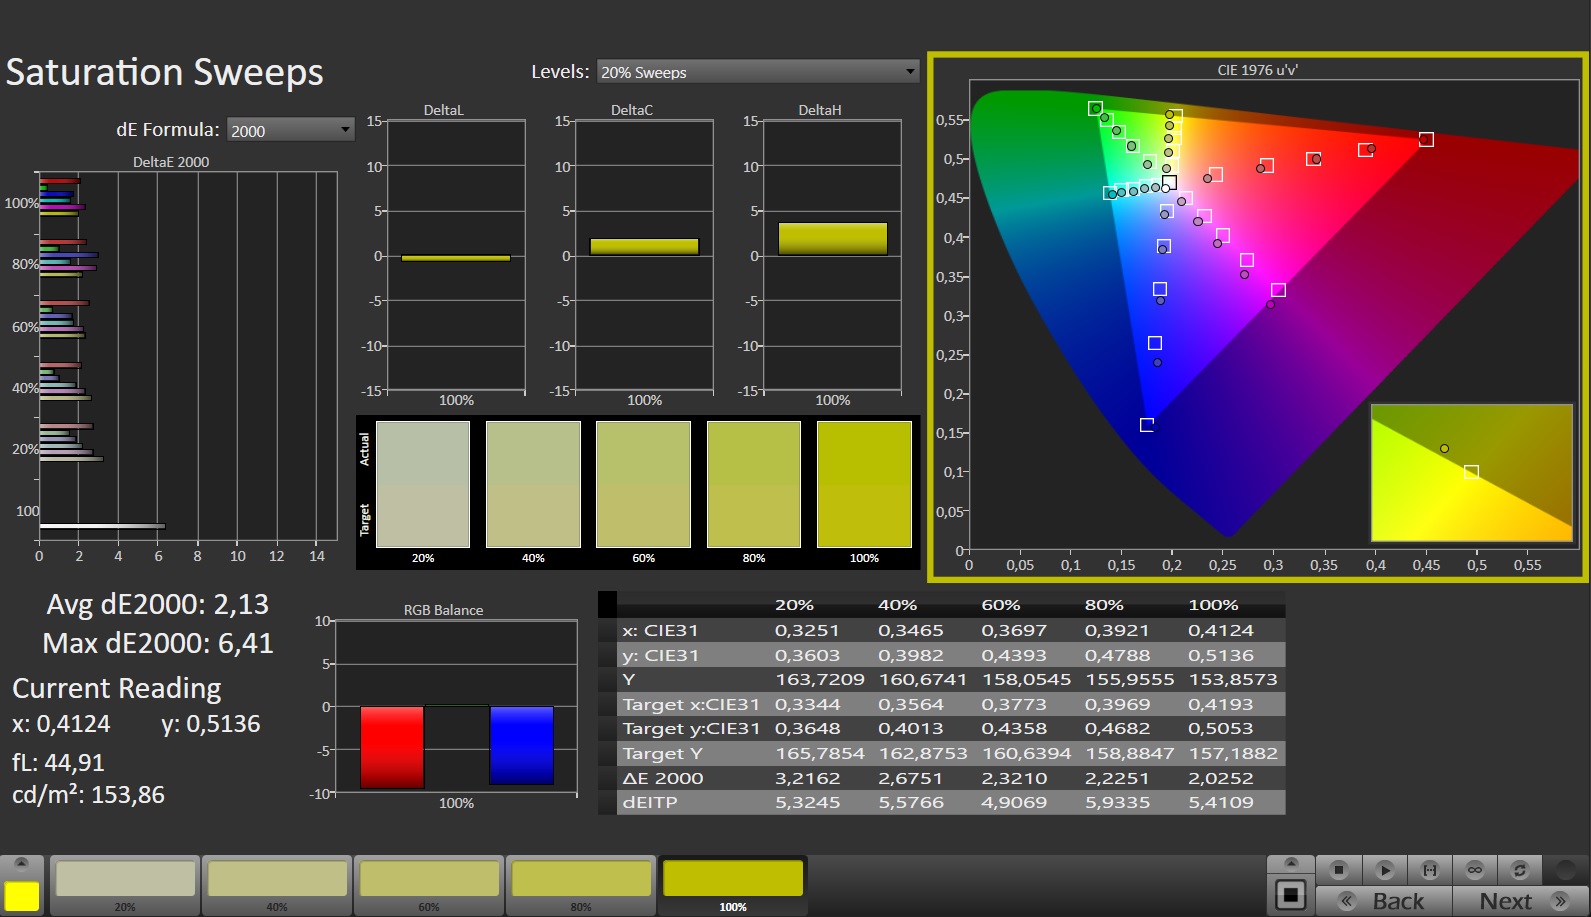
Medion har utrustat E20 med en mycket responsiv 144-Hz-panel i 16:9-formatet som inte visar något PWM-flimmer vid någon ljusstyrka. Ljusstyrkan och kontrasten på den matta 17,3-tumsskärmen (1 920 x 1 080 pixlar) uppfyller sina målkrav på >300 cd/m² respektive 1 000:1.
| |||||||||||||||||||||||||
Distribution av ljusstyrkan: 91 %
Mitt på batteriet: 312 cd/m²
Kontrast: 1248:1 (Svärta: 0.25 cd/m²)
ΔE ColorChecker Calman: 2.65 | ∀{0.5-29.43 Ø4.73}
calibrated: 0.96
ΔE Greyscale Calman: 3.2 | ∀{0.09-98 Ø4.97}
66.5% AdobeRGB 1998 (Argyll 3D)
96.7% sRGB (Argyll 3D)
65.1% Display P3 (Argyll 3D)
Gamma: 2.246
CCT: 7258 K
| Medion Erazer Scout E20 LG Philips LGD0611, IPS, 1920x1080, 17.3" | Gigabyte G7 KE AU Optronics B173HAN05.1, IPS, 1920x1080, 17.3" | MSI Katana 17 B13VFK B173HAN04.9, IPS LED, 1920x1080, 17.3" | Asus TUF Gaming A16 FA617 NE160WUM-NX2 (BOE0B33), IPS-Level, 1920x1200, 16" | Lenovo Legion 5 15IAH7H 82RB CSOT MNF601CA1-3, IPS, 1920x1080, 15.6" | Acer Nitro 5 AN515-46-R1A1 AU Optronics B156HAN12.H, IPS, 1920x1080, 15.6" | |
|---|---|---|---|---|---|---|
| Display | 6% | -37% | 5% | 5% | 4% | |
| Display P3 Coverage (%) | 65.1 | 70.4 8% | 40.8 -37% | 69.4 7% | 69.1 6% | 68.8 6% |
| sRGB Coverage (%) | 96.7 | 99.8 3% | 61 -37% | 97.8 1% | 99.5 3% | 98.1 1% |
| AdobeRGB 1998 Coverage (%) | 66.5 | 71.7 8% | 42.2 -37% | 70.9 7% | 70 5% | 69.7 5% |
| Response Times | 43% | -137% | -6% | -8% | 18% | |
| Response Time Grey 50% / Grey 80% * (ms) | 14.8 ? | 5 ? 66% | 33 ? -123% | 17 ? -15% | 14.8 ? -0% | 13 ? 12% |
| Response Time Black / White * (ms) | 10.4 ? | 8.3 ? 20% | 26 ? -150% | 10.1 ? 3% | 12 ? -15% | 8 ? 23% |
| PWM Frequency (Hz) | ||||||
| Screen | 16% | -69% | 15% | -21% | -8% | |
| Brightness middle (cd/m²) | 312 | 307 -2% | 267 -14% | 308 -1% | 363.5 17% | 327 5% |
| Brightness (cd/m²) | 303 | 301 -1% | 256 -16% | 293 -3% | 350 16% | 320 6% |
| Brightness Distribution (%) | 91 | 93 2% | 93 2% | 90 -1% | 89 -2% | 93 2% |
| Black Level * (cd/m²) | 0.25 | 0.2 20% | 0.21 16% | 0.23 8% | 0.39 -56% | 0.24 4% |
| Contrast (:1) | 1248 | 1535 23% | 1271 2% | 1339 7% | 932 -25% | 1363 9% |
| Colorchecker dE 2000 * | 2.65 | 1.32 50% | 4.7 -77% | 1.47 45% | 3.68 -39% | 3.26 -23% |
| Colorchecker dE 2000 max. * | 6.44 | 4.6 29% | 20.4 -217% | 2.98 54% | 8.92 -39% | 8.73 -36% |
| Colorchecker dE 2000 calibrated * | 0.96 | 1.03 -7% | 4.5 -369% | 1.02 -6% | 0.53 45% | 0.87 9% |
| Greyscale dE 2000 * | 3.2 | 2.1 34% | 1.5 53% | 2.2 31% | 6.5 -103% | 4.87 -52% |
| Gamma | 2.246 98% | 2.247 98% | 2.12 104% | 2.228 99% | 2.2 100% | 2.3 96% |
| CCT | 7258 90% | 6815 95% | 6552 99% | 6228 104% | 5995 108% | 7070 92% |
| Totalt genomsnitt (program/inställningar) | 22% /
18% | -81% /
-72% | 5% /
10% | -8% /
-13% | 5% /
-2% |
* ... mindre är bättre
Skärmen visar en bra färgåtergivning redan i leveransstadiet, och med en avvikelse på cirka 2,65 är målet DeltaE < 3 uppfyllt. En ytterligare kalibrering sänker avvikelsen ytterligare till 0,96 och säkerställer också en mer balanserad gråskala.
Panelen kan täcka sRGB-färgrymden helt och hållet men inte AdobeRGB- och DCI-P3-färgrymderna. Skärmarna hos de flesta konkurrenter uppvisar liknande egenskaper.
Visa svarstider
| ↔ Svarstid svart till vitt | ||
|---|---|---|
| 10.4 ms ... stiga ↗ och falla ↘ kombinerat | ↗ 5.4 ms stiga | 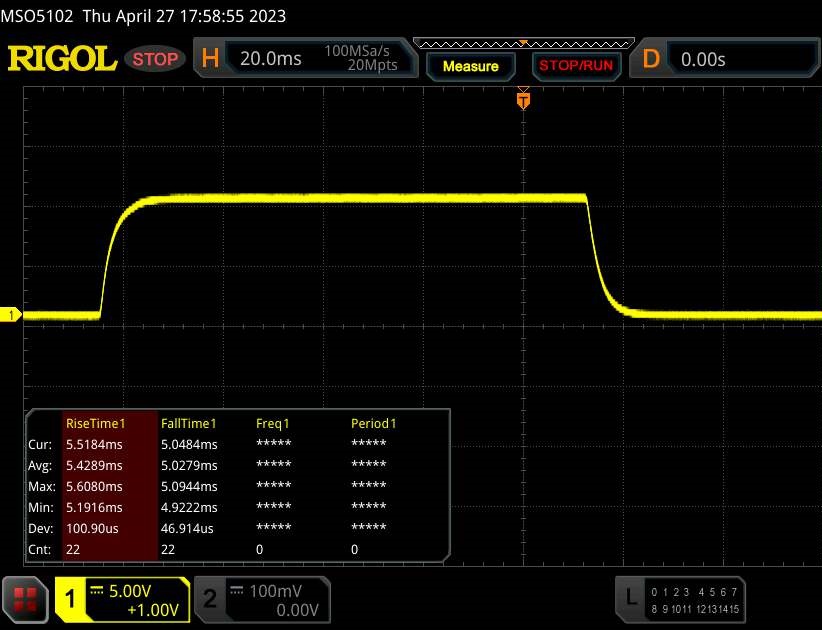 |
| ↘ 5 ms hösten | ||
| Skärmen visar bra svarsfrekvens i våra tester, men kan vara för långsam för konkurrenskraftiga spelare. I jämförelse sträcker sig alla testade enheter från 0.1 (minst) till 240 (maximalt) ms. » 28 % av alla enheter är bättre. Det betyder att den uppmätta svarstiden är bättre än genomsnittet av alla testade enheter (19.9 ms). | ||
| ↔ Svarstid 50 % grått till 80 % grått | ||
| 14.8 ms ... stiga ↗ och falla ↘ kombinerat | ↗ 7.2 ms stiga | 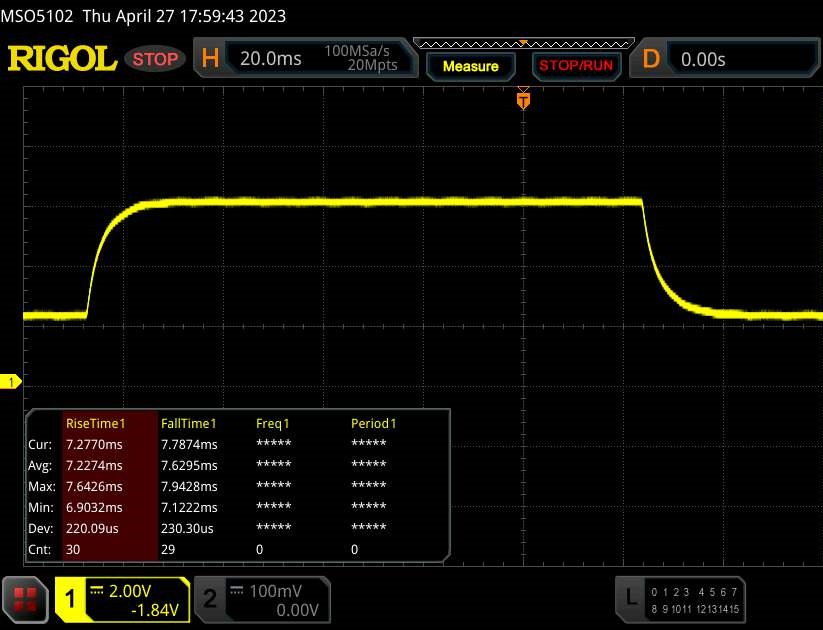 |
| ↘ 7.6 ms hösten | ||
| Skärmen visar bra svarsfrekvens i våra tester, men kan vara för långsam för konkurrenskraftiga spelare. I jämförelse sträcker sig alla testade enheter från 0.165 (minst) till 636 (maximalt) ms. » 29 % av alla enheter är bättre. Det betyder att den uppmätta svarstiden är bättre än genomsnittet av alla testade enheter (31.1 ms). | ||
Skärmflimmer / PWM (Puls-Width Modulation)
| Skärmflimmer / PWM upptäcktes inte | 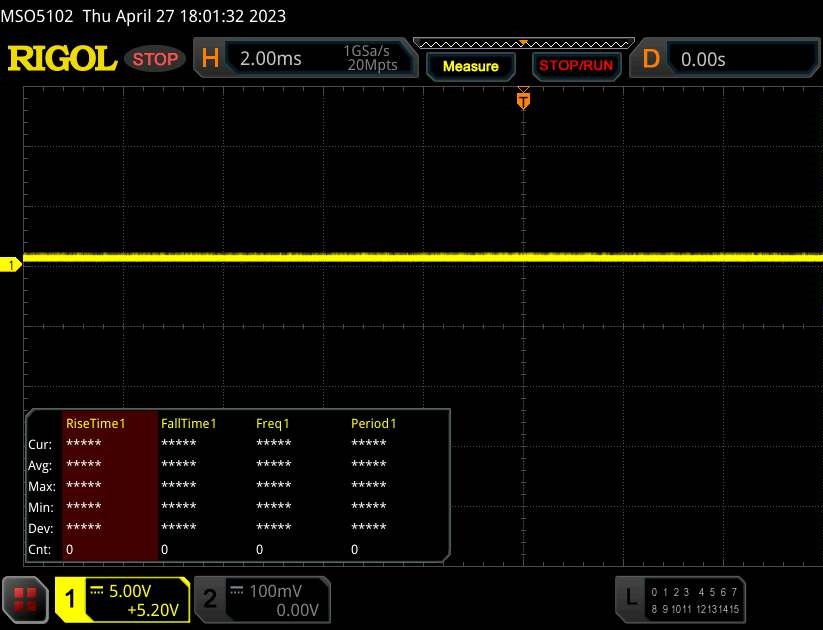 | ||
Som jämförelse: 52 % av alla testade enheter använder inte PWM för att dämpa skärmen. Om PWM upptäcktes mättes ett medelvärde av 7798 (minst: 5 - maximum: 343500) Hz. | |||
IPS-panelen har stabila betraktningsvinklar och kan läsas från vilken position som helst. Utomhus kan du läsa innehållet på skärmen när solljuset inte är för starkt.

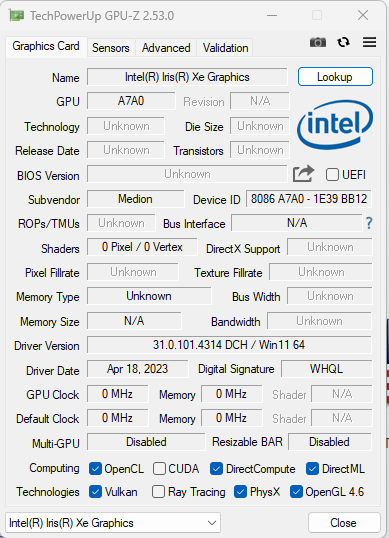
Prestationer - Scouten använder Raptor Lake och Ada Lovelace
Erazer Scout E20 är en bärbar dator för spel i instegssegmentet. Den nödvändiga datorprestandan tillhandahålls av Raptor Lake- och Ada Lovelace-chips. Vår testenhet finns tillgänglig för cirka 1 500 euro (~1 658 dollar). Vid tidpunkten för det här testet kunde vi inte hitta några andra utrustningskonfigurationer.
Testförhållanden
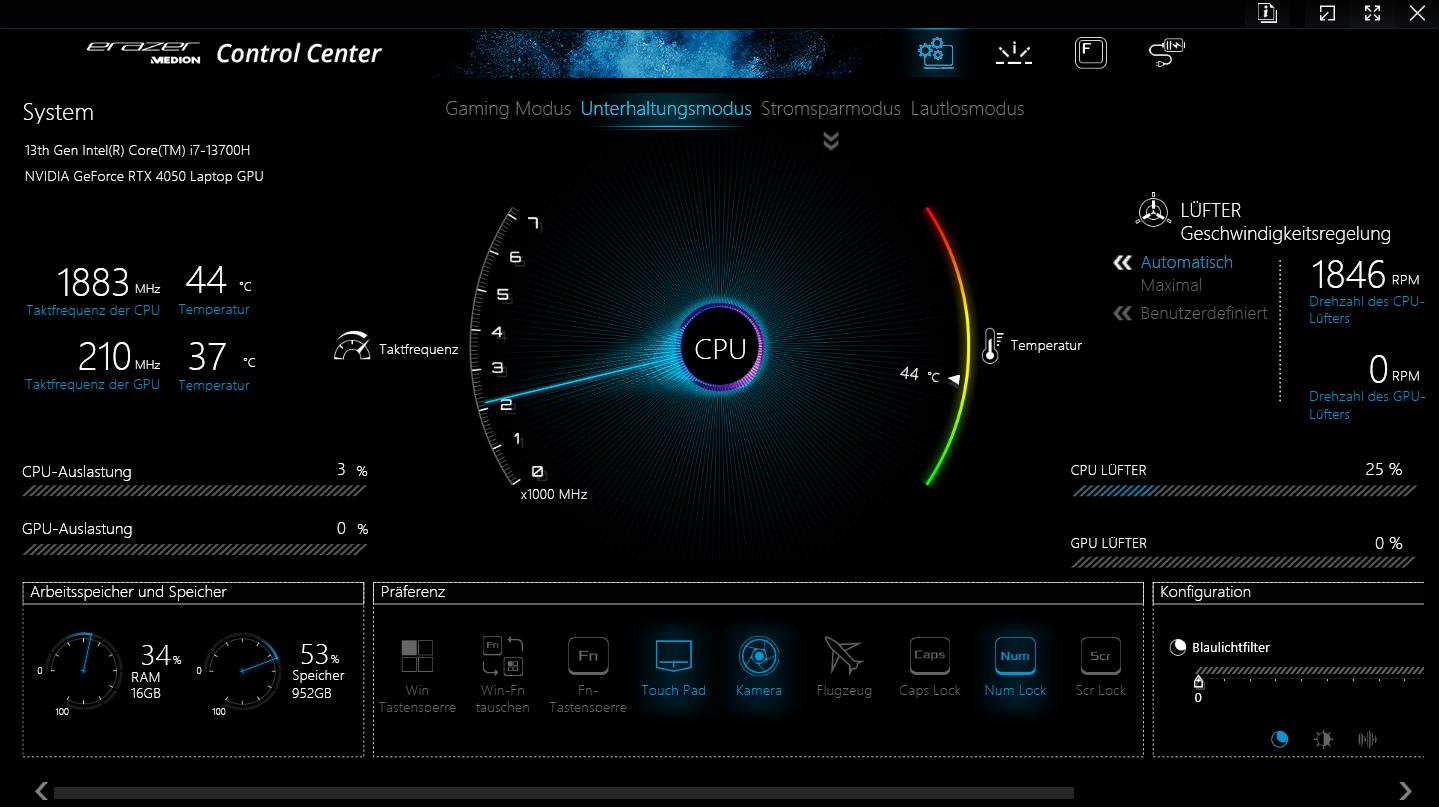
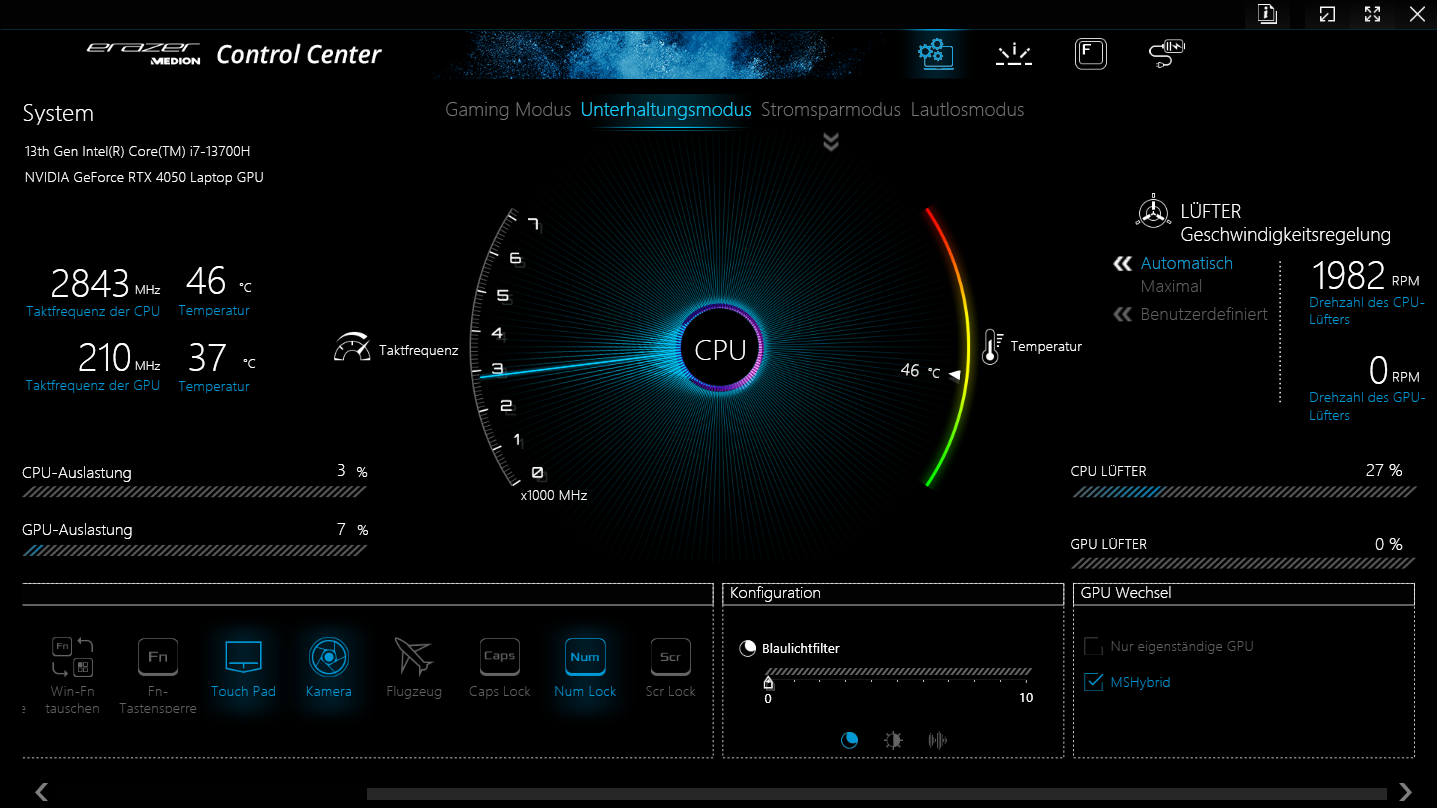
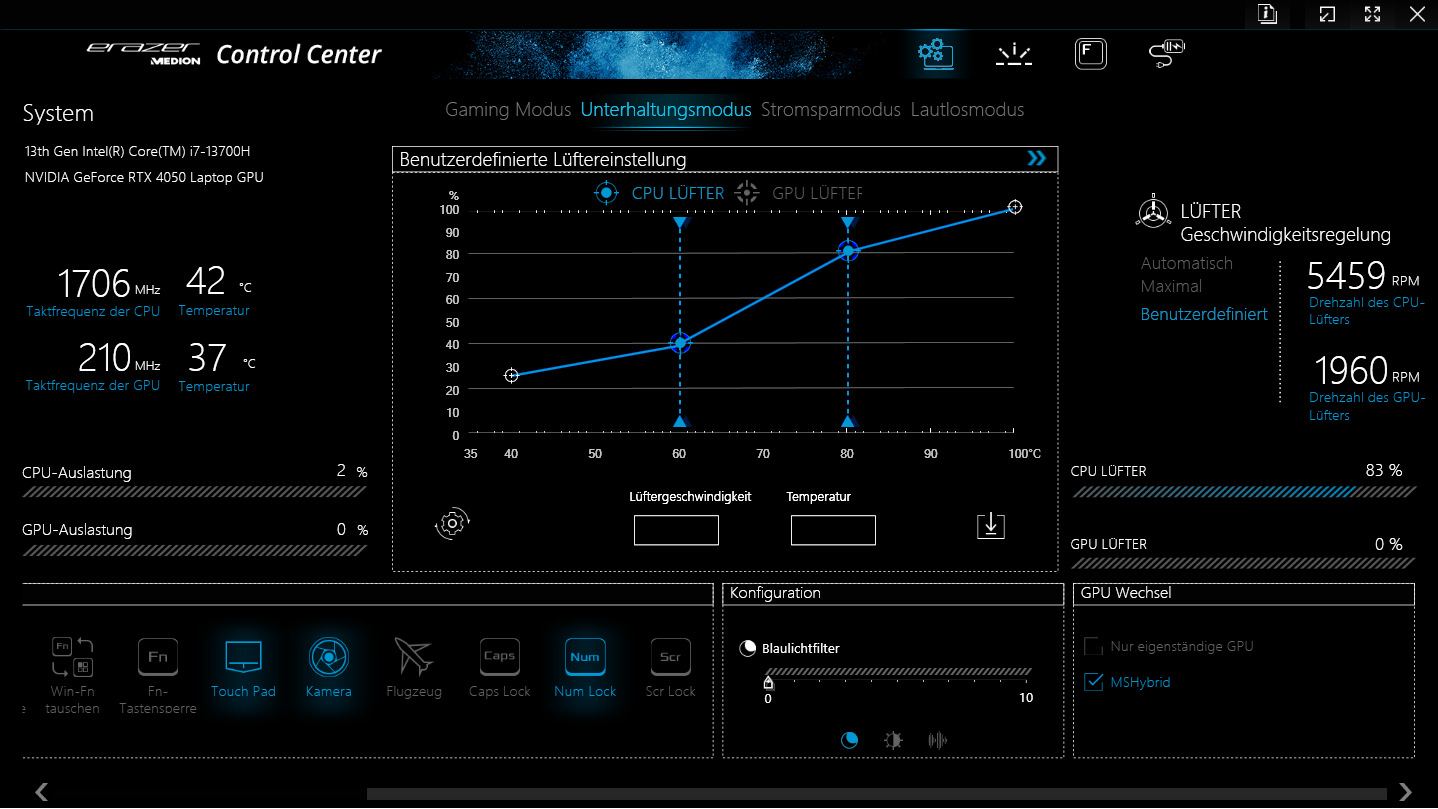
E20 har fyra tillverkarspecifika prestandalägen (se tabell). Du kan växla mellan dem med hjälp av programvaran Control Center, som är den bärbara datorns kontrollcenter. Vi använde "Entertainment mode" för benchmarks och "Power saving mode" för batteritesterna, med Optimus aktiverat. Läget Power Saving utgör också ett specialfall bland lägena, eftersom det inaktiverar GeForce grafikkärnan.
| Spelläge | Underhållningsläge | Läge för energisparande | Tyst läge | |
|---|---|---|---|---|
| Effektbegränsning 1 (HWInfo) | 110 watt | 50 watt | 20 watt | 15 watt |
| Effektgräns 2 (HWInfo) | 115 watt | 115 watt | 30 watt | 30 watt |
| Buller ( Witcher 3 ) | 57 dB(A) | 50 dB(A) | - | 34 dB(A) |
| Prestanda ( Witcher 3 ) | ~83 fps | ~80 fps | - | 30-50 fps |
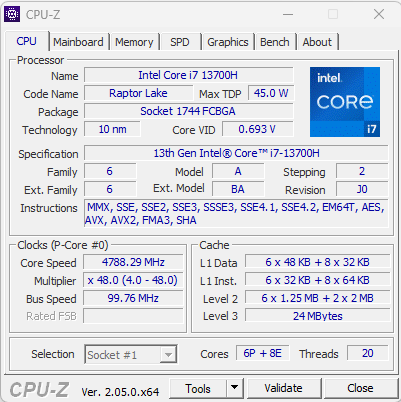
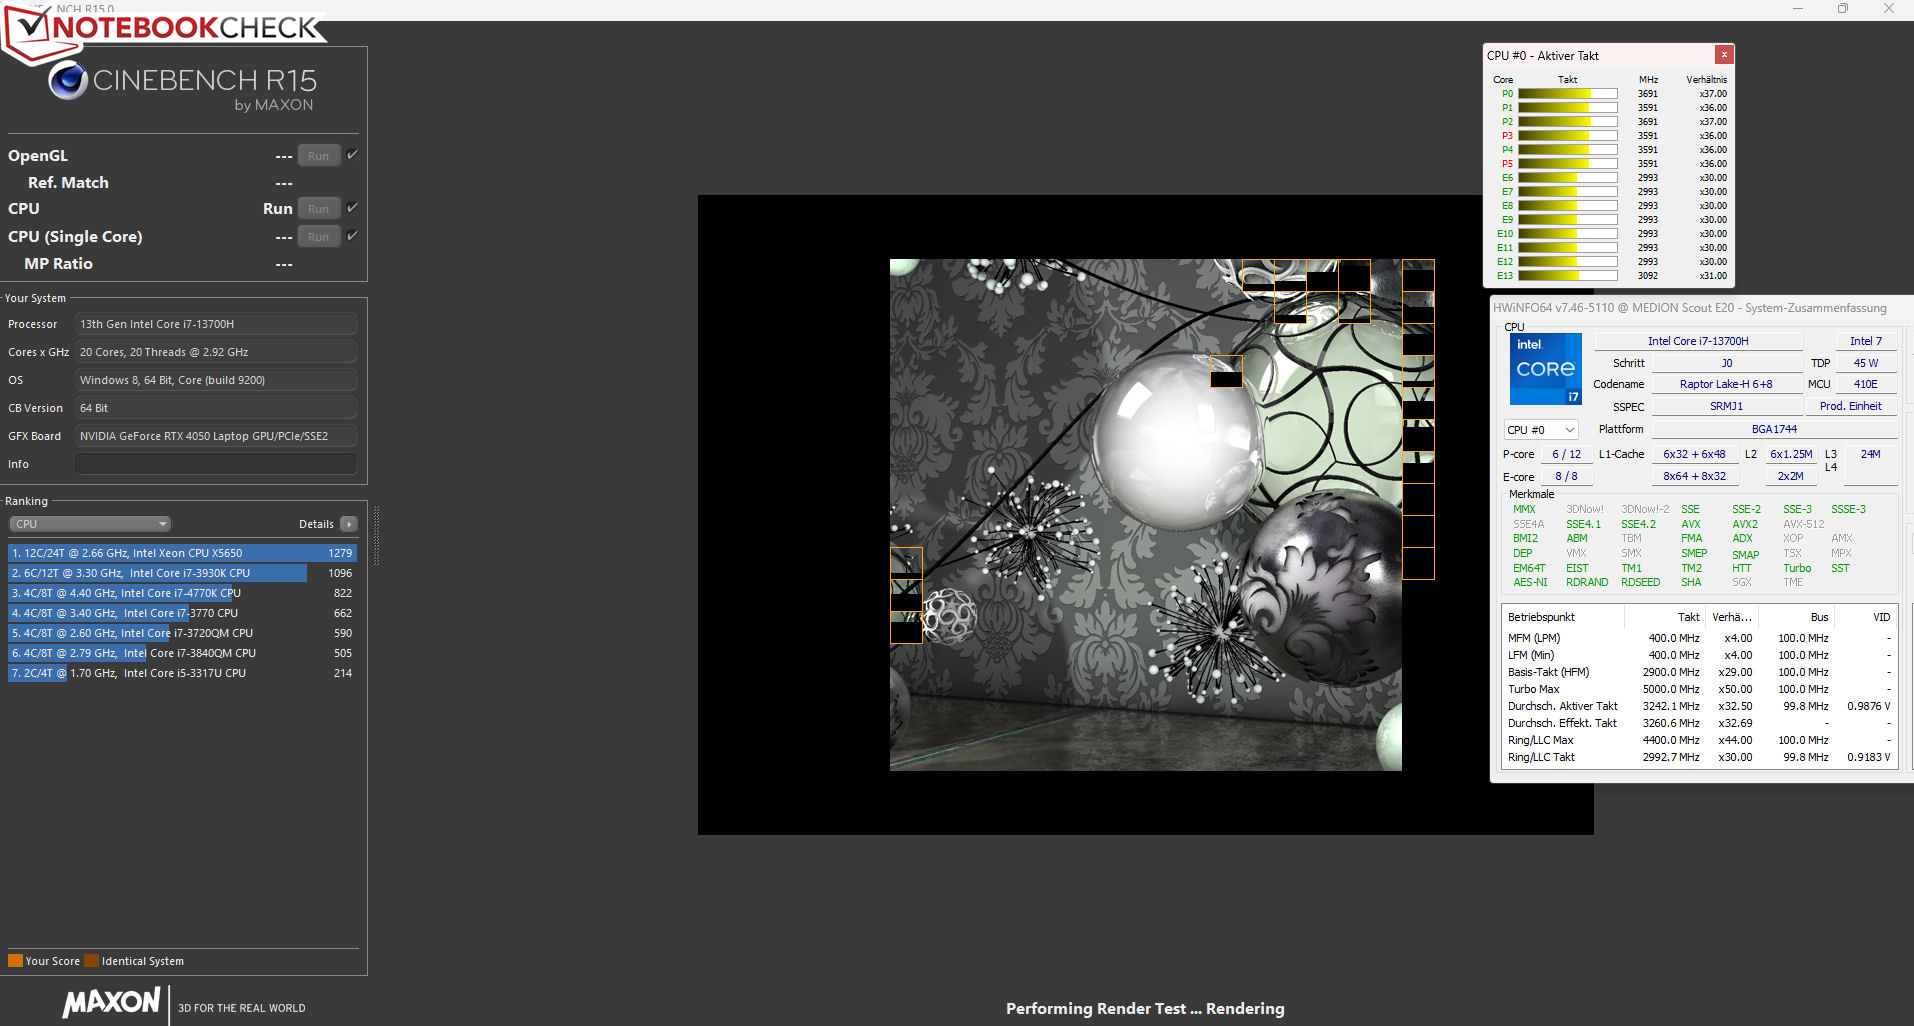
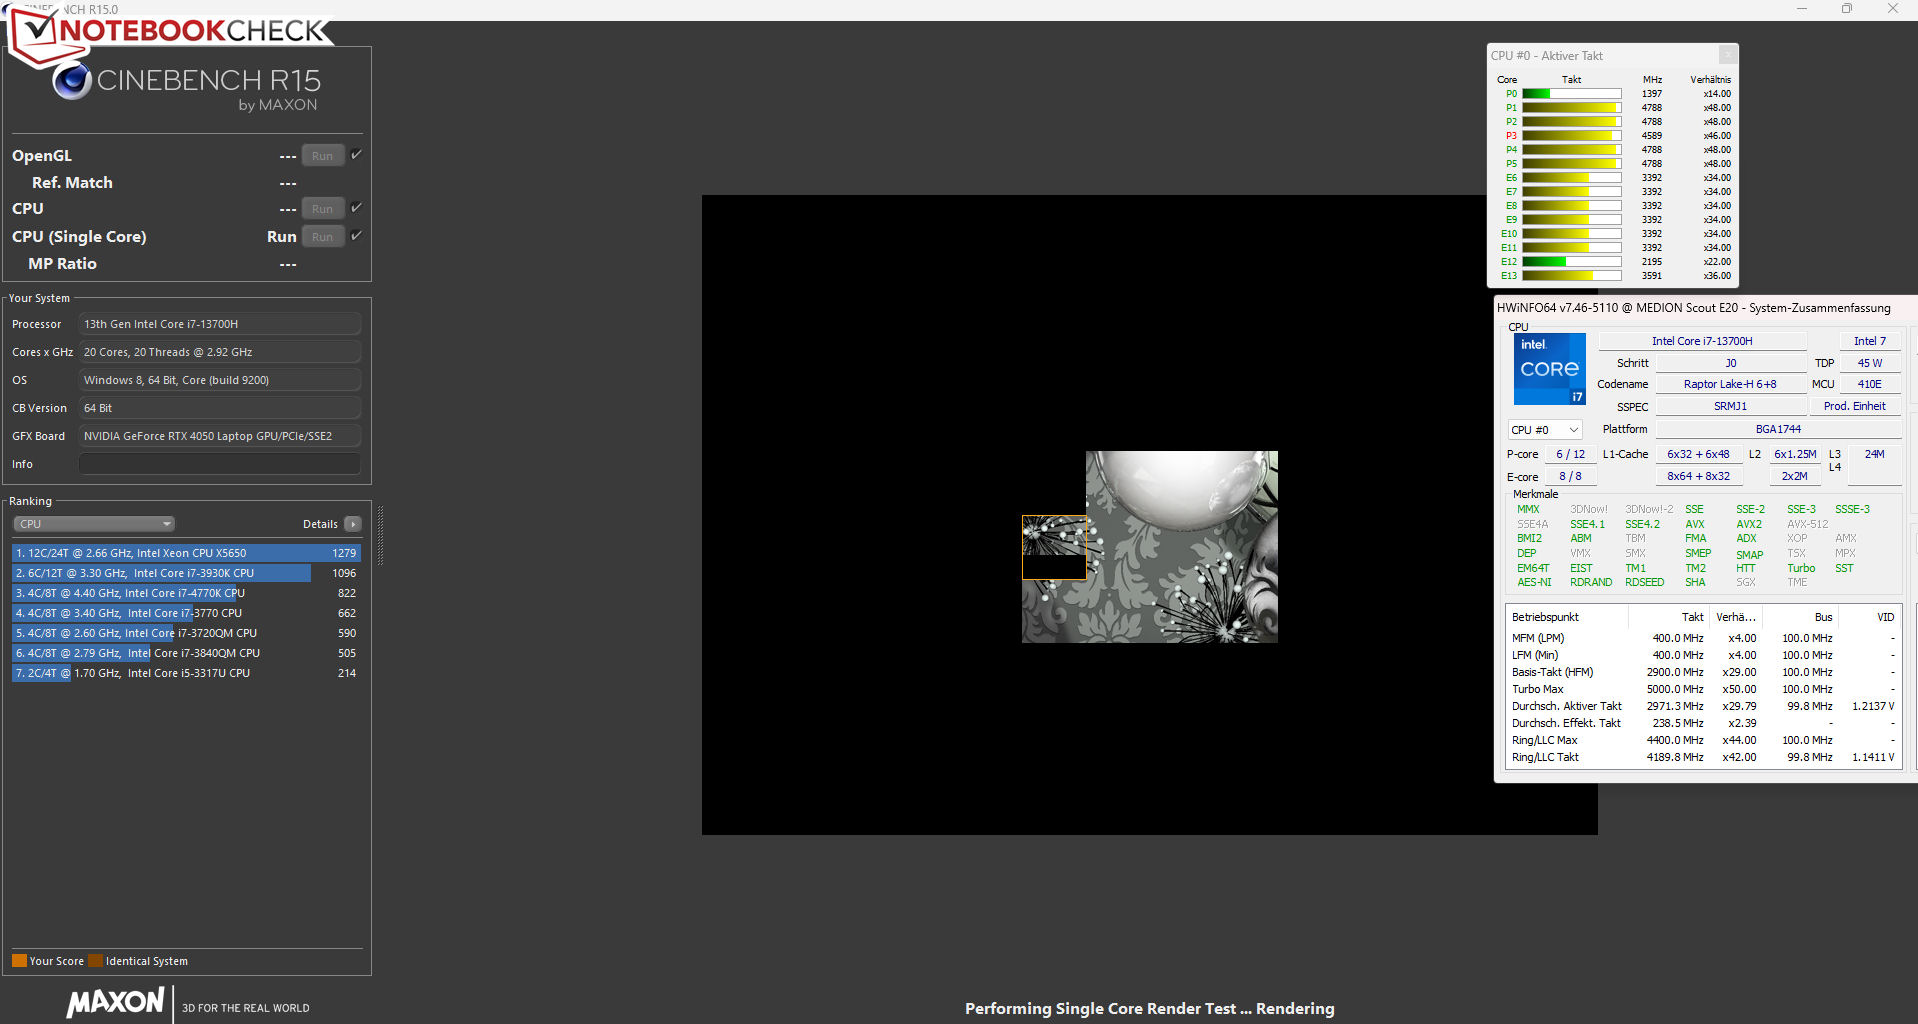
Processor
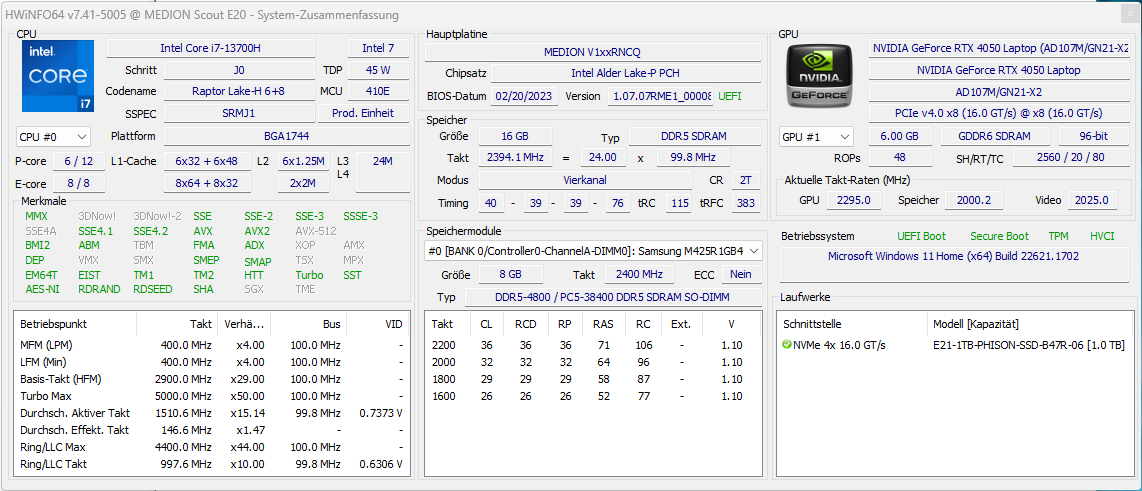
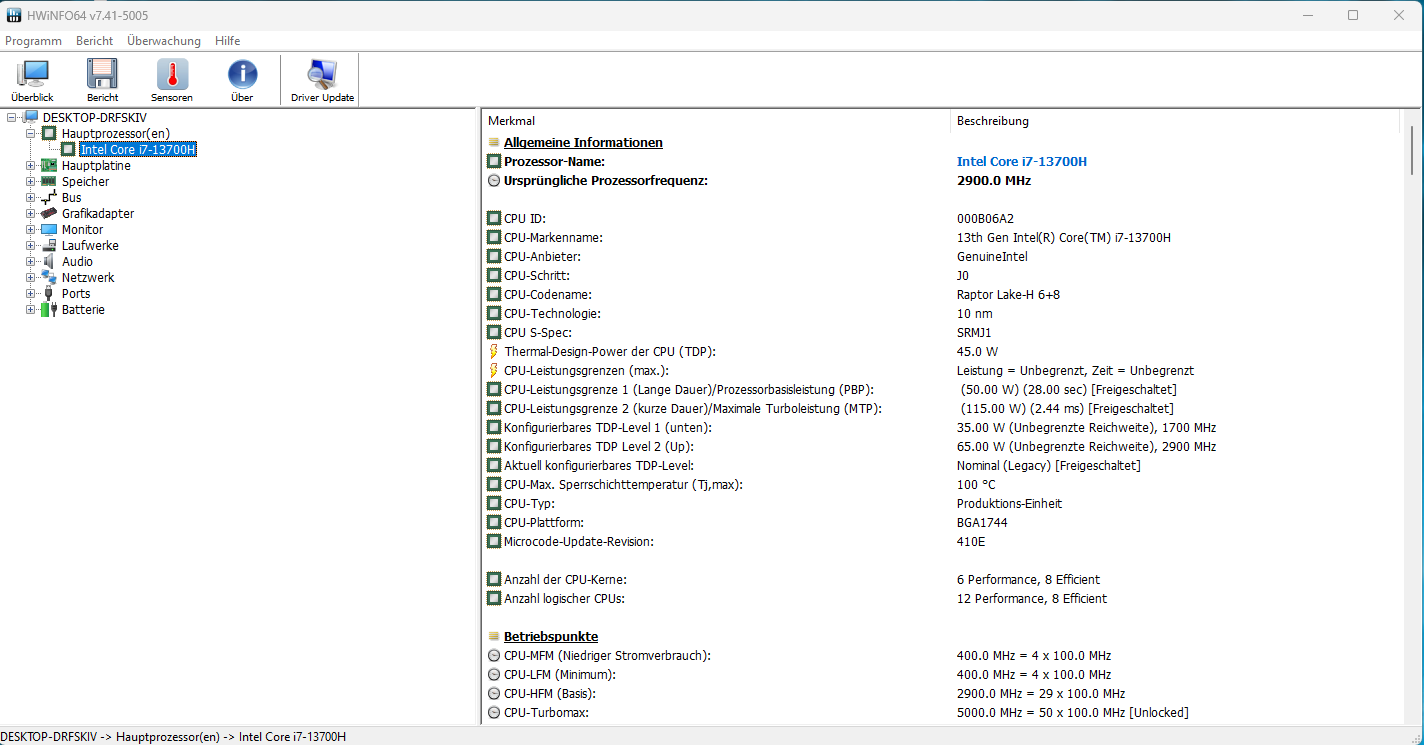
Raptor LakeCore i7-13700Hprocessorn består av åtta effektivitetskärnor (ingen hyperthreading, 1,8-3,7 GHz) och sex prestandakärnor (hyperthreading, 2,4-5 GHz), vilket ger totalt 20 logiska CPU-kärnor.
Benchmarks ger resultat som ligger över (spelläge, underhållningsläge) och under (andra lägen) det nuvarande genomsnittet för CPU:n fram till nu. Den mer relevanta prestandan för entrådig process (170 poäng) minskar mindre under batteridrift än prestandan för flertrådig process (1 335 poäng).
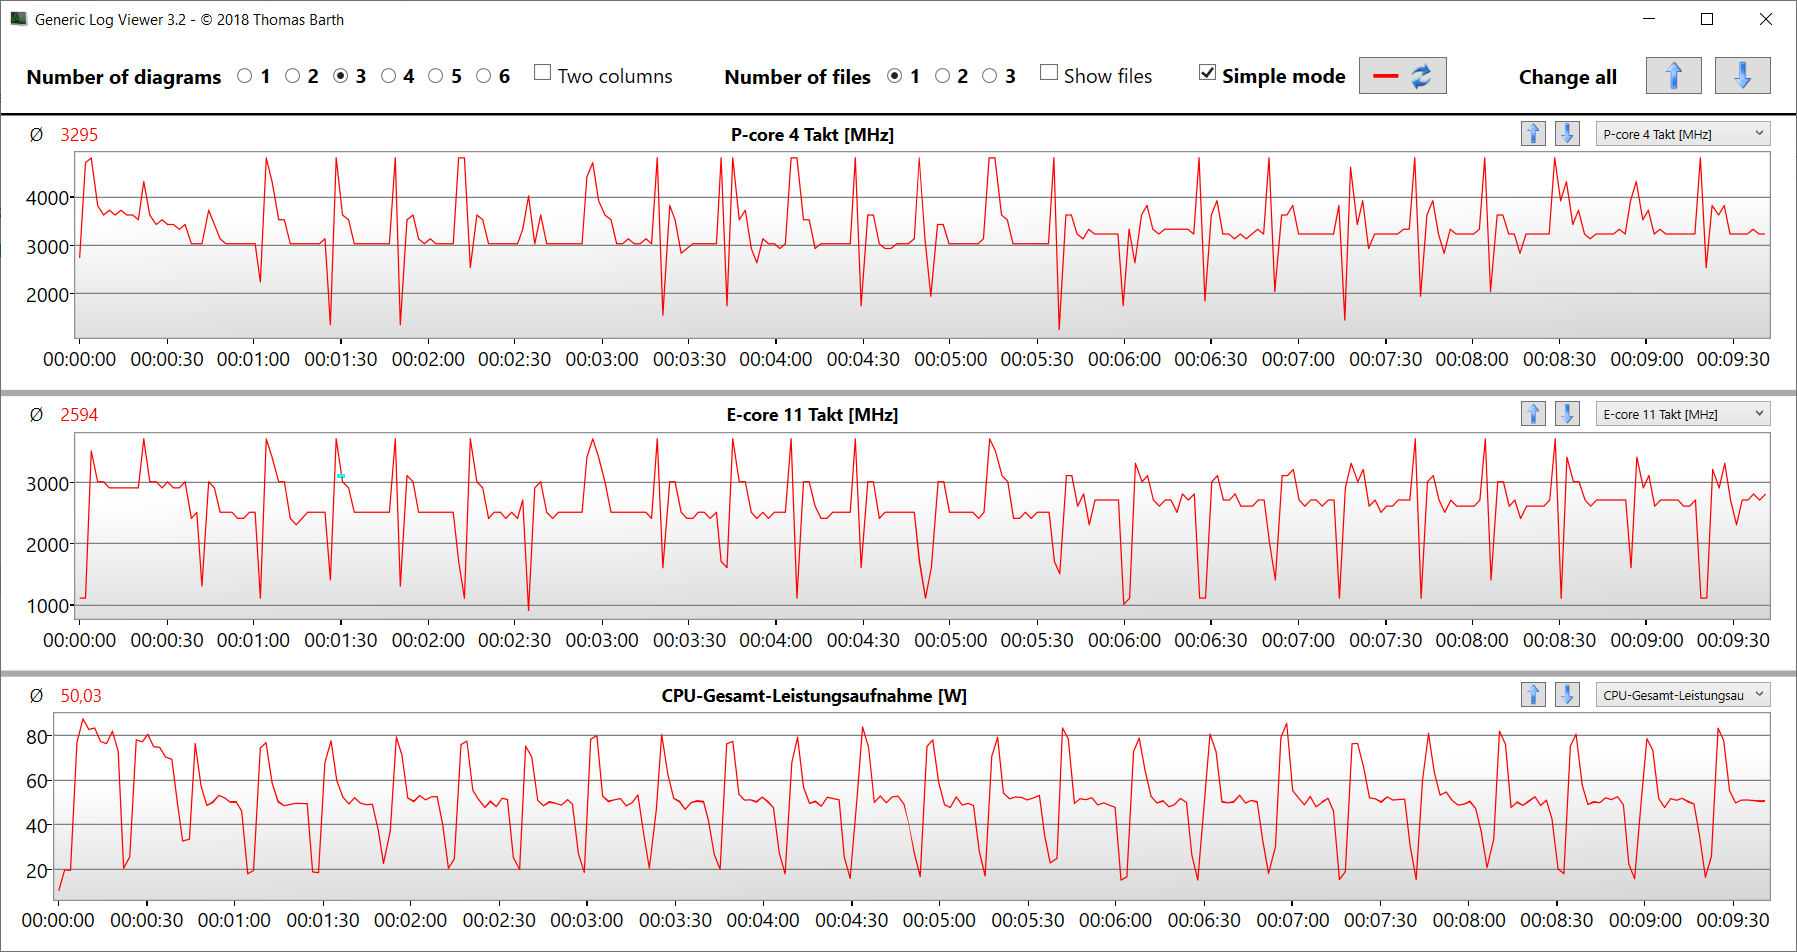
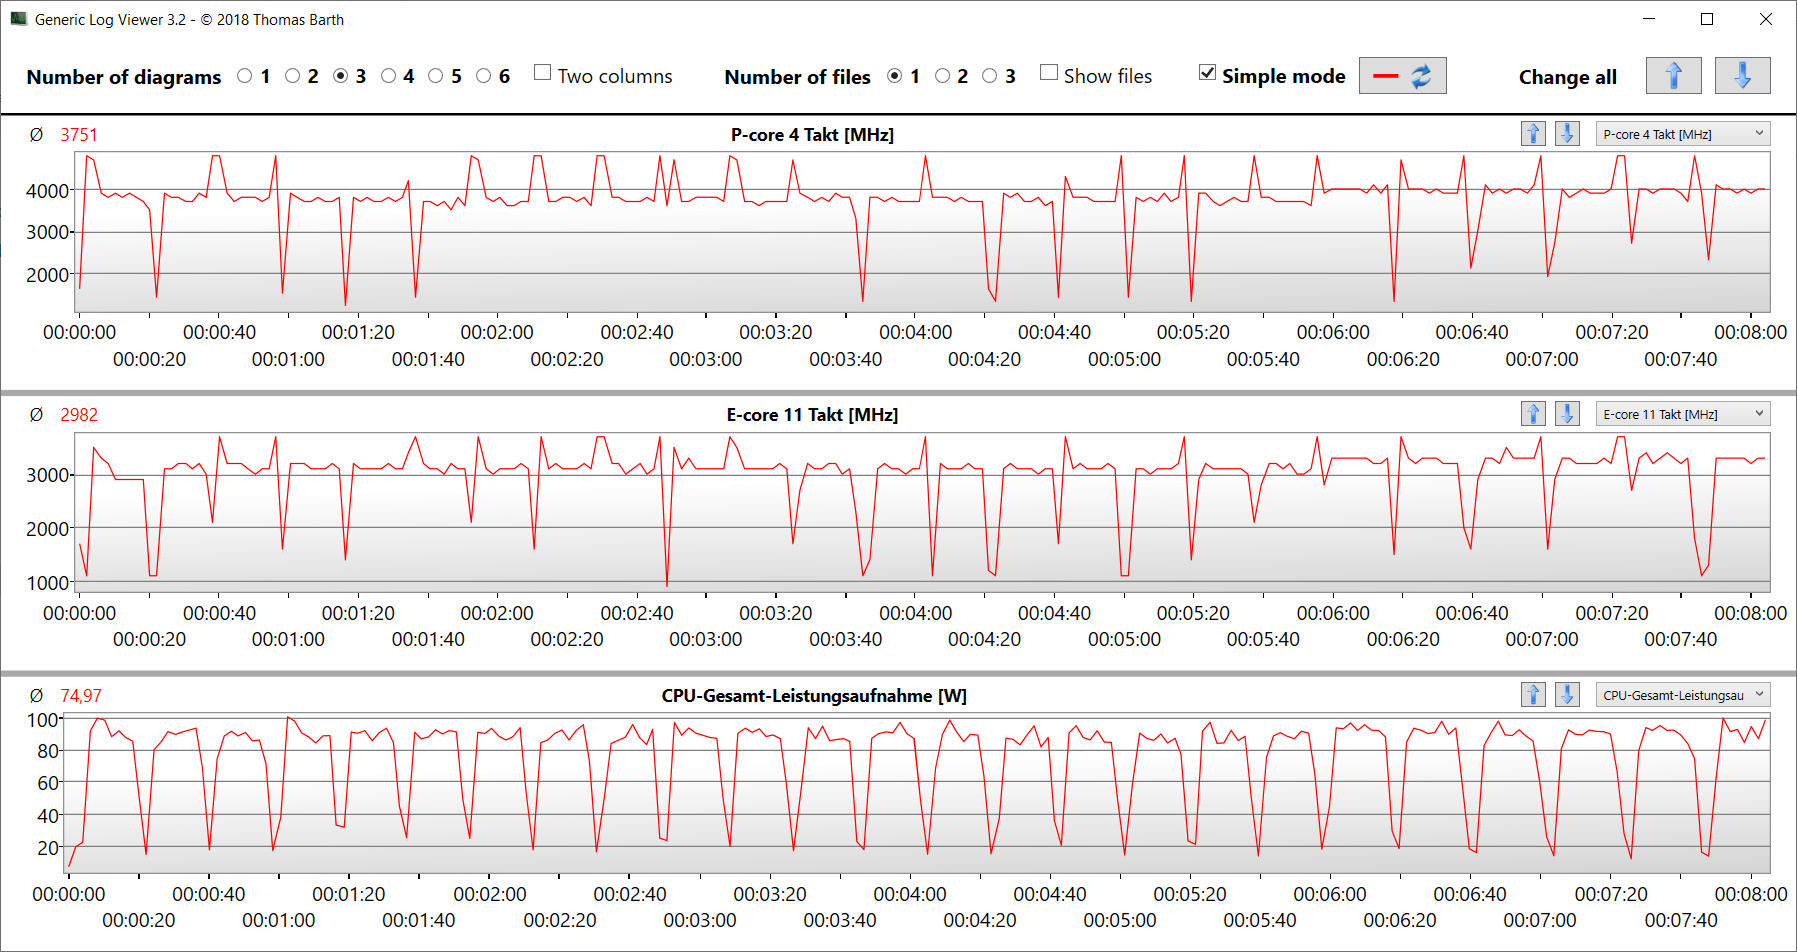
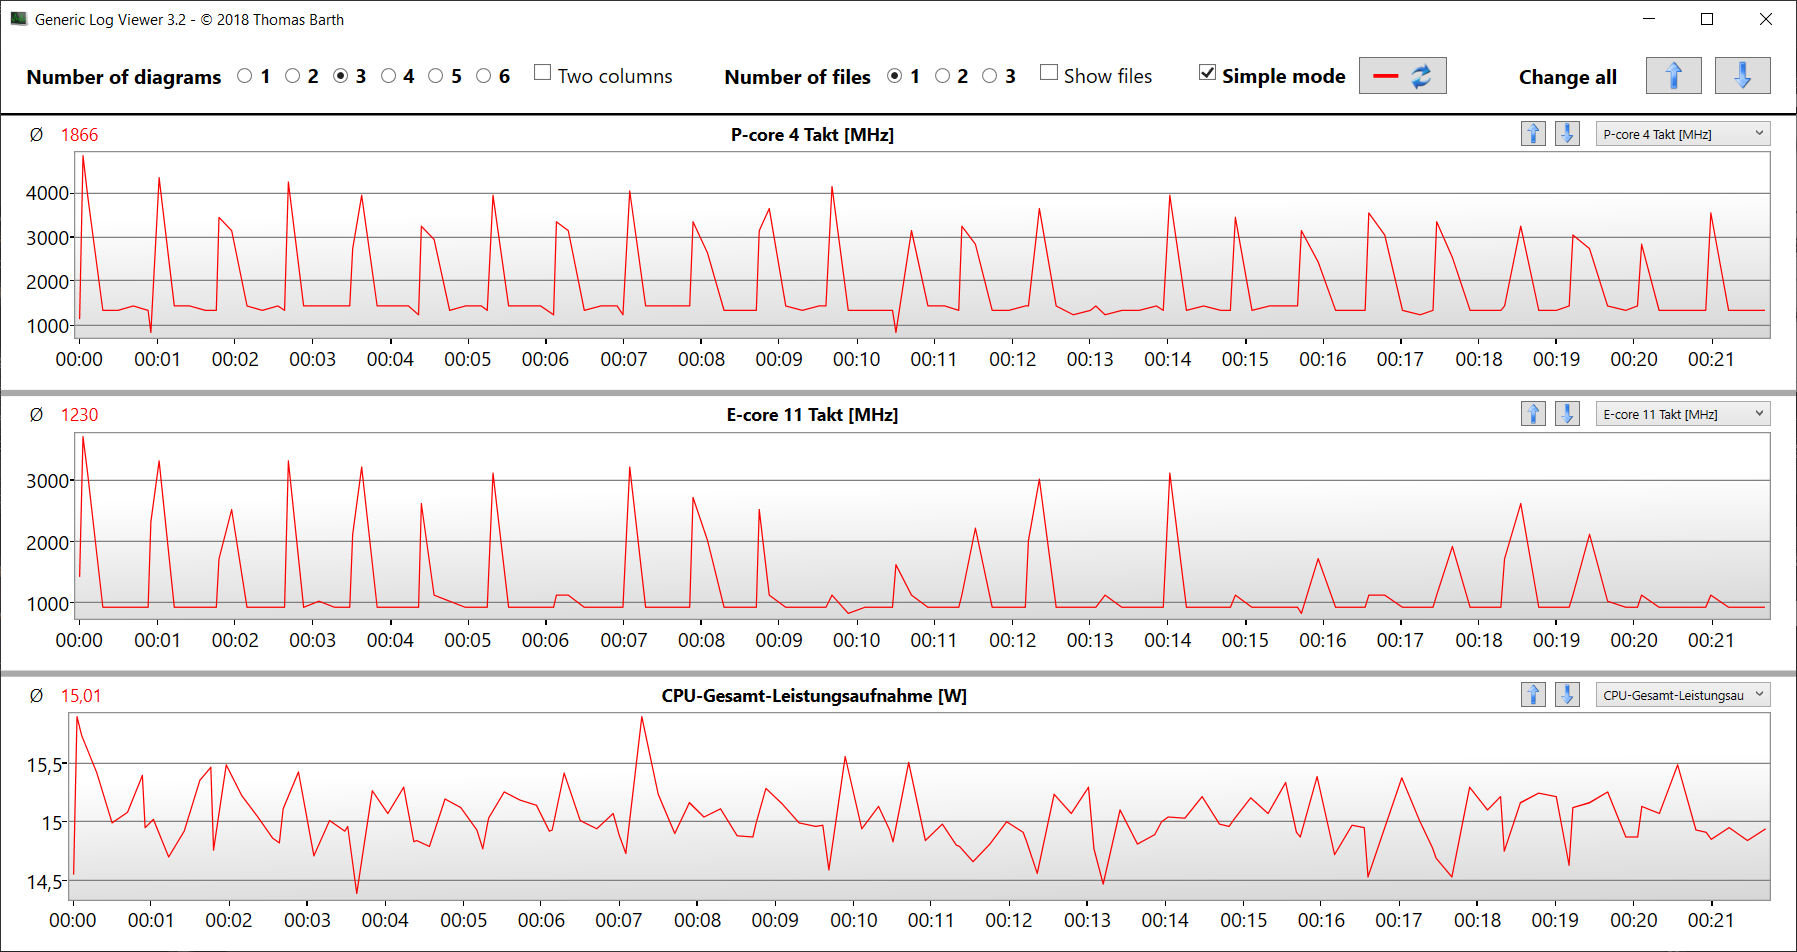
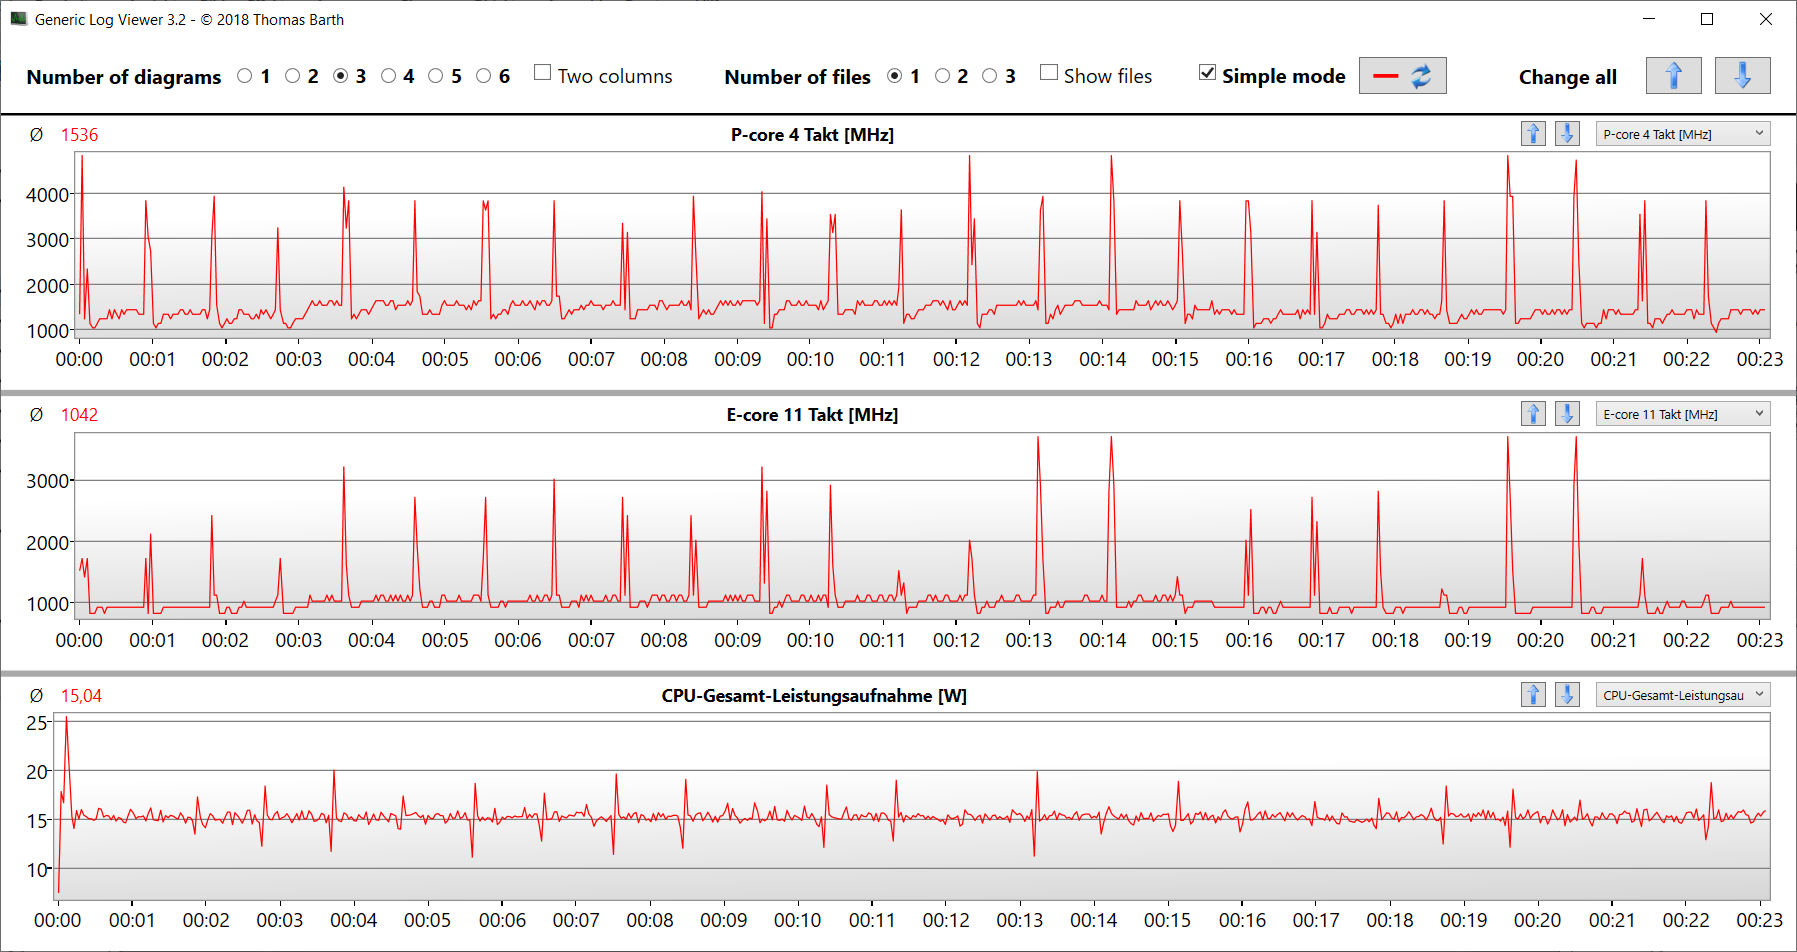
CB15-slingtestet visar att konstant belastning av flera trådar gör att Turbohastigheten sjunker från den första till den tredje körningen. Därefter kan en konstant nivå upprätthållas - åtminstone ett tag. Läget Gaming säkerställer en högre konstant klockfrekvens.
Cinebench R15 Multi Constant Load Test
| CPU Performance rating - Percent | |
| Genomsnitt av klass Gaming | |
| Lenovo Legion 5 15IAH7H 82RB | |
| Medion Erazer Scout E20 | |
| Medion Erazer Scout E20 | |
| Genomsnitt Intel Core i7-13700H | |
| MSI Katana 17 B13VFK | |
| Gigabyte G7 KE | |
| Asus TUF Gaming A16 FA617 | |
| Acer Nitro 5 AN515-46-R1A1 | |
| Medion Erazer Scout E20 | |
| Cinebench R23 | |
| Multi Core | |
| Genomsnitt av klass Gaming (10488 - 40970, n=113, senaste 2 åren) | |
| Lenovo Legion 5 15IAH7H 82RB | |
| Medion Erazer Scout E20 (Gaming Modus) | |
| Medion Erazer Scout E20 | |
| MSI Katana 17 B13VFK | |
| Genomsnitt Intel Core i7-13700H (5890 - 20034, n=29) | |
| Gigabyte G7 KE | |
| Asus TUF Gaming A16 FA617 | |
| Acer Nitro 5 AN515-46-R1A1 | |
| Medion Erazer Scout E20 (Lautlosmodus) | |
| Single Core | |
| Genomsnitt av klass Gaming (1166 - 2356, n=113, senaste 2 åren) | |
| Medion Erazer Scout E20 (Gaming Modus) | |
| Medion Erazer Scout E20 | |
| Lenovo Legion 5 15IAH7H 82RB | |
| MSI Katana 17 B13VFK | |
| Genomsnitt Intel Core i7-13700H (1323 - 1914, n=29) | |
| Gigabyte G7 KE | |
| Asus TUF Gaming A16 FA617 | |
| Acer Nitro 5 AN515-46-R1A1 | |
| Medion Erazer Scout E20 (Lautlosmodus) | |
| Cinebench R20 | |
| CPU (Multi Core) | |
| Genomsnitt av klass Gaming (4029 - 16108, n=112, senaste 2 åren) | |
| Lenovo Legion 5 15IAH7H 82RB | |
| Medion Erazer Scout E20 (Gaming Modus) | |
| Medion Erazer Scout E20 | |
| MSI Katana 17 B13VFK | |
| Genomsnitt Intel Core i7-13700H (2322 - 7674, n=29) | |
| Asus TUF Gaming A16 FA617 | |
| Gigabyte G7 KE | |
| Acer Nitro 5 AN515-46-R1A1 | |
| Medion Erazer Scout E20 (Lautlosmodus) | |
| CPU (Single Core) | |
| Genomsnitt av klass Gaming (442 - 895, n=112, senaste 2 åren) | |
| Medion Erazer Scout E20 | |
| Medion Erazer Scout E20 (Gaming Modus) | |
| Lenovo Legion 5 15IAH7H 82RB | |
| Genomsnitt Intel Core i7-13700H (508 - 741, n=29) | |
| MSI Katana 17 B13VFK | |
| Gigabyte G7 KE | |
| Asus TUF Gaming A16 FA617 | |
| Acer Nitro 5 AN515-46-R1A1 | |
| Medion Erazer Scout E20 (Lautlosmodus) | |
| Cinebench R15 | |
| CPU Multi 64Bit | |
| Genomsnitt av klass Gaming (1578 - 6271, n=113, senaste 2 åren) | |
| Lenovo Legion 5 15IAH7H 82RB | |
| Medion Erazer Scout E20 (Gaming Modus) | |
| Medion Erazer Scout E20 | |
| Genomsnitt Intel Core i7-13700H (905 - 2982, n=29) | |
| MSI Katana 17 B13VFK | |
| Asus TUF Gaming A16 FA617 | |
| Acer Nitro 5 AN515-46-R1A1 | |
| Gigabyte G7 KE | |
| Medion Erazer Scout E20 (Lautlosmodus) | |
| CPU Single 64Bit | |
| Genomsnitt av klass Gaming (188.8 - 343, n=112, senaste 2 åren) | |
| Medion Erazer Scout E20 | |
| Medion Erazer Scout E20 (Gaming Modus) | |
| Lenovo Legion 5 15IAH7H 82RB | |
| Genomsnitt Intel Core i7-13700H (213 - 278, n=29) | |
| MSI Katana 17 B13VFK | |
| Gigabyte G7 KE | |
| Acer Nitro 5 AN515-46-R1A1 | |
| Asus TUF Gaming A16 FA617 | |
| Medion Erazer Scout E20 (Lautlosmodus) | |
| Blender - v2.79 BMW27 CPU | |
| Medion Erazer Scout E20 (Lautlosmodus) | |
| Acer Nitro 5 AN515-46-R1A1 | |
| Genomsnitt Intel Core i7-13700H (169 - 555, n=29) | |
| Gigabyte G7 KE | |
| Asus TUF Gaming A16 FA617 | |
| MSI Katana 17 B13VFK | |
| Medion Erazer Scout E20 | |
| Medion Erazer Scout E20 (Gaming Modus) | |
| Lenovo Legion 5 15IAH7H 82RB | |
| Genomsnitt av klass Gaming (80 - 330, n=110, senaste 2 åren) | |
| 7-Zip 18.03 | |
| 7z b 4 | |
| Genomsnitt av klass Gaming (33491 - 148086, n=111, senaste 2 åren) | |
| Lenovo Legion 5 15IAH7H 82RB | |
| Medion Erazer Scout E20 (Gaming Modus) | |
| Medion Erazer Scout E20 | |
| MSI Katana 17 B13VFK | |
| Acer Nitro 5 AN515-46-R1A1 | |
| Asus TUF Gaming A16 FA617 | |
| Genomsnitt Intel Core i7-13700H (27322 - 76344, n=29) | |
| Gigabyte G7 KE | |
| Medion Erazer Scout E20 (Lautlosmodus) | |
| 7z b 4 -mmt1 | |
| Genomsnitt av klass Gaming (4199 - 7436, n=111, senaste 2 åren) | |
| Medion Erazer Scout E20 | |
| Medion Erazer Scout E20 (Gaming Modus) | |
| Genomsnitt Intel Core i7-13700H (4825 - 6238, n=29) | |
| Lenovo Legion 5 15IAH7H 82RB | |
| Asus TUF Gaming A16 FA617 | |
| MSI Katana 17 B13VFK | |
| Acer Nitro 5 AN515-46-R1A1 | |
| Gigabyte G7 KE | |
| Medion Erazer Scout E20 (Lautlosmodus) | |
| Geekbench 5.5 | |
| Multi-Core | |
| Genomsnitt av klass Gaming (6460 - 27010, n=111, senaste 2 åren) | |
| Lenovo Legion 5 15IAH7H 82RB | |
| Medion Erazer Scout E20 (Gaming Modus) | |
| Medion Erazer Scout E20 | |
| Genomsnitt Intel Core i7-13700H (6165 - 14215, n=29) | |
| MSI Katana 17 B13VFK | |
| Gigabyte G7 KE | |
| Asus TUF Gaming A16 FA617 | |
| Acer Nitro 5 AN515-46-R1A1 | |
| Medion Erazer Scout E20 (Lautlosmodus) | |
| Single-Core | |
| Genomsnitt av klass Gaming (986 - 2474, n=111, senaste 2 åren) | |
| Medion Erazer Scout E20 (Gaming Modus) | |
| Medion Erazer Scout E20 | |
| Genomsnitt Intel Core i7-13700H (1362 - 1919, n=29) | |
| MSI Katana 17 B13VFK | |
| Lenovo Legion 5 15IAH7H 82RB | |
| Gigabyte G7 KE | |
| Medion Erazer Scout E20 (Lautlosmodus) | |
| Asus TUF Gaming A16 FA617 | |
| Acer Nitro 5 AN515-46-R1A1 | |
| HWBOT x265 Benchmark v2.2 - 4k Preset | |
| Genomsnitt av klass Gaming (11.5 - 44.3, n=111, senaste 2 åren) | |
| Lenovo Legion 5 15IAH7H 82RB | |
| Medion Erazer Scout E20 (Gaming Modus) | |
| Asus TUF Gaming A16 FA617 | |
| MSI Katana 17 B13VFK | |
| Medion Erazer Scout E20 | |
| Acer Nitro 5 AN515-46-R1A1 | |
| Gigabyte G7 KE | |
| Genomsnitt Intel Core i7-13700H (6.72 - 21.2, n=29) | |
| Medion Erazer Scout E20 (Lautlosmodus) | |
| LibreOffice - 20 Documents To PDF | |
| Asus TUF Gaming A16 FA617 | |
| MSI Katana 17 B13VFK | |
| Acer Nitro 5 AN515-46-R1A1 | |
| Genomsnitt av klass Gaming (19 - 88.8, n=111, senaste 2 åren) | |
| Genomsnitt Intel Core i7-13700H (31.3 - 62.4, n=29) | |
| Medion Erazer Scout E20 (Lautlosmodus) | |
| Gigabyte G7 KE | |
| Medion Erazer Scout E20 | |
| Medion Erazer Scout E20 (Gaming Modus) | |
| Lenovo Legion 5 15IAH7H 82RB | |
| R Benchmark 2.5 - Overall mean | |
| Medion Erazer Scout E20 (Lautlosmodus) | |
| Asus TUF Gaming A16 FA617 | |
| Acer Nitro 5 AN515-46-R1A1 | |
| Gigabyte G7 KE | |
| Genomsnitt Intel Core i7-13700H (0.4308 - 0.607, n=29) | |
| Lenovo Legion 5 15IAH7H 82RB | |
| Medion Erazer Scout E20 (Gaming Modus) | |
| Medion Erazer Scout E20 | |
| MSI Katana 17 B13VFK | |
| Genomsnitt av klass Gaming (0.3439 - 0.759, n=112, senaste 2 åren) | |
* ... mindre är bättre
AIDA64: FP32 Ray-Trace | FPU Julia | CPU SHA3 | CPU Queen | FPU SinJulia | FPU Mandel | CPU AES | CPU ZLib | FP64 Ray-Trace | CPU PhotoWorxx
| Performance rating | |
| Genomsnitt av klass Gaming | |
| Lenovo Legion 5 15IAH7H 82RB | |
| Acer Nitro 5 AN515-46-R1A1 | |
| Asus TUF Gaming A16 FA617 | |
| Medion Erazer Scout E20 | |
| Medion Erazer Scout E20 | |
| Genomsnitt Intel Core i7-13700H | |
| Gigabyte G7 KE | |
| MSI Katana 17 B13VFK | |
| Medion Erazer Scout E20 | |
| AIDA64 / FP32 Ray-Trace | |
| Genomsnitt av klass Gaming (10227 - 85542, n=110, senaste 2 åren) | |
| Lenovo Legion 5 15IAH7H 82RB (v6.75.6100) | |
| Asus TUF Gaming A16 FA617 (v6.85.6300) | |
| Medion Erazer Scout E20 (v6.75.6100, Gaming Modus) | |
| Acer Nitro 5 AN515-46-R1A1 (v6.75.6100) | |
| Medion Erazer Scout E20 (v6.75.6100) | |
| Genomsnitt Intel Core i7-13700H (4986 - 18908, n=29) | |
| MSI Katana 17 B13VFK (v6.85.6300) | |
| Gigabyte G7 KE (v6.75.6100) | |
| Medion Erazer Scout E20 (v6.75.6100, Lautlosmodus) | |
| AIDA64 / FPU Julia | |
| Genomsnitt av klass Gaming (51376 - 238426, n=110, senaste 2 åren) | |
| Asus TUF Gaming A16 FA617 (v6.85.6300) | |
| Acer Nitro 5 AN515-46-R1A1 (v6.75.6100) | |
| Lenovo Legion 5 15IAH7H 82RB (v6.75.6100) | |
| Medion Erazer Scout E20 (v6.75.6100, Gaming Modus) | |
| Medion Erazer Scout E20 | |
| Genomsnitt Intel Core i7-13700H (25360 - 92359, n=29) | |
| MSI Katana 17 B13VFK (v6.85.6300) | |
| Gigabyte G7 KE (v6.75.6100) | |
| Medion Erazer Scout E20 (v6.75.6100, Lautlosmodus) | |
| AIDA64 / CPU SHA3 | |
| Genomsnitt av klass Gaming (2180 - 9817, n=110, senaste 2 åren) | |
| Lenovo Legion 5 15IAH7H 82RB (v6.75.6100) | |
| Medion Erazer Scout E20 (v6.75.6100, Gaming Modus) | |
| Asus TUF Gaming A16 FA617 (v6.85.6300) | |
| Acer Nitro 5 AN515-46-R1A1 (v6.75.6100) | |
| Gigabyte G7 KE (v6.75.6100) | |
| Medion Erazer Scout E20 (v6.75.6100) | |
| Genomsnitt Intel Core i7-13700H (1339 - 4224, n=29) | |
| MSI Katana 17 B13VFK (v6.85.6300) | |
| Medion Erazer Scout E20 (v6.75.6100, Lautlosmodus) | |
| AIDA64 / CPU Queen | |
| Genomsnitt av klass Gaming (49785 - 173351, n=101, senaste 2 åren) | |
| Medion Erazer Scout E20 (v6.75.6100) | |
| Acer Nitro 5 AN515-46-R1A1 (v6.75.6100) | |
| Medion Erazer Scout E20 (v6.75.6100, Gaming Modus) | |
| Asus TUF Gaming A16 FA617 (v6.85.6300) | |
| Lenovo Legion 5 15IAH7H 82RB (v6.75.6100) | |
| Genomsnitt Intel Core i7-13700H (59324 - 107159, n=29) | |
| Gigabyte G7 KE (v6.75.6100) | |
| MSI Katana 17 B13VFK | |
| Medion Erazer Scout E20 (v6.75.6100, Lautlosmodus) | |
| AIDA64 / FPU SinJulia | |
| Genomsnitt av klass Gaming (4424 - 33636, n=110, senaste 2 åren) | |
| Acer Nitro 5 AN515-46-R1A1 (v6.75.6100) | |
| Asus TUF Gaming A16 FA617 (v6.85.6300) | |
| Medion Erazer Scout E20 (v6.75.6100, Gaming Modus) | |
| Lenovo Legion 5 15IAH7H 82RB (v6.75.6100) | |
| Medion Erazer Scout E20 (v6.75.6100) | |
| Genomsnitt Intel Core i7-13700H (4800 - 11050, n=29) | |
| MSI Katana 17 B13VFK | |
| Gigabyte G7 KE (v6.75.6100) | |
| Medion Erazer Scout E20 (v6.75.6100, Lautlosmodus) | |
| AIDA64 / FPU Mandel | |
| Genomsnitt av klass Gaming (25115 - 128721, n=110, senaste 2 åren) | |
| Acer Nitro 5 AN515-46-R1A1 (v6.75.6100) | |
| Asus TUF Gaming A16 FA617 (v6.85.6300) | |
| Lenovo Legion 5 15IAH7H 82RB (v6.75.6100) | |
| Medion Erazer Scout E20 (v6.75.6100, Gaming Modus) | |
| Medion Erazer Scout E20 (v6.75.6100) | |
| Genomsnitt Intel Core i7-13700H (12321 - 45118, n=29) | |
| MSI Katana 17 B13VFK (v6.85.6300) | |
| Gigabyte G7 KE (v6.75.6100) | |
| Medion Erazer Scout E20 (v6.75.6100, Lautlosmodus) | |
| AIDA64 / CPU AES | |
| Lenovo Legion 5 15IAH7H 82RB (v6.75.6100) | |
| Acer Nitro 5 AN515-46-R1A1 | |
| Gigabyte G7 KE (v6.75.6100) | |
| Genomsnitt av klass Gaming (39258 - 247074, n=110, senaste 2 åren) | |
| Medion Erazer Scout E20 (v6.75.6100, Gaming Modus) | |
| Genomsnitt Intel Core i7-13700H (28769 - 151254, n=29) | |
| Medion Erazer Scout E20 (v6.75.6100) | |
| Asus TUF Gaming A16 FA617 (v6.85.6300) | |
| MSI Katana 17 B13VFK (v6.85.6300) | |
| Medion Erazer Scout E20 (v6.75.6100, Lautlosmodus) | |
| AIDA64 / CPU ZLib | |
| Genomsnitt av klass Gaming (574 - 2531, n=110, senaste 2 åren) | |
| Lenovo Legion 5 15IAH7H 82RB (v6.75.6100) | |
| Medion Erazer Scout E20 (v6.75.6100, Gaming Modus) | |
| Medion Erazer Scout E20 (v6.75.6100) | |
| Genomsnitt Intel Core i7-13700H (389 - 1215, n=29) | |
| Gigabyte G7 KE (v6.75.6100) | |
| Asus TUF Gaming A16 FA617 (v6.85.6300) | |
| Acer Nitro 5 AN515-46-R1A1 (v6.75.6100) | |
| MSI Katana 17 B13VFK (v6.85.6300) | |
| Medion Erazer Scout E20 (v6.75.6100, Lautlosmodus) | |
| AIDA64 / FP64 Ray-Trace | |
| Genomsnitt av klass Gaming (5509 - 45446, n=110, senaste 2 åren) | |
| Lenovo Legion 5 15IAH7H 82RB (v6.75.6100) | |
| Asus TUF Gaming A16 FA617 (v6.85.6300) | |
| Medion Erazer Scout E20 (v6.75.6100, Gaming Modus) | |
| Acer Nitro 5 AN515-46-R1A1 (v6.75.6100) | |
| Medion Erazer Scout E20 (v6.75.6100) | |
| Genomsnitt Intel Core i7-13700H (2540 - 10135, n=29) | |
| MSI Katana 17 B13VFK (v6.85.6300) | |
| Gigabyte G7 KE (v6.75.6100) | |
| Medion Erazer Scout E20 (v6.75.6100, Lautlosmodus) | |
| AIDA64 / CPU PhotoWorxx | |
| Genomsnitt av klass Gaming (12271 - 89891, n=110, senaste 2 åren) | |
| Genomsnitt Intel Core i7-13700H (12872 - 52727, n=29) | |
| Medion Erazer Scout E20 (v6.75.6100, Gaming Modus) | |
| Medion Erazer Scout E20 (v6.75.6100) | |
| Lenovo Legion 5 15IAH7H 82RB (v6.75.6100) | |
| MSI Katana 17 B13VFK (v6.85.6300) | |
| Medion Erazer Scout E20 (v6.75.6100, Lautlosmodus) | |
| Gigabyte G7 KE (v6.75.6100) | |
| Acer Nitro 5 AN515-46-R1A1 | |
| Asus TUF Gaming A16 FA617 (v6.85.6300) | |
Systemets prestanda
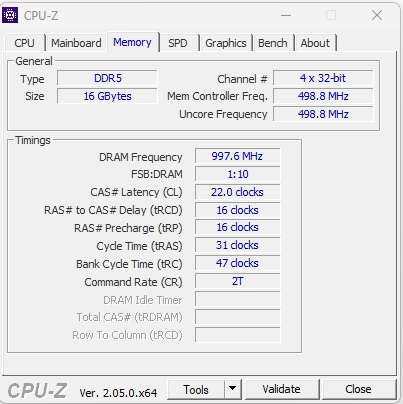
Det smidigt fungerande systemet erbjuder tillräcklig prestanda för krävande uppgifter som rendering och spel, vilket också bekräftas av de goda PCMark-resultaten. Överföringshastigheterna för arbetsminnet ligger på normala nivåer för DDR5-4800-lagring.
CrossMark: Overall | Productivity | Creativity | Responsiveness
| PCMark 10 / Score | |
| Genomsnitt av klass Gaming (5828 - 11574, n=96, senaste 2 åren) | |
| Lenovo Legion 5 15IAH7H 82RB | |
| Medion Erazer Scout E20 | |
| Asus TUF Gaming A16 FA617 | |
| Genomsnitt Intel Core i7-13700H, NVIDIA GeForce RTX 4050 Laptop GPU (6822 - 7556, n=7) | |
| MSI Katana 17 B13VFK | |
| Acer Nitro 5 AN515-46-R1A1 | |
| Gigabyte G7 KE | |
| PCMark 10 / Essentials | |
| Lenovo Legion 5 15IAH7H 82RB | |
| Medion Erazer Scout E20 | |
| Genomsnitt Intel Core i7-13700H, NVIDIA GeForce RTX 4050 Laptop GPU (10283 - 11549, n=7) | |
| MSI Katana 17 B13VFK | |
| Genomsnitt av klass Gaming (8810 - 12600, n=100, senaste 2 åren) | |
| Asus TUF Gaming A16 FA617 | |
| Acer Nitro 5 AN515-46-R1A1 | |
| Gigabyte G7 KE | |
| PCMark 10 / Productivity | |
| Genomsnitt av klass Gaming (6845 - 18766, n=98, senaste 2 åren) | |
| Lenovo Legion 5 15IAH7H 82RB | |
| Medion Erazer Scout E20 | |
| Asus TUF Gaming A16 FA617 | |
| MSI Katana 17 B13VFK | |
| Genomsnitt Intel Core i7-13700H, NVIDIA GeForce RTX 4050 Laptop GPU (8368 - 9836, n=7) | |
| Gigabyte G7 KE | |
| Acer Nitro 5 AN515-46-R1A1 | |
| PCMark 10 / Digital Content Creation | |
| Genomsnitt av klass Gaming (7602 - 19657, n=98, senaste 2 åren) | |
| Lenovo Legion 5 15IAH7H 82RB | |
| Asus TUF Gaming A16 FA617 | |
| Medion Erazer Scout E20 | |
| Genomsnitt Intel Core i7-13700H, NVIDIA GeForce RTX 4050 Laptop GPU (9527 - 10643, n=7) | |
| MSI Katana 17 B13VFK | |
| Acer Nitro 5 AN515-46-R1A1 | |
| Gigabyte G7 KE | |
| CrossMark / Overall | |
| Lenovo Legion 5 15IAH7H 82RB | |
| Genomsnitt av klass Gaming (1366 - 2409, n=98, senaste 2 åren) | |
| Medion Erazer Scout E20 | |
| MSI Katana 17 B13VFK | |
| Gigabyte G7 KE | |
| Genomsnitt Intel Core i7-13700H, NVIDIA GeForce RTX 4050 Laptop GPU (1205 - 1937, n=9) | |
| Acer Nitro 5 AN515-46-R1A1 | |
| CrossMark / Productivity | |
| Lenovo Legion 5 15IAH7H 82RB | |
| Medion Erazer Scout E20 | |
| Genomsnitt av klass Gaming (1386 - 2254, n=98, senaste 2 åren) | |
| Gigabyte G7 KE | |
| MSI Katana 17 B13VFK | |
| Genomsnitt Intel Core i7-13700H, NVIDIA GeForce RTX 4050 Laptop GPU (1158 - 1877, n=9) | |
| Acer Nitro 5 AN515-46-R1A1 | |
| CrossMark / Creativity | |
| Genomsnitt av klass Gaming (1343 - 2729, n=98, senaste 2 åren) | |
| Medion Erazer Scout E20 | |
| Lenovo Legion 5 15IAH7H 82RB | |
| MSI Katana 17 B13VFK | |
| Genomsnitt Intel Core i7-13700H, NVIDIA GeForce RTX 4050 Laptop GPU (1293 - 2044, n=9) | |
| Gigabyte G7 KE | |
| Acer Nitro 5 AN515-46-R1A1 | |
| CrossMark / Responsiveness | |
| Lenovo Legion 5 15IAH7H 82RB | |
| Gigabyte G7 KE | |
| Medion Erazer Scout E20 | |
| MSI Katana 17 B13VFK | |
| Genomsnitt av klass Gaming (1226 - 2334, n=98, senaste 2 åren) | |
| Genomsnitt Intel Core i7-13700H, NVIDIA GeForce RTX 4050 Laptop GPU (1097 - 1929, n=9) | |
| Acer Nitro 5 AN515-46-R1A1 | |
| PCMark 8 Home Score Accelerated v2 | 5486 poäng | |
| PCMark 8 Work Score Accelerated v2 | 6205 poäng | |
| PCMark 10 Score | 7556 poäng | |
Hjälp | ||
| AIDA64 / Memory Copy | |
| Genomsnitt av klass Gaming (21750 - 129946, n=110, senaste 2 åren) | |
| Genomsnitt Intel Core i7-13700H (24334 - 78081, n=29) | |
| Medion Erazer Scout E20 | |
| MSI Katana 17 B13VFK | |
| Lenovo Legion 5 15IAH7H 82RB | |
| Acer Nitro 5 AN515-46-R1A1 | |
| Asus TUF Gaming A16 FA617 | |
| Gigabyte G7 KE | |
| AIDA64 / Memory Read | |
| Genomsnitt av klass Gaming (22956 - 118858, n=110, senaste 2 åren) | |
| Medion Erazer Scout E20 | |
| Genomsnitt Intel Core i7-13700H (23681 - 79656, n=29) | |
| MSI Katana 17 B13VFK | |
| Lenovo Legion 5 15IAH7H 82RB | |
| Acer Nitro 5 AN515-46-R1A1 | |
| Asus TUF Gaming A16 FA617 | |
| Gigabyte G7 KE | |
| AIDA64 / Memory Write | |
| Genomsnitt av klass Gaming (22297 - 135096, n=110, senaste 2 åren) | |
| Genomsnitt Intel Core i7-13700H (22986 - 99898, n=29) | |
| Medion Erazer Scout E20 | |
| Lenovo Legion 5 15IAH7H 82RB | |
| Acer Nitro 5 AN515-46-R1A1 | |
| Asus TUF Gaming A16 FA617 | |
| MSI Katana 17 B13VFK | |
| Gigabyte G7 KE | |
| AIDA64 / Memory Latency | |
| Genomsnitt av klass Gaming (75.3 - 259, n=110, senaste 2 åren) | |
| MSI Katana 17 B13VFK | |
| Medion Erazer Scout E20 | |
| Lenovo Legion 5 15IAH7H 82RB | |
| Genomsnitt Intel Core i7-13700H (82.4 - 136.8, n=29) | |
| Gigabyte G7 KE | |
| Acer Nitro 5 AN515-46-R1A1 | |
| Asus TUF Gaming A16 FA617 | |
* ... mindre är bättre
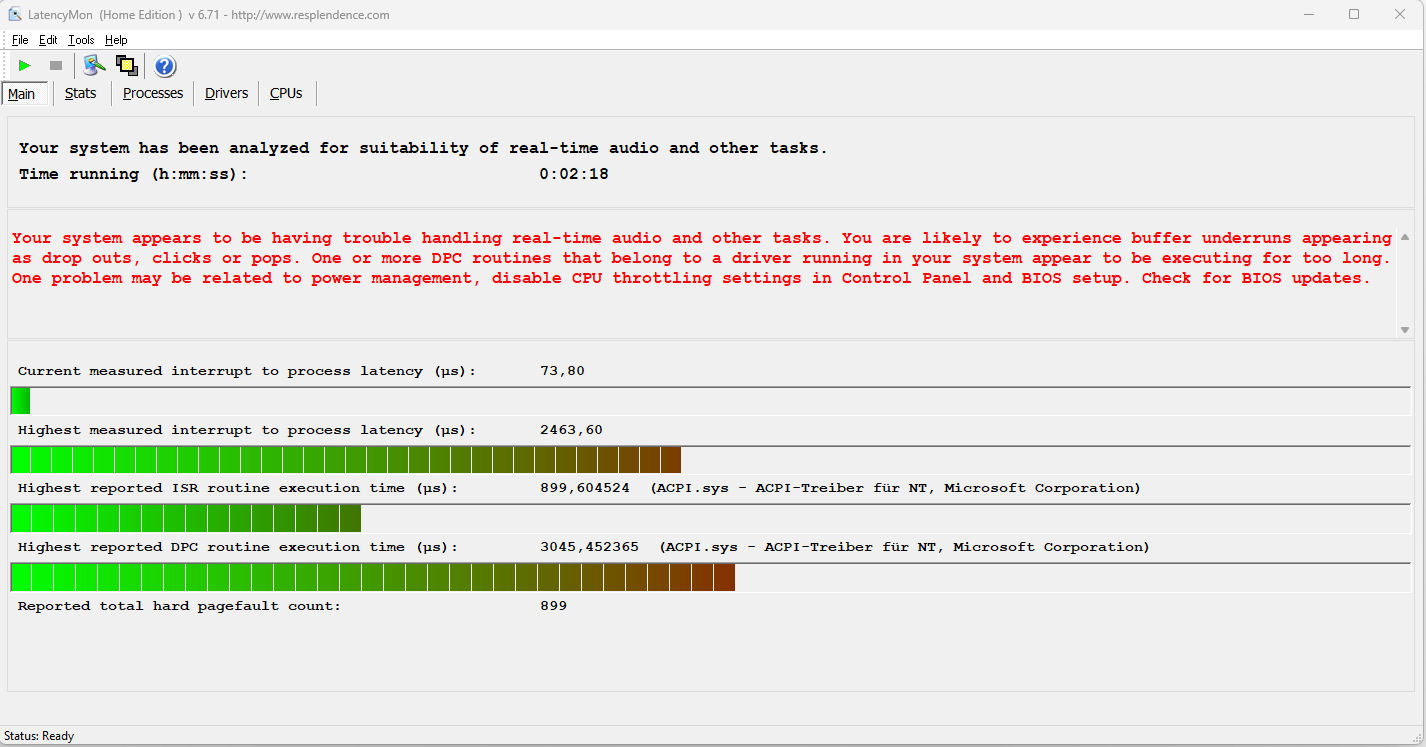
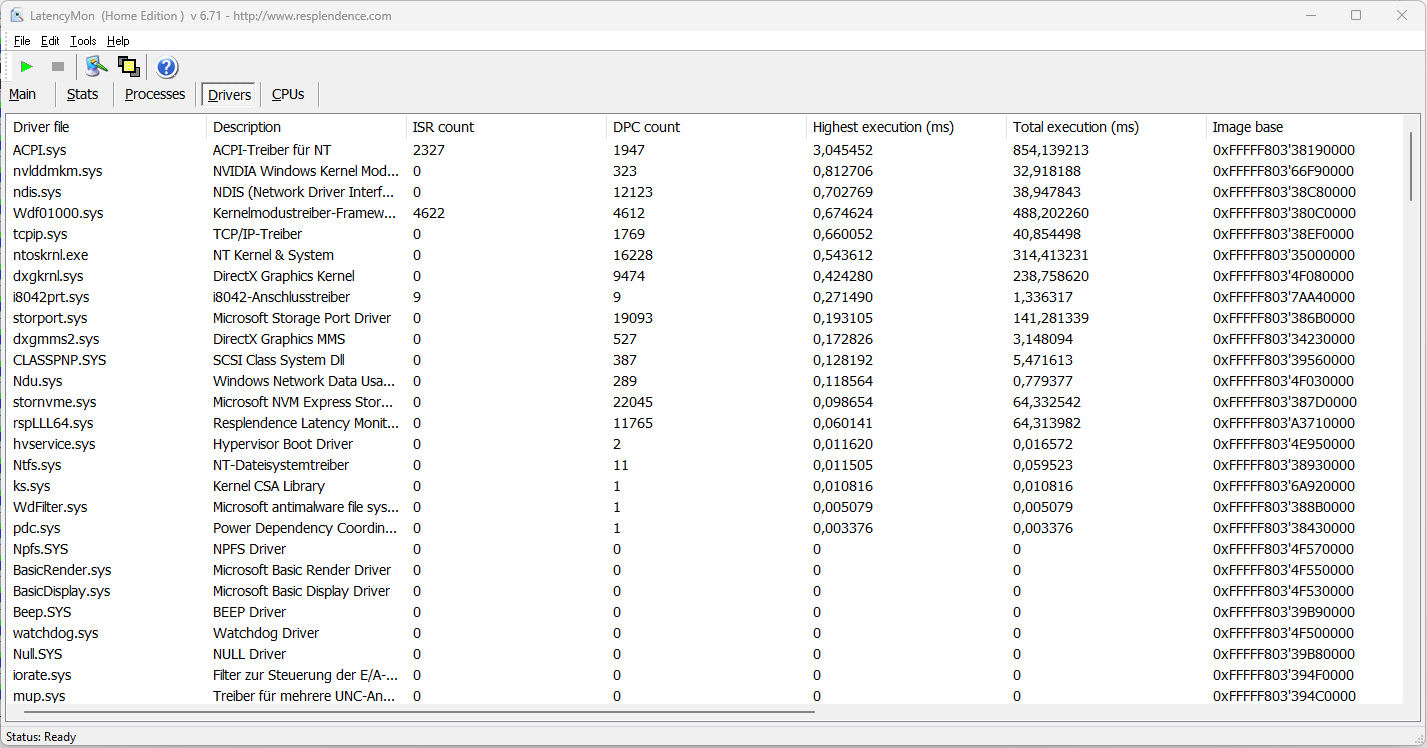
DPC-latenstider
Det standardiserade Latency Monitor-testet (med webbsurfning, 4k-videoåtergivning och Prime95 hög belastning) avslöjar några tydliga fördröjningar. Systemet verkar inte vara lämpat för video- och ljudbearbetning i realtid. Framtida mjukvaruuppdateringar kan ge vissa förbättringar eller till och med förvärra situationen.
| DPC Latencies / LatencyMon - interrupt to process latency (max), Web, Youtube, Prime95 | |
| Acer Nitro 5 AN515-46-R1A1 | |
| Medion Erazer Scout E20 | |
| MSI Katana 17 B13VFK | |
| Gigabyte G7 KE | |
| Lenovo Legion 5 15IAH7H 82RB | |
| Asus TUF Gaming A16 FA617 | |
* ... mindre är bättre
Lagringslösning
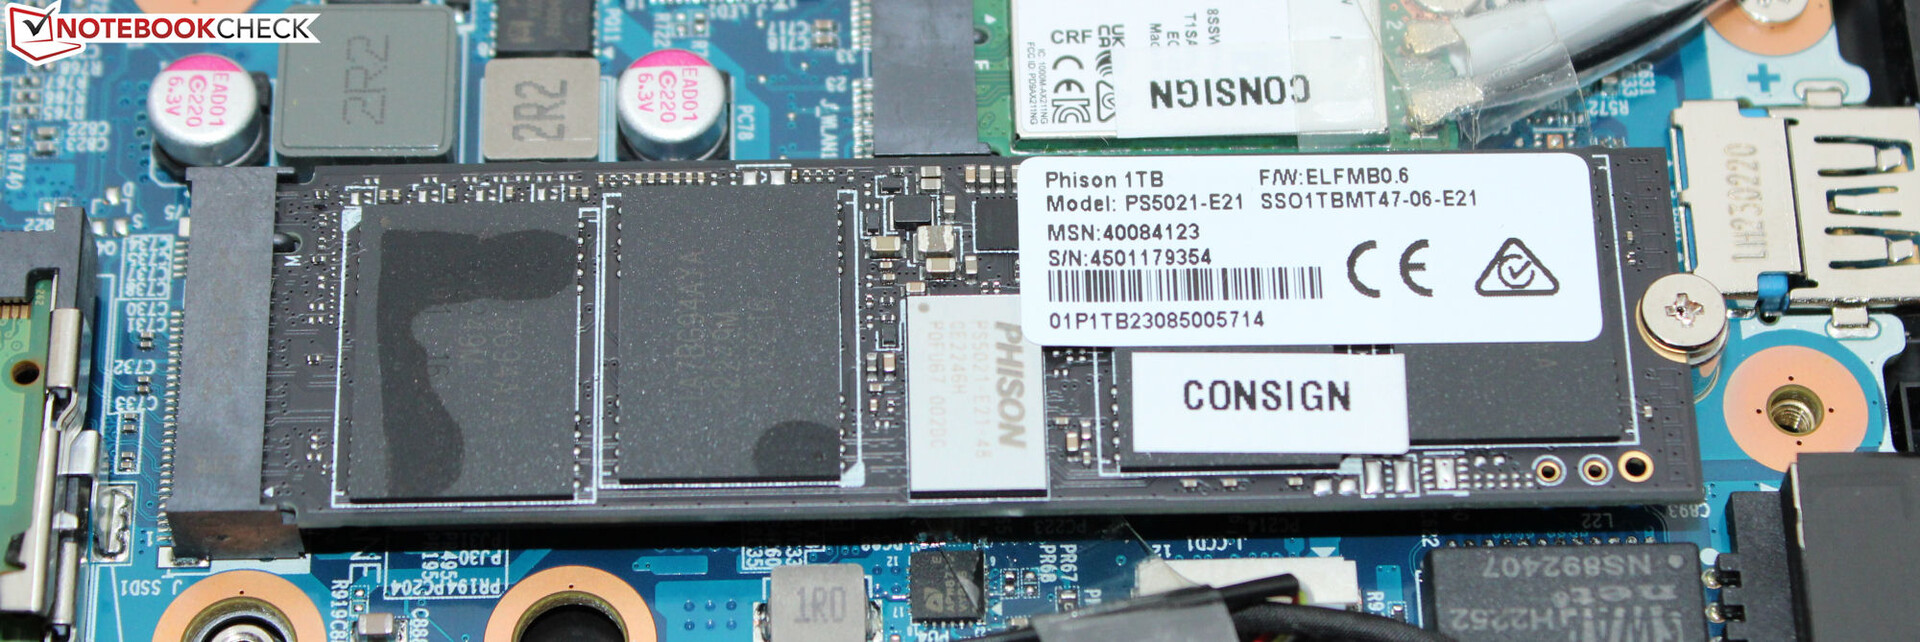
En 1 TB PCIe 4 SSD i M.2-2280-format från Phison fungerar som systemenhet. Även om den levererar mycket bra överföringshastigheter är den inte en av toppmodellerna bland SSD-diskarna. Det finns inga prestandaförluster på grund av termisk strypning.
Enligt Medions webbplats kan du utöka den bärbara datorns lagringsutrymme genom att använda ett 2,5-tums lagringsmedium, men vår testenhet innehåller varken de nödvändiga SATA-platserna eller insättningsramen.

* ... mindre är bättre
Disk Throttling: DiskSpd Read Loop, Queue Depth 8
Grafikkort
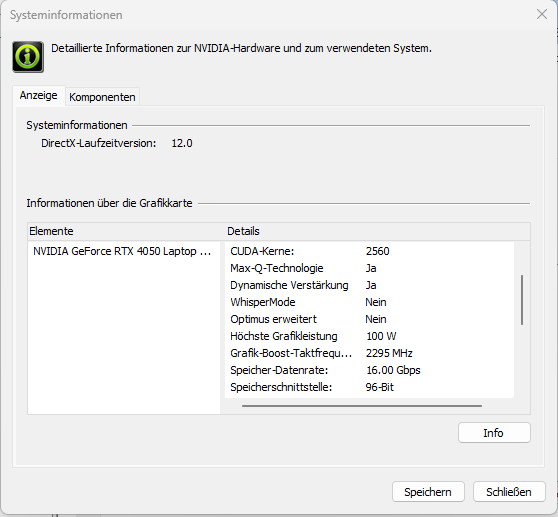
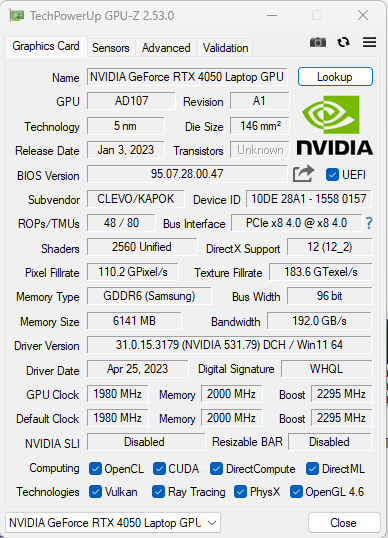
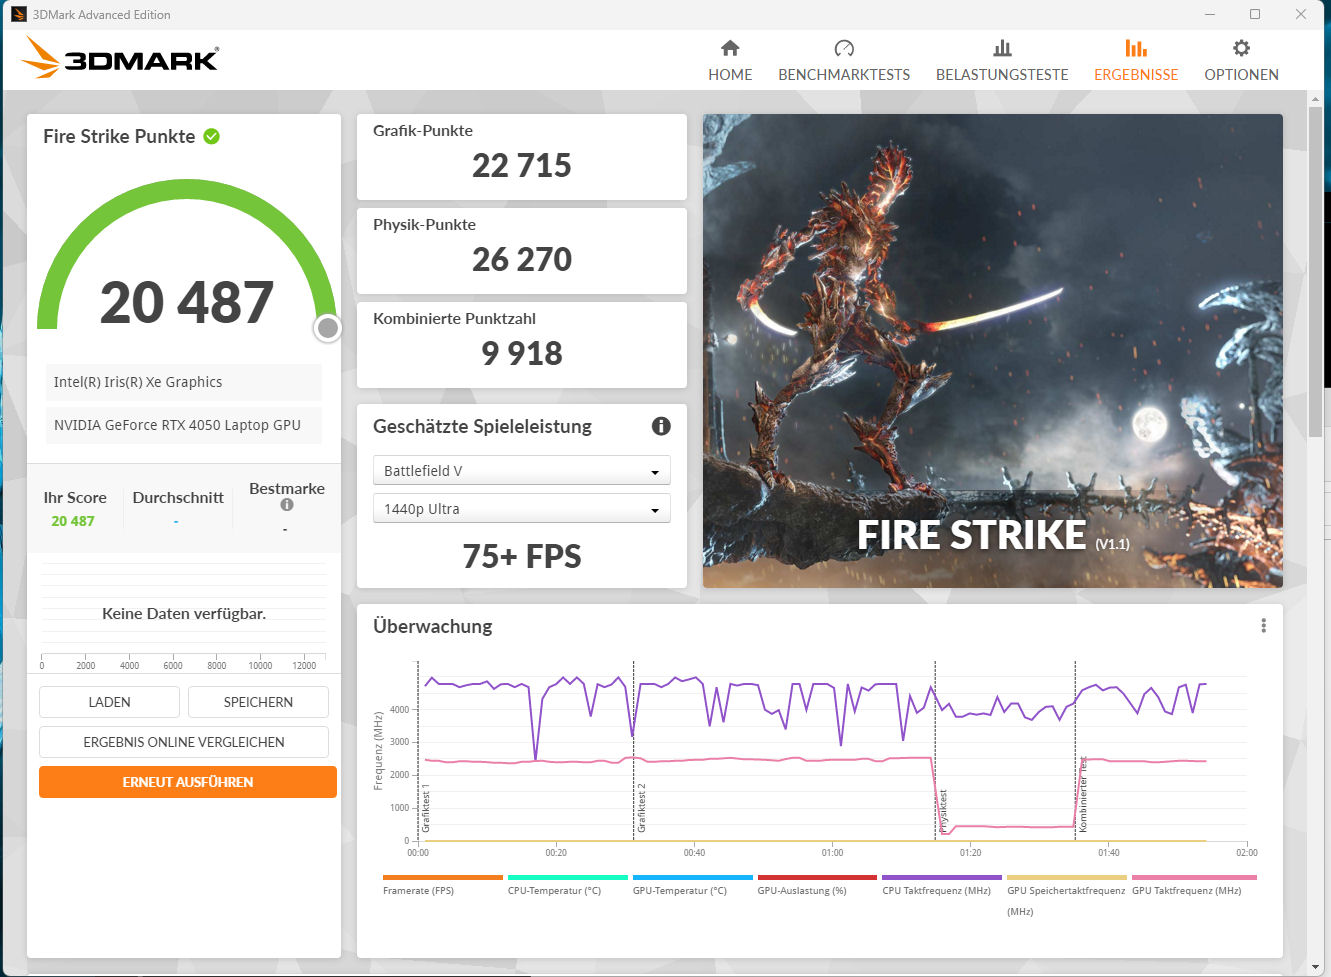
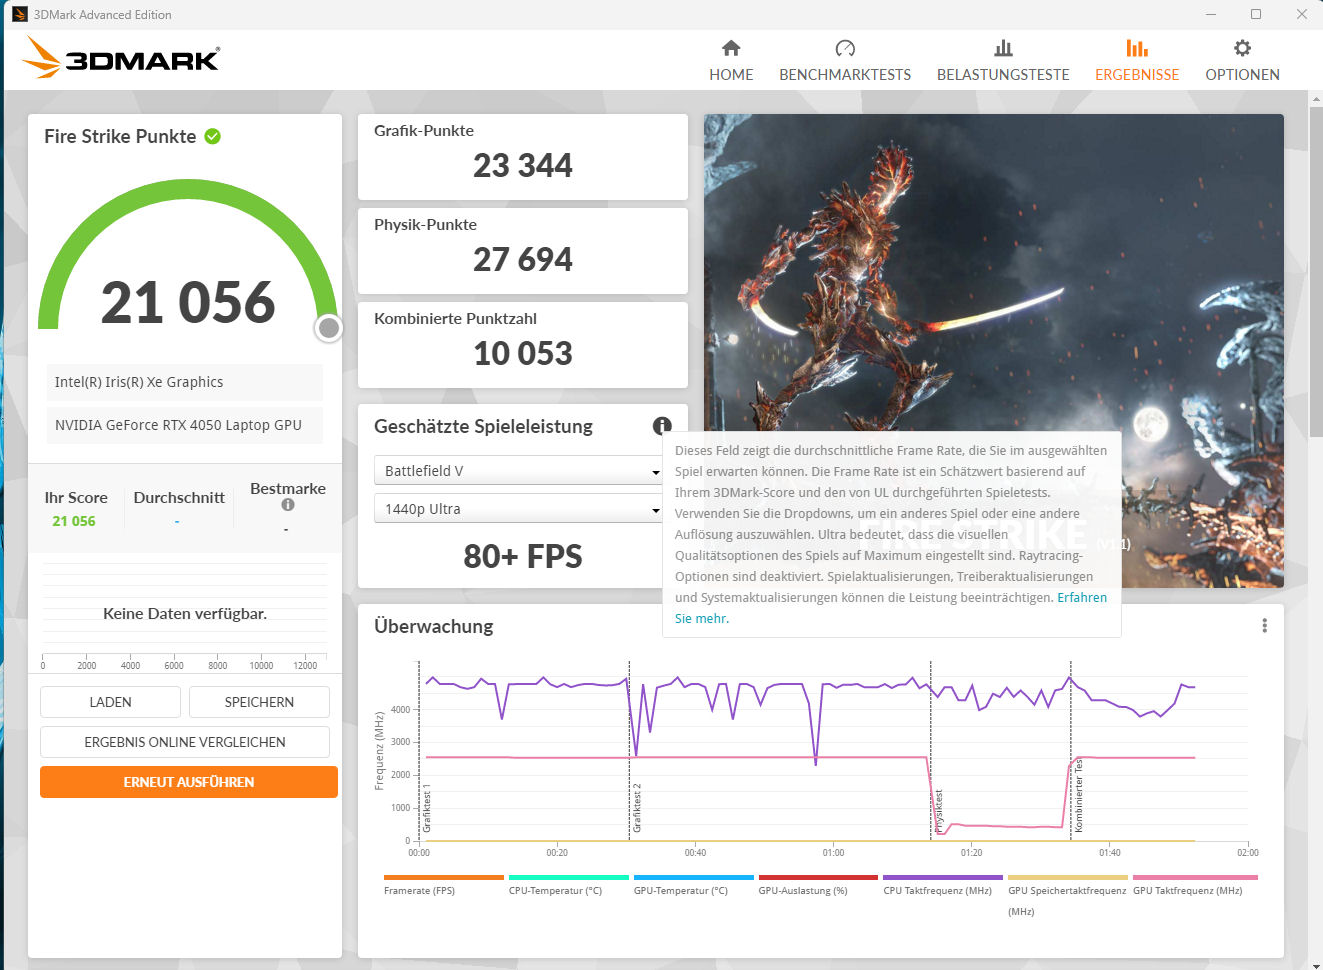
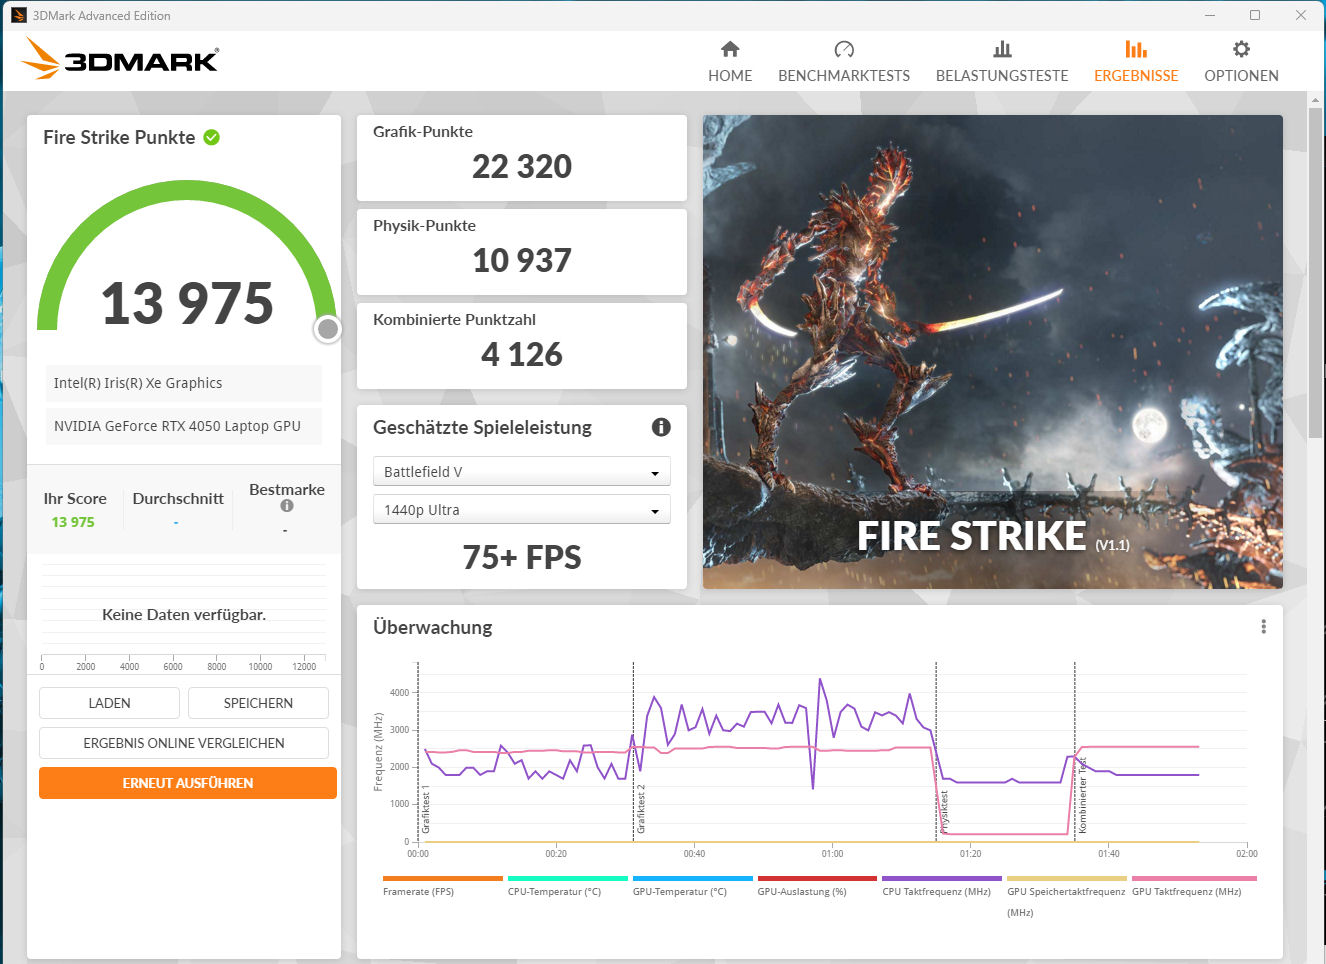
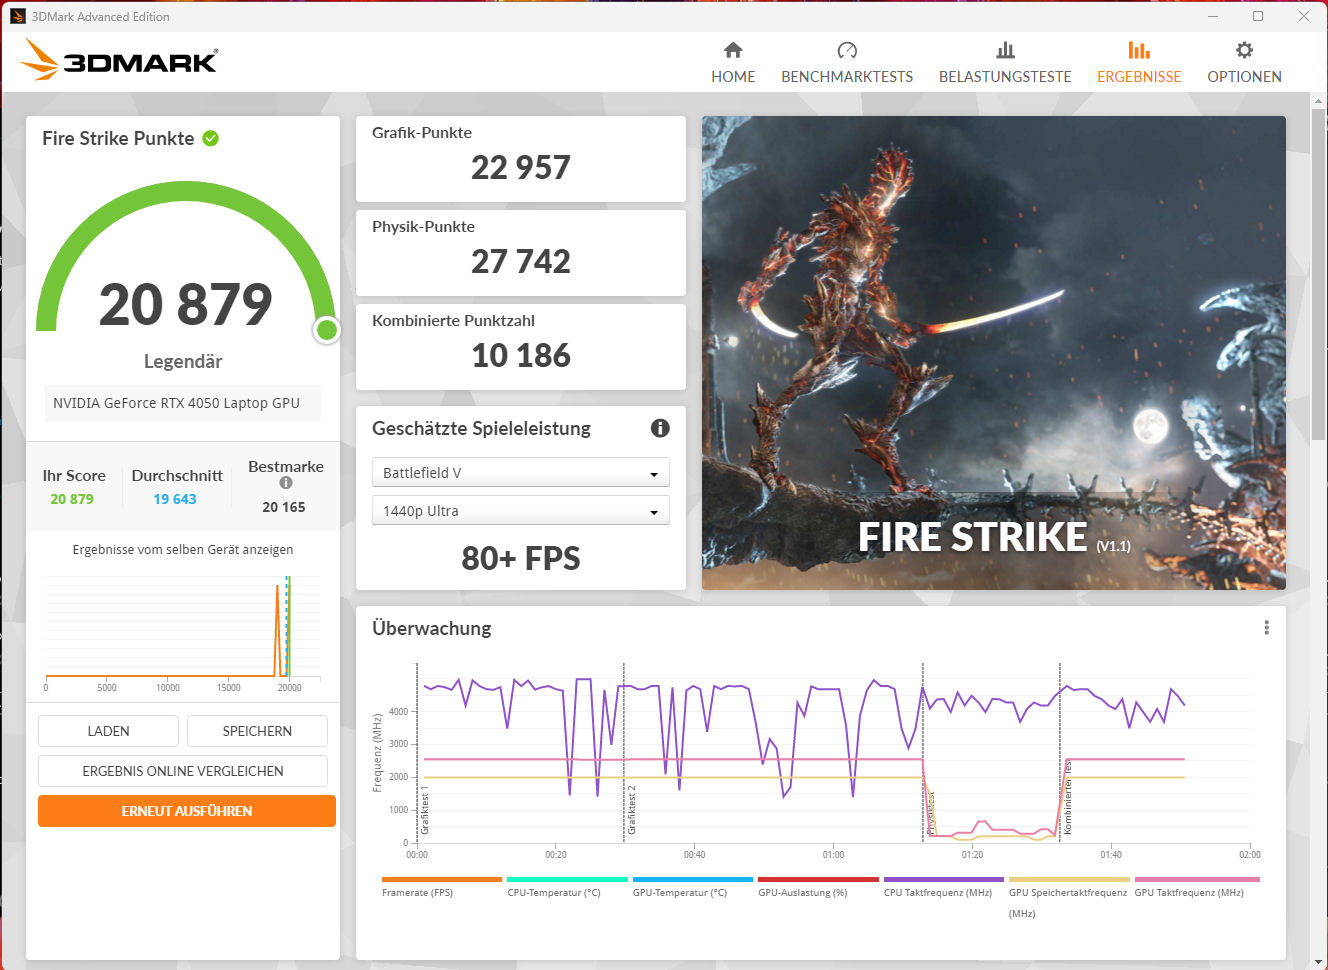
TheGeForce RTX 4050gPU för bärbara datorer har 2 560 shaders, en 96-bitars buss och 6 144 MB snabb GDDR6-lagring. Medion tillåter den en maximal TGP på 100 watt. Enligt vårt test The Witcher 3 används den maximala TGP inte fullt ut.
Benchmarkresultaten ligger över genomsnittet för RTX 4050. Underhållningslägena och spellägena ger nästan samma grafikprestanda. Den direkta bildutgången via GeForce GPU ger ingen prestandaökning. Växling mellan Optimus- och dGPU-läget sker i BIOS eller via Control Center. Avancerad Optimus stöds inte.
| 3DMark Performance rating - Percent | |
| Genomsnitt av klass Gaming | |
| MSI Katana 17 B13VFK | |
| Acer Nitro 5 AN515-46-R1A1 | |
| Asus TUF Gaming A16 FA617 | |
| Medion Erazer Scout E20 | |
| Medion Erazer Scout E20 | |
| Lenovo Legion 5 15IAH7H 82RB -1! | |
| Genomsnitt NVIDIA GeForce RTX 4050 Laptop GPU | |
| Medion Erazer Scout E20 | |
| Gigabyte G7 KE | |
| 3DMark 11 - 1280x720 Performance GPU | |
| Genomsnitt av klass Gaming (21841 - 80022, n=109, senaste 2 åren) | |
| Acer Nitro 5 AN515-46-R1A1 | |
| MSI Katana 17 B13VFK | |
| Asus TUF Gaming A16 FA617 | |
| Medion Erazer Scout E20 (Gaming Performance) | |
| Lenovo Legion 5 15IAH7H 82RB | |
| Medion Erazer Scout E20 | |
| Medion Erazer Scout E20 (Lautlosmodus) | |
| Gigabyte G7 KE | |
| Genomsnitt NVIDIA GeForce RTX 4050 Laptop GPU (13339 - 32642, n=41) | |
| 3DMark 06 Standard Score | 51372 poäng | |
| 3DMark 11 Performance | 27315 poäng | |
| 3DMark Cloud Gate Standard Score | 52998 poäng | |
| 3DMark Fire Strike Score | 20487 poäng | |
| 3DMark Time Spy Score | 8594 poäng | |
Hjälp | ||
| Blender | |
| v3.3 Classroom OPTIX/RTX | |
| Gigabyte G7 KE (3.3.2) | |
| Lenovo Legion 5 15IAH7H 82RB (3.3.0) | |
| Medion Erazer Scout E20 (3.3.3) | |
| Medion Erazer Scout E20 (3.3.3, Lautlosmodus) | |
| Genomsnitt NVIDIA GeForce RTX 4050 Laptop GPU (25 - 37, n=40) | |
| Medion Erazer Scout E20 (3.3.3, Gaming Modus) | |
| Acer Nitro 5 AN515-46-R1A1 (3.3.0) | |
| MSI Katana 17 B13VFK (3.3.3) | |
| Genomsnitt av klass Gaming (9 - 32, n=112, senaste 2 åren) | |
| v3.3 Classroom CUDA | |
| Genomsnitt NVIDIA GeForce RTX 4050 Laptop GPU (47 - 68, n=39) | |
| Gigabyte G7 KE (3.3.2) | |
| Medion Erazer Scout E20 (3.3.3) | |
| Medion Erazer Scout E20 (3.3.3, Lautlosmodus) | |
| Lenovo Legion 5 15IAH7H 82RB (3.3.0) | |
| Medion Erazer Scout E20 (3.3.3, Gaming Modus) | |
| MSI Katana 17 B13VFK (3.3.3) | |
| Acer Nitro 5 AN515-46-R1A1 (3.3.0) | |
| Genomsnitt av klass Gaming (15 - 228, n=112, senaste 2 åren) | |
| Geekbench 5.5 - OpenCL Score | |
| Genomsnitt av klass Gaming (80702 - 277970, n=108, senaste 2 åren) | |
| Acer Nitro 5 AN515-46-R1A1 | |
| Gigabyte G7 KE | |
| Lenovo Legion 5 15IAH7H 82RB | |
| MSI Katana 17 B13VFK | |
| Medion Erazer Scout E20 (Gaming Modus) | |
| Medion Erazer Scout E20 (Lautlosmodus) | |
| Medion Erazer Scout E20 | |
| Genomsnitt NVIDIA GeForce RTX 4050 Laptop GPU (63538 - 90075, n=38) | |
| Asus TUF Gaming A16 FA617 | |
| Geekbench 6.0 - GPU OpenCL 6.0 | |
| Genomsnitt av klass Gaming (87350 - 192027, n=4, senaste 2 åren) | |
| Medion Erazer Scout E20 | |
| Genomsnitt NVIDIA GeForce RTX 4050 Laptop GPU (66574 - 84452, n=13) | |
| V-Ray 5 Benchmark | |
| GPU RTX | |
| Genomsnitt av klass Gaming (1146 - 4363, n=38, senaste 2 åren) | |
| Acer Nitro 5 AN515-46-R1A1 (5.0.1) | |
| Medion Erazer Scout E20 (5.0.1, Gaming Modus) | |
| Medion Erazer Scout E20 (5.0.1) | |
| Genomsnitt NVIDIA GeForce RTX 4050 Laptop GPU (618 - 1588, n=24) | |
| Medion Erazer Scout E20 (5.0.1, Lautlosmodus) | |
| Gigabyte G7 KE (5.0.1) | |
| GPU CUDA | |
| Genomsnitt av klass Gaming (887 - 3288, n=38, senaste 2 åren) | |
| Acer Nitro 5 AN515-46-R1A1 (5.0.1) | |
| Medion Erazer Scout E20 (5.0.1, Gaming Modus) | |
| Medion Erazer Scout E20 (5.0.1, Lautlosmodus) | |
| Medion Erazer Scout E20 (5.0.1) | |
| Genomsnitt NVIDIA GeForce RTX 4050 Laptop GPU (735 - 1202, n=24) | |
| Gigabyte G7 KE (5.0.1) | |
| CPU | |
| Genomsnitt av klass Gaming (5864 - 30302, n=37, senaste 2 åren) | |
| Lenovo Legion 5 15IAH7H 82RB (5.0.1) | |
| Medion Erazer Scout E20 (5.0.1, Gaming Modus) | |
| Genomsnitt NVIDIA GeForce RTX 4050 Laptop GPU (3562 - 14401, n=24) | |
| Medion Erazer Scout E20 (5.0.1) | |
| Acer Nitro 5 AN515-46-R1A1 (5.0.1) | |
| Gigabyte G7 KE (5.0.1) | |
| Medion Erazer Scout E20 (5.0.1, Lautlosmodus) | |
| V-Ray Benchmark Next 4.10 | |
| GPU | |
| Genomsnitt av klass Gaming (427 - 1333, n=106, senaste 2 åren) | |
| MSI Katana 17 B13VFK (v4.10.07 ) | |
| Acer Nitro 5 AN515-46-R1A1 (v4.10.07 ) | |
| Medion Erazer Scout E20 (v4.10.07, Gaming Modus) | |
| Medion Erazer Scout E20 (v4.10.07, Lautlosmodus) | |
| Medion Erazer Scout E20 (v4.10.07 ) | |
| Genomsnitt NVIDIA GeForce RTX 4050 Laptop GPU (333 - 565, n=35) | |
| Gigabyte G7 KE (v4.10.07 ) | |
| Asus TUF Gaming A16 FA617 (v4.10.07 ) | |
| CPU | |
| Genomsnitt av klass Gaming (10048 - 45327, n=105, senaste 2 åren) | |
| Medion Erazer Scout E20 (v4.10.07, Gaming Modus) | |
| MSI Katana 17 B13VFK (v4.10.07 ) | |
| Medion Erazer Scout E20 (v4.10.07 ) | |
| Genomsnitt NVIDIA GeForce RTX 4050 Laptop GPU (5413 - 24181, n=35) | |
| Asus TUF Gaming A16 FA617 (v4.10.07 ) | |
| Gigabyte G7 KE (v4.10.07 ) | |
| Acer Nitro 5 AN515-46-R1A1 (v4.10.07 ) | |
| Medion Erazer Scout E20 (v4.10.07, Lautlosmodus) | |
* ... mindre är bättre
Spelprestanda
Scout är inställd för FHD-spel med höga till maximala inställningar. "Silent mode" gör det möjligt att spela med låg ljudnivå, men du bör sänka din upplösning och dina inställningar i enlighet med detta. Den bärbara datorn når bildfrekvenser över (spelläge, underhållningsläge) och under (tyst läge) det genomsnitt vi hittills fastställt för RTX 4050. Beroende på spelet kan den direkta bildutgången via GeForce GPU leda till en minimal ökning av bildfrekvensen.
| Performance rating - Percent | |
| Genomsnitt av klass Gaming | |
| MSI Katana 17 B13VFK | |
| Lenovo Legion 5 15IAH7H 82RB | |
| Medion Erazer Scout E20 | |
| Medion Erazer Scout E20 | |
| Acer Nitro 5 AN515-46-R1A1 | |
| Gigabyte G7 KE | |
| Genomsnitt NVIDIA GeForce RTX 4050 Laptop GPU | |
| Asus TUF Gaming A16 FA617 | |
| Medion Erazer Scout E20 | |
| The Witcher 3 - 1920x1080 Ultra Graphics & Postprocessing (HBAO+) | |
| Genomsnitt av klass Gaming (95 - 240, n=8, senaste 2 åren) | |
| Acer Nitro 5 AN515-46-R1A1 | |
| MSI Katana 17 B13VFK | |
| Asus TUF Gaming A16 FA617 | |
| Lenovo Legion 5 15IAH7H 82RB | |
| Medion Erazer Scout E20 (Gaming Modus) | |
| Medion Erazer Scout E20 | |
| Gigabyte G7 KE | |
| Medion Erazer Scout E20 (Lautlosmodus) | |
| Genomsnitt NVIDIA GeForce RTX 4050 Laptop GPU (18.5 - 94.7, n=40) | |
| GTA V - 1920x1080 Highest AA:4xMSAA + FX AF:16x | |
| Genomsnitt av klass Gaming (48.3 - 186.9, n=103, senaste 2 åren) | |
| MSI Katana 17 B13VFK | |
| Lenovo Legion 5 15IAH7H 82RB | |
| Gigabyte G7 KE | |
| Medion Erazer Scout E20 (Gaming Modus) | |
| Medion Erazer Scout E20 | |
| Acer Nitro 5 AN515-46-R1A1 | |
| Asus TUF Gaming A16 FA617 | |
| Genomsnitt NVIDIA GeForce RTX 4050 Laptop GPU (14.9 - 101.7, n=35) | |
| Medion Erazer Scout E20 (Lautlosmodus) | |
| Final Fantasy XV Benchmark - 1920x1080 High Quality | |
| Genomsnitt av klass Gaming (41 - 215, n=104, senaste 2 åren) | |
| Acer Nitro 5 AN515-46-R1A1 (1.3) | |
| Lenovo Legion 5 15IAH7H 82RB (1.3) | |
| MSI Katana 17 B13VFK (1.3) | |
| Gigabyte G7 KE (1.3) | |
| Medion Erazer Scout E20 (1.3) | |
| Medion Erazer Scout E20 (1.3, Gaming Modus) | |
| Asus TUF Gaming A16 FA617 (1.3) | |
| Genomsnitt NVIDIA GeForce RTX 4050 Laptop GPU (15.5 - 122.3, n=39) | |
| Medion Erazer Scout E20 (1.3, Lautlosmodus) | |
| Strange Brigade - 1920x1080 ultra AA:ultra AF:16 | |
| Genomsnitt av klass Gaming (76.3 - 456, n=94, senaste 2 åren) | |
| MSI Katana 17 B13VFK (1.47.22.14 D3D12) | |
| Acer Nitro 5 AN515-46-R1A1 (1.47.22.14 D3D12) | |
| Lenovo Legion 5 15IAH7H 82RB (1.47.22.14 D3D12) | |
| Asus TUF Gaming A16 FA617 (1.47.22.14 D3D12) | |
| Medion Erazer Scout E20 (1.47.22.14 D3D12, Gaming Modus) | |
| Gigabyte G7 KE (1.47.22.14 D3D12) | |
| Medion Erazer Scout E20 (1.47.22.14 D3D12) | |
| Medion Erazer Scout E20 (1.47.22.14 D3D12, Lautlosmodus) | |
| Genomsnitt NVIDIA GeForce RTX 4050 Laptop GPU (21.2 - 156.6, n=38) | |
| Dota 2 Reborn - 1920x1080 ultra (3/3) best looking | |
| MSI Katana 17 B13VFK | |
| Lenovo Legion 5 15IAH7H 82RB | |
| Genomsnitt av klass Gaming (84.8 - 248, n=113, senaste 2 åren) | |
| Medion Erazer Scout E20 (Gaming Modus) | |
| Medion Erazer Scout E20 | |
| Gigabyte G7 KE | |
| Genomsnitt NVIDIA GeForce RTX 4050 Laptop GPU (73.5 - 175.6, n=39) | |
| Asus TUF Gaming A16 FA617 | |
| Acer Nitro 5 AN515-46-R1A1 | |
| Medion Erazer Scout E20 (Lautlosmodus) | |
| X-Plane 11.11 - 1920x1080 high (fps_test=3) | |
| MSI Katana 17 B13VFK | |
| Medion Erazer Scout E20 (Gaming Modus) | |
| Lenovo Legion 5 15IAH7H 82RB | |
| Medion Erazer Scout E20 | |
| Genomsnitt av klass Gaming (52.1 - 143.5, n=116, senaste 2 åren) | |
| Genomsnitt NVIDIA GeForce RTX 4050 Laptop GPU (55.5 - 117, n=40) | |
| Gigabyte G7 KE | |
| Acer Nitro 5 AN515-46-R1A1 | |
| Medion Erazer Scout E20 (Lautlosmodus) | |
| Asus TUF Gaming A16 FA617 | |
För att utvärdera om bildfrekvensen i stort sett är konstant under en längre tidsperiod kör vi spelet "The Witcher 3" i cirka 60 minuter i Full-HD-upplösning och med maximala kvalitetsinställningar. Spelkaraktären flyttas inte under denna tid. Det är endast när "Silent mode" aktiveras som bildfrekvensen sjunker.
The Witcher 3 FPS Chart
| låg | med. | hög | ultra | |
|---|---|---|---|---|
| GTA V (2015) | 184.8 | 180.1 | 172.4 | 94.2 |
| The Witcher 3 (2015) | 382.6 | 265.3 | 150.9 | 83.4 |
| Dota 2 Reborn (2015) | 177.6 | 160.3 | 150.3 | 142.5 |
| Final Fantasy XV Benchmark (2018) | 187.5 | 116.9 | 82.6 | |
| X-Plane 11.11 (2018) | 153.9 | 132.7 | 104.4 | |
| Far Cry 5 (2018) | 172 | 136 | 126 | 119 |
| Strange Brigade (2018) | 447 | 206 | 166.5 | 144 |
| Gears Tactics (2020) | 341.6 | 204.1 | 133.9 | 96.7 |
| Death Stranding (2020) | 174.8 | 140.5 | 132 | 128.8 |
| Assassin´s Creed Valhalla (2020) | 184 | 117 | 92 | 70 |
| Immortals Fenyx Rising (2020) | 171 | 112 | 101 | 93 |
| Mass Effect Legendary Edition (2021) | 150.1 | 135.1 | ||
| Far Cry 6 (2021) | 153.2 | 125.3 | 107.3 | 76.7 |
| Back 4 Blood (2021) | 332 | 221 | 166.1 | 155.3 |
| Guardians of the Galaxy (2021) | 144 | 120 | 119 | 113 |
| Riders Republic (2021) | 164 | 131 | 107 | 96 |
| Halo Infinite (2021) | 122.8 | 104.6 | 85.9 | |
| Rainbow Six Extraction (2022) | 208 | 166 | 159 | 125 |
| GRID Legends (2022) | 206.2 | 171.4 | 140.9 | 109.8 |
| Elex 2 (2022) | 116.3 | 115.7 | 103.4 | 81.4 |
| F1 22 (2022) | 215 | 197.2 | 152.3 | 52.5 |
| Uncharted Legacy of Thieves Collection (2022) | 75.1 | 71.1 | 67.2 | 62.6 |
| Dead Island 2 (2023) | 196 | 171.7 | 133.1 | 120.6 |
| Star Wars Jedi Survivor (2023) | 99.2 | 86.3 | 62.9 | 49.4 |
| Anno 117: Pax Romana (2025) | 83.6 | 64 | 47.8 | 26.2 |
| Forza Horizon 6 (2026) | 147 | 96 | 50 | 18 |
Utsläpp - Erazer Scout värms knappt upp
Bullernivåer
Prestanda-profilerna har ett starkt inflytande på den bärbara datorns bullerutveckling. Vid spelande ger "Gaming mode" en ljudnivå på cirka 57 dB(A), och när "Entertainment mode" väljs är nivån märkbart lägre, 50 dB(A). I båda fallen är värdena för höga. CPU och GPU bör fortfarande kylas tillräckligt även med långsammare fläktar, och Medion har fortfarande en del arbete att göra med att uppdatera fläktkontrollen.
De två andra lägena är betydligt mer användarvänliga, eftersom de får E20 att gå tystare. Även om "Silent mode" inte håller vad namnet lovar, möjliggör det ändå spelande på en låg ljudnivå. Den bärbara datorn går till exempel igenom vårt The Witcher 3 -test med cirka 34 dB(A).
Under tomgång eller vardaglig drift (kontor, internet) körs den bärbara datorn ofta tyst, och ibland till och med ljudlöst. Å andra sidan rusar fläktarna ibland också upp i onödan (vilket är ett typiskt fenomen med Clevo barebones).
Ljudnivå
| Låg belastning |
| 26 / 27 / 32 dB(A) |
| Hög belastning |
| 57 / 57 dB(A) |
 | ||
30 dB tyst 40 dB(A) hörbar 50 dB(A) högt ljud |
||
min: | ||
| Medion Erazer Scout E20 i7-13700H, GeForce RTX 4050 Laptop GPU | Gigabyte G7 KE i5-12500H, GeForce RTX 3060 Laptop GPU | MSI Katana 17 B13VFK i7-13620H, GeForce RTX 4060 Laptop GPU | Asus TUF Gaming A16 FA617 R7 7735HS, Radeon RX 7600S | Lenovo Legion 5 15IAH7H 82RB i7-12700H, GeForce RTX 3060 Laptop GPU | Acer Nitro 5 AN515-46-R1A1 R7 6800H, GeForce RTX 3070 Ti Laptop GPU | |
|---|---|---|---|---|---|---|
| Noise | -10% | -1% | 10% | 14% | -3% | |
| av / miljö * (dB) | 25 | 27 -8% | 24.5 2% | 24 4% | 23.3 7% | 25 -0% |
| Idle Minimum * (dB) | 26 | 27 -4% | 24.5 6% | 24 8% | 23.5 10% | 25 4% |
| Idle Average * (dB) | 27 | 35 -30% | 24.5 9% | 25 7% | 23.5 13% | 28.6 -6% |
| Idle Maximum * (dB) | 32 | 38 -19% | 40 -25% | 28 12% | 26.8 16% | 44.3 -38% |
| Load Average * (dB) | 57 | 52 9% | 48.3 15% | 42 26% | 29.3 49% | 47.6 16% |
| Witcher 3 ultra * (dB) | 50 | 56 -12% | 56 -12% | 50 -0% | 51.4 -3% | |
| Load Maximum * (dB) | 57 | 59 -4% | 59.1 -4% | 50 12% | 53 7% | 53.6 6% |
* ... mindre är bättre
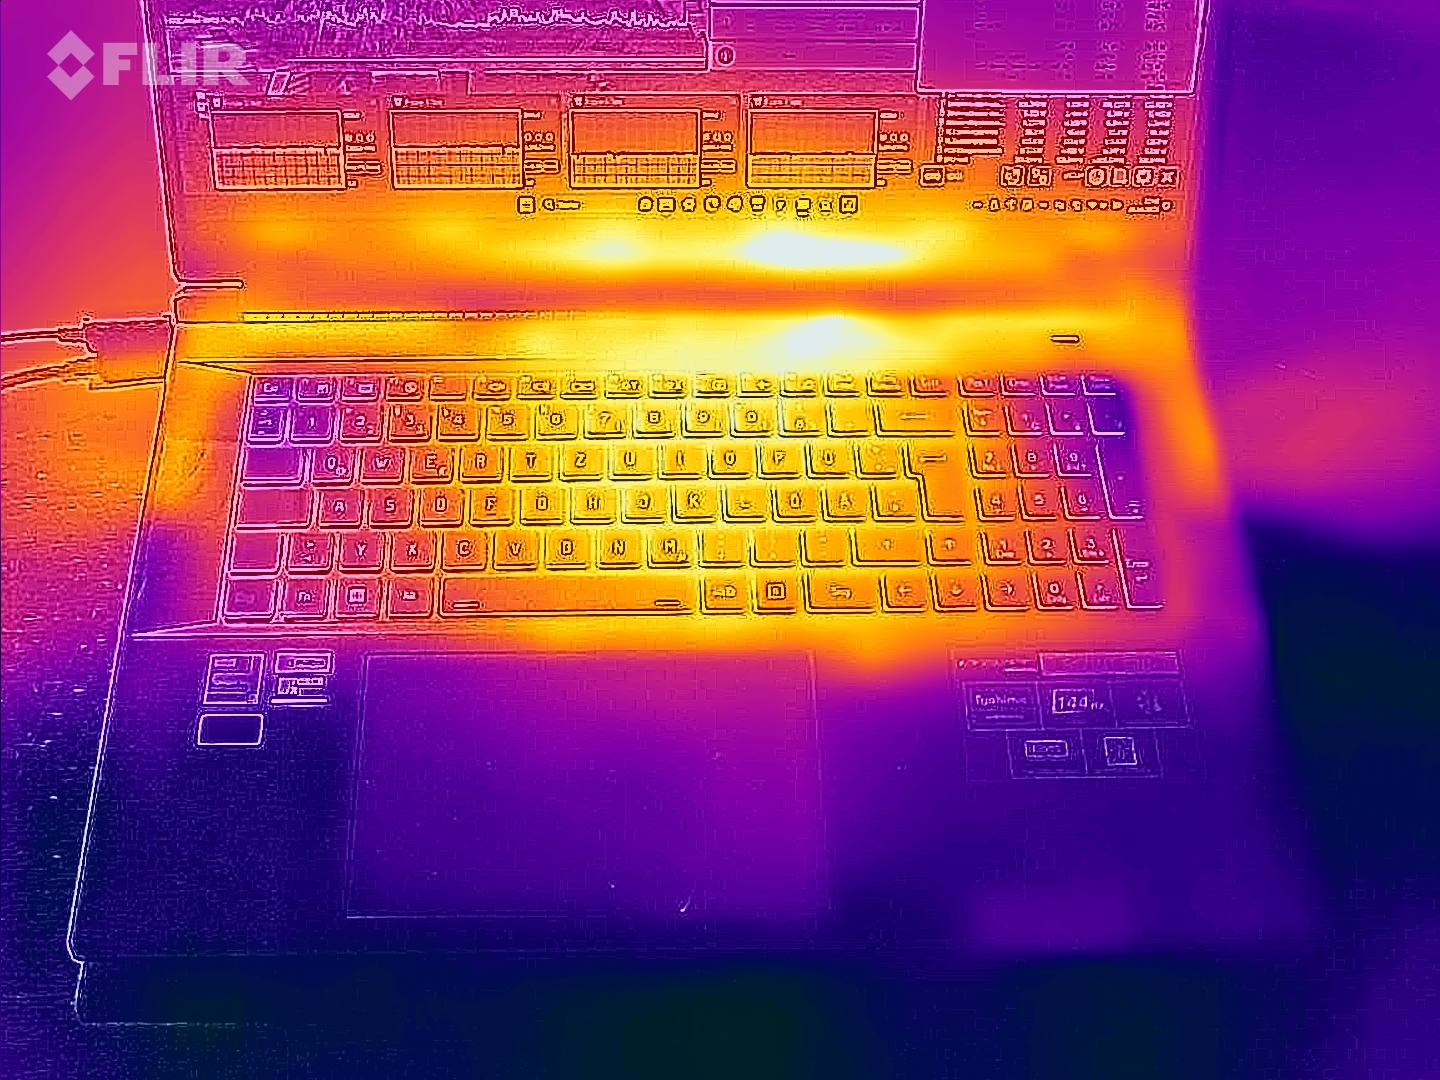
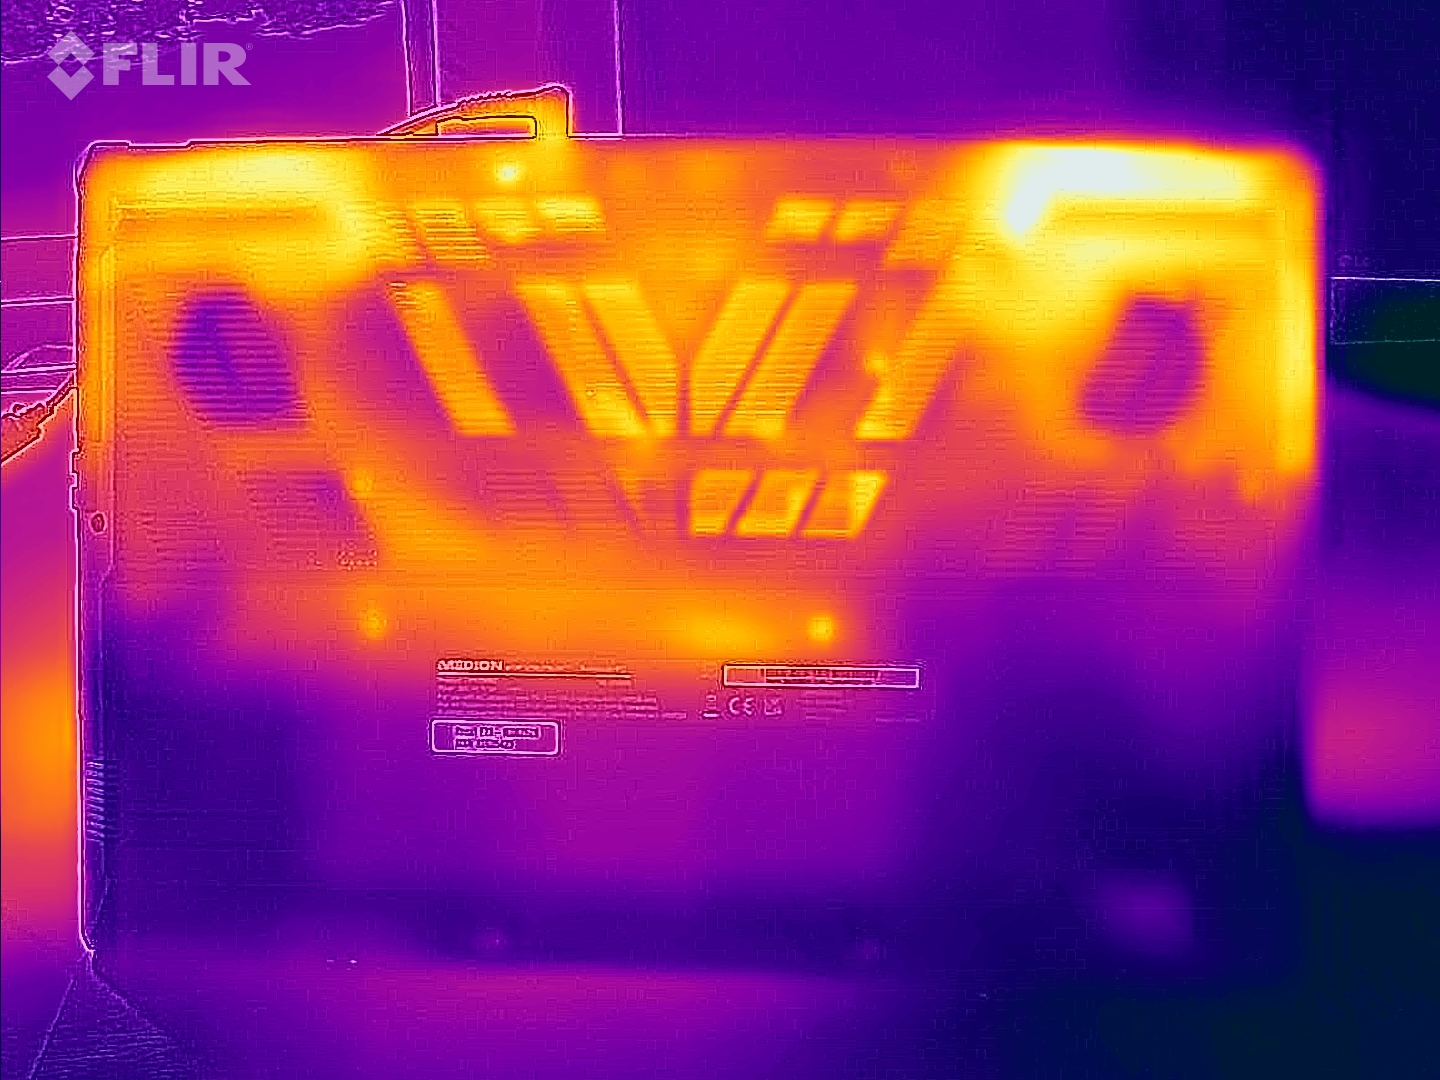
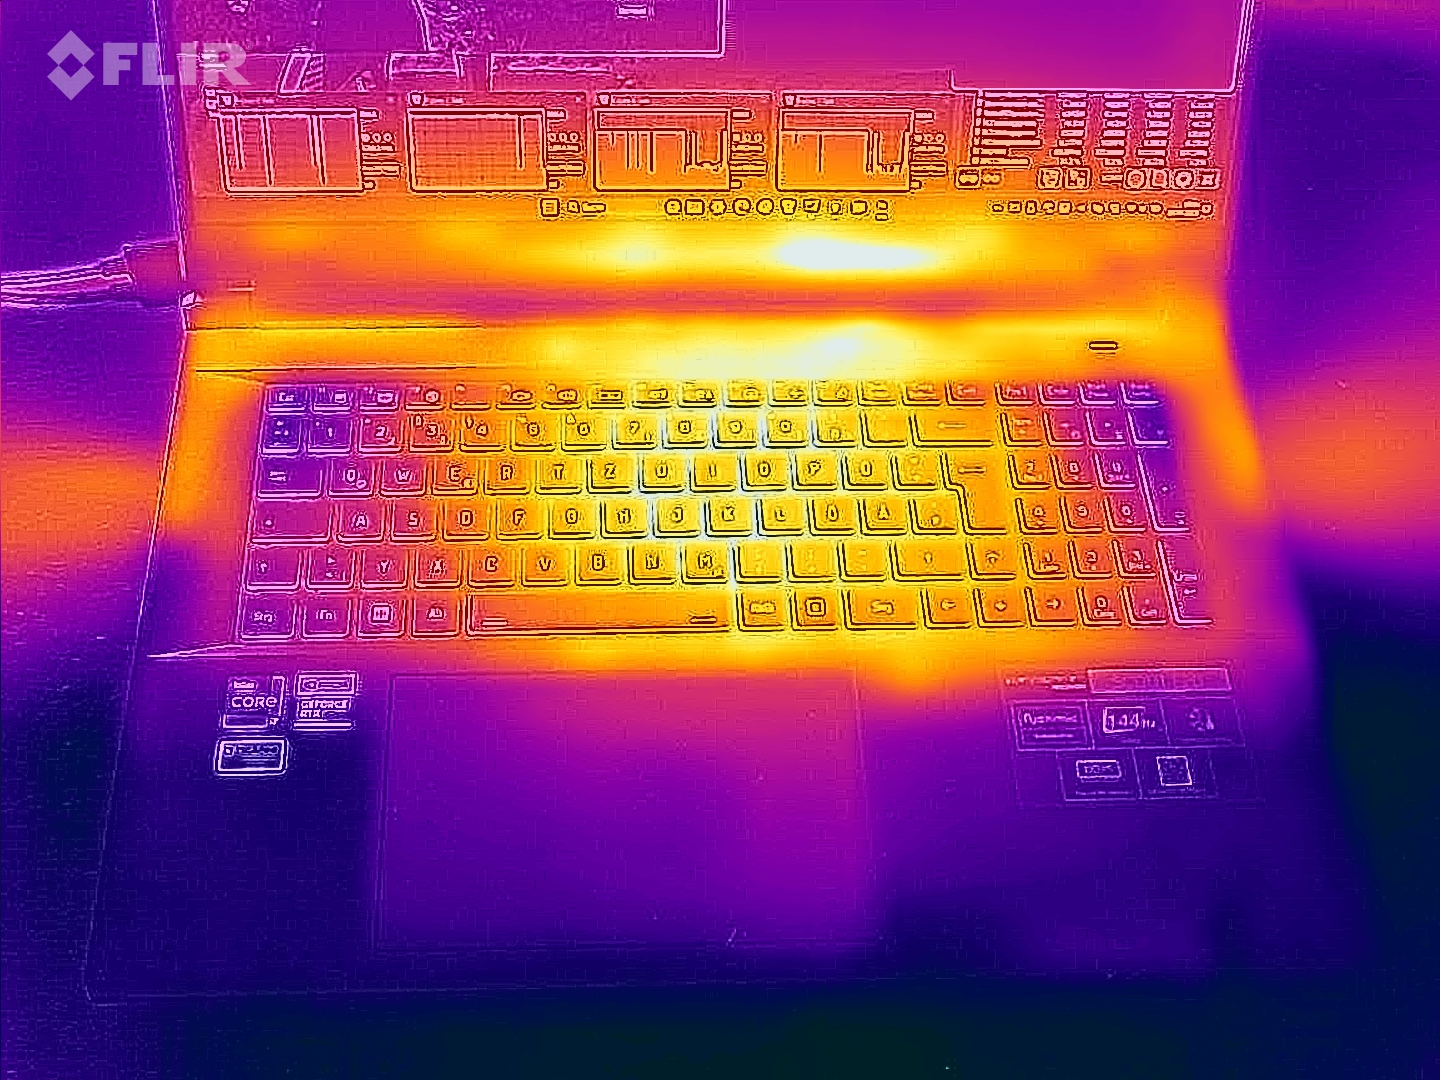
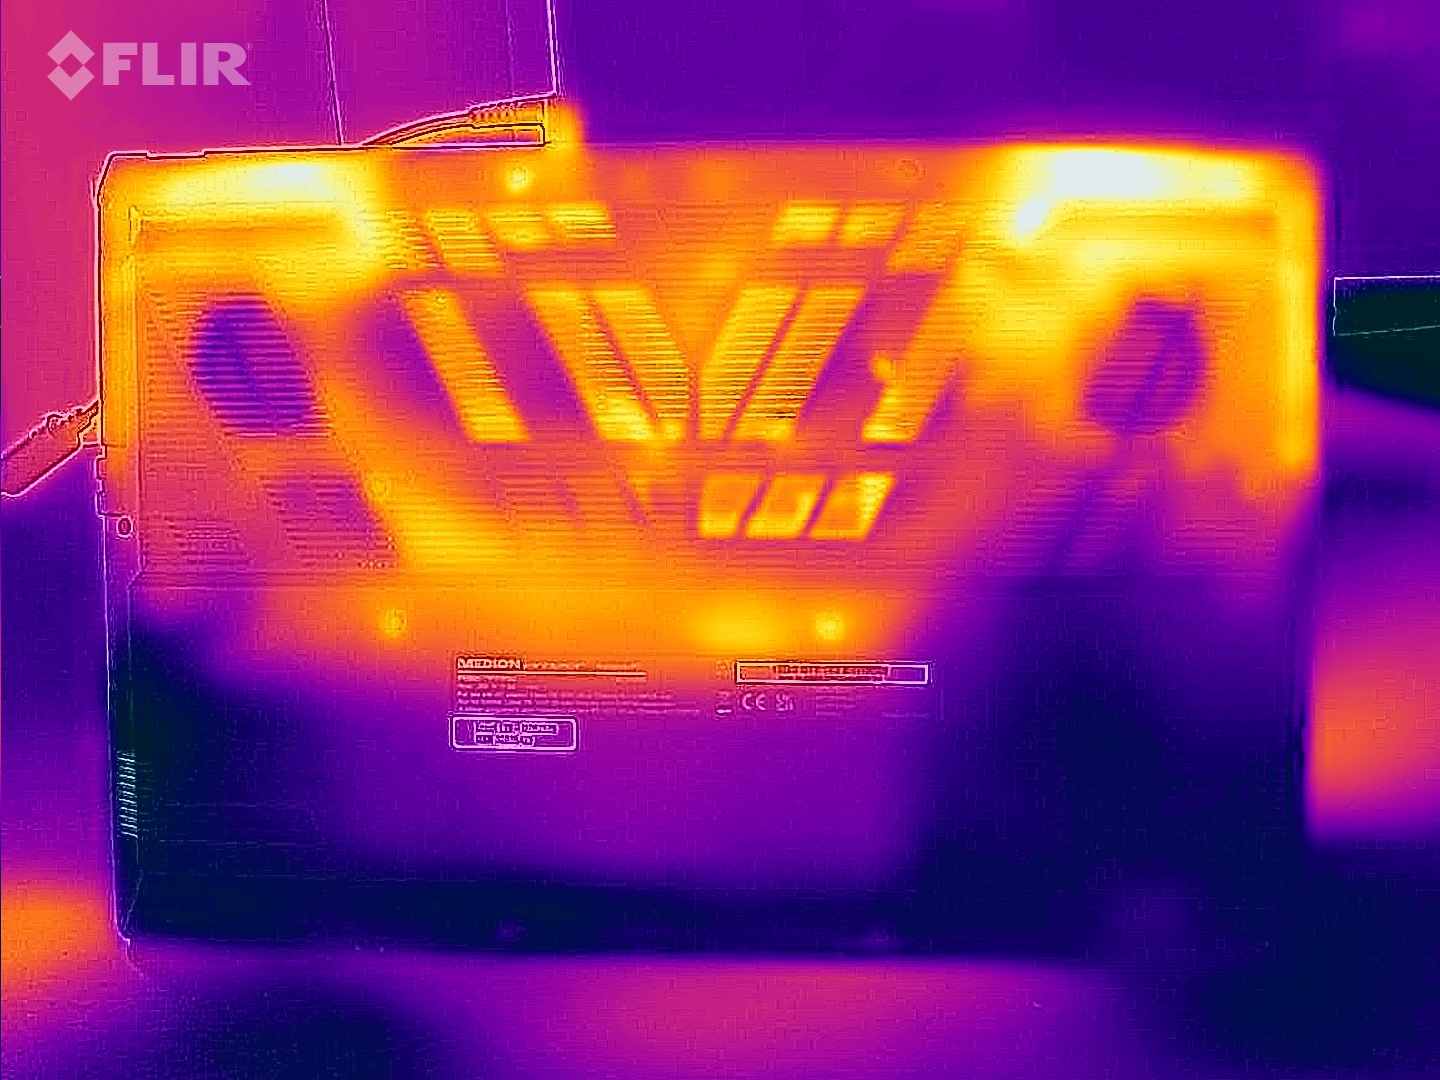
Temperaturer
Den bärbara datorn blir högst måttligt varm. Den högsta temperaturen uppnås under stresstestet, med 41 °C vid en enda mätpunkt. Vid daglig drift håller sig temperaturerna inom det gröna intervallet.
(±) Den maximala temperaturen på ovansidan är 41 °C / 106 F, jämfört med genomsnittet av 40.4 °C / 105 F , allt från 21.2 till 68.8 °C för klassen Gaming.
(+) Botten värms upp till maximalt 39 °C / 102 F, jämfört med genomsnittet av 43.2 °C / 110 F
(+) Vid tomgångsbruk är medeltemperaturen för ovansidan 26.8 °C / 80 F, jämfört med enhetsgenomsnittet på 33.9 °C / ### class_avg_f### F.
(±) När du spelar The Witcher 3 är medeltemperaturen för ovansidan 34.1 °C / 93 F, jämfört med enhetsgenomsnittet på 33.9 °C / ## #class_avg_f### F.
(+) Handledsstöden och pekplattan är kallare än hudtemperaturen med maximalt 26 °C / 78.8 F och är därför svala att ta på.
(+) Medeltemperaturen för handledsstödsområdet på liknande enheter var 28.8 °C / 83.8 F (+2.8 °C / 5 F).
| Medion Erazer Scout E20 Intel Core i7-13700H, NVIDIA GeForce RTX 4050 Laptop GPU | Gigabyte G7 KE Intel Core i5-12500H, NVIDIA GeForce RTX 3060 Laptop GPU | MSI Katana 17 B13VFK Intel Core i7-13620H, NVIDIA GeForce RTX 4060 Laptop GPU | Asus TUF Gaming A16 FA617 AMD Ryzen 7 7735HS, AMD Radeon RX 7600S | Lenovo Legion 5 15IAH7H 82RB Intel Core i7-12700H, NVIDIA GeForce RTX 3060 Laptop GPU | Acer Nitro 5 AN515-46-R1A1 AMD Ryzen 7 6800H, NVIDIA GeForce RTX 3070 Ti Laptop GPU | |
|---|---|---|---|---|---|---|
| Heat | -16% | -10% | -30% | -1% | -13% | |
| Maximum Upper Side * (°C) | 41 | 52 -27% | 41.6 -1% | 54 -32% | 37.8 8% | 48.1 -17% |
| Maximum Bottom * (°C) | 39 | 54 -38% | 43.1 -11% | 47 -21% | 51 -31% | 49.7 -27% |
| Idle Upper Side * (°C) | 31 | 28 10% | 32 -3% | 40 -29% | 25.8 17% | 30 3% |
| Idle Bottom * (°C) | 29 | 32 -10% | 35.8 -23% | 40 -38% | 28.8 1% | 31.7 -9% |
* ... mindre är bättre
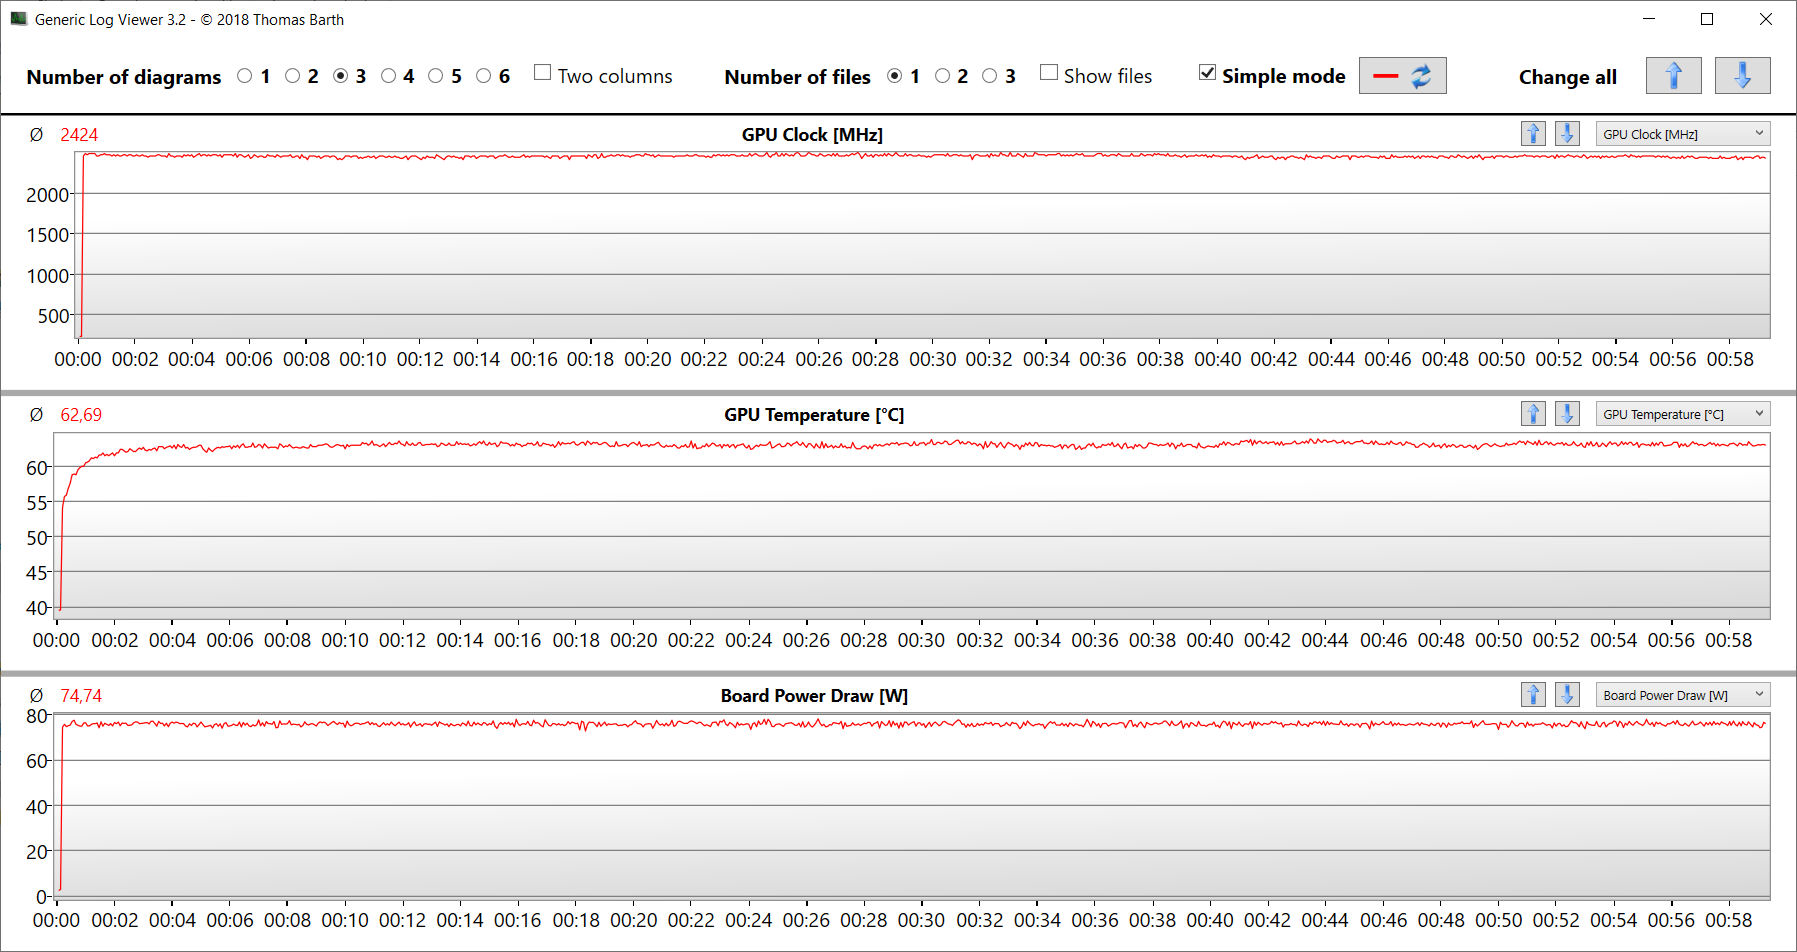
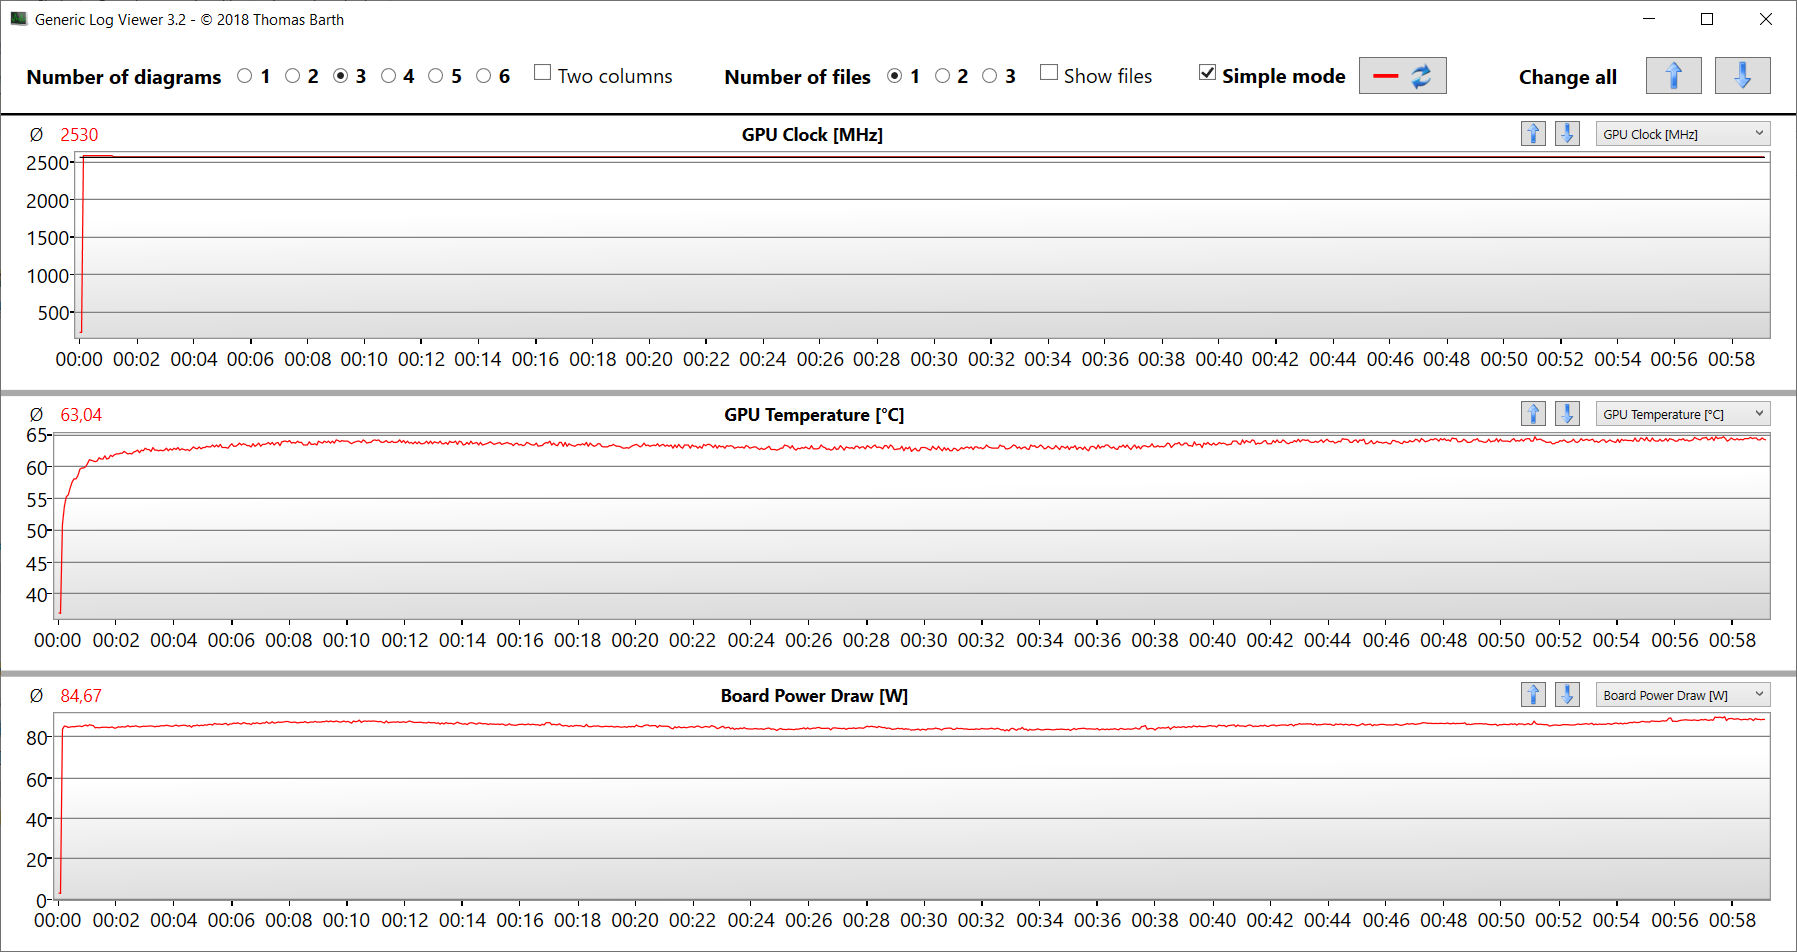
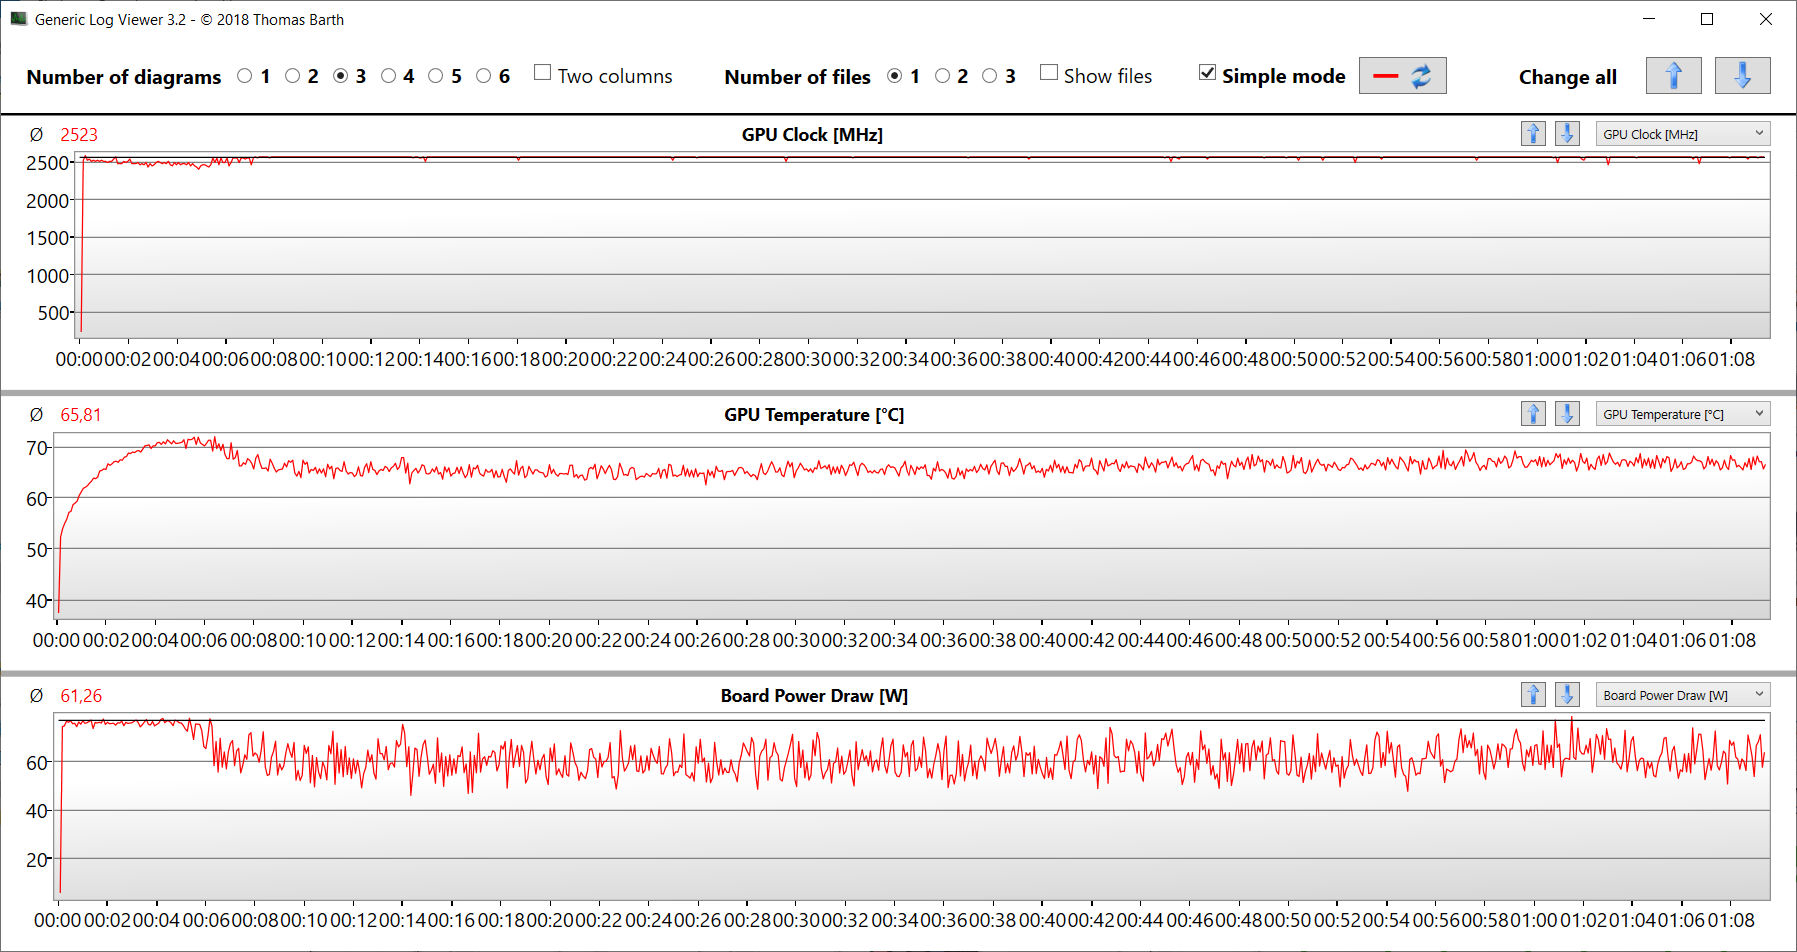
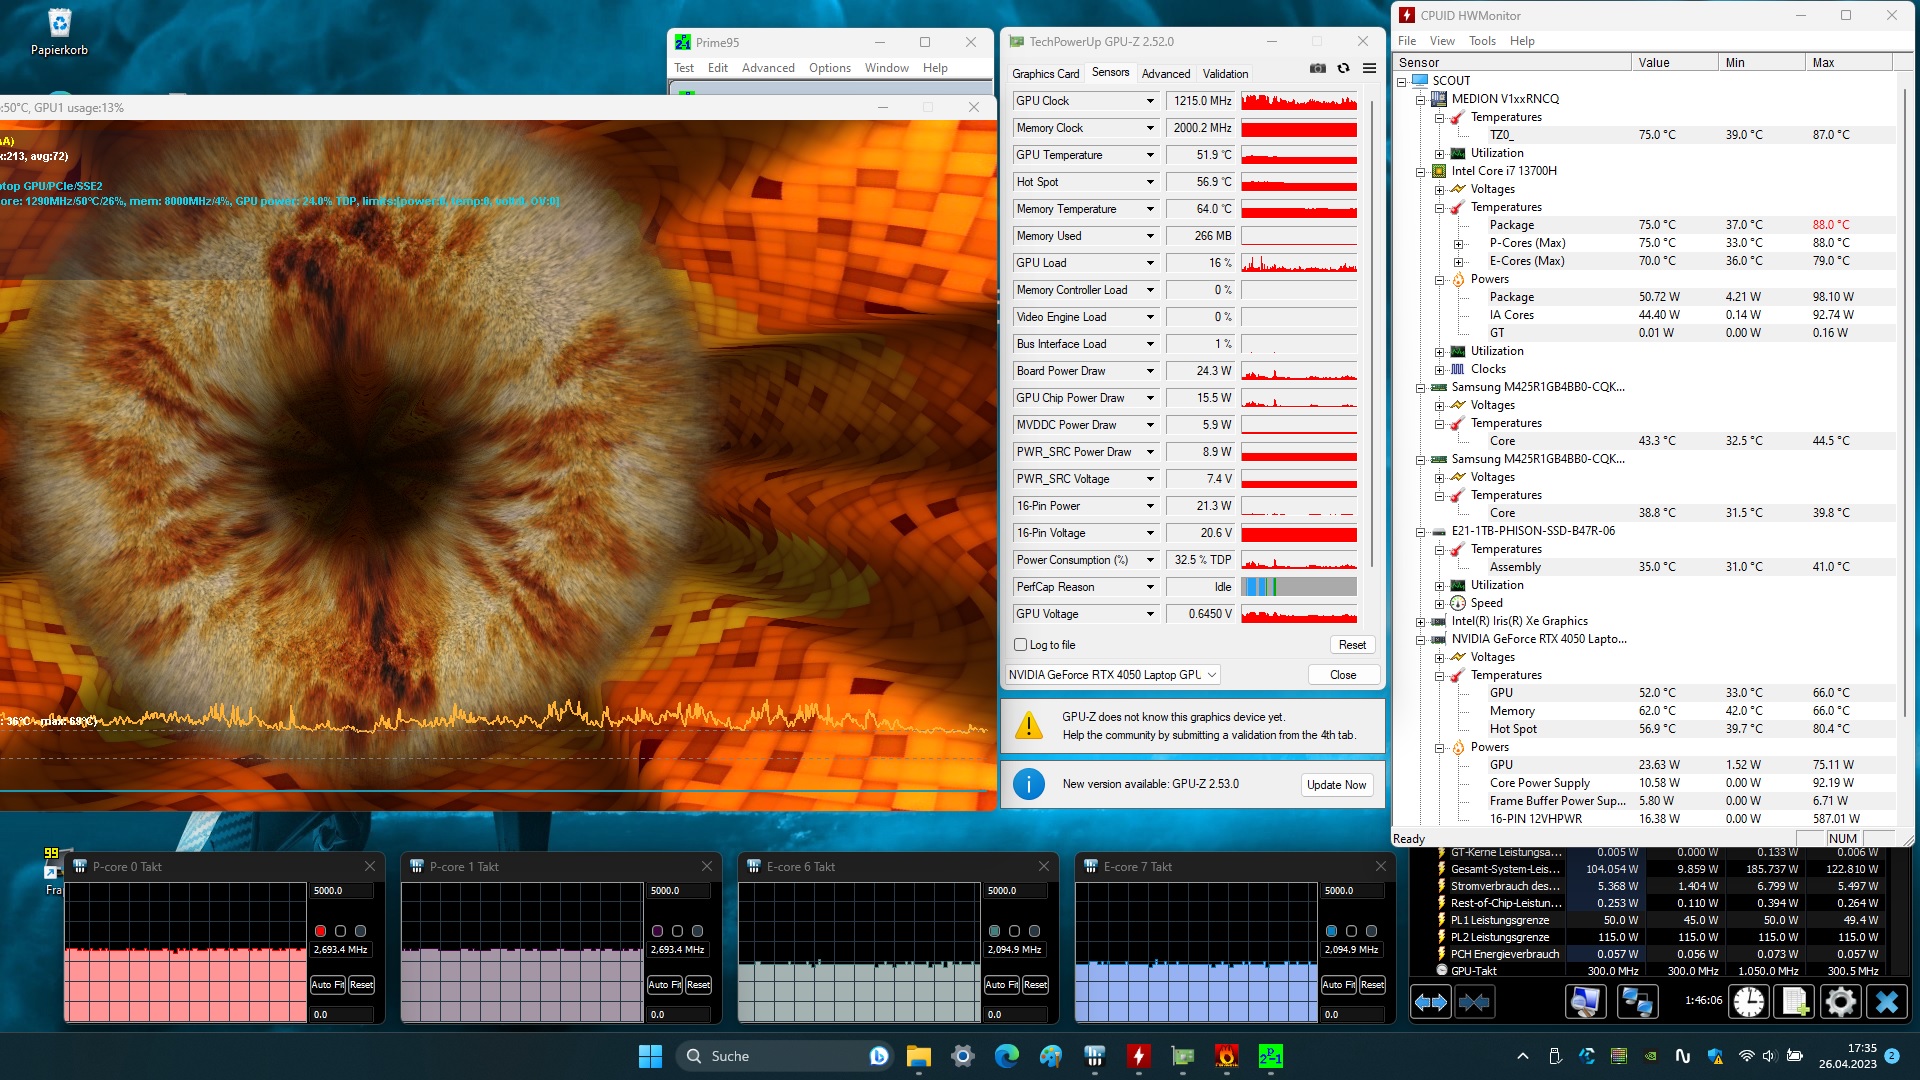
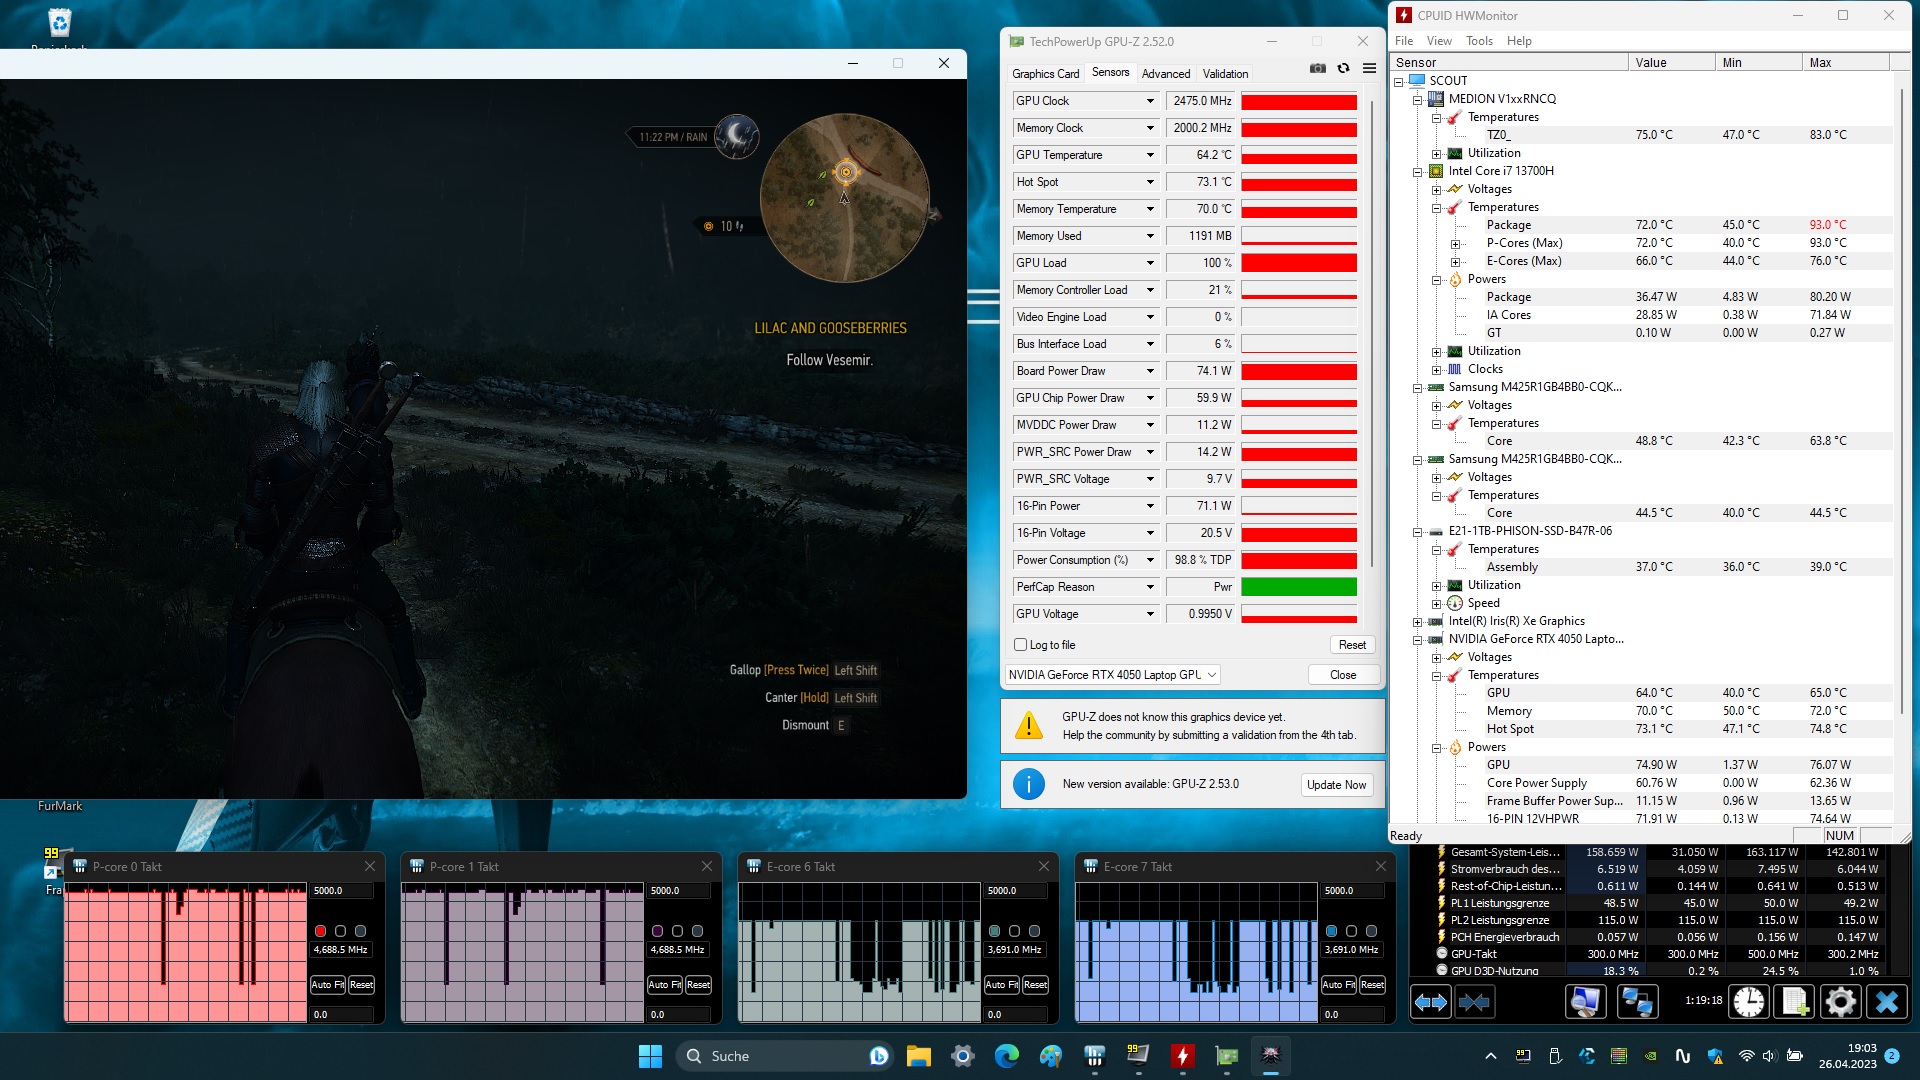
Stresstest
Stresstestet (med Prime95 och Furmark igång konstant) är ett extremt scenario som vi använder för att utvärdera systemets stabilitet vid full belastning. Processorn börjar testet med medelhöga klockfrekvenser (P: 3,4-3,7 GHz, E: 2,8-2,9 GHz) och GPU:n körs på 2,3 GHz. Under testet minskar CPU:ns och GPU:ns klockfrekvenser.
Högtalare
Stereohögtalarna ger ett magert ljud som knappt har någon bas. För en bättre lyssningsupplevelse rekommenderar vi att du använder hörlurar eller externa högtalare.
Medion Erazer Scout E20 ljudanalys
(+) | högtalare kan spela relativt högt (84 dB)
Bas 100 - 315 Hz
(-) | nästan ingen bas - i genomsnitt 33.1% lägre än medianen
(±) | linjäriteten för basen är genomsnittlig (9.9% delta till föregående frekvens)
Mellan 400 - 2000 Hz
(±) | högre mellan - i genomsnitt 6.6% högre än median
(±) | linjäriteten för mids är genomsnittlig (8.2% delta till föregående frekvens)
Högsta 2 - 16 kHz
(+) | balanserade toppar - endast 2.1% från medianen
(±) | linjäriteten för toppar är genomsnittlig (7.5% delta till föregående frekvens)
Totalt 100 - 16 000 Hz
(±) | linjäriteten för det totala ljudet är genomsnittlig (22.2% skillnad mot median)
Jämfört med samma klass
» 79% av alla testade enheter i den här klassen var bättre, 6% liknande, 14% sämre
» Den bästa hade ett delta på 6%, genomsnittet var 18%, sämst var 132%
Jämfört med alla testade enheter
» 64% av alla testade enheter var bättre, 6% liknande, 29% sämre
» Den bästa hade ett delta på 4%, genomsnittet var 24%, sämst var 134%
MSI Katana 17 B13VFK ljudanalys
(±) | högtalarljudstyrkan är genomsnittlig men bra (78.5 dB)
Bas 100 - 315 Hz
(-) | nästan ingen bas - i genomsnitt 17.7% lägre än medianen
(±) | linjäriteten för basen är genomsnittlig (11.7% delta till föregående frekvens)
Mellan 400 - 2000 Hz
(±) | högre mellan - i genomsnitt 6.8% högre än median
(+) | mids är linjära (6.7% delta till föregående frekvens)
Högsta 2 - 16 kHz
(+) | balanserade toppar - endast 3.2% från medianen
(±) | linjäriteten för toppar är genomsnittlig (7.2% delta till föregående frekvens)
Totalt 100 - 16 000 Hz
(±) | linjäriteten för det totala ljudet är genomsnittlig (19.4% skillnad mot median)
Jämfört med samma klass
» 67% av alla testade enheter i den här klassen var bättre, 7% liknande, 26% sämre
» Den bästa hade ett delta på 6%, genomsnittet var 18%, sämst var 132%
Jämfört med alla testade enheter
» 48% av alla testade enheter var bättre, 7% liknande, 45% sämre
» Den bästa hade ett delta på 4%, genomsnittet var 24%, sämst var 134%
Energihantering - Medions bärbara dator har endast en kort batteritid
Effektförbrukning
Energiförbrukningen hos Medions bärbara dator visar inget anmärkningsvärt beteende och värdena ligger på normala nivåer för den använda hårdvaran. Den bärbara datorn går igenom vårt The Witcher 3 -test och vårt stresstest med konstant strömförbrukning. Strömförsörjningen på 230 watt ger alltid en tillräcklig mängd ström.
| Av/Standby | |
| Låg belastning | |
| Hög belastning |
|
Förklaring:
min: | |
| Medion Erazer Scout E20 i7-13700H, GeForce RTX 4050 Laptop GPU | Gigabyte G7 KE i5-12500H, GeForce RTX 3060 Laptop GPU | MSI Katana 17 B13VFK i7-13620H, GeForce RTX 4060 Laptop GPU | Asus TUF Gaming A16 FA617 R7 7735HS, Radeon RX 7600S | Lenovo Legion 5 15IAH7H 82RB i7-12700H, GeForce RTX 3060 Laptop GPU | Acer Nitro 5 AN515-46-R1A1 R7 6800H, GeForce RTX 3070 Ti Laptop GPU | Genomsnitt NVIDIA GeForce RTX 4050 Laptop GPU | Genomsnitt av klass Gaming | |
|---|---|---|---|---|---|---|---|---|
| Power Consumption | -51% | -25% | -5% | -104% | -25% | -23% | -58% | |
| Idle Minimum * (Watt) | 5 | 15 -200% | 12.2 -144% | 8 -60% | 19.8 -296% | 7 -40% | 9.95 ? -99% | 13.3 ? -166% |
| Idle Average * (Watt) | 11 | 17 -55% | 14.9 -35% | 11 -0% | 26.2 -138% | 8.9 19% | 15.8 ? -44% | 19 ? -73% |
| Idle Maximum * (Watt) | 22 | 24 -9% | 15.8 28% | 16 27% | 48.2 -119% | 14.4 35% | 20.1 ? 9% | 24.5 ? -11% |
| Load Average * (Watt) | 96 | 111 -16% | 85.22 11% | 97 -1% | 102.9 -7% | 202 -110% | 88 ? 8% | 108.1 ? -13% |
| Witcher 3 ultra * (Watt) | 145.2 | 174.1 -20% | 151.1 -4% | 161.5 -11% | 186.7 -29% | 203 -40% | ||
| Load Maximum * (Watt) | 201 | 208 -3% | 212.8 -6% | 168 16% | 268 -33% | 230 -14% | 176.3 ? 12% | 254 ? -26% |
* ... mindre är bättre
Power Consumption The Witcher 3 / Stress Test
Power Consumption With External Monitor
Batteritid
I vårt WLAN-test, där vi kallade upp webbplatser via skript, och i vårt videotest, där vi spelade upp kortfilmen Big Buck Bunny (H.264-kodning, FHD) i en slinga, uppnådde den bärbara 17,3-tumsdatorn en körtid på 4:44 timmar respektive 4:37 timmar. Under båda testerna är den bärbara datorns energisparfunktioner inaktiverade och skärmens ljusstyrka är justerad till cirka 150 cd/m². Dessutom är kommunikationsmodulerna också avstängda när videotestet körs.
| Medion Erazer Scout E20 i7-13700H, GeForce RTX 4050 Laptop GPU, 53.35 Wh | Gigabyte G7 KE i5-12500H, GeForce RTX 3060 Laptop GPU, 54 Wh | MSI Katana 17 B13VFK i7-13620H, GeForce RTX 4060 Laptop GPU, 53.5 Wh | Asus TUF Gaming A16 FA617 R7 7735HS, Radeon RX 7600S, 90 Wh | Lenovo Legion 5 15IAH7H 82RB i7-12700H, GeForce RTX 3060 Laptop GPU, 80 Wh | Acer Nitro 5 AN515-46-R1A1 R7 6800H, GeForce RTX 3070 Ti Laptop GPU, 57.5 Wh | Genomsnitt av klass Gaming | |
|---|---|---|---|---|---|---|---|
| Batteridrifttid | -12% | -36% | 119% | 0% | 23% | 39% | |
| Reader / Idle (h) | 6.7 | 7.1 6% | 20.2 201% | 8.1 21% | 10.5 57% | 8.71 ? 30% | |
| H.264 (h) | 4.6 | 2.2 -52% | 5.7 24% | 8.26 ? 80% | |||
| WiFi v1.3 (h) | 4.7 | 5.3 13% | 2.9 -38% | 12.1 157% | 5 6% | 5.8 23% | 7.01 ? 49% |
| Load (h) | 1.5 | 1.3 -13% | 1 -33% | 1.5 0% | 1.1 -27% | 1.3 -13% | 1.47 ? -2% |
För
Emot
Slutsats - En väl avrundad bärbar dator för spel i instegssegmentet
Erazer Scout E20 är inriktad på FHD-spel, men den bärbara datorn är också bra på andra områden som rendering och videobearbetning. TheCore i7-13700Hoch GeForce RTX 4050kan köras med höga klockfrekvenser, och en 1 TB SSD säkerställer korta laddningstider och ger det nödvändiga lagringsutrymmet.
Med Erazer Scout E20 levererar Medion en konsekvent bärbar dator för spel från instegssegmentet. Fläktkontrollen skulle fortfarande kunna behöva justeras lite.
Även om den bärbara datorn endast värms upp måttligt under belastning kan den då producera mycket buller. Som tur är finns det ett "Silent mode" som möjliggör spelande med låg ljudnivå - men inte tystnad.
En realistisk batteritid på knappt 4,5 till 5 timmar väcker ingen entusiasm, och den relativt låga batterikapaciteten på 53,35 Wh blir märkbar här. Eftersom batteriet inte kan laddas med en USB-C-laddare måste du alltid ta med dig strömförsörjningen. Den matta 17,3-tumsskärmen (FHD, IPS, 144 Hz, sRGB) lämnade överlag ett gott intryck.
Ett alternativ till E20 skulle kunna varaAsus TUF Gaming A16 Advantage Edition. Medan prestandan ligger på en liknande nivå kan den göra mål med en betydligt längre batteritid och en skärm i 16:10-format. Ett budgetalternativ ärGigabyte G7 KE, som har en jämförbar grafikprestanda men ett inköpspris som är cirka 450 euro (~498 dollar) lägre. Ett Windows-operativsystem ingår dock inte.
Pris och tillgänglighet
I Tyskland kan du köpa Medion Erazer Scout E20 från Medions webbutik https://www.medion.com/de/shop/p/core-gaming-notebooks-medion-erazer-scout-e20-intel-core-i7-13700h-windows-11-home-43-9-cm-17-3--fhd-display-mit-144-hz-rtx-4050-1-tb-ssd-16-gb-ram-core-gaming-notebook-30035423A1för nästan 1 500 euro (~1 658 dollar). Den är baserad på Clevo V170RNCQ, som finns på Clevo för 1399 euro (~$1,547). Clevo erbjuder också olika konfigurationsalternativ.
Medion Erazer Scout E20
- 05/16/2023 v7 (old)
Sascha Mölck
Genomskinlighet
Valet av enheter som ska granskas görs av vår redaktion. Testprovet gavs till författaren som ett lån av tillverkaren eller återförsäljaren för denna recension. Långivaren hade inget inflytande på denna recension och inte heller fick tillverkaren en kopia av denna recension innan publiceringen. Det fanns ingen skyldighet att publicera denna recension. Som ett oberoende medieföretag är Notebookcheck inte föremål för auktoritet från tillverkare, återförsäljare eller förlag.
This is how Notebookcheck is testingEvery year, Notebookcheck independently reviews hundreds of laptops and smartphones using standardized procedures to ensure that all results are comparable. We have continuously developed our test methods for around 20 years and set industry standards in the process. In our test labs, high-quality measuring equipment is utilized by experienced technicians and editors. These tests involve a multi-stage validation process. Our complex rating system is based on hundreds of well-founded measurements and benchmarks, which maintains objectivity.
Price comparison

