Test: Asus ROG Zephyrus M16 - Gaming i 16:10 (Sammanfattning)
Testgrupp
Gradering | Datum | Modell | Vikt | Höjd | Storlek | Upplösning | Pris |
|---|---|---|---|---|---|---|---|
| 85.6 % v7 (old) | 07/2021 | Asus ROG Zephyrus M16 GU603H i9-11900H, GeForce RTX 3070 Laptop GPU | 2 kg | 20 mm | 16.00" | 2560x1600 | |
| 85.4 % v7 (old) | 03/2021 | Alienware m15 R4 i9-10980HK, GeForce RTX 3070 Laptop GPU | 2.3 kg | 20 mm | 15.60" | 1920x1080 | |
| 82.8 % v7 (old) | 10/2021 | Asus TUF Gaming F17 FX706HM i9-11900H, GeForce RTX 3060 Laptop GPU | 2.7 kg | 26 mm | 17.30" | 1920x1080 | |
| 86.4 % v7 (old) | 09/2021 | Aorus 15P YD i7-11800H, GeForce RTX 3080 Laptop GPU | 2.2 kg | 27 mm | 15.60" | 1920x1080 | |
| 84 % v7 (old) | 09/2021 | MSI GS66 Stealth 10UG i7-10870H, GeForce RTX 3070 Laptop GPU | 2.1 kg | 19.8 mm | 15.60" | 1920x1080 |
| SD Card Reader | |
| average JPG Copy Test (av. of 3 runs) | |
| Alienware m15 R4 (AV PRO microSD 128 GB V60) | |
| Aorus 15P YD (AV PRO microSD 128 GB V60) | |
| Genomsnitt av klass Gaming (20.9 - 210, n=55, senaste 2 åren) | |
| Asus ROG Zephyrus M16 GU603H (AV PRO microSD 128 GB V60) | |
| maximum AS SSD Seq Read Test (1GB) | |
| Alienware m15 R4 (AV PRO microSD 128 GB V60) | |
| Aorus 15P YD (AV PRO microSD 128 GB V60) | |
| Asus ROG Zephyrus M16 GU603H (AV PRO microSD 128 GB V60) | |
| Genomsnitt av klass Gaming (25.5 - 261, n=52, senaste 2 åren) | |


| |||||||||||||||||||||||||
Distribution av ljusstyrkan: 86 %
Mitt på batteriet: 448 cd/m²
Kontrast: 933:1 (Svärta: 0.48 cd/m²)
ΔE ColorChecker Calman: 2.76 | ∀{0.5-29.43 Ø4.71}
calibrated: 2.86
ΔE Greyscale Calman: 3.1 | ∀{0.09-98 Ø4.96}
100% sRGB (Argyll 1.6.3 3D)
87% AdobeRGB 1998 (Argyll 1.6.3 3D)
Gamma: 2.153
CCT: 6826 K
| Asus ROG Zephyrus M16 GU603H AU Optronics AUOC199, IPS, 2560x1600, 16" | Alienware m15 R4 LG Philips LGD066E, IPS, 1920x1080, 15.6" | Asus TUF Gaming F17 FX706HM AU Optronics AUI8294 (B173HAN04.9), IPS, 1920x1080, 17.3" | Aorus 15P YD BOE09B9, IPS, 1920x1080, 15.6" | MSI GS66 Stealth 10UG AU Optronics B156HAN12.0, IPS, 1920x1080, 15.6" | |
|---|---|---|---|---|---|
| Display | |||||
| Display P3 Coverage (%) | 69.4 | 40.1 | 70.2 | 67.7 | |
| sRGB Coverage (%) | 99 | 60 | 98.5 | 98.4 | |
| AdobeRGB 1998 Coverage (%) | 70.5 | 41.4 | 72.4 | 69.1 | |
| Response Times | -61% | -424% | -126% | -147% | |
| Response Time Grey 50% / Grey 80% * (ms) | 4.8 ? | 7.4 ? -54% | 32.4 -575% | 14 ? -192% | 14.4 ? -200% |
| Response Time Black / White * (ms) | 6 ? | 10 ? -67% | 22.4 -273% | 9.6 ? -60% | 11.6 ? -93% |
| PWM Frequency (Hz) | |||||
| Screen | 14% | -19% | -11% | 6% | |
| Brightness middle (cd/m²) | 448 | 333 -26% | 266 -41% | 337 -25% | 259.5 -42% |
| Brightness (cd/m²) | 446 | 303 -32% | 264 -41% | 316 -29% | 264 -41% |
| Brightness Distribution (%) | 86 | 86 0% | 79 -8% | 85 -1% | 90 5% |
| Black Level * (cd/m²) | 0.48 | 0.29 40% | 0.32 33% | 0.31 35% | 0.25 48% |
| Contrast (:1) | 933 | 1148 23% | 831 -11% | 1087 17% | 1038 11% |
| Colorchecker dE 2000 * | 2.76 | 1.8 35% | 3.97 -44% | 3.87 -40% | 2.52 9% |
| Colorchecker dE 2000 max. * | 7.09 | 4.49 37% | 8.93 -26% | 8.09 -14% | 5.55 22% |
| Colorchecker dE 2000 calibrated * | 2.86 | 1.13 60% | 3.5 -22% | 1.15 60% | 1.93 33% |
| Greyscale dE 2000 * | 3.1 | 1.9 39% | 1.8 42% | 6.1 -97% | 1.7 45% |
| Gamma | 2.153 102% | 2.265 97% | 2.31 95% | 2.132 103% | 2.04 108% |
| CCT | 6826 95% | 6840 95% | 6754 96% | 6891 94% | 6414 101% |
| Color Space (Percent of AdobeRGB 1998) (%) | 87 | 71 -18% | 41.4 -52% | 72 -17% | 63.3 -27% |
| Color Space (Percent of sRGB) (%) | 100 | 93 -7% | 60 -40% | 94 -6% | 98.8 -1% |
| Totalt genomsnitt (program/inställningar) | -24% /
2% | -222% /
-81% | -69% /
-28% | -71% /
-18% |
* ... mindre är bättre
Visa svarstider
| ↔ Svarstid svart till vitt | ||
|---|---|---|
| 6 ms ... stiga ↗ och falla ↘ kombinerat | ↗ 2 ms stiga | 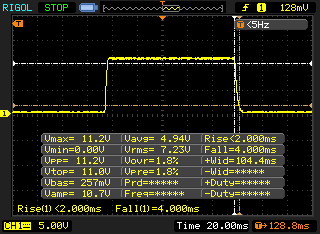 |
| ↘ 4 ms hösten | ||
| Skärmen visar väldigt snabba svarsfrekvenser i våra tester och borde vara mycket väl lämpad för fartfyllt spel. I jämförelse sträcker sig alla testade enheter från 0.1 (minst) till 240 (maximalt) ms. » 19 % av alla enheter är bättre. Det betyder att den uppmätta svarstiden är bättre än genomsnittet av alla testade enheter (19.8 ms). | ||
| ↔ Svarstid 50 % grått till 80 % grått | ||
| 4.8 ms ... stiga ↗ och falla ↘ kombinerat | ↗ 2 ms stiga | 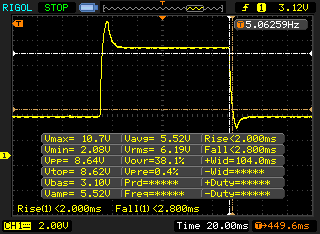 |
| ↘ 2.8 ms hösten | ||
| Skärmen visar väldigt snabba svarsfrekvenser i våra tester och borde vara mycket väl lämpad för fartfyllt spel. I jämförelse sträcker sig alla testade enheter från 0.165 (minst) till 636 (maximalt) ms. » 17 % av alla enheter är bättre. Det betyder att den uppmätta svarstiden är bättre än genomsnittet av alla testade enheter (30.9 ms). | ||
Skärmflimmer / PWM (Puls-Width Modulation)
| Skärmflimmer / PWM upptäcktes inte | 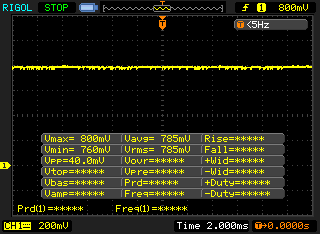 | ||
Som jämförelse: 52 % av alla testade enheter använder inte PWM för att dämpa skärmen. Om PWM upptäcktes mättes ett medelvärde av 7748 (minst: 5 - maximum: 343500) Hz. | |||
* ... mindre är bättre
| PCMark 10 Score | 7097 poäng | |
Hjälp | ||
| DPC Latencies / LatencyMon - interrupt to process latency (max), Web, Youtube, Prime95 | |
| Alienware m15 R4 | |
| Asus TUF Gaming F17 FX706HM | |
| Asus ROG Zephyrus M16 GU603H | |
| Aorus 15P YD | |
| MSI GS66 Stealth 10UG | |
* ... mindre är bättre
| Asus ROG Zephyrus M16 GU603H Samsung PM9A1 MZVL22T0HBLB | Alienware m15 R4 Micron 2300 1TB MTFDHBA1T0TDV | Asus TUF Gaming F17 FX706HM SK Hynix HFM001TD3JX013N | Aorus 15P YD Samsung PM9A1 MZVL21T0HCLR | MSI GS66 Stealth 10UG WDC PC SN730 SDBPNTY-1T00 | |
|---|---|---|---|---|---|
| CrystalDiskMark 5.2 / 6 | -40% | -32% | 1% | -42% | |
| Write 4K (MB/s) | 239.6 | 93.7 -61% | 168.8 -30% | 230.4 -4% | 163.1 -32% |
| Read 4K (MB/s) | 89.3 | 48.1 -46% | 72 -19% | 91.8 3% | 48.97 -45% |
| Write Seq (MB/s) | 4515 | 2785 -38% | 4301 -5% | 2607 -42% | |
| Read Seq (MB/s) | 4592 | 2598 -43% | 4474 -3% | 2316 -50% | |
| Write 4K Q32T1 (MB/s) | 605 | 481.9 -20% | 459.5 -24% | 656 8% | 338 -44% |
| Read 4K Q32T1 (MB/s) | 658 | 521 -21% | 473.1 -28% | 722 10% | 475.6 -28% |
| Write Seq Q32T1 (MB/s) | 5280 | 3362 -36% | 3129 -41% | 5198 -2% | 3090 -41% |
| Read Seq Q32T1 (MB/s) | 7098 | 3200 -55% | 3529 -50% | 7065 0% | 3421 -52% |
| Write 4K Q8T8 (MB/s) | 484.5 | ||||
| Read 4K Q8T8 (MB/s) | 1518 | ||||
| AS SSD | -67% | -31% | -1% | -60% | |
| Seq Read (MB/s) | 5615 | 2658 -53% | 2837 -49% | 5376 -4% | 2198 -61% |
| Seq Write (MB/s) | 4297 | 2769 -36% | 1565 -64% | 3669 -15% | 2596 -40% |
| 4K Read (MB/s) | 55.3 | 46.07 -17% | 55.4 0% | 56.5 2% | 43.81 -21% |
| 4K Write (MB/s) | 170.5 | 87.2 -49% | 152.9 -10% | 157.7 -8% | 115.5 -32% |
| 4K-64 Read (MB/s) | 2591 | 1372 -47% | 1327 -49% | 2720 5% | 1692 -35% |
| 4K-64 Write (MB/s) | 3190 | 1247 -61% | 1922 -40% | 3366 6% | 2162 -32% |
| Access Time Read * (ms) | 0.04 | 0.052 -30% | 0.035 12% | 0.04 -0% | 0.056 -40% |
| Access Time Write * (ms) | 0.025 | 0.098 -292% | 0.028 -12% | 0.027 -8% | 0.098 -292% |
| Score Read (Points) | 3208 | 1684 -48% | 1666 -48% | 3314 3% | 1956 -39% |
| Score Write (Points) | 3790 | 1611 -57% | 2232 -41% | 3890 3% | 2537 -33% |
| Score Total (Points) | 8563 | 4166 -51% | 4695 -45% | 8804 3% | 5513 -36% |
| Totalt genomsnitt (program/inställningar) | -54% /
-56% | -32% /
-32% | 0% /
-0% | -51% /
-52% |
* ... mindre är bättre

DiskSpd Read Loop, Queue Depth 8
| 3DMark 11 Performance | 19516 poäng | |
| 3DMark Cloud Gate Standard Score | 44393 poäng | |
| 3DMark Fire Strike Score | 15460 poäng | |
| 3DMark Time Spy Score | 6448 poäng | |
Hjälp | ||
| The Witcher 3 - 1920x1080 Ultra Graphics & Postprocessing (HBAO+) | |
| Genomsnitt av klass Gaming (104.7 - 240, n=7, senaste 2 åren) | |
| Aorus 15P YD | |
| Alienware m15 R4 | |
| Genomsnitt NVIDIA GeForce RTX 3070 Laptop GPU (34.9 - 109, n=52) | |
| MSI GS66 Stealth 10UG | |
| Asus ROG Zephyrus M16 GU603H | |
| Asus TUF Gaming F17 FX706HM | |
| Dota 2 Reborn - 1920x1080 ultra (3/3) best looking | |
| Genomsnitt av klass Gaming (84.8 - 252, n=108, senaste 2 åren) | |
| Asus ROG Zephyrus M16 GU603H | |
| Aorus 15P YD | |
| Alienware m15 R4 | |
| Asus TUF Gaming F17 FX706HM | |
| Genomsnitt NVIDIA GeForce RTX 3070 Laptop GPU (26.9 - 163.9, n=58) | |
| MSI GS66 Stealth 10UG | |
| GTA V - 1920x1080 Highest AA:4xMSAA + FX AF:16x | |
| Genomsnitt av klass Gaming (48.3 - 186.9, n=94, senaste 2 åren) | |
| Aorus 15P YD | |
| Genomsnitt NVIDIA GeForce RTX 3070 Laptop GPU (21.7 - 125.8, n=50) | |
| MSI GS66 Stealth 10UG | |
| Asus TUF Gaming F17 FX706HM | |
| Asus ROG Zephyrus M16 GU603H | |
| Final Fantasy XV Benchmark - 1920x1080 High Quality | |
| Genomsnitt av klass Gaming (41 - 215, n=95, senaste 2 åren) | |
| Aorus 15P YD | |
| MSI GS66 Stealth 10UG | |
| Genomsnitt NVIDIA GeForce RTX 3070 Laptop GPU (27.9 - 107, n=49) | |
| Asus TUF Gaming F17 FX706HM | |
| Asus ROG Zephyrus M16 GU603H | |
| Alienware m15 R4 | |
| Strange Brigade - 1920x1080 ultra AA:ultra AF:16 | |
| Genomsnitt av klass Gaming (76.3 - 458, n=87, senaste 2 åren) | |
| Aorus 15P YD | |
| Genomsnitt NVIDIA GeForce RTX 3070 Laptop GPU (36.2 - 194, n=46) | |
| MSI GS66 Stealth 10UG | |
| Asus TUF Gaming F17 FX706HM | |
| Asus ROG Zephyrus M16 GU603H | |
| Cyberpunk 2077 1.0 - 1920x1080 Ultra Preset | |
| Aorus 15P YD | |
| Alienware m15 R4 | |
| Genomsnitt NVIDIA GeForce RTX 3070 Laptop GPU (50 - 70.5, n=11) | |
| Asus ROG Zephyrus M16 GU603H | |
The Witcher 3 - Spel-stresstest (FPS)
| låg | med. | hög | ultra | QHD | |
|---|---|---|---|---|---|
| GTA V (2015) | 184 | 179 | 151 | 79.4 | |
| The Witcher 3 (2015) | 89.1 | ||||
| Dota 2 Reborn (2015) | 173 | 156 | 148 | 139 | |
| Final Fantasy XV Benchmark (2018) | 137 | 81 | 65.7 | 49.1 | |
| X-Plane 11.11 (2018) | 126 | 106 | 86.4 | ||
| Far Cry 5 (2018) | 110 | 85 | |||
| Strange Brigade (2018) | 311 | 146 | 119 | 105 | 82.3 |
| Cyberpunk 2077 1.0 (2020) | 59.4 | 38.4 |
Ljudnivå
| Låg belastning |
| 25 / 31 / 42 dB(A) |
| Hög belastning |
| 48 / 56 dB(A) |
 | ||
30 dB tyst 40 dB(A) hörbar 50 dB(A) högt ljud |
||
min: | ||
(-) Den maximala temperaturen på ovansidan är 52 °C / 126 F, jämfört med genomsnittet av 40.4 °C / 105 F , allt från 21.2 till 68.8 °C för klassen Gaming.
(-) Botten värms upp till maximalt 53 °C / 127 F, jämfört med genomsnittet av 43.2 °C / 110 F
(±) Vid tomgångsbruk är medeltemperaturen för ovansidan 35.8 °C / 96 F, jämfört med enhetsgenomsnittet på 33.9 °C / ### class_avg_f### F.
(-) När du spelar The Witcher 3 är medeltemperaturen för ovansidan 45 °C / 113 F, jämfört med enhetsgenomsnittet på 33.9 °C / ## #class_avg_f### F.
(±) Handledsstöden och pekplattan kan bli väldigt varma vid beröring med maximalt 39 °C / 102.2 F.
(-) Medeltemperaturen för handledsstödsområdet på liknande enheter var 28.8 °C / 83.8 F (-10.2 °C / -18.4 F).
Asus ROG Zephyrus M16 GU603H ljudanalys
(±) | högtalarljudstyrkan är genomsnittlig men bra (80 dB)
Bas 100 - 315 Hz
(±) | reducerad bas - i genomsnitt 7.4% lägre än medianen
(±) | linjäriteten för basen är genomsnittlig (9.2% delta till föregående frekvens)
Mellan 400 - 2000 Hz
(±) | högre mellan - i genomsnitt 5.6% högre än median
(+) | mids är linjära (4% delta till föregående frekvens)
Högsta 2 - 16 kHz
(+) | balanserade toppar - endast 2.6% från medianen
(+) | toppar är linjära (6.7% delta till föregående frekvens)
Totalt 100 - 16 000 Hz
(+) | det totala ljudet är linjärt (12.1% skillnad mot median)
Jämfört med samma klass
» 12% av alla testade enheter i den här klassen var bättre, 4% liknande, 84% sämre
» Den bästa hade ett delta på 6%, genomsnittet var 18%, sämst var 132%
Jämfört med alla testade enheter
» 10% av alla testade enheter var bättre, 2% liknande, 88% sämre
» Den bästa hade ett delta på 4%, genomsnittet var 23%, sämst var 134%
Apple MacBook 12 (Early 2016) 1.1 GHz ljudanalys
(+) | högtalare kan spela relativt högt (83.6 dB)
Bas 100 - 315 Hz
(±) | reducerad bas - i genomsnitt 11.3% lägre än medianen
(±) | linjäriteten för basen är genomsnittlig (14.2% delta till föregående frekvens)
Mellan 400 - 2000 Hz
(+) | balanserad mellan - endast 2.4% från medianen
(+) | mids är linjära (5.5% delta till föregående frekvens)
Högsta 2 - 16 kHz
(+) | balanserade toppar - endast 2% från medianen
(+) | toppar är linjära (4.5% delta till föregående frekvens)
Totalt 100 - 16 000 Hz
(+) | det totala ljudet är linjärt (10.2% skillnad mot median)
Jämfört med samma klass
» 7% av alla testade enheter i den här klassen var bättre, 2% liknande, 90% sämre
» Den bästa hade ett delta på 5%, genomsnittet var 18%, sämst var 53%
Jämfört med alla testade enheter
» 5% av alla testade enheter var bättre, 1% liknande, 94% sämre
» Den bästa hade ett delta på 4%, genomsnittet var 23%, sämst var 134%
| Av/Standby | |
| Låg belastning | |
| Hög belastning |
|
Förklaring:
min: | |
| Asus ROG Zephyrus M16 GU603H i9-11900H, GeForce RTX 3070 Laptop GPU | Alienware m15 R4 i9-10980HK, GeForce RTX 3070 Laptop GPU | Asus TUF Gaming F17 FX706HM i9-11900H, GeForce RTX 3060 Laptop GPU | Aorus 15P YD i7-11800H, GeForce RTX 3080 Laptop GPU | MSI GS66 Stealth 10UG i7-10870H, GeForce RTX 3070 Laptop GPU | Genomsnitt NVIDIA GeForce RTX 3070 Laptop GPU | Genomsnitt av klass Gaming | |
|---|---|---|---|---|---|---|---|
| Power Consumption | -75% | 18% | -34% | 1% | -10% | -5% | |
| Idle Minimum * (Watt) | 11 | 35 -218% | 10.3 6% | 23 -109% | 12.9 -17% | 15.6 ? -42% | 13 ? -18% |
| Idle Average * (Watt) | 20 | 39 -95% | 13.1 34% | 25 -25% | 15.4 23% | 20.1 ? -1% | 19 ? 5% |
| Idle Maximum * (Watt) | 30 | 48 -60% | 14.1 53% | 35 -17% | 27.1 10% | 29.4 ? 2% | 24.5 ? 18% |
| Load Average * (Watt) | 111 | 135 -22% | 110 1% | 101 9% | 98.2 12% | 110.8 ? -0% | 111.1 ? -0% |
| Witcher 3 ultra * (Watt) | 156 | 194 -24% | 138 12% | 190 -22% | 164.9 -6% | ||
| Load Maximum * (Watt) | 197 | 252 -28% | 190 4% | 280 -42% | 232.9 -18% | 214 ? -9% | 260 ? -32% |
* ... mindre är bättre
Energiförbrukning vid spel (The Witcher 3)
| Asus ROG Zephyrus M16 GU603H i9-11900H, GeForce RTX 3070 Laptop GPU, 90 Wh | Alienware m15 R4 i9-10980HK, GeForce RTX 3070 Laptop GPU, 86 Wh | Asus TUF Gaming F17 FX706HM i9-11900H, GeForce RTX 3060 Laptop GPU, 90 Wh | Aorus 15P YD i7-11800H, GeForce RTX 3080 Laptop GPU, 99 Wh | MSI GS66 Stealth 10UG i7-10870H, GeForce RTX 3070 Laptop GPU, 99.9 Wh | Genomsnitt av klass Gaming | |
|---|---|---|---|---|---|---|
| Batteridrifttid | -60% | 28% | -15% | 4% | -17% | |
| Reader / Idle (h) | 13.3 | 3.7 -72% | 7.5 -44% | 10.8 -19% | 8.27 ? -38% | |
| WiFi v1.3 (h) | 7.7 | 2.7 -65% | 7.6 -1% | 5.3 -31% | 7.1 -8% | 7.11 ? -8% |
| Load (h) | 1.6 | 0.9 -44% | 2.5 56% | 2.1 31% | 2.2 38% | 1.502 ? -6% |
För
Emot
Omdöme - Zephyrus M16 imponerar
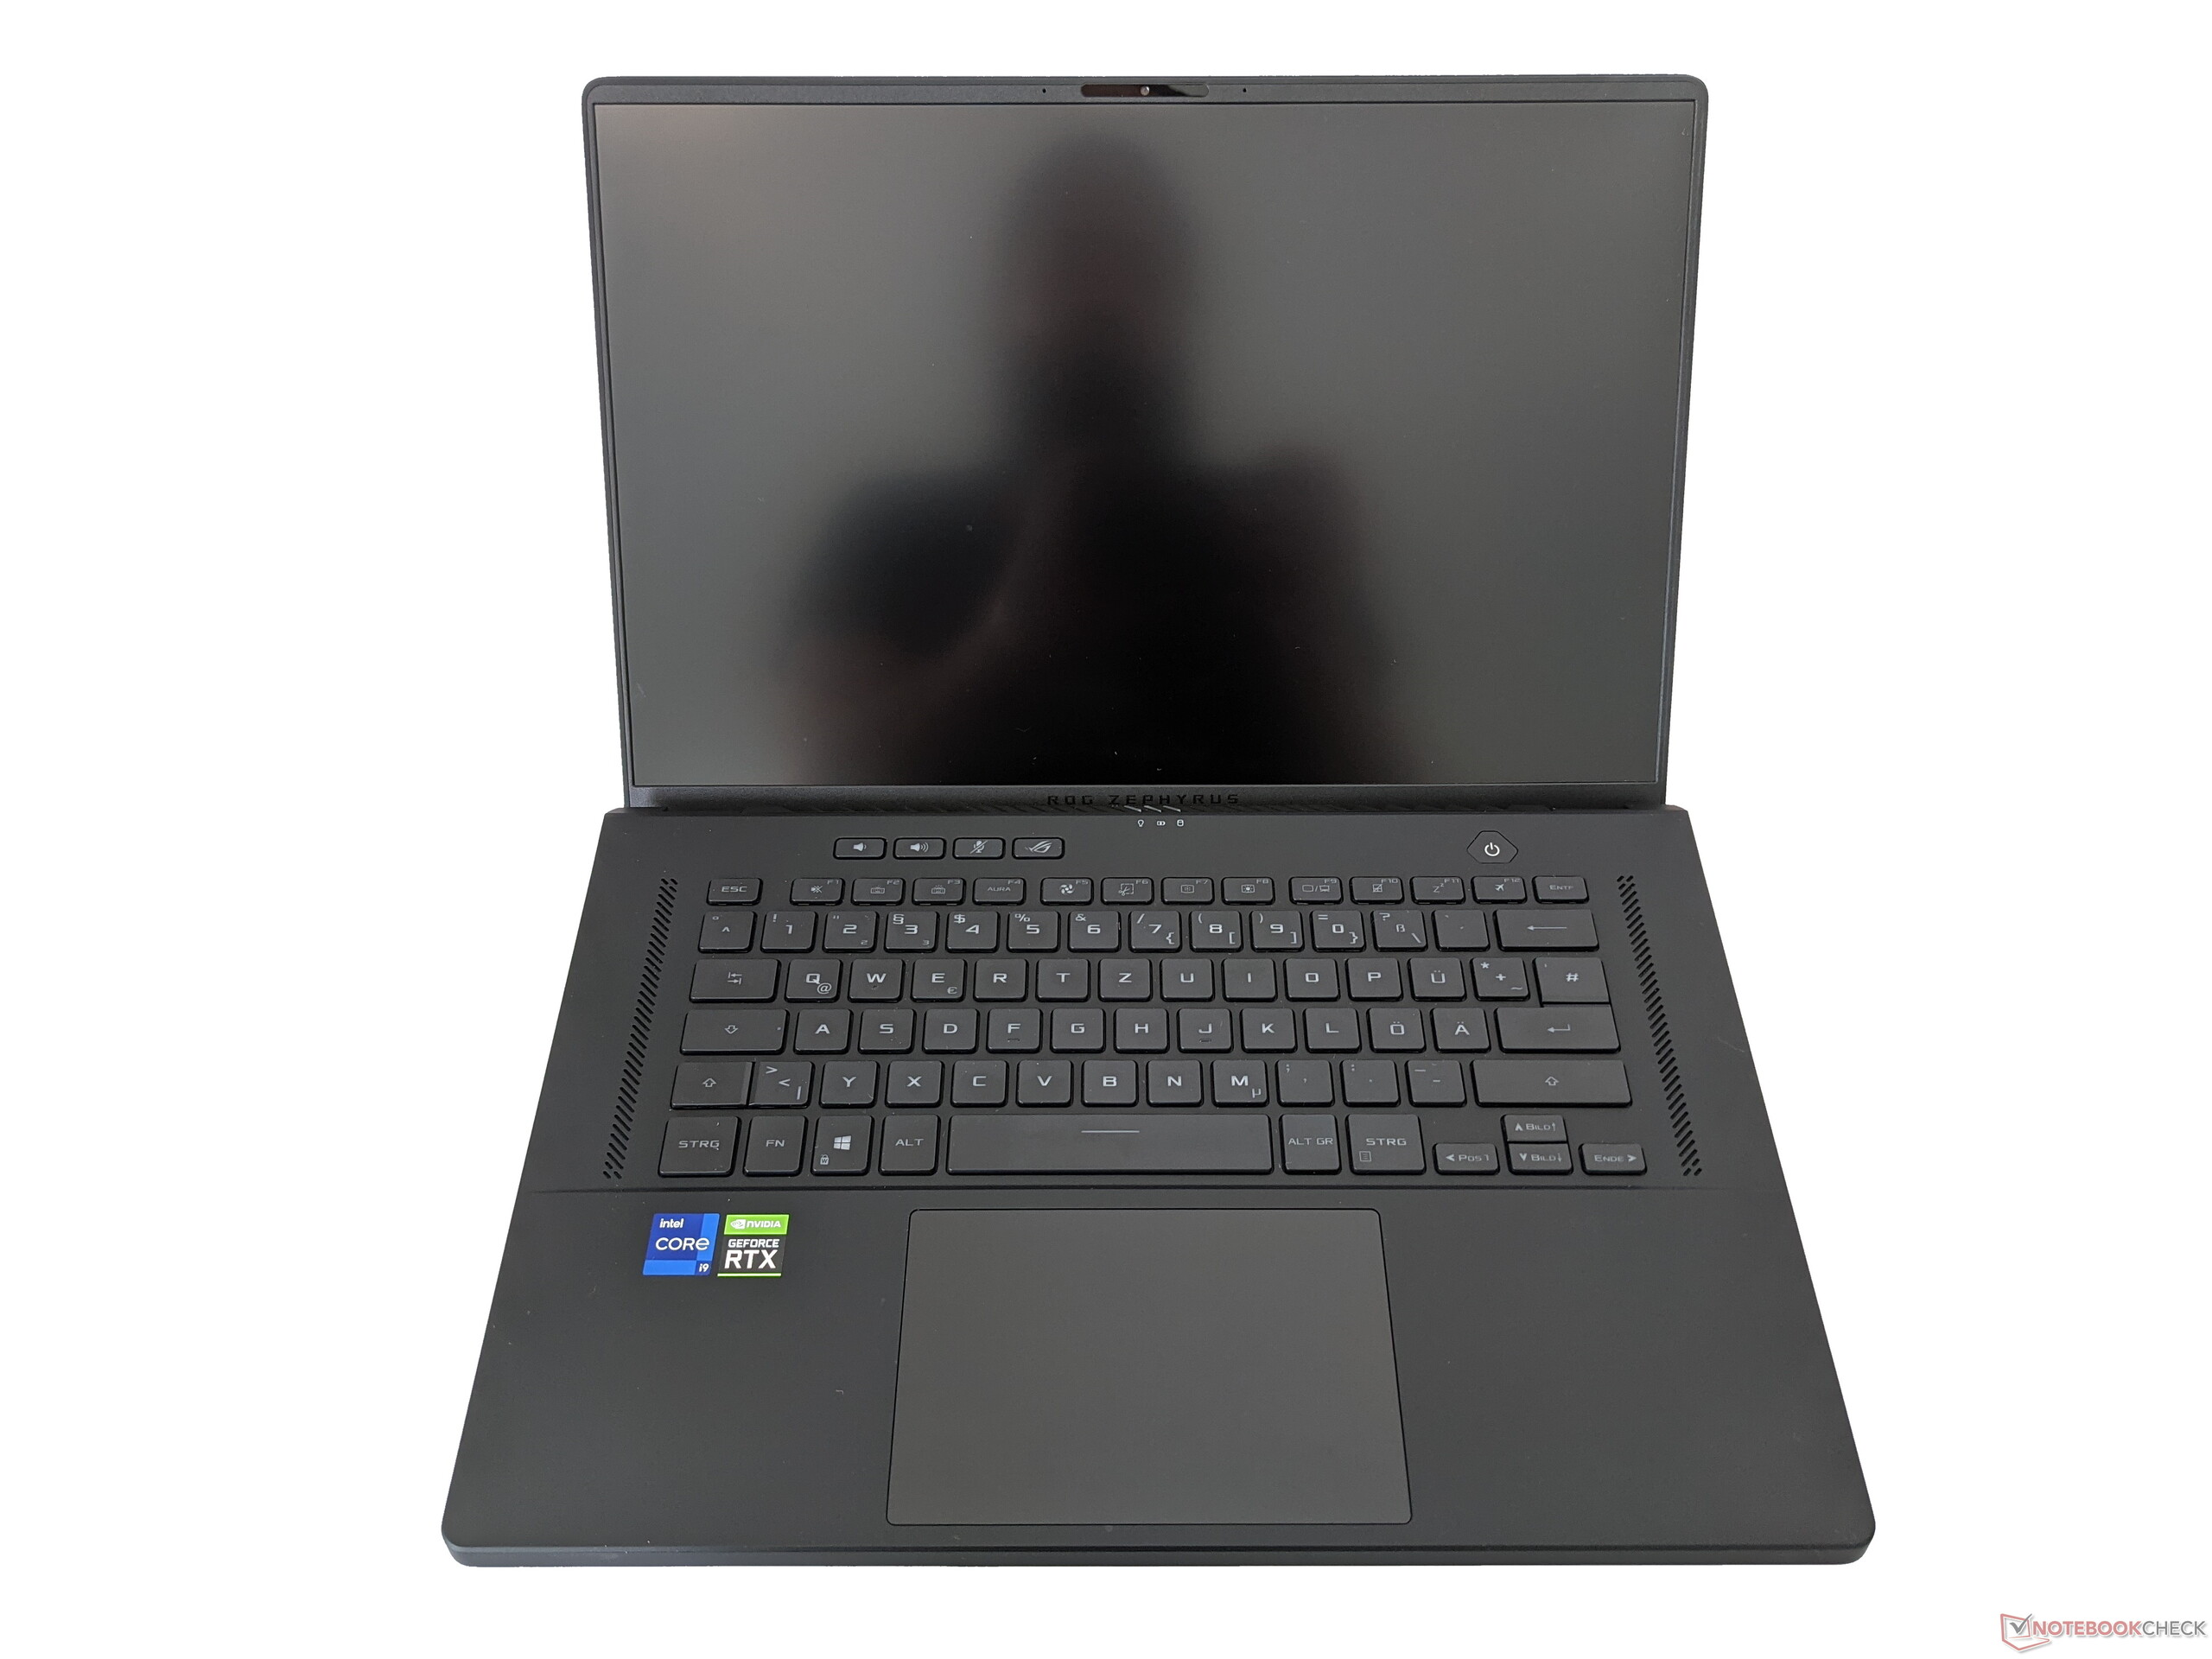
Asus ROG Zephyrus M16 är gjord för den som letar efter en spellaptop med 16:10-skärm. Asus laptop har större skärmyta än vad som är typiskt för en vanlig 15 tumsenhet. Dessutom är skärmen väldigt ljusstark och har exakta färger och snabb bilduppdatering (165 Hz). Ett bra portutbud, goda möjligheter till service och bra inmatningsenheter rundar av paketet.
Asus ROG Zephyrus M16 är en unik spellaptop tack vare 16:10-skärmen.
Den har några brister, exempelvis medioker WiFi-prestanda. Nvidia GeForce RTX 3070 är en väldigt kapabel GPU som kan köra alla moderna titlar. Men andra spellaptops som Alienware m15 R4 eller MSI GS66 Stealth 10UG lyckas krama ur mer prestanda ur samma GPU. Zephyrus M16 har dock riktigt hög CPU-prestanda. Med en SSD-enhet på 2 TB och 32 GB RAM passar Zephyrus M16 bra till alla typer av uppgifter.
Asus ROG Zephyrus M16 GU603H
- 06/27/2021 v7 (old)
Mike Wobker
Price comparison
