Test: Asus ROG Chimera G703 (i7-7820HK, GTX 1080, Full HD) Laptop (Sammanfattning)
| SD Card Reader | |
| average JPG Copy Test (av. of 3 runs) | |
| Schenker XMG Ultra 17 (Toshiba Exceria Pro SDXC 64 GB UHS-II) | |
| Asus G703 (Toshiba Exceria Pro SDXC 64 GB UHS-II) | |
| Genomsnitt av klass Gaming (20.9 - 210, n=54, senaste 2 åren) | |
| MSI GT75VR 7RF-012 Titan Pro (Toshiba Exceria Pro SDXC 64 GB UHS-II) | |
| Acer Predator 17 X GX-792-76DL (Toshiba Exceria Pro SDXC 64 GB UHS-II) | |
| maximum AS SSD Seq Read Test (1GB) | |
| Asus G703 (Toshiba Exceria Pro SDXC 64 GB UHS-II) | |
| Schenker XMG Ultra 17 (Toshiba Exceria Pro SDXC 64 GB UHS-II) | |
| Genomsnitt av klass Gaming (25.5 - 261, n=51, senaste 2 åren) | |
| Acer Predator 17 X GX-792-76DL (Toshiba Exceria Pro SDXC 64 GB UHS-II) | |
| MSI GT75VR 7RF-012 Titan Pro (Toshiba Exceria Pro SDXC 64 GB UHS-II) | |
| |||||||||||||||||||||||||
Distribution av ljusstyrkan: 80 %
Mitt på batteriet: 274 cd/m²
Kontrast: 945:1 (Svärta: 0.29 cd/m²)
ΔE ColorChecker Calman: 3.99 | ∀{0.5-29.43 Ø4.71}
calibrated: 1.79
ΔE Greyscale Calman: 4.14 | ∀{0.09-98 Ø4.96}
92% sRGB (Argyll 1.6.3 3D)
60% AdobeRGB 1998 (Argyll 1.6.3 3D)
66.6% AdobeRGB 1998 (Argyll 3D)
92.4% sRGB (Argyll 3D)
65.5% Display P3 (Argyll 3D)
Gamma: 2.58
CCT: 7352 K
| Asus G703 AUO B173HAN03.0 (AUO309D), IPS, 1920x1080 | Schenker XMG Ultra 17 AU Optronics B173ZAN01.0 (AUO109B), IPS, 3840x2160 | Acer Predator 17 X GX-792-76DL LP173WF4-SPF5 (LGD056D), IPS, 1920x1080 | MSI GT75VR 7RF-012 Titan Pro CMN N173HHE-G32 (CMN1747), TN LED, 1920x1080 | Alienware 17 R4 TN LED, 2560x1440 | |
|---|---|---|---|---|---|
| Display | 30% | -5% | 25% | -9% | |
| Display P3 Coverage (%) | 65.5 | 86.4 32% | 66 1% | 90.3 38% | 61.2 -7% |
| sRGB Coverage (%) | 92.4 | 100 8% | 83.7 -9% | 99.6 8% | 82.9 -10% |
| AdobeRGB 1998 Coverage (%) | 66.6 | 99.1 49% | 61.2 -8% | 86.8 30% | 60.5 -9% |
| Response Times | -136% | -153% | 37% | -42% | |
| Response Time Grey 50% / Grey 80% * (ms) | 17.6 ? | 44 ? -150% | 45 ? -156% | 11.6 ? 34% | 30 ? -70% |
| Response Time Black / White * (ms) | 11.2 ? | 24.8 ? -121% | 28 ? -150% | 6.8 ? 39% | 12.8 ? -14% |
| PWM Frequency (Hz) | 25000 ? | ||||
| Screen | 15% | 4% | 26% | -16% | |
| Brightness middle (cd/m²) | 274 | 332 21% | 380 39% | 274 0% | 402.3 47% |
| Brightness (cd/m²) | 268 | 313 17% | 362 35% | 262 -2% | 372 39% |
| Brightness Distribution (%) | 80 | 88 10% | 91 14% | 87 9% | 86 8% |
| Black Level * (cd/m²) | 0.29 | 0.28 3% | 0.37 -28% | 0.26 10% | 0.62 -114% |
| Contrast (:1) | 945 | 1186 26% | 1027 9% | 1054 12% | 649 -31% |
| Colorchecker dE 2000 * | 3.99 | 3.86 3% | 4.12 -3% | 1.36 66% | 5.6 -40% |
| Colorchecker dE 2000 max. * | 7.33 | 5.88 20% | 8.19 -12% | 4.1 44% | 9.8 -34% |
| Colorchecker dE 2000 calibrated * | 1.79 | ||||
| Greyscale dE 2000 * | 4.14 | 4.33 -5% | 3.95 5% | 0.64 85% | 4.7 -14% |
| Gamma | 2.58 85% | 2.41 91% | 2.47 89% | 2.19 100% | 2.14 103% |
| CCT | 7352 88% | 6595 99% | 6539 99% | 6551 99% | 7519 86% |
| Color Space (Percent of AdobeRGB 1998) (%) | 60 | 88 47% | 55 -8% | 77 28% | 53.7 -10% |
| Color Space (Percent of sRGB) (%) | 92 | 100 9% | 84 -9% | 100 9% | 82.2 -11% |
| Totalt genomsnitt (program/inställningar) | -30% /
-2% | -51% /
-19% | 29% /
27% | -22% /
-18% |
* ... mindre är bättre
Visa svarstider
| ↔ Svarstid svart till vitt | ||
|---|---|---|
| 11.2 ms ... stiga ↗ och falla ↘ kombinerat | ↗ 6 ms stiga | 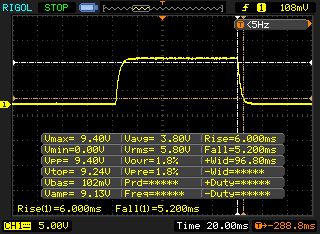 |
| ↘ 5.2 ms hösten | ||
| Skärmen visar bra svarsfrekvens i våra tester, men kan vara för långsam för konkurrenskraftiga spelare. I jämförelse sträcker sig alla testade enheter från 0.1 (minst) till 240 (maximalt) ms. » 30 % av alla enheter är bättre. Det betyder att den uppmätta svarstiden är bättre än genomsnittet av alla testade enheter (19.8 ms). | ||
| ↔ Svarstid 50 % grått till 80 % grått | ||
| 17.6 ms ... stiga ↗ och falla ↘ kombinerat | ↗ 8.4 ms stiga | 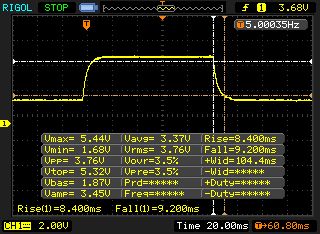 |
| ↘ 9.2 ms hösten | ||
| Skärmen visar bra svarsfrekvens i våra tester, men kan vara för långsam för konkurrenskraftiga spelare. I jämförelse sträcker sig alla testade enheter från 0.165 (minst) till 636 (maximalt) ms. » 32 % av alla enheter är bättre. Det betyder att den uppmätta svarstiden är bättre än genomsnittet av alla testade enheter (31 ms). | ||
Skärmflimmer / PWM (Puls-Width Modulation)
| Skärmflimmer / PWM upptäcktes inte | 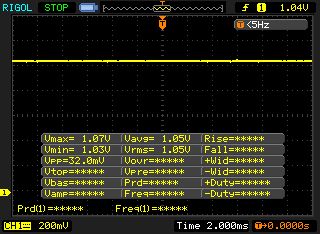 | ||
Som jämförelse: 52 % av alla testade enheter använder inte PWM för att dämpa skärmen. Om PWM upptäcktes mättes ett medelvärde av 7754 (minst: 5 - maximum: 343500) Hz. | |||
| PCMark 8 Home Score Accelerated v2 | 5944 poäng | |
| PCMark 8 Work Score Accelerated v2 | 6016 poäng | |
| PCMark 10 Score | 5035 poäng | |
Hjälp | ||
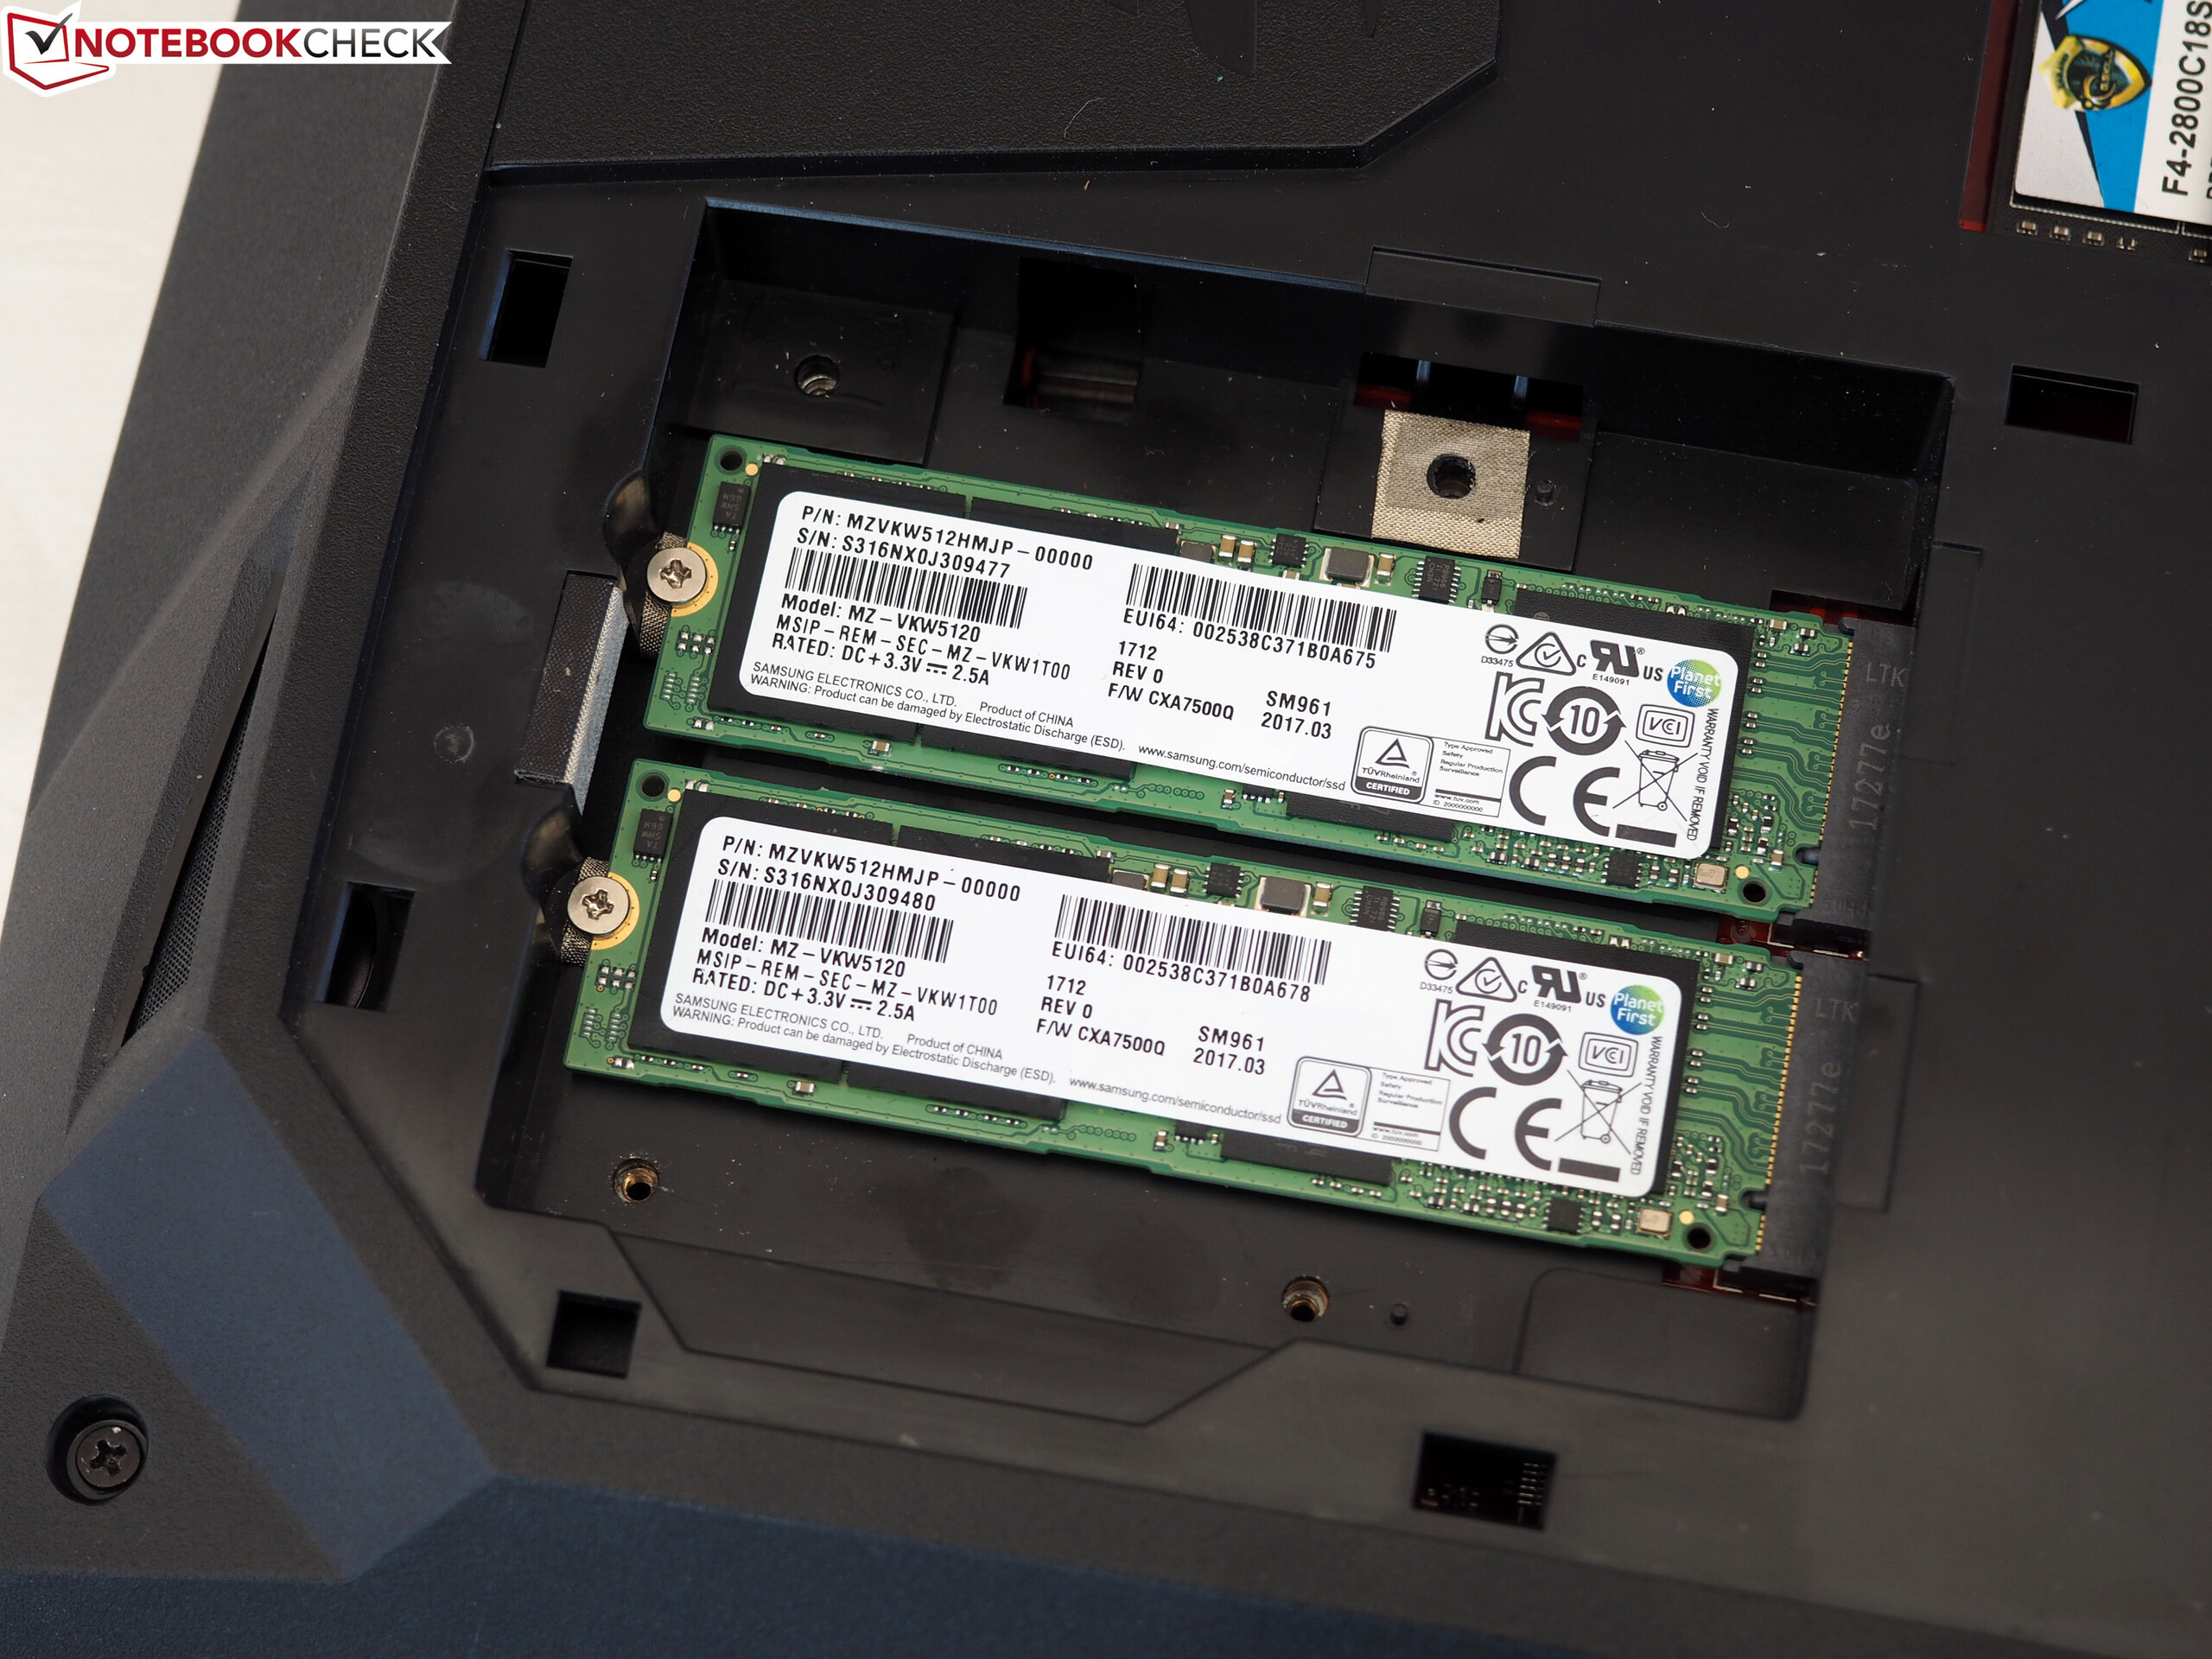
| Asus G703 2x Samsung SM961 MZVKW512HMJP NVMe (RAID 0) | Schenker XMG Ultra 17 Samsung SSD 960 Evo 500GB m.2 NVMe | Acer Predator 17 X GX-792-76DL Toshiba NVMe THNSN5512GPU7 | MSI GT75VR 7RF-012 Titan Pro 2x Samsung SM961 MZVPW256HEGL NVMe (RAID 0) | Alienware 17 R4 SK Hynix PC300 NVMe 512 GB | Genomsnitt 2x Samsung SM961 MZVKW512HMJP NVMe (RAID 0) | |
|---|---|---|---|---|---|---|
| AS SSD | -7% | -30% | -9% | -44% | 0% | |
| Seq Read (MB/s) | 3177 | 2533 -20% | 2261 -29% | 3137 -1% | 1752 -45% | 3177 ? 0% |
| Seq Write (MB/s) | 2556 | 1771 -31% | 1338 -48% | 2352 -8% | 735 -71% | 2556 ? 0% |
| 4K Read (MB/s) | 47.61 | 43.65 -8% | 39.52 -17% | 50.1 5% | 35.61 -25% | 47.6 ? 0% |
| 4K Write (MB/s) | 148.4 | 139.5 -6% | 133.8 -10% | 128.8 -13% | 113.4 -24% | 148.4 ? 0% |
| Score Read (Points) | 1633 | 1716 5% | 1118 -32% | 1412 -14% | 831 -49% | 1633 ? 0% |
| Score Write (Points) | 1519 | 1615 6% | 930 -39% | 1289 -15% | 858 -44% | 1519 ? 0% |
| Score Total (Points) | 3962 | 4173 5% | 2581 -35% | 3392 -14% | 2072 -48% | 3962 ? 0% |

| 3DMark 11 Performance | 21293 poäng | |
| 3DMark Cloud Gate Standard Score | 35865 poäng | |
| 3DMark Fire Strike Score | 17502 poäng | |
Hjälp | ||
| The Witcher 3 - 1920x1080 Ultra Graphics & Postprocessing (HBAO+) | |
| Genomsnitt av klass Gaming (104.7 - 240, n=7, senaste 2 åren) | |
| Alienware 17 R4 | |
| Asus G703 | |
| MSI GT75VR 7RF-012 Titan Pro | |
| Schenker XMG Ultra 17 | |
| Genomsnitt NVIDIA GeForce GTX 1080 Mobile (61.7 - 78.1, n=23) | |
| Acer Predator 17 X GX-792-76DL | |
| låg | med. | hög | ultra | |
|---|---|---|---|---|
| The Witcher 3 (2015) | 148 | 77.9 | ||
| FIFA 18 (2017) | 357 | 348 | ||
| The Evil Within 2 (2017) | 78.3 | 76.1 | ||
| ELEX (2017) | 119 | 104 | ||
| Wolfenstein II: The New Colossus (2017) | 145 | 125 | ||
| Assassin´s Creed Origins (2017) | 98 | 83 | ||
| Call of Duty WWII (2017) | 160 | 136 | ||
| Need for Speed Payback (2017) | 144 | 135 | ||
| Star Wars Battlefront 2 (2017) | 147 | 124 | ||
| Fortnite (2018) | 216 | 159 | ||
| Final Fantasy XV Benchmark (2018) | 80 | |||
| Kingdom Come: Deliverance (2018) | 100 | 76.4 |
Ljudnivå
| Låg belastning |
| 35 / 36 / 38 dB(A) |
| Hög belastning |
| 46 / 54 dB(A) |
 | ||
30 dB tyst 40 dB(A) hörbar 50 dB(A) högt ljud |
||
min: | ||
| Asus G703 GeForce GTX 1080 Mobile, i7-7820HK | Schenker XMG Ultra 17 GeForce GTX 1080 Mobile, i7-8700 | Acer Predator 17 X GX-792-76DL GeForce GTX 1080 Mobile, i7-7820HK | MSI GT75VR 7RF-012 Titan Pro GeForce GTX 1080 Mobile, i7-7820HK | Alienware 17 R4 GeForce GTX 1080 Mobile, i7-7820HK | |
|---|---|---|---|---|---|
| Noise | -2% | 5% | -2% | 1% | |
| av / miljö * (dB) | 30 | 30 -0% | 30 -0% | 30 -0% | 28.2 6% |
| Idle Minimum * (dB) | 35 | 34 3% | 33 6% | 33 6% | 35.6 -2% |
| Idle Average * (dB) | 36 | 35 3% | 35 3% | 34 6% | 35.6 1% |
| Idle Maximum * (dB) | 38 | 40 -5% | 37 3% | 38 -0% | 35.7 6% |
| Load Average * (dB) | 46 | 45 2% | 40 13% | 44 4% | 50.2 -9% |
| Witcher 3 ultra * (dB) | 48 | 52 -8% | 56 -17% | 50.2 -5% | |
| Load Maximum * (dB) | 54 | 60 -11% | 50 7% | 62 -15% | 50.2 7% |
* ... mindre är bättre
(-) Den maximala temperaturen på ovansidan är 55 °C / 131 F, jämfört med genomsnittet av 40.4 °C / 105 F , allt från 21.2 till 68.8 °C för klassen Gaming.
(-) Botten värms upp till maximalt 54 °C / 129 F, jämfört med genomsnittet av 43.2 °C / 110 F
(+) Vid tomgångsbruk är medeltemperaturen för ovansidan 27.1 °C / 81 F, jämfört med enhetsgenomsnittet på 33.9 °C / ### class_avg_f### F.
(±) När du spelar The Witcher 3 är medeltemperaturen för ovansidan 36.2 °C / 97 F, jämfört med enhetsgenomsnittet på 33.9 °C / ## #class_avg_f### F.
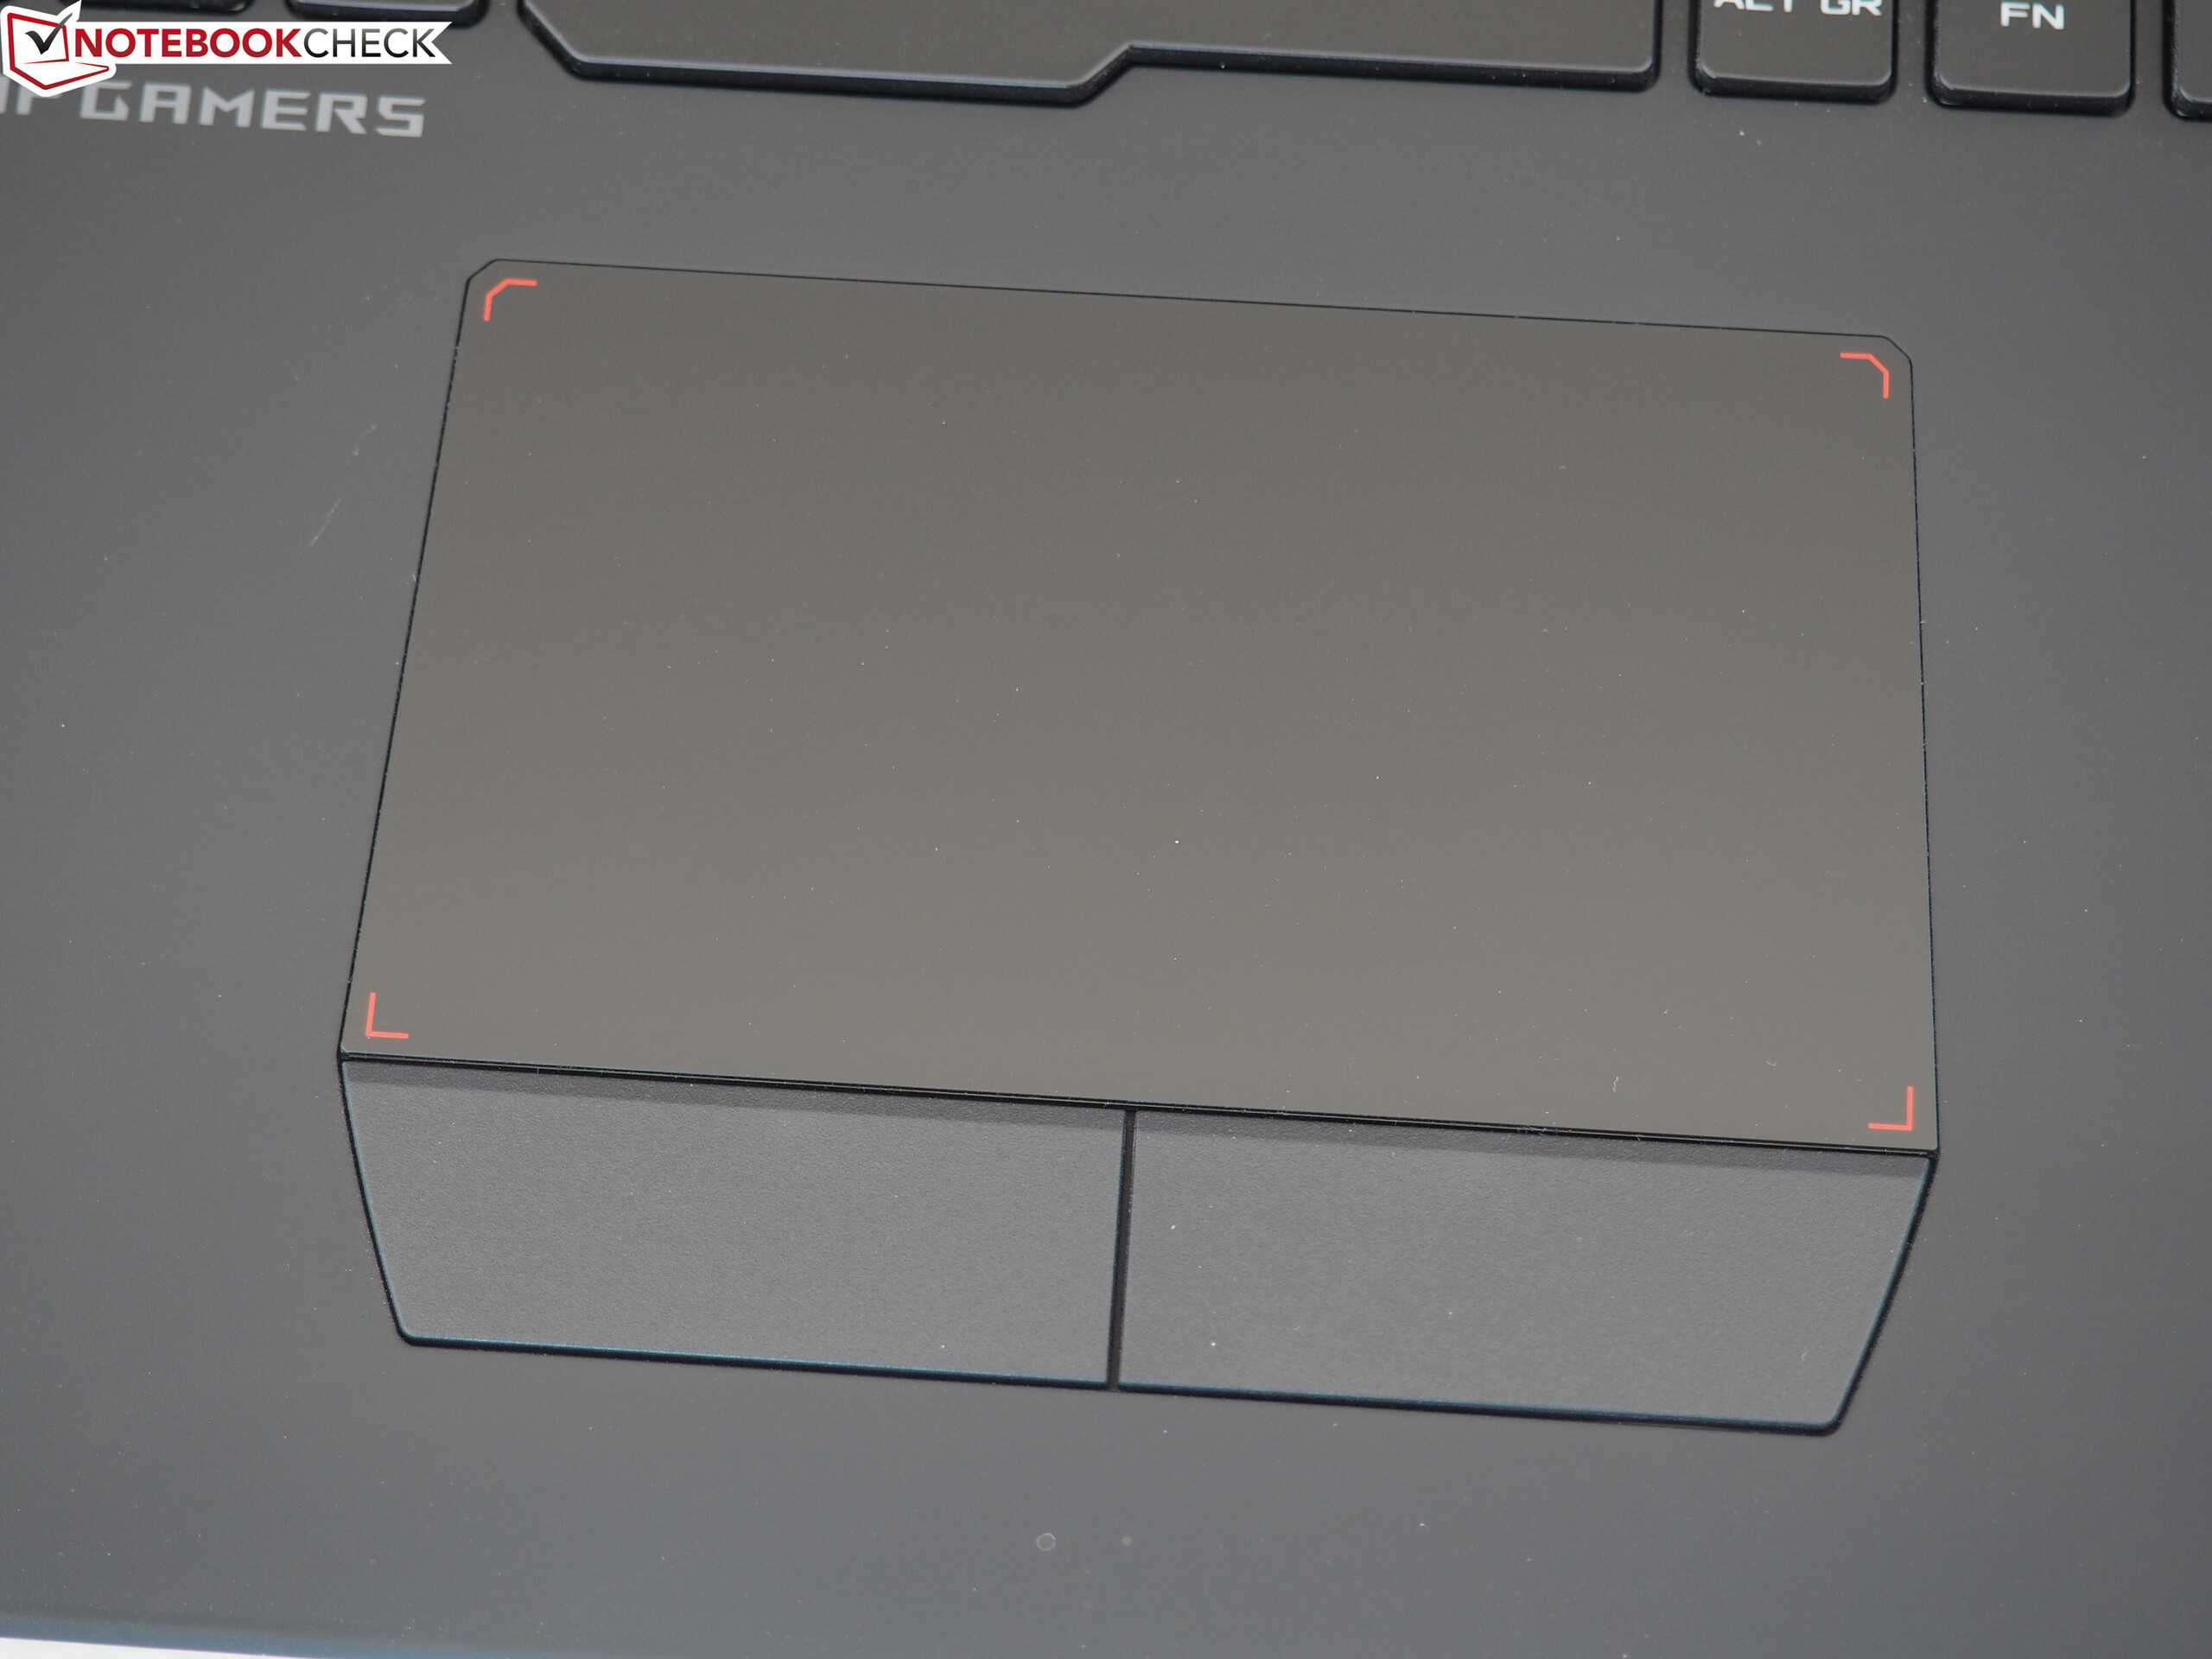
(+) Handledsstöden och pekplattan är kallare än hudtemperaturen med maximalt 28 °C / 82.4 F och är därför svala att ta på.
(±) Medeltemperaturen för handledsstödsområdet på liknande enheter var 28.8 °C / 83.8 F (+0.8 °C / 1.4 F).
| Asus G703 GeForce GTX 1080 Mobile, i7-7820HK | Schenker XMG Ultra 17 GeForce GTX 1080 Mobile, i7-8700 | Acer Predator 17 X GX-792-76DL GeForce GTX 1080 Mobile, i7-7820HK | MSI GT75VR 7RF-012 Titan Pro GeForce GTX 1080 Mobile, i7-7820HK | Alienware 17 R4 GeForce GTX 1080 Mobile, i7-7820HK | |
|---|---|---|---|---|---|
| Heat | 6% | 7% | -4% | 3% | |
| Maximum Upper Side * (°C) | 55 | 41 25% | 44.2 20% | 46 16% | 49.6 10% |
| Maximum Bottom * (°C) | 54 | 48 11% | 43 20% | 57 -6% | 56 -4% |
| Idle Upper Side * (°C) | 29 | 30 -3% | 32.4 -12% | 34 -17% | 29.6 -2% |
| Idle Bottom * (°C) | 32 | 35 -9% | 32.8 -2% | 35 -9% | 29.2 9% |
* ... mindre är bättre
Asus G703 ljudanalys
(+) | högtalare kan spela relativt högt (89 dB)
Bas 100 - 315 Hz
(±) | reducerad bas - i genomsnitt 7.5% lägre än medianen
(+) | basen är linjär (5.9% delta till föregående frekvens)
Mellan 400 - 2000 Hz
(+) | balanserad mellan - endast 4.8% från medianen
(+) | mids är linjära (5% delta till föregående frekvens)
Högsta 2 - 16 kHz
(±) | reducerade toppar - i genomsnitt 5.4% lägre än medianen
(+) | toppar är linjära (6.8% delta till föregående frekvens)
Totalt 100 - 16 000 Hz
(+) | det totala ljudet är linjärt (11.1% skillnad mot median)
Jämfört med samma klass
» 8% av alla testade enheter i den här klassen var bättre, 3% liknande, 89% sämre
» Den bästa hade ett delta på 6%, genomsnittet var 18%, sämst var 132%
Jämfört med alla testade enheter
» 7% av alla testade enheter var bättre, 2% liknande, 91% sämre
» Den bästa hade ett delta på 4%, genomsnittet var 23%, sämst var 134%
Schenker XMG Ultra 17 ljudanalys
(±) | högtalarljudstyrkan är genomsnittlig men bra (79 dB)
Bas 100 - 315 Hz
(+) | bra bas - bara 4.1% från medianen
(±) | linjäriteten för basen är genomsnittlig (12.2% delta till föregående frekvens)
Mellan 400 - 2000 Hz
(±) | högre mellan - i genomsnitt 5.5% högre än median
(+) | mids är linjära (6.5% delta till föregående frekvens)
Högsta 2 - 16 kHz
(+) | balanserade toppar - endast 1.4% från medianen
(+) | toppar är linjära (2% delta till föregående frekvens)
Totalt 100 - 16 000 Hz
(+) | det totala ljudet är linjärt (11% skillnad mot median)
Jämfört med samma klass
» 7% av alla testade enheter i den här klassen var bättre, 3% liknande, 89% sämre
» Den bästa hade ett delta på 6%, genomsnittet var 18%, sämst var 132%
Jämfört med alla testade enheter
» 6% av alla testade enheter var bättre, 2% liknande, 92% sämre
» Den bästa hade ett delta på 4%, genomsnittet var 23%, sämst var 134%
| Av/Standby | |
| Låg belastning | |
| Hög belastning |
|
Förklaring:
min: | |
| Asus G703 GeForce GTX 1080 Mobile, i7-7820HK | Schenker XMG Ultra 17 GeForce GTX 1080 Mobile, i7-8700 | Acer Predator 17 X GX-792-76DL GeForce GTX 1080 Mobile, i7-7820HK | MSI GT75VR 7RF-012 Titan Pro GeForce GTX 1080 Mobile, i7-7820HK | Alienware 17 R4 GeForce GTX 1080 Mobile, i7-7820HK | |
|---|---|---|---|---|---|
| Power Consumption | -7% | 4% | -14% | -4% | |
| Idle Minimum * (Watt) | 26 | 32 -23% | 27 -4% | 34 -31% | 37.5 -44% |
| Idle Average * (Watt) | 30 | 38 -27% | 32 -7% | 41 -37% | 37.6 -25% |
| Idle Maximum * (Watt) | 37 | 45 -22% | 41 -11% | 50 -35% | 37.6 -2% |
| Load Average * (Watt) | 123 | 96 22% | 102 17% | 106 14% | 122.4 -0% |
| Witcher 3 ultra * (Watt) | 257 | 237 8% | 257 -0% | 180.3 30% | |
| Load Maximum * (Watt) | 341 | 331 3% | 248 27% | 320 6% | 277.4 19% |
* ... mindre är bättre
| Asus G703 GeForce GTX 1080 Mobile, i7-7820HK, 71 Wh | Schenker XMG Ultra 17 GeForce GTX 1080 Mobile, i7-8700, 82 Wh | Acer Predator 17 X GX-792-76DL GeForce GTX 1080 Mobile, i7-7820HK, 88.8 Wh | MSI GT75VR 7RF-012 Titan Pro GeForce GTX 1080 Mobile, i7-7820HK, 75 Wh | Alienware 17 R4 GeForce GTX 1080 Mobile, i7-7820HK, 99 Wh | Genomsnitt av klass Gaming | |
|---|---|---|---|---|---|---|
| Batteridrifttid | 4% | 59% | 3% | 31% | 162% | |
| Reader / Idle (h) | 3.3 | 2.7 -18% | 5.2 58% | 3 -9% | 4.6 39% | 8.27 ? 151% |
| H.264 (h) | 2.4 | 2.5 4% | 3.4 42% | 2.5 4% | 8.32 ? 247% | |
| WiFi v1.3 (h) | 2.5 | 2.4 -4% | 4.2 68% | 2.4 -4% | 3 20% | 7.11 ? 184% |
| Load (h) | 0.9 | 1.2 33% | 1.5 67% | 1.1 22% | 1.2 33% | 1.502 ? 67% |
För
Emot
Läs den fullständiga versionen av den här recensionen på engelska här.
Så länge som det gäller kraftfulla desktop-alternativ så kan ROG Chimera G703 ta en plats på vinnarpodiet utan några problem.
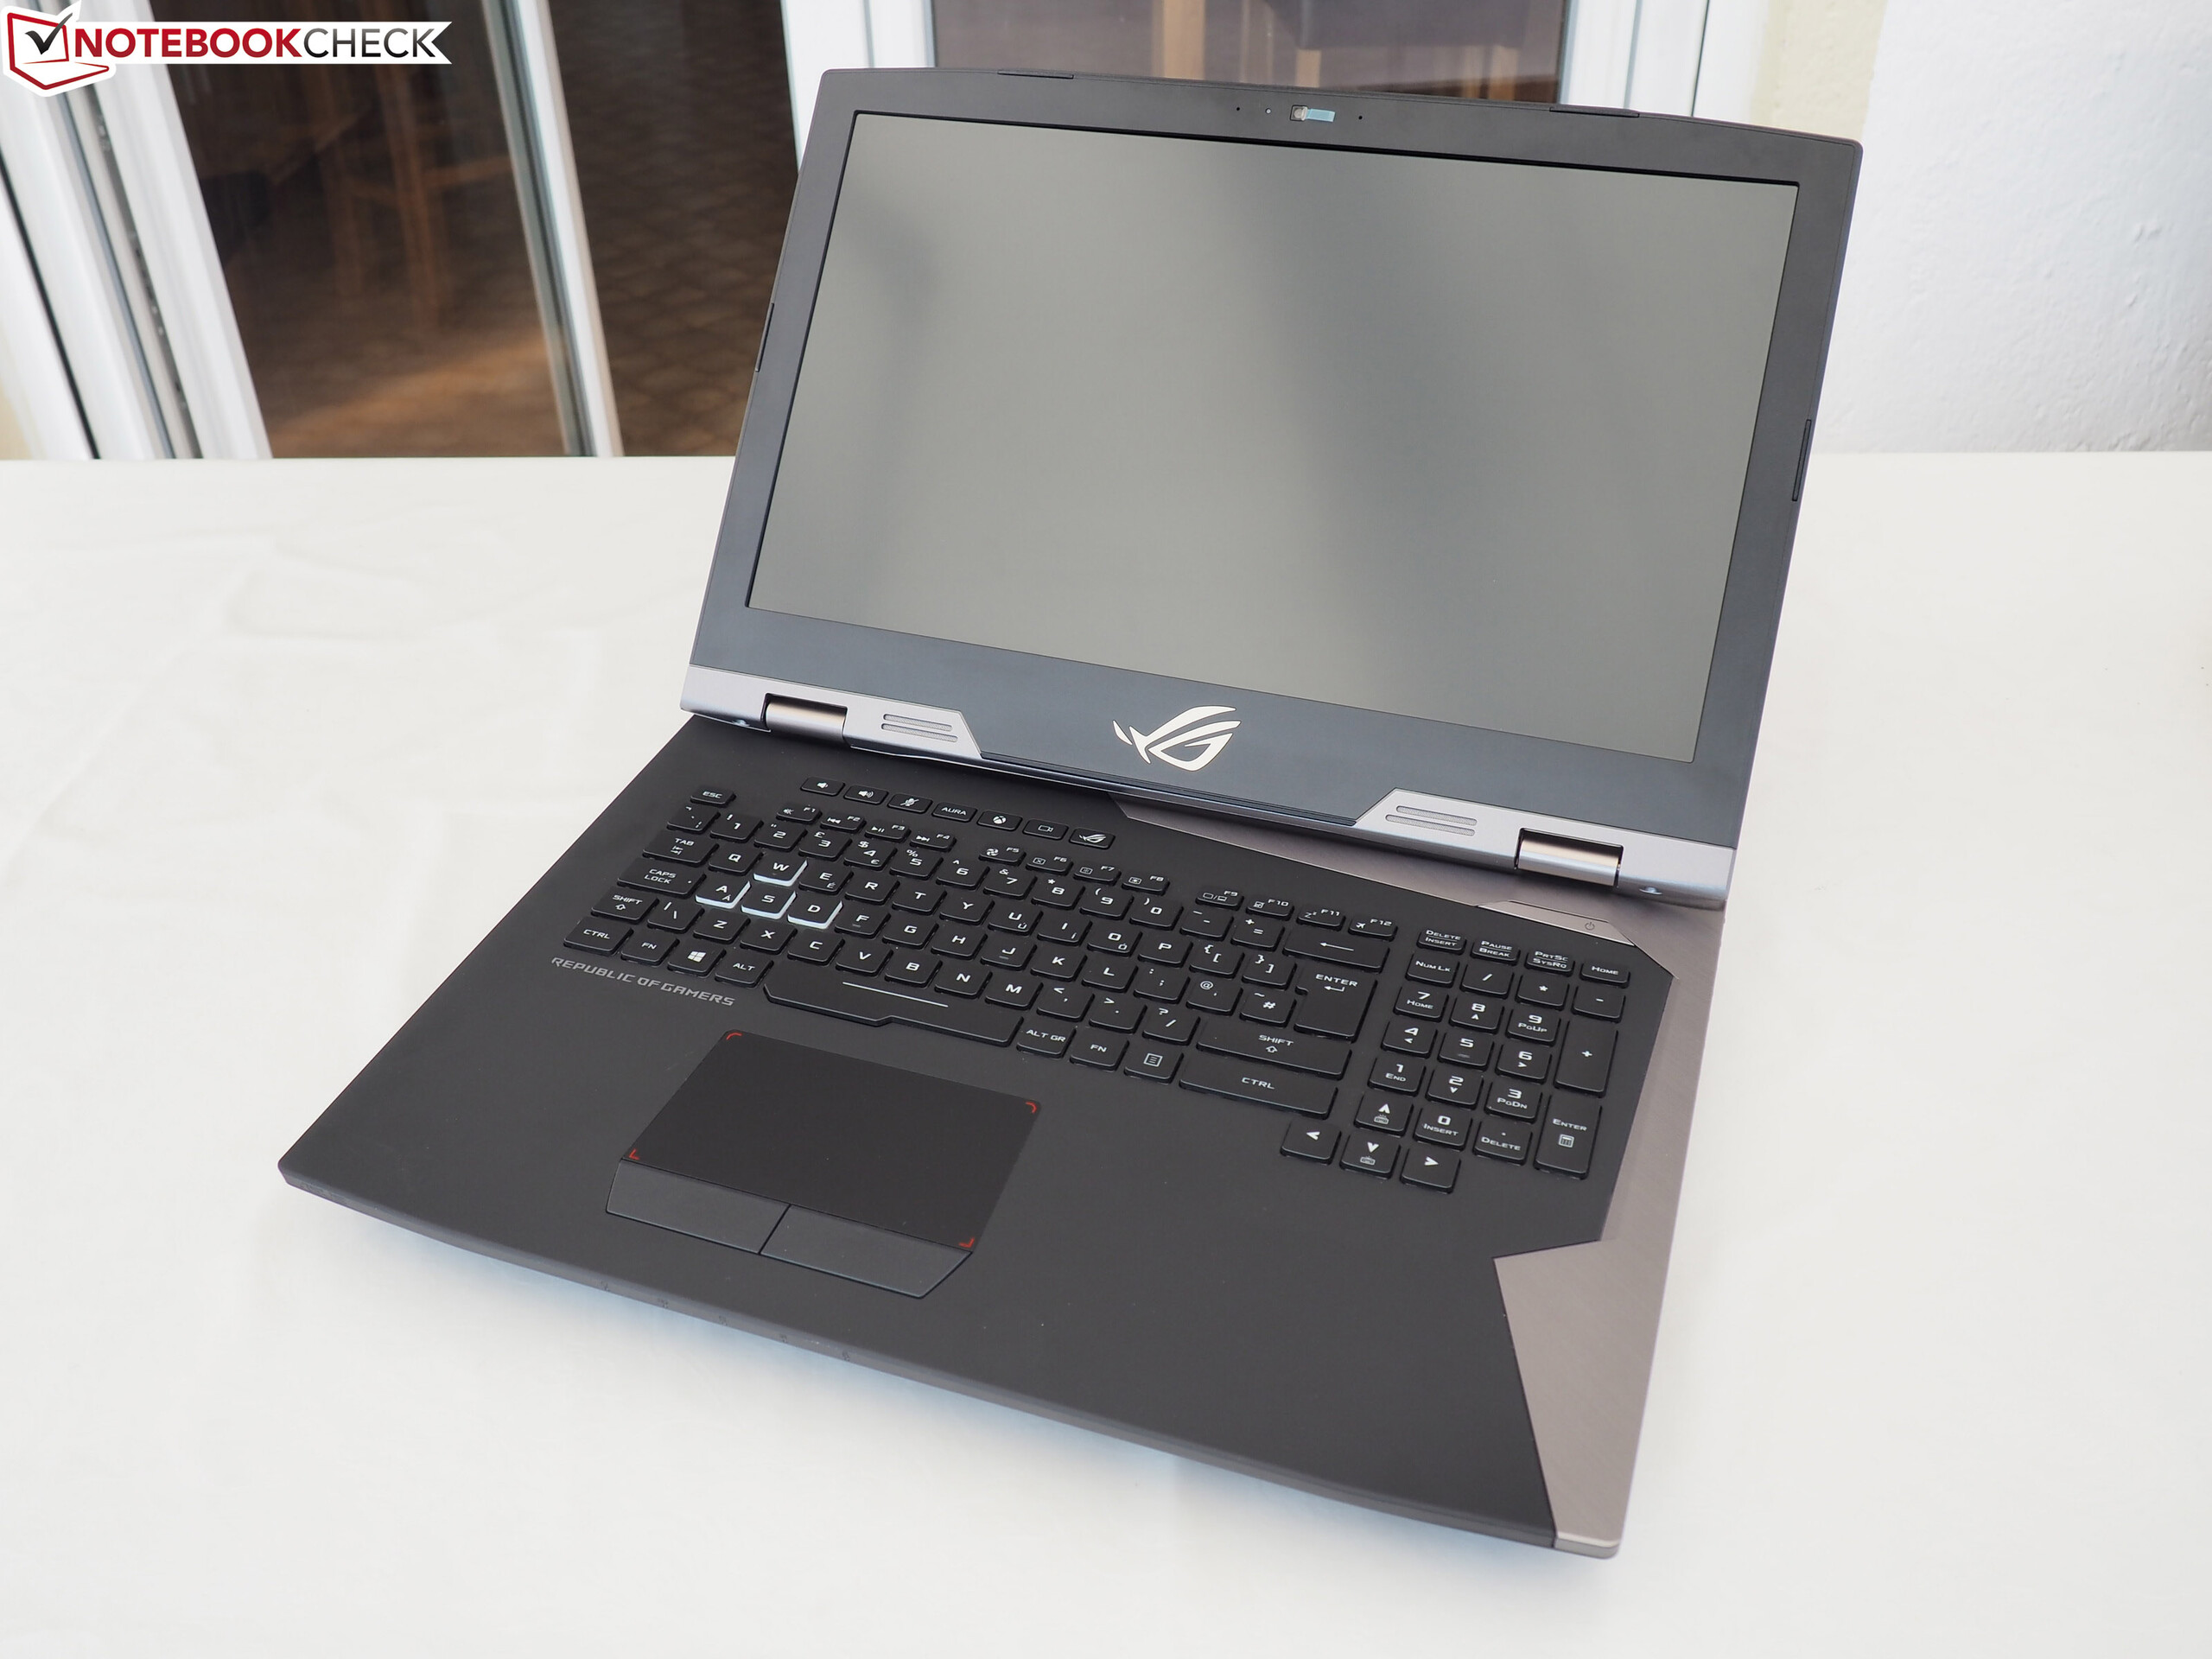
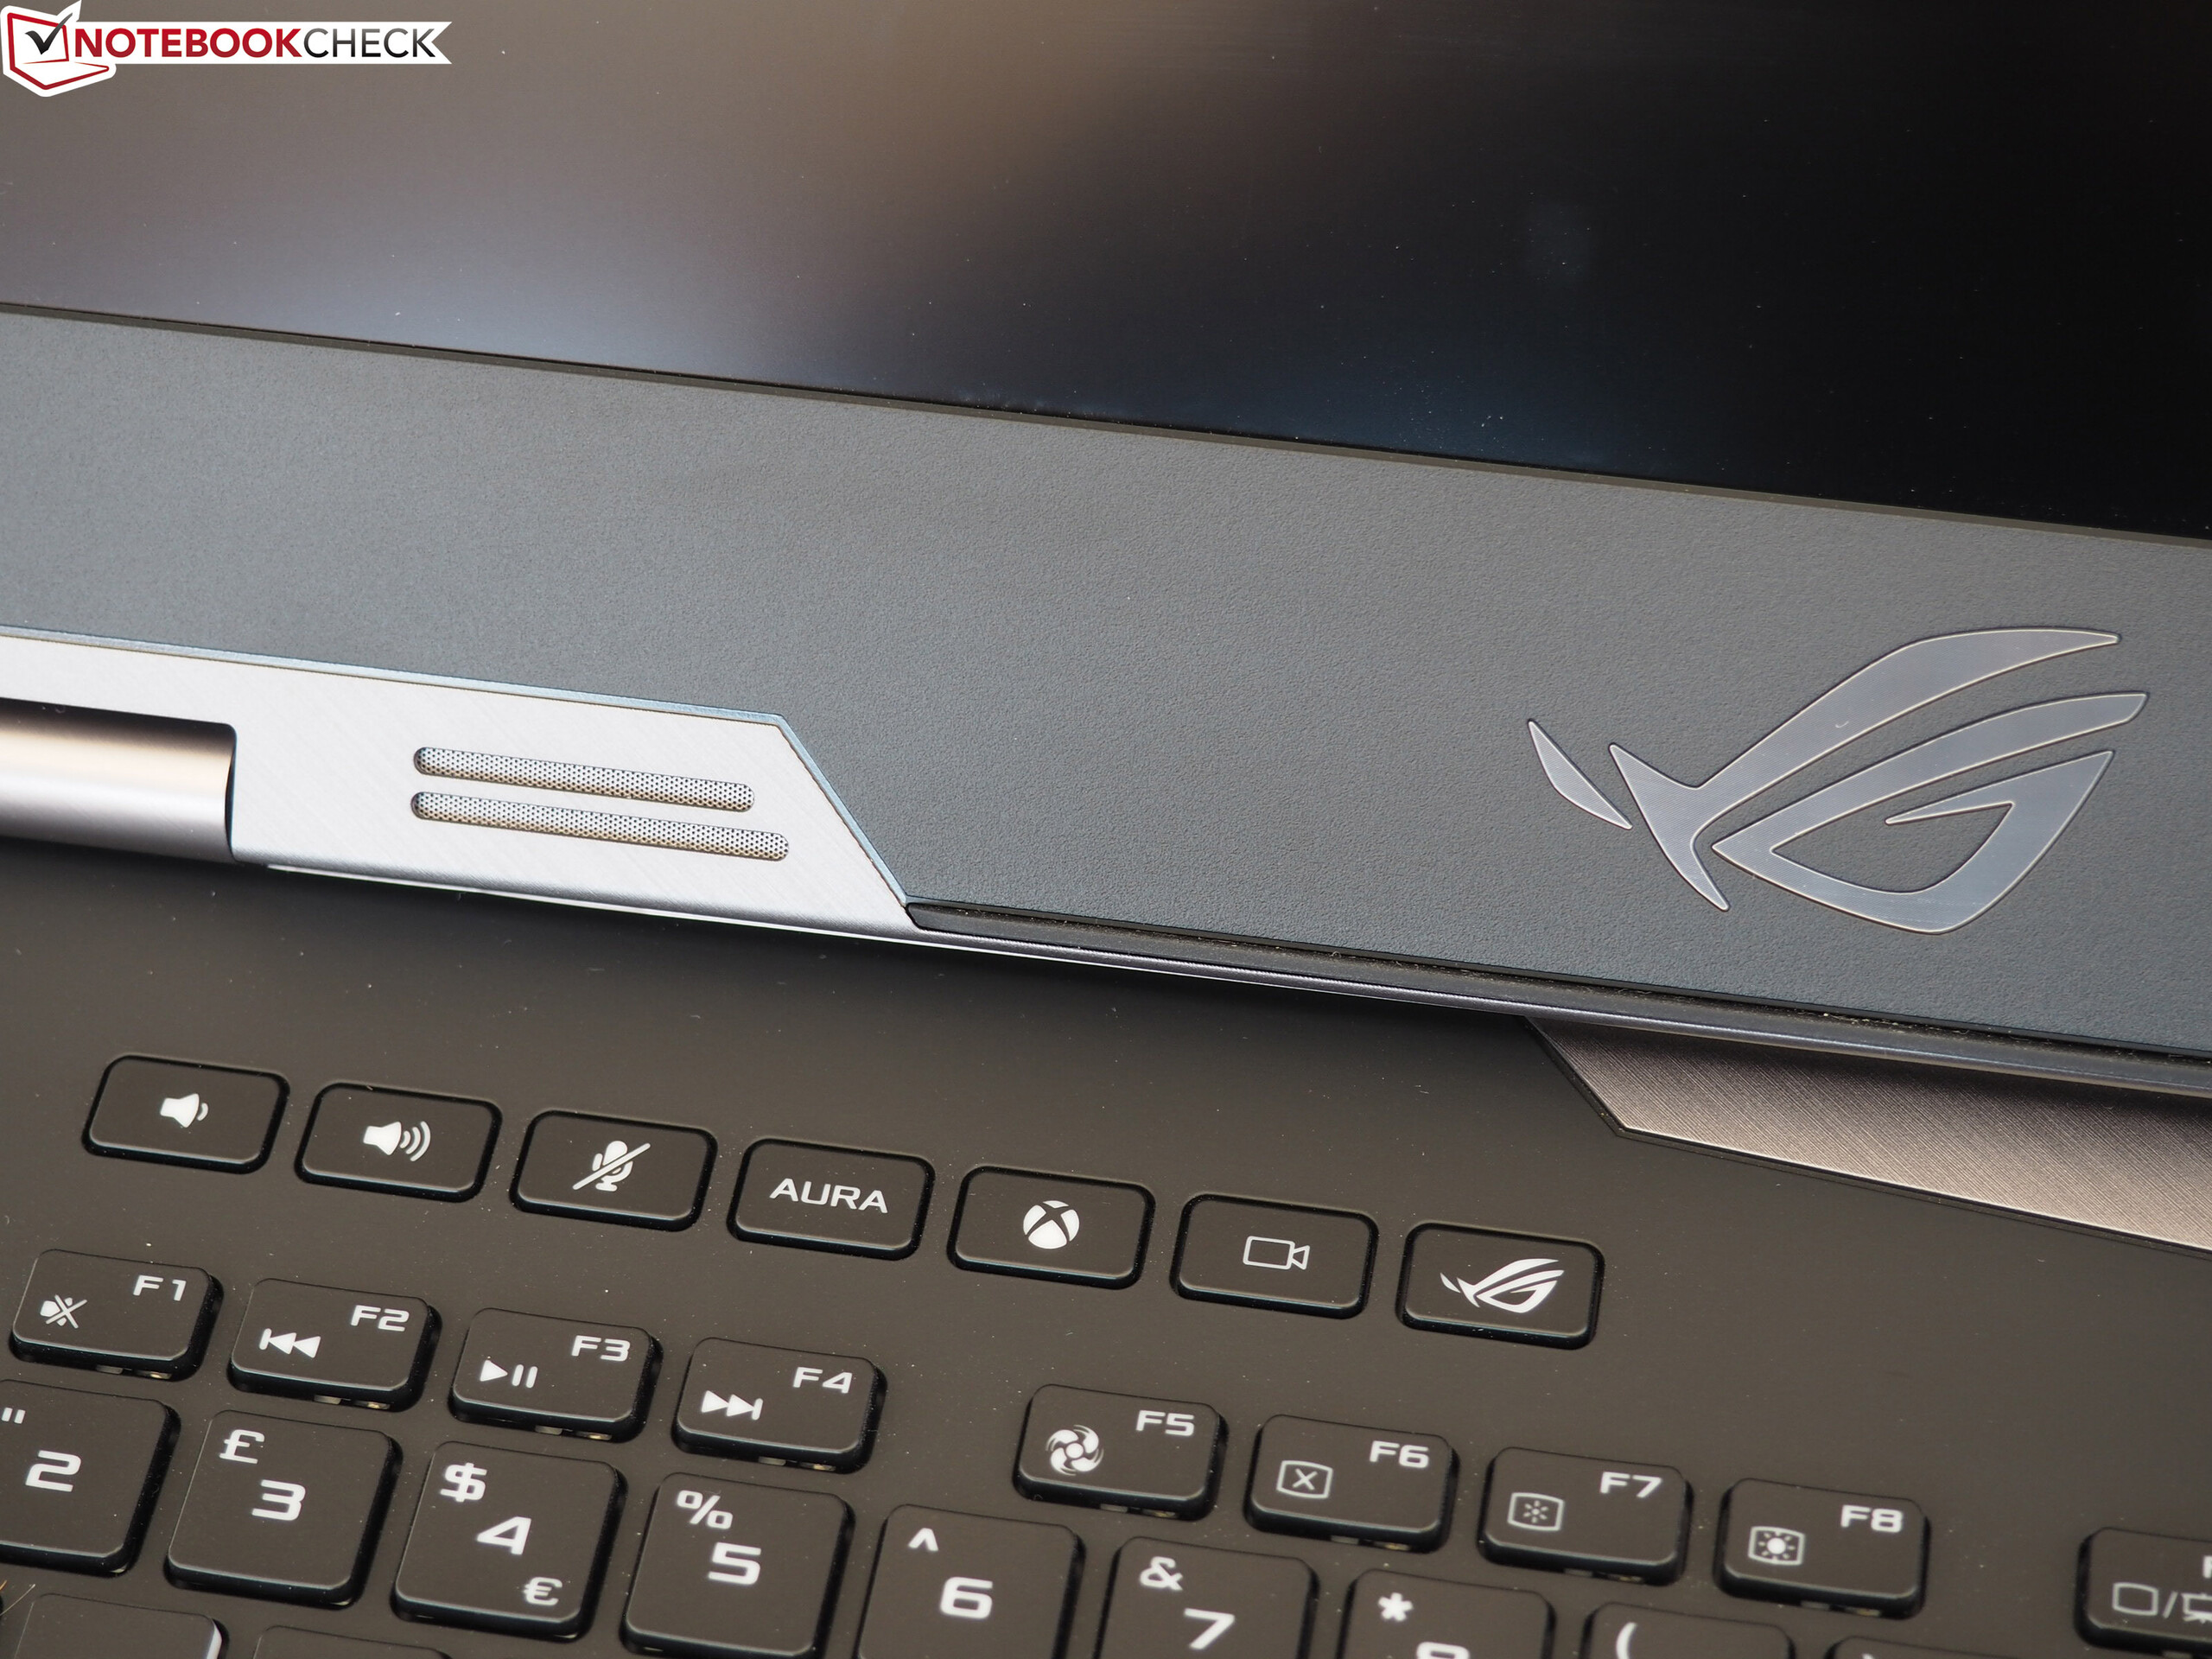
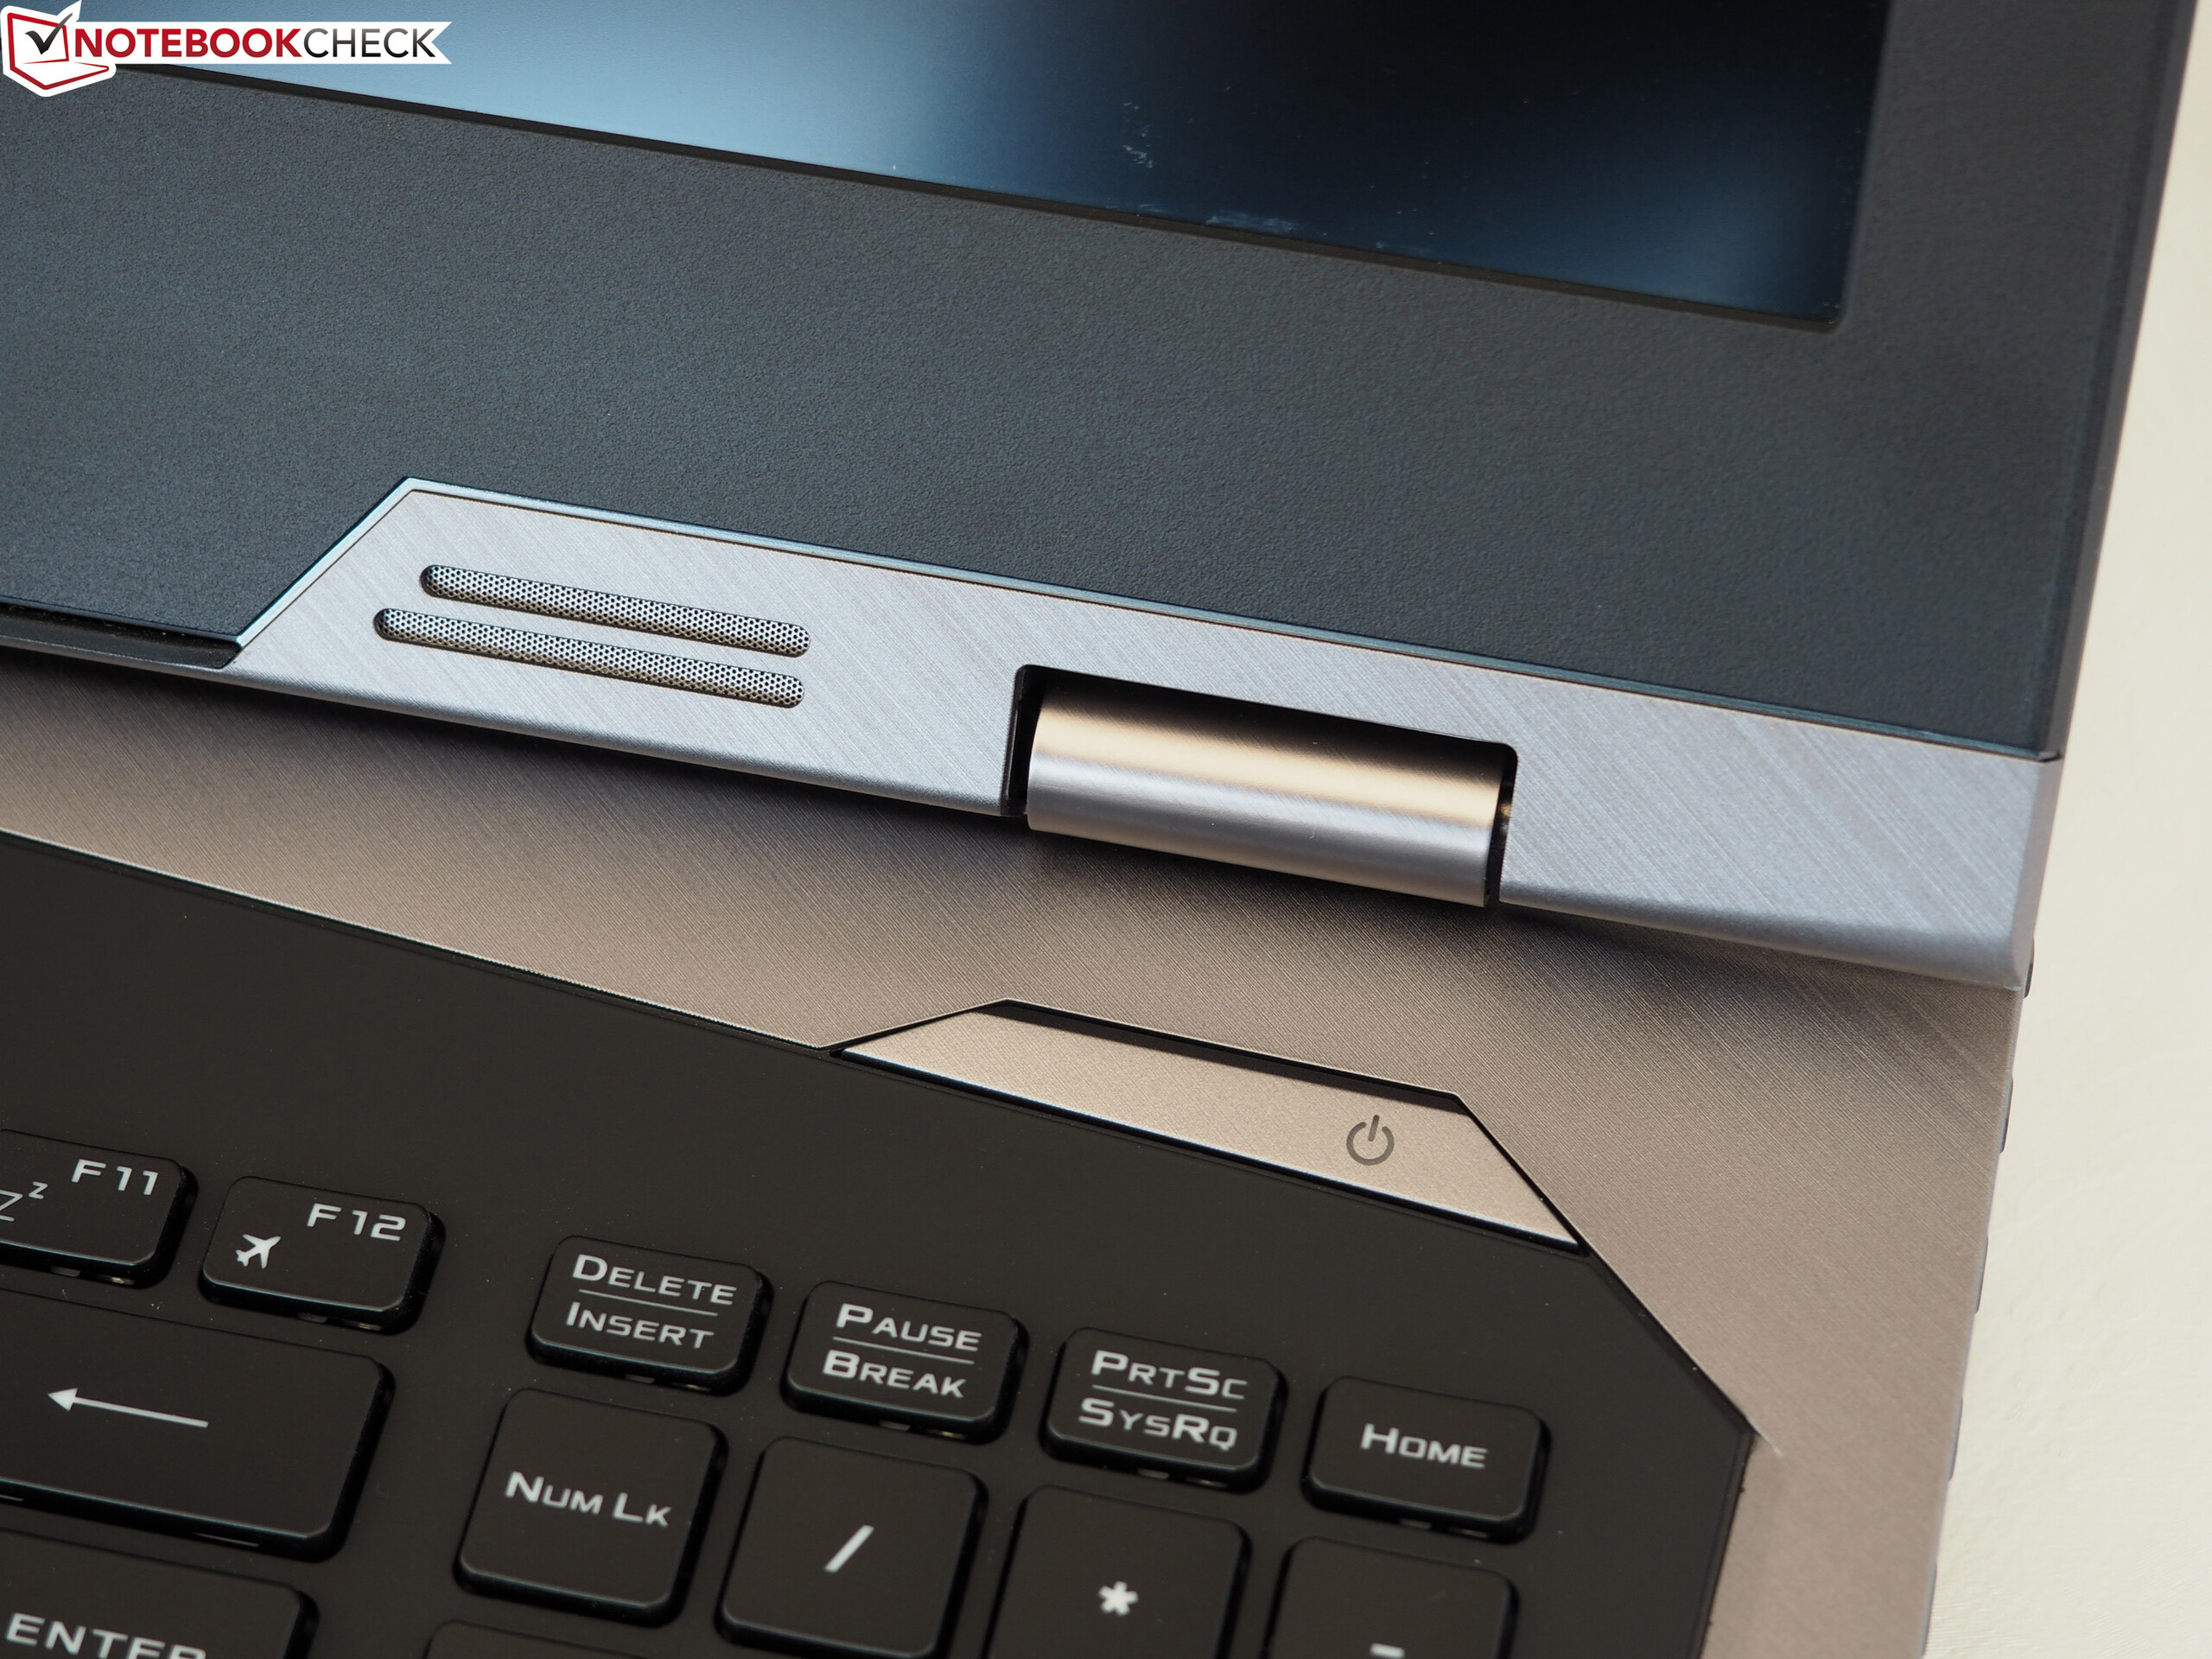
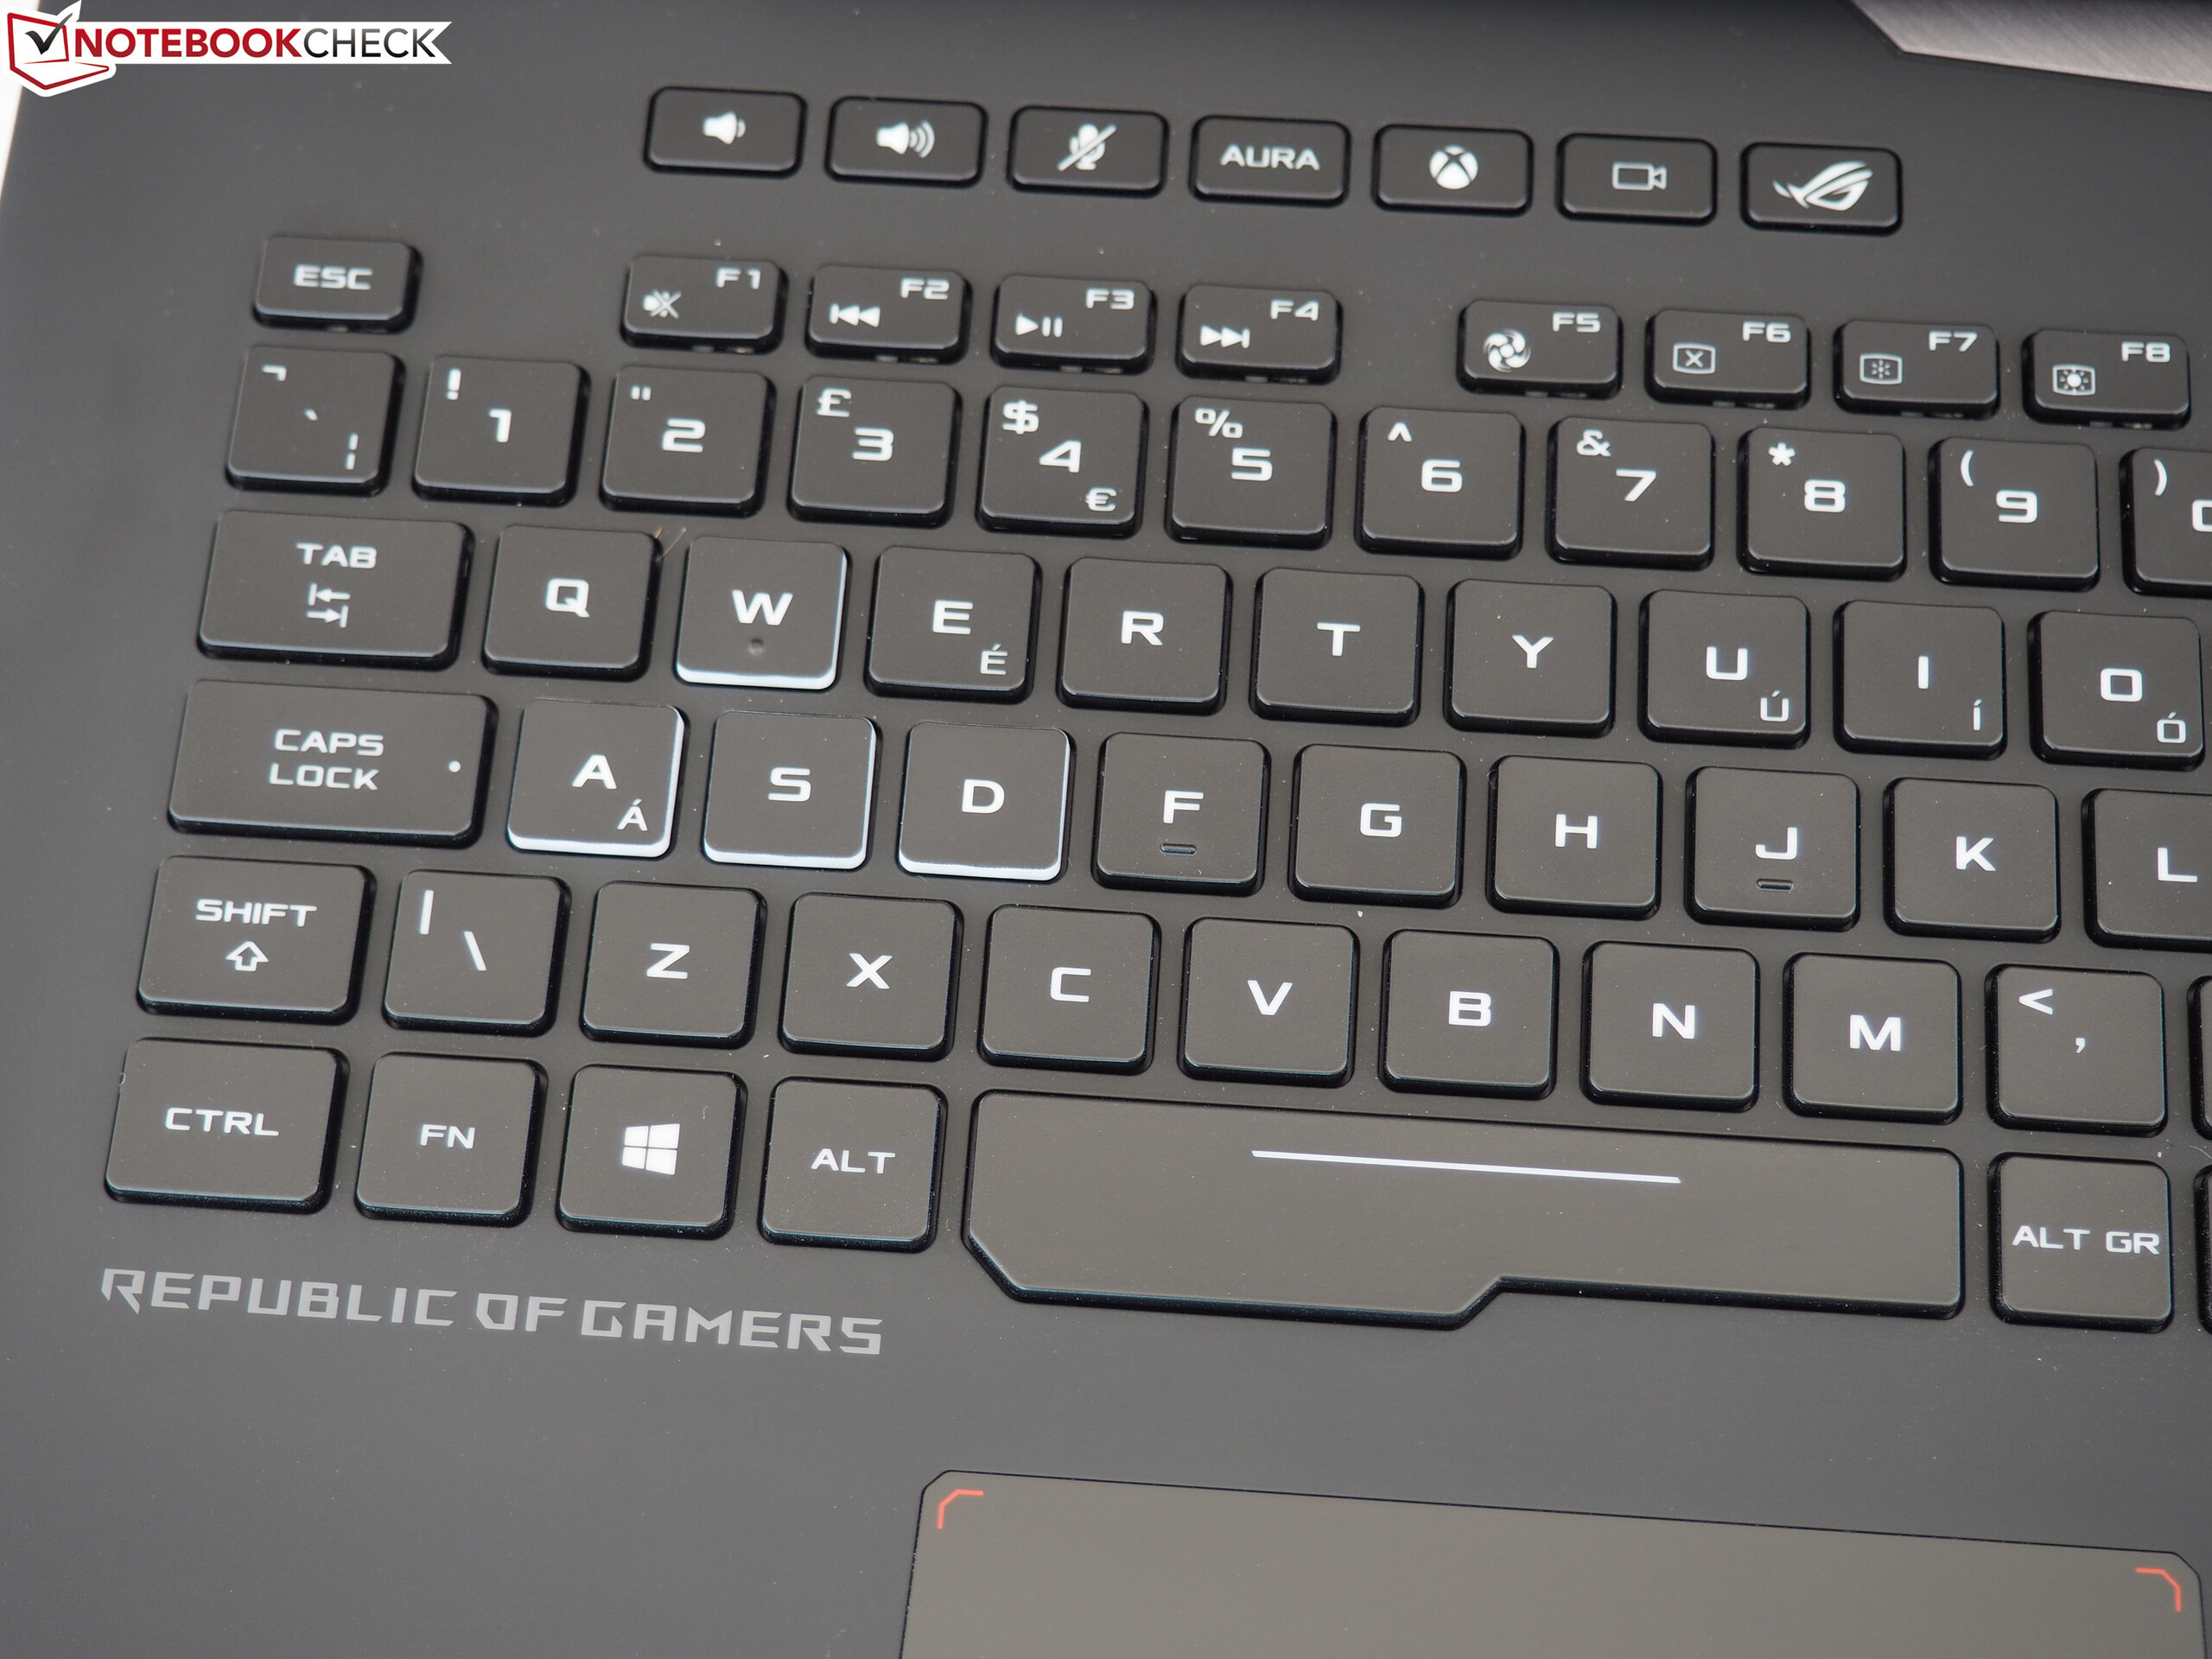
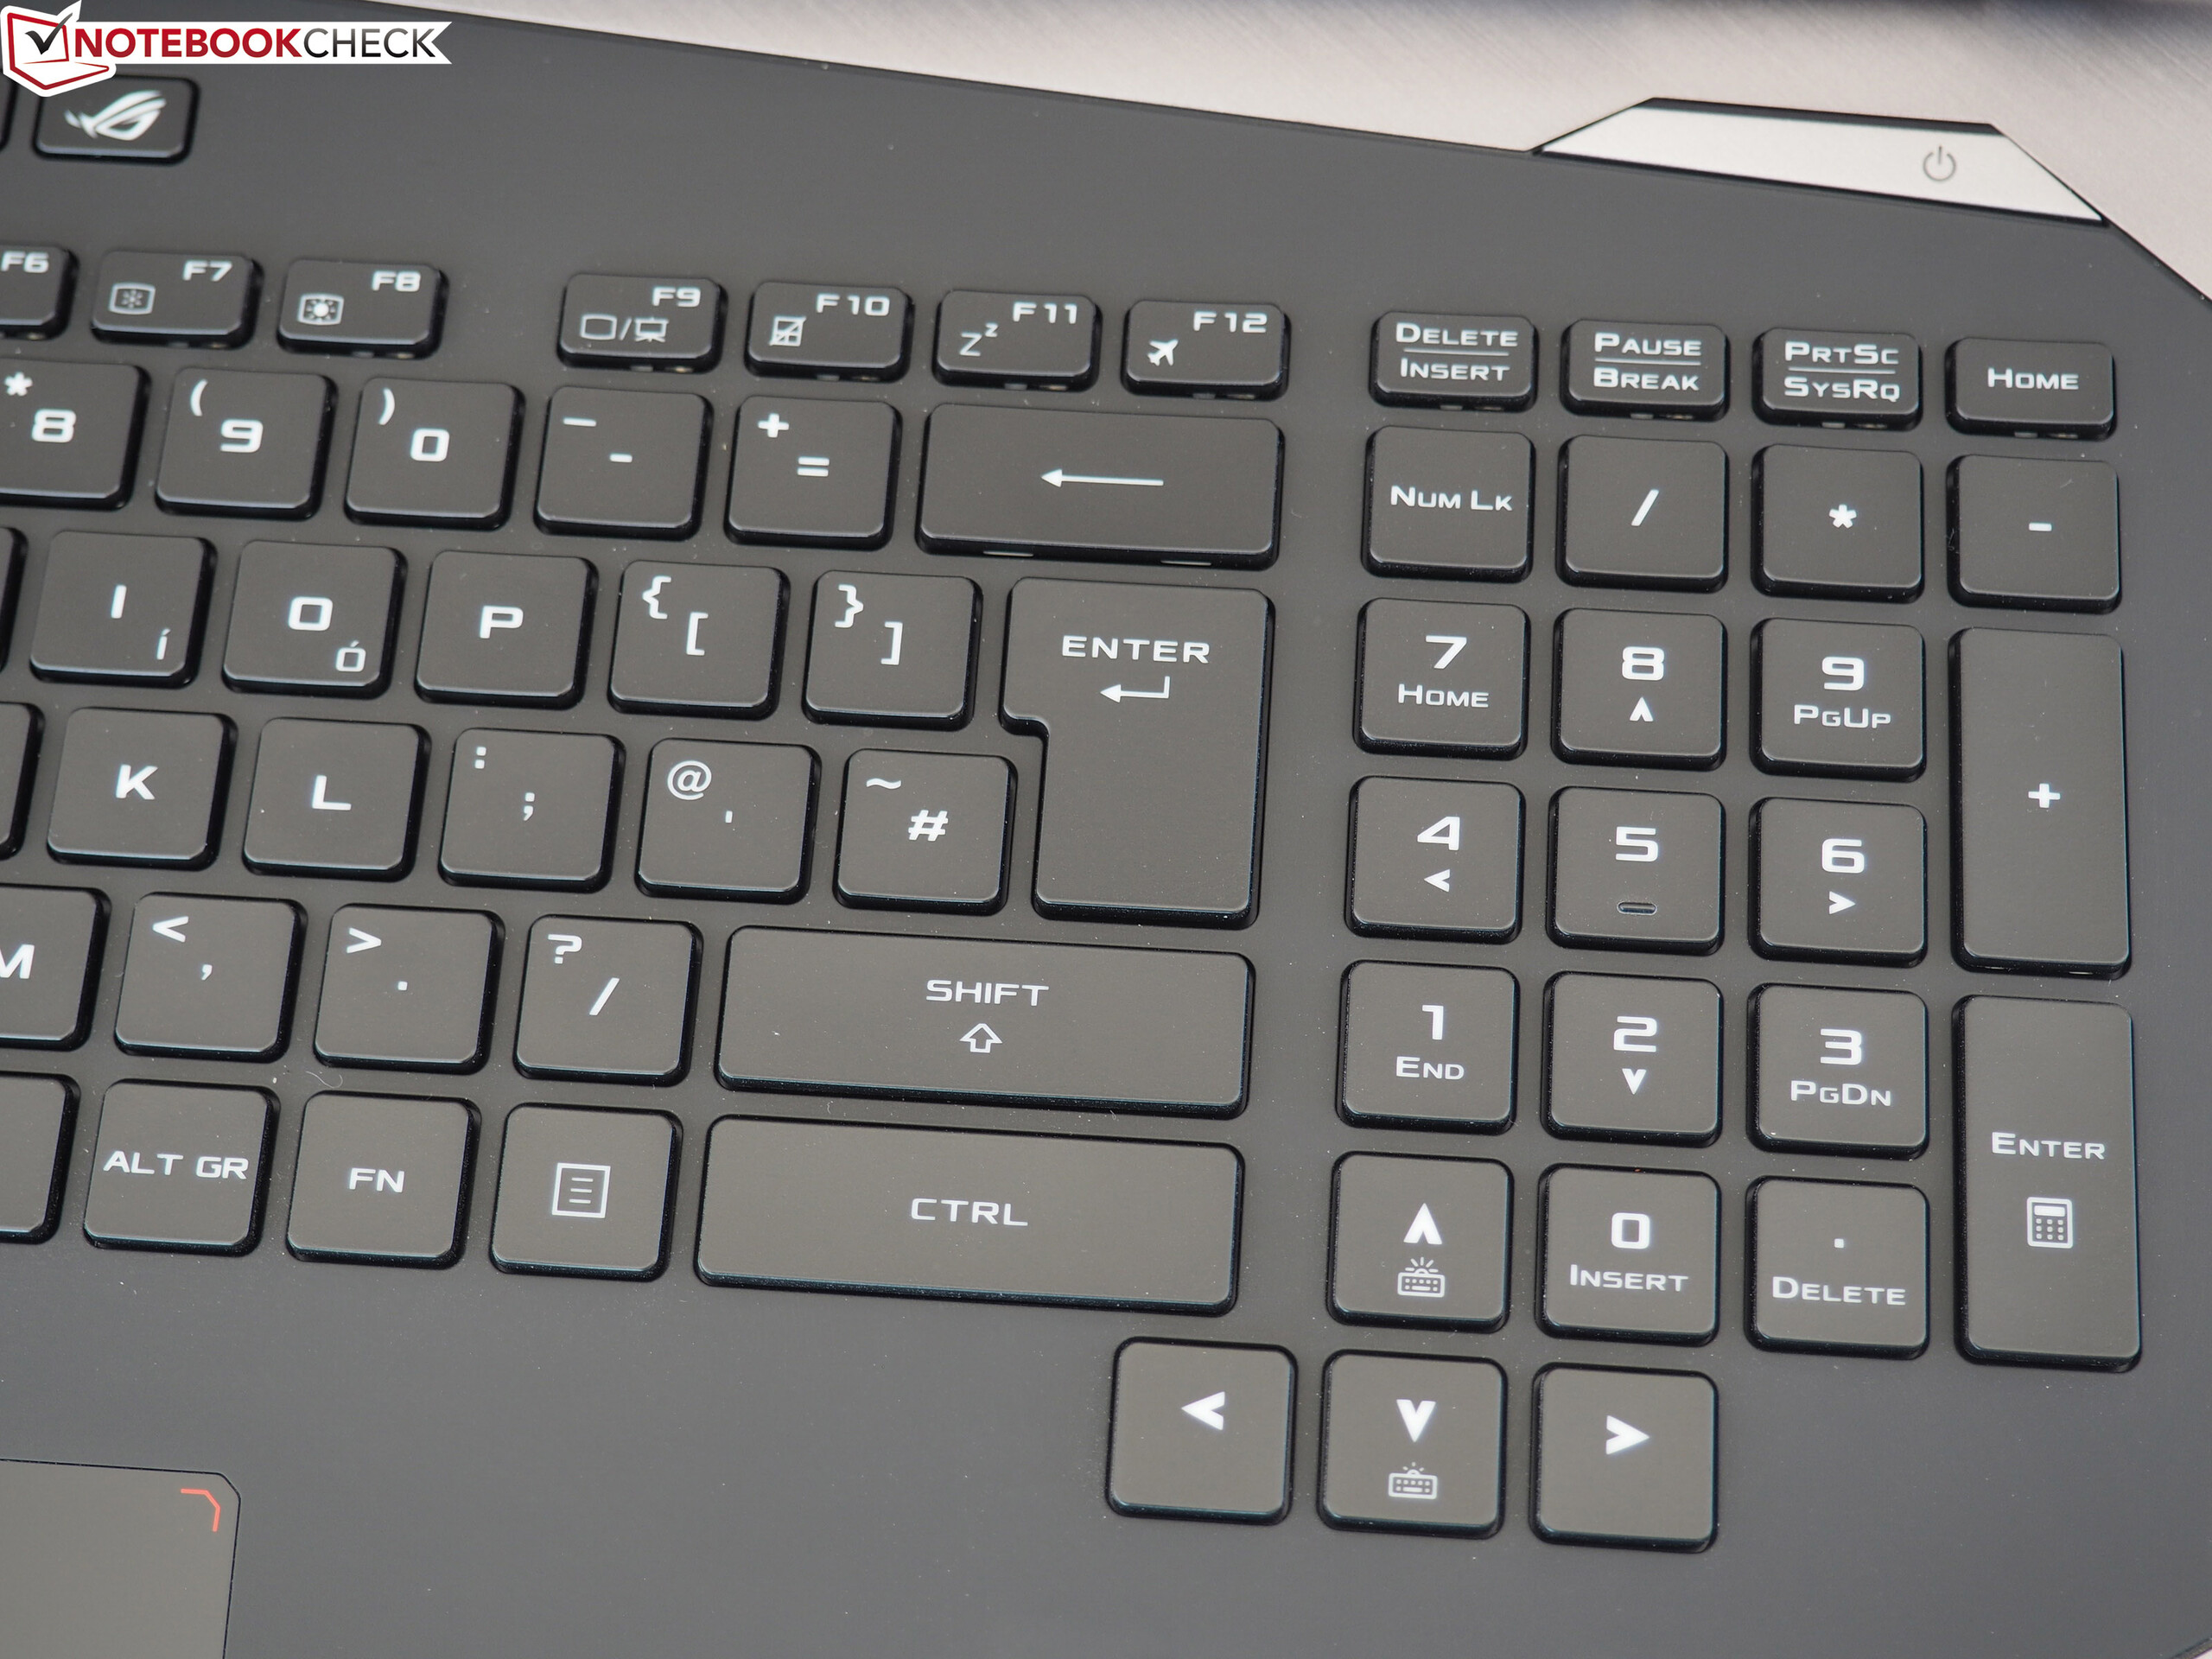
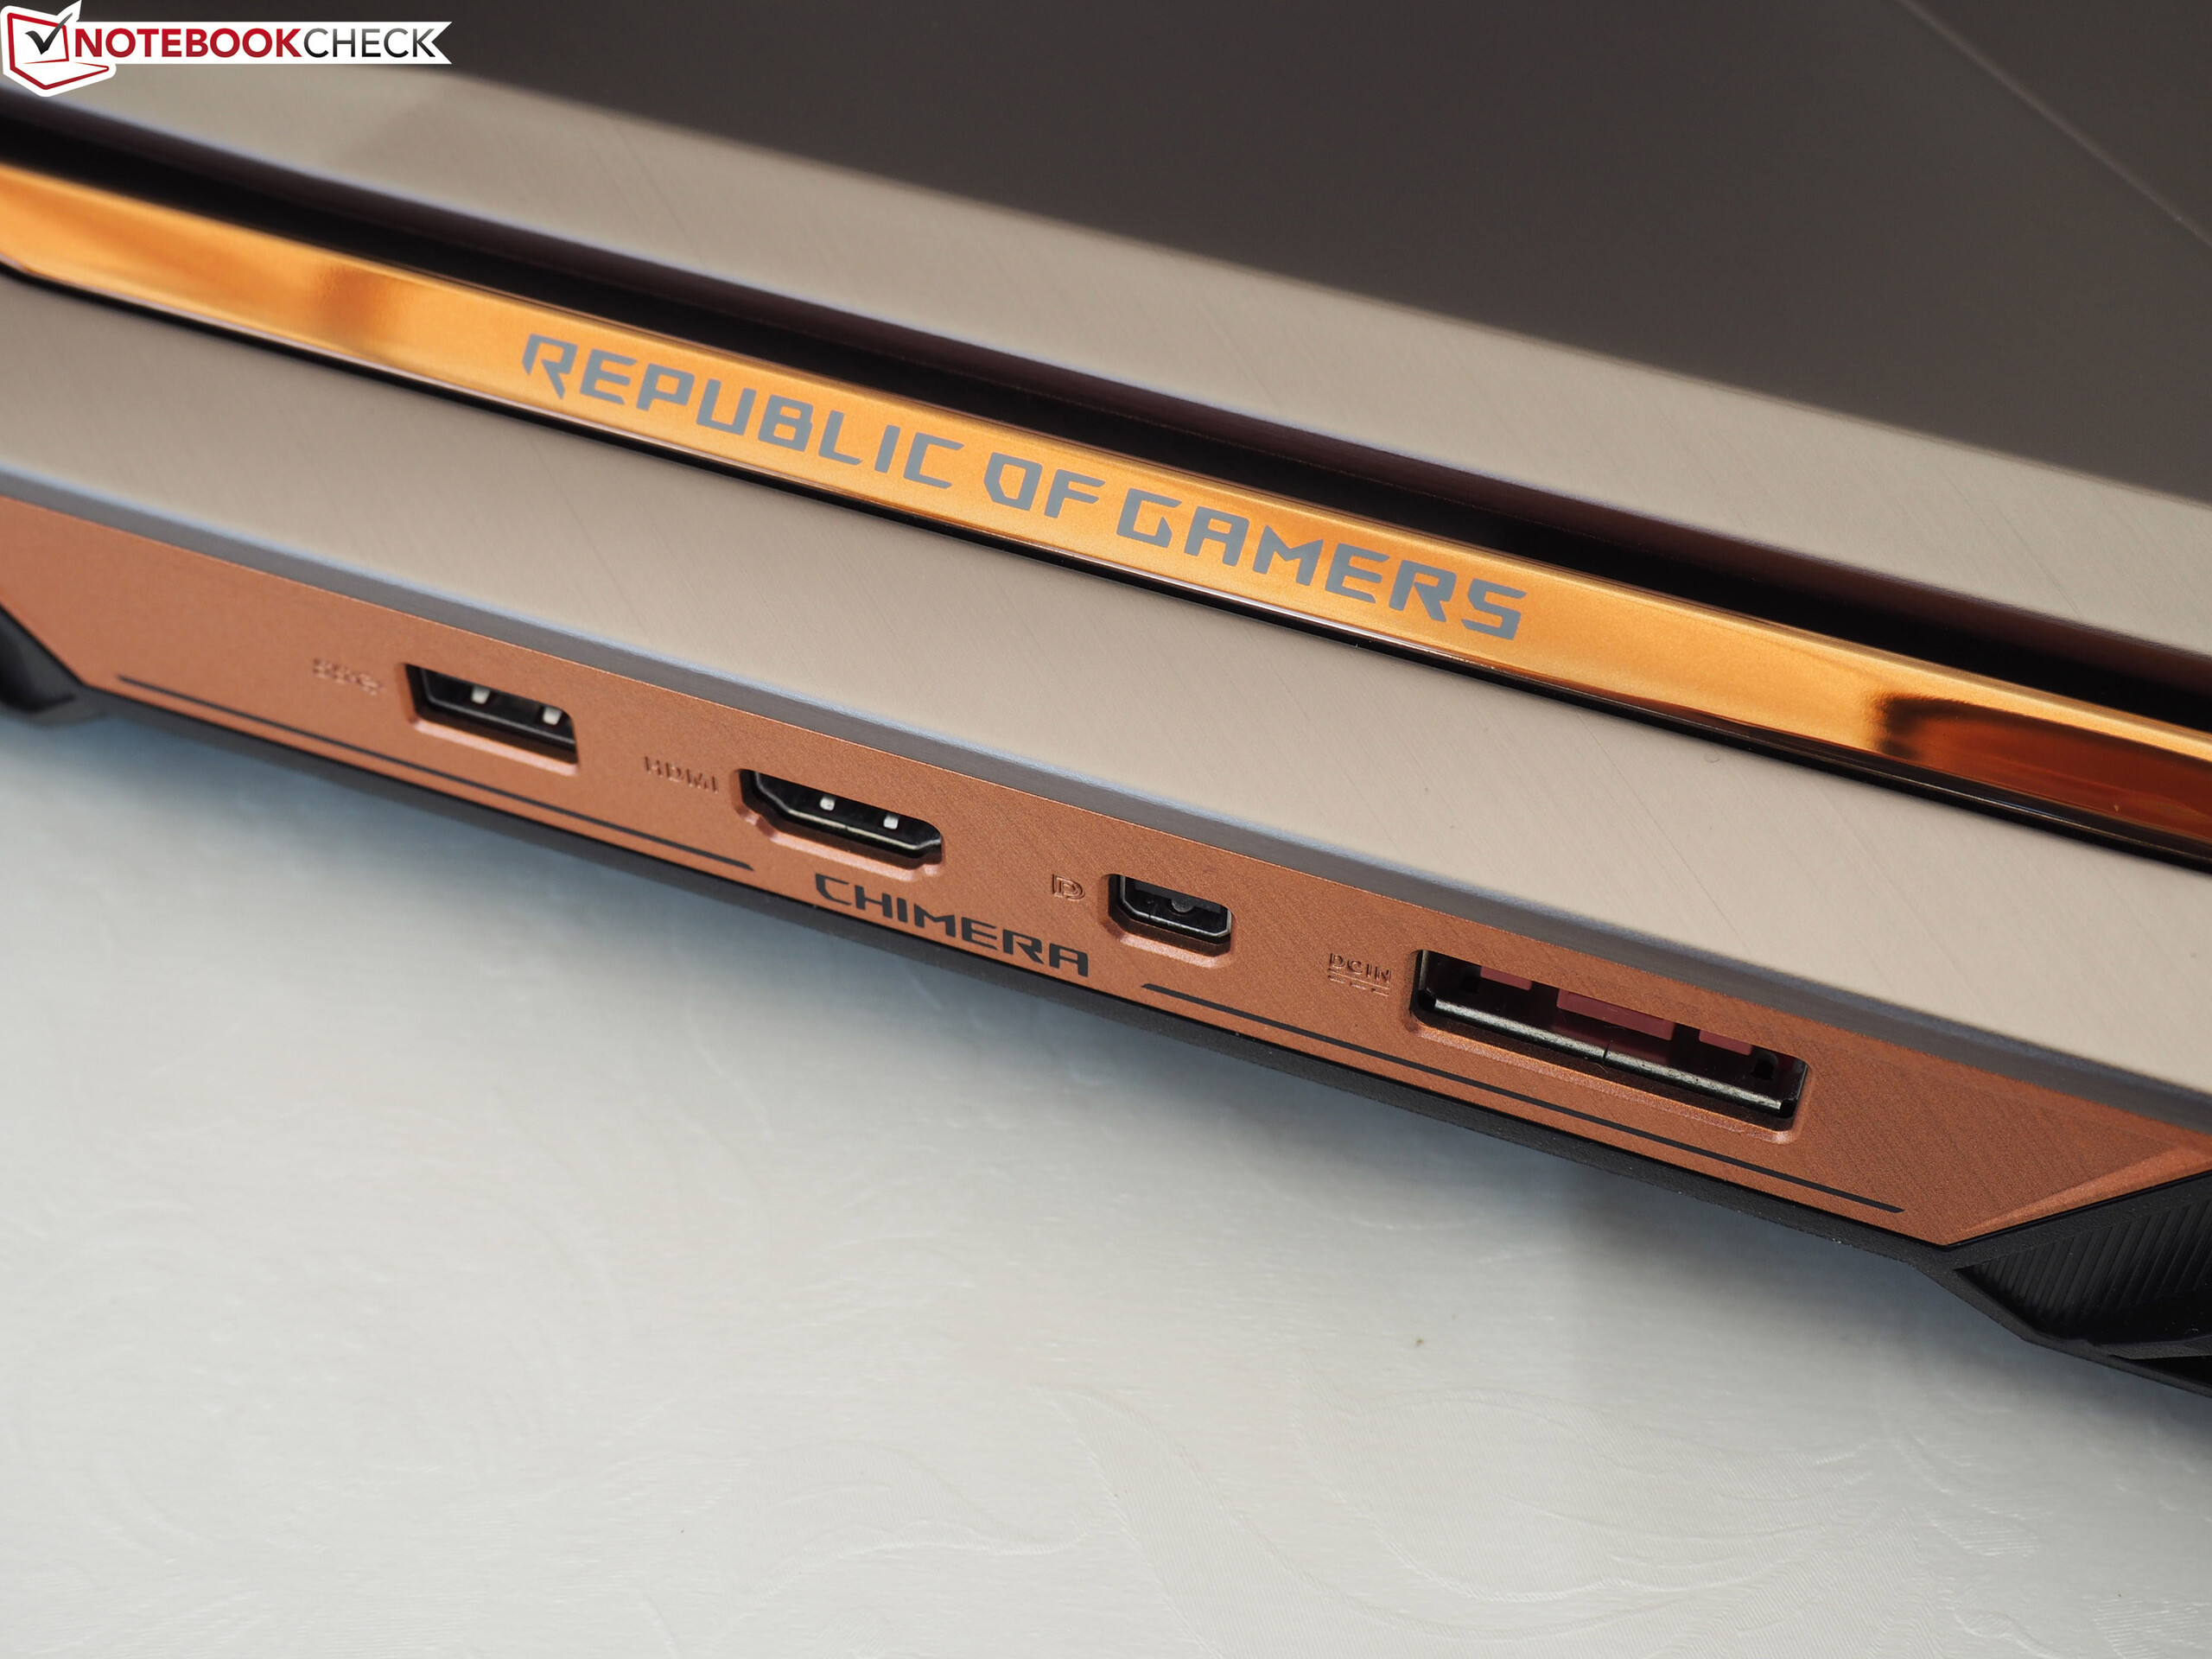
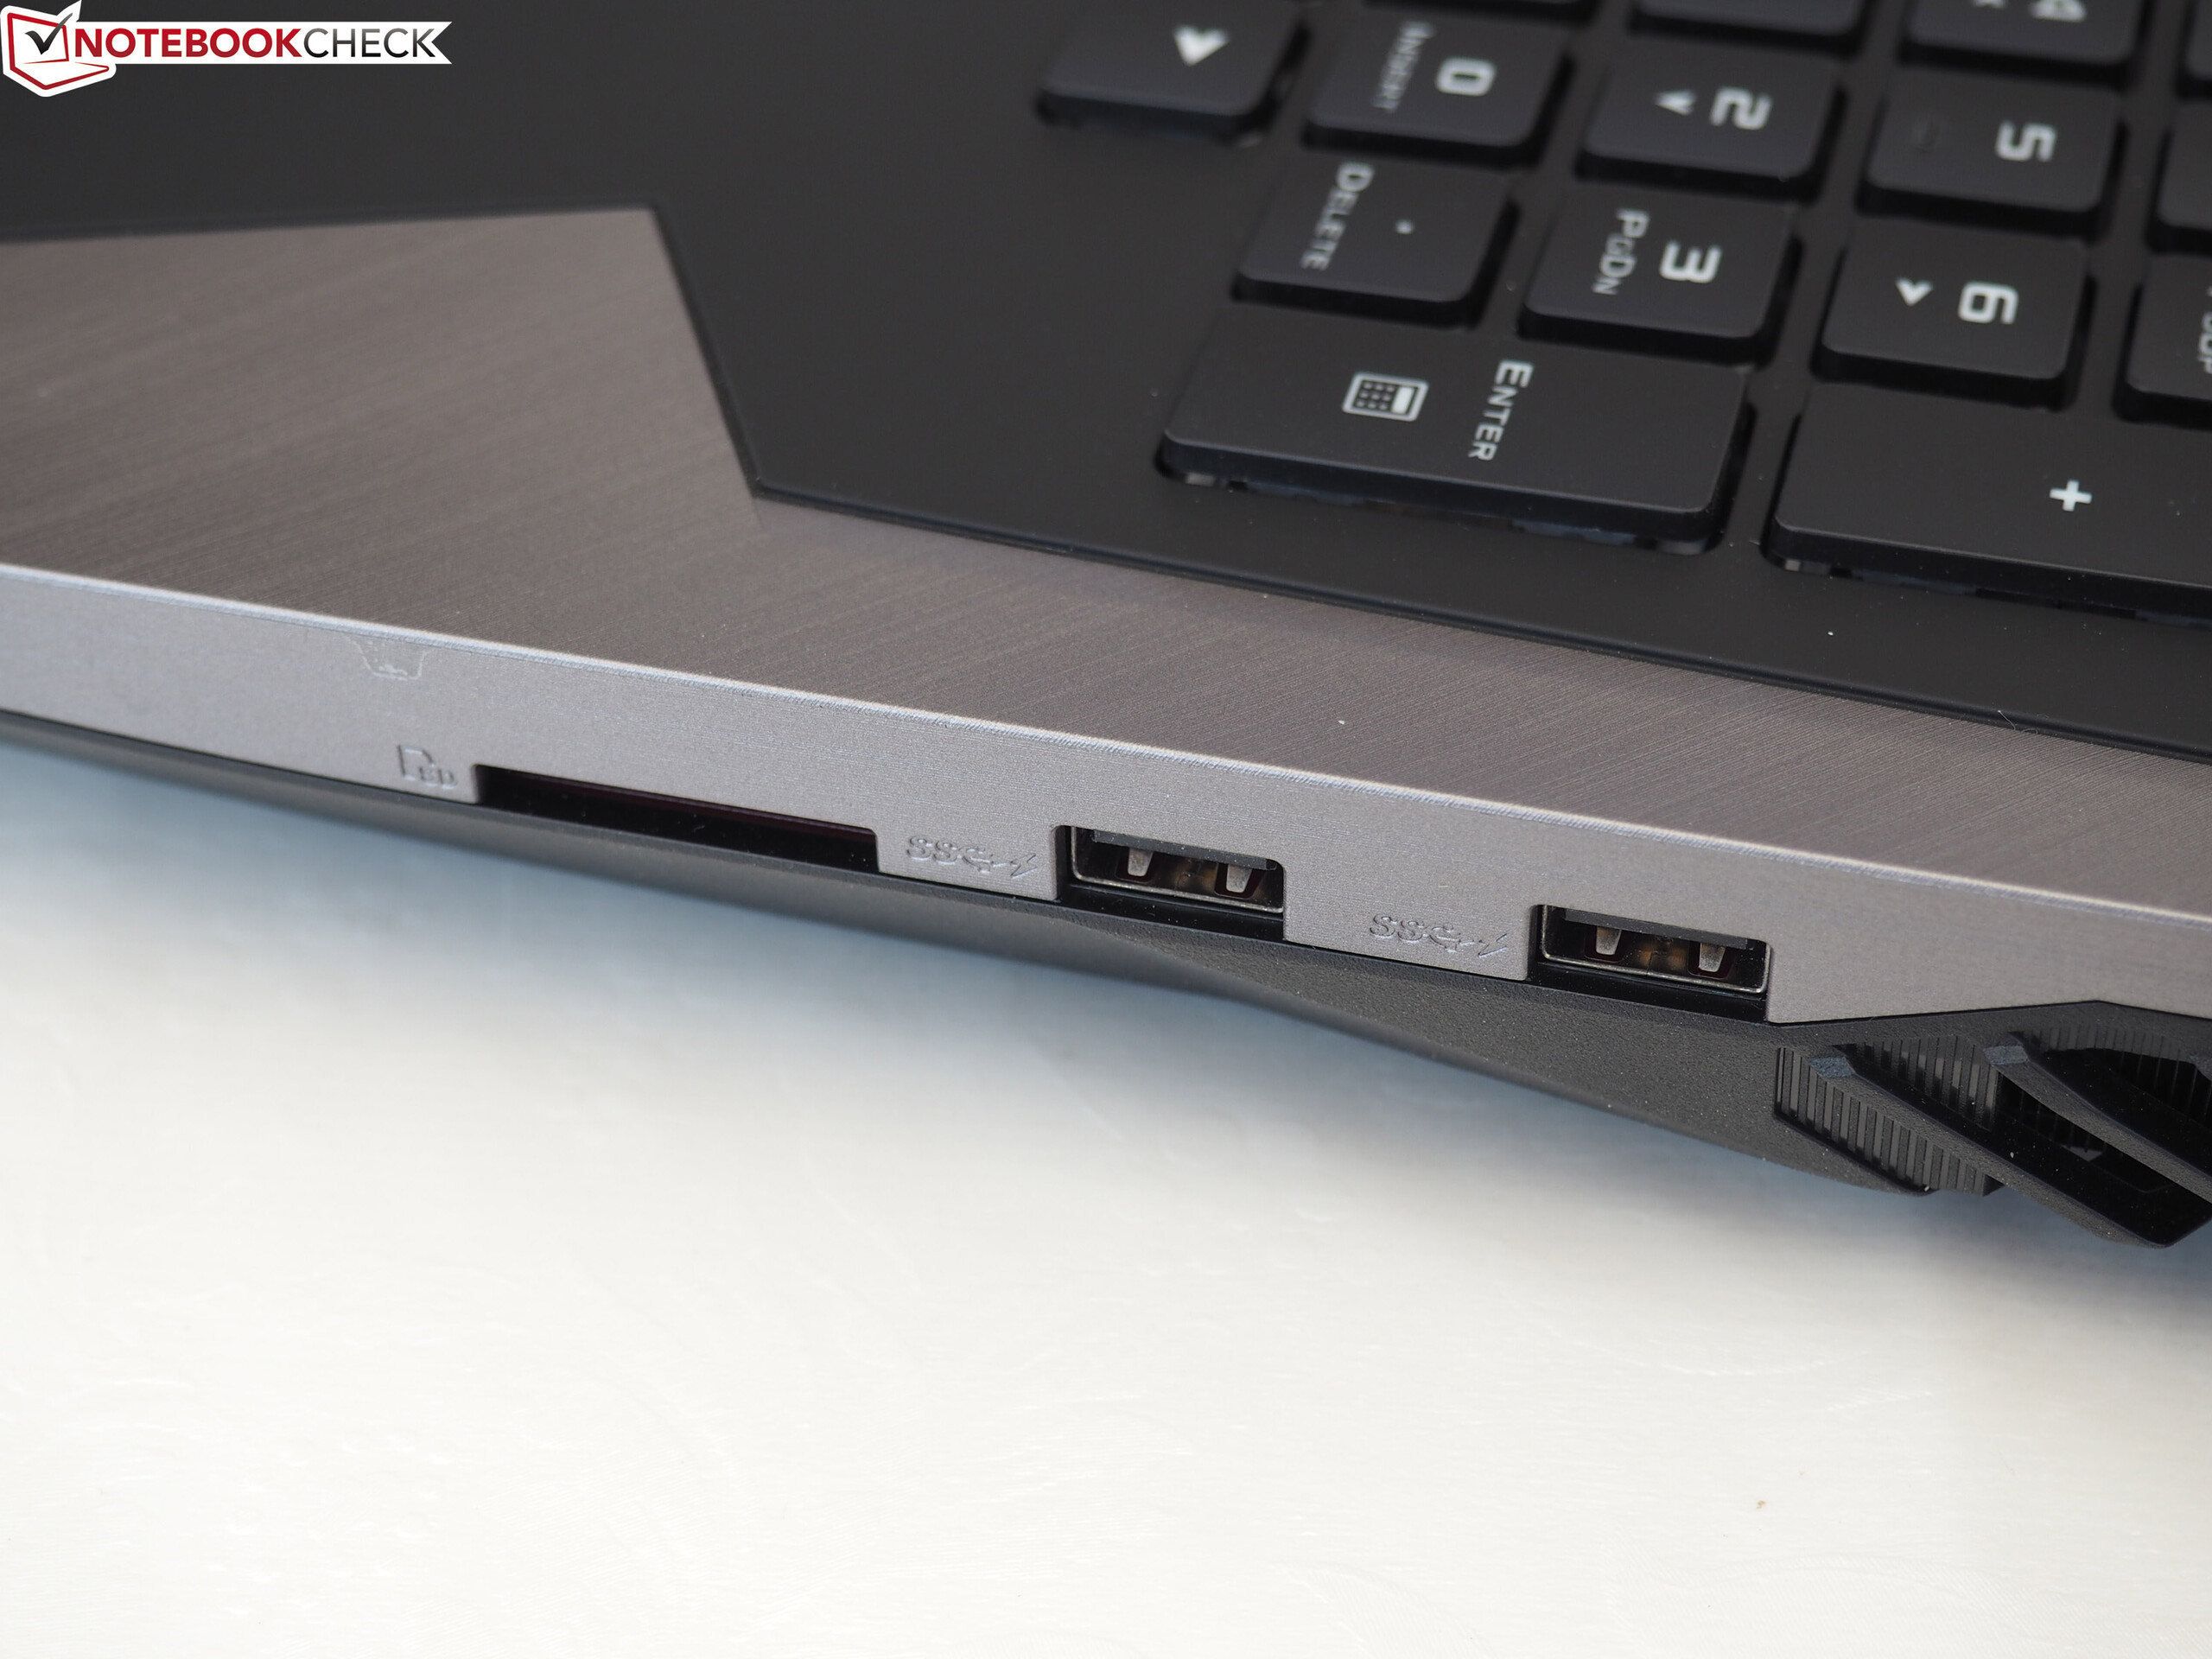
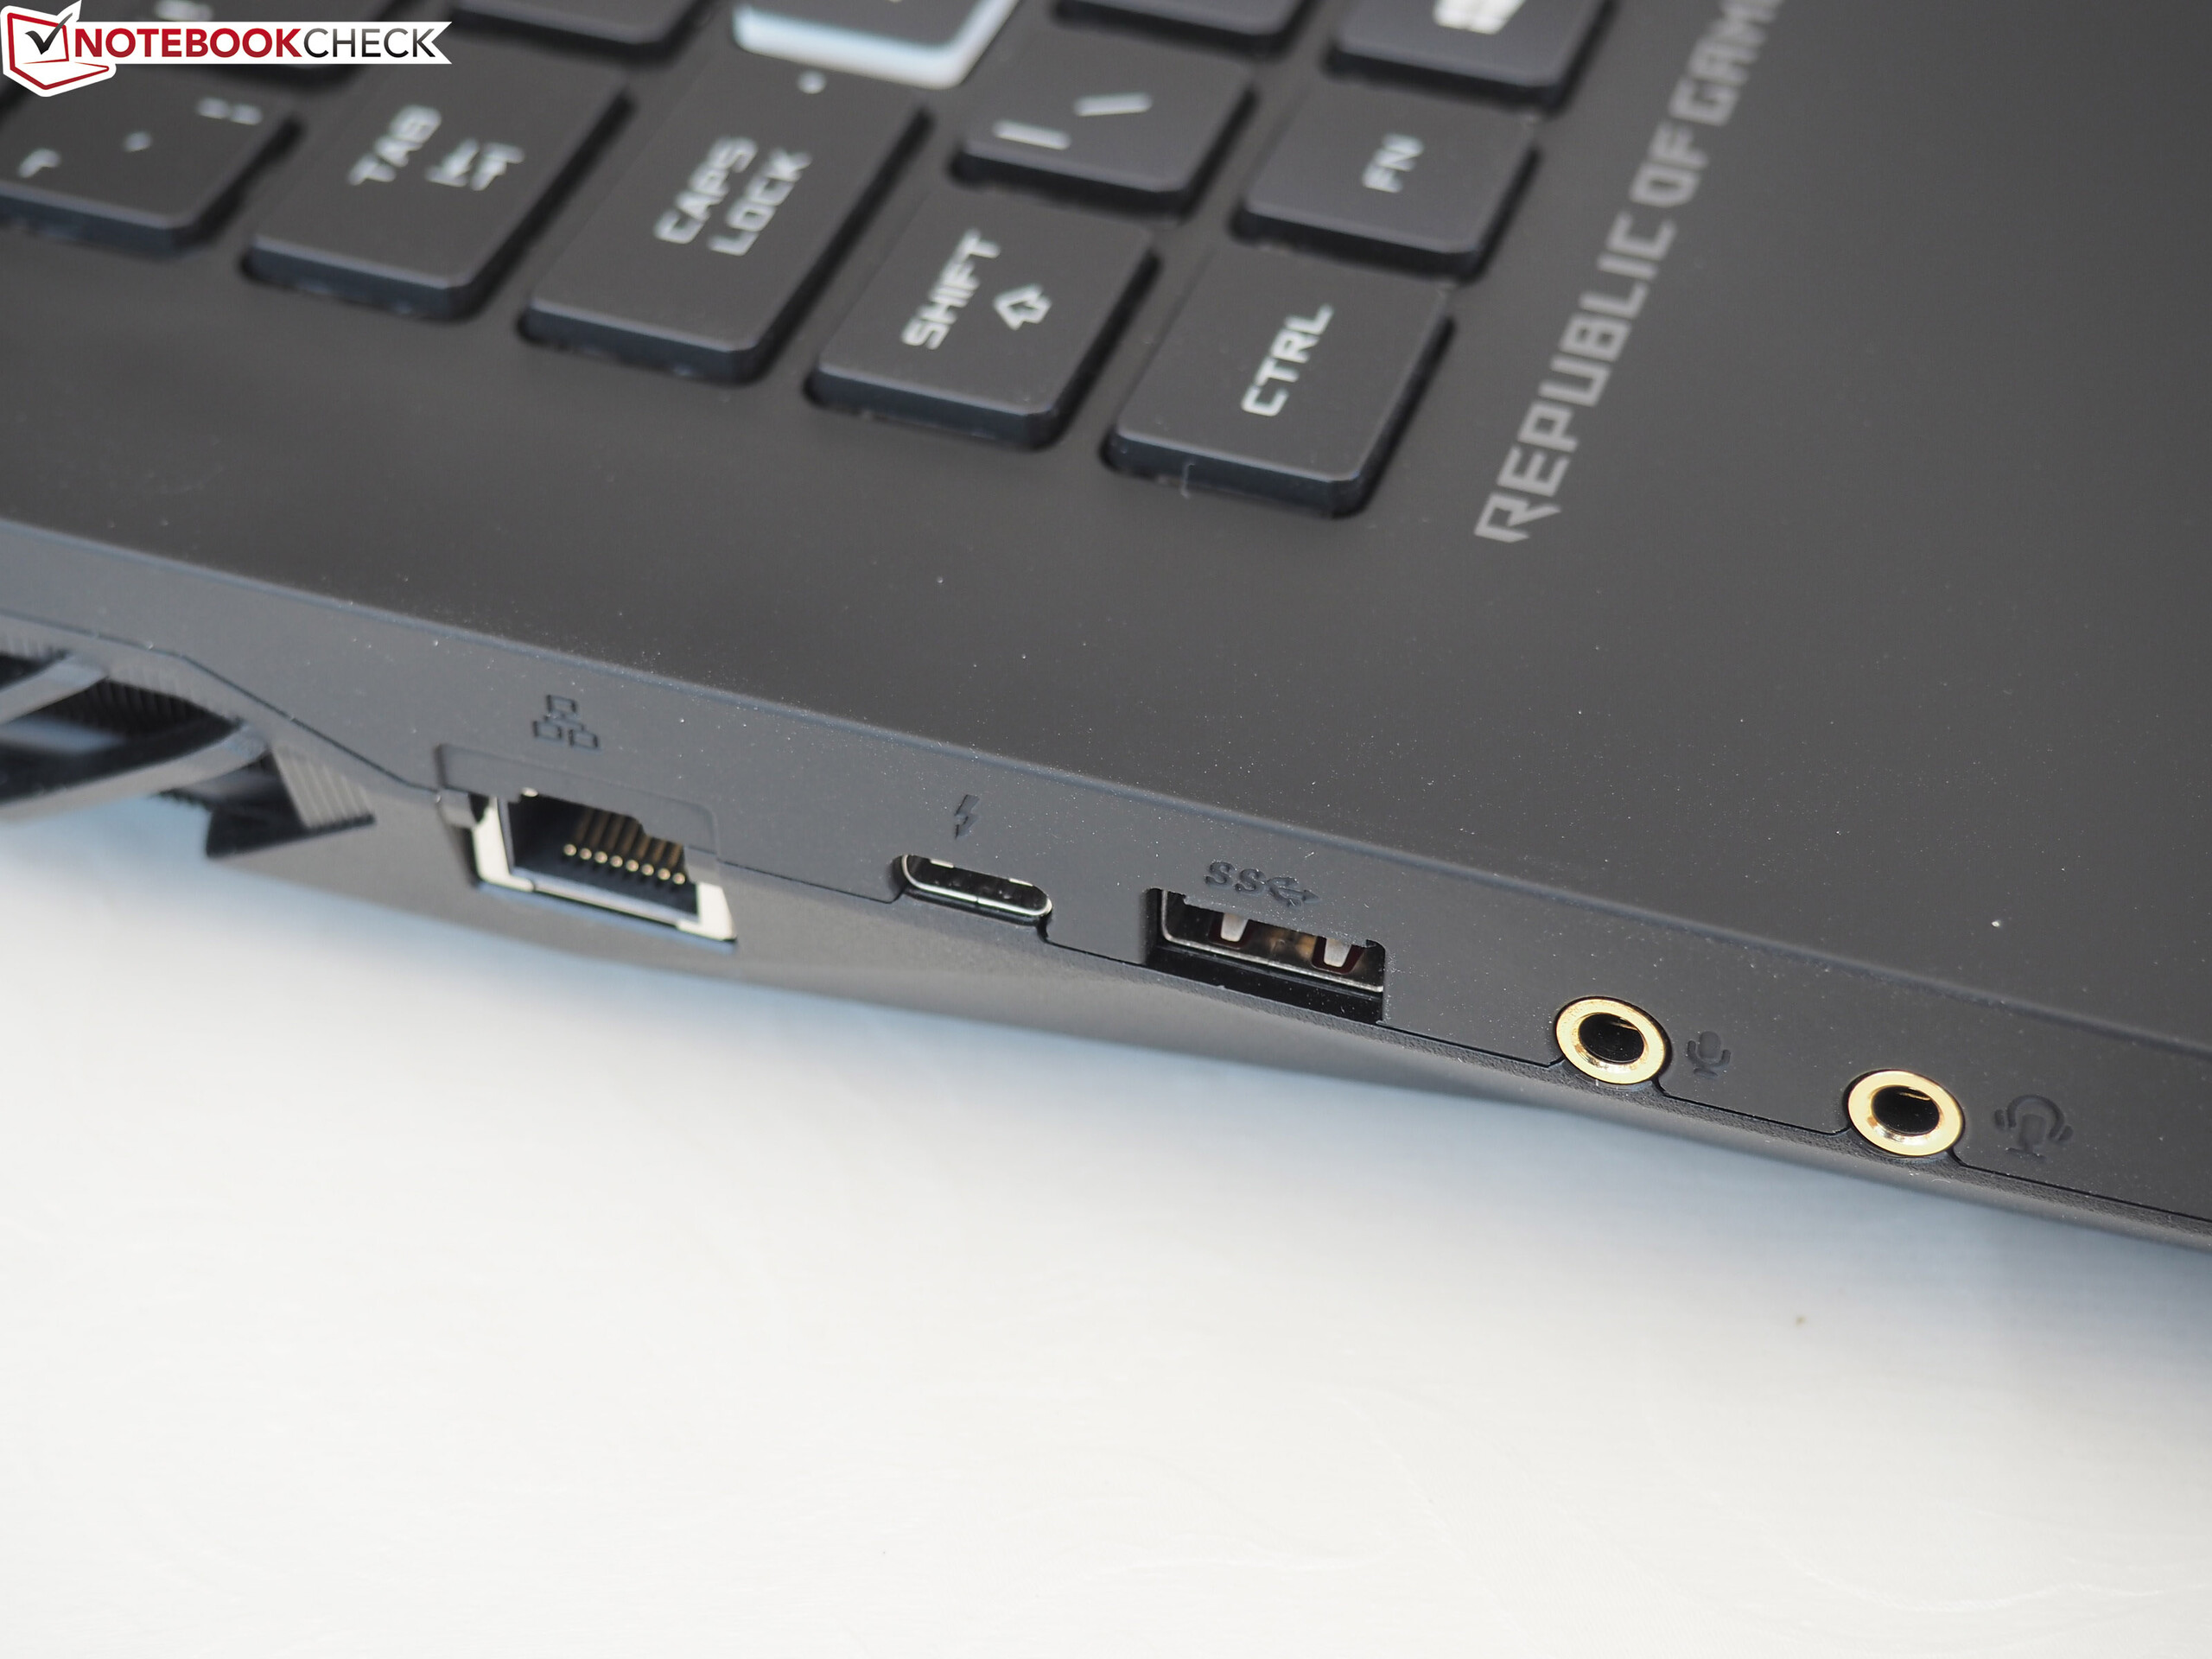
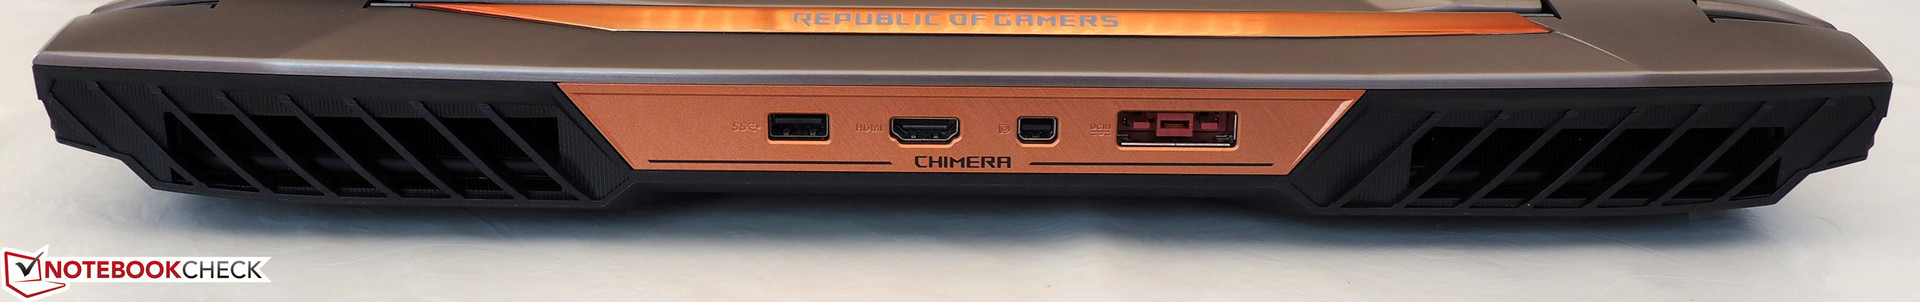
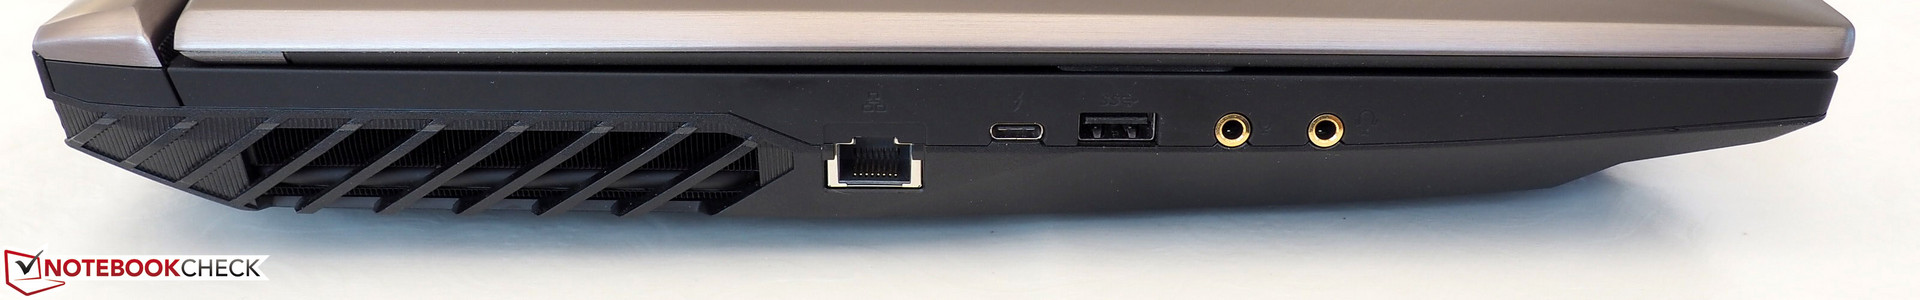
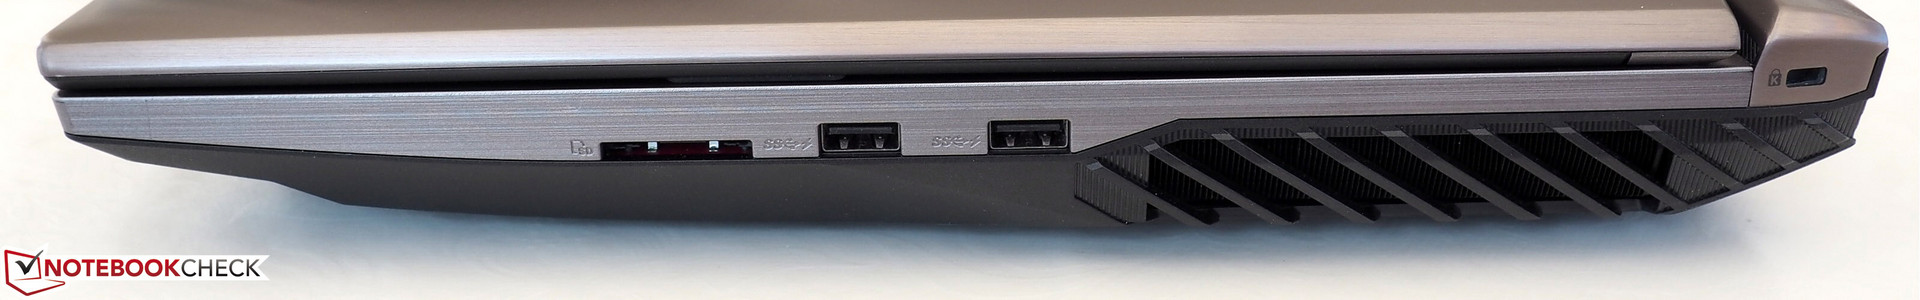
Asus har satt ihop ett väldigt framgångsrikt paket här, som inte låter sig ta några större felsteg. Inte bara ser vi tillbaka på dom förstklassiga inmatningsenheterna (tangentbord inklusive RGB-belysning) utan även dom många anslutningarna (såsom Thunderbolt 3). Skärmen och ljudkvaliteten vet också hur man övertygar. I synnerhet IPS-skärmen med sin kombination av 144 Hz och G-Sync är ett riktigt argument för köp.
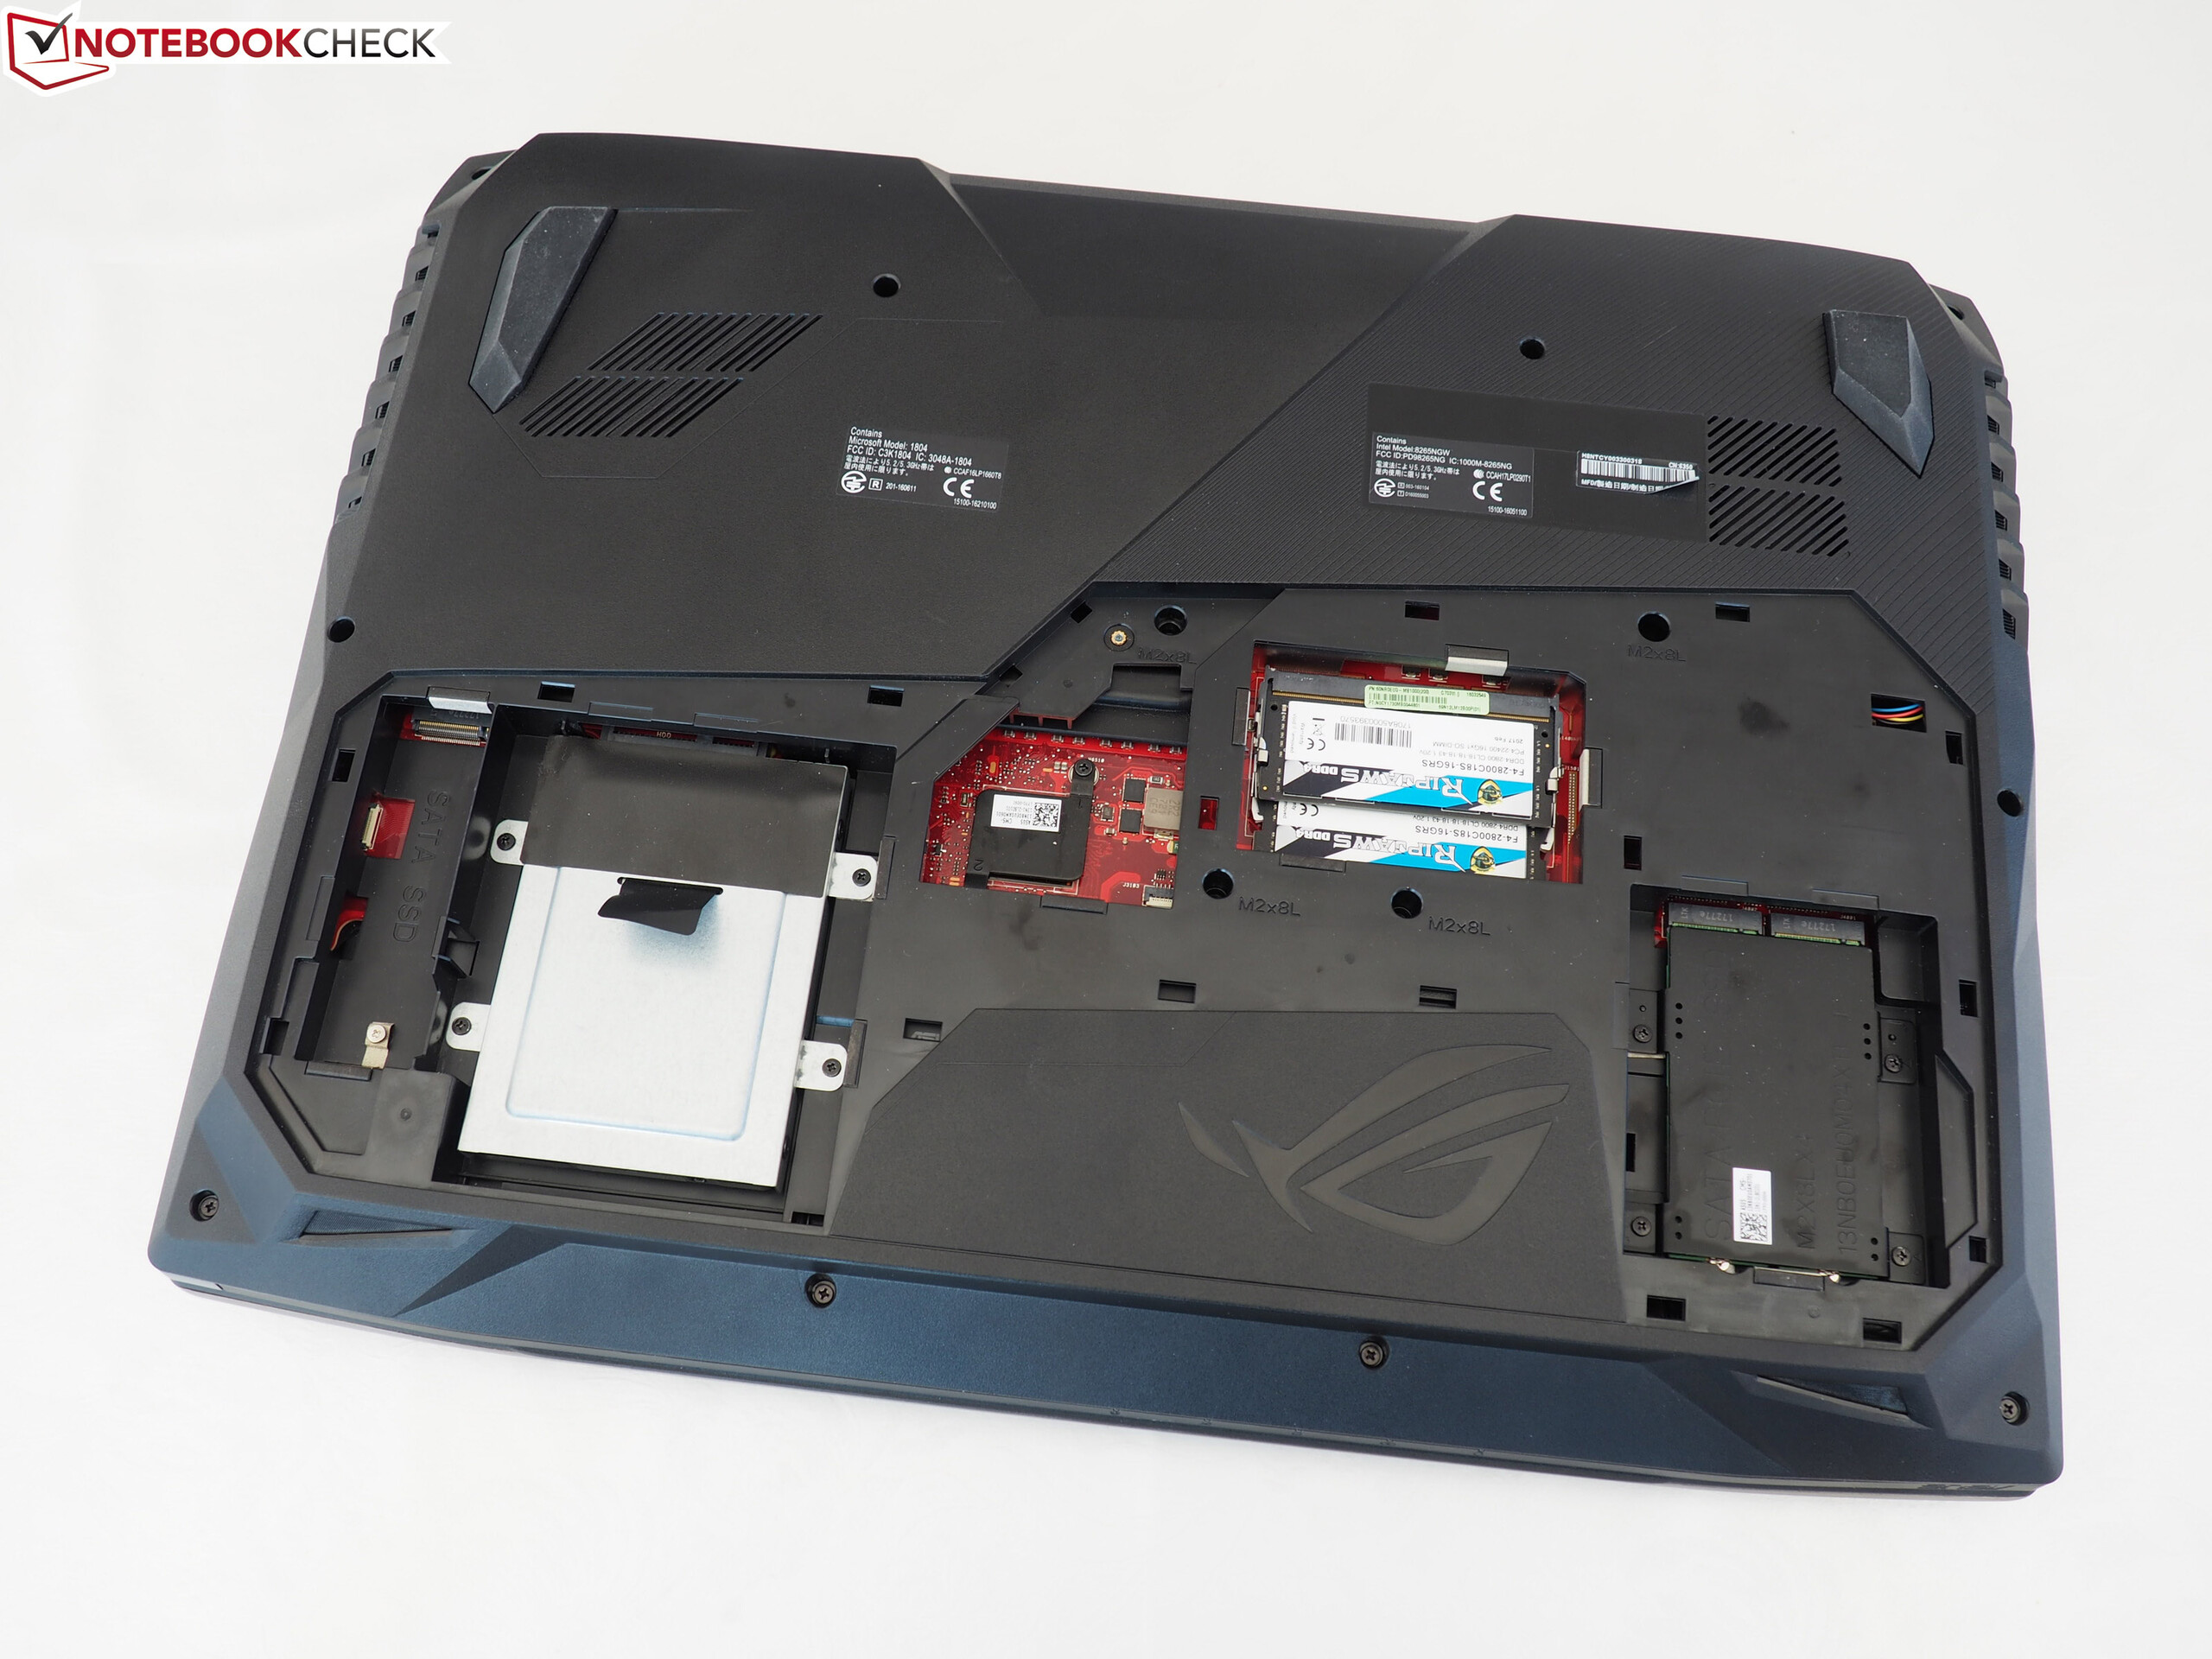
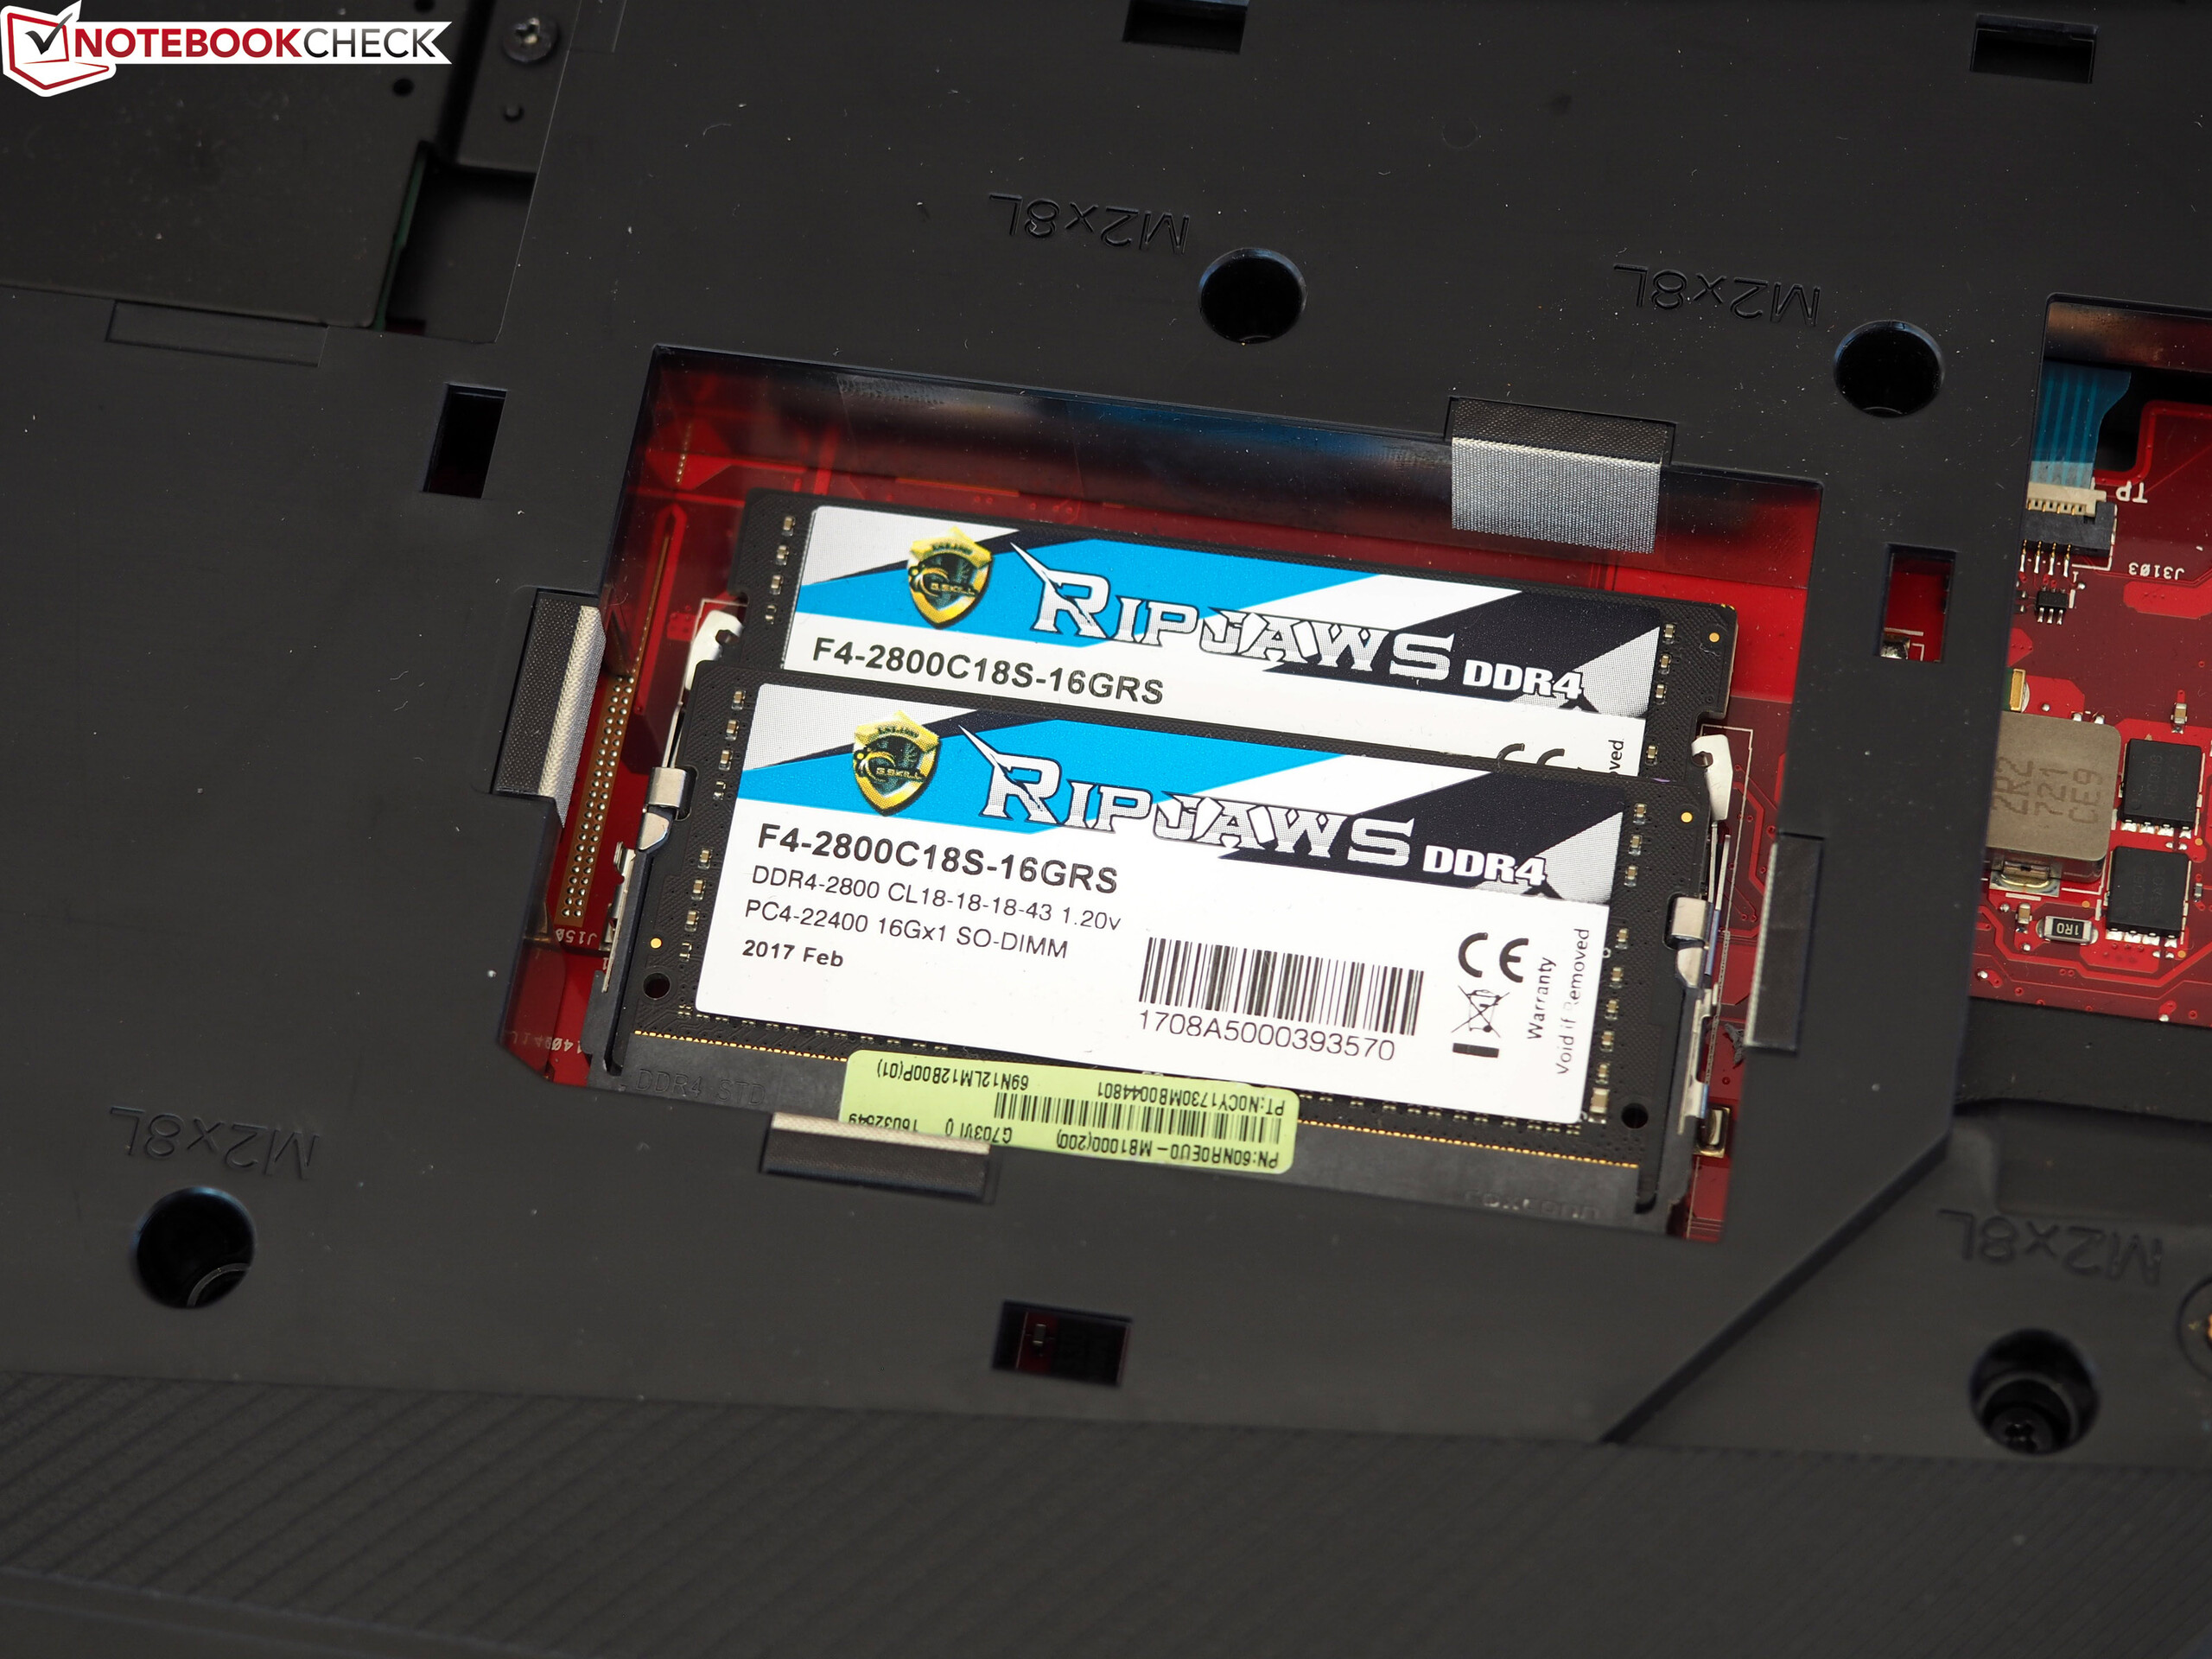
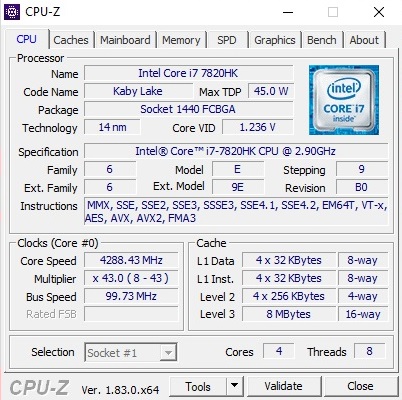
Prestandan går heller inte att klandra. För att rättfärdiga det rejäla inköpspriset så har Asus utrustat 17-tummaren med ett överflöd av toppskikts-komponenter, oavsett om det är GeForce GTX 1080 eller Core i7-7820HK, som kan erbjuda sin högsta prestanda tack vare överklockning. SSD-RAID och mängden RAM är också värda att notera.
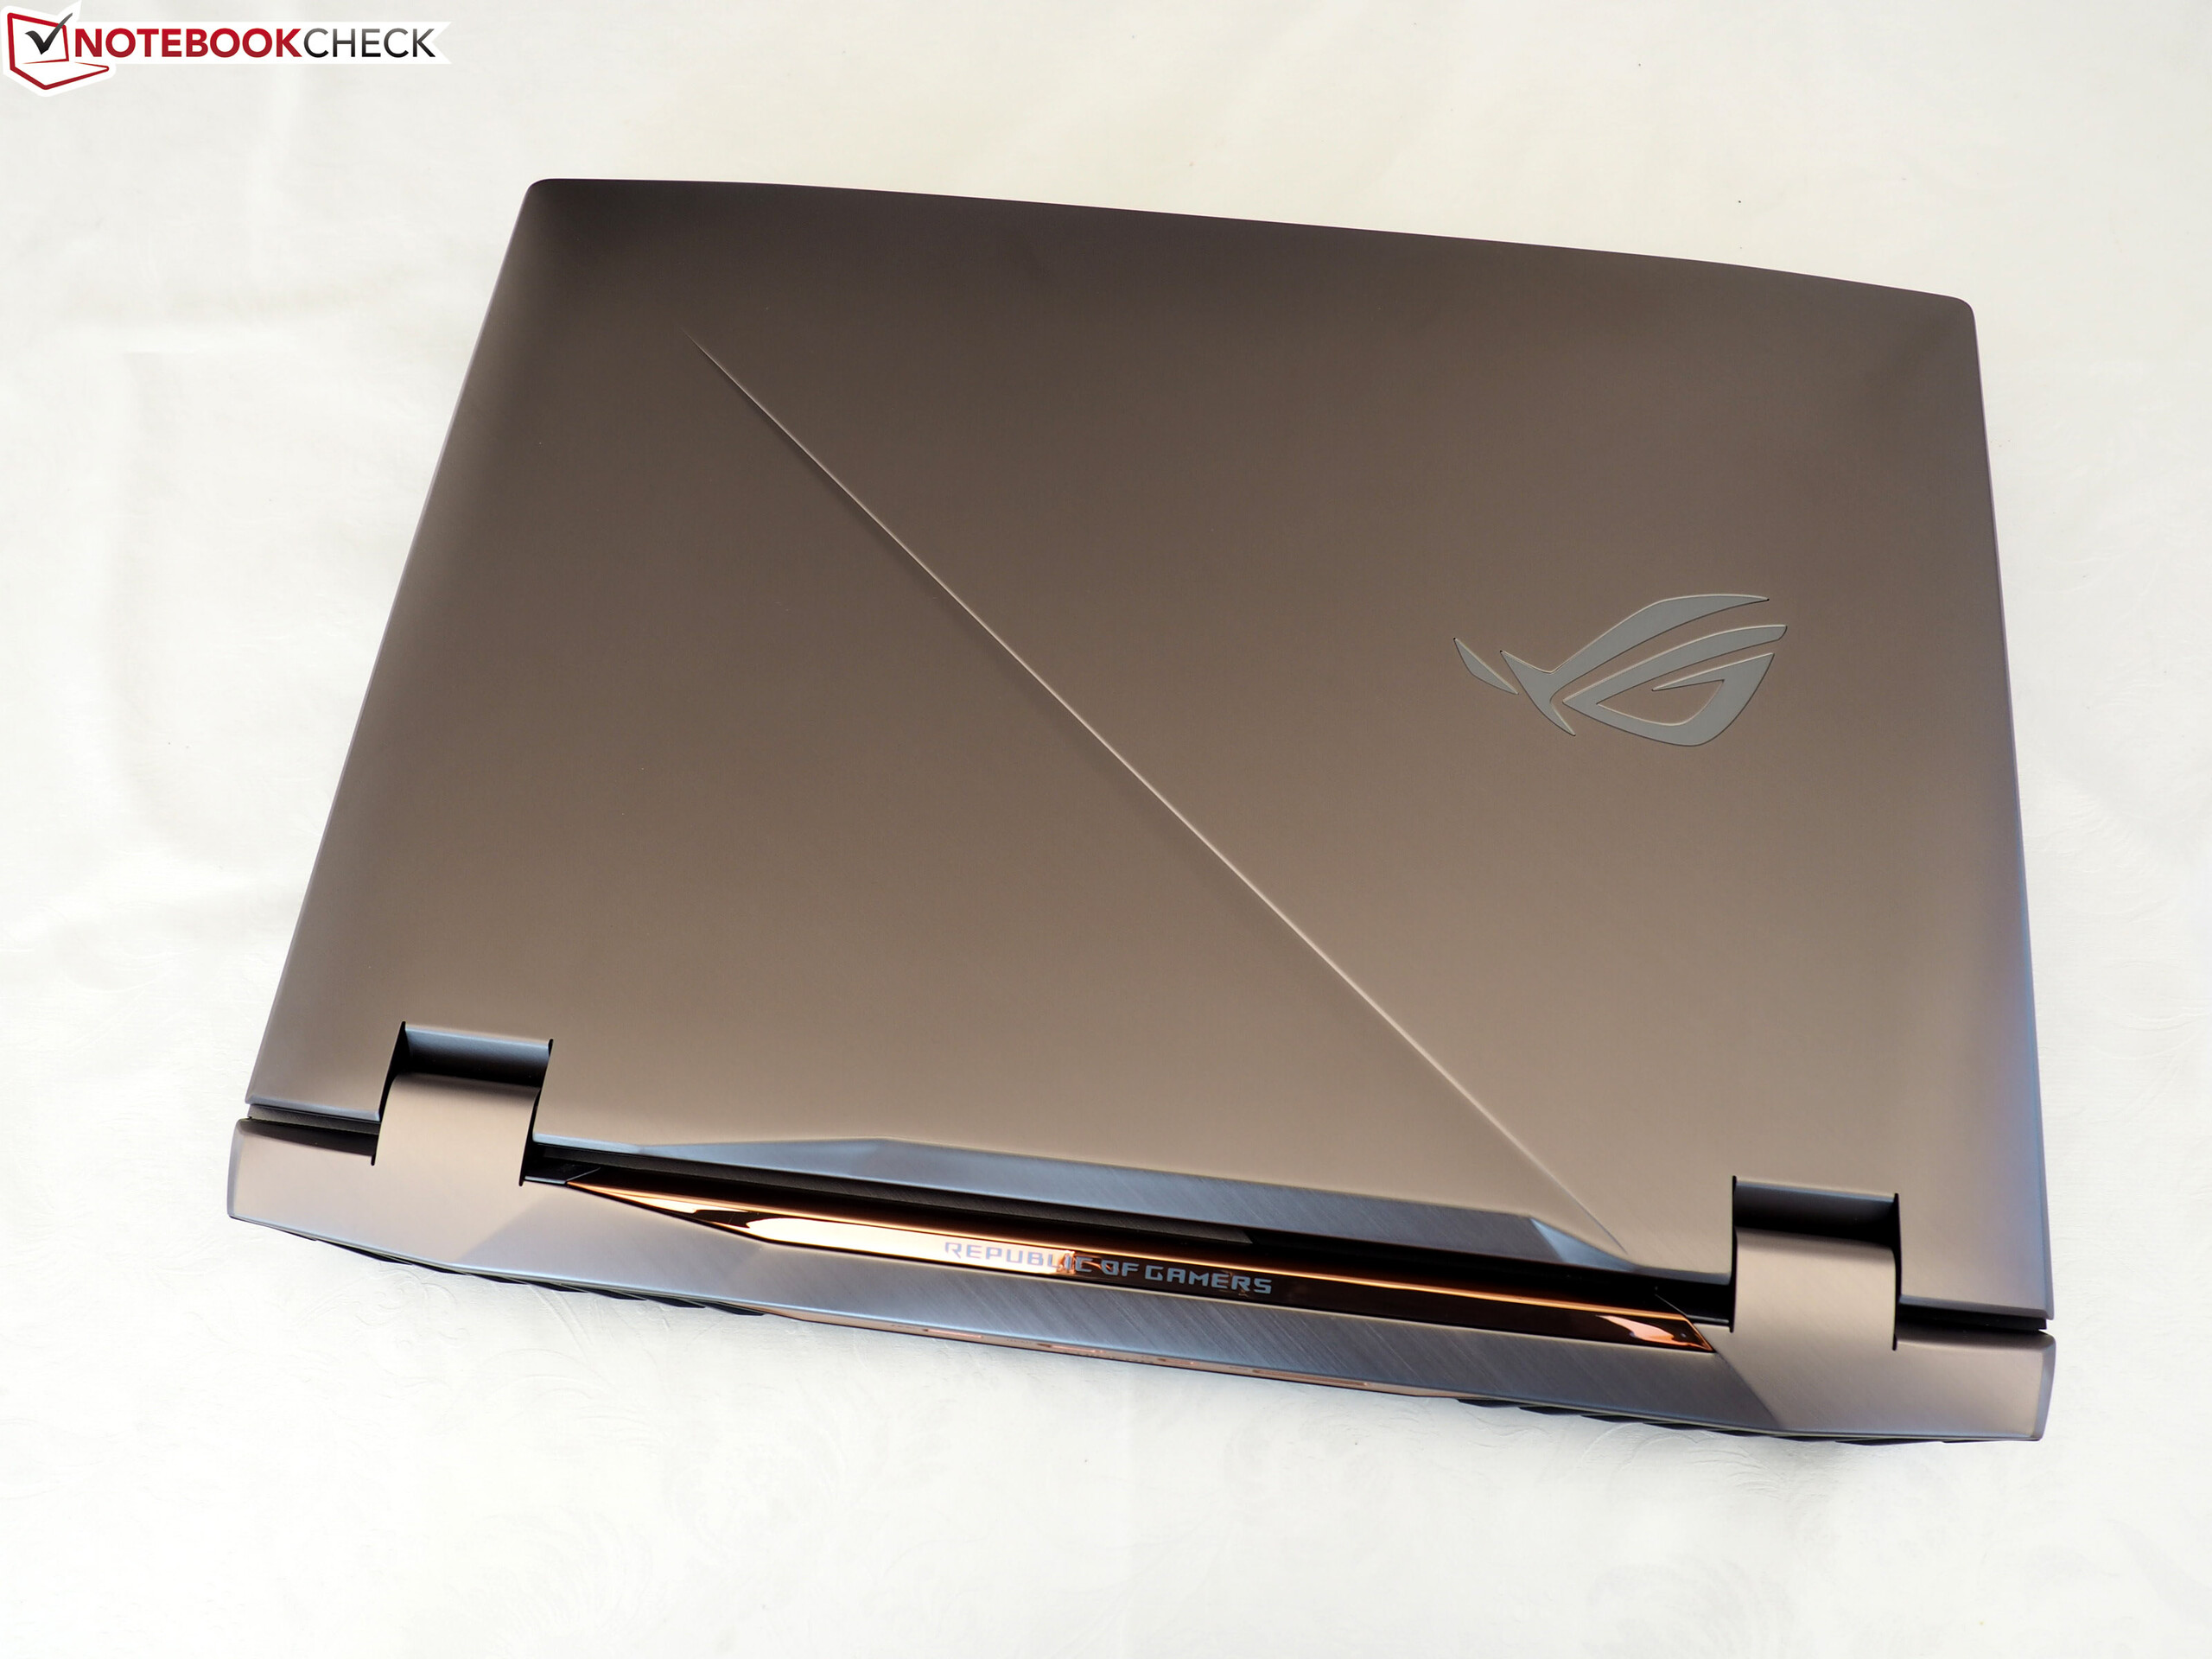
På den negativa sidan måste vi ställa den höga vikten, tjocka designen, korta batteritiden och ljudnivån vid 3D-arbete (åtminstone när OC-funktionen är aktiv) mot G703.
Trots dessa svagheter så kommer ROG Chimera få en väldigt hög plats på vår Topp 10-lista över Spellaptops.
Asus G703
- 02/27/2018 v6 (old)
Florian Glaser
Price comparison