Test: Dell XPS 15 9575 (i7-8705G, Vega M GL, 4K UHD) Omvandlingsbar (Sammanfattning)
| SD Card Reader | |
| average JPG Copy Test (av. of 3 runs) | |
| Eurocom Sky X9C (Toshiba Exceria Pro SDXC 64 GB UHS-II) | |
| Dell XPS 15 9575 i7-8705G (Toshiba Exceria Pro M501 UHS-II) | |
| Dell XPS 15 9560 (i7-7700HQ, UHD) (Toshiba Exceria Pro SDXC 64 GB UHS-II) | |
| Gigabyte Aero 14-K8 (Toshiba Exceria Pro SDXC 64 GB UHS-II) | |
| maximum AS SSD Seq Read Test (1GB) | |
| Dell XPS 15 9560 (i7-7700HQ, UHD) (Toshiba Exceria Pro SDXC 64 GB UHS-II) | |
| Eurocom Sky X9C (Toshiba Exceria Pro SDXC 64 GB UHS-II) | |
| Dell XPS 15 9575 i7-8705G (Toshiba Exceria Pro M501 UHS-II) | |
| Gigabyte Aero 14-K8 (Toshiba Exceria Pro SDXC 64 GB UHS-II) | |
| Networking | |
| iperf3 transmit AX12 | |
| Asus ZenBook Flip 15 UX561UD | |
| Dell XPS 15 9575 i7-8705G | |
| Lenovo Yoga 720-15IKB-80X7 | |
| Acer Swift 3 SF315-41-R6J9 | |
| iperf3 receive AX12 | |
| Lenovo Yoga 720-15IKB-80X7 | |
| Dell XPS 15 9575 i7-8705G | |
| Acer Swift 3 SF315-41-R6J9 | |
| Asus ZenBook Flip 15 UX561UD | |
| |||||||||||||||||||||||||
Distribution av ljusstyrkan: 81 %
Mitt på batteriet: 488 cd/m²
Kontrast: 1627:1 (Svärta: 0.3 cd/m²)
ΔE ColorChecker Calman: 3.16 | ∀{0.5-29.43 Ø4.72}
ΔE Greyscale Calman: 3.3 | ∀{0.09-98 Ø4.97}
97.9% sRGB (Argyll 1.6.3 3D)
71.7% AdobeRGB 1998 (Argyll 1.6.3 3D)
79.2% AdobeRGB 1998 (Argyll 3D)
97.9% sRGB (Argyll 3D)
78.7% Display P3 (Argyll 3D)
Gamma: 2.178
CCT: 6811 K
| Dell XPS 15 9575 i7-8705G Sharp SHP148D, IPS, 15.6", 3840x2160 | Dell XPS 15 9575 i5-8305G Sharp SHP148E, IPS, 15.6", 1920x1080 | Dell XPS 15 9560 (i7-7700HQ, UHD) IGZO IPS, 15.6", 3840x2160 | HP Spectre x360 15t-bl100 BOE06C3, IPS, 15.6", 3840x2160 | Dell Precision 5510 SHP143E, 7PHPT_LQ156D1, IGZO LED, 15.6", 3840x2160 | Lenovo ThinkPad P50 LQ156D1JW05, IPS, 15.6", 3840x2160 | |
|---|---|---|---|---|---|---|
| Display | -15% | 14% | -15% | 13% | 11% | |
| Display P3 Coverage (%) | 78.7 | 63.3 -20% | 89.7 14% | 66.6 -15% | 88.4 12% | 85.8 9% |
| sRGB Coverage (%) | 97.9 | 92.5 -6% | 100 2% | 86.9 -11% | 100 2% | 98.6 1% |
| AdobeRGB 1998 Coverage (%) | 79.2 | 63.9 -19% | 100 26% | 63.5 -20% | 99.5 26% | 98.2 24% |
| Response Times | -8% | -16% | 15% | -8% | 28% | |
| Response Time Grey 50% / Grey 80% * (ms) | 48.4 ? | 53.6 ? -11% | 57.2 ? -18% | 41.2 ? 15% | 56.4 ? -17% | 39.2 ? 19% |
| Response Time Black / White * (ms) | 34.8 ? | 36.4 ? -5% | 39.2 ? -13% | 29.6 ? 15% | 34 ? 2% | 22 ? 37% |
| PWM Frequency (Hz) | 1000 ? | 1000 ? | 962 | 1000 | 217 | |
| Screen | -14% | -19% | -21% | -16% | -29% | |
| Brightness middle (cd/m²) | 488 | 418.5 -14% | 370.1 -24% | 338.7 -31% | 391 -20% | 250 -49% |
| Brightness (cd/m²) | 440 | 391 -11% | 356 -19% | 325 -26% | 361 -18% | 250 -43% |
| Brightness Distribution (%) | 81 | 87 7% | 87 7% | 91 12% | 87 7% | 86 6% |
| Black Level * (cd/m²) | 0.3 | 0.35 -17% | 0.37 -23% | 0.28 7% | 0.4 -33% | 0.31 -3% |
| Contrast (:1) | 1627 | 1196 -26% | 1000 -39% | 1210 -26% | 978 -40% | 806 -50% |
| Colorchecker dE 2000 * | 3.16 | 3.5 -11% | 5.3 -68% | 4.9 -55% | 4.85 -53% | 4.5 -42% |
| Colorchecker dE 2000 max. * | 8.8 | 7.57 14% | 9.9 -13% | 8.7 1% | 9.3 -6% | |
| Greyscale dE 2000 * | 3.3 | 5.3 -61% | 4.6 -39% | 5.5 -67% | 4.01 -22% | 7.2 -118% |
| Gamma | 2.178 101% | 2.2 100% | 2.31 95% | 2.08 106% | 2.18 101% | 2.31 95% |
| CCT | 6811 95% | 7500 87% | 6284 103% | 7498 87% | 7340 89% | 6399 102% |
| Color Space (Percent of AdobeRGB 1998) (%) | 71.7 | 57.9 -19% | 88.3 23% | 63.5 -11% | 96 34% | 85 19% |
| Color Space (Percent of sRGB) (%) | 97.9 | 92.1 -6% | 100 2% | 86.92 -11% | 100 2% | 98.6 1% |
| Colorchecker dE 2000 calibrated * | 2.51 | |||||
| Totalt genomsnitt (program/inställningar) | -12% /
-14% | -7% /
-12% | -7% /
-15% | -4% /
-8% | 3% /
-13% |
* ... mindre är bättre
Visa svarstider
| ↔ Svarstid svart till vitt | ||
|---|---|---|
| 34.8 ms ... stiga ↗ och falla ↘ kombinerat | ↗ 19.2 ms stiga | 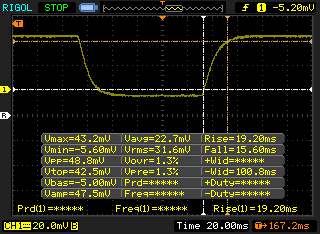 |
| ↘ 15.6 ms hösten | ||
| Skärmen visar långsamma svarsfrekvenser i våra tester och kommer att vara otillfredsställande för spelare. I jämförelse sträcker sig alla testade enheter från 0.1 (minst) till 240 (maximalt) ms. » 92 % av alla enheter är bättre. Detta innebär att den uppmätta svarstiden är sämre än genomsnittet av alla testade enheter (19.8 ms). | ||
| ↔ Svarstid 50 % grått till 80 % grått | ||
| 48.4 ms ... stiga ↗ och falla ↘ kombinerat | ↗ 23.2 ms stiga | 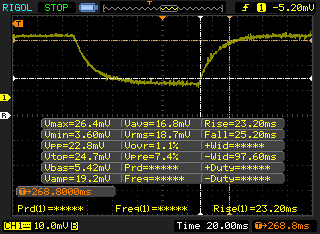 |
| ↘ 25.2 ms hösten | ||
| Skärmen visar långsamma svarsfrekvenser i våra tester och kommer att vara otillfredsställande för spelare. I jämförelse sträcker sig alla testade enheter från 0.165 (minst) till 636 (maximalt) ms. » 84 % av alla enheter är bättre. Detta innebär att den uppmätta svarstiden är sämre än genomsnittet av alla testade enheter (31 ms). | ||
Skärmflimmer / PWM (Puls-Width Modulation)
| Skärmflimmer / PWM upptäckt | 1000 Hz | ≤ 25 % ljusstyrka inställning | 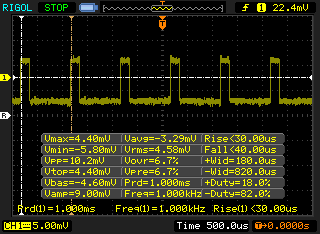 |
Displayens bakgrundsbelysning flimrar vid 1000 Hz (i värsta fall, t.ex. med PWM) Flimrande upptäckt vid en ljusstyrkeinställning på 25 % och lägre. Det ska inte finnas något flimmer eller PWM över denna ljusstyrkeinställning. Frekvensen för 1000 Hz är ganska hög, så de flesta användare som är känsliga för PWM bör inte märka något flimmer. Som jämförelse: 52 % av alla testade enheter använder inte PWM för att dämpa skärmen. Om PWM upptäcktes mättes ett medelvärde av 7769 (minst: 5 - maximum: 343500) Hz. | |||
| Cinebench R10 | |
| Rendering Multiple CPUs 32Bit | |
| Eurocom Tornado F5 | |
| Intel Hades Canyon NUC8i7HVK | |
| Dell XPS 15 9575 i7-8705G | |
| Dell Latitude 5590 | |
| Dell XPS 15 9575 i5-8305G | |
| Dell XPS 15 9560 (i7-7700HQ, UHD) | |
| Dell XPS 13 9370 i7 UHD | |
| Acer Swift 3 SF315-41-R6J9 | |
| Dell Latitude 13 7380 | |
| Rendering Single 32Bit | |
| Dell Latitude 5590 | |
| Eurocom Tornado F5 | |
| Intel Hades Canyon NUC8i7HVK | |
| Dell XPS 15 9575 i7-8705G | |
| Dell XPS 13 9370 i7 UHD | |
| Dell Latitude 13 7380 | |
| Dell XPS 15 9575 i5-8305G | |
| Dell XPS 15 9560 (i7-7700HQ, UHD) | |
| Acer Swift 3 SF315-41-R6J9 | |
* ... mindre är bättre
| PCMark 8 Home Score Accelerated v2 | 4235 poäng | |
| PCMark 8 Creative Score Accelerated v2 | 6297 poäng | |
| PCMark 8 Work Score Accelerated v2 | 4469 poäng | |
| PCMark 10 Score | 5001 poäng | |
Hjälp | ||
| Dell XPS 15 9575 i7-8705G SK hynix PC401 NVMe 500 GB | Dell XPS 15 9575 i5-8305G Toshiba XG5 KXG50ZNV256G | Asus ZenBook Flip 15 UX561UD Micron 1100 MTFDDAV256TBN | Asus Zenbook Pro UX550VE-DB71T Samsung PM961 NVMe MZVLW512HMJP | Asus G501VW-FY081T Samsung CM871 MZNLF128HCHP | |
|---|---|---|---|---|---|
| AS SSD | -58% | -59% | 31% | -122% | |
| Copy Game MB/s (MB/s) | 944 | 250.5 -73% | 282.3 -70% | 477.1 -49% | 141.5 -85% |
| Copy Program MB/s (MB/s) | 487.9 | 174.9 -64% | 196.8 -60% | 294.6 -40% | 99.9 -80% |
| Copy ISO MB/s (MB/s) | 1523 | 392.7 -74% | 291 -81% | 1269 -17% | 163 -89% |
| Score Total (Points) | 2132 | 1113 -48% | 844 -60% | 3721 75% | 269 -87% |
| Score Write (Points) | 807 | 307 -62% | 371 -54% | 1421 76% | 63 -92% |
| Score Read (Points) | 921 | 595 -35% | 310 -66% | 1541 67% | 152 -83% |
| Access Time Write * (ms) | 0.051 | 0.056 -10% | 0.056 -10% | 0.034 33% | 0.225 -341% |
| Access Time Read * (ms) | 0.044 | 0.146 -232% | 0.097 -120% | 0.054 -23% | 0.207 -370% |
| 4K-64 Write (MB/s) | 637 | 181.2 -72% | 248.5 -61% | 1160 82% | 19.4 -97% |
| 4K-64 Read (MB/s) | 649 | 337.1 -48% | 235.5 -64% | 1269 96% | 87.6 -87% |
| 4K Write (MB/s) | 94.3 | 92.7 -2% | 84.8 -10% | 112.8 20% | 30.66 -67% |
| 4K Read (MB/s) | 41.38 | 24.78 -40% | 25.79 -38% | 51 23% | 13.87 -66% |
| Seq Write (MB/s) | 752 | 334.3 -56% | 379.3 -50% | 1475 96% | 126.9 -83% |
| Seq Read (MB/s) | 2302 | 2335 1% | 488 -79% | 2208 -4% | 504 -78% |
* ... mindre är bättre

| 3DMark 11 Performance | 9890 poäng | |
| 3DMark Ice Storm Standard Score | 67107 poäng | |
| 3DMark Cloud Gate Standard Score | 20851 poäng | |
| 3DMark Fire Strike Score | 6280 poäng | |
| 3DMark Fire Strike Extreme Score | 3100 poäng | |
| 3DMark Time Spy Score | 2225 poäng | |
Hjälp | ||
| låg | med. | hög | ultra | 4K | |
|---|---|---|---|---|---|
| BioShock Infinite (2013) | 224.5 | 181.4 | 161 | 52.5 | |
| Batman: Arkham Knight (2015) | 108 | 95 | 54 | 16 | |
| Rise of the Tomb Raider (2016) | 133.1 | 81.2 | 42.4 | 32.8 | 14.3 |
| Ashes of the Singularity (2016) | 54.9 | 37 | 32.7 |
Ljudnivå
| Låg belastning |
| 28.2 / 28.2 / 28.2 dB(A) |
| Hög belastning |
| 29 / 47.4 dB(A) |
 | ||
30 dB tyst 40 dB(A) hörbar 50 dB(A) högt ljud |
||
min: | ||
| Dell XPS 15 9575 i7-8705G Vega M GL / 870, i7-8705G, SK hynix PC401 NVMe 500 GB | Lenovo Yoga 720-15IKB-80X7 GeForce GTX 1050 Mobile, i7-7700HQ, Samsung PM961 MZVLW256HEHP | Asus ZenBook Flip 15 UX561UD GeForce GTX 1050 Mobile, i5-8550U, Micron 1100 MTFDDAV256TBN | Asus Zenbook Pro UX550VE-DB71T GeForce GTX 1050 Ti Mobile, i7-7700HQ, Samsung PM961 NVMe MZVLW512HMJP | Alienware 13 R3 (i5-7300HQ, GTX 1050 Ti) GeForce GTX 1050 Ti Mobile, i5-7300HQ, Samsung PM961 MZVLW256HEHP | |
|---|---|---|---|---|---|
| Noise | -5% | -8% | -11% | -3% | |
| av / miljö * (dB) | 28.2 | 28.2 -0% | 30.4 -8% | 28.3 -0% | 29.7 -5% |
| Idle Minimum * (dB) | 28.2 | 28.2 -0% | 31.3 -11% | 30.4 -8% | 29.7 -5% |
| Idle Average * (dB) | 28.2 | 28.2 -0% | 31.3 -11% | 31 -10% | 29.7 -5% |
| Idle Maximum * (dB) | 28.2 | 28.2 -0% | 31.3 -11% | 31.2 -11% | 29.7 -5% |
| Load Average * (dB) | 29 | 39 -34% | 36.4 -26% | 43.3 -49% | 32.7 -13% |
| Witcher 3 ultra * (dB) | 44.7 | 46.2 -3% | 36.4 19% | ||
| Load Maximum * (dB) | 47.4 | 46.3 2% | 37.1 22% | 46.2 3% | 50 -5% |
* ... mindre är bättre
(±) Den maximala temperaturen på ovansidan är 45 °C / 113 F, jämfört med genomsnittet av 36.8 °C / 98 F , allt från 21 till 71 °C för klassen Multimedia.
(+) Botten värms upp till maximalt 36.6 °C / 98 F, jämfört med genomsnittet av 39.1 °C / 102 F
(+) Vid tomgångsbruk är medeltemperaturen för ovansidan 24.8 °C / 77 F, jämfört med enhetsgenomsnittet på 31.3 °C / ### class_avg_f### F.
(±) När du spelar The Witcher 3 är medeltemperaturen för ovansidan 33.5 °C / 92 F, jämfört med enhetsgenomsnittet på 31.3 °C / ## #class_avg_f### F.
(+) Handledsstöden och pekplattan är kallare än hudtemperaturen med maximalt 28 °C / 82.4 F och är därför svala att ta på.
(±) Medeltemperaturen för handledsstödsområdet på liknande enheter var 28.7 °C / 83.7 F (+0.7 °C / 1.3 F).
| Av/Standby | |
| Låg belastning | |
| Hög belastning |
|
Förklaring:
min: | |
| Dell XPS 15 9575 i7-8705G i7-8705G, Vega M GL / 870, SK hynix PC401 NVMe 500 GB, IPS, 3840x2160, 15.6" | Dell XPS 15 9560 (i7-7700HQ, UHD) i7-7700HQ, GeForce GTX 1050 Mobile, Lite-On CX2-8B512-Q11, IGZO IPS, 3840x2160, 15.6" | Lenovo Yoga 720-15IKB-80X7 i7-7700HQ, GeForce GTX 1050 Mobile, Samsung PM961 MZVLW256HEHP, IPS, 1920x1080, 15.6" | Asus ZenBook Flip 15 UX561UD i5-8550U, GeForce GTX 1050 Mobile, Micron 1100 MTFDDAV256TBN, IPS, 3840x2160, 15.6" | Asus Zenbook Pro UX550VE-DB71T i7-7700HQ, GeForce GTX 1050 Ti Mobile, Samsung PM961 NVMe MZVLW512HMJP, IPS, 1920x1080, 15.6" | |
|---|---|---|---|---|---|
| Power Consumption | -37% | -2% | -3% | 8% | |
| Idle Minimum * (Watt) | 6.2 | 11.9 -92% | 8.3 -34% | 5.4 13% | 6.3 -2% |
| Idle Average * (Watt) | 12.9 | 17.1 -33% | 10.2 21% | 10.8 16% | 7.9 39% |
| Idle Maximum * (Watt) | 13.6 | 17.3 -27% | 10.4 24% | 13.9 -2% | 8.1 40% |
| Load Average * (Watt) | 76.1 | 94.7 -24% | 67.5 11% | 94 -24% | 84.9 -12% |
| Witcher 3 ultra * (Watt) | 84.3 | 104.8 -24% | 96.5 -14% | 96.3 -14% | |
| Load Maximum * (Watt) | 99.4 | 122 -23% | 117.2 -18% | 116.6 -17% | 102.4 -3% |
* ... mindre är bättre
| Dell XPS 15 9575 i7-8705G i7-8705G, Vega M GL / 870, 75 Wh | Dell XPS 15 9575 i5-8305G i5-8305G, Vega M GL / 870, 75 Wh | Lenovo Yoga 720-15IKB-80X7 i7-7700HQ, GeForce GTX 1050 Mobile, 72 Wh | Asus ZenBook Flip 15 UX561UD i5-8550U, GeForce GTX 1050 Mobile, 52 Wh | Asus Zenbook Pro UX550VE-DB71T i7-7700HQ, GeForce GTX 1050 Ti Mobile, 73 Wh | Asus Strix GL502VT-DS74 6700HQ, GeForce GTX 970M, 64 Wh | |
|---|---|---|---|---|---|---|
| Batteridrifttid | 17% | 40% | -5% | 30% | -16% | |
| Reader / Idle (h) | 11.2 | 11.1 -1% | 17.8 59% | 9.3 -17% | 17.1 53% | 9.7 -13% |
| WiFi v1.3 (h) | 7 | 9.4 34% | 8.1 16% | 5.2 -26% | 8.9 27% | 5.9 -16% |
| Load (h) | 1.1 | 1.3 18% | 1.6 45% | 1.4 27% | 1.2 9% | 0.9 -18% |
För
Emot
Läs den fullständiga versionen av den här recensionen på engelska här.
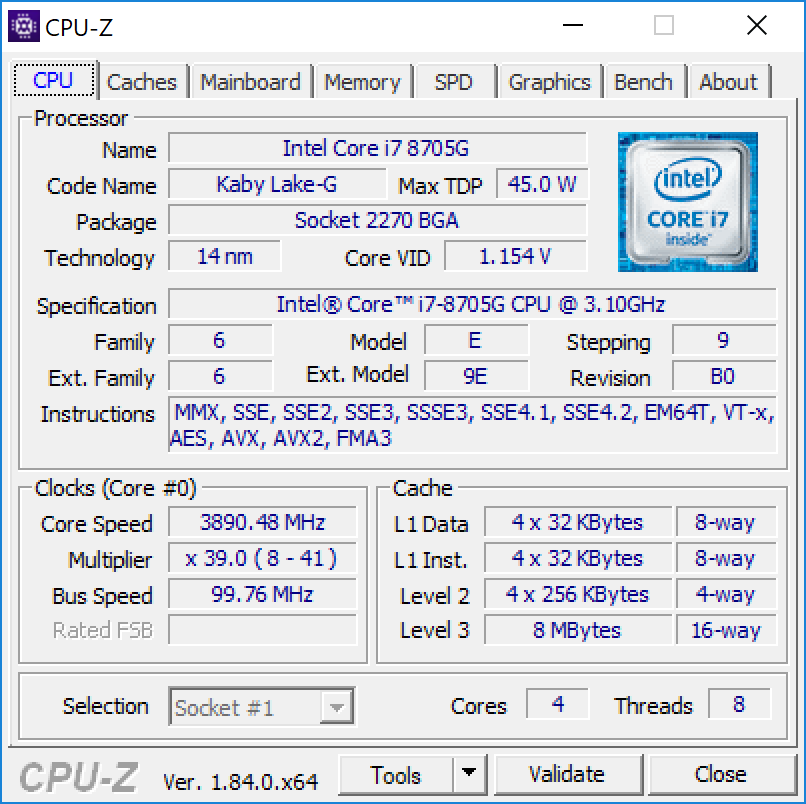
Aktuella SKU:er för XPS 15 9560 inkluderar Core i5-7300HQ och Core i7-7700HQ i likhet med hur det aktuella utbudet av SKU:er för XPS 15 9575 inkluderar Core i5-8305G och Core i7-8705G. Där steget från en i5-7300HQ till i7-7700HQ kan föra med sig en prestandaökning på runt 40% så är steget mellan i5-8305G till i7-8705G bara 5 - 10 procent. Om man väger in den massiva skillnaden i kostnad mellan i5- och i7-modellerna av XPS 15 9575 (11 000 kronor mot 19 000 kronor) så blir det uppenbart att man inte borde köpa Core i7-konfigurationen om prestanda-per-krona är prioriterat.
Istället har Dell rättfärdigat den stora skillnaden i pris med mer RAM och en panel med högre upplösning som i skrivande stund bara kommer tillsammans med Core i7 SKU:n. Den som kör tung multitasking, använder den tryckkänsliga skärmens stylus eller redigerar video kommer uppleva ett större värde av 16 GB RAM och ett alternativ för 4K UHD än vad dom flesta hemmaanvändare kommer göra. Men trots det så är vi besvikna på att dom aktuella Core i5-varianterna är begränsade till bara 8 GB RAM.
Utöver ovan nämnda skillnader så gäller våra existerande kommentarer om Core i5-versionen av XPS 15 9575. Kaby Lake G visar sig vara ett utmärkt alternativ till den allmänt förekommande kombinationen Core i7-7700HQ och GTX 1050 alternativt 1050 Ti som återfinns i dom flesta konkurrerande laptops. Dells omvandlingsbara är mer energieffektiv och håller sig svalare än dom nämnda systemen och är tystare än XPS 15 9560. Så länge man känner till den långa listan över nackdelar (se till höger) så kommer andra omvandlingsbara på 15 tum inte i närheten av vad XPS 15 9575 kan erbjuda, med ett anmärkningsvärt undantag i form av den kommande 2018 HP Spectre x360 15.
Du behöver inte spendera 19 000 kronor för alternativet med Core i7-8705G när modellen med Core i5-8705G bara är en aning långsammare för nästan 10 000 kronor mindre. Till och med den billigaste konfigurationen av XPS 15 9575 är nästan lika snabb som den dyraste XPS 15 9575 eller XPS 9560. Vi hoppas på att få se mer RAM och skärmalternativ för framtida modeller med Core i5 för att göra serien ännu mer tilltalande.
Dell XPS 15 9575 i7-8705G
- 05/08/2018 v6 (old)
Allen Ngo
Price comparison
