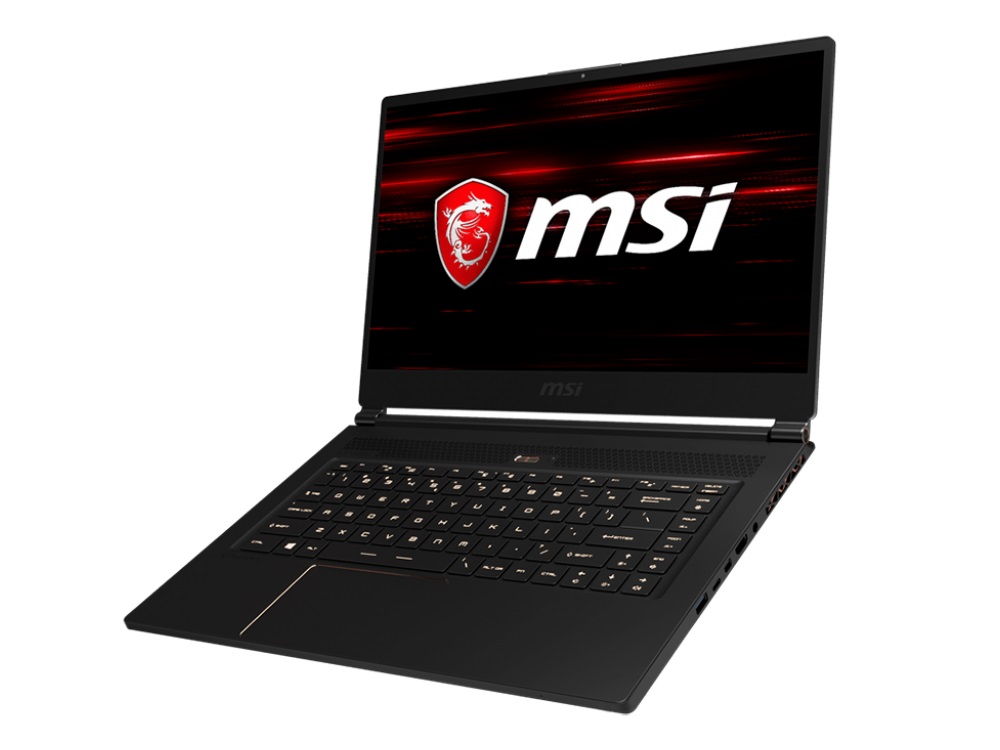
Test: MSI GS65 8RF Stealth Thin (i7-8750H, GTX 1070 Max-Q, Full HD) Laptop (Sammanfattning)
| |||||||||||||||||||||||||
Distribution av ljusstyrkan: 89 %
Mitt på batteriet: 222 cd/m²
Kontrast: 1155:1 (Svärta: 0.22 cd/m²)
ΔE ColorChecker Calman: 2.37 | ∀{0.5-29.43 Ø4.71}
calibrated: 1.84
ΔE Greyscale Calman: 1.58 | ∀{0.09-98 Ø4.96}
92% sRGB (Argyll 1.6.3 3D)
60% AdobeRGB 1998 (Argyll 1.6.3 3D)
67.2% AdobeRGB 1998 (Argyll 3D)
92.1% sRGB (Argyll 3D)
66.2% Display P3 (Argyll 3D)
Gamma: 2.48
CCT: 6785 K
| MSI GS65 8RF-019DE Stealth Thin AU Optronics B156HAN08.0 (AUO80ED), IPS, 1920x1080 | MSI GS63VR 7RG-005 Chi Mei N156HHE-GA1 (CMN15F4), TN LED, 1920x1080 | Gigabyte Aero 15X v8 LGD05C0, IPS, 1920x1080 | Asus Zephyrus M GM501 AUO B156HAN07.1 (AUO71ED), IPS, 1920x1080 | Acer Predator Triton 700 AUO B156HAN04.2 (AUO42ED), IPS, 1920x1080 | |
|---|---|---|---|---|---|
| Display | 25% | -2% | 0% | -5% | |
| Display P3 Coverage (%) | 66.2 | 91.6 38% | 63.6 -4% | 66.1 0% | 62.5 -6% |
| sRGB Coverage (%) | 92.1 | 100 9% | 93.8 2% | 92.7 1% | 88.7 -4% |
| AdobeRGB 1998 Coverage (%) | 67.2 | 86.6 29% | 64.9 -3% | 67.2 0% | 63.5 -6% |
| Response Times | 45% | 9% | 41% | -143% | |
| Response Time Grey 50% / Grey 80% * (ms) | 17.6 ? | 10.4 ? 41% | 16.8 ? 5% | 6.6 ? 63% | 44.8 ? -155% |
| Response Time Black / White * (ms) | 12.8 ? | 6.6 ? 48% | 11.2 ? 13% | 10.4 ? 19% | 29.6 ? -131% |
| PWM Frequency (Hz) | 25510 ? | ||||
| Screen | -10% | 12% | -52% | -55% | |
| Brightness middle (cd/m²) | 254 | 269 6% | 313 23% | 307 21% | 291 15% |
| Brightness (cd/m²) | 262 | 254 -3% | 300 15% | 296 13% | 277 6% |
| Brightness Distribution (%) | 89 | 85 -4% | 78 -12% | 89 0% | 84 -6% |
| Black Level * (cd/m²) | 0.22 | 0.21 5% | 0.33 -50% | 0.25 -14% | 0.22 -0% |
| Contrast (:1) | 1155 | 1281 11% | 948 -18% | 1228 6% | 1323 15% |
| Colorchecker dE 2000 * | 2.37 | 3 -27% | 1.29 46% | 5.74 -142% | 5.52 -133% |
| Colorchecker dE 2000 max. * | 4.71 | 5.62 -19% | 2.04 57% | 11.32 -140% | 10.72 -128% |
| Colorchecker dE 2000 calibrated * | 1.84 | 1.94 -5% | |||
| Greyscale dE 2000 * | 1.58 | 3.18 -101% | 0.69 56% | 6.44 -308% | 6.59 -317% |
| Gamma | 2.48 89% | 2.25 98% | 2.43 91% | 2.48 89% | 2.44 90% |
| CCT | 6785 96% | 7274 89% | 6550 99% | 8395 77% | 7816 83% |
| Color Space (Percent of AdobeRGB 1998) (%) | 60 | 77 28% | 60 0% | 60 0% | 58 -3% |
| Color Space (Percent of sRGB) (%) | 92 | 100 9% | 94 2% | 93 1% | 89 -3% |
| Totalt genomsnitt (program/inställningar) | 20% /
5% | 6% /
9% | -4% /
-30% | -68% /
-57% |
* ... mindre är bättre
Visa svarstider
| ↔ Svarstid svart till vitt | ||
|---|---|---|
| 12.8 ms ... stiga ↗ och falla ↘ kombinerat | ↗ 7.6 ms stiga | 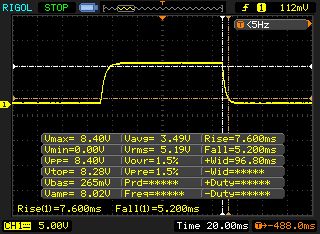 |
| ↘ 5.2 ms hösten | ||
| Skärmen visar bra svarsfrekvens i våra tester, men kan vara för långsam för konkurrenskraftiga spelare. I jämförelse sträcker sig alla testade enheter från 0.1 (minst) till 240 (maximalt) ms. » 33 % av alla enheter är bättre. Det betyder att den uppmätta svarstiden är bättre än genomsnittet av alla testade enheter (19.8 ms). | ||
| ↔ Svarstid 50 % grått till 80 % grått | ||
| 17.6 ms ... stiga ↗ och falla ↘ kombinerat | ↗ 9.2 ms stiga | 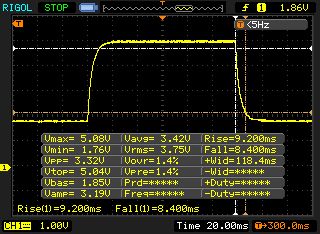 |
| ↘ 8.4 ms hösten | ||
| Skärmen visar bra svarsfrekvens i våra tester, men kan vara för långsam för konkurrenskraftiga spelare. I jämförelse sträcker sig alla testade enheter från 0.165 (minst) till 636 (maximalt) ms. » 32 % av alla enheter är bättre. Det betyder att den uppmätta svarstiden är bättre än genomsnittet av alla testade enheter (31 ms). | ||
Skärmflimmer / PWM (Puls-Width Modulation)
| Skärmflimmer / PWM upptäcktes inte | 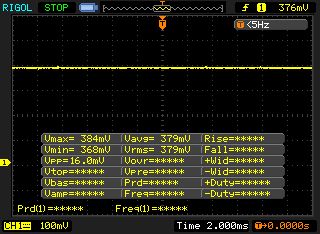 | ||
Som jämförelse: 52 % av alla testade enheter använder inte PWM för att dämpa skärmen. Om PWM upptäcktes mättes ett medelvärde av 7754 (minst: 5 - maximum: 343500) Hz. | |||
| PCMark 10 - Score | |
| Genomsnitt av klass Gaming (5828 - 12414, n=93, senaste 2 åren) | |
| Acer Predator Triton 700 | |
| Asus Zephyrus M GM501 | |
| MSI GS65 8RF-019DE Stealth Thin | |
| Gigabyte Aero 15X v8 | |
| MSI GS63VR 7RG-005 | |
| PCMark 8 Home Score Accelerated v2 | 4665 poäng | |
| PCMark 8 Work Score Accelerated v2 | 5621 poäng | |
| PCMark 10 Score | 5095 poäng | |
Hjälp | ||
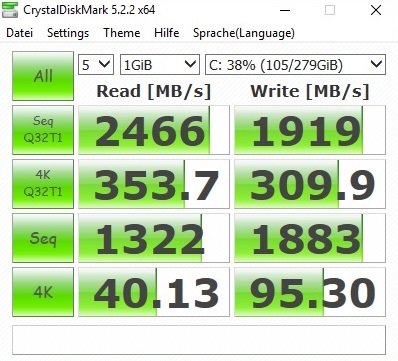
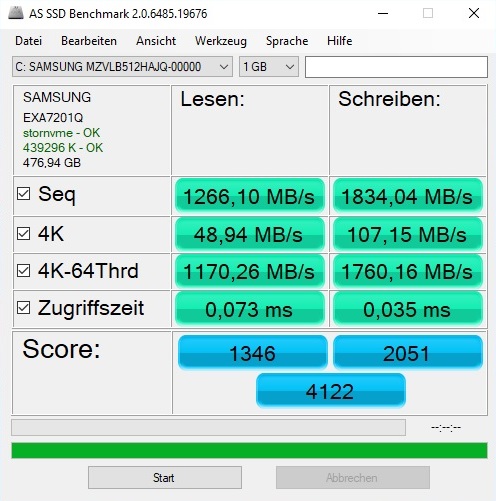
| MSI GS65 8RF-019DE Stealth Thin Samsung SSD PM981 MZVLB512HAJQ | MSI GS63VR 7RG-005 Samsung SM961 MZVPW256HEGL | Gigabyte Aero 15X v8 Toshiba NVMe THNSN5512GPU7 | Asus Zephyrus M GM501 Samsung SM961 MZVKW512HMJP m.2 PCI-e | Acer Predator Triton 700 2x SK Hynix Canvas SC300 512GB M.2 (HFS512G39MND) (RAID 0) | |
|---|---|---|---|---|---|
| CrystalDiskMark 5.2 / 6 | -9% | -2% | 45% | ||
| Read Seq Q32T1 (MB/s) | 2466 | 2627 7% | 3157 28% | 3417 39% | |
| Write Seq Q32T1 (MB/s) | 1919 | 1375 -28% | 1659 -14% | 2771 44% | |
| Read 4K Q32T1 (MB/s) | 353.7 | 332.8 -6% | 325.6 -8% | 564 59% | |
| Write 4K Q32T1 (MB/s) | 309.9 | 268.6 -13% | 269.5 -13% | 460.6 49% | |
| Read Seq (MB/s) | 1322 | 1404 6% | 1104 -16% | 2664 102% | |
| Write Seq (MB/s) | 1883 | 1335 -29% | 1652 -12% | 2631 40% | |
| Read 4K (MB/s) | 40.13 | 37.65 -6% | 46.2 15% | 45.45 13% | |
| Write 4K (MB/s) | 95.3 | 94.4 -1% | 96 1% | 109.2 15% |

| 3DMark 11 Performance | 15782 poäng | |
| 3DMark Cloud Gate Standard Score | 30373 poäng | |
| 3DMark Fire Strike Score | 12733 poäng | |
Hjälp | ||
| The Witcher 3 - 1920x1080 Ultra Graphics & Postprocessing (HBAO+) | |
| Genomsnitt av klass Gaming (104.7 - 240, n=7, senaste 2 åren) | |
| Acer Predator Triton 700 | |
| Asus Zephyrus M GM501 | |
| MSI GS65 8RF-019DE Stealth Thin | |
| Gigabyte Aero 15X v8 | |
| MSI GS63VR 7RG-005 | |
| låg | med. | hög | ultra | |
|---|---|---|---|---|
| The Witcher 3 (2015) | 95.5 | 52.7 | ||
| Resident Evil 7 (2017) | 135 | 116 | ||
| Rocket League (2017) | 196 | |||
| Playerunknown's Battlegrounds (PUBG) (2017) | 116 | 78.7 | ||
| FIFA 18 (2017) | 222 | 217 | ||
| The Evil Within 2 (2017) | 51.7 | 50.5 | ||
| Wolfenstein II: The New Colossus (2017) | 98.4 | 92.2 | ||
| Assassin´s Creed Origins (2017) | 71 | 61 | ||
| Call of Duty WWII (2017) | 115 | 101 | ||
| Need for Speed Payback (2017) | 92.5 | 88.6 | ||
| Star Wars Battlefront 2 (2017) | 89.2 | 75.9 | ||
| Fortnite (2018) | 127 | 105 | ||
| Final Fantasy XV Benchmark (2018) | 49.5 | |||
| Kingdom Come: Deliverance (2018) | 71.2 | 54.2 | ||
| Far Cry 5 (2018) | 83 | 78 |
Ljudnivå
| Låg belastning |
| 30 / 31 / 34 dB(A) |
| Hög belastning |
| 43 / 44 dB(A) |
 | ||
30 dB tyst 40 dB(A) hörbar 50 dB(A) högt ljud |
||
min: | ||
| MSI GS65 8RF-019DE Stealth Thin GeForce GTX 1070 Max-Q, i7-8750H | MSI GS63VR 7RG-005 GeForce GTX 1070 Max-Q, i7-7700HQ | Gigabyte Aero 15X v8 GeForce GTX 1070 Max-Q, i7-8750H | Asus Zephyrus M GM501 GeForce GTX 1070 Mobile, i7-8750H | Acer Predator Triton 700 GeForce GTX 1080 Max-Q, i7-7700HQ | Genomsnitt av klass Gaming | |
|---|---|---|---|---|---|---|
| Noise | -3% | -8% | -6% | -7% | 5% | |
| av / miljö * (dB) | 30 | 30 -0% | 29 3% | 29 3% | 31 -3% | 24.1 ? 20% |
| Idle Minimum * (dB) | 30 | 31 -3% | 30 -0% | 30 -0% | 33 -10% | 26 ? 13% |
| Idle Average * (dB) | 31 | 34 -10% | 31 -0% | 31 -0% | 34 -10% | 27.4 ? 12% |
| Idle Maximum * (dB) | 34 | 35 -3% | 35 -3% | 33 3% | 40 -18% | 30.1 ? 11% |
| Load Average * (dB) | 43 | 42 2% | 49 -14% | 49 -14% | 41 5% | 43.6 ? -1% |
| Witcher 3 ultra * (dB) | 42 | 44 -5% | 51 -21% | 50 -19% | 43 -2% | |
| Load Maximum * (dB) | 44 | 46 -5% | 54 -23% | 52 -18% | 48 -9% | 54.2 ? -23% |
* ... mindre är bättre
(-) Den maximala temperaturen på ovansidan är 49 °C / 120 F, jämfört med genomsnittet av 40.4 °C / 105 F , allt från 21.2 till 68.8 °C för klassen Gaming.
(-) Botten värms upp till maximalt 63 °C / 145 F, jämfört med genomsnittet av 43.2 °C / 110 F
(+) Vid tomgångsbruk är medeltemperaturen för ovansidan 23.2 °C / 74 F, jämfört med enhetsgenomsnittet på 33.9 °C / ### class_avg_f### F.
(-) När du spelar The Witcher 3 är medeltemperaturen för ovansidan 44.4 °C / 112 F, jämfört med enhetsgenomsnittet på 33.9 °C / ## #class_avg_f### F.
(±) Handledsstöden och pekplattan kan bli väldigt varma vid beröring med maximalt 37 °C / 98.6 F.
(-) Medeltemperaturen för handledsstödsområdet på liknande enheter var 28.8 °C / 83.8 F (-8.2 °C / -14.8 F).
| MSI GS65 8RF-019DE Stealth Thin GeForce GTX 1070 Max-Q, i7-8750H | MSI GS63VR 7RG-005 GeForce GTX 1070 Max-Q, i7-7700HQ | Gigabyte Aero 15X v8 GeForce GTX 1070 Max-Q, i7-8750H | Asus Zephyrus M GM501 GeForce GTX 1070 Mobile, i7-8750H | Acer Predator Triton 700 GeForce GTX 1080 Max-Q, i7-7700HQ | Genomsnitt av klass Gaming | |
|---|---|---|---|---|---|---|
| Heat | -2% | -10% | -9% | -21% | -9% | |
| Maximum Upper Side * (°C) | 49 | 47 4% | 53 -8% | 52 -6% | 61 -24% | 45.2 ? 8% |
| Maximum Bottom * (°C) | 63 | 63 -0% | 65 -3% | 49 22% | 69 -10% | 48.1 ? 24% |
| Idle Upper Side * (°C) | 24 | 25 -4% | 26 -8% | 31 -29% | 29 -21% | 31 ? -29% |
| Idle Bottom * (°C) | 25 | 27 -8% | 30 -20% | 31 -24% | 32 -28% | 34.2 ? -37% |
* ... mindre är bättre
MSI GS65 8RF-019DE Stealth Thin ljudanalys
(±) | högtalarljudstyrkan är genomsnittlig men bra (76 dB)
Bas 100 - 315 Hz
(-) | nästan ingen bas - i genomsnitt 16.4% lägre än medianen
(±) | linjäriteten för basen är genomsnittlig (9.7% delta till föregående frekvens)
Mellan 400 - 2000 Hz
(+) | balanserad mellan - endast 4.9% från medianen
(+) | mids är linjära (5.6% delta till föregående frekvens)
Högsta 2 - 16 kHz
(+) | balanserade toppar - endast 2.5% från medianen
(±) | linjäriteten för toppar är genomsnittlig (7.1% delta till föregående frekvens)
Totalt 100 - 16 000 Hz
(±) | linjäriteten för det totala ljudet är genomsnittlig (18.5% skillnad mot median)
Jämfört med samma klass
» 60% av alla testade enheter i den här klassen var bättre, 8% liknande, 32% sämre
» Den bästa hade ett delta på 6%, genomsnittet var 18%, sämst var 132%
Jämfört med alla testade enheter
» 42% av alla testade enheter var bättre, 8% liknande, 51% sämre
» Den bästa hade ett delta på 4%, genomsnittet var 23%, sämst var 134%
Gigabyte Aero 15X v8 ljudanalys
(±) | högtalarljudstyrkan är genomsnittlig men bra (78 dB)
Bas 100 - 315 Hz
(-) | nästan ingen bas - i genomsnitt 16.8% lägre än medianen
(±) | linjäriteten för basen är genomsnittlig (11.6% delta till föregående frekvens)
Mellan 400 - 2000 Hz
(+) | balanserad mellan - endast 4.3% från medianen
(+) | mids är linjära (5% delta till föregående frekvens)
Högsta 2 - 16 kHz
(+) | balanserade toppar - endast 3.6% från medianen
(±) | linjäriteten för toppar är genomsnittlig (9.1% delta till föregående frekvens)
Totalt 100 - 16 000 Hz
(±) | linjäriteten för det totala ljudet är genomsnittlig (18.4% skillnad mot median)
Jämfört med samma klass
» 59% av alla testade enheter i den här klassen var bättre, 9% liknande, 32% sämre
» Den bästa hade ett delta på 6%, genomsnittet var 18%, sämst var 132%
Jämfört med alla testade enheter
» 41% av alla testade enheter var bättre, 8% liknande, 51% sämre
» Den bästa hade ett delta på 4%, genomsnittet var 23%, sämst var 134%
| Av/Standby | |
| Låg belastning | |
| Hög belastning |
|
Förklaring:
min: | |
| MSI GS65 8RF-019DE Stealth Thin GeForce GTX 1070 Max-Q, i7-8750H | MSI GS63VR 7RG-005 GeForce GTX 1070 Max-Q, i7-7700HQ | Gigabyte Aero 15X v8 GeForce GTX 1070 Max-Q, i7-8750H | Asus Zephyrus M GM501 GeForce GTX 1070 Mobile, i7-8750H | Acer Predator Triton 700 GeForce GTX 1080 Max-Q, i7-7700HQ | Genomsnitt av klass Gaming | |
|---|---|---|---|---|---|---|
| Power Consumption | -16% | -28% | -47% | -107% | -47% | |
| Idle Minimum * (Watt) | 7 | 12 -71% | 14 -100% | 16 -129% | 28 -300% | 13 ? -86% |
| Idle Average * (Watt) | 11 | 16 -45% | 18 -64% | 19 -73% | 33 -200% | 19 ? -73% |
| Idle Maximum * (Watt) | 20 | 21 -5% | 22 -10% | 26 -30% | 41 -105% | 24.6 ? -23% |
| Load Average * (Watt) | 98 | 85 13% | 91 7% | 103 -5% | 94 4% | 110.7 ? -13% |
| Witcher 3 ultra * (Watt) | 132 | 128 3% | 142 -8% | 164 -24% | 160 -21% | |
| Load Maximum * (Watt) | 182 | 162 11% | 173 5% | 223 -23% | 222 -22% | 259 ? -42% |
* ... mindre är bättre
| MSI GS65 8RF-019DE Stealth Thin GeForce GTX 1070 Max-Q, i7-8750H, 82 Wh | MSI GS63VR 7RG-005 GeForce GTX 1070 Max-Q, i7-7700HQ, 52.4 Wh | Gigabyte Aero 15X v8 GeForce GTX 1070 Max-Q, i7-8750H, 94.24 Wh | Asus Zephyrus M GM501 GeForce GTX 1070 Mobile, i7-8750H, 55 Wh | Acer Predator Triton 700 GeForce GTX 1080 Max-Q, i7-7700HQ, 54 Wh | Genomsnitt av klass Gaming | |
|---|---|---|---|---|---|---|
| Batteridrifttid | -33% | 55% | -44% | -54% | 16% | |
| Reader / Idle (h) | 8.5 | 5.7 -33% | 12.7 49% | 4 -53% | 2.5 -71% | 8.27 ? -3% |
| H.264 (h) | 5.9 | 3.8 -36% | 8.4 42% | 2.7 -54% | 1.8 -69% | 8.32 ? 41% |
| WiFi v1.3 (h) | 6 | 3.9 -35% | 8.6 43% | 2.7 -55% | 2.4 -60% | 7.11 ? 19% |
| Load (h) | 1.4 | 1 -29% | 2.6 86% | 1.2 -14% | 1.2 -14% | 1.502 ? 7% |
För
Emot
Läs den fullständiga versionen av den här recensionen på engelska här.
GS65 kan inte riktigt matcha helheten som Gigabyte Aero 15X erbjuder, trots att MSI gör sitt bästa.
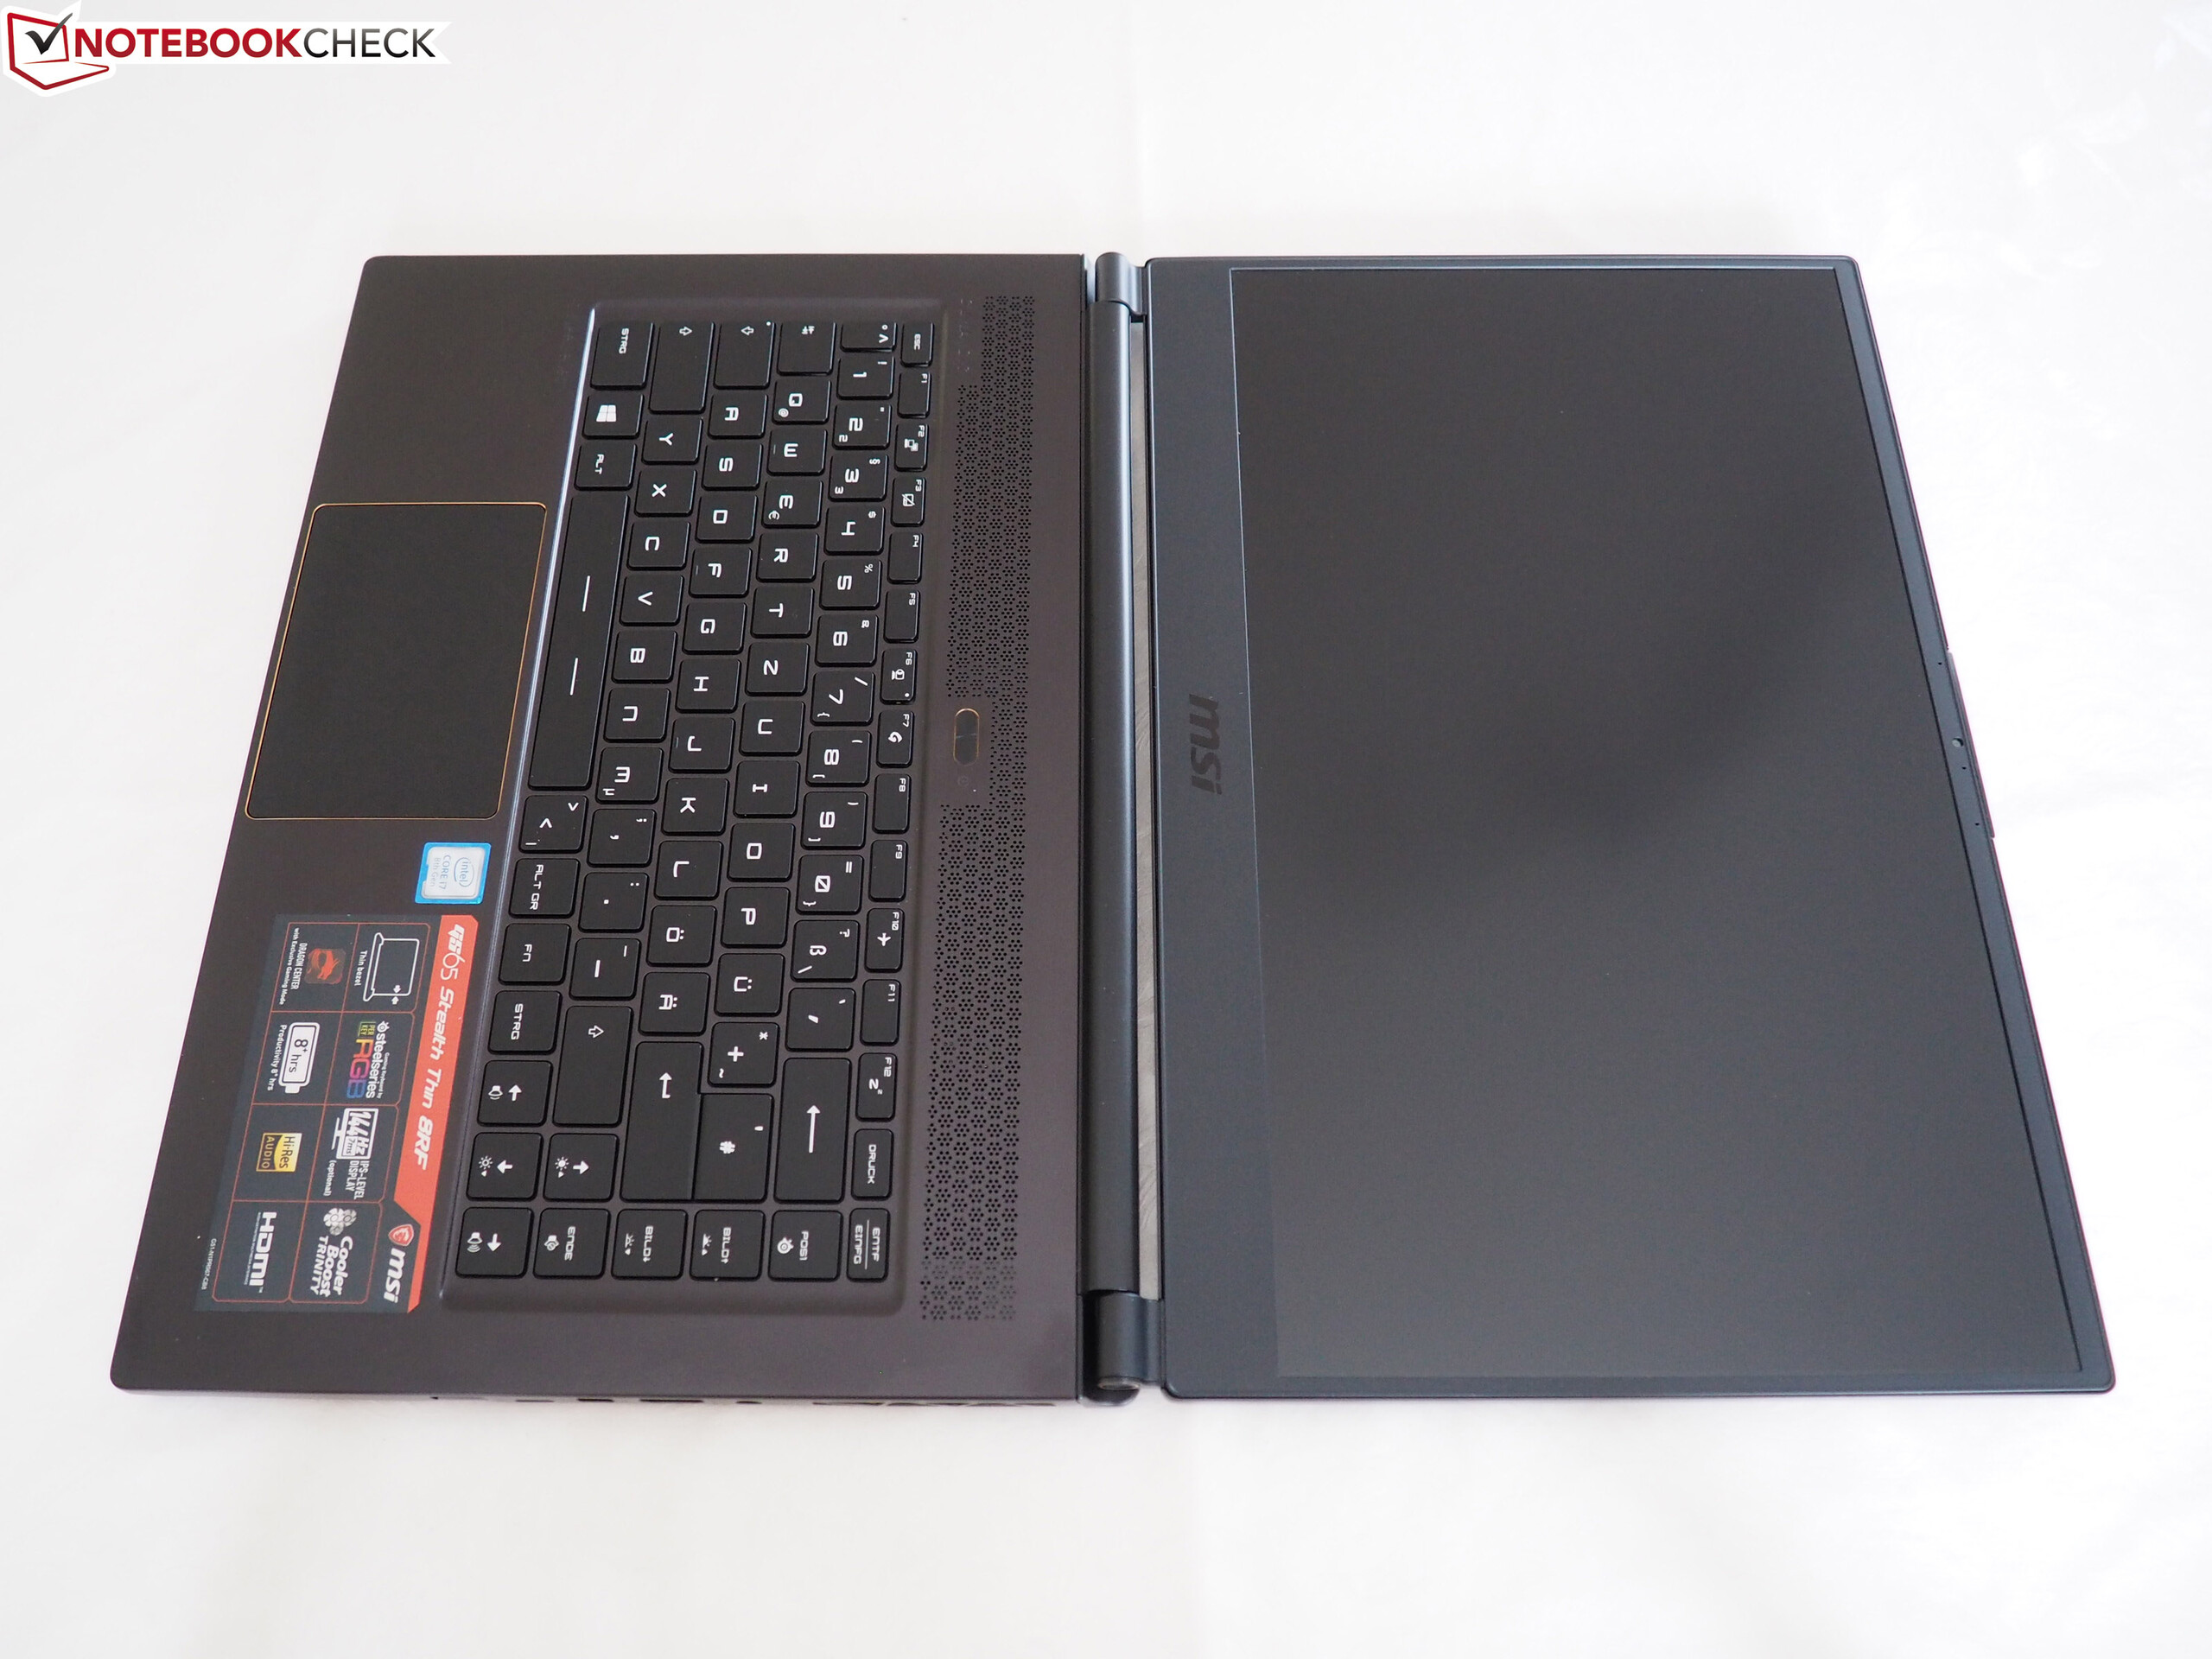
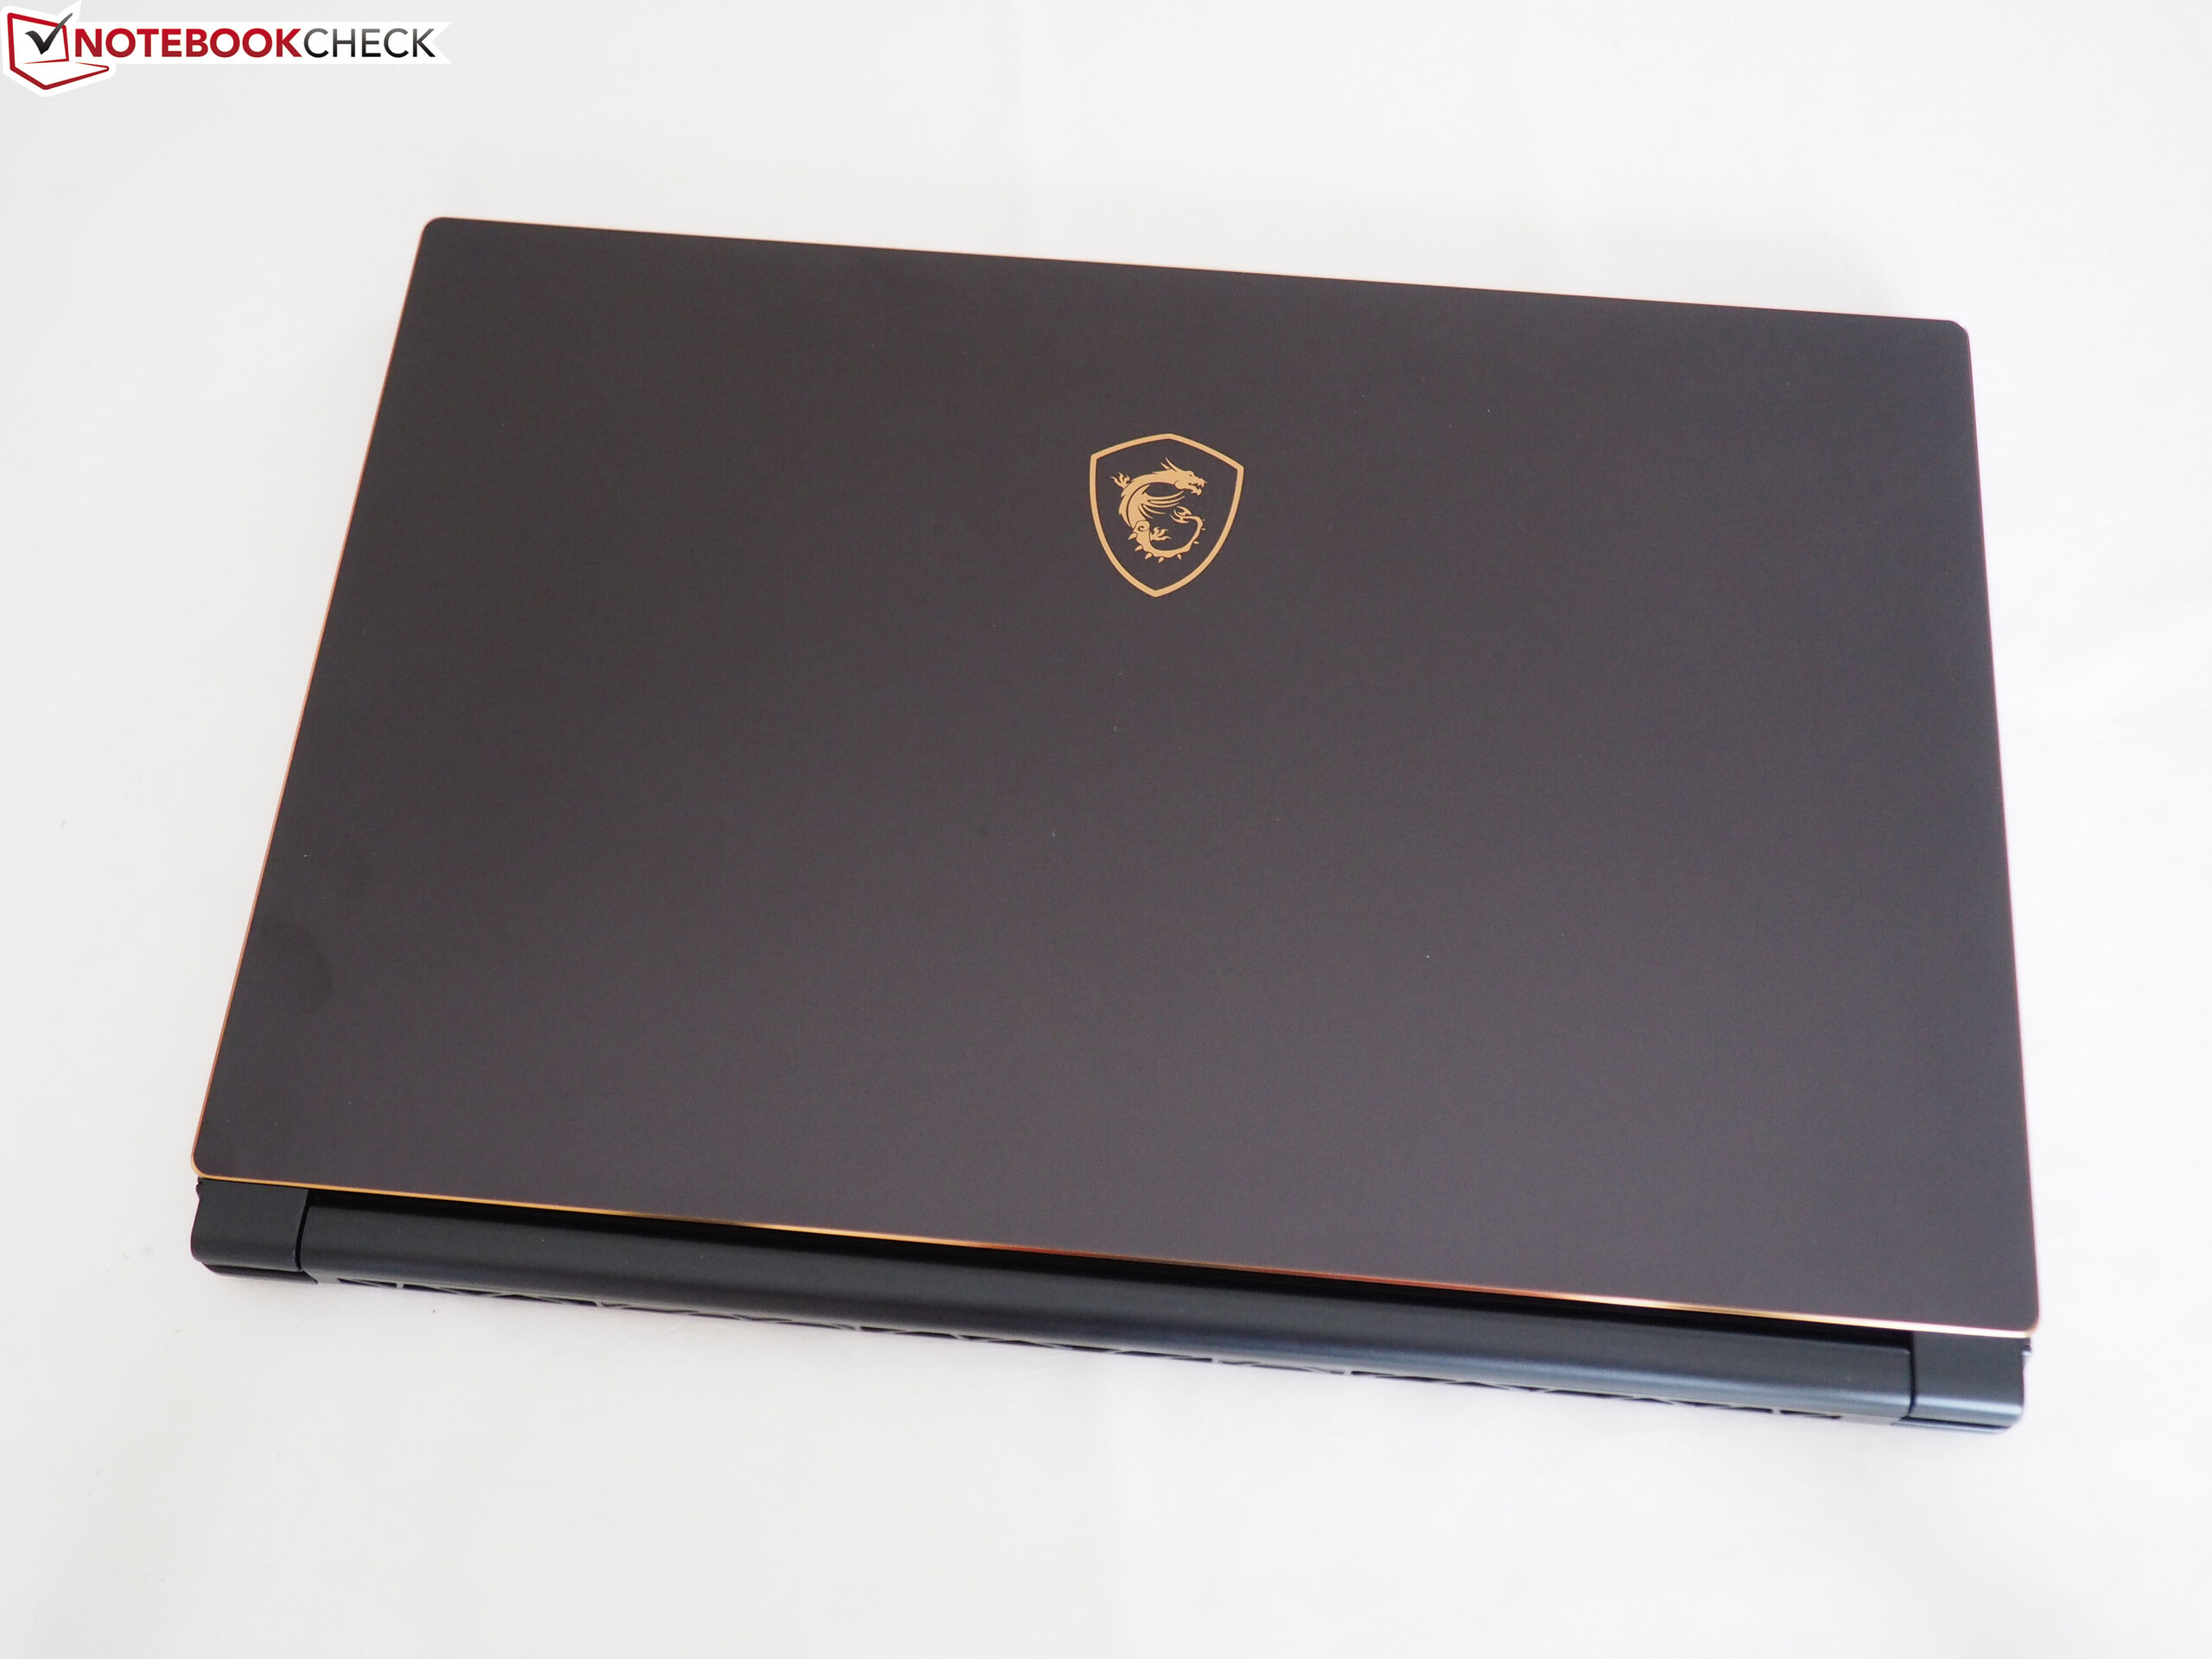
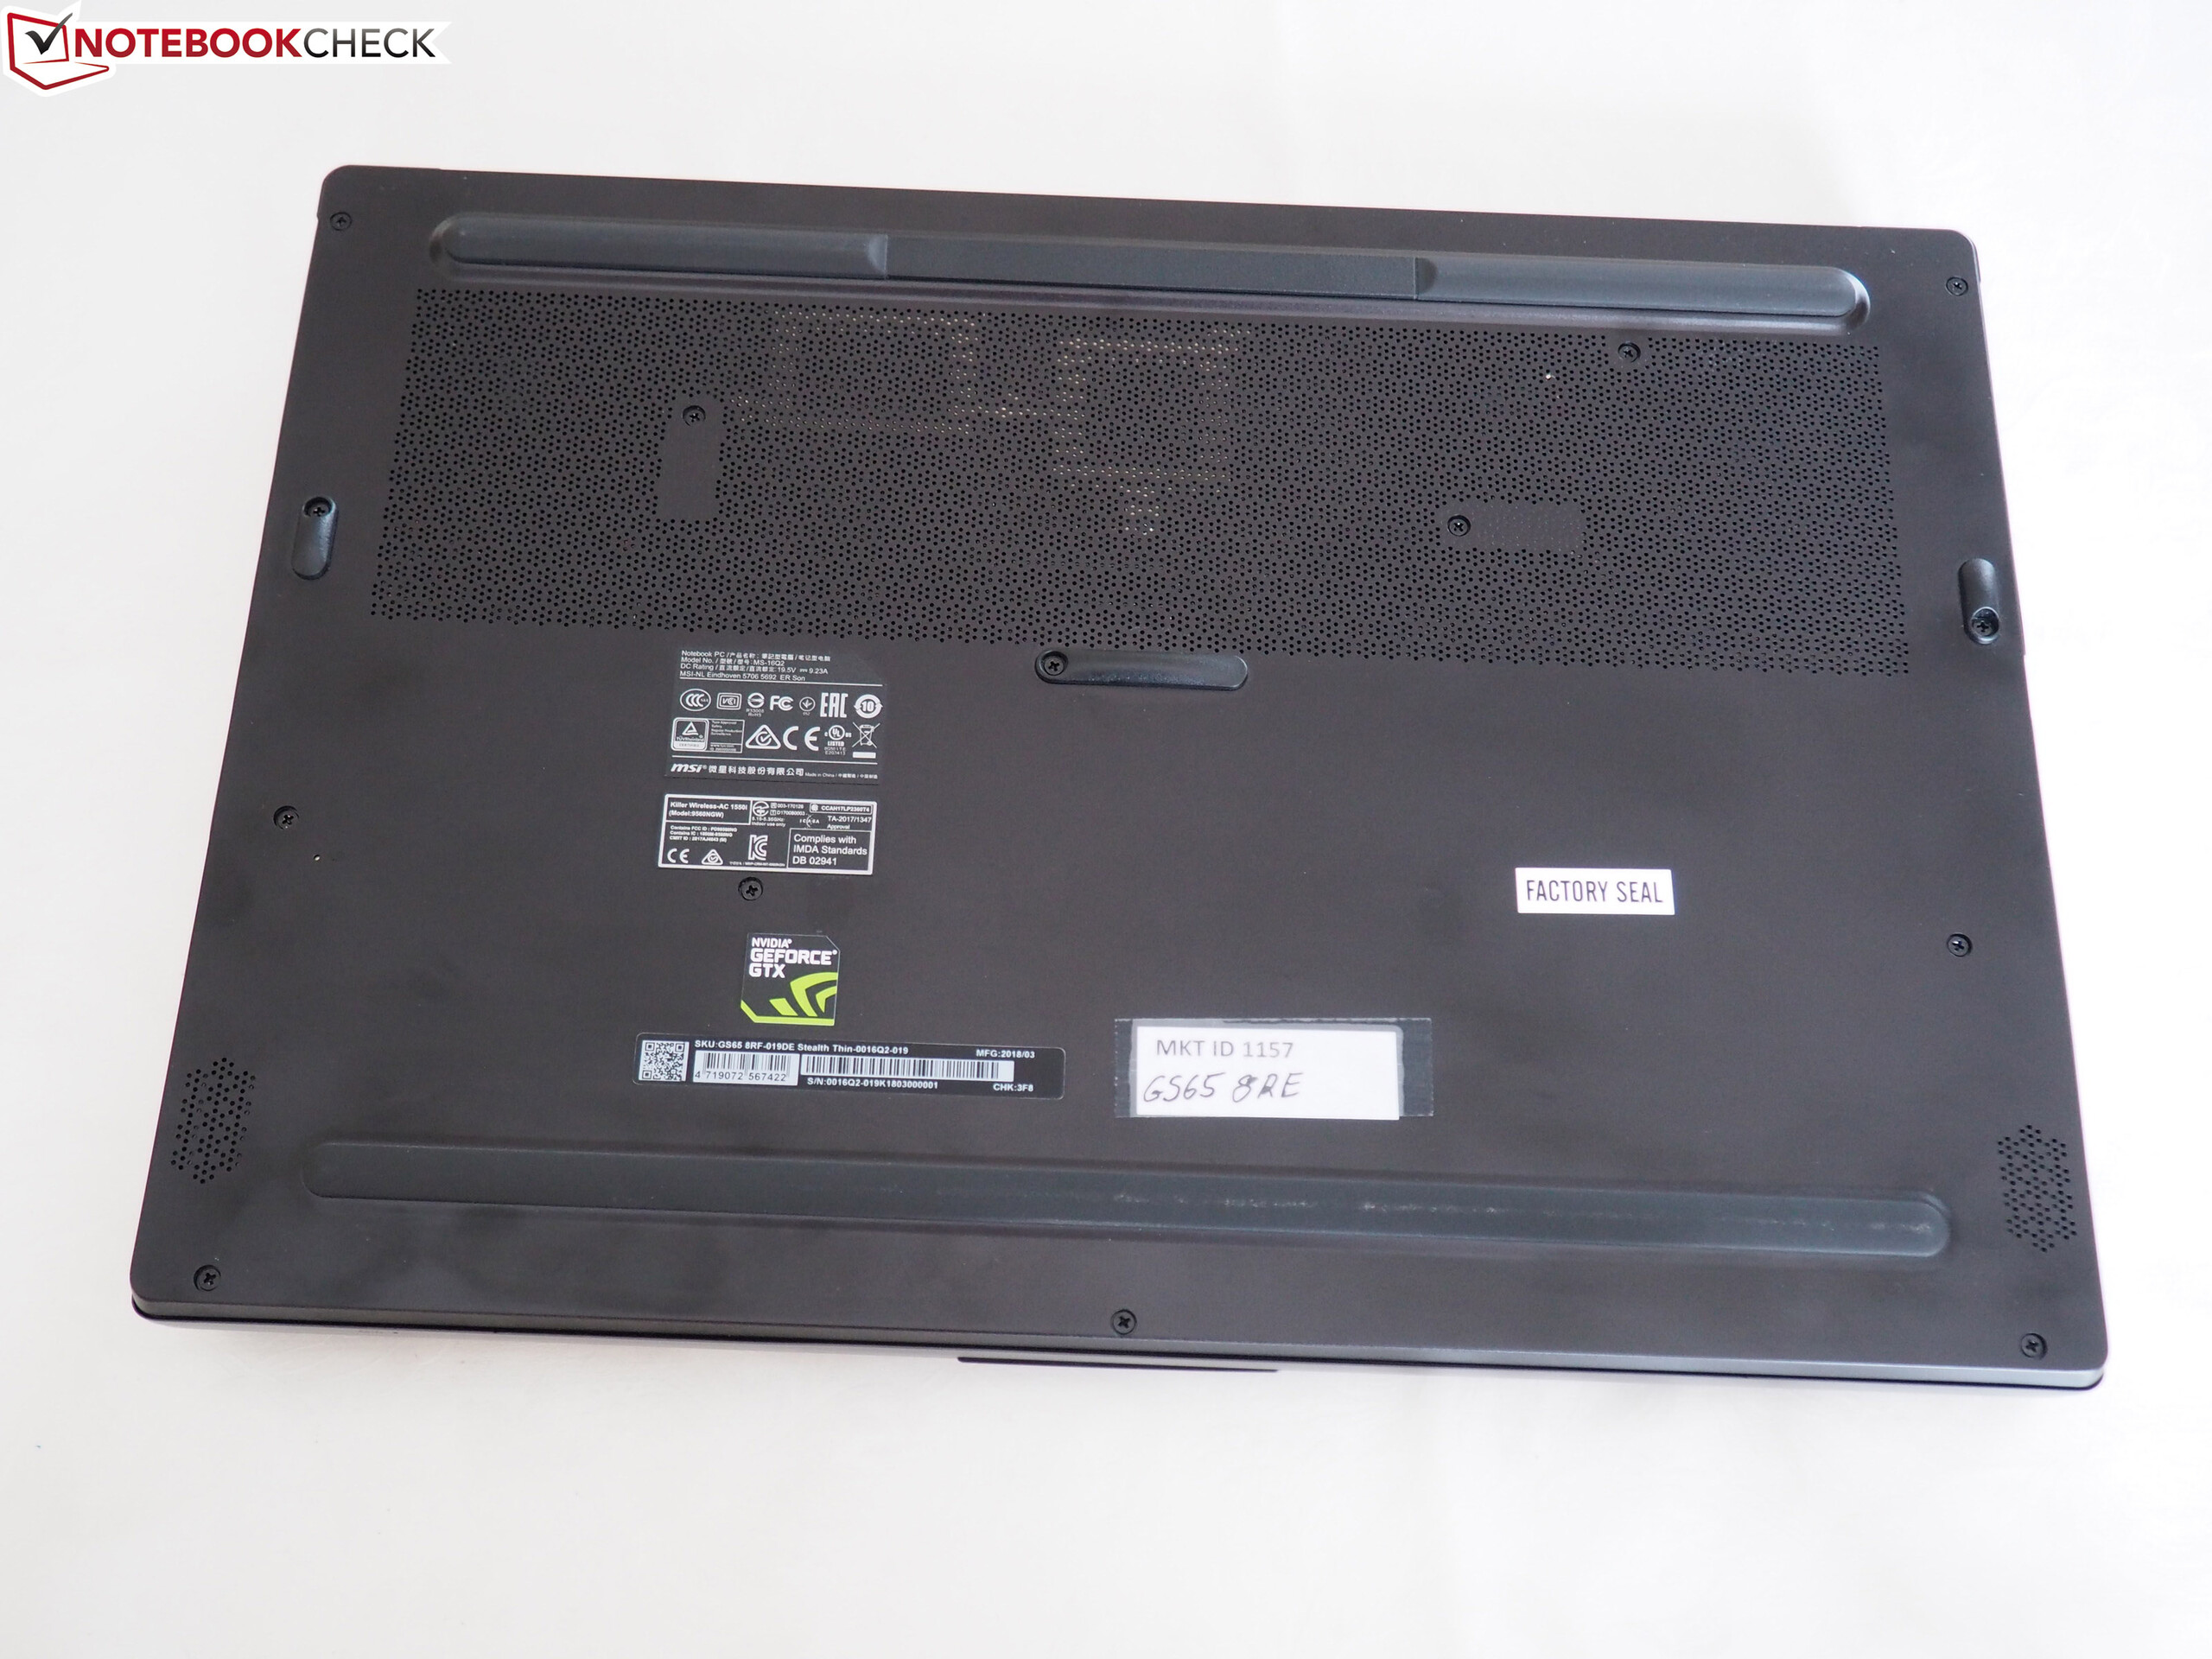
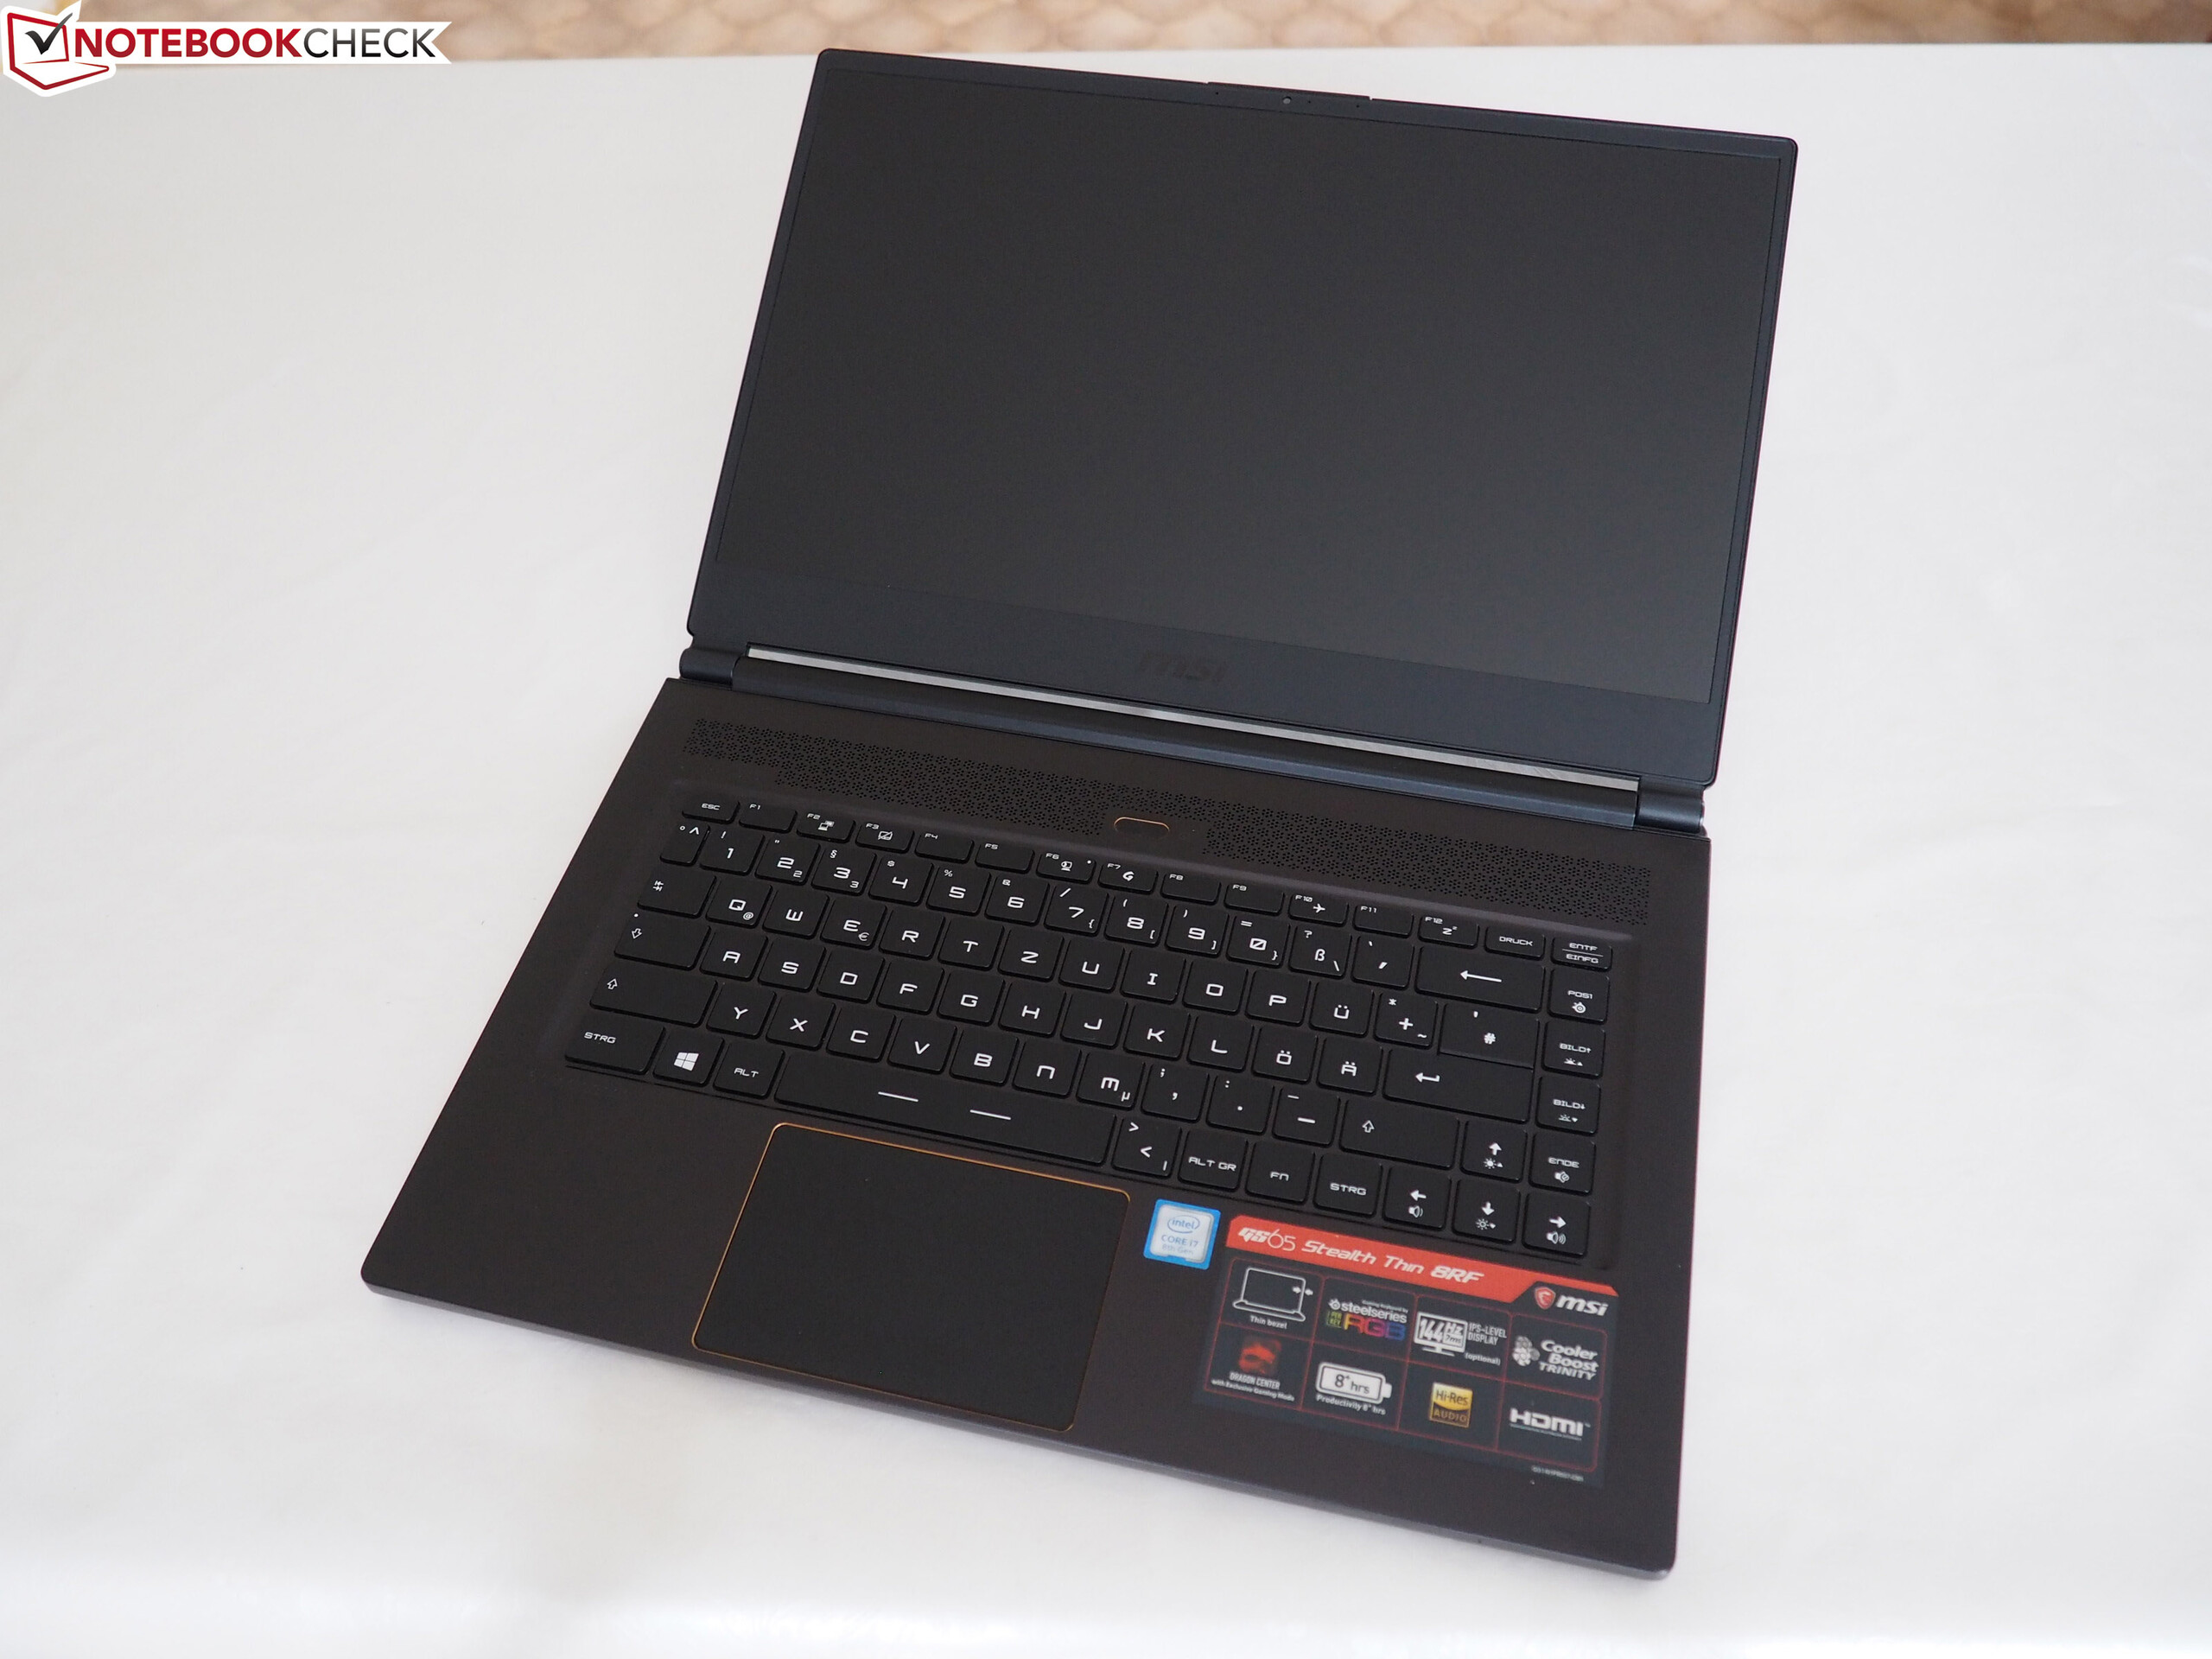
Även om GS65 ser tjusig ut med sitt aluminiumchassi så är Aero 15X mer robust och bättre byggd. I synnerhet så uppstår hörbara knarrande och knakande ljud när GS65 utsätts för större fysisk påfrestning. Dessutom är ett större batteri, bättre servicemöjligheter, en inbyggd kortläsare och en bättre skrivupplevelse saker som talar till fördel för Aero 15X.
Men om du vill ha det så tyst som möjligt när du spelar så borde du skaffa GS65 då fläktarna på den är mycket tystare. Båda enheterna har manuella fläktkontroller som du kan experimentera med.
Trots en del svagheter så är denna kompakta 15 tums-enhet en av dom bästa laptop-modellerna för spel som finns på under 2.5 kg, vilket placerar MSI GS65 på vår Topp 10: Tunna och Lätta Spellaptops-ranking.
MSI har gjort stora framsteg med GS65 jämfört med GS63.
MSI GS65 8RF-019DE Stealth Thin
- 05/08/2018 v6 (old)
Florian Glaser
Price comparison