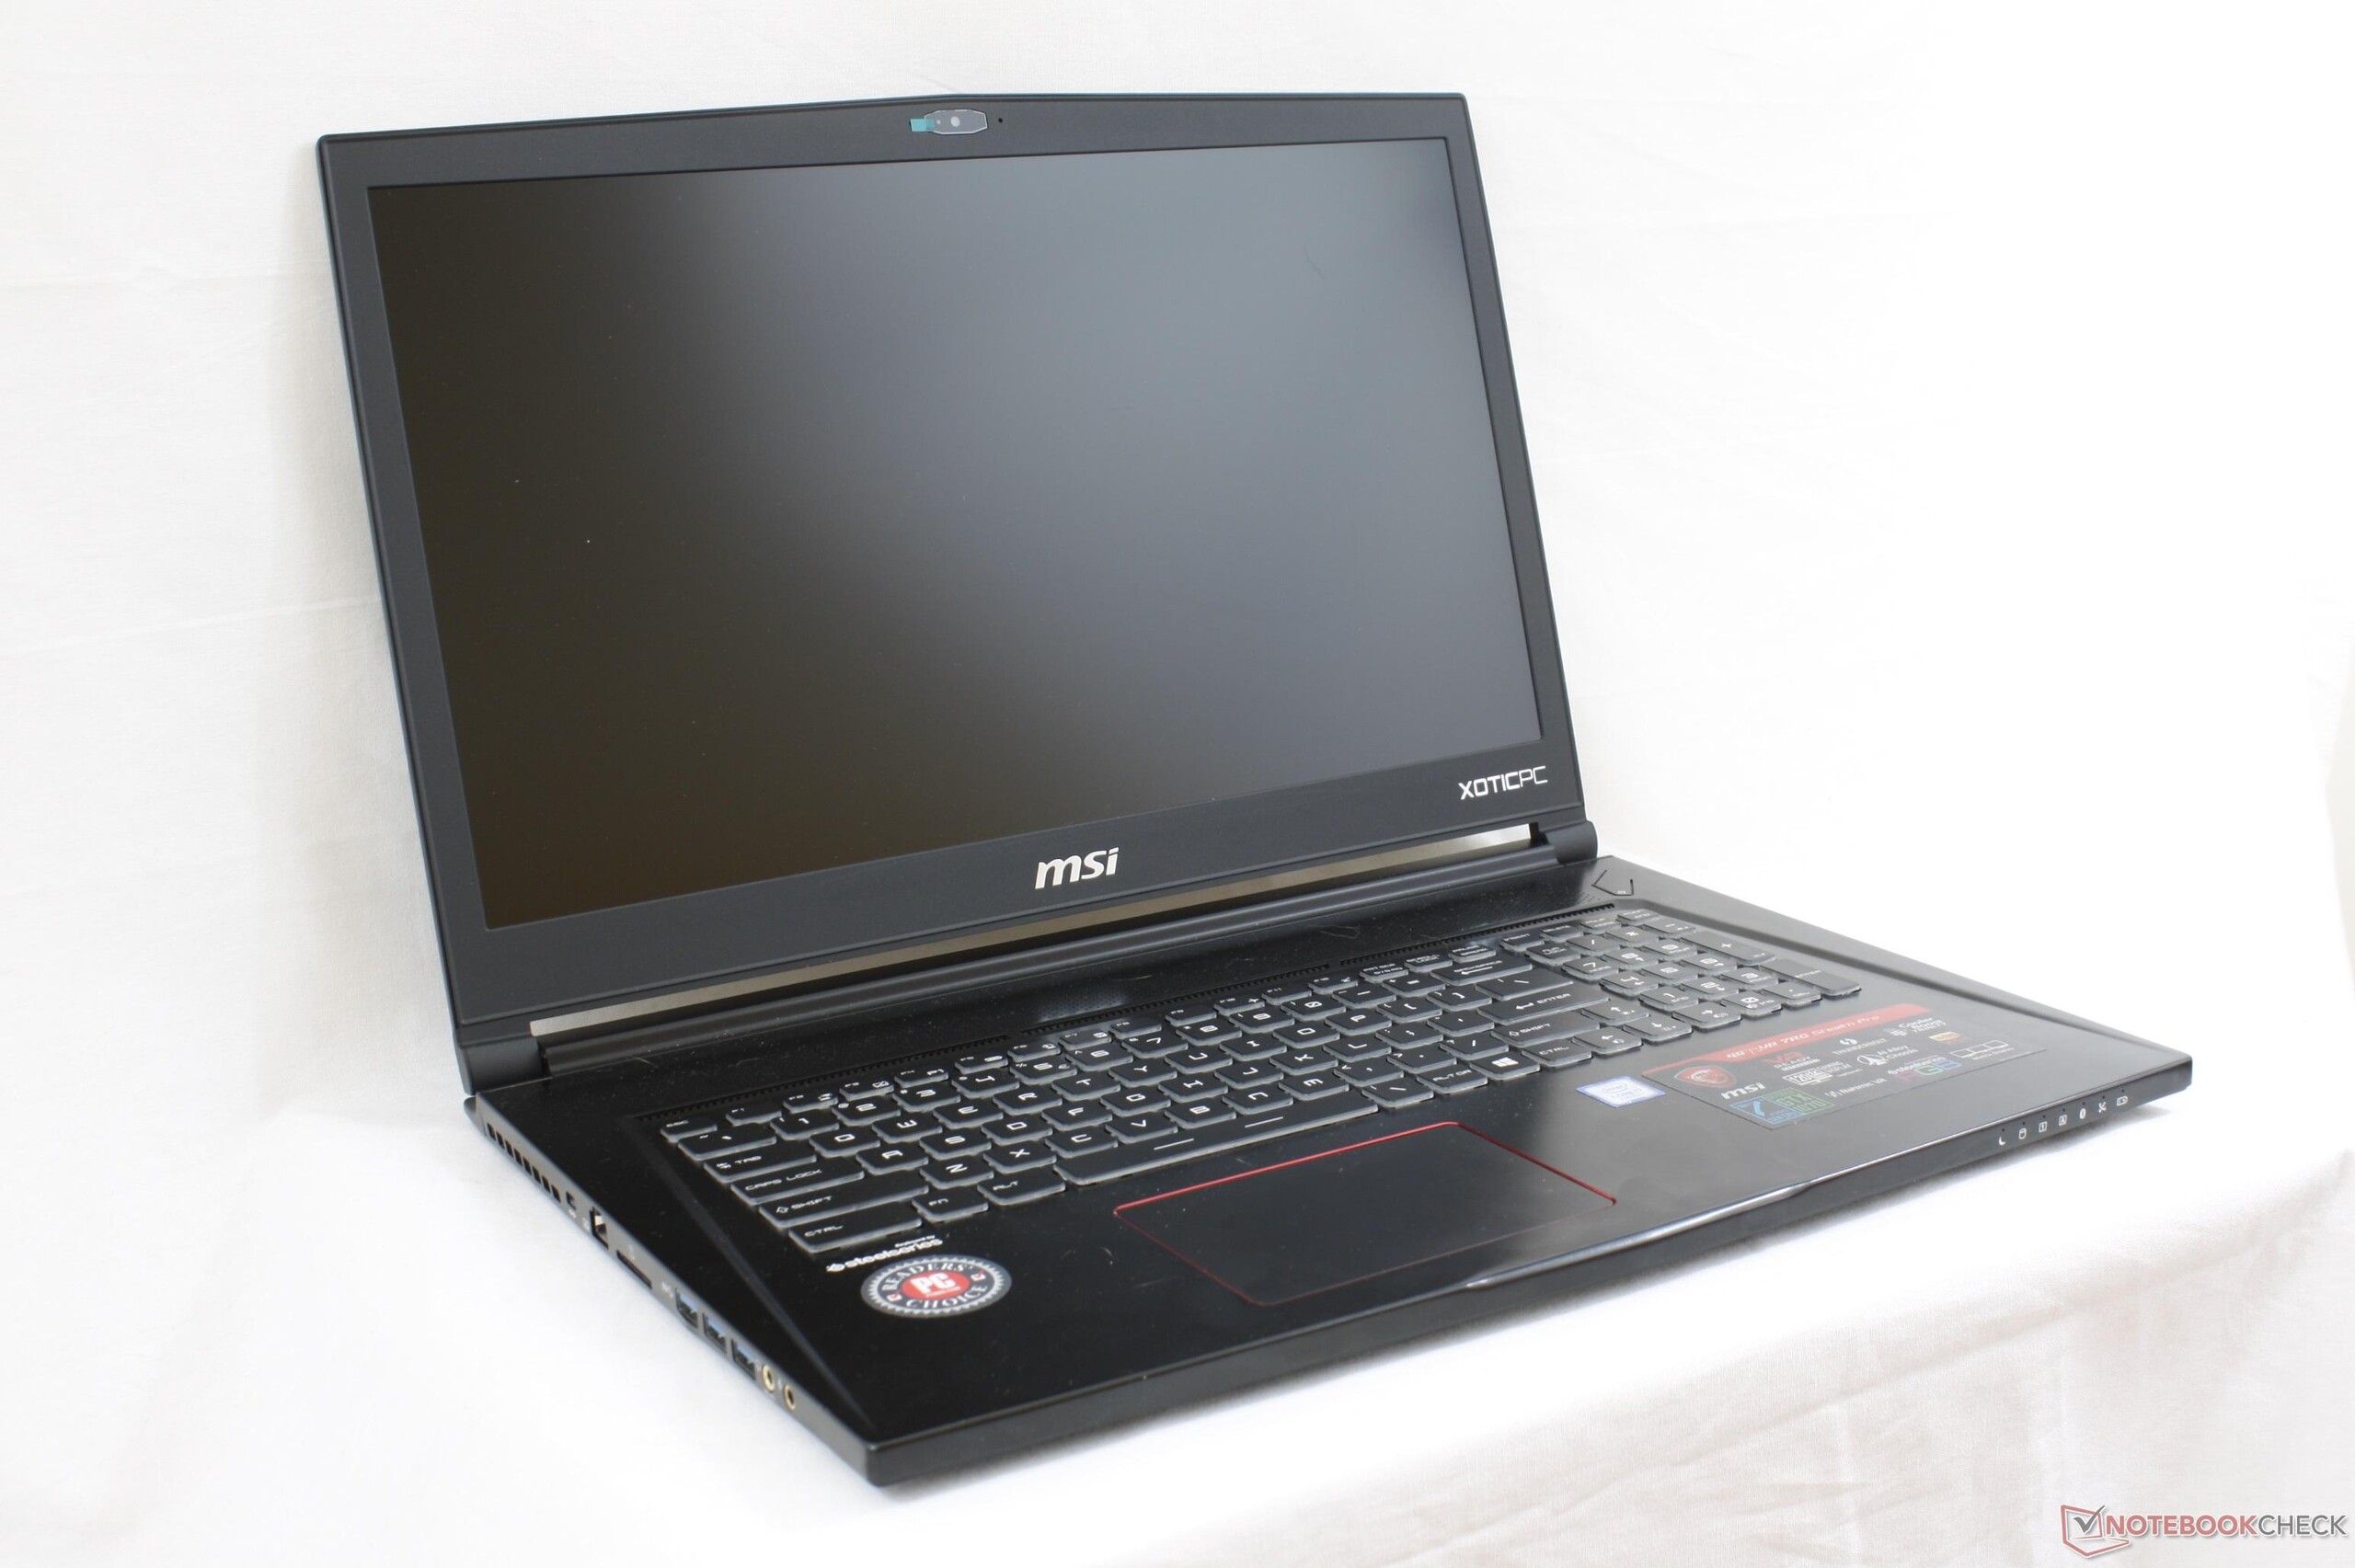
Test: MSI GS73VR 7RG (i7-7700HQ, GTX 1070 Max-Q, FHD) Laptop (Sammanfattning)


| SD Card Reader | |
| average JPG Copy Test (av. of 3 runs) | |
| MSI GS73VR 7RG | |
| Eurocom Sky X7E2 | |
| MSI GS73VR 7RF | |
| maximum AS SSD Seq Read Test (1GB) | |
| Eurocom Sky X7E2 | |
| MSI GS73VR 7RG | |
| MSI GS73VR 7RF | |
| Networking | |
| iperf3 transmit AX12 | |
| MSI GT73VR 7RF-296 | |
| Aorus X7 v7 | |
| MSI GS73VR 7RG | |
| iperf3 receive AX12 | |
| MSI GT73VR 7RF-296 | |
| MSI GS73VR 7RG | |
| Aorus X7 v7 | |
| |||||||||||||||||||||||||
Distribution av ljusstyrkan: 79 %
Mitt på batteriet: 350.9 cd/m²
Kontrast: 1063:1 (Svärta: 0.33 cd/m²)
ΔE ColorChecker Calman: 7.7 | ∀{0.5-29.43 Ø4.71}
ΔE Greyscale Calman: 11.1 | ∀{0.09-98 Ø4.96}
100% sRGB (Argyll 1.6.3 3D)
77.74% AdobeRGB 1998 (Argyll 1.6.3 3D)
86.9% AdobeRGB 1998 (Argyll 3D)
100% sRGB (Argyll 3D)
89.6% Display P3 (Argyll 3D)
Gamma: 2.11
CCT: 11813 K
| MSI GS73VR 7RG ID: CMN1747, Name: Chi Mei N173HHE-G32, TN LED, 17.3", 1920x1080 | Lenovo Legion Y920-17IKB LP173WF4-SPF5, IPS, 17.3", 1920x1080 | Aorus X7 v7 AU Optronics B173QTN01.4 (AUO1496), TN LED, 17.3", 2560x1440 | Gigabyte P57X v7 SHP145E, IPS, 17.3", 3840x2160 | EVGA SC17 GTX 1070 Sharp LQ173D1JW31, IPS, 17.3", 3840x2160 | |
|---|---|---|---|---|---|
| Display | -24% | -23% | 4% | 4% | |
| Display P3 Coverage (%) | 89.6 | 66.4 -26% | 63 -30% | 87.8 -2% | 87.3 -3% |
| sRGB Coverage (%) | 100 | 84 -16% | 87.1 -13% | 100 0% | 100 0% |
| AdobeRGB 1998 Coverage (%) | 86.9 | 61.4 -29% | 63.7 -27% | 98.9 14% | 98.8 14% |
| Response Times | -99% | 14% | -297% | -206% | |
| Response Time Grey 50% / Grey 80% * (ms) | 23.6 ? | 28.8 ? -22% | 24 ? -2% | 55.6 ? -136% | 45.6 ? -93% |
| Response Time Black / White * (ms) | 8.4 ? | 23.2 ? -176% | 6 ? 29% | 46.8 ? -457% | 35.2 ? -319% |
| PWM Frequency (Hz) | 26040 ? | 20000 | 1000 ? | 1042 ? | |
| Screen | 9% | -3% | 17% | 17% | |
| Brightness middle (cd/m²) | 350.9 | 422.3 20% | 375 7% | 441.3 26% | 399.1 14% |
| Brightness (cd/m²) | 311 | 378 22% | 353 14% | 408 31% | 360 16% |
| Brightness Distribution (%) | 79 | 81 3% | 85 8% | 86 9% | 81 3% |
| Black Level * (cd/m²) | 0.33 | 0.48 -45% | 0.58 -76% | 0.44 -33% | 0.4 -21% |
| Contrast (:1) | 1063 | 880 -17% | 647 -39% | 1003 -6% | 998 -6% |
| Colorchecker dE 2000 * | 7.7 | 4.4 43% | 6.06 21% | 5.1 34% | 4.78 38% |
| Colorchecker dE 2000 max. * | 14.4 | 9.2 36% | 10.54 27% | 9.8 32% | 7.65 47% |
| Greyscale dE 2000 * | 11.1 | 2.8 75% | 5.68 49% | 4.3 61% | 3.8 66% |
| Gamma | 2.11 104% | 2.22 99% | 2.3 96% | 2.08 106% | 2.03 108% |
| CCT | 11813 55% | 6403 102% | 7998 81% | 7345 88% | 7288 89% |
| Color Space (Percent of AdobeRGB 1998) (%) | 77.74 | 55 -29% | 57 -27% | 87 12% | 86.9 12% |
| Color Space (Percent of sRGB) (%) | 100 | 84 -16% | 87 -13% | 100 0% | 100 0% |
| Totalt genomsnitt (program/inställningar) | -38% /
-12% | -4% /
-5% | -92% /
-28% | -62% /
-15% |
* ... mindre är bättre
Visa svarstider
| ↔ Svarstid svart till vitt | ||
|---|---|---|
| 8.4 ms ... stiga ↗ och falla ↘ kombinerat | ↗ 6 ms stiga | 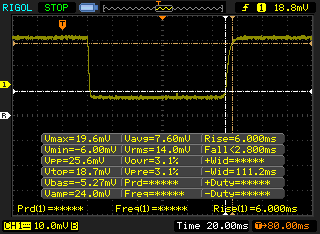 |
| ↘ 2.4 ms hösten | ||
| Skärmen visar snabba svarsfrekvenser i våra tester och bör passa för spel. I jämförelse sträcker sig alla testade enheter från 0.1 (minst) till 240 (maximalt) ms. » 24 % av alla enheter är bättre. Det betyder att den uppmätta svarstiden är bättre än genomsnittet av alla testade enheter (19.8 ms). | ||
| ↔ Svarstid 50 % grått till 80 % grått | ||
| 23.6 ms ... stiga ↗ och falla ↘ kombinerat | ↗ 13.6 ms stiga | 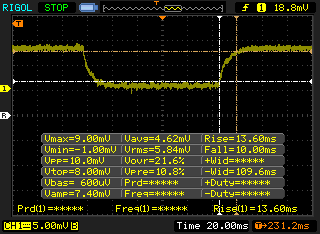 |
| ↘ 10 ms hösten | ||
| Skärmen visar bra svarsfrekvens i våra tester, men kan vara för långsam för konkurrenskraftiga spelare. I jämförelse sträcker sig alla testade enheter från 0.165 (minst) till 636 (maximalt) ms. » 34 % av alla enheter är bättre. Det betyder att den uppmätta svarstiden är bättre än genomsnittet av alla testade enheter (31 ms). | ||
Skärmflimmer / PWM (Puls-Width Modulation)
| Skärmflimmer / PWM upptäckt | 26040 Hz | ≤ 10 % ljusstyrka inställning | 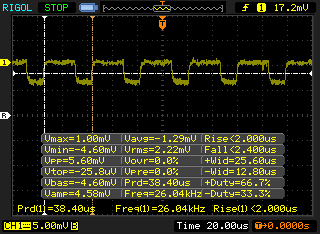 |
Displayens bakgrundsbelysning flimrar vid 26040 Hz (i värsta fall, t.ex. med PWM) Flimrande upptäckt vid en ljusstyrkeinställning på 10 % och lägre. Det ska inte finnas något flimmer eller PWM över denna ljusstyrkeinställning. Frekvensen för 26040 Hz är ganska hög, så de flesta användare som är känsliga för PWM bör inte märka något flimmer. Som jämförelse: 52 % av alla testade enheter använder inte PWM för att dämpa skärmen. Om PWM upptäcktes mättes ett medelvärde av 7757 (minst: 5 - maximum: 343500) Hz. | |||
| Cinebench R15 | |
| CPU Single 64Bit | |
| no name | |
| Eurocom Tornado F5 | |
| Test: Coffee Lake: i7-8700K and i5-8400 (Sammanfattning) | |
| MSI GT75VR 7RF-012 Titan Pro | |
| MSI GS73VR 7RG | |
| Asus Zephyrus GX501VS | |
| Razer Blade (2016) FHD | |
| MSI GT80 Titan SLI | |
| Asus GL552JX-CN154H | |
| Toshiba Satellite S70-B-106 | |
| CPU Multi 64Bit | |
| no name | |
| Test: Coffee Lake: i7-8700K and i5-8400 (Sammanfattning) | |
| Eurocom Tornado F5 | |
| MSI GT75VR 7RF-012 Titan Pro | |
| MSI GS73VR 7RG | |
| Asus Zephyrus GX501VS | |
| MSI GT80 Titan SLI | |
| Razer Blade (2016) FHD | |
| Asus GL552JX-CN154H | |
| Toshiba Satellite S70-B-106 | |
| Cinebench R11.5 | |
| CPU Single 64Bit | |
| no name | |
| Eurocom Tornado F5 | |
| Test: Coffee Lake: i7-8700K and i5-8400 (Sammanfattning) | |
| MSI GS73VR 7RG | |
| MSI GT75VR 7RF-012 Titan Pro | |
| Asus Zephyrus GX501VS | |
| Razer Blade (2016) FHD | |
| MSI GT80 Titan SLI | |
| Asus GL552JX-CN154H | |
| Toshiba Satellite S70-B-106 | |
| CPU Multi 64Bit | |
| no name | |
| Test: Coffee Lake: i7-8700K and i5-8400 (Sammanfattning) | |
| Eurocom Tornado F5 | |
| MSI GT75VR 7RF-012 Titan Pro | |
| MSI GS73VR 7RG | |
| Asus Zephyrus GX501VS | |
| MSI GT80 Titan SLI | |
| Razer Blade (2016) FHD | |
| Asus GL552JX-CN154H | |
| Toshiba Satellite S70-B-106 | |
| Cinebench R10 | |
| Rendering Multiple CPUs 32Bit | |
| no name | |
| Test: Coffee Lake: i7-8700K and i5-8400 (Sammanfattning) | |
| Eurocom Tornado F5 | |
| MSI GS73VR 7RG | |
| Asus Zephyrus GX501VS | |
| MSI GT80 Titan SLI | |
| Razer Blade (2016) FHD | |
| Asus GL552JX-CN154H | |
| Rendering Single 32Bit | |
| no name | |
| Eurocom Tornado F5 | |
| Test: Coffee Lake: i7-8700K and i5-8400 (Sammanfattning) | |
| MSI GS73VR 7RG | |
| Asus Zephyrus GX501VS | |
| MSI GT80 Titan SLI | |
| Razer Blade (2016) FHD | |
| Asus GL552JX-CN154H | |
| wPrime 2.10 - 1024m | |
| Asus Zephyrus GX501VS | |
| MSI GS73VR 7RG | |
| Test: Coffee Lake: i7-8700K and i5-8400 (Sammanfattning) | |
| Eurocom Tornado F5 | |
| no name | |
* ... mindre är bättre
| PCMark 8 | |
| Home Score Accelerated v2 | |
| Lenovo Legion Y920-17IKB | |
| EVGA SC17 GTX 1070 | |
| MSI GS73VR 7RG | |
| MSI GF72VR 7RF | |
| Work Score Accelerated v2 | |
| Lenovo Legion Y920-17IKB | |
| MSI GS73VR 7RG | |
| MSI GF72VR 7RF | |
| EVGA SC17 GTX 1070 | |
| Creative Score Accelerated v2 | |
| Lenovo Legion Y920-17IKB | |
| EVGA SC17 GTX 1070 | |
| MSI GS73VR 7RG | |
| MSI GF72VR 7RF | |
| PCMark 10 | |
| Digital Content Creation | |
| Lenovo Legion Y920-17IKB | |
| MSI GS73VR 7RG | |
| MSI GF72VR 7RF | |
| Productivity | |
| Lenovo Legion Y920-17IKB | |
| MSI GF72VR 7RF | |
| MSI GS73VR 7RG | |
| Essentials | |
| Lenovo Legion Y920-17IKB | |
| MSI GS73VR 7RG | |
| MSI GF72VR 7RF | |
| Score | |
| Lenovo Legion Y920-17IKB | |
| MSI GS73VR 7RG | |
| MSI GF72VR 7RF | |
| PCMark 8 Home Score Accelerated v2 | 4394 poäng | |
| PCMark 8 Creative Score Accelerated v2 | 5491 poäng | |
| PCMark 8 Work Score Accelerated v2 | 5215 poäng | |
| PCMark 10 Score | 4891 poäng | |
Hjälp | ||
| MSI GS73VR 7RG Samsung SSD PM871 MZNLN512HMJP | Lenovo Legion Y920-17IKB Samsung SM961 MZVKW512HMJP m.2 PCI-e | Gigabyte P57X v7 Transcend MTS800 256GB M.2 (TS256GMTS800) | EVGA SC17 GTX 1070 Samsung SM951 MZVPV256 m.2 | MSI GT73VR 7RF-296 2x Samsung SM951 MZVPV256HDGL (RAID 0) | |
|---|---|---|---|---|---|
| AS SSD | 179% | -34% | 107% | 184% | |
| Copy Game MB/s (MB/s) | 381.5 | 1117 193% | 389.8 2% | 1034 171% | |
| Copy Program MB/s (MB/s) | 229.8 | 407.8 77% | 206.1 -10% | 470 105% | |
| Copy ISO MB/s (MB/s) | 423.5 | 1975 366% | 392.2 -7% | 1337 216% | |
| Score Total (Points) | 1064 | 3080 189% | 721 -32% | 2328 119% | 3310 211% |
| Score Write (Points) | 417 | 1506 261% | 249 -40% | 487 17% | 1054 153% |
| Score Read (Points) | 421 | 1072 155% | 314 -25% | 1238 194% | 1511 259% |
| Access Time Write * (ms) | 0.032 | 0.029 9% | 0.055 -72% | 0.033 -3% | 0.03 6% |
| Access Time Read * (ms) | 0.051 | 0.044 14% | 0.11 -116% | 0.049 4% | 0.035 31% |
| 4K-64 Write (MB/s) | 273.6 | 1220 346% | 151.4 -45% | 260.9 -5% | 697 155% |
| 4K-64 Read (MB/s) | 337.7 | 747 121% | 241.4 -29% | 999 196% | 1165 245% |
| 4K Write (MB/s) | 96.8 | 127.1 31% | 72 -26% | 112.1 16% | 123.8 28% |
| 4K Read (MB/s) | 33.69 | 48.23 43% | 23.65 -30% | 45.64 35% | 46.75 39% |
| Seq Write (MB/s) | 465.1 | 1589 242% | 260.9 -44% | 1144 146% | 2332 401% |
| Seq Read (MB/s) | 497.9 | 2768 456% | 491.9 -1% | 1934 288% | 2988 500% |
* ... mindre är bättre

| 3DMark | |
| 1920x1080 Fire Strike Graphics | |
| Alienware 17 R4 | |
| Asus Zephyrus GX501 | |
| EVGA SC17 GTX 1070 | |
| MSI GS63VR 7RG | |
| MSI GS73VR 7RG | |
| Asus G701VO-CS74K | |
| MSI GS43VR 7RE-069US | |
| HP Omen 15-ce002ng | |
| Asus Strix GL502VY-DS71 | |
| Asus Strix GL502VT-DS74 | |
| 3840x2160 Fire Strike Ultra Graphics | |
| Alienware 17 R4 | |
| Asus Zephyrus GX501 | |
| EVGA SC17 GTX 1070 | |
| MSI GS73VR 7RG | |
| Asus G701VO-CS74K | |
| MSI GS43VR 7RE-069US | |
| Asus Strix GL502VY-DS71 | |
| Fire Strike Extreme Graphics | |
| Alienware 17 R4 | |
| EVGA SC17 GTX 1070 | |
| MSI GS73VR 7RG | |
| Asus G701VO-CS74K | |
| MSI GS43VR 7RE-069US | |
| Asus Strix GL502VY-DS71 | |
| Asus Strix GL502VT-DS74 | |
| 3DMark 11 | |
| 1280x720 Performance GPU | |
| Alienware 17 R4 | |
| Asus Zephyrus GX501 | |
| EVGA SC17 GTX 1070 | |
| MSI GS63VR 7RG | |
| MSI GS73VR 7RG | |
| Asus G701VO-CS74K | |
| MSI GS43VR 7RE-069US | |
| HP Omen 15-ce002ng | |
| Asus Strix GL502VY-DS71 | |
| Asus Strix GL502VT-DS74 | |
| 1280x720 Performance Combined | |
| Alienware 17 R4 | |
| EVGA SC17 GTX 1070 | |
| MSI GS73VR 7RG | |
| Asus G701VO-CS74K | |
| Asus Zephyrus GX501 | |
| MSI GS43VR 7RE-069US | |
| MSI GS63VR 7RG | |
| HP Omen 15-ce002ng | |
| Asus Strix GL502VY-DS71 | |
| Asus Strix GL502VT-DS74 | |
| 3DMark 11 Performance | 14903 poäng | |
| 3DMark Ice Storm Standard Score | 128787 poäng | |
| 3DMark Cloud Gate Standard Score | 27498 poäng | |
| 3DMark Fire Strike Score | 12077 poäng | |
| 3DMark Fire Strike Extreme Score | 6394 poäng | |
Hjälp | ||
| Rise of the Tomb Raider - 1920x1080 Very High Preset AA:FX AF:16x | |
| Alienware 17 R4 | |
| Asus Zephyrus GX501 | |
| Nvidia GeForce GTX 1070 Founders Edition | |
| MSI GE73VR 7RF Raider | |
| Asus Zephyrus GX501VS | |
| MSI GS73VR 7RG | |
| MSI GS43VR 7RE-069US | |
| EVGA SC17 | |
| HP Omen 15-ce002ng | |
| Zotac ZBOX Magnus EN51050 | |
| BioShock Infinite - 1920x1080 Ultra Preset, DX11 (DDOF) | |
| Alienware 17 R4 | |
| Nvidia GeForce GTX 1070 Founders Edition | |
| MSI GE73VR 7RF Raider | |
| Asus Zephyrus GX501VS | |
| MSI GS73VR 7RG | |
| MSI GS43VR 7RE-069US | |
| EVGA SC17 | |
| Lenovo Legion Y520-15IKBN 80WK0042GE | |
| Zotac ZBOX Magnus EN51050 | |
| The Witcher 3 - 1920x1080 Ultra Graphics & Postprocessing (HBAO+) | |
| Alienware 17 R4 | |
| Nvidia GeForce GTX 1070 Founders Edition | |
| Asus Zephyrus GX501 | |
| MSI GE73VR 7RF Raider | |
| MSI GS73VR 7RG | |
| Asus Zephyrus GX501VS | |
| MSI GS43VR 7RE-069US | |
| HP Omen 15-ce002ng | |
| Lenovo Legion Y520-15IKBN 80WK0042GE | |
| Zotac ZBOX Magnus EN51050 | |
| låg | med. | hög | ultra | |
|---|---|---|---|---|
| BioShock Infinite (2013) | 127.6 | |||
| Metro: Last Light (2013) | 96.1 | |||
| Thief (2014) | 93.3 | |||
| The Witcher 3 (2015) | 98.2 | 51.3 | ||
| Batman: Arkham Knight (2015) | 106 | 56 | ||
| Metal Gear Solid V (2015) | 60 | 60 | ||
| Fallout 4 (2015) | 88.3 | |||
| Rise of the Tomb Raider (2016) | 97.7 | 83.5 | ||
| Ashes of the Singularity (2016) | 67.5 | 63.5 | ||
| Overwatch (2016) | 138.1 | |||
| Mafia 3 (2016) | 55.1 | |||
| Prey (2017) | 132 | |||
| Dirt 4 (2017) | 115.4 | 72.8 | ||
| F1 2017 (2017) | 125 | 81 |
Ljudnivå
| Låg belastning |
| 29.4 / 30.7 / 34 dB(A) |
| Hög belastning |
| 42 / 45.8 dB(A) |
 | ||
30 dB tyst 40 dB(A) hörbar 50 dB(A) högt ljud |
||
min: | ||
| MSI GS73VR 7RG GeForce GTX 1070 Max-Q, i7-7700HQ, Samsung SSD PM871 MZNLN512HMJP | MSI GS73VR 6RF GeForce GTX 1060 Mobile, 6700HQ, SanDisk SD8SN8U1T001122 | Gigabyte P57X v7 GeForce GTX 1070 Mobile, i7-7700HQ, Transcend MTS800 256GB M.2 (TS256GMTS800) | EVGA SC17 GTX 1070 GeForce GTX 1070 Mobile, 6820HK, Samsung SM951 MZVPV256 m.2 | Alienware 17 R4 GeForce GTX 1080 Mobile, i7-7820HK, SK Hynix PC300 NVMe 512 GB | HP Omen 15-ce002ng GeForce GTX 1060 Max-Q, i7-7700HQ, Samsung PM961 MZVLW256HEHP | |
|---|---|---|---|---|---|---|
| Noise | -6% | -5% | -8% | -12% | -3% | |
| av / miljö * (dB) | 28 | 28.4 -1% | 29 -4% | 29.2 -4% | 28.2 -1% | 30 -7% |
| Idle Minimum * (dB) | 29.4 | 31.9 -9% | 30.4 -3% | 33.9 -15% | 35.6 -21% | 30 -2% |
| Idle Average * (dB) | 30.7 | 32 -4% | 32.1 -5% | 33.9 -10% | 35.6 -16% | 33 -7% |
| Idle Maximum * (dB) | 34 | 34 -0% | 32.1 6% | 33.9 -0% | 35.7 -5% | 37 -9% |
| Load Average * (dB) | 42 | 47 -12% | 45.6 -9% | 43.8 -4% | 50.2 -20% | 41 2% |
| Witcher 3 ultra * (dB) | 45.8 | 50.2 -10% | 42 8% | |||
| Load Maximum * (dB) | 45.8 | 49.4 -8% | 51.5 -12% | 53.4 -17% | 50.2 -10% | 50 -9% |
* ... mindre är bättre
(-) Den maximala temperaturen på ovansidan är 52.2 °C / 126 F, jämfört med genomsnittet av 40.4 °C / 105 F , allt från 21.2 till 68.8 °C för klassen Gaming.
(-) Botten värms upp till maximalt 46.6 °C / 116 F, jämfört med genomsnittet av 43.2 °C / 110 F
(+) Vid tomgångsbruk är medeltemperaturen för ovansidan 28.7 °C / 84 F, jämfört med enhetsgenomsnittet på 33.9 °C / ### class_avg_f### F.
(-) När du spelar The Witcher 3 är medeltemperaturen för ovansidan 38.4 °C / 101 F, jämfört med enhetsgenomsnittet på 33.9 °C / ## #class_avg_f### F.
(+) Handledsstöden och pekplattan når maximal hudtemperatur (33.6 °C / 92.5 F) och är därför inte varma.
(-) Medeltemperaturen för handledsstödsområdet på liknande enheter var 28.8 °C / 83.8 F (-4.8 °C / -8.7 F).
MSI GS73VR 7RG ljudanalys
(-) | inte särskilt höga högtalare (71.6 dB)
Bas 100 - 315 Hz
(-) | nästan ingen bas - i genomsnitt 20.4% lägre än medianen
(+) | basen är linjär (5.7% delta till föregående frekvens)
Mellan 400 - 2000 Hz
(±) | högre mellan - i genomsnitt 10% högre än median
(±) | linjäriteten för mids är genomsnittlig (13.2% delta till föregående frekvens)
Högsta 2 - 16 kHz
(+) | balanserade toppar - endast 3.4% från medianen
(±) | linjäriteten för toppar är genomsnittlig (14.9% delta till föregående frekvens)
Totalt 100 - 16 000 Hz
(-) | det totala ljudet är inte linjärt (34.7% skillnad mot median)
Jämfört med samma klass
» 99% av alla testade enheter i den här klassen var bättre, 1% liknande, 1% sämre
» Den bästa hade ett delta på 6%, genomsnittet var 18%, sämst var 132%
Jämfört med alla testade enheter
» 93% av alla testade enheter var bättre, 1% liknande, 6% sämre
» Den bästa hade ett delta på 4%, genomsnittet var 23%, sämst var 134%
Apple MacBook 12 (Early 2016) 1.1 GHz ljudanalys
(+) | högtalare kan spela relativt högt (83.6 dB)
Bas 100 - 315 Hz
(±) | reducerad bas - i genomsnitt 11.3% lägre än medianen
(±) | linjäriteten för basen är genomsnittlig (14.2% delta till föregående frekvens)
Mellan 400 - 2000 Hz
(+) | balanserad mellan - endast 2.4% från medianen
(+) | mids är linjära (5.5% delta till föregående frekvens)
Högsta 2 - 16 kHz
(+) | balanserade toppar - endast 2% från medianen
(+) | toppar är linjära (4.5% delta till föregående frekvens)
Totalt 100 - 16 000 Hz
(+) | det totala ljudet är linjärt (10.2% skillnad mot median)
Jämfört med samma klass
» 7% av alla testade enheter i den här klassen var bättre, 2% liknande, 90% sämre
» Den bästa hade ett delta på 5%, genomsnittet var 18%, sämst var 53%
Jämfört med alla testade enheter
» 5% av alla testade enheter var bättre, 1% liknande, 94% sämre
» Den bästa hade ett delta på 4%, genomsnittet var 23%, sämst var 134%
| Av/Standby | |
| Låg belastning | |
| Hög belastning |
|
Förklaring:
min: | |
| MSI GS73VR 7RG i7-7700HQ, GeForce GTX 1070 Max-Q, Samsung SSD PM871 MZNLN512HMJP, TN LED, 1920x1080, 17.3" | MSI GF72VR 7RF i7-7700HQ, GeForce GTX 1060 Mobile, Samsung PM961 MZVLW256HEHP, TN LED, 1920x1080, 17.3" | Gigabyte Aero 15X i7-7700HQ, GeForce GTX 1070 Max-Q, Samsung SM961 MZVKW512HMJP m.2 PCI-e, IPS, 1920x1080, 15.6" | Alienware 17 R4 i7-7820HK, GeForce GTX 1080 Mobile, SK Hynix PC300 NVMe 512 GB, TN LED, 2560x1440, 17.3" | MSI GE73VR 7RF Raider i7-7700HQ, GeForce GTX 1070 Mobile, Toshiba HG6 THNSNJ256G8NY, TN WLED, 1920x1080, 17.3" | |
|---|---|---|---|---|---|
| Power Consumption | -13% | 8% | -102% | -20% | |
| Idle Minimum * (Watt) | 10.1 | 15.7 -55% | 10 1% | 37.5 -271% | 10 1% |
| Idle Average * (Watt) | 18.3 | 21.4 -17% | 13 29% | 37.6 -105% | 18 2% |
| Idle Maximum * (Watt) | 19.6 | 21.9 -12% | 20 -2% | 37.6 -92% | 26 -33% |
| Load Average * (Watt) | 87.6 | 83.9 4% | 79 10% | 122.4 -40% | 97 -11% |
| Witcher 3 ultra * (Watt) | 136.3 | 130.2 4% | 120 12% | 180.3 -32% | 183 -34% |
| Load Maximum * (Watt) | 160.7 | 159.6 1% | 165 -3% | 277.4 -73% | 230 -43% |
* ... mindre är bättre
| MSI GS73VR 7RG i7-7700HQ, GeForce GTX 1070 Max-Q, 51 Wh | Aorus X7 v7 i7-7820HK, GeForce GTX 1070 Mobile, 94 Wh | MSI GF72VR 7RF i7-7700HQ, GeForce GTX 1060 Mobile, 43 Wh | Gigabyte Aero 15X i7-7700HQ, GeForce GTX 1070 Max-Q, 94.2 Wh | Alienware 17 R4 i7-7820HK, GeForce GTX 1080 Mobile, 99 Wh | Lenovo Legion Y920-17IKB i7-7820HK, GeForce GTX 1070 Mobile, 90 Wh | |
|---|---|---|---|---|---|---|
| Batteridrifttid | -1% | -32% | 147% | -2% | 50% | |
| Reader / Idle (h) | 5.8 | 3.7 -36% | 3.4 -41% | 13 124% | 4.6 -21% | 5.9 2% |
| WiFi v1.3 (h) | 3.2 | 3 -6% | 2.4 -25% | 8.2 156% | 3 -6% | 4.7 47% |
| Load (h) | 1 | 1.4 40% | 0.7 -30% | 2.6 160% | 1.2 20% | 2 100% |
För
Emot

GS73VR Max-Q uppdateringen gör detta till den bästa upprepningen av serien hitills. Den har inte bara snabbare prestanda än den äldre GTX 1060 SKU under samma energiförhållanden utan den är också tystare och svalare. Det är precis den här typen av steg som GS-serien borde ta för att slå ut alla andra super-tunna spellaptops som för tillfället finns på marknaden.
Även om GS73VR 7RG är märkbart förbättrad gentemot GS73VR 7RF och 6RF så har den fortfarande långt att gå. 7RG är en av dom mest högljudda Max-Q datorer vi har testat tillsammans med Eurocom Q5. Den är inte i närheten så högljudd som fullstorleks-modellerna Alienware 17 eller Eurocom Tornado F5, men den vacklar lite för mycket mellan "Max-Q GTX" och "vanlig GTX" för vårt tycke. Asus Zephyrus är en mindre laptop men ändå lyckas den inrymma och kyla ett GTX 1080 Max-Q vid mycket lägre fläkthastighet.
Vid sidan om dom tidigare nämnda förbättringarna så följer alla för och nackdelar av de tidigare GS73VR-versionerna med. Chassit kunde vara stabilare, styrplattan stadigare och den övergripande byggkvaliteten känns aningen bristfällig. Vi kan inte förstå varför garantin upphävs om man tar bort bottenpanelen när det egentligen är väldigt enkelt process att byta ut en HDD. 120 Hz-skärmen och SteelSeries-tangentbordet är i övrigt svåra att inte gilla.
Detta är både den tystaste och mest kraftfulla version av GS73VR som går att köpa för pengar. I slutändan finns det dock kraftfullare och tystare Max-Q laptops där ute, särskilt i 15-tums segmentet där Zephyrus GX501 och Predator Triton för tillfället härskar.
MSI GS73VR 7RG
- 10/19/2017 v6 (old)
Allen Ngo
Price comparison
