Test: MSI PX60 6QD Prestige iBuyPower Edition (sammanfattning)


| |||||||||||||||||||||||||
Distribution av ljusstyrkan: 80 %
Mitt på batteriet: 221.1 cd/m²
Kontrast: 361:1 (Svärta: 0.612 cd/m²)
ΔE ColorChecker Calman: 10.96 | ∀{0.5-29.43 Ø4.71}
ΔE Greyscale Calman: 11.8 | ∀{0.09-98 Ø4.96}
99.76% sRGB (Argyll 1.6.3 3D)
73.9% AdobeRGB 1998 (Argyll 1.6.3 3D)
83.1% AdobeRGB 1998 (Argyll 3D)
99.8% sRGB (Argyll 3D)
84.5% Display P3 (Argyll 3D)
Gamma: 2.17
CCT: 15654 K
| MSI PX60 6QD 15.6", 1920x1080 | MSI PX60 QD-034US 15.6", 1920x1080 | Lenovo ThinkPad T560 20FH001APB 15.6", 1920x1080 | HP ZBook 15 G3 15.6", 1920x1080 | Apple MacBook Pro Retina 15 inch 2015-05 15.4", 2880x1800 | Dell XPS 15-9550 i7 15.6", 3840x2160 | |
|---|---|---|---|---|---|---|
| Display | -13% | -47% | -14% | -20% | 8% | |
| Display P3 Coverage (%) | 84.5 | 67 -21% | 40.93 -52% | 66.8 -21% | 61.4 -27% | 87.8 4% |
| sRGB Coverage (%) | 99.8 | 97.7 -2% | 59.6 -40% | 95.5 -4% | 90.8 -9% | 100 0% |
| AdobeRGB 1998 Coverage (%) | 83.1 | 69.2 -17% | 42.55 -49% | 69 -17% | 62.9 -24% | 99.4 20% |
| Response Times | -27% | -30% | ||||
| Response Time Grey 50% / Grey 80% * (ms) | 44.4 ? | 54 ? -22% | 58 ? -31% | |||
| Response Time Black / White * (ms) | 27.2 ? | 35.6 ? -31% | 35 ? -29% | |||
| PWM Frequency (Hz) | 200 ? | 198 ? | ||||
| Screen | 43% | 63% | 40% | 55% | 52% | |
| Brightness middle (cd/m²) | 221.1 | 300.9 36% | 307.3 39% | 306 38% | 341 54% | 361 63% |
| Brightness (cd/m²) | 208 | 285 37% | 285 37% | 289 39% | 315 51% | 344 65% |
| Brightness Distribution (%) | 80 | 86 8% | 85 6% | 85 6% | 82 2% | 90 13% |
| Black Level * (cd/m²) | 0.612 | 0.431 30% | 0.3 51% | 0.34 44% | 0.34 44% | 0.38 38% |
| Contrast (:1) | 361 | 698 93% | 1024 184% | 900 149% | 1003 178% | 950 163% |
| Colorchecker dE 2000 * | 10.96 | 1.79 84% | 5.1 53% | 2.07 81% | 5.34 51% | |
| Colorchecker dE 2000 max. * | 19.39 | 3.96 80% | 9.9 49% | 3.27 83% | ||
| Greyscale dE 2000 * | 11.8 | 2.19 81% | 7.4 37% | 1.9 84% | 4.84 59% | |
| Gamma | 2.17 101% | 2.29 96% | 2.37 93% | 2.62 84% | 2.21 100% | |
| CCT | 15654 42% | 6724 97% | 7263 89% | 6514 100% | 7395 88% | |
| Color Space (Percent of AdobeRGB 1998) (%) | 73.9 | 63.1 -15% | 63 -15% | 58 -22% | 89 20% | |
| Color Space (Percent of sRGB) (%) | 99.76 | 97.8 -2% | 95 -5% | 91 -9% | 100 0% | |
| Totalt genomsnitt (program/inställningar) | 15% /
30% | 8% /
22% | -0% /
20% | 18% /
37% | 10% /
31% |
* ... mindre är bättre
Visa svarstider
| ↔ Svarstid svart till vitt | ||
|---|---|---|
| 27.2 ms ... stiga ↗ och falla ↘ kombinerat | ↗ 9.2 ms stiga | 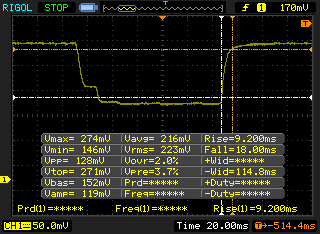 |
| ↘ 18 ms hösten | ||
| Skärmen visar relativt långsamma svarsfrekvenser i våra tester och kan vara för långsam för spelare. I jämförelse sträcker sig alla testade enheter från 0.1 (minst) till 240 (maximalt) ms. » 69 % av alla enheter är bättre. Detta innebär att den uppmätta svarstiden är sämre än genomsnittet av alla testade enheter (19.8 ms). | ||
| ↔ Svarstid 50 % grått till 80 % grått | ||
| 44.4 ms ... stiga ↗ och falla ↘ kombinerat | ↗ 22.8 ms stiga | 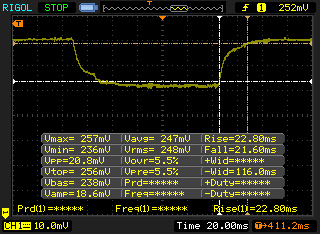 |
| ↘ 21.6 ms hösten | ||
| Skärmen visar långsamma svarsfrekvenser i våra tester och kommer att vara otillfredsställande för spelare. I jämförelse sträcker sig alla testade enheter från 0.165 (minst) till 636 (maximalt) ms. » 76 % av alla enheter är bättre. Detta innebär att den uppmätta svarstiden är sämre än genomsnittet av alla testade enheter (30.9 ms). | ||
Skärmflimmer / PWM (Puls-Width Modulation)
| Skärmflimmer / PWM upptäckt | 200 Hz | ≤ 99 % ljusstyrka inställning | 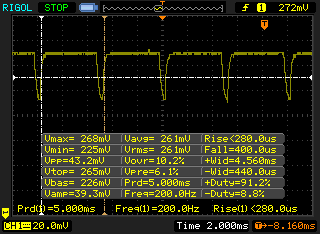 |
Displayens bakgrundsbelysning flimrar vid 200 Hz (i värsta fall, t.ex. med PWM) Flimrande upptäckt vid en ljusstyrkeinställning på 99 % och lägre. Det ska inte finnas något flimmer eller PWM över denna ljusstyrkeinställning. Frekvensen för 200 Hz är relativt låg, så känsliga användare kommer sannolikt att märka flimmer och uppleva ansträngda ögon vid den angivna ljusstyrkeinställningen och nedan. Som jämförelse: 52 % av alla testade enheter använder inte PWM för att dämpa skärmen. Om PWM upptäcktes mättes ett medelvärde av 7741 (minst: 5 - maximum: 343500) Hz. | |||

| Cinebench R11.5 | |
| CPU Single 64Bit (sortera efter värde) | |
| MSI PX60 6QD | |
| MSI PX60 QD-034US | |
| Lenovo ThinkPad T560 20FH001APB | |
| HP ZBook 15 G3 | |
| Apple MacBook Pro Retina 15 inch 2015-05 | |
| Apple MacBook Pro Retina 15 inch 2015-05 | |
| Dell XPS 15-9550 i7 | |
| Dell Precision 5510 | |
| CPU Multi 64Bit (sortera efter värde) | |
| MSI PX60 6QD | |
| MSI PX60 QD-034US | |
| Lenovo ThinkPad T560 20FH001APB | |
| HP ZBook 15 G3 | |
| Apple MacBook Pro Retina 15 inch 2015-05 | |
| Apple MacBook Pro Retina 15 inch 2015-05 | |
| Dell XPS 15-9550 i7 | |
| Dell Precision 5510 | |
| Cinebench R15 | |
| CPU Single 64Bit (sortera efter värde) | |
| MSI PX60 6QD | |
| MSI PX60 QD-034US | |
| Lenovo ThinkPad T560 20FH001APB | |
| HP ZBook 15 G3 | |
| Apple MacBook Pro Retina 15 inch 2015-05 | |
| Apple MacBook Pro Retina 15 inch 2015-05 | |
| Dell XPS 15-9550 i7 | |
| Dell Precision 5510 | |
| CPU Multi 64Bit (sortera efter värde) | |
| MSI PX60 6QD | |
| MSI PX60 QD-034US | |
| Lenovo ThinkPad T560 20FH001APB | |
| HP ZBook 15 G3 | |
| Apple MacBook Pro Retina 15 inch 2015-05 | |
| Apple MacBook Pro Retina 15 inch 2015-05 | |
| Dell XPS 15-9550 i7 | |
| Dell Precision 5510 | |
| PCMark 8 Home Score Accelerated v2 | 3590 poäng | |
| PCMark 8 Creative Score Accelerated v2 | 4426 poäng | |
| PCMark 8 Work Score Accelerated v2 | 4703 poäng | |
Hjälp | ||

| 3DMark 11 - 1280x720 Performance (sortera efter värde) | |
| MSI PX60 6QD | |
| MSI PX60 QD-034US | |
| Lenovo ThinkPad T560 20FH001APB | |
| HP ZBook 15 G3 | |
| Apple MacBook Pro Retina 15 inch 2015-05 | |
| Dell XPS 15-9550 i7 | |
| Dell Precision 5510 | |
| 3DMark | |
| 1920x1080 Fire Strike Score (sortera efter värde) | |
| MSI PX60 6QD | |
| MSI PX60 QD-034US | |
| Lenovo ThinkPad T560 20FH001APB | |
| HP ZBook 15 G3 | |
| Apple MacBook Pro Retina 15 inch 2015-05 | |
| Dell XPS 15-9550 i7 | |
| Dell Precision 5510 | |
| 1280x720 Cloud Gate Standard Score (sortera efter värde) | |
| MSI PX60 6QD | |
| MSI PX60 QD-034US | |
| Lenovo ThinkPad T560 20FH001APB | |
| HP ZBook 15 G3 | |
| Apple MacBook Pro Retina 15 inch 2015-05 | |
| Dell XPS 15-9550 i7 | |
| Dell Precision 5510 | |
| 1280x720 Ice Storm Standard Score (sortera efter värde) | |
| MSI PX60 6QD | |
| MSI PX60 QD-034US | |
| Lenovo ThinkPad T560 20FH001APB | |
| HP ZBook 15 G3 | |
| Apple MacBook Pro Retina 15 inch 2015-05 | |
| Dell XPS 15-9550 i7 | |
| Dell Precision 5510 | |
| 3DMark 06 Standard Score | 23380 poäng | |
| 3DMark Vantage P Result | 18030 poäng | |
| 3DMark 11 Performance | 4740 poäng | |
| 3DMark Ice Storm Standard Score | 85864 poäng | |
| 3DMark Cloud Gate Standard Score | 16389 poäng | |
| 3DMark Fire Strike Score | 3448 poäng | |
Hjälp | ||
| låg | med. | hög | ultra | QHD | 4K | |
|---|---|---|---|---|---|---|
| BioShock Infinite (2013) | 166 | 112 | 104 | 39 | ||
| World of Tanks enCore (2018) | 246.4 | 75.1 | 26 | 19 | 8.9 | |
| Hitman 2 (2018) | 29.8 | 18.6 | 15.7 | 13.4 | ||
| Fallout 76 (2018) | 55.7 | 30.2 | 25.9 | 25 | ||
| Battlefield V (2018) | 68.1 | 31 | 25.7 | 19.8 | ||
| Farming Simulator 19 (2018) | 122.1 | 58.5 | 35.9 | 26.5 | ||
| Darksiders III (2018) | 124 | 51 | 43 | 29 | ||
| Just Cause 4 (2018) | 39.8 | 24.4 | 19.4 | 18.8 | ||
| Far Cry New Dawn (2019) | 26 | 22 | 20 | 19 | ||
| Metro Exodus (2019) | 29.67 | 13.93 | ||||
| Dirt Rally 2.0 (2019) | 67.9 | 37.34 | 32.48 | |||
| The Division 2 (2019) | 49 | 24 | 17 | 12 | ||
| Anno 1800 (2019) | 52.8 | 26.7 | 15.9 | |||
| Rage 2 (2019) | 22.4 | 13.1 | ||||
| Total War: Three Kingdoms (2019) | 101.4 | 31.2 | 19.1 | 13.2 | ||
| League of Legends (2019) | 110.3 | 81 | 75.5 | 75.9 | 60.9 | 40.4 |
| F1 2019 (2019) | 84 | 38.8 | 34.3 | 19 | 14.5 | 7.5 |
| Control (2019) | 49.4 | 14.4 | ||||
| Borderlands 3 (2019) | 48.9 | 47.4 | 13.9 | 10.3 | ||
| Star Wars Jedi Fallen Order (2019) | 48 | 37.7 | 33.2 | 18.6 | 18.4 | |
| Gears Tactics (2020) | 98.1 | 37.5 | 20.5 | 14.8 | 10 | |
| F1 2020 (2020) | 79.9 | 38.4 | 28.8 | 18.5 | 12.6 |
| MSI PX60 6QD GeForce GTX 950M, 6700HQ | MSI PX60 QD-034US GeForce GTX 950M, 5700HQ, HGST Travelstar 7K1000 HTS721010A9E630 | Lenovo ThinkPad T560 20FH001APB HD Graphics 520, 6600U, Samsung SSD PM871 MZ7LN256HCHP | HP ZBook 15 G3 Quadro M2000M, E3-1505M v5, Samsung SM951 MZVPV512HDGL m.2 PCI-e | Apple MacBook Pro Retina 15 inch 2015-05 Radeon R9 M370X, 4870HQ, Apple SSD SM0512G | Dell XPS 15-9550 i7 GeForce GTX 960M, 6700HQ, Samsung PM951 NVMe 512 GB | |
|---|---|---|---|---|---|---|
| Noise | -4% | 15% | 4% | 8% | 3% | |
| av / miljö * (dB) | 30 | 30 -0% | ||||
| Idle Minimum * (dB) | 35 | 34.8 1% | 30 14% | 30 14% | 28.9 17% | 31.4 10% |
| Idle Average * (dB) | 35.2 | 37.2 -6% | 30.7 13% | 30 15% | 28.9 18% | 32.5 8% |
| Idle Maximum * (dB) | 35.2 | 37.4 -6% | 31.4 11% | 30 15% | 28.9 18% | 33.6 5% |
| Load Average * (dB) | 38.8 | 41.8 -8% | 33.8 13% | 45.3 -17% | 46 -19% | 45.2 -16% |
| Load Maximum * (dB) | 48.8 | 49.4 -1% | 38 22% | 49.7 -2% | 46 6% | 46 6% |
* ... mindre är bättre
Ljudnivå
| Låg belastning |
| 35 / 35.2 / 35.2 dB(A) |
| Hög belastning |
| 38.8 / 48.8 dB(A) |
 | ||
30 dB tyst 40 dB(A) hörbar 50 dB(A) högt ljud |
||
min: | ||
(±) Den maximala temperaturen på ovansidan är 42.6 °C / 109 F, jämfört med genomsnittet av 34.3 °C / 94 F , allt från 21.2 till 62.5 °C för klassen Office.
(-) Botten värms upp till maximalt 60.4 °C / 141 F, jämfört med genomsnittet av 36.8 °C / 98 F
(+) Vid tomgångsbruk är medeltemperaturen för ovansidan 29.9 °C / 86 F, jämfört med enhetsgenomsnittet på 29.5 °C / ### class_avg_f### F.
(+) Handledsstöden och pekplattan når maximal hudtemperatur (33.4 °C / 92.1 F) och är därför inte varma.
(-) Medeltemperaturen för handledsstödsområdet på liknande enheter var 27.6 °C / 81.7 F (-5.8 °C / -10.4 F).
| Av/Standby | |
| Låg belastning | |
| Hög belastning |
|
Förklaring:
min: | |
| MSI PX60 6QD GeForce GTX 950M, 6700HQ | Lenovo ThinkPad T560 20FH001APB HD Graphics 520, 6600U, Samsung SSD PM871 MZ7LN256HCHP | HP ZBook 15 G3 Quadro M2000M, E3-1505M v5, Samsung SM951 MZVPV512HDGL m.2 PCI-e | Apple MacBook Pro Retina 15 inch 2015-05 Radeon R9 M370X, 4870HQ, Apple SSD SM0512G | Dell XPS 15-9550 i7 GeForce GTX 960M, 6700HQ, Samsung PM951 NVMe 512 GB | Dell Precision 5510 Quadro M1000M, E3-1505M v5, SK hynix SC920 512 GB | |
|---|---|---|---|---|---|---|
| Power Consumption | 53% | 19% | 25% | -9% | 8% | |
| Idle Minimum * (Watt) | 15 | 3.8 75% | 5.7 62% | 6 60% | 12.5 17% | 8.6 43% |
| Idle Average * (Watt) | 18.6 | 10.2 45% | 12.2 34% | 12.8 31% | 19.6 -5% | 16.2 13% |
| Idle Maximum * (Watt) | 19.7 | 15.6 21% | 12.6 36% | 13.3 32% | 22.8 -16% | 16.7 15% |
| Load Average * (Watt) | 64.6 | 30.8 52% | 83.1 -29% | 82.4 -28% | 102 -58% | 82.6 -28% |
| Load Maximum * (Watt) | 129 | 33.9 74% | 138.2 -7% | 91.8 29% | 107 17% | 131.8 -2% |
* ... mindre är bättre
För
Emot
Läs en mer omfattande version av testet på engelska här.
Även om vårt betygsystem har utvecklats i takt med marknaden har vår bedömning av PX60 knappt förändrats sedan förra årets modell. Det hade inte varit något problem om föregångaren var felfri, men vi hittade mycket övrigt att önska under det testet. Skylake-versionen av PX60 åtgärdar få av dessa brister, utan hämtar istället sina marginella förbättringar från ett uppdaterat chipset och ny CPU-arkitektur.
Resultatet är ännu en ”företagsdator” som har mer gemensamt med en spelmaskin bortsett från vissa utseendemässiga skillnader. MSI följde bara minsta motståndets lag genom att döpa om GS60 Ghost-serien.
Problemet är att företagsmarknaden är extremt konkurrensutsatt och de flesta köpare sätter funktioner som ergonomi och funktionalitet framför allt annat. Genom att underprestera i viktiga kategorier som batteritid, underhållsmöjligheter och pekplatta, hade PX60 verkligen behövt glänsa på andra punkter för att kunna konkurrera.
Som företagsmaskin har den tyvärr inga sådana egenskaper. Ser man istället datorn som en mer återhållsamt designad speldator står den sig möjligen bättre.
Den har fortfarande ett antal brister, men så länge du inte gå i förväntar dig en ThinkPad eller Latitude kan PX60 fungera som en billig stationär dator (eller bärbar med kort batteritid) för prismedvetna konsumenter. För de flesta företag finns det däremot alldeles för många överlägsna alternativ.
MSI PX60 6QD
- 05/03/2016 v5.1 (old)
Steve Schardein
Price comparison
