Test: Lenovo Legion Y740-17ICH (i7-8750H, RTX 2080 Max-Q) Laptop (Sammanfattning)
| |||||||||||||||||||||||||
Distribution av ljusstyrkan: 81 %
Mitt på batteriet: 299.1 cd/m²
Kontrast: 1108:1 (Svärta: 0.27 cd/m²)
ΔE ColorChecker Calman: 5.07 | ∀{0.5-29.43 Ø4.72}
calibrated: 3.31
ΔE Greyscale Calman: 6.8 | ∀{0.09-98 Ø4.97}
89.9% sRGB (Argyll 1.6.3 3D)
58.5% AdobeRGB 1998 (Argyll 1.6.3 3D)
64.8% AdobeRGB 1998 (Argyll 3D)
90.4% sRGB (Argyll 3D)
64% Display P3 (Argyll 3D)
Gamma: 2.46
CCT: 7805 K
| Lenovo Legion Y740-17ICH AU Optronics B173HAN03.2, IPS, 17.3", 1920x1080 | Asus ROG Strix Scar II GL704GW B173HAN04.0 (AUO409D), AHVA, 17.3", 1920x1080 | Razer Blade Pro 2017 Sharp LQ173D1JW33 (SHP145A), IGZO, 17.3", 3840x2160 | MSI GE75 8SG Raider CMN N173HCE-G33 (CMN175C), AHVA, 17.3", 1920x1080 | Alienware 17 R5 JYWWF_B173QTN (AUO1496), TN, 17.3", 2560x1440 | Lenovo Legion Y730-17ICH, i7-8750H LP173WF4-SPF6, IPS, 17.3", 1920x1080 | |
|---|---|---|---|---|---|---|
| Display | -3% | 35% | -2% | -3% | -2% | |
| Display P3 Coverage (%) | 64 | 62.9 -2% | 88.9 39% | 60.6 -5% | 63.4 -1% | 66.4 4% |
| sRGB Coverage (%) | 90.4 | 87.1 -4% | 100 11% | 91.2 1% | 86.1 -5% | 84.9 -6% |
| AdobeRGB 1998 Coverage (%) | 64.8 | 63.7 -2% | 99.7 54% | 62.6 -3% | 62.9 -3% | 62.1 -4% |
| Response Times | 0% | -245% | 39% | 10% | -112% | |
| Response Time Grey 50% / Grey 80% * (ms) | 15.6 ? | 17.6 ? -13% | 60.8 ? -290% | 8 ? 49% | 20.8 ? -33% | 36.8 ? -136% |
| Response Time Black / White * (ms) | 12.8 ? | 11.2 ? 13% | 38.4 ? -200% | 9.2 ? 28% | 6 ? 53% | 24 ? -88% |
| PWM Frequency (Hz) | 204.9 ? | 26040 ? | ||||
| Screen | 19% | 7% | 24% | -1% | -8% | |
| Brightness middle (cd/m²) | 299.1 | 295 -1% | 230 -23% | 363 21% | 398 33% | 328.7 10% |
| Brightness (cd/m²) | 273 | 291 7% | 207 -24% | 342 25% | 367 34% | 318 16% |
| Brightness Distribution (%) | 81 | 96 19% | 83 2% | 86 6% | 86 6% | 91 12% |
| Black Level * (cd/m²) | 0.27 | 0.24 11% | 0.2 26% | 0.27 -0% | 0.51 -89% | 0.51 -89% |
| Contrast (:1) | 1108 | 1229 11% | 1150 4% | 1344 21% | 780 -30% | 645 -42% |
| Colorchecker dE 2000 * | 5.07 | 3.2 37% | 5.62 -11% | 2.29 55% | 5.45 -7% | 4.91 3% |
| Colorchecker dE 2000 max. * | 10.55 | 6.64 37% | 10.24 3% | 4.54 57% | 10.36 2% | 10.15 4% |
| Colorchecker dE 2000 calibrated * | 3.31 | 2.52 24% | 2.45 26% | 2.56 23% | 4.27 -29% | |
| Greyscale dE 2000 * | 6.8 | 2.16 68% | 4.54 33% | 3.02 56% | 5.4 21% | 3.9 43% |
| Gamma | 2.46 89% | 2.46 89% | 2.36 93% | 2.38 92% | 2.4 92% | 2.13 103% |
| CCT | 7805 83% | 6872 95% | 6625 98% | 7048 92% | 7453 87% | 6911 94% |
| Color Space (Percent of AdobeRGB 1998) (%) | 58.5 | 57 -3% | 88 50% | 58 -1% | 56 -4% | 55.6 -5% |
| Color Space (Percent of sRGB) (%) | 89.9 | 87 -3% | 100 11% | 91 1% | 86 -4% | 84.7 -6% |
| Totalt genomsnitt (program/inställningar) | 5% /
12% | -68% /
-21% | 20% /
21% | 2% /
-0% | -41% /
-20% |
* ... mindre är bättre
Visa svarstider
| ↔ Svarstid svart till vitt | ||
|---|---|---|
| 12.8 ms ... stiga ↗ och falla ↘ kombinerat | ↗ 7.6 ms stiga | 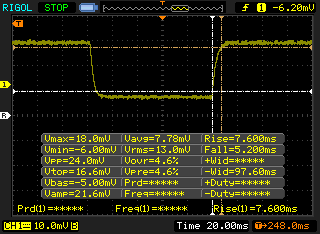 |
| ↘ 5.2 ms hösten | ||
| Skärmen visar bra svarsfrekvens i våra tester, men kan vara för långsam för konkurrenskraftiga spelare. I jämförelse sträcker sig alla testade enheter från 0.1 (minst) till 240 (maximalt) ms. » 33 % av alla enheter är bättre. Det betyder att den uppmätta svarstiden är bättre än genomsnittet av alla testade enheter (19.8 ms). | ||
| ↔ Svarstid 50 % grått till 80 % grått | ||
| 15.6 ms ... stiga ↗ och falla ↘ kombinerat | ↗ 8 ms stiga | 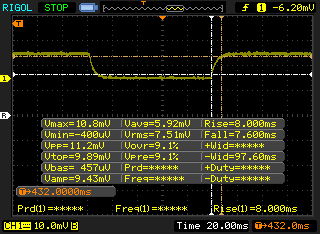 |
| ↘ 7.6 ms hösten | ||
| Skärmen visar bra svarsfrekvens i våra tester, men kan vara för långsam för konkurrenskraftiga spelare. I jämförelse sträcker sig alla testade enheter från 0.165 (minst) till 636 (maximalt) ms. » 30 % av alla enheter är bättre. Det betyder att den uppmätta svarstiden är bättre än genomsnittet av alla testade enheter (31 ms). | ||
Skärmflimmer / PWM (Puls-Width Modulation)
| Skärmflimmer / PWM upptäcktes inte | 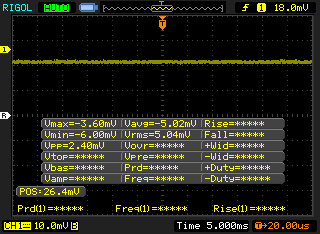 | ||
Som jämförelse: 52 % av alla testade enheter använder inte PWM för att dämpa skärmen. Om PWM upptäcktes mättes ett medelvärde av 7769 (minst: 5 - maximum: 343500) Hz. | |||
| PCMark 8 Home Score Accelerated v2 | 5107 poäng | |
| PCMark 8 Work Score Accelerated v2 | 5882 poäng | |
| PCMark 10 Score | 6053 poäng | |
Hjälp | ||
| Lenovo Legion Y740-17ICH Samsung SSD PM981 MZVLB256HAHQ | Asus ROG Strix Scar II GL704GW Intel SSD 660p SSDPEKNW512G8 | Razer Blade Pro 2017 2x Samsung SSD PM951 MZVLV256HCHP (RAID 0) | Alienware 17 R5 SK hynix PC401 HFS256GD9TNG | HP Omen X 17-ap0xx Samsung PM961 MZVLW256HEHP | |
|---|---|---|---|---|---|
| AS SSD | -21% | 11% | -29% | 13% | |
| Seq Read (MB/s) | 1153 | 1315 14% | 2599 125% | 2203 91% | 2352 104% |
| Seq Write (MB/s) | 1328 | 927 -30% | 588 -56% | 559 -58% | 1145 -14% |
| 4K Read (MB/s) | 35.05 | 52.4 50% | 37.57 7% | 38.74 11% | 44.81 28% |
| 4K Write (MB/s) | 96 | 122.8 28% | 104.4 9% | 92.7 -3% | 116.2 21% |
| 4K-64 Read (MB/s) | 727 | 326.5 -55% | 1116 54% | 447.2 -38% | 967 33% |
| 4K-64 Write (MB/s) | 1212 | 727 -40% | 513 -58% | 279.1 -77% | 798 -34% |
| Access Time Read * (ms) | 0.063 | 0.11 -75% | 0.051 19% | 0.091 -44% | 0.05 21% |
| Access Time Write * (ms) | 0.04 | 0.045 -13% | 0.036 10% | 0.065 -63% | 0.032 20% |
| Score Read (Points) | 878 | 510 -42% | 1414 61% | 706 -20% | 1248 42% |
| Score Write (Points) | 1441 | 942 -35% | 676 -53% | 428 -70% | 1029 -29% |
| Score Total (Points) | 2784 | 1715 -38% | 2715 -2% | 1424 -49% | 2862 3% |
| Copy ISO MB/s (MB/s) | 1487 | 1834 23% | |||
| Copy Program MB/s (MB/s) | 608 | 492.1 -19% | |||
| Copy Game MB/s (MB/s) | 1162 | 983 -15% |
* ... mindre är bättre

| 3DMark 11 Performance | 20177 poäng | |
| 3DMark Cloud Gate Standard Score | 37537 poäng | |
| 3DMark Fire Strike Score | 16302 poäng | |
| 3DMark Fire Strike Extreme Score | 8104 poäng | |
| 3DMark Time Spy Score | 7153 poäng | |
Hjälp | ||
| The Witcher 3 - 1920x1080 Ultra Graphics & Postprocessing (HBAO+) | |
| Asus ROG G703GX | |
| MSI GS75 8SG Stealth | |
| Lenovo Legion Y740-17ICH | |
| Asus ROG Strix Scar II GL704GW | |
| Razer Blade 15 RTX 2070 Max-Q | |
| HP Omen X 17-ap0xx | |
| Alienware 17 R5 | |
| Alienware m15 GTX 1070 Max-Q | |
| Lenovo Legion Y730-17ICH, i7-8750H | |
| Acer Nitro 5 AN515-42-R6V0 | |
| låg | med. | hög | ultra | |
|---|---|---|---|---|
| BioShock Infinite (2013) | 316.8 | 283.4 | 239.6 | 161.5 |
| The Witcher 3 (2015) | 305.4 | 222.4 | 144.2 | 73.1 |
| Rise of the Tomb Raider (2016) | 253.4 | 182.8 | 138.8 | 109 |
| Lenovo Legion Y740-17ICH GeForce RTX 2080 Max-Q, i7-8750H, Samsung SSD PM981 MZVLB256HAHQ | Asus ROG Strix Scar II GL704GW GeForce RTX 2070 Mobile, i7-8750H, Intel SSD 660p SSDPEKNW512G8 | Razer Blade Pro 2017 GeForce GTX 1080 Mobile, i7-7820HK, 2x Samsung SSD PM951 MZVLV256HCHP (RAID 0) | MSI GE75 8SG Raider GeForce RTX 2080 Mobile, i7-8750H, Kingston RBUSNS8154P3512GJ | Alienware 17 R5 GeForce GTX 1070 Mobile, i7-8750H, SK hynix PC401 HFS256GD9TNG | Lenovo Legion Y730-17ICH, i7-8750H GeForce GTX 1050 Ti Mobile, i7-8750H, Toshiba KBG30ZMT128G | |
|---|---|---|---|---|---|---|
| Noise | -14% | -13% | -18% | -12% | 3% | |
| av / miljö * (dB) | 28.3 | 29 -2% | 30 -6% | 30 -6% | 30 -6% | 28 1% |
| Idle Minimum * (dB) | 31.5 | 29 8% | 30 5% | 30 5% | 32 -2% | 28 11% |
| Idle Average * (dB) | 31.6 | 32 -1% | 31 2% | 34 -8% | 33 -4% | 28 11% |
| Idle Maximum * (dB) | 31.6 | 40 -27% | 33 -4% | 37 -17% | 34 -8% | 31.3 1% |
| Load Average * (dB) | 32.3 | 46 -42% | 43 -33% | 52 -61% | 43 -33% | 33.4 -3% |
| Witcher 3 ultra * (dB) | 43 | 51 -19% | 55 -28% | 53 -23% | 51 -19% | 42.8 -0% |
| Load Maximum * (dB) | 45.5 | 52 -14% | 58 -27% | 54 -19% | 51 -12% | 46.2 -2% |
* ... mindre är bättre
Ljudnivå
| Låg belastning |
| 31.5 / 31.6 / 31.6 dB(A) |
| Hårddisk |
| 31.6 dB(A) |
| Hög belastning |
| 32.3 / 45.5 dB(A) |
 | ||
30 dB tyst 40 dB(A) hörbar 50 dB(A) högt ljud |
||
min: | ||
(+) Den maximala temperaturen på ovansidan är 38.6 °C / 101 F, jämfört med genomsnittet av 40.4 °C / 105 F , allt från 21.2 till 68.8 °C för klassen Gaming.
(±) Botten värms upp till maximalt 43.6 °C / 110 F, jämfört med genomsnittet av 43.2 °C / 110 F
(+) Vid tomgångsbruk är medeltemperaturen för ovansidan 26.1 °C / 79 F, jämfört med enhetsgenomsnittet på 33.9 °C / ### class_avg_f### F.
(+) När du spelar The Witcher 3 är medeltemperaturen för ovansidan 29.6 °C / 85 F, jämfört med enhetsgenomsnittet på 33.9 °C / ## #class_avg_f### F.
(+) Handledsstöden och pekplattan är kallare än hudtemperaturen med maximalt 27 °C / 80.6 F och är därför svala att ta på.
(±) Medeltemperaturen för handledsstödsområdet på liknande enheter var 28.8 °C / 83.8 F (+1.8 °C / 3.2 F).
Lenovo Legion Y740-17ICH ljudanalys
(±) | högtalarljudstyrkan är genomsnittlig men bra (74.3 dB)
Bas 100 - 315 Hz
(-) | nästan ingen bas - i genomsnitt 21.1% lägre än medianen
(-) | basen är inte linjär (16.5% delta till föregående frekvens)
Mellan 400 - 2000 Hz
(+) | balanserad mellan - endast 3.3% från medianen
(±) | linjäriteten för mids är genomsnittlig (9.7% delta till föregående frekvens)
Högsta 2 - 16 kHz
(+) | balanserade toppar - endast 1.7% från medianen
(+) | toppar är linjära (4.6% delta till föregående frekvens)
Totalt 100 - 16 000 Hz
(±) | linjäriteten för det totala ljudet är genomsnittlig (23.4% skillnad mot median)
Jämfört med samma klass
» 85% av alla testade enheter i den här klassen var bättre, 4% liknande, 11% sämre
» Den bästa hade ett delta på 6%, genomsnittet var 18%, sämst var 132%
Jämfört med alla testade enheter
» 70% av alla testade enheter var bättre, 6% liknande, 24% sämre
» Den bästa hade ett delta på 4%, genomsnittet var 24%, sämst var 134%
Apple MacBook 12 (Early 2016) 1.1 GHz ljudanalys
(+) | högtalare kan spela relativt högt (83.6 dB)
Bas 100 - 315 Hz
(±) | reducerad bas - i genomsnitt 11.3% lägre än medianen
(±) | linjäriteten för basen är genomsnittlig (14.2% delta till föregående frekvens)
Mellan 400 - 2000 Hz
(+) | balanserad mellan - endast 2.4% från medianen
(+) | mids är linjära (5.5% delta till föregående frekvens)
Högsta 2 - 16 kHz
(+) | balanserade toppar - endast 2% från medianen
(+) | toppar är linjära (4.5% delta till föregående frekvens)
Totalt 100 - 16 000 Hz
(+) | det totala ljudet är linjärt (10.2% skillnad mot median)
Jämfört med samma klass
» 7% av alla testade enheter i den här klassen var bättre, 2% liknande, 91% sämre
» Den bästa hade ett delta på 5%, genomsnittet var 18%, sämst var 53%
Jämfört med alla testade enheter
» 5% av alla testade enheter var bättre, 1% liknande, 94% sämre
» Den bästa hade ett delta på 4%, genomsnittet var 24%, sämst var 134%
| Av/Standby | |
| Låg belastning | |
| Hög belastning |
|
Förklaring:
min: | |
| Lenovo Legion Y740-17ICH i7-8750H, GeForce RTX 2080 Max-Q, Samsung SSD PM981 MZVLB256HAHQ, IPS, 1920x1080, 17.3" | Asus ROG Strix Scar II GL704GW i7-8750H, GeForce RTX 2070 Mobile, Intel SSD 660p SSDPEKNW512G8, AHVA, 1920x1080, 17.3" | Razer Blade Pro 2017 i7-7820HK, GeForce GTX 1080 Mobile, 2x Samsung SSD PM951 MZVLV256HCHP (RAID 0), IGZO, 3840x2160, 17.3" | MSI GE75 8SG Raider i7-8750H, GeForce RTX 2080 Mobile, Kingston RBUSNS8154P3512GJ, AHVA, 1920x1080, 17.3" | Alienware 17 R5 i7-8750H, GeForce GTX 1070 Mobile, SK hynix PC401 HFS256GD9TNG, TN, 2560x1440, 17.3" | Lenovo Legion Y730-17ICH, i7-8750H i7-8750H, GeForce GTX 1050 Ti Mobile, Toshiba KBG30ZMT128G, IPS, 1920x1080, 17.3" | |
|---|---|---|---|---|---|---|
| Power Consumption | -9% | -42% | 7% | -29% | 41% | |
| Idle Minimum * (Watt) | 20.2 | 19 6% | 31 -53% | 7 65% | 28 -39% | 6.3 69% |
| Idle Average * (Watt) | 27.2 | 22 19% | 36 -32% | 15 45% | 32 -18% | 11 60% |
| Idle Maximum * (Watt) | 28.7 | 29 -1% | 44 -53% | 22 23% | 37 -29% | 11.5 60% |
| Load Average * (Watt) | 90.8 | 102 -12% | 107 -18% | 92 -1% | 112 -23% | 89.8 1% |
| Witcher 3 ultra * (Watt) | 152.1 | 190 -25% | 212 -39% | 207 -36% | 192 -26% | 102 33% |
| Load Maximum * (Watt) | 165.4 | 231 -40% | 258 -56% | 254 -54% | 231 -40% | 130.7 21% |
* ... mindre är bättre
| Lenovo Legion Y740-17ICH i7-8750H, GeForce RTX 2080 Max-Q, 76 Wh | Asus ROG Strix Scar II GL704GW i7-8750H, GeForce RTX 2070 Mobile, 66 Wh | Razer Blade Pro 2017 i7-7820HK, GeForce GTX 1080 Mobile, 99 Wh | MSI GE75 8SG Raider i7-8750H, GeForce RTX 2080 Mobile, 65 Wh | Alienware 17 R5 i7-8750H, GeForce GTX 1070 Mobile, 99 Wh | Lenovo Legion Y730-17ICH, i7-8750H i7-8750H, GeForce GTX 1050 Ti Mobile, 76 Wh | |
|---|---|---|---|---|---|---|
| Batteridrifttid | 22% | 3% | 47% | 13% | 109% | |
| WiFi v1.3 (h) | 3.2 | 3.9 22% | 3.3 3% | 4.7 47% | 3.6 13% | 6.7 109% |
| Reader / Idle (h) | 6.2 | 4.2 | 7.8 | 4.5 | 13.2 | |
| Witcher 3 ultra (h) | 0.9 | 0.8 | ||||
| Load (h) | 1.1 | 1.4 | 0.9 | 1.1 | 0.9 |
För
Emot
Läs den fullständiga versionen av den här recensionen på engelska här.
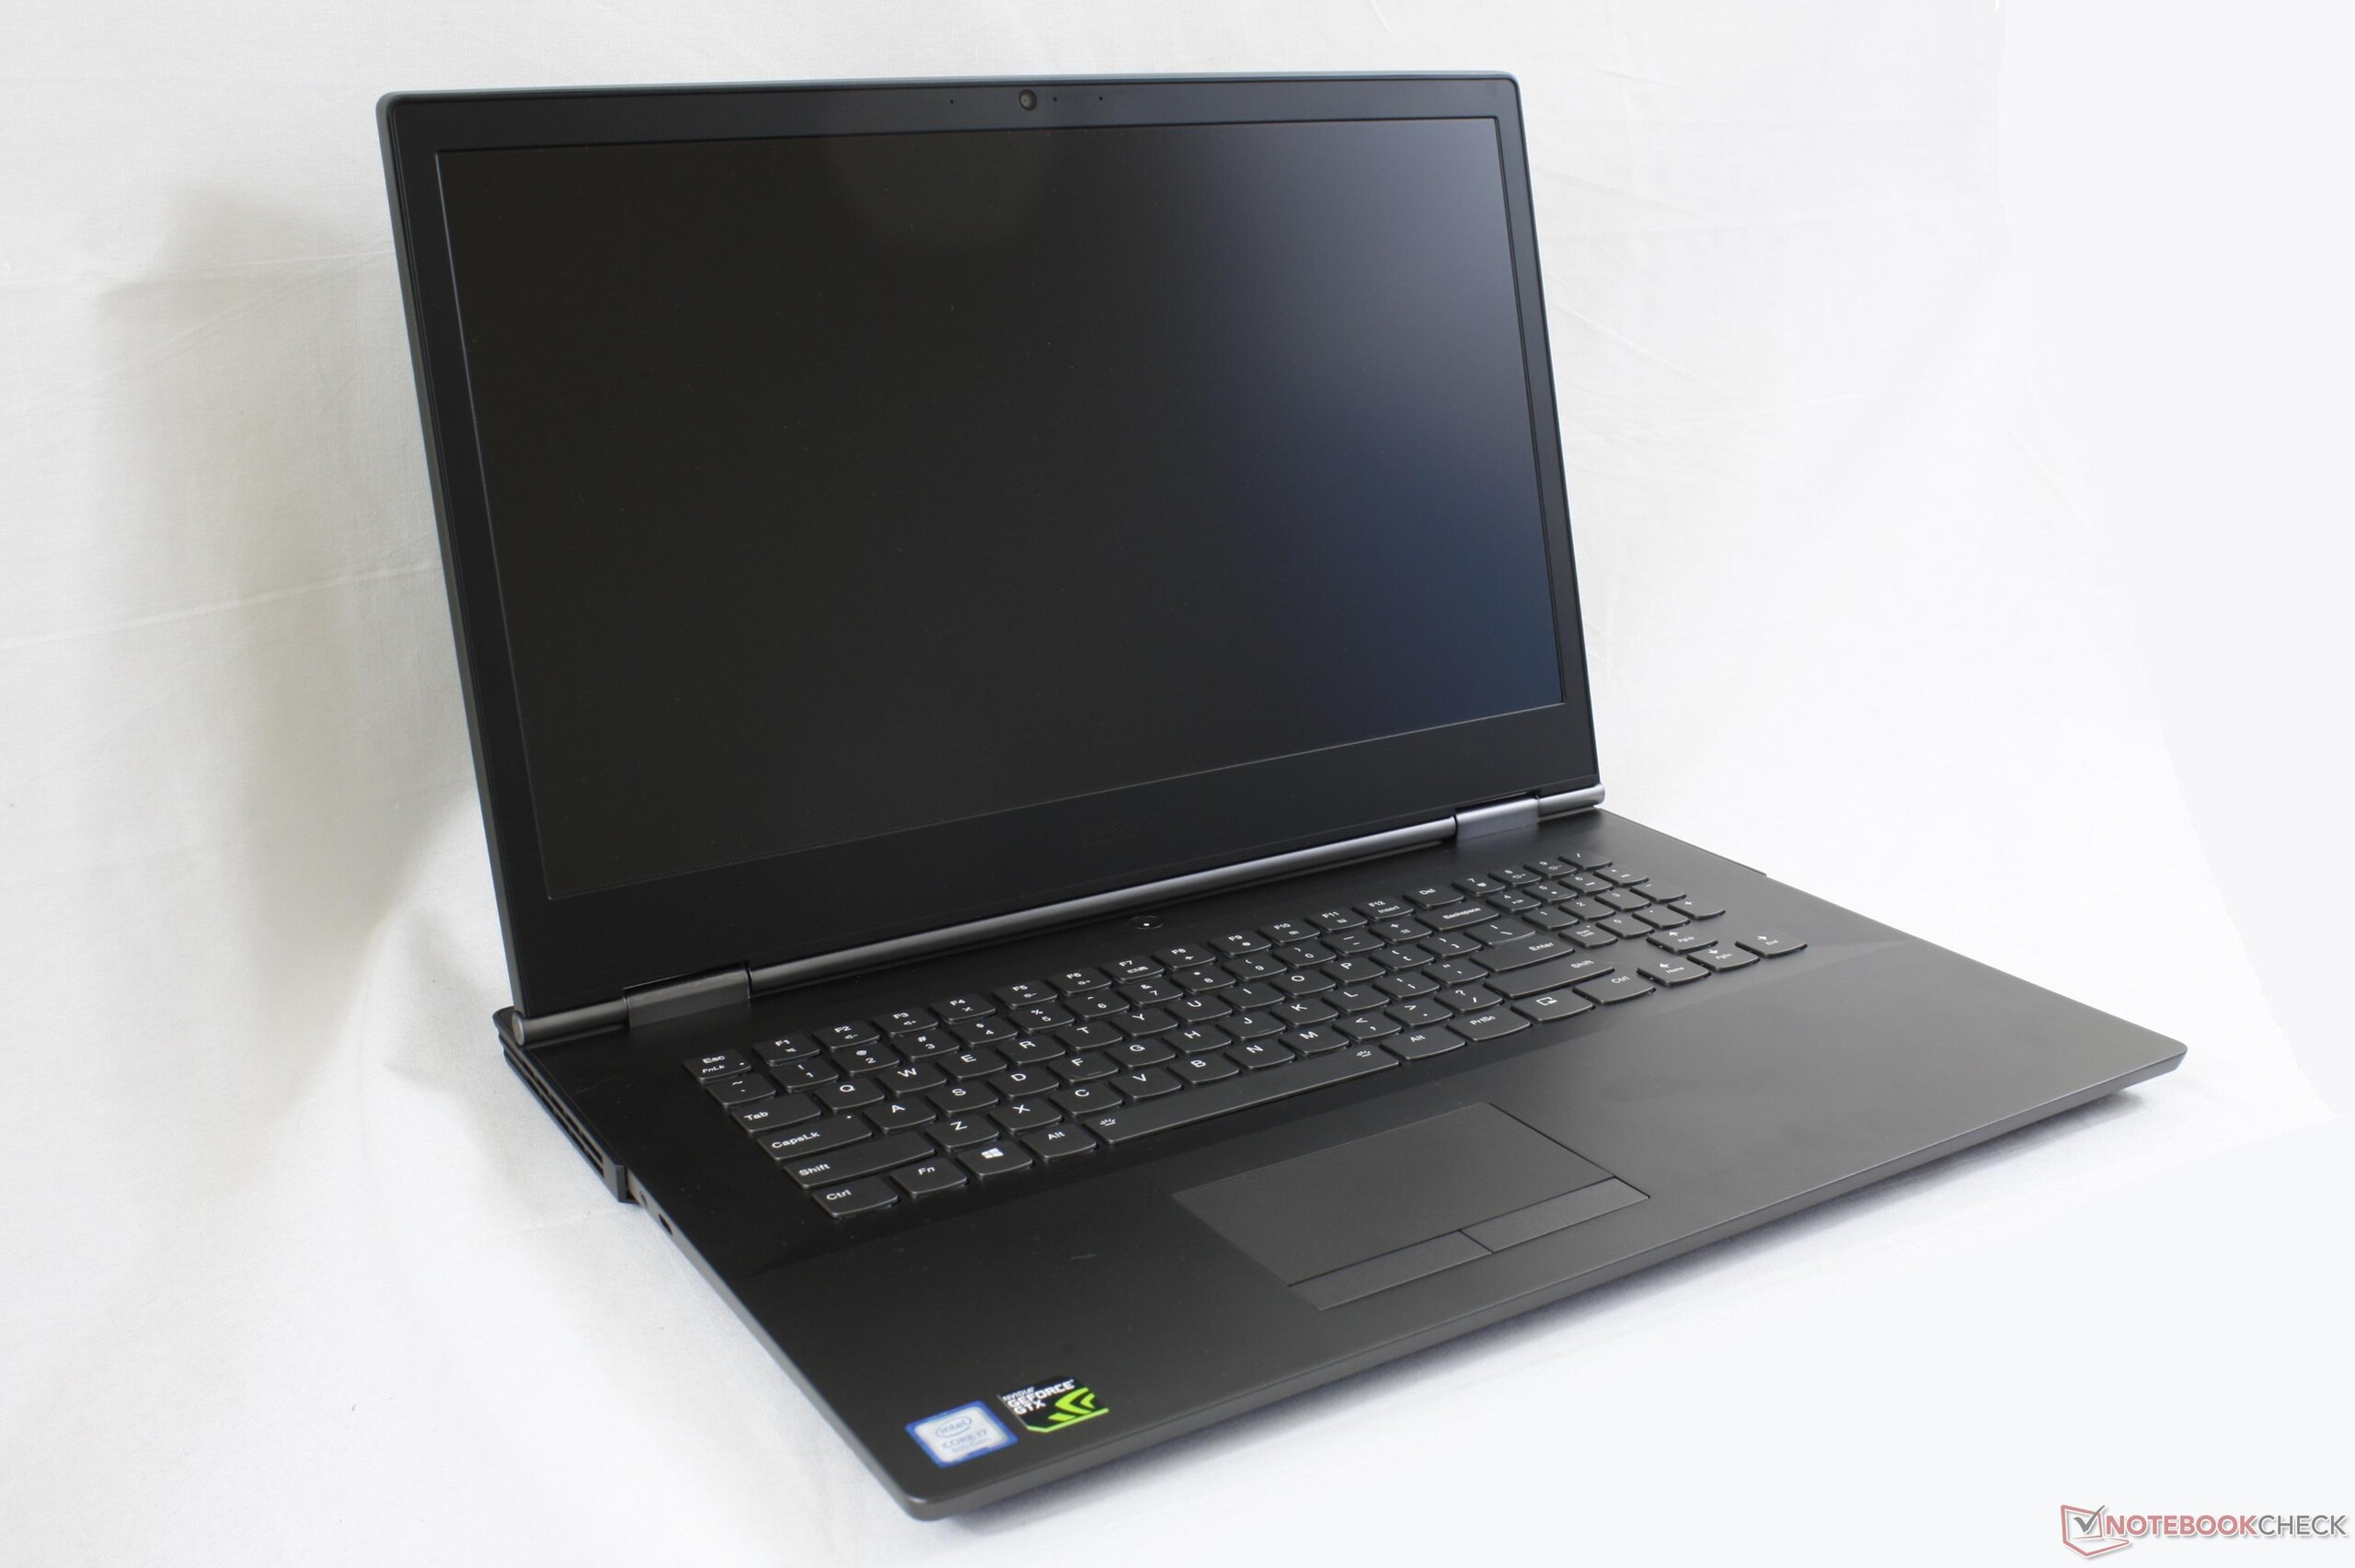
De flesta tillverkare sparar de lyxigare GeForce 80-klassade grafikkorten till sina flaggskeppsmodeller för entusiaster. Legion Y900-familjen brukade tillhöra den kategorin, men Lenovo har satt den serien i vänteläge vilket gör Legion Y700-serien till deras mest avancerade alternativ. Resultatet är en mittenskiktsenhet med en toppskikts-GPU till ett betydligt lägre pris än konkurrerande "super-modeller" som Alienware m17, Asus ROG G703, MSI GT75 eller Acer Triton 700. Denna Lenovo-laptop har samma spelprestanda som entusiast-alternativen men kostar tusentals kronor mindre, i huvudsak på grund av att den har en enklare och mindre eccentrisk design på sitt chassi.
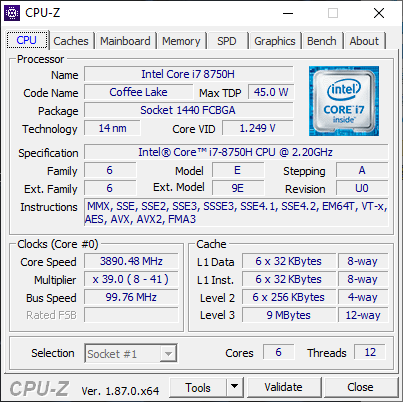
CPU-prestandan är högre än genomsnittet för Core i7-8750H på grund av utmärkt förmåga att upprätthålla Turbo Boost. Både kärntemperaturerna och ljudnivån är lägre än förväntat med tanke på den tunna formfaktorn och den höga prestandan.
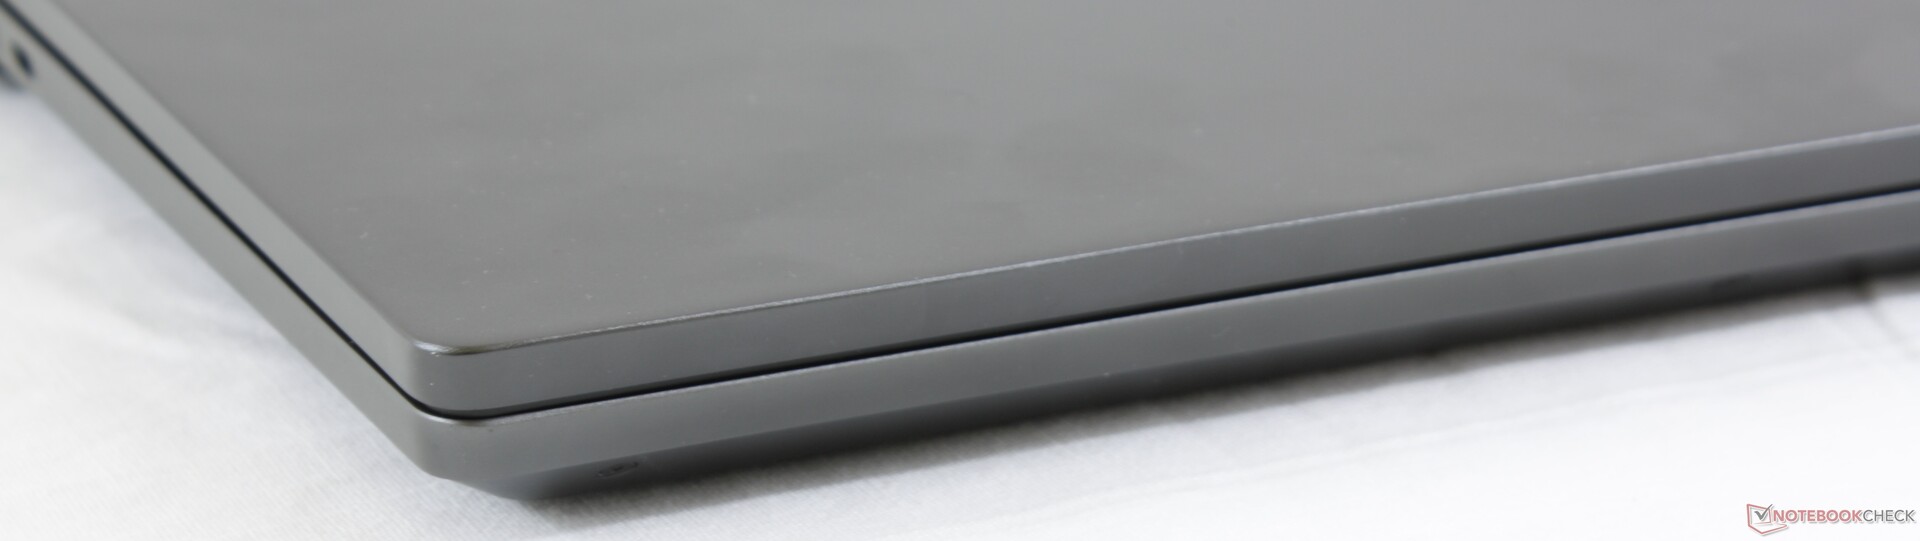
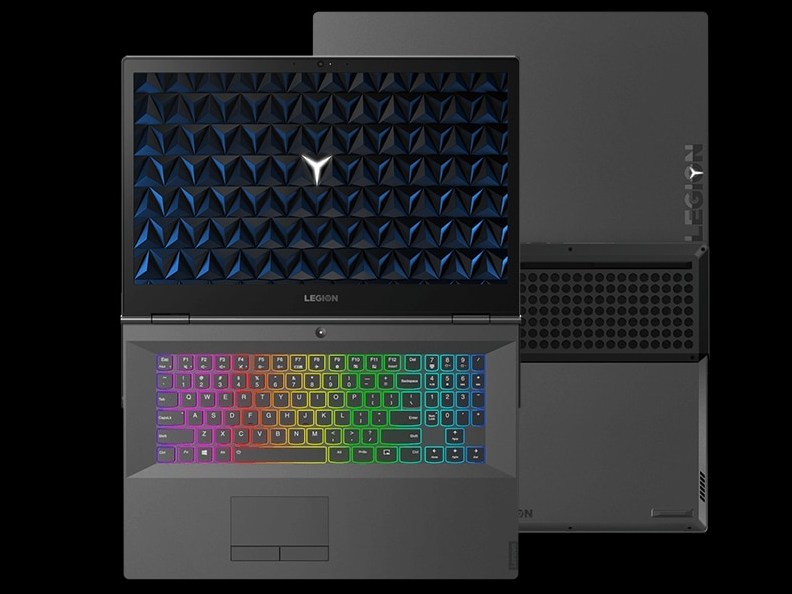
Eftersom Legion Y740 har ett mittenskiktschassi är dock det första intrycket inte lika starkt som hos tidigare nämnda toppskiktsalternativ. Lenovo-modellen är mer benägen att böja sig eller gunga än de robustare (och dyrare) modellerna MSI GT75 eller Asus ROG G703. Vår specifika enhet led också av måttlig till kraftig bleeding och oprecisa färger. Tangentbordets knappar är dessutom mjukare och generellt sett sämre för spel. Gamers kommer inte sakna prestanda, men sämre chassi och knappar kommer ändå begränsa den totala spelupplevelsen.
Mittenskiktsmodellen Legion Y740 säljs för mycket mindre än konkurrerande entusiastmodeller på 17.3 tum samtidigt som den har samma avancerade CPU och GPU. Den är riktigt prisvärd när det kommer till prestanda så länge du inte har några problem med dess anspråkslösa design och ett chassi som böjer sig.
Lenovo Legion Y740-17ICH
- 03/01/2019 v6 (old)
Allen Ngo
Price comparison
