Test: HP Omen 17t (i7-8750H, GTX 1070) Laptop (Sammanfattning)
| SD Card Reader | |
| average JPG Copy Test (av. of 3 runs) | |
| Aorus X9 DT (Toshiba Exceria Pro SDXC 64 GB UHS-II) | |
| Eurocom Q8 (Toshiba Exceria Pro SDXC 64 GB UHS-II) | |
| Genomsnitt av klass Gaming (20.9 - 210, n=54, senaste 2 åren) | |
| HP Omen 17t-3AW55AV_1 (Toshiba Exceria Pro SDXC 64 GB UHS-II) | |
| Acer Predator 17 G9-793-70PJ (Toshiba Exceria Pro SDXC 64 GB UHS-II) | |
| Asus G752VS-BA338T (Toshiba Exceria Pro SDXC 64 GB UHS-II) | |
| MSI GE73 8RF-008 Raider RGB (Toshiba Exceria Pro SDXC 64 GB UHS-II) | |
| maximum AS SSD Seq Read Test (1GB) | |
| Aorus X9 DT (Toshiba Exceria Pro SDXC 64 GB UHS-II) | |
| Eurocom Q8 (Toshiba Exceria Pro SDXC 64 GB UHS-II) | |
| Genomsnitt av klass Gaming (25.5 - 261, n=51, senaste 2 åren) | |
| Acer Predator 17 G9-793-70PJ (Toshiba Exceria Pro SDXC 64 GB UHS-II) | |
| Asus G752VS-BA338T (Toshiba Exceria Pro SDXC 64 GB UHS-II) | |
| HP Omen 17t-3AW55AV_1 (Toshiba Exceria Pro SDXC 64 GB UHS-II) | |
| MSI GE73 8RF-008 Raider RGB (Toshiba Exceria Pro SDXC 64 GB UHS-II) | |
| |||||||||||||||||||||||||
Distribution av ljusstyrkan: 87 %
Mitt på batteriet: 343.6 cd/m²
Kontrast: 1011:1 (Svärta: 0.34 cd/m²)
ΔE ColorChecker Calman: 3.74 | ∀{0.5-29.43 Ø4.71}
calibrated: 3.49
ΔE Greyscale Calman: 3.7 | ∀{0.09-98 Ø4.96}
90% sRGB (Argyll 1.6.3 3D)
58% AdobeRGB 1998 (Argyll 1.6.3 3D)
65.8% AdobeRGB 1998 (Argyll 3D)
90% sRGB (Argyll 3D)
65.4% Display P3 (Argyll 3D)
Gamma: 2.36
CCT: 6388 K
| HP Omen 17t-3AW55AV_1 AU Optronics AUO309D, IPS, 17.3", 1920x1080 | Alienware 17 R4 TN LED, 17.3", 2560x1440 | Acer Predator 17 G9-793-70PJ AU Optronics B173ZAN01.0 (AUO109B), IPS, 17.3", 3840x2160 | Asus G752VS-BA338T AU Optronics B173HAN01.1 (AUO119D), IPS, 17.3", 1920x1080 | Eurocom Q8 AU Optronics B173QTN01.0, Dell P/N WJGD4, TN LED, 17.3", 2560x1440 | EVGA SC17 GTX 1070 Sharp LQ173D1JW31, IPS, 17.3", 3840x2160 | MSI GE73 8RF-008 Raider RGB Chi Mei N173HHE-G32 (CMN1747), TN WLED, 17.3", 1920x1080 | Aorus X9 DT AUO B173HAN03.0 (AUO309D), IPS, 17.3", 1920x1080 | MSI GT75 8RG-090 Titan CMN N173HHE-G32 (CMN1747), TN, 17.3", 1920x1080 | |
|---|---|---|---|---|---|---|---|---|---|
| Display | -7% | 31% | -4% | -10% | 31% | 27% | 2% | 27% | |
| Display P3 Coverage (%) | 65.4 | 61.2 -6% | 86.4 32% | 61.6 -6% | 58.7 -10% | 87.3 33% | 90.8 39% | 66.8 2% | 90.9 39% |
| sRGB Coverage (%) | 90 | 82.9 -8% | 99.9 11% | 90.3 0% | 81 -10% | 100 11% | 99.9 11% | 92.1 2% | 100 11% |
| AdobeRGB 1998 Coverage (%) | 65.8 | 60.5 -8% | 99.1 51% | 62.8 -5% | 58.9 -10% | 98.8 50% | 85.8 30% | 67.3 2% | 86.2 31% |
| Response Times | -49% | -170% | -133% | -7% | -206% | -48% | -13% | 50% | |
| Response Time Grey 50% / Grey 80% * (ms) | 17.6 ? | 30 ? -70% | 50 ? -184% | 36 ? -105% | 21.6 ? -23% | 45.6 ? -159% | 28 ? -59% | 18.4 ? -5% | 8 ? 55% |
| Response Time Black / White * (ms) | 10 ? | 12.8 ? -28% | 25.6 ? -156% | 26 ? -160% | 9 ? 10% | 35.2 ? -252% | 13.6 ? -36% | 12 ? -20% | 5.6 ? 44% |
| PWM Frequency (Hz) | 1042 ? | 25000 ? | 26000 ? | ||||||
| Screen | -26% | 5% | -27% | -69% | -1% | 7% | 19% | 17% | |
| Brightness middle (cd/m²) | 343.6 | 402.3 17% | 343 0% | 307 -11% | 367.9 7% | 399.1 16% | 273 -21% | 280 -19% | 240 -30% |
| Brightness (cd/m²) | 320 | 372 16% | 328 2% | 300 -6% | 346 8% | 360 13% | 273 -15% | 262 -18% | 248 -22% |
| Brightness Distribution (%) | 87 | 86 -1% | 84 -3% | 88 1% | 84 -3% | 81 -7% | 90 3% | 86 -1% | 83 -5% |
| Black Level * (cd/m²) | 0.34 | 0.62 -82% | 0.29 15% | 0.32 6% | 0.55 -62% | 0.4 -18% | 0.26 24% | 0.22 35% | 0.22 35% |
| Contrast (:1) | 1011 | 649 -36% | 1183 17% | 959 -5% | 669 -34% | 998 -1% | 1050 4% | 1273 26% | 1091 8% |
| Colorchecker dE 2000 * | 3.74 | 5.6 -50% | 4.01 -7% | 5.53 -48% | 9.86 -164% | 4.78 -28% | 3.52 6% | 1.78 52% | 2.14 43% |
| Colorchecker dE 2000 max. * | 5.33 | 9.8 -84% | 6.03 -13% | 11.54 -117% | 17.56 -229% | 7.65 -44% | 6.34 -19% | 3.91 27% | 5.04 5% |
| Colorchecker dE 2000 calibrated * | 3.49 | 4.43 -27% | 2.09 40% | 1.54 56% | |||||
| Greyscale dE 2000 * | 3.7 | 4.7 -27% | 4.7 -27% | 7 -89% | 12.4 -235% | 3.8 -3% | 3.11 16% | 0.74 80% | 1.62 56% |
| Gamma | 2.36 93% | 2.14 103% | 2.4 92% | 2.48 89% | 2.09 105% | 2.03 108% | 2.43 91% | 2.43 91% | 2.28 96% |
| CCT | 6388 102% | 7519 86% | 6451 101% | 8103 80% | 11064 59% | 7288 89% | 6999 93% | 6494 100% | 6846 95% |
| Color Space (Percent of AdobeRGB 1998) (%) | 58 | 53.7 -7% | 88 52% | 58 0% | 52.5 -9% | 86.9 50% | 76 31% | 60 3% | 77 33% |
| Color Space (Percent of sRGB) (%) | 90 | 82.2 -9% | 100 11% | 90 0% | 80.5 -11% | 100 11% | 100 11% | 92 2% | 100 11% |
| Totalt genomsnitt (program/inställningar) | -27% /
-26% | -45% /
-13% | -55% /
-36% | -29% /
-50% | -59% /
-22% | -5% /
4% | 3% /
11% | 31% /
23% |
* ... mindre är bättre
Visa svarstider
| ↔ Svarstid svart till vitt | ||
|---|---|---|
| 10 ms ... stiga ↗ och falla ↘ kombinerat | ↗ 4.8 ms stiga | 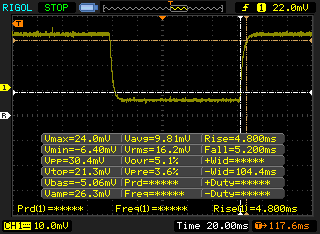 |
| ↘ 5.2 ms hösten | ||
| Skärmen visar bra svarsfrekvens i våra tester, men kan vara för långsam för konkurrenskraftiga spelare. I jämförelse sträcker sig alla testade enheter från 0.1 (minst) till 240 (maximalt) ms. » 27 % av alla enheter är bättre. Det betyder att den uppmätta svarstiden är bättre än genomsnittet av alla testade enheter (19.8 ms). | ||
| ↔ Svarstid 50 % grått till 80 % grått | ||
| 17.6 ms ... stiga ↗ och falla ↘ kombinerat | ↗ 10 ms stiga | 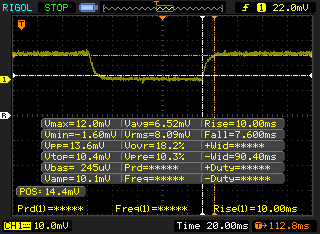 |
| ↘ 7.6 ms hösten | ||
| Skärmen visar bra svarsfrekvens i våra tester, men kan vara för långsam för konkurrenskraftiga spelare. I jämförelse sträcker sig alla testade enheter från 0.165 (minst) till 636 (maximalt) ms. » 32 % av alla enheter är bättre. Det betyder att den uppmätta svarstiden är bättre än genomsnittet av alla testade enheter (30.9 ms). | ||
Skärmflimmer / PWM (Puls-Width Modulation)
| Skärmflimmer / PWM upptäcktes inte | 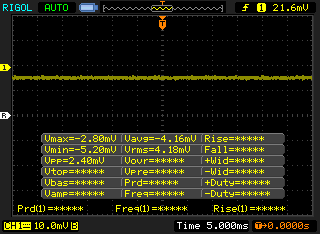 | ||
Som jämförelse: 52 % av alla testade enheter använder inte PWM för att dämpa skärmen. Om PWM upptäcktes mättes ett medelvärde av 7744 (minst: 5 - maximum: 343500) Hz. | |||
| wPrime 2.10 - 1024m | |
| Asus ROG Strix GL702ZC-GC204T | |
| HP Omen X 17-ap0xx | |
| Genomsnitt Intel Core i7-8750H (125.5 - 180.5, n=6) | |
| HP Omen 17t-3AW55AV_1 | |
| Genomsnitt av klass Gaming (33 - 210, n=6, senaste 2 åren) | |
* ... mindre är bättre
| PCMark 8 Home Score Accelerated v2 | 5557 poäng | |
| PCMark 8 Creative Score Accelerated v2 | 8378 poäng | |
| PCMark 8 Work Score Accelerated v2 | 5968 poäng | |
| PCMark 10 Score | 5939 poäng | |
Hjälp | ||
| HP Omen 17t-3AW55AV_1 Samsung SSD PM981 MZVLB512HAJQ | Alienware 17 R4 SK Hynix PC300 NVMe 512 GB | EVGA SC17 GTX 1070 Samsung SM951 MZVPV256 m.2 | Acer Predator 17 G9-793-70PJ Toshiba NVMe THNSN5512GPU7 | Asus G752VS-BA338T Samsung SM961 MZVKW512HMJP m.2 PCI-e | Eurocom Q8 Samsung SSD 960 Pro 512 GB m.2 | MSI GE73 8RF-008 Raider RGB Toshiba HG6 THNSNJ256G8NY | Aorus X9 DT Transcend TS1TMTE850 | Genomsnitt Samsung SSD PM981 MZVLB512HAJQ | |
|---|---|---|---|---|---|---|---|---|---|
| AS SSD | -29% | -4% | -6% | 17% | 12% | -84% | -22% | 8% | |
| Copy Game MB/s (MB/s) | 875 | 574 -34% | 1034 18% | 1217 39% | 958 9% | 295.5 -66% | 1057 ? 21% | ||
| Copy Program MB/s (MB/s) | 481.1 | 446.1 -7% | 470 -2% | 445.1 -7% | 406.7 -15% | 192.9 -60% | 454 ? -6% | ||
| Copy ISO MB/s (MB/s) | 1080 | 1227 14% | 1337 24% | 2145 99% | 1596 48% | 412.5 -62% | 1755 ? 63% | ||
| Score Total (Points) | 4142 | 2072 -50% | 2328 -44% | 2547 -39% | 3056 -26% | 3840 -7% | 881 -79% | 2145 -48% | 3966 ? -4% |
| Score Write (Points) | 2147 | 858 -60% | 487 -77% | 890 -59% | 1480 -31% | 1579 -26% | 254 -88% | 916 -57% | 1780 ? -17% |
| Score Read (Points) | 1304 | 831 -36% | 1238 -5% | 1112 -15% | 1077 -17% | 1515 16% | 417 -68% | 828 -37% | 1451 ? 11% |
| Access Time Write * (ms) | 0.047 | 0.123 -162% | 0.033 30% | 0.033 30% | 0.027 43% | 0.035 26% | 0.097 -106% | 0.038 19% | 0.08337 ? -77% |
| Access Time Read * (ms) | 0.071 | 0.042 41% | 0.049 31% | 0.052 27% | 0.058 18% | 0.043 39% | 0.235 -231% | 0.042 41% | 0.05092 ? 28% |
| 4K-64 Write (MB/s) | 1866 | 671 -64% | 260.9 -86% | 646 -65% | 1185 -36% | 1285 -31% | 172.7 -91% | 715 -62% | 1504 ? -19% |
| 4K-64 Read (MB/s) | 1125 | 620 -45% | 999 -11% | 851 -24% | 744 -34% | 1232 10% | 351.4 -69% | 654 -42% | 1203 ? 7% |
| 4K Write (MB/s) | 84.4 | 113.4 34% | 112.1 33% | 120.8 43% | 138.9 65% | 107.9 28% | 38.34 -55% | 98.9 17% | 112 ? 33% |
| 4K Read (MB/s) | 31.66 | 35.61 12% | 45.64 44% | 37.51 18% | 49.71 57% | 35.57 12% | 14.07 -56% | 22.23 -30% | 50.5 ? 60% |
| Seq Write (MB/s) | 1962 | 735 -63% | 1144 -42% | 1230 -37% | 1554 -21% | 1869 -5% | 425.7 -78% | 1019 -48% | 1637 ? -17% |
| Seq Read (MB/s) | 1473 | 1752 19% | 1934 31% | 2237 52% | 2824 92% | 2481 68% | 511 -65% | 1518 3% | 1976 ? 34% |
* ... mindre är bättre

| 3DMark 11 | |
| 1280x720 Performance GPU | |
| Genomsnitt av klass Gaming (21841 - 80022, n=103, senaste 2 åren) | |
| Aorus X9 DT | |
| Genomsnitt NVIDIA GeForce GTX 1070 Mobile (13760 - 25604, n=58) | |
| HP Omen 17t-3AW55AV_1 | |
| MSI GS73 Stealth 8RF-011 | |
| Asus ROG Strix GL702ZC-GC204T | |
| Schenker XMG Neo 15 | |
| HP Spectre x360 15-ch000 | |
| HP Omen 15-dc0001ng | |
| 1280x720 Performance Combined | |
| Genomsnitt av klass Gaming (10258 - 30851, n=103, senaste 2 åren) | |
| Aorus X9 DT | |
| HP Omen 17t-3AW55AV_1 | |
| MSI GS73 Stealth 8RF-011 | |
| Schenker XMG Neo 15 | |
| Genomsnitt NVIDIA GeForce GTX 1070 Mobile (7137 - 12565, n=58) | |
| HP Spectre x360 15-ch000 | |
| Asus ROG Strix GL702ZC-GC204T | |
| HP Omen 15-dc0001ng | |
| 3DMark | |
| 1280x720 Cloud Gate Standard Graphics | |
| Genomsnitt av klass Gaming (86886 - 223650, n=60, senaste 2 åren) | |
| Aorus X9 DT | |
| HP Omen 17t-3AW55AV_1 | |
| Genomsnitt NVIDIA GeForce GTX 1070 Mobile (64973 - 125922, n=51) | |
| MSI GS73 Stealth 8RF-011 | |
| Schenker XMG Neo 15 | |
| Asus ROG Strix GL702ZC-GC204T | |
| HP Omen 15-dc0001ng | |
| HP Spectre x360 15-ch000 | |
| 1920x1080 Fire Strike Graphics | |
| Genomsnitt av klass Gaming (18629 - 62849, n=112, senaste 2 åren) | |
| Aorus X9 DT | |
| Genomsnitt NVIDIA GeForce GTX 1070 Mobile (15718 - 19059, n=56) | |
| HP Omen 17t-3AW55AV_1 | |
| MSI GS73 Stealth 8RF-011 | |
| Schenker XMG Neo 15 | |
| Asus ROG Strix GL702ZC-GC204T | |
| HP Omen 15-dc0001ng | |
| HP Spectre x360 15-ch000 | |
| 3DMark 11 Performance | 17921 poäng | |
| 3DMark Cloud Gate Standard Score | 37519 poäng | |
| 3DMark Fire Strike Score | 14335 poäng | |
Hjälp | ||
| The Witcher 3 | |
| 1920x1080 High Graphics & Postprocessing (Nvidia HairWorks Off) | |
| Genomsnitt av klass Gaming (341 - 404, n=2, senaste 2 åren) | |
| Aorus X9 DT | |
| Asus G752VS-BA338T | |
| MSI GE73 8RF-008 Raider RGB | |
| Genomsnitt NVIDIA GeForce GTX 1070 Mobile (83 - 123, n=30) | |
| Acer Predator 17 G9-793-70PJ | |
| HP Omen 17t-3AW55AV_1 | |
| 1920x1080 Ultra Graphics & Postprocessing (HBAO+) | |
| Genomsnitt av klass Gaming (104.7 - 240, n=7, senaste 2 åren) | |
| Alienware 17 R4 | |
| Aorus X9 DT | |
| HP Omen X 17-ap0xx | |
| MSI GE73 8RF-008 Raider RGB | |
| Asus G752VS-BA338T | |
| Acer Predator 17 G9-793-70PJ | |
| Genomsnitt NVIDIA GeForce GTX 1070 Mobile (48.2 - 68.4, n=41) | |
| HP Omen 17t-3AW55AV_1 | |
| Eurocom Q8 | |
| Rise of the Tomb Raider | |
| 1920x1080 High Preset AA:FX AF:4x | |
| Asus G752VS-BA338T | |
| Genomsnitt NVIDIA GeForce GTX 1070 Mobile (83.2 - 118.8, n=18) | |
| HP Omen 17t-3AW55AV_1 | |
| 1920x1080 Very High Preset AA:FX AF:16x | |
| Alienware 17 R4 | |
| HP Omen X 17-ap0xx | |
| Asus G752VS-BA338T | |
| EVGA SC17 GTX 1070 | |
| Genomsnitt NVIDIA GeForce GTX 1070 Mobile (79.1 - 102.5, n=25) | |
| HP Omen 17t-3AW55AV_1 | |
| låg | med. | hög | ultra | 4K | |
|---|---|---|---|---|---|
| The Witcher 3 (2015) | 268 | 191 | 83 | 57 | |
| Rise of the Tomb Raider (2016) | 253 | 174 | 103 | 87 | |
| Rocket League (2017) | 250 | 250 | 231 | 173 | |
| Middle-earth: Shadow of War (2017) | 186 | 127 | 98 | 76 | |
| Final Fantasy XV Benchmark (2018) | 140 | 82 | 63 |
Ljudnivå
| Låg belastning |
| 31.1 / 31.1 / 35 dB(A) |
| Hög belastning |
| 42 / 46.5 dB(A) |
 | ||
30 dB tyst 40 dB(A) hörbar 50 dB(A) högt ljud |
||
min: | ||
| HP Omen 17t-3AW55AV_1 GeForce GTX 1070 Mobile, i7-8750H, Samsung SSD PM981 MZVLB512HAJQ | Alienware 17 R4 GeForce GTX 1080 Mobile, i7-7820HK, SK Hynix PC300 NVMe 512 GB | EVGA SC17 GTX 1070 GeForce GTX 1070 Mobile, 6820HK, Samsung SM951 MZVPV256 m.2 | Acer Predator 17 G9-793-70PJ GeForce GTX 1070 Mobile, i7-7700HQ, Toshiba NVMe THNSN5512GPU7 | Asus G752VS-BA338T GeForce GTX 1070 Mobile, i7-7700HQ, Samsung SM961 MZVKW512HMJP m.2 PCI-e | Eurocom Q8 GeForce GTX 1070 Mobile, i9-8950HK, Samsung SSD 960 Pro 512 GB m.2 | MSI GE73 8RF-008 Raider RGB GeForce GTX 1070 Mobile, i7-8750H, Toshiba HG6 THNSNJ256G8NY | Aorus X9 DT GeForce GTX 1080 Mobile, i9-8950HK, Transcend TS1TMTE850 | |
|---|---|---|---|---|---|---|---|---|
| Noise | -10% | -7% | -6% | -2% | -3% | -6% | -21% | |
| av / miljö * (dB) | 27.8 | 28.2 -1% | 29.2 -5% | 31 -12% | 30 -8% | 28 -1% | 30 -8% | 30 -8% |
| Idle Minimum * (dB) | 31.1 | 35.6 -14% | 33.9 -9% | 32 -3% | 30 4% | 28.2 9% | 32 -3% | 36 -16% |
| Idle Average * (dB) | 31.1 | 35.6 -14% | 33.9 -9% | 35 -13% | 32 -3% | 31.8 -2% | 33 -6% | 37 -19% |
| Idle Maximum * (dB) | 35 | 35.7 -2% | 33.9 3% | 38 -9% | 36 -3% | 36.3 -4% | 34 3% | 43 -23% |
| Load Average * (dB) | 42 | 50.2 -20% | 43.8 -4% | 42 -0% | 43 -2% | 46.7 -11% | 41 2% | 50 -19% |
| Witcher 3 ultra * (dB) | 44.5 | 50.2 -13% | 44 1% | 43 3% | 46.9 -5% | 50 -12% | 57 -28% | |
| Load Maximum * (dB) | 46.5 | 50.2 -8% | 53.4 -15% | 50 -8% | 49 -5% | 49.7 -7% | 54 -16% | 61 -31% |
* ... mindre är bättre
(±) Den maximala temperaturen på ovansidan är 44.2 °C / 112 F, jämfört med genomsnittet av 40.4 °C / 105 F , allt från 21.2 till 68.8 °C för klassen Gaming.
(-) Botten värms upp till maximalt 55.8 °C / 132 F, jämfört med genomsnittet av 43.2 °C / 110 F
(+) Vid tomgångsbruk är medeltemperaturen för ovansidan 28.5 °C / 83 F, jämfört med enhetsgenomsnittet på 33.9 °C / ### class_avg_f### F.
(±) När du spelar The Witcher 3 är medeltemperaturen för ovansidan 32.9 °C / 91 F, jämfört med enhetsgenomsnittet på 33.9 °C / ## #class_avg_f### F.
(+) Handledsstöden och pekplattan är kallare än hudtemperaturen med maximalt 28.2 °C / 82.8 F och är därför svala att ta på.
(±) Medeltemperaturen för handledsstödsområdet på liknande enheter var 28.8 °C / 83.8 F (+0.6 °C / 1 F).
| HP Omen 17t-3AW55AV_1 GeForce GTX 1070 Mobile, i7-8750H, Samsung SSD PM981 MZVLB512HAJQ | Alienware 17 R4 GeForce GTX 1080 Mobile, i7-7820HK, SK Hynix PC300 NVMe 512 GB | EVGA SC17 GTX 1070 GeForce GTX 1070 Mobile, 6820HK, Samsung SM951 MZVPV256 m.2 | Acer Predator 17 G9-793-70PJ GeForce GTX 1070 Mobile, i7-7700HQ, Toshiba NVMe THNSN5512GPU7 | Asus G752VS-BA338T GeForce GTX 1070 Mobile, i7-7700HQ, Samsung SM961 MZVKW512HMJP m.2 PCI-e | Eurocom Q8 GeForce GTX 1070 Mobile, i9-8950HK, Samsung SSD 960 Pro 512 GB m.2 | MSI GE73 8RF-008 Raider RGB GeForce GTX 1070 Mobile, i7-8750H, Toshiba HG6 THNSNJ256G8NY | Aorus X9 DT GeForce GTX 1080 Mobile, i9-8950HK, Transcend TS1TMTE850 | |
|---|---|---|---|---|---|---|---|---|
| Heat | 3% | 7% | 19% | 17% | 5% | 2% | 9% | |
| Maximum Upper Side * (°C) | 44.2 | 49.6 -12% | 47.6 -8% | 39.1 12% | 41 7% | 43.4 2% | 47 -6% | 43 3% |
| Maximum Bottom * (°C) | 55.8 | 56 -0% | 53.2 5% | 42.1 25% | 39.3 30% | 44 21% | 49 12% | 55 1% |
| Idle Upper Side * (°C) | 31.6 | 29.6 6% | 28.2 11% | 27.9 12% | 28.8 9% | 32.8 -4% | 32 -1% | 27 15% |
| Idle Bottom * (°C) | 35 | 29.2 17% | 28.6 18% | 26.1 25% | 27.3 22% | 34.2 2% | 34 3% | 29 17% |
* ... mindre är bättre
HP Omen 17t-3AW55AV_1 ljudanalys
(±) | högtalarljudstyrkan är genomsnittlig men bra (72.8 dB)
Bas 100 - 315 Hz
(-) | nästan ingen bas - i genomsnitt 17.6% lägre än medianen
(±) | linjäriteten för basen är genomsnittlig (14.3% delta till föregående frekvens)
Mellan 400 - 2000 Hz
(+) | balanserad mellan - endast 2% från medianen
(+) | mids är linjära (5.2% delta till föregående frekvens)
Högsta 2 - 16 kHz
(+) | balanserade toppar - endast 2.4% från medianen
(+) | toppar är linjära (6.5% delta till föregående frekvens)
Totalt 100 - 16 000 Hz
(±) | linjäriteten för det totala ljudet är genomsnittlig (16% skillnad mot median)
Jämfört med samma klass
» 39% av alla testade enheter i den här klassen var bättre, 6% liknande, 55% sämre
» Den bästa hade ett delta på 6%, genomsnittet var 18%, sämst var 132%
Jämfört med alla testade enheter
» 25% av alla testade enheter var bättre, 5% liknande, 69% sämre
» Den bästa hade ett delta på 4%, genomsnittet var 23%, sämst var 134%
MSI GE73 8RF-008 Raider RGB ljudanalys
(+) | högtalare kan spela relativt högt (93 dB)
Bas 100 - 315 Hz
(±) | reducerad bas - i genomsnitt 7% lägre än medianen
(±) | linjäriteten för basen är genomsnittlig (8.1% delta till föregående frekvens)
Mellan 400 - 2000 Hz
(+) | balanserad mellan - endast 4.8% från medianen
(±) | linjäriteten för mids är genomsnittlig (7.1% delta till föregående frekvens)
Högsta 2 - 16 kHz
(+) | balanserade toppar - endast 3.6% från medianen
(+) | toppar är linjära (4.6% delta till föregående frekvens)
Totalt 100 - 16 000 Hz
(+) | det totala ljudet är linjärt (10.2% skillnad mot median)
Jämfört med samma klass
» 5% av alla testade enheter i den här klassen var bättre, 2% liknande, 93% sämre
» Den bästa hade ett delta på 6%, genomsnittet var 18%, sämst var 132%
Jämfört med alla testade enheter
» 5% av alla testade enheter var bättre, 1% liknande, 94% sämre
» Den bästa hade ett delta på 4%, genomsnittet var 23%, sämst var 134%
| Av/Standby | |
| Låg belastning | |
| Hög belastning |
|
Förklaring:
min: | |
| HP Omen 17t-3AW55AV_1 i7-8750H, GeForce GTX 1070 Mobile, Samsung SSD PM981 MZVLB512HAJQ, IPS, 1920x1080, 17.3" | EVGA SC17 GTX 1070 6820HK, GeForce GTX 1070 Mobile, Samsung SM951 MZVPV256 m.2, IPS, 3840x2160, 17.3" | Acer Predator 17 G9-793-70PJ i7-7700HQ, GeForce GTX 1070 Mobile, Toshiba NVMe THNSN5512GPU7, IPS, 3840x2160, 17.3" | Asus G752VS-BA338T i7-7700HQ, GeForce GTX 1070 Mobile, Samsung SM961 MZVKW512HMJP m.2 PCI-e, IPS, 1920x1080, 17.3" | Eurocom Q8 i9-8950HK, GeForce GTX 1070 Mobile, Samsung SSD 960 Pro 512 GB m.2, TN LED, 2560x1440, 17.3" | MSI GE73 8RF-008 Raider RGB i7-8750H, GeForce GTX 1070 Mobile, Toshiba HG6 THNSNJ256G8NY, TN WLED, 1920x1080, 17.3" | Alienware 17 R4 i7-7820HK, GeForce GTX 1080 Mobile, SK Hynix PC300 NVMe 512 GB, TN LED, 2560x1440, 17.3" | HP Omen X 17-ap0xx i7-7820HK, GeForce GTX 1080 Mobile, Samsung PM961 MZVLW256HEHP, IPS, 1920x1080, 17.3" | |
|---|---|---|---|---|---|---|---|---|
| Power Consumption | -37% | -19% | -4% | -10% | 2% | -44% | -8% | |
| Idle Minimum * (Watt) | 17.8 | 27.3 -53% | 23 -29% | 21 -18% | 26.3 -48% | 15 16% | 37.5 -111% | 21.6 -21% |
| Idle Average * (Watt) | 24.7 | 34.9 -41% | 33 -34% | 27 -9% | 29 -17% | 20 19% | 37.6 -52% | 26.4 -7% |
| Idle Maximum * (Watt) | 29.6 | 37.6 -27% | 40 -35% | 32 -8% | 32.3 -9% | 26 12% | 37.6 -27% | 26.6 10% |
| Load Average * (Watt) | 110 | 164.4 -49% | 94 15% | 86 22% | 82.4 25% | 97 12% | 122.4 -11% | 95.6 13% |
| Witcher 3 ultra * (Watt) | 167.8 | 177 -5% | 165 2% | 192 -14% | 186 -11% | 180.3 -7% | 221.7 -32% | |
| Load Maximum * (Watt) | 178.6 | 202.5 -13% | 228 -28% | 206 -15% | 170.2 5% | 239 -34% | 277.4 -55% | 199.6 -12% |
* ... mindre är bättre
| HP Omen 17t-3AW55AV_1 i7-8750H, GeForce GTX 1070 Mobile, 86 Wh | EVGA SC17 GTX 1070 6820HK, GeForce GTX 1070 Mobile, 74.48 Wh | Acer Predator 17 G9-793-70PJ i7-7700HQ, GeForce GTX 1070 Mobile, 88 Wh | Asus G752VS-BA338T i7-7700HQ, GeForce GTX 1070 Mobile, 90 Wh | Eurocom Q8 i9-8950HK, GeForce GTX 1070 Mobile, 66 Wh | MSI GE73 8RF-008 Raider RGB i7-8750H, GeForce GTX 1070 Mobile, 51 Wh | Alienware 17 R4 i7-7820HK, GeForce GTX 1080 Mobile, 99 Wh | HP Omen X 17-ap0xx i7-7820HK, GeForce GTX 1080 Mobile, 99 Wh | Aorus X9 DT i9-8950HK, GeForce GTX 1080 Mobile, 94.24 Wh | |
|---|---|---|---|---|---|---|---|---|---|
| Batteridrifttid | -30% | 0% | 27% | -38% | -25% | -17% | 29% | -17% | |
| Reader / Idle (h) | 4.5 | 4 -11% | 5.4 20% | 7.4 64% | 5.1 13% | 4.6 2% | 5.8 29% | 4.2 -7% | |
| WiFi v1.3 (h) | 4.2 | 2.7 -36% | 3.6 -14% | 4.9 17% | 2.6 -38% | 3.1 -26% | 3 -29% | 5.6 33% | 3.2 -24% |
| Load (h) | 1.6 | 0.9 -44% | 1.5 -6% | 1.6 0% | 0.6 -63% | 1.2 -25% | 2 25% | 1.3 -19% |
För
Emot

Läs den fullständiga versionen av den här recensionen på engelska här.
Berättelsen om Omen 17t handlar om balans. Maskinens komponenter kompletterar varandra väl, vilket resulterar i ett totalt sett utmärkt paket med väldigt lite att klaga på. Skärmen är ljusstark och har bra färgåtergivning. Dess kraftfulla CPU och GPU är fintjusterade för spel i FullHD. Tangentbordet och konstruktionskvaliteten är utmärkta och portutbudet är omfattande. Dessutom ligger både värmehantering och fläktljud över genomsnittet i den här kategorin.
Den utmärkande egenskapen är 144 Hz-skärmen. Skärmar med hög bilduppdatering, vilket tidigare var förbehållet dyrare laptops, börjar så sakteliga ta sig över till billigare enheter och Omen 17t är ett utmärkt exempel på den kvalitet som går att få på den här prisnivån. Även om Omen 17t inte på något sätt är en "budgetlaptop" är den mer aggressivt prissatt än de flesta av sina konkurrenter, särskilt jämfört med dem som har en skärm med hög bilduppdatering.
Omen 17t har några svagheter. I synnerhet är batteritiden dålig (på grund av att Optimus saknas) och högtalarna är motbjudande (tack vare ett obehagligt skramlande vid hög volym). Dessutom beter sig dess Samsung PM981-bootenhet underligt, men det kan vara specifikt för vår enhet. HP har dessutom gjort ett misstag i att inte använda det extra utrymmet som blev över när den optiska enheten togs bort. Ingen av dessa nackdelar är dock kritisk för en spellaptop.
För att summera, HP Omen 17t är ett välbyggt paket som har en genomtänkt design. 144 Hz-skärmen är en trevlig egenskap för det här prisskiktet och de interna komponenterna kan (i huvudsak) dra nytta av den högre bilduppdateringen och G-Sync. Omen 17t är ett bra exempel på en en allt-i-allo-enhet som även bemästrar en del saker, och dess konkurrensmässiga pris gör den värd att överväga.
HP Omen 17t-3AW55AV_1
- 08/21/2018 v6 (old)
Sam Medley
Price comparison
