Test: Asus TUF Gaming FX705DT (Ryzen 5 3550H, GTX 1650, SSD, FHD) Laptop (Sammanfattning)
| |||||||||||||||||||||||||
Distribution av ljusstyrkan: 84 %
Mitt på batteriet: 316 cd/m²
Kontrast: 988:1 (Svärta: 0.32 cd/m²)
ΔE ColorChecker Calman: 3.39 | ∀{0.5-29.43 Ø4.71}
calibrated: 2.14
ΔE Greyscale Calman: 3.17 | ∀{0.09-98 Ø4.96}
89% sRGB (Argyll 1.6.3 3D)
51% AdobeRGB 1998 (Argyll 1.6.3 3D)
63.7% AdobeRGB 1998 (Argyll 3D)
89.1% sRGB (Argyll 3D)
62.3% Display P3 (Argyll 3D)
Gamma: 2.39
CCT: 7098 K
| Asus TUF FX705DT-AU068T IPS, 1920x1080, 17.3" | Asus TUF FX705DY-AU072 IPS, 1920x1080, 17.3" | MSI GF75 8RD-001 IPS, 1920x1080, 17.3" | Lenovo Legion Y730-17ICH, i7-8750H IPS, 1920x1080, 17.3" | Acer Predator Helios 300 PH317-52-51M6 IPS, 1920x1080, 17.3" | Asus TUF FX705GE-EW096T IPS, 1920x1080, 17.3" | Asus TUF FX705GM IPS, 1920x1080, 17.3" | Dell G3 17 3779 IPS, 1920x1080, 17.3" | |
|---|---|---|---|---|---|---|---|---|
| Display | 2% | -0% | 1% | -1% | 0% | 2% | ||
| Display P3 Coverage (%) | 62.3 | 64 3% | 66.4 7% | 67.1 8% | 63.1 1% | 62.4 0% | 63.9 3% | |
| sRGB Coverage (%) | 89.1 | 90.1 1% | 84.9 -5% | 86.1 -3% | 86.8 -3% | 88.8 0% | 89.8 1% | |
| AdobeRGB 1998 Coverage (%) | 63.7 | 65.2 2% | 62.1 -3% | 63 -1% | 63.5 0% | 63.8 0% | 64.9 2% | |
| Response Times | 6% | 7% | 15% | 20% | 6% | 75% | 10% | |
| Response Time Grey 50% / Grey 80% * (ms) | 41 ? | 40 ? 2% | 38 ? 7% | 36.8 ? 10% | 36 ? 12% | 39 ? 5% | 7.4 ? 82% | 38 ? 7% |
| Response Time Black / White * (ms) | 30 ? | 27 ? 10% | 28 ? 7% | 24 ? 20% | 22 ? 27% | 28 ? 7% | 10 ? 67% | 26 ? 13% |
| PWM Frequency (Hz) | 122000 ? | |||||||
| Screen | 5% | 14% | -29% | -30% | 4% | 13% | -14% | |
| Brightness middle (cd/m²) | 316 | 322 2% | 356 13% | 328.7 4% | 365 16% | 299 -5% | 234 -26% | 323 2% |
| Brightness (cd/m²) | 294 | 303 3% | 332 13% | 318 8% | 341 16% | 291 -1% | 228 -22% | 306 4% |
| Brightness Distribution (%) | 84 | 84 0% | 89 6% | 91 8% | 89 6% | 90 7% | 85 1% | 89 6% |
| Black Level * (cd/m²) | 0.32 | 0.32 -0% | 0.27 16% | 0.51 -59% | 0.32 -0% | 0.28 12% | 0.2 37% | 0.31 3% |
| Contrast (:1) | 988 | 1006 2% | 1319 34% | 645 -35% | 1141 15% | 1068 8% | 1170 18% | 1042 5% |
| Colorchecker dE 2000 * | 3.39 | 2.97 12% | 2.73 19% | 4.91 -45% | 6.51 -92% | 3.02 11% | 2.16 36% | 4.96 -46% |
| Colorchecker dE 2000 max. * | 5.56 | 5.08 9% | 4.7 15% | 10.15 -83% | 12.32 -122% | 5.27 5% | 3.39 39% | 8.25 -48% |
| Colorchecker dE 2000 calibrated * | 2.14 | 2.29 -7% | 2.14 -0% | 4.27 -100% | 2.9 -36% | 2.76 -29% | 2.02 6% | |
| Greyscale dE 2000 * | 3.17 | 2.26 29% | 2.38 25% | 3.9 -23% | 7.65 -141% | 2.18 31% | 2 37% | 5.65 -78% |
| Gamma | 2.39 92% | 2.45 90% | 2.48 89% | 2.13 103% | 2.64 83% | 2.48 89% | 2.46 89% | 2.24 98% |
| CCT | 7098 92% | 6892 94% | 6643 98% | 6911 94% | 8066 81% | 6392 102% | 6394 102% | 7441 87% |
| Color Space (Percent of AdobeRGB 1998) (%) | 51 | 57 12% | 59 16% | 55.6 9% | 56 10% | 57 12% | 58 14% | 58 14% |
| Color Space (Percent of sRGB) (%) | 89 | 87 -2% | 90 1% | 84.7 -5% | 86 -3% | 87 -2% | 89 0% | 90 1% |
| Totalt genomsnitt (program/inställningar) | 6% /
6% | 8% /
11% | -5% /
-18% | -3% /
-18% | 3% /
4% | 29% /
18% | -1% /
-7% |
* ... mindre är bättre
Visa svarstider
| ↔ Svarstid svart till vitt | ||
|---|---|---|
| 30 ms ... stiga ↗ och falla ↘ kombinerat | ↗ 16 ms stiga | 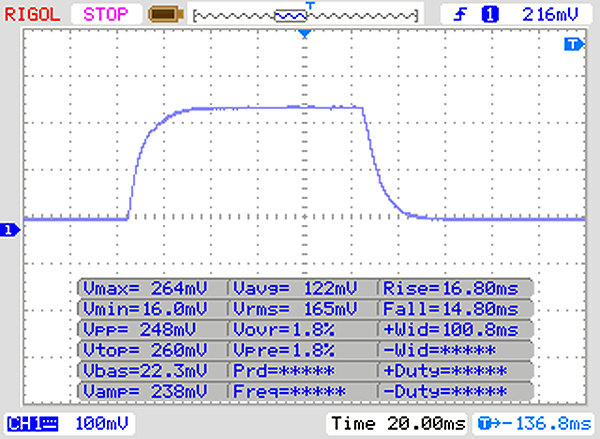 |
| ↘ 14 ms hösten | ||
| Skärmen visar långsamma svarsfrekvenser i våra tester och kommer att vara otillfredsställande för spelare. I jämförelse sträcker sig alla testade enheter från 0.1 (minst) till 240 (maximalt) ms. » 80 % av alla enheter är bättre. Detta innebär att den uppmätta svarstiden är sämre än genomsnittet av alla testade enheter (19.8 ms). | ||
| ↔ Svarstid 50 % grått till 80 % grått | ||
| 41 ms ... stiga ↗ och falla ↘ kombinerat | ↗ 20 ms stiga | 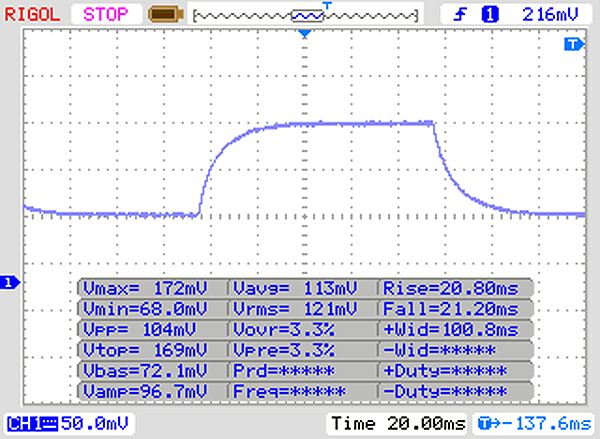 |
| ↘ 21 ms hösten | ||
| Skärmen visar långsamma svarsfrekvenser i våra tester och kommer att vara otillfredsställande för spelare. I jämförelse sträcker sig alla testade enheter från 0.165 (minst) till 636 (maximalt) ms. » 65 % av alla enheter är bättre. Detta innebär att den uppmätta svarstiden är sämre än genomsnittet av alla testade enheter (30.9 ms). | ||
Skärmflimmer / PWM (Puls-Width Modulation)
| Skärmflimmer / PWM upptäcktes inte | 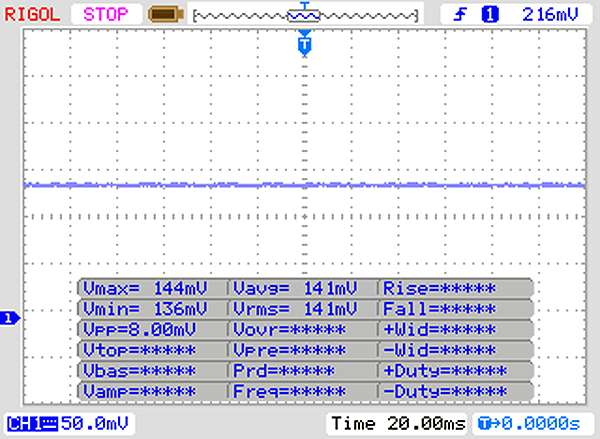 | ||
Som jämförelse: 52 % av alla testade enheter använder inte PWM för att dämpa skärmen. Om PWM upptäcktes mättes ett medelvärde av 7748 (minst: 5 - maximum: 343500) Hz. | |||
| Geekbench 3 | |
| 32 Bit Multi-Core Score | |
| Asus TUF FX705GE-EW096T | |
| Asus TUF FX705DY-AU072 | |
| Genomsnitt AMD Ryzen 5 3550H (13474 - 15114, n=3) | |
| Asus TUF FX705DT-AU068T | |
| 32 Bit Single-Core Score | |
| Asus TUF FX705GE-EW096T | |
| Genomsnitt AMD Ryzen 5 3550H (3348 - 3558, n=3) | |
| Asus TUF FX705DY-AU072 | |
| Asus TUF FX705DT-AU068T | |
| Mozilla Kraken 1.1 - Total | |
| Asus TUF FX705DY-AU072 (Edge 44) | |
| Asus TUF FX705DT-AU068T (Edge 44) | |
| Dell G3 17 3779 (Edge 42.17134.1.0) | |
| Genomsnitt AMD Ryzen 5 3550H (1042 - 1229, n=8) | |
| MSI GF75 8RD-001 | |
| Genomsnitt av klass Gaming (391 - 590, n=101, senaste 2 åren) | |
| Octane V2 - Total Score | |
| Genomsnitt av klass Gaming (93292 - 139447, n=27, senaste 2 åren) | |
| Dell G3 17 3779 (Edge 42.17134.1.0) | |
| Asus TUF FX705DY-AU072 (Edge 44) | |
| Genomsnitt AMD Ryzen 5 3550H (28324 - 29361, n=4) | |
| Asus TUF FX705DT-AU068T (Edge 44) | |
| Speedometer 2.0 - Result 2.0 | |
| Genomsnitt av klass Gaming (29 - 736, n=27, senaste 2 åren) | |
| Asus TUF FX705DY-AU072 (Edge 44) | |
| Genomsnitt AMD Ryzen 5 3550H (42.1 - 43.5, n=2) | |
| Asus TUF FX705DT-AU068T (Edge 44) | |
| JetStream 1.1 - 1.1 Total | |
| Genomsnitt av klass Gaming (549 - 647, n=3, senaste 2 åren) | |
| Asus TUF FX705GE-EW096T (Edge 44) | |
| Dell G3 17 3779 (Edge 42.17134.1.0) | |
| Genomsnitt AMD Ryzen 5 3550H (190.9 - 210, n=4) | |
| Asus TUF FX705DT-AU068T (Edge 44) | |
* ... mindre är bättre
| PCMark 7 Score | 6405 poäng | |
| PCMark 8 Home Score Accelerated v2 | 4593 poäng | |
| PCMark 8 Creative Score Accelerated v2 | 3628 poäng | |
| PCMark 8 Work Score Accelerated v2 | 4898 poäng | |
| PCMark 10 Score | 4339 poäng | |
Hjälp | ||

| Asus TUF FX705DT-AU068T WDC PC SN520 SDAPNUW-256G | MSI GF75 8RD-001 Kingston RBUSNS8154P3256GJ1 | Lenovo Legion Y730-17ICH, i7-8750H Toshiba KBG30ZMT128G | Acer Predator Helios 300 PH317-52-51M6 Hynix HFS128G39TND | Asus TUF FX705DY-AU072 Kingston RBUSNS8154P3512GJ | Asus TUF FX705GE-EW096T SK hynix BC501 HFM128GDJTNG-831 | Asus TUF FX705GM WDC PC SN520 SDAPNUW-256G | Dell G3 17 3779 SK hynix SC311 SATA | Genomsnitt WDC PC SN520 SDAPNUW-256G | |
|---|---|---|---|---|---|---|---|---|---|
| CrystalDiskMark 5.2 / 6 | -23% | -56% | -63% | -10% | -36% | -4% | -60% | -5% | |
| Write 4K (MB/s) | 145 | 72.1 -50% | 71.4 -51% | 61.9 -57% | 107.7 -26% | 90.3 -38% | 104.2 -28% | 62.8 -57% | 118.5 ? -18% |
| Read 4K (MB/s) | 45.28 | 28.12 -38% | 29.98 -34% | 22.78 -50% | 36.5 -19% | 37.03 -18% | 41.46 -8% | 24.63 -46% | 42 ? -7% |
| Write Seq (MB/s) | 1301 | 746 -43% | 129.6 -90% | 136.1 -90% | 988 -24% | 320.3 -75% | 1295 0% | 203.9 -84% | 1123 ? -14% |
| Read Seq (MB/s) | 1362 | 834 -39% | 843 -38% | 490.1 -64% | 1115 -18% | 1012 -26% | 1325 -3% | 550 -60% | 1208 ? -11% |
| Write 4K Q32T1 (MB/s) | 249.1 | 313.7 26% | 88.9 -64% | 136.2 -45% | 334.9 34% | 196.8 -21% | 282.8 14% | 160.1 -36% | 324 ? 30% |
| Read 4K Q32T1 (MB/s) | 342.1 | 348.7 2% | 196.4 -43% | 208.4 -39% | 360.8 5% | 271.5 -21% | 321.3 -6% | 184.3 -46% | 322 ? -6% |
| Write Seq Q32T1 (MB/s) | 1301 | 854 -34% | 130.5 -90% | 136 -90% | 1008 -23% | 268.8 -79% | 1301 0% | 235 -82% | 1091 ? -16% |
| Read Seq Q32T1 (MB/s) | 1732 | 1587 -8% | 1037 -40% | 553 -68% | 1609 -7% | 1595 -8% | 1704 -2% | 554 -68% | 1729 ? 0% |
| 3DMark 05 Standard | 24001 poäng | |
| 3DMark 06 Standard Score | 23061 poäng | |
| 3DMark Vantage P Result | 27719 poäng | |
| 3DMark 11 Performance | 10635 poäng | |
| 3DMark Ice Storm Standard Score | 58789 poäng | |
| 3DMark Cloud Gate Standard Score | 16079 poäng | |
| 3DMark Fire Strike Score | 7942 poäng | |
| 3DMark Time Spy Score | 3437 poäng | |
Hjälp | ||
| 3DMark 11 - 1280x720 Performance GPU | |
| Genomsnitt av klass Gaming (21841 - 80022, n=105, senaste 2 åren) | |
| Asus GL704GM-DH74 | |
| Lenovo Legion Y530-15ICH | |
| Asus TUF FX705GM | |
| Asus TUF FX705DT-AU068T (Dual-Channel) | |
| Asus TUF FX705DT-AU068T | |
| Acer Aspire Nitro 5 AN515-54-53Z2 | |
| Acer Nitro 5 | |
| Genomsnitt NVIDIA GeForce GTX 1650 Mobile (10885 - 13575, n=30) | |
| Asus TUF FX705GE-EW096T | |
| Acer Predator Helios 300 PH317-52-51M6 | |
| MSI GF75 8RD-001 | |
| Asus TUF FX705DY-AU072 | |
| Dell G3 17 3779 | |
| låg | med. | hög | ultra | |
|---|---|---|---|---|
| StarCraft 2 (2010) | 267.9 | 125 | 123.7 | 102.2 |
| Diablo III (2012) | 139.5 | 123.7 | 122.9 | 103.3 |
| Counter-Strike: GO (2012) | 200.8 | 182.6 | 162.1 | 130 |
| BioShock Infinite (2013) | 184.2 | 160 | 149 | 77 |
| Middle-earth: Shadow of Mordor (2014) | 136 | 123.1 | 84.2 | 69.3 |
| GTA V (2015) | 99.1 | 93.6 | 67.7 | 38.2 |
| The Witcher 3 (2015) | 134.9 | 97.9 | 59.1 | 33.3 |
| Batman: Arkham Knight (2015) | 90 | 86 | 68 | 45 |
| Dota 2 Reborn (2015) | 75.8 | 69.1 | 63.3 | 58.5 |
| World of Warships (2015) | 124.7 | 105.9 | 84.6 | 84.2 |
| Ashes of the Singularity (2016) | 46.4 | 40.6 | 36.5 | |
| Civilization 6 (2016) | 111.4 | 83 | 59.4 | 53.7 |
| Team Fortress 2 (2017) | 92 | 85 | 77 | 75 |
| Destiny 2 (2017) | 85.4 | 75.1 | 72.7 | 62.4 |
| Final Fantasy XV Benchmark (2018) | 67 | 47.7 | 33.6 | |
| X-Plane 11.11 (2018) | 56.9 | 50.5 | 44.5 | |
| World of Tanks enCore (2018) | 256.5 | 131.6 | 69.5 | |
| Far Cry 5 (2018) | 64 | 48 | 49 | 44 |
| Forza Horizon 4 (2018) | 84 | 64 | 65 | 48 |
| Assassin´s Creed Odyssey (2018) | 45 | 38 | 35 | 22 |
| Darksiders III (2018) | 96.8 | 64.8 | 57.4 | 52.3 |
| Far Cry New Dawn (2019) | 59 | 47 | 44 | 40 |
| Metro Exodus (2019) | 67.7 | 40.5 | 30.4 | 24.9 |
| Dirt Rally 2.0 (2019) | 145.7 | 81.4 | 68.9 | 42.1 |
| The Division 2 (2019) | 81 | 54 | 46 | 35 |
| Anno 1800 (2019) | 49.2 | 45.2 | 38 | 21.7 |
| The Witcher 3 - 1920x1080 Ultra Graphics & Postprocessing (HBAO+) | |
| Genomsnitt av klass Gaming (104.7 - 240, n=7, senaste 2 åren) | |
| MSI GF75 8RD-001 | |
| Asus TUF FX705GM | |
| Genomsnitt NVIDIA GeForce GTX 1650 Mobile (29.9 - 40.3, n=31) | |
| Acer Nitro 5 | |
| Acer Aspire Nitro 5 AN515-54-53Z2 | |
| Asus TUF FX705DT-AU068T (Dual-Channel) | |
| Asus TUF FX705DT-AU068T | |
| Acer Predator Helios 300 PH317-52-51M6 | |
| Lenovo Legion Y730-17ICH, i7-8750H | |
| Asus TUF FX705GE-EW096T | |
| Asus TUF FX705DY-AU072 | |
| Dell G3 17 3779 | |
| BioShock Infinite - 1920x1080 Ultra Preset, DX11 (DDOF) | |
| Genomsnitt NVIDIA GeForce GTX 1650 Mobile (68.5 - 99.4, n=18) | |
| Asus TUF FX705DT-AU068T (Dual-Channel) | |
| Asus TUF FX705DT-AU068T | |
| Lenovo Legion Y730-17ICH, i7-8750H | |
| Asus TUF FX705GE-EW096T | |
| Dell G3 17 3779 | |
| Asus TUF FX705DY-AU072 | |
| Far Cry 5 - 1920x1080 Ultra Preset AA:T | |
| Genomsnitt av klass Gaming (70 - 151, n=6, senaste 2 åren) | |
| Asus TUF FX705DT-AU068T (Dual-Channel) | |
| Genomsnitt NVIDIA GeForce GTX 1650 Mobile (44 - 57, n=9) | |
| Asus TUF FX705DT-AU068T | |
| Asus TUF FX705GE-EW096T | |
| Dell G3 17 3779 | |
| Asus TUF FX705DY-AU072 | |
| Dota 2 Reborn - 1920x1080 ultra (3/3) best looking | |
| Genomsnitt av klass Gaming (84.8 - 252, n=108, senaste 2 åren) | |
| Genomsnitt NVIDIA GeForce GTX 1650 Mobile (58.5 - 119, n=20) | |
| Asus TUF FX705DT-AU068T (Dual-Channel) | |
| Asus TUF FX705DY-AU072 | |
| Asus TUF FX705DT-AU068T | |
| Anno 1800 - 1920x1080 Medium Graphics Quality (DX11) | |
| Genomsnitt av klass Gaming (n=1senaste 2 åren) | |
| Acer Nitro 5 | |
| Asus TUF FX705DT-AU068T (Dual-Channel) | |
| Genomsnitt NVIDIA GeForce GTX 1650 Mobile (43.3 - 69.8, n=5) | |
| Asus TUF FX705DT-AU068T | |
| Assassin´s Creed Odyssey - 1920x1080 High Preset | |
| Acer Nitro 5 | |
| Asus TUF FX705GM | |
| Asus TUF FX705DT-AU068T (Dual-Channel) | |
| Genomsnitt NVIDIA GeForce GTX 1650 Mobile (35 - 53, n=4) | |
| Asus TUF FX705GE-EW096T | |
| Asus TUF FX705DT-AU068T | |
| Far Cry New Dawn - 1920x1080 Ultra Preset | |
| Acer Nitro 5 | |
| Acer Aspire Nitro 5 AN515-54-53Z2 | |
| Genomsnitt NVIDIA GeForce GTX 1650 Mobile (40 - 56, n=6) | |
| Asus TUF FX705DT-AU068T (Dual-Channel) | |
| MSI GF75 8RD-001 | |
| Asus TUF FX705DT-AU068T | |
| Asus TUF FX705DY-AU072 | |
Ljudnivå
| Låg belastning |
| 30.8 / 30.8 / 32.2 dB(A) |
| Hög belastning |
| 38.6 / 44.8 dB(A) |
 | ||
30 dB tyst 40 dB(A) hörbar 50 dB(A) högt ljud |
||
min: | ||
| Asus TUF FX705DT-AU068T R5 3550H, GeForce GTX 1650 Mobile | MSI GF75 8RD-001 i7-8750H, GeForce GTX 1050 Ti Max-Q | Lenovo Legion Y730-17ICH, i7-8750H i7-8750H, GeForce GTX 1050 Ti Mobile | Acer Predator Helios 300 PH317-52-51M6 i5-8300H, GeForce GTX 1050 Ti Mobile | Asus TUF FX705DY-AU072 R5 3550H, Radeon RX 560X (Laptop) | Asus TUF FX705GE-EW096T i7-8750H, GeForce GTX 1050 Ti Mobile | Asus TUF FX705GM i7-8750H, GeForce GTX 1060 Mobile | Acer Aspire Nitro 5 AN515-54-53Z2 i5-9300H, GeForce GTX 1650 Mobile | Dell G3 17 3779 i5-8300H, GeForce GTX 1050 Mobile | Genomsnitt NVIDIA GeForce GTX 1650 Mobile | Genomsnitt av klass Gaming | |
|---|---|---|---|---|---|---|---|---|---|---|---|
| Noise | 2% | 7% | -4% | -3% | -4% | -12% | -4% | 0% | 3% | 4% | |
| av / miljö * (dB) | 30.8 | 30.7 -0% | 28 9% | 29 6% | 30.7 -0% | 30.5 1% | 29 6% | 30 3% | 30.5 1% | 27.6 ? 10% | 24.1 ? 22% |
| Idle Minimum * (dB) | 30.8 | 32 -4% | 28 9% | 29 6% | 32.5 -6% | 31.2 -1% | 32 -4% | 30 3% | 30.5 1% | 28.1 ? 9% | 26 ? 16% |
| Idle Average * (dB) | 30.8 | 32 -4% | 28 9% | 31 -1% | 32.6 -6% | 32.4 -5% | 33 -7% | 31 -1% | 31.1 -1% | 28.8 ? 6% | 27.5 ? 11% |
| Idle Maximum * (dB) | 32.2 | 32.1 -0% | 31.3 3% | 33 -2% | 33.3 -3% | 32.8 -2% | 44 -37% | 33 -2% | 32.1 -0% | 31 ? 4% | 30.1 ? 7% |
| Load Average * (dB) | 38.6 | 33.6 13% | 33.4 13% | 45 -17% | 38.7 -0% | 43 -11% | 46 -19% | 46 -19% | 43.4 -12% | 41.7 ? -8% | 43.8 ? -13% |
| Load Maximum * (dB) | 44.8 | 40.6 9% | 46.2 -3% | 51 -14% | 45 -0% | 48.1 -7% | 50 -12% | 49 -9% | 39.2 12% | 46.4 ? -4% | 54.3 ? -21% |
| Witcher 3 ultra * (dB) | 42.8 | 45 | 48 | 46 |
* ... mindre är bättre
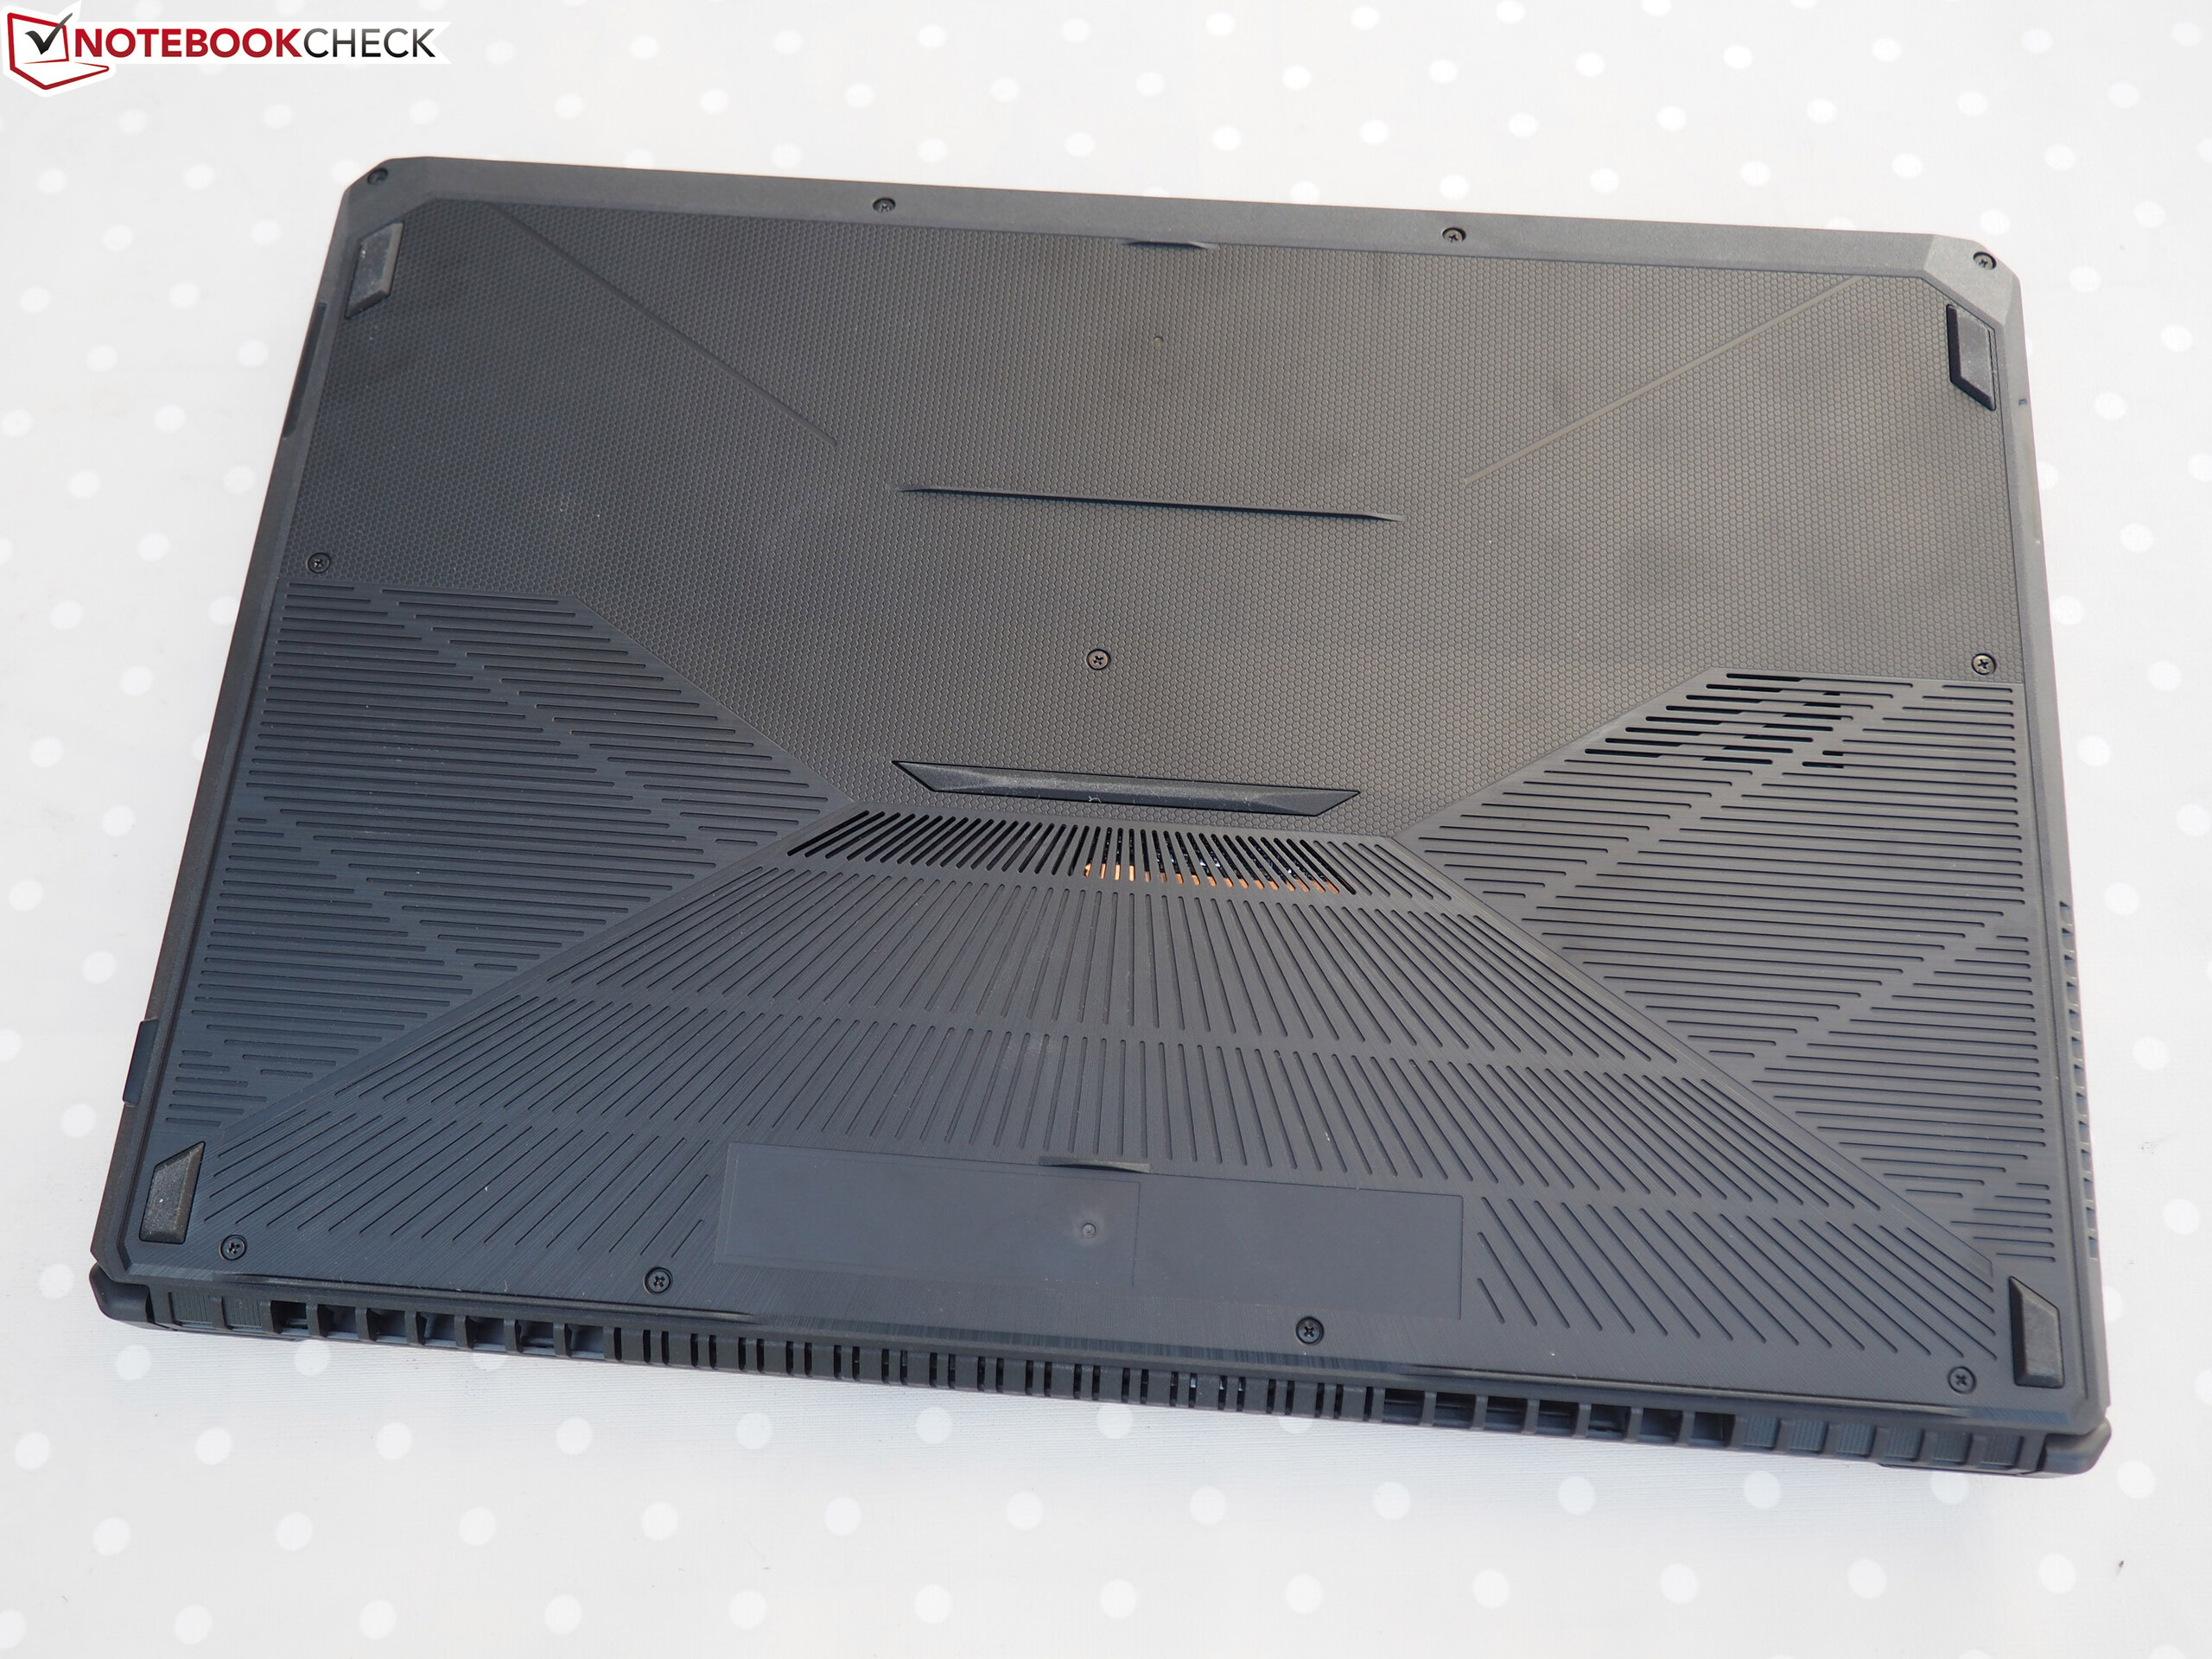
(±) Den maximala temperaturen på ovansidan är 41.6 °C / 107 F, jämfört med genomsnittet av 40.4 °C / 105 F , allt från 21.2 till 68.8 °C för klassen Gaming.
(+) Botten värms upp till maximalt 38 °C / 100 F, jämfört med genomsnittet av 43.2 °C / 110 F
(+) Vid tomgångsbruk är medeltemperaturen för ovansidan 27.2 °C / 81 F, jämfört med enhetsgenomsnittet på 33.9 °C / ### class_avg_f### F.
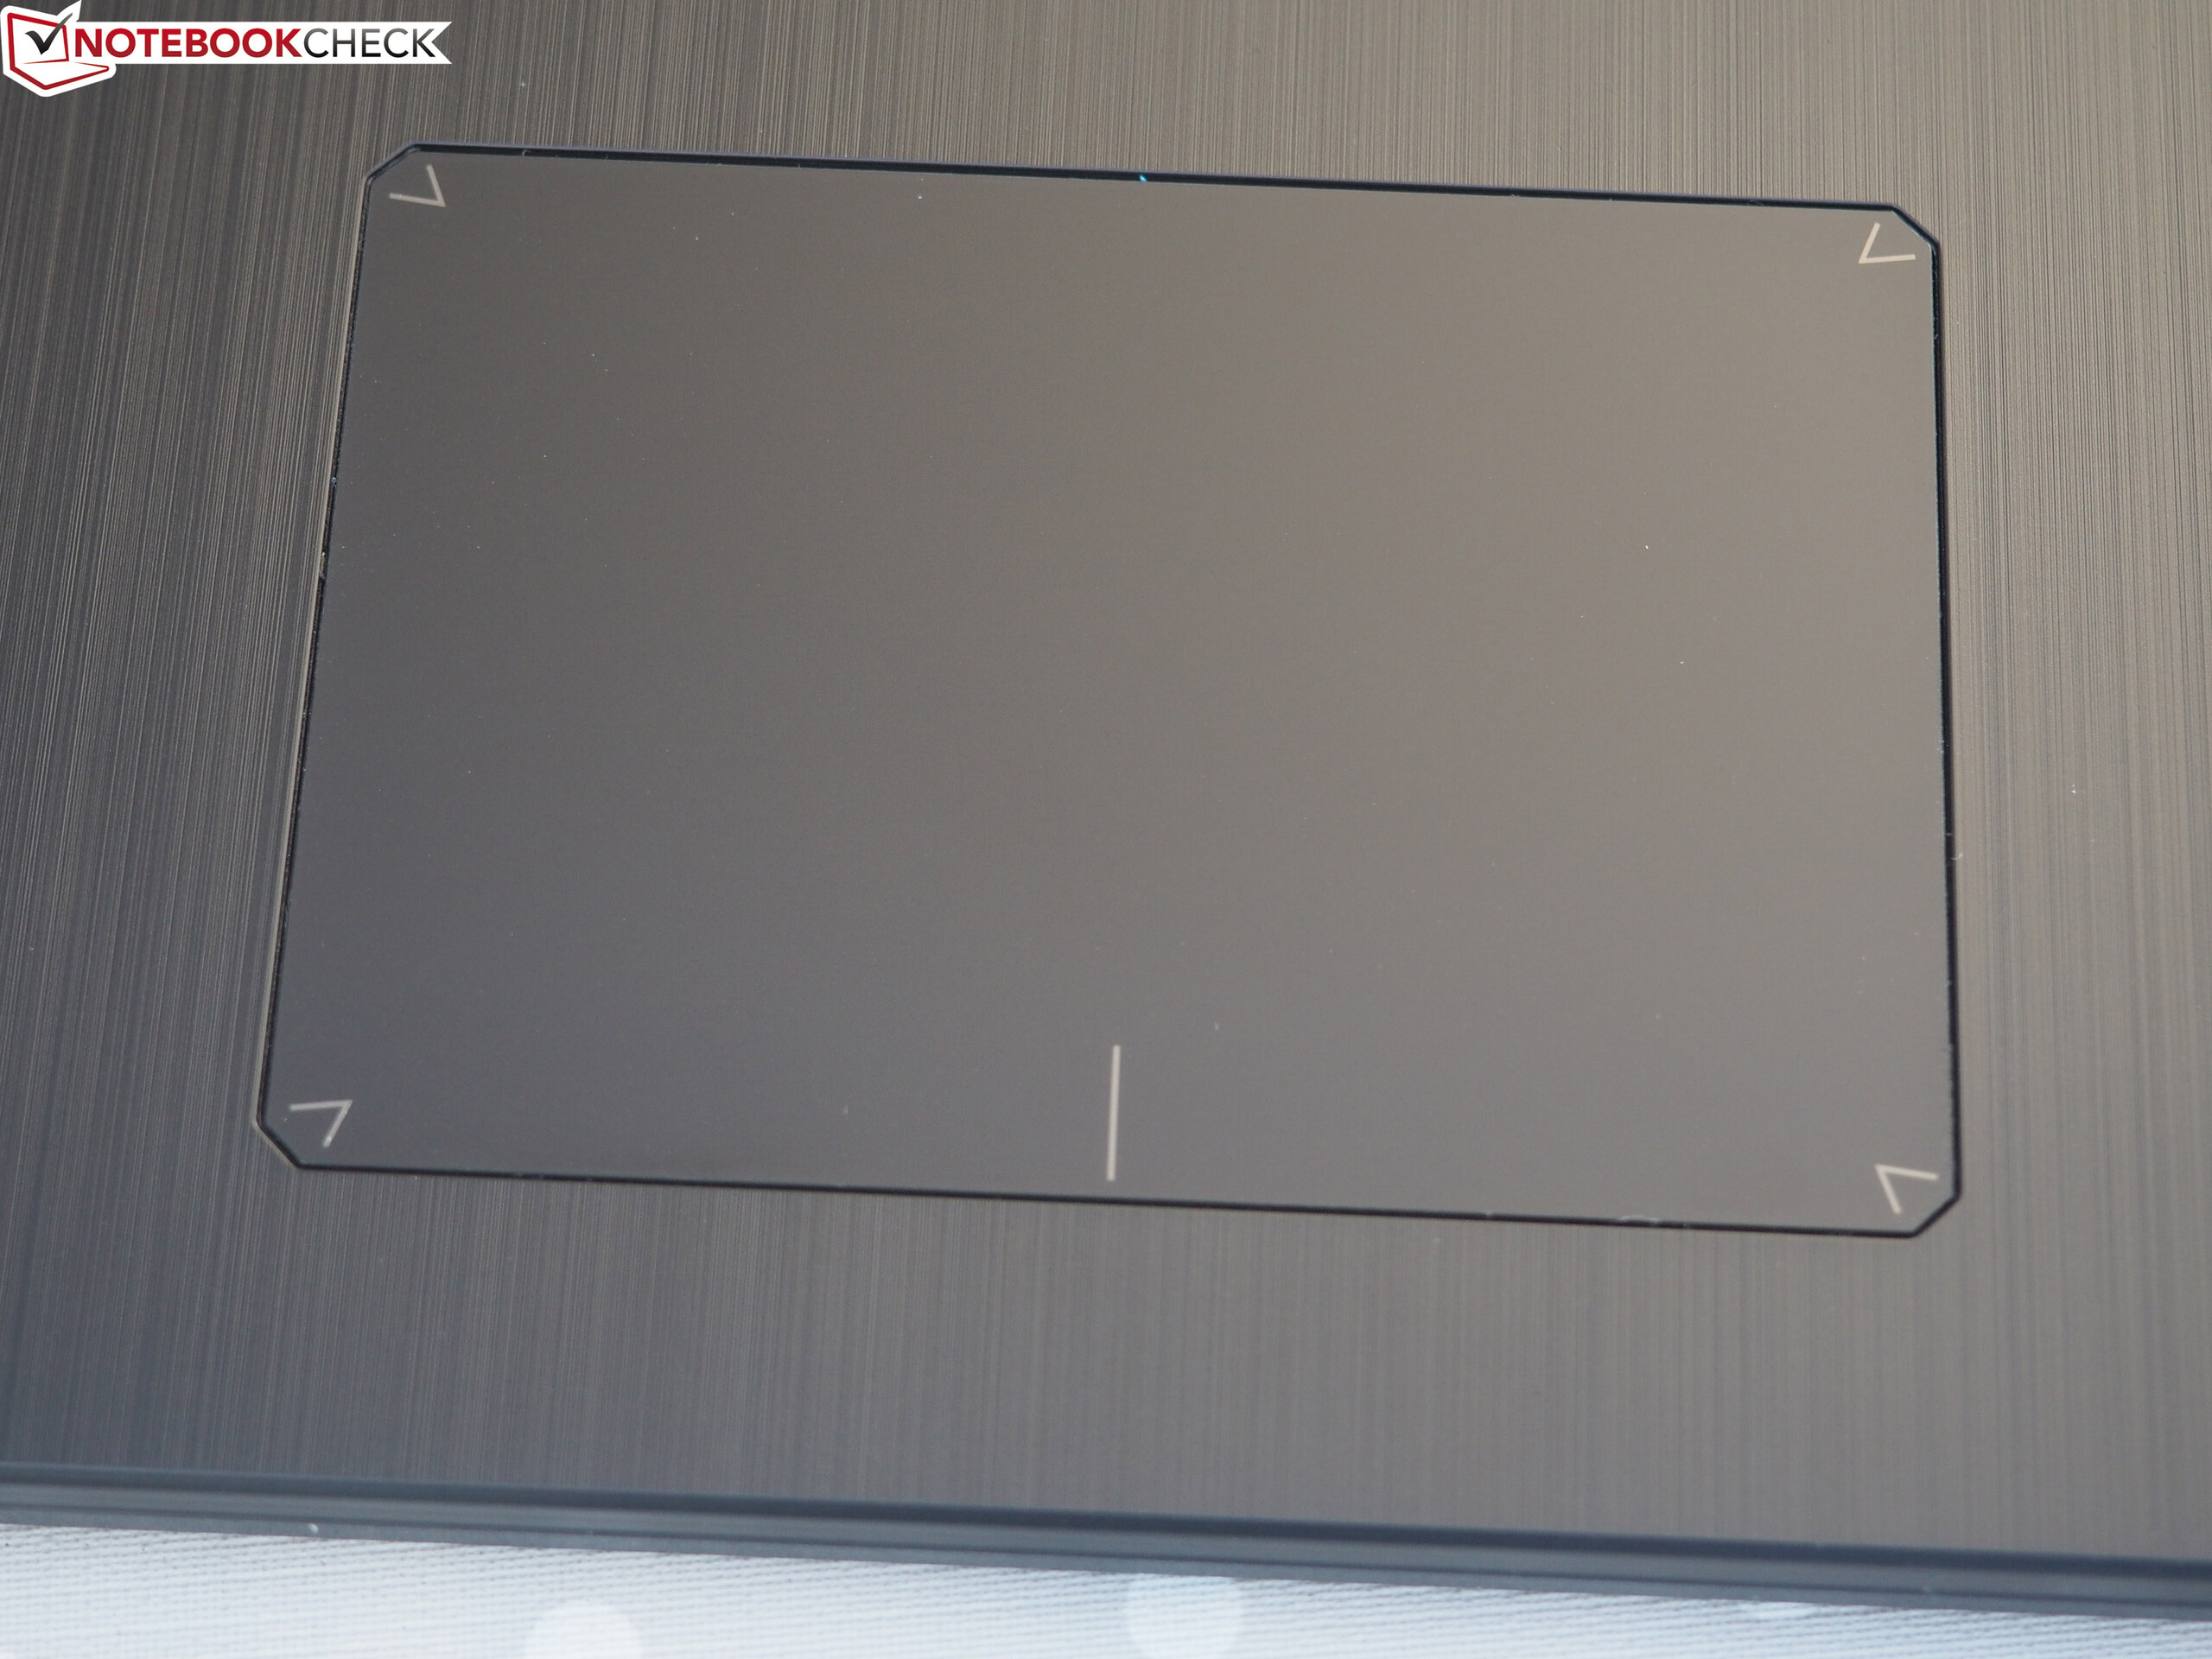
(+) Handledsstöden och pekplattan är kallare än hudtemperaturen med maximalt 24.4 °C / 75.9 F och är därför svala att ta på.
(+) Medeltemperaturen för handledsstödsområdet på liknande enheter var 28.8 °C / 83.8 F (+4.4 °C / 7.9 F).
| Asus TUF FX705DT-AU068T R5 3550H, GeForce GTX 1650 Mobile | MSI GF75 8RD-001 i7-8750H, GeForce GTX 1050 Ti Max-Q | Lenovo Legion Y730-17ICH, i7-8750H i7-8750H, GeForce GTX 1050 Ti Mobile | Acer Predator Helios 300 PH317-52-51M6 i5-8300H, GeForce GTX 1050 Ti Mobile | Asus TUF FX705DY-AU072 R5 3550H, Radeon RX 560X (Laptop) | Asus TUF FX705GE-EW096T i7-8750H, GeForce GTX 1050 Ti Mobile | Asus TUF FX705GM i7-8750H, GeForce GTX 1060 Mobile | Acer Aspire Nitro 5 AN515-54-53Z2 i5-9300H, GeForce GTX 1650 Mobile | Dell G3 17 3779 i5-8300H, GeForce GTX 1050 Mobile | Genomsnitt NVIDIA GeForce GTX 1650 Mobile | Genomsnitt av klass Gaming | |
|---|---|---|---|---|---|---|---|---|---|---|---|
| Heat | 7% | -14% | -16% | 8% | -8% | -17% | -2% | -23% | -7% | -13% | |
| Maximum Upper Side * (°C) | 41.6 | 44.2 -6% | 42 -1% | 50 -20% | 41.5 -0% | 53.3 -28% | 54 -30% | 47 -13% | 53 -27% | 46 ? -11% | 45.2 ? -9% |
| Maximum Bottom * (°C) | 38 | 39.1 -3% | 51.2 -35% | 52 -37% | 39.6 -4% | 44.7 -18% | 53 -39% | 50 -32% | 60.5 -59% | 49.2 ? -29% | 48.2 ? -27% |
| Idle Upper Side * (°C) | 31.7 | 24.5 23% | 31.8 -0% | 33 -4% | 25.7 19% | 29.5 7% | 30 5% | 24 24% | 30.3 4% | 28.3 ? 11% | 31 ? 2% |
| Idle Bottom * (°C) | 29.5 | 25.5 14% | 35.4 -20% | 30 -2% | 24.2 18% | 27 8% | 30 -2% | 25 15% | 32 -8% | 28.9 ? 2% | 34.2 ? -16% |
* ... mindre är bättre
Asus TUF FX705DT-AU068T ljudanalys
(-) | inte särskilt höga högtalare (65.9 dB)
Bas 100 - 315 Hz
(-) | nästan ingen bas - i genomsnitt 18.9% lägre än medianen
(±) | linjäriteten för basen är genomsnittlig (12.2% delta till föregående frekvens)
Mellan 400 - 2000 Hz
(+) | balanserad mellan - endast 4.2% från medianen
(±) | linjäriteten för mids är genomsnittlig (10.7% delta till föregående frekvens)
Högsta 2 - 16 kHz
(±) | högre toppar - i genomsnitt 7.3% högre än medianen
(±) | linjäriteten för toppar är genomsnittlig (7.1% delta till föregående frekvens)
Totalt 100 - 16 000 Hz
(±) | linjäriteten för det totala ljudet är genomsnittlig (28.9% skillnad mot median)
Jämfört med samma klass
» 95% av alla testade enheter i den här klassen var bättre, 2% liknande, 4% sämre
» Den bästa hade ett delta på 6%, genomsnittet var 18%, sämst var 132%
Jämfört med alla testade enheter
» 87% av alla testade enheter var bättre, 2% liknande, 11% sämre
» Den bästa hade ett delta på 4%, genomsnittet var 23%, sämst var 134%
Lenovo Legion Y730-17ICH, i7-8750H ljudanalys
(-) | inte särskilt höga högtalare (69.1 dB)
Bas 100 - 315 Hz
(±) | reducerad bas - i genomsnitt 5.7% lägre än medianen
(±) | linjäriteten för basen är genomsnittlig (12.8% delta till föregående frekvens)
Mellan 400 - 2000 Hz
(+) | balanserad mellan - endast 3.3% från medianen
(+) | mids är linjära (5.3% delta till föregående frekvens)
Högsta 2 - 16 kHz
(+) | balanserade toppar - endast 1.2% från medianen
(+) | toppar är linjära (4.5% delta till föregående frekvens)
Totalt 100 - 16 000 Hz
(+) | det totala ljudet är linjärt (13.8% skillnad mot median)
Jämfört med samma klass
» 21% av alla testade enheter i den här klassen var bättre, 7% liknande, 71% sämre
» Den bästa hade ett delta på 6%, genomsnittet var 18%, sämst var 132%
Jämfört med alla testade enheter
» 15% av alla testade enheter var bättre, 4% liknande, 81% sämre
» Den bästa hade ett delta på 4%, genomsnittet var 23%, sämst var 134%
| Av/Standby | |
| Låg belastning | |
| Hög belastning |
|
Förklaring:
min: | |
| Asus TUF FX705DT-AU068T R5 3550H, GeForce GTX 1650 Mobile | MSI GF75 8RD-001 i7-8750H, GeForce GTX 1050 Ti Max-Q | Lenovo Legion Y730-17ICH, i7-8750H i7-8750H, GeForce GTX 1050 Ti Mobile | Acer Predator Helios 300 PH317-52-51M6 i5-8300H, GeForce GTX 1050 Ti Mobile | Asus TUF FX705DY-AU072 R5 3550H, Radeon RX 560X (Laptop) | Asus TUF FX705GE-EW096T i7-8750H, GeForce GTX 1050 Ti Mobile | Asus TUF FX705GM i7-8750H, GeForce GTX 1060 Mobile | Acer Aspire Nitro 5 AN515-54-53Z2 i5-9300H, GeForce GTX 1650 Mobile | Dell G3 17 3779 i5-8300H, GeForce GTX 1050 Mobile | Genomsnitt NVIDIA GeForce GTX 1650 Mobile | Genomsnitt av klass Gaming | |
|---|---|---|---|---|---|---|---|---|---|---|---|
| Power Consumption | -42% | -37% | -37% | -28% | -21% | -122% | -21% | -53% | -28% | -149% | |
| Idle Minimum * (Watt) | 3.9 | 6.5 -67% | 6.3 -62% | 6 -54% | 5.5 -41% | 3.8 3% | 13 -233% | 5 -28% | 7.7 -97% | 4.96 ? -27% | 13 ? -233% |
| Idle Average * (Watt) | 9.6 | 11.9 -24% | 11 -15% | 9 6% | 10.9 -14% | 9 6% | 17 -77% | 7 27% | 14 -46% | 8.61 ? 10% | 19 ? -98% |
| Idle Maximum * (Watt) | 12.2 | 13.1 -7% | 11.5 6% | 13 -7% | 12.2 -0% | 11.2 8% | 24 -97% | 11 10% | 15.5 -27% | 14.8 ? -21% | 24.5 ? -101% |
| Load Average * (Watt) | 59 | 86 -46% | 89.8 -52% | 95 -61% | 77 -31% | 101 -71% | 106 -80% | 89 -51% | 95 -61% | 81.7 ? -38% | 111.1 ? -88% |
| Load Maximum * (Watt) | 80 | 131 -64% | 130.7 -63% | 134 -68% | 123 -54% | 119.7 -50% | 179 -124% | 132 -65% | 106 -33% | 131.9 ? -65% | 260 ? -225% |
| Witcher 3 ultra * (Watt) | 102 | 102 | 151 | 90 |
* ... mindre är bättre
| Asus TUF FX705DT-AU068T R5 3550H, GeForce GTX 1650 Mobile, 64 Wh | Asus TUF FX705DY-AU072 R5 3550H, Radeon RX 560X (Laptop), 64 Wh | Asus TUF FX705GE-EW096T i7-8750H, GeForce GTX 1050 Ti Mobile, 64 Wh | Asus TUF FX705GM i7-8750H, GeForce GTX 1060 Mobile, 64 Wh | MSI GF75 8RD-001 i7-8750H, GeForce GTX 1050 Ti Max-Q, 51 Wh | Lenovo Legion Y730-17ICH, i7-8750H i7-8750H, GeForce GTX 1050 Ti Mobile, 76 Wh | Acer Predator Helios 300 PH317-52-51M6 i5-8300H, GeForce GTX 1050 Ti Mobile, 48 Wh | Dell G3 17 3779 i5-8300H, GeForce GTX 1050 Mobile, 56 Wh | Genomsnitt av klass Gaming | |
|---|---|---|---|---|---|---|---|---|---|
| Batteridrifttid | -9% | 10% | -42% | -50% | -25% | -19% | -18% | -18% | |
| Reader / Idle (h) | 13.6 | 12.6 -7% | 6.3 -54% | 6.3 -54% | 13.2 -3% | 11.8 -13% | 12.2 -10% | 8.27 ? -39% | |
| H.264 (h) | 8.1 | 6.7 -17% | 4.3 -47% | 3.4 -58% | 5.3 -35% | 8.32 ? 3% | |||
| WiFi v1.3 (h) | 7.8 | 7.2 -8% | 8.6 10% | 4.5 -42% | 4.7 -40% | 6.7 -14% | 5.9 -24% | 5.8 -26% | 7.11 ? -9% |
| Load (h) | 2.1 | 2 -5% | 1.6 -24% | 1.1 -48% | 0.9 -57% | 1.7 -19% | 2.1 0% | 1.502 ? -28% |
För
Emot
Läs den fullständiga versionen av den här recensionen på engelska här.
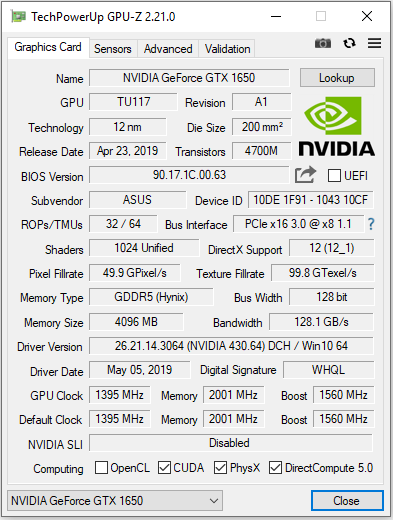
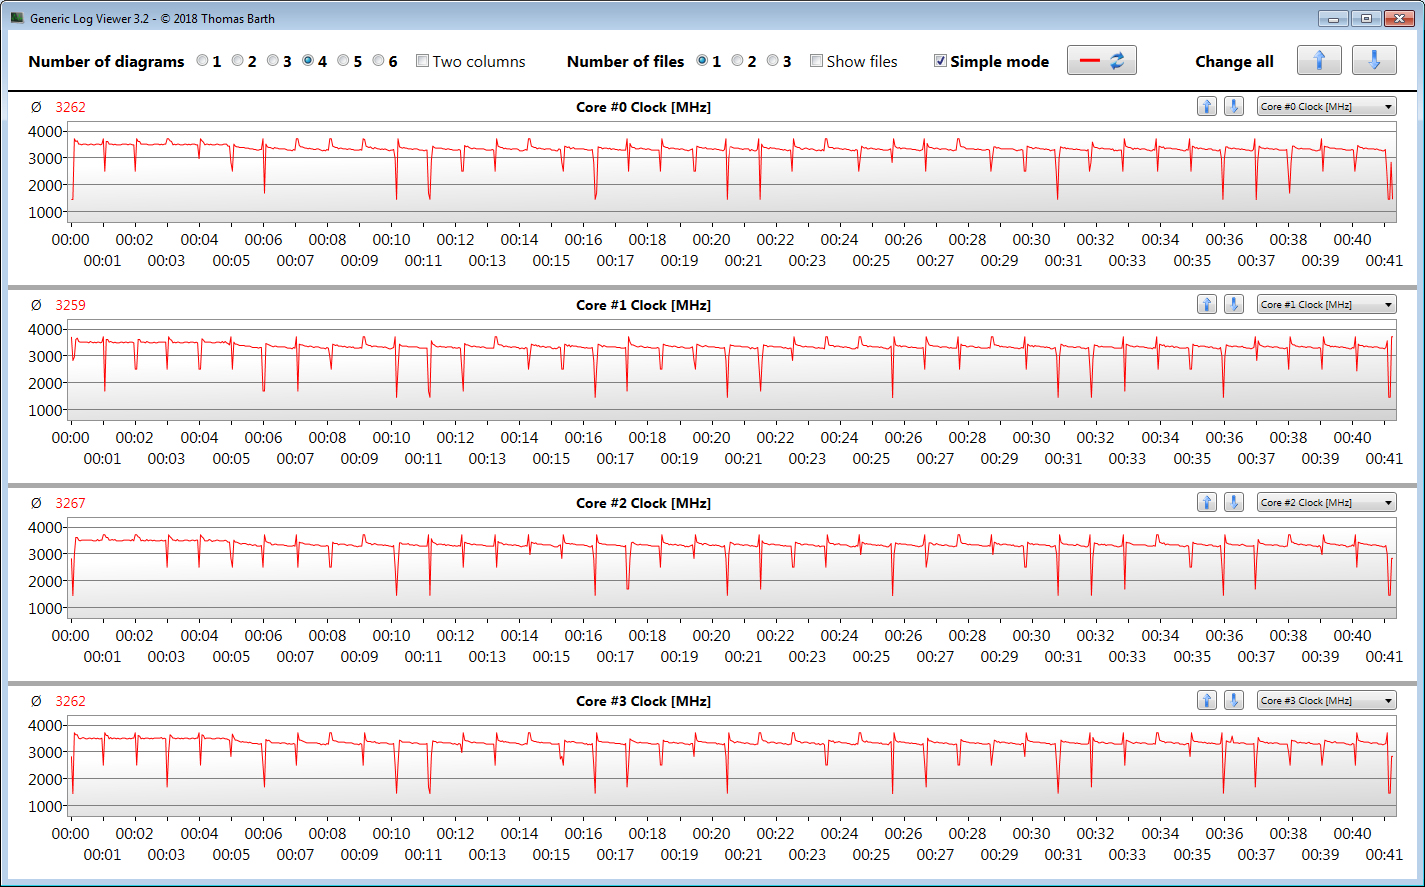
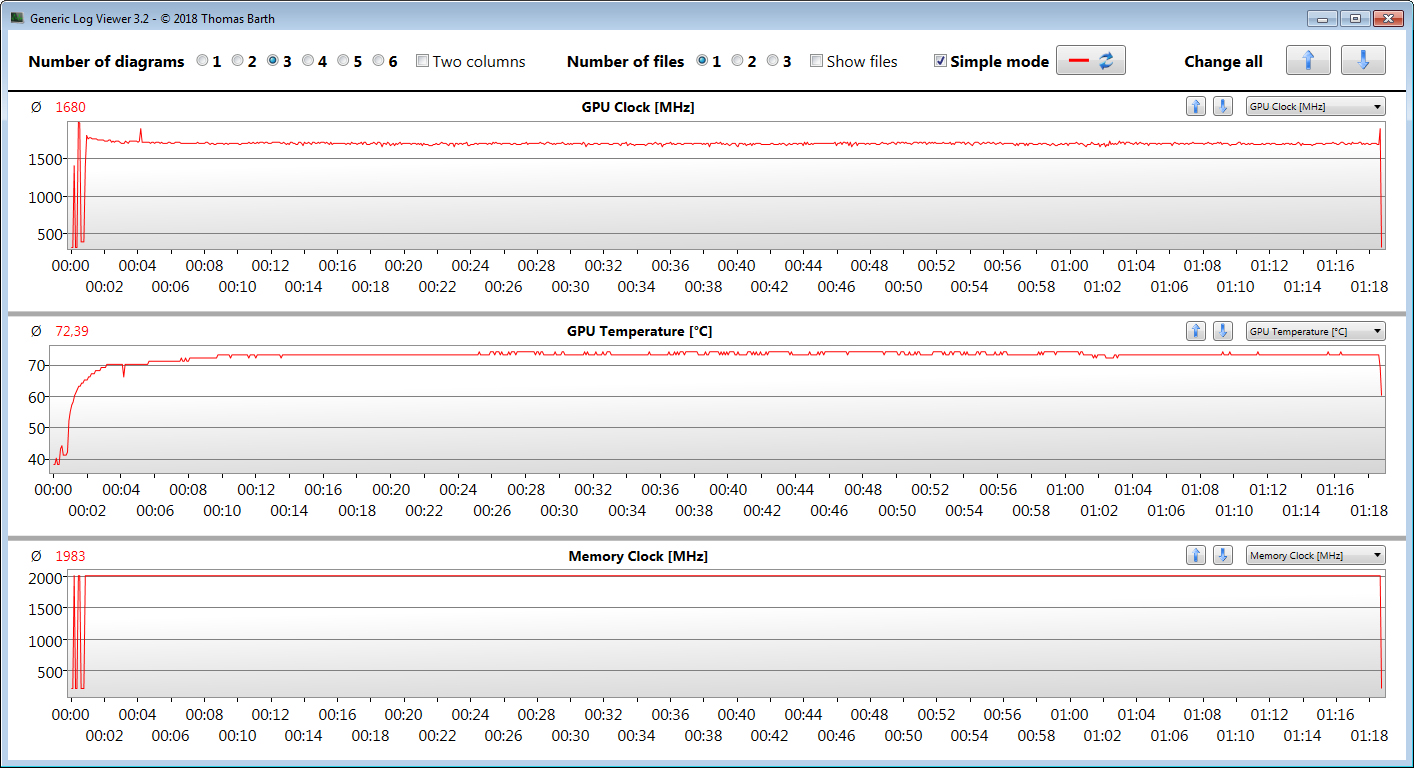
Asus TUF Gaming FX705DT har en hårdvarukombination man inte ser varje dag - en AMD Ryzen 5 3550H APU tillsammans med en Nvidia GeForce GTX 1650 GPU. Tillsammans klarar de alla aktuella och moderna spel galant i skärmens Full HD-upplösning med grafikinställningar på medel eller hög nivå. En del spel kan till och med köras i maximala inställningar. För att kunna använda hårdvarans potential fullt ut rekommenderar vi att du installerar en andra RAM-modul.
Kombinationen av CPU och GPU visar sig också vara exceptionellt energieffektiv - jämförbara bärbara datorer drar betydligt mer energi vid belastning. I Armory Create ControL Center finns det dessutom alternativ som 'Tyst Läge', vilket reducerar fläktens hastighet och ljudnivå, och det går också att sänka processorns klockfrekvenser. Prestandan är mer än tillräcklig för kontors- och internetanvändning.
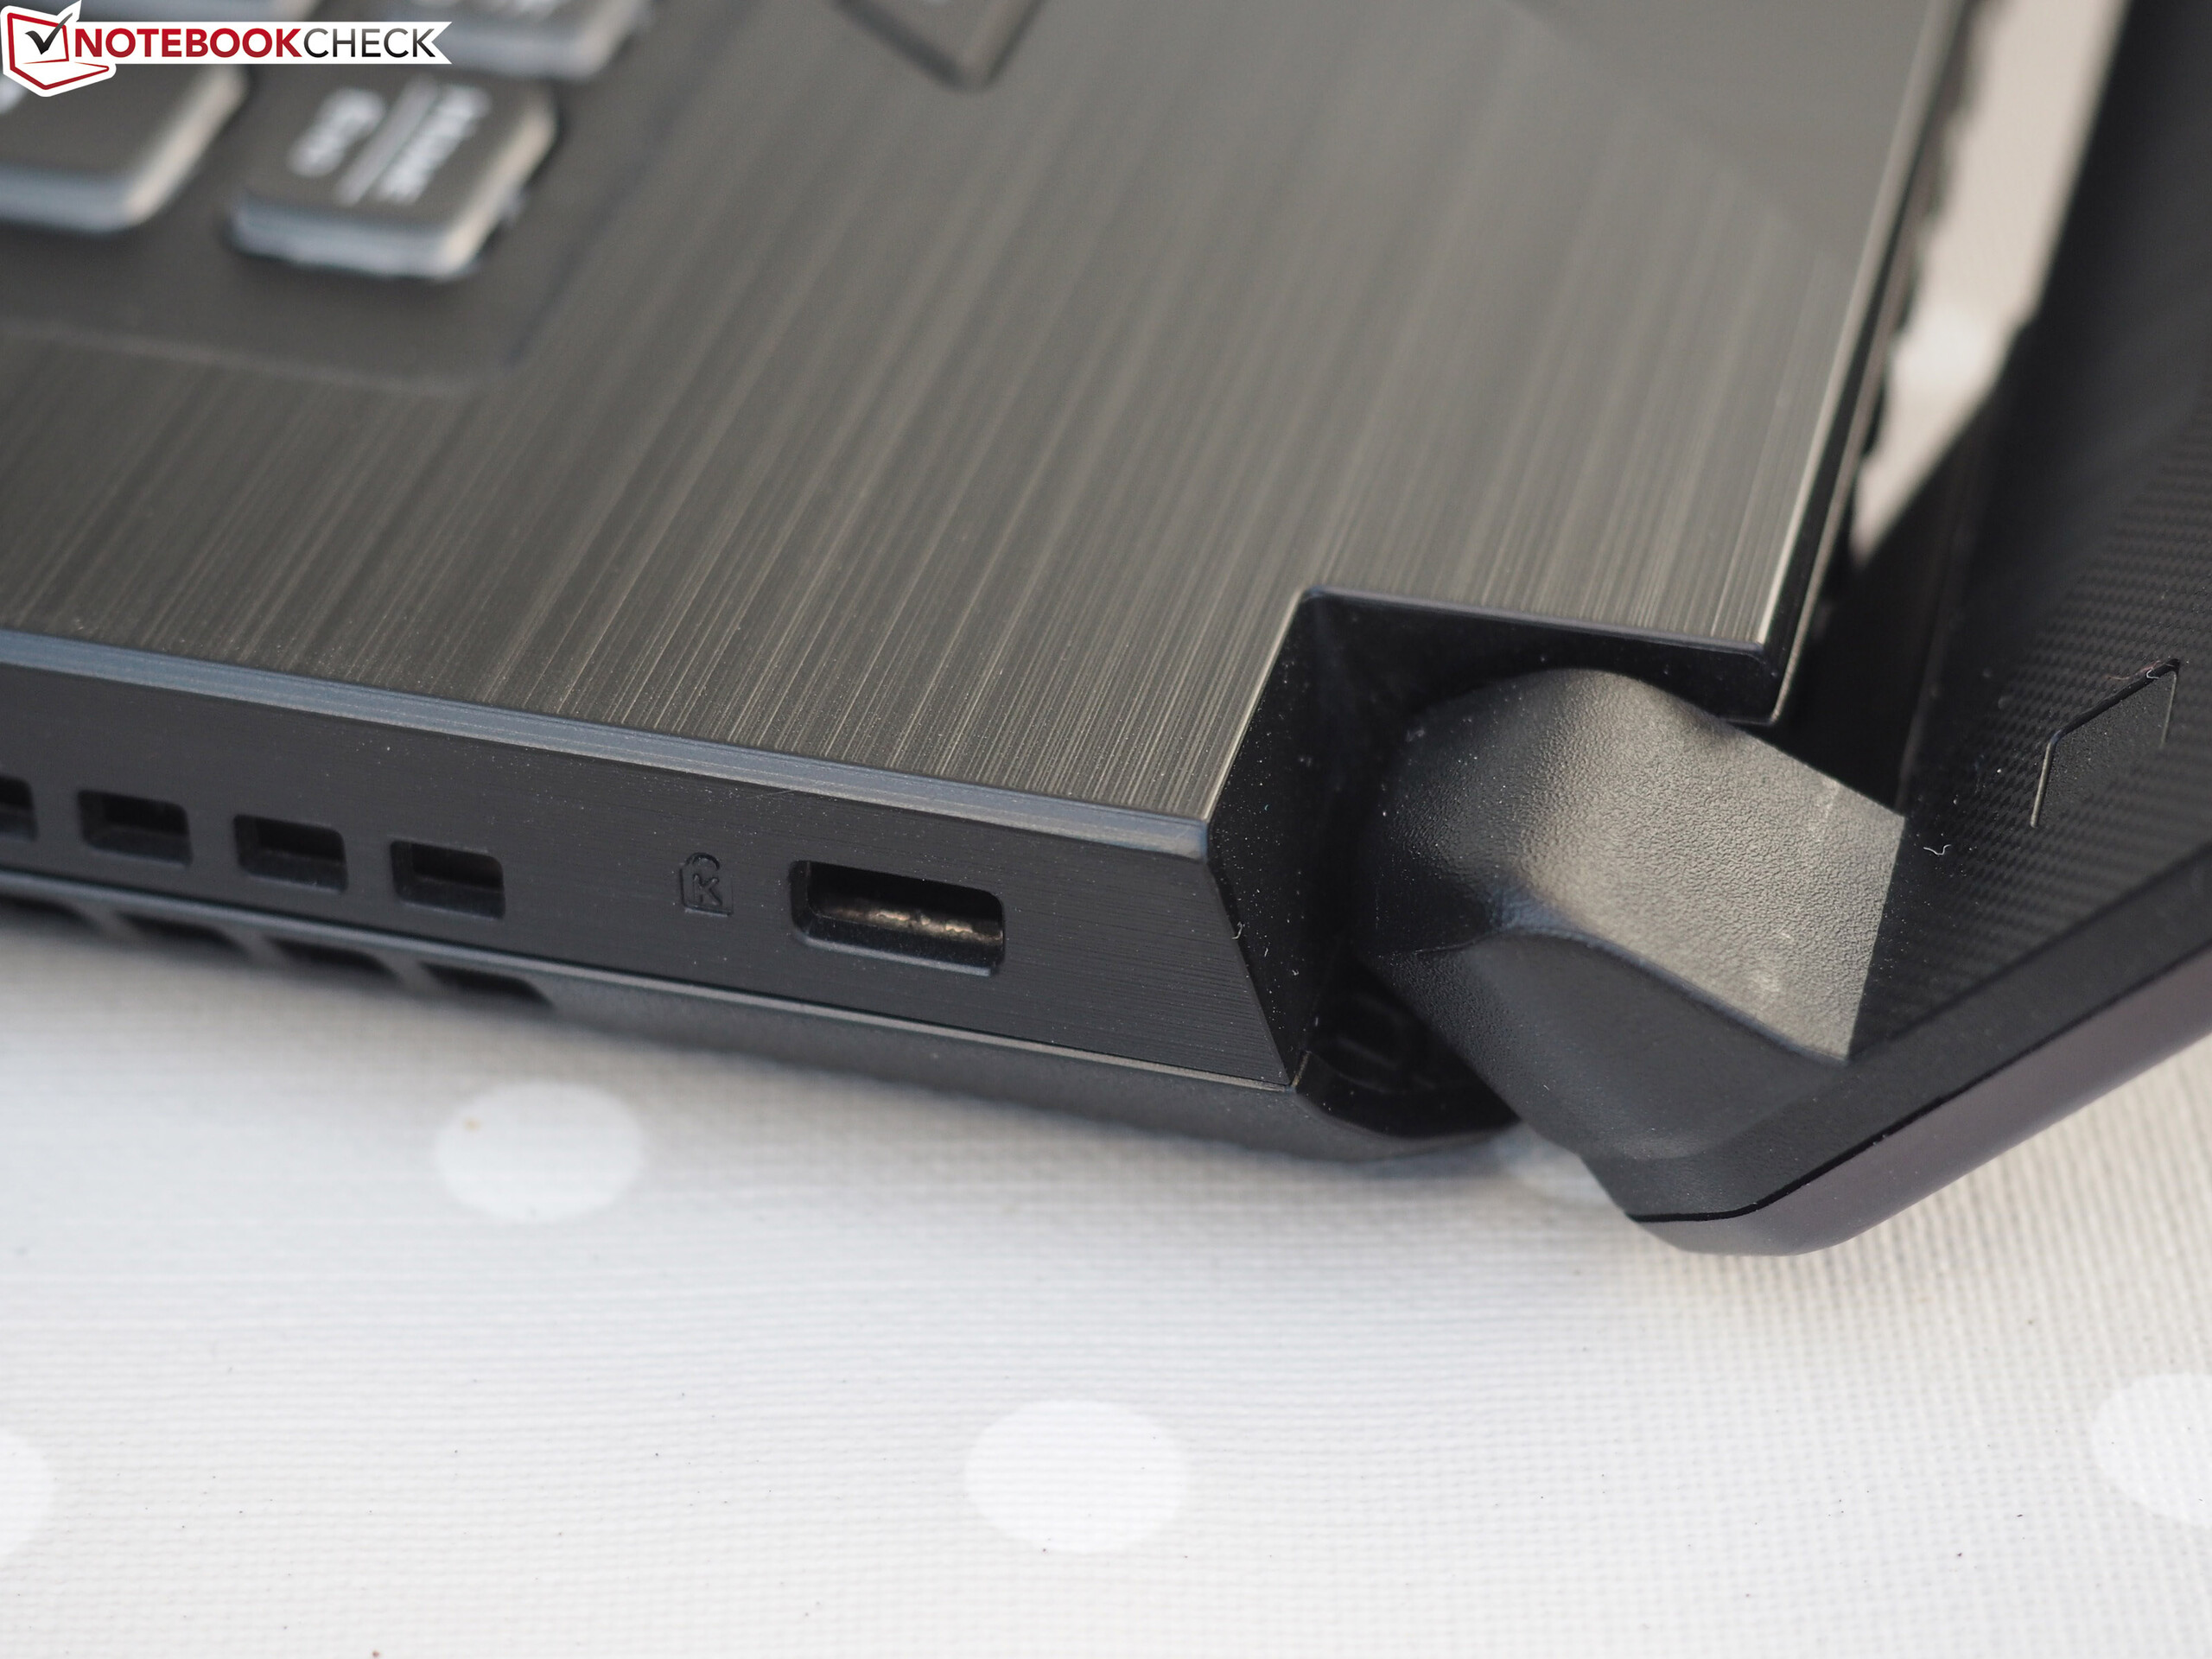
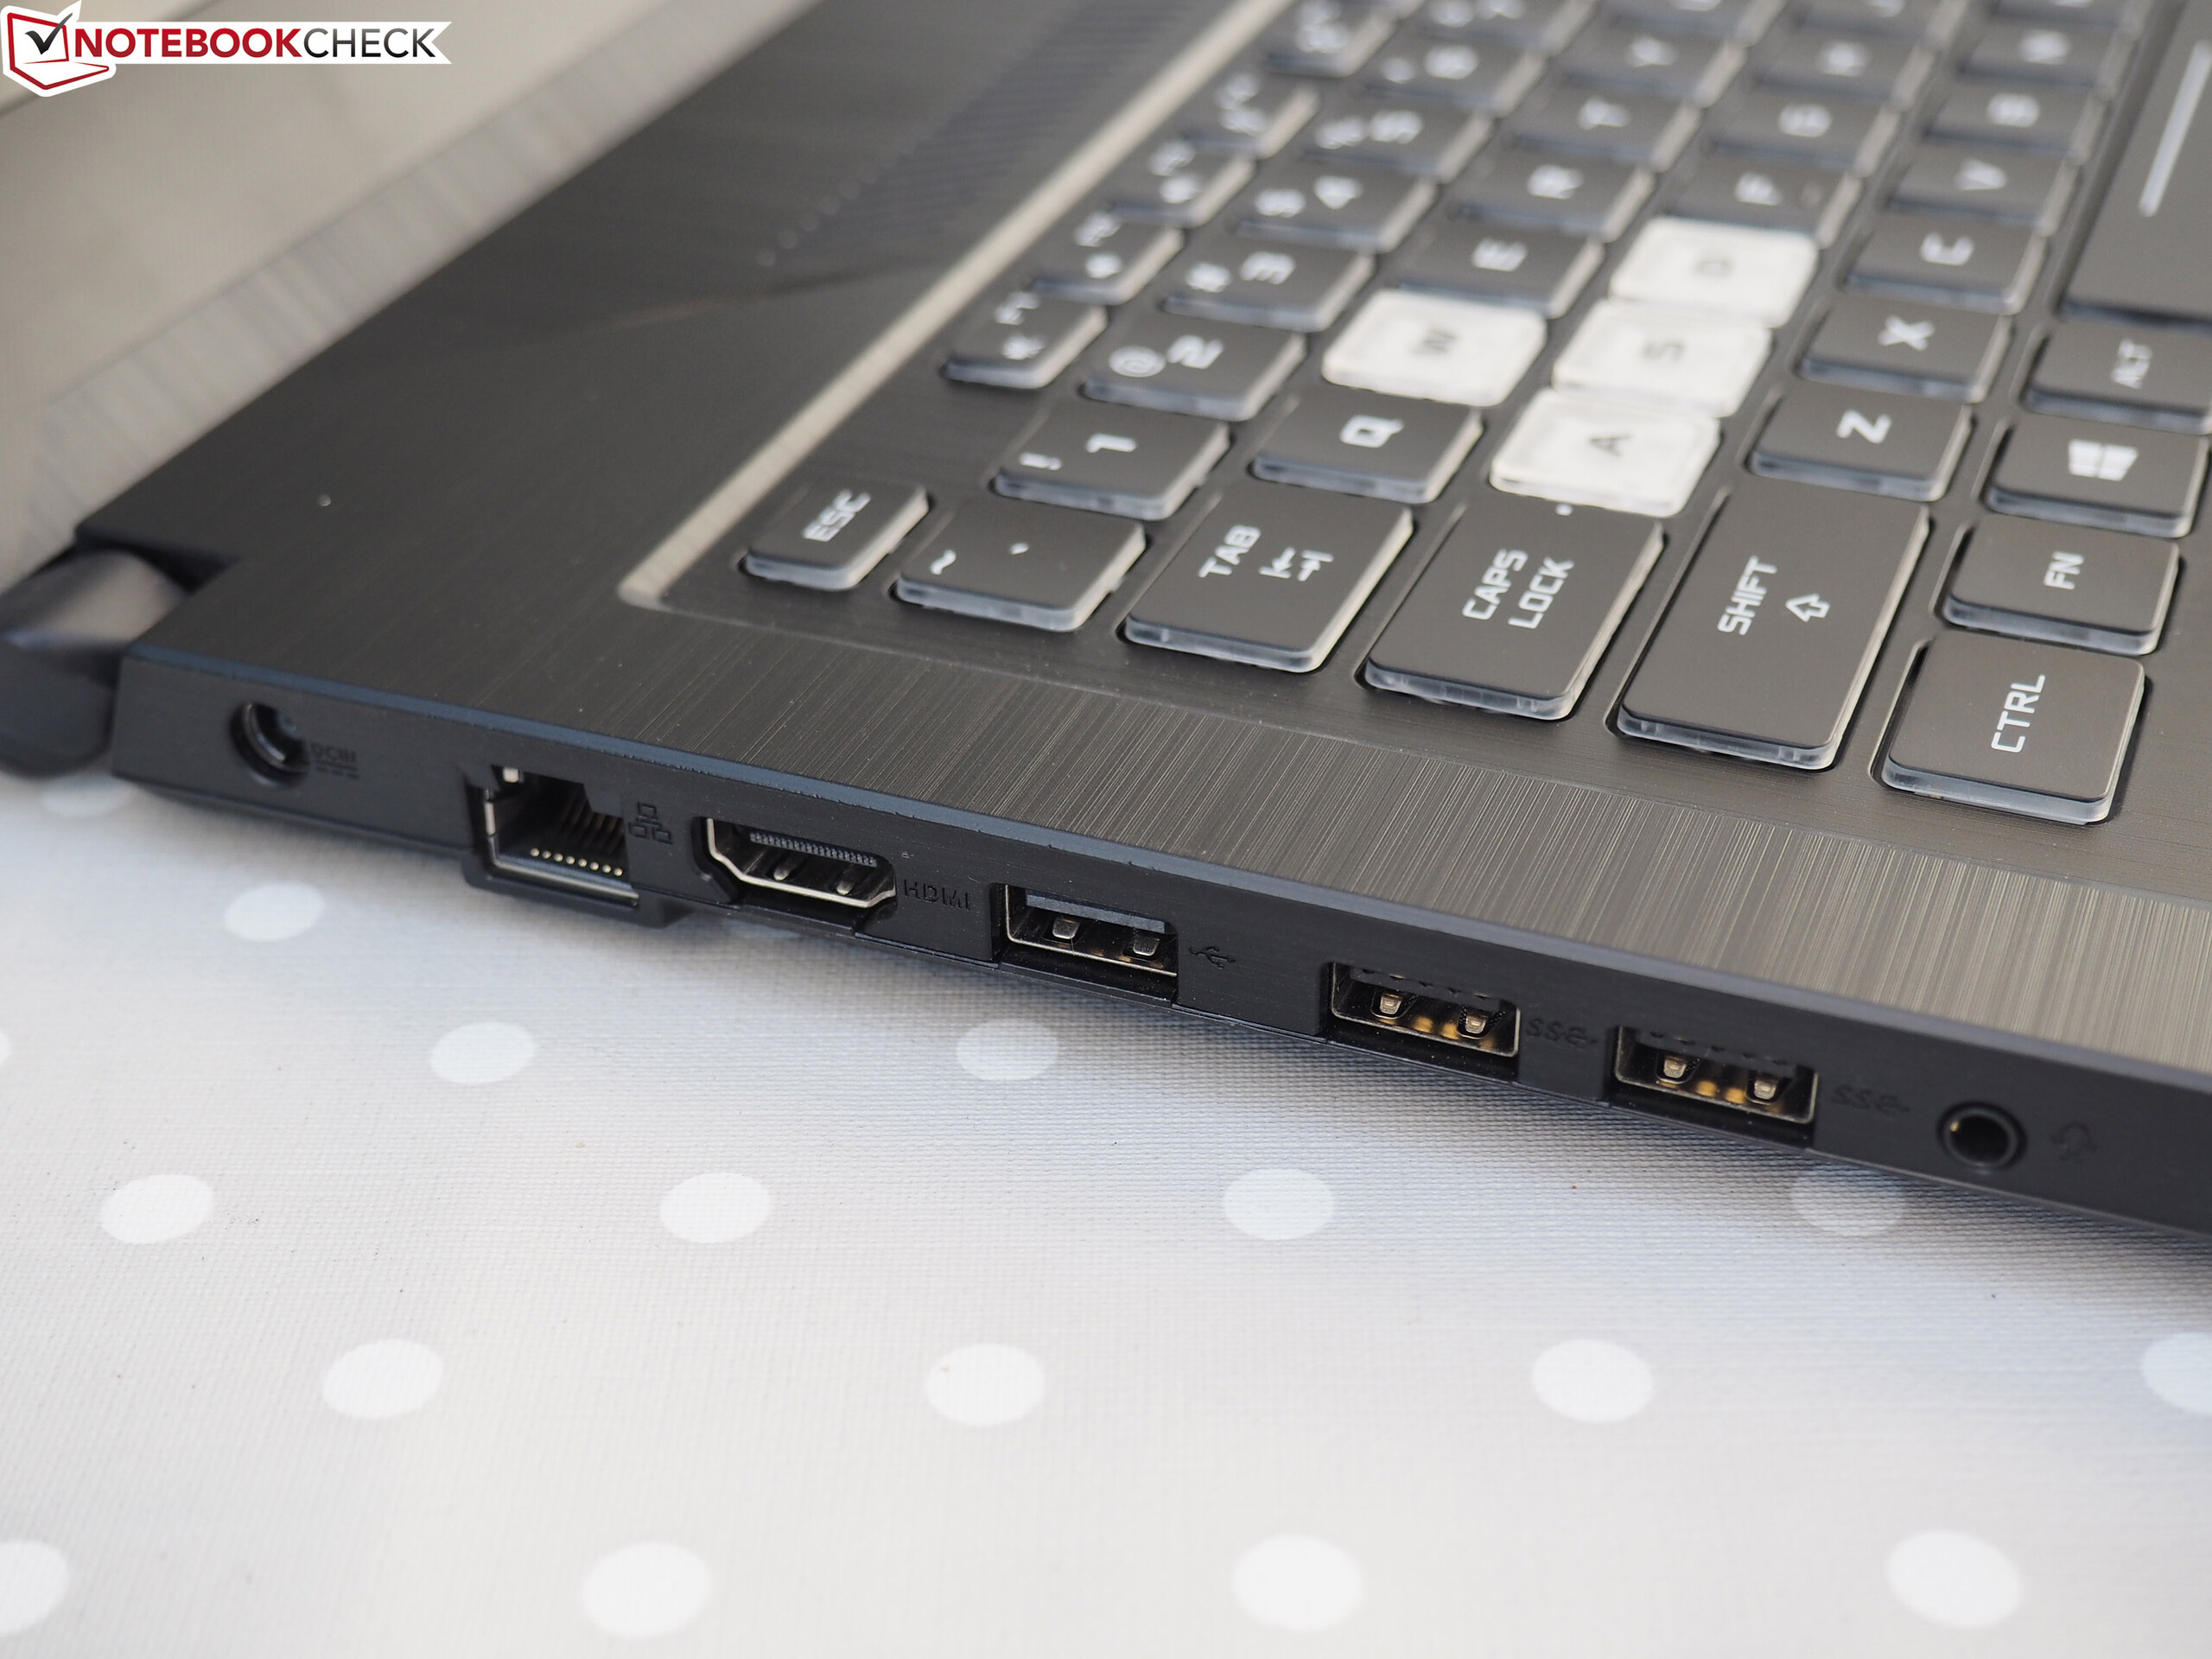
Asus TUF Gaming FX705DT visar sig vara en välavrundad spellaptop utan några större brister - det är bara det magra portutbudet som talar mot den.
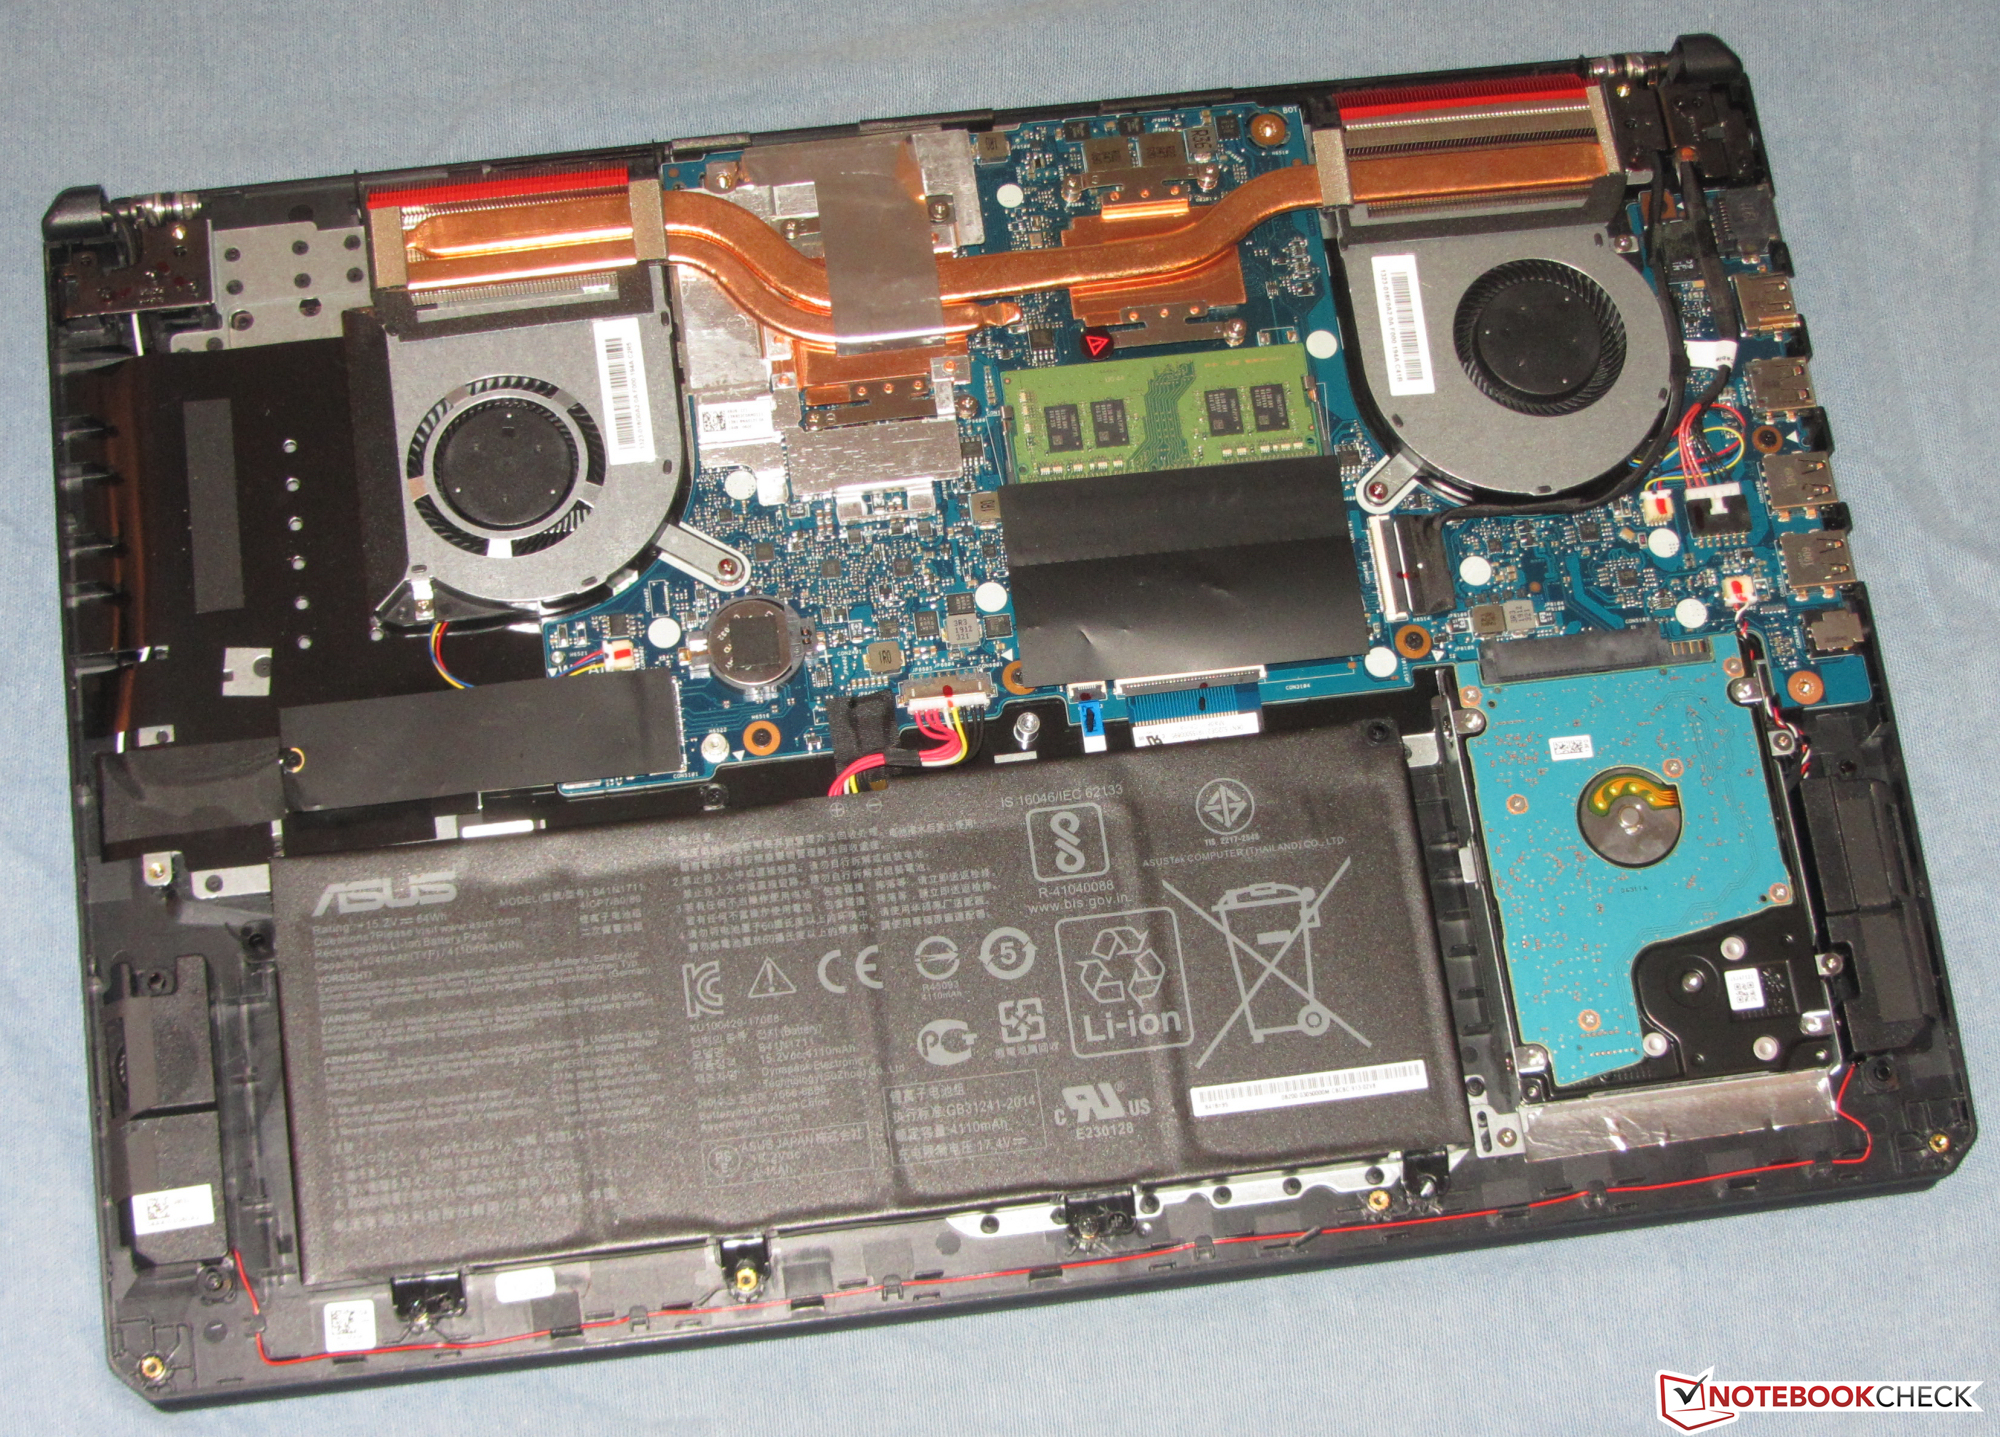
En NVMe SSD sörjer för ett smidigt och kvickt system och datorns lagringskrav uppfylls av en 2.5 tums HDD på 1 TB. Båda enheterna kan, om så krävs, bytas ut. Detta kräver dock att chassit öppnas.
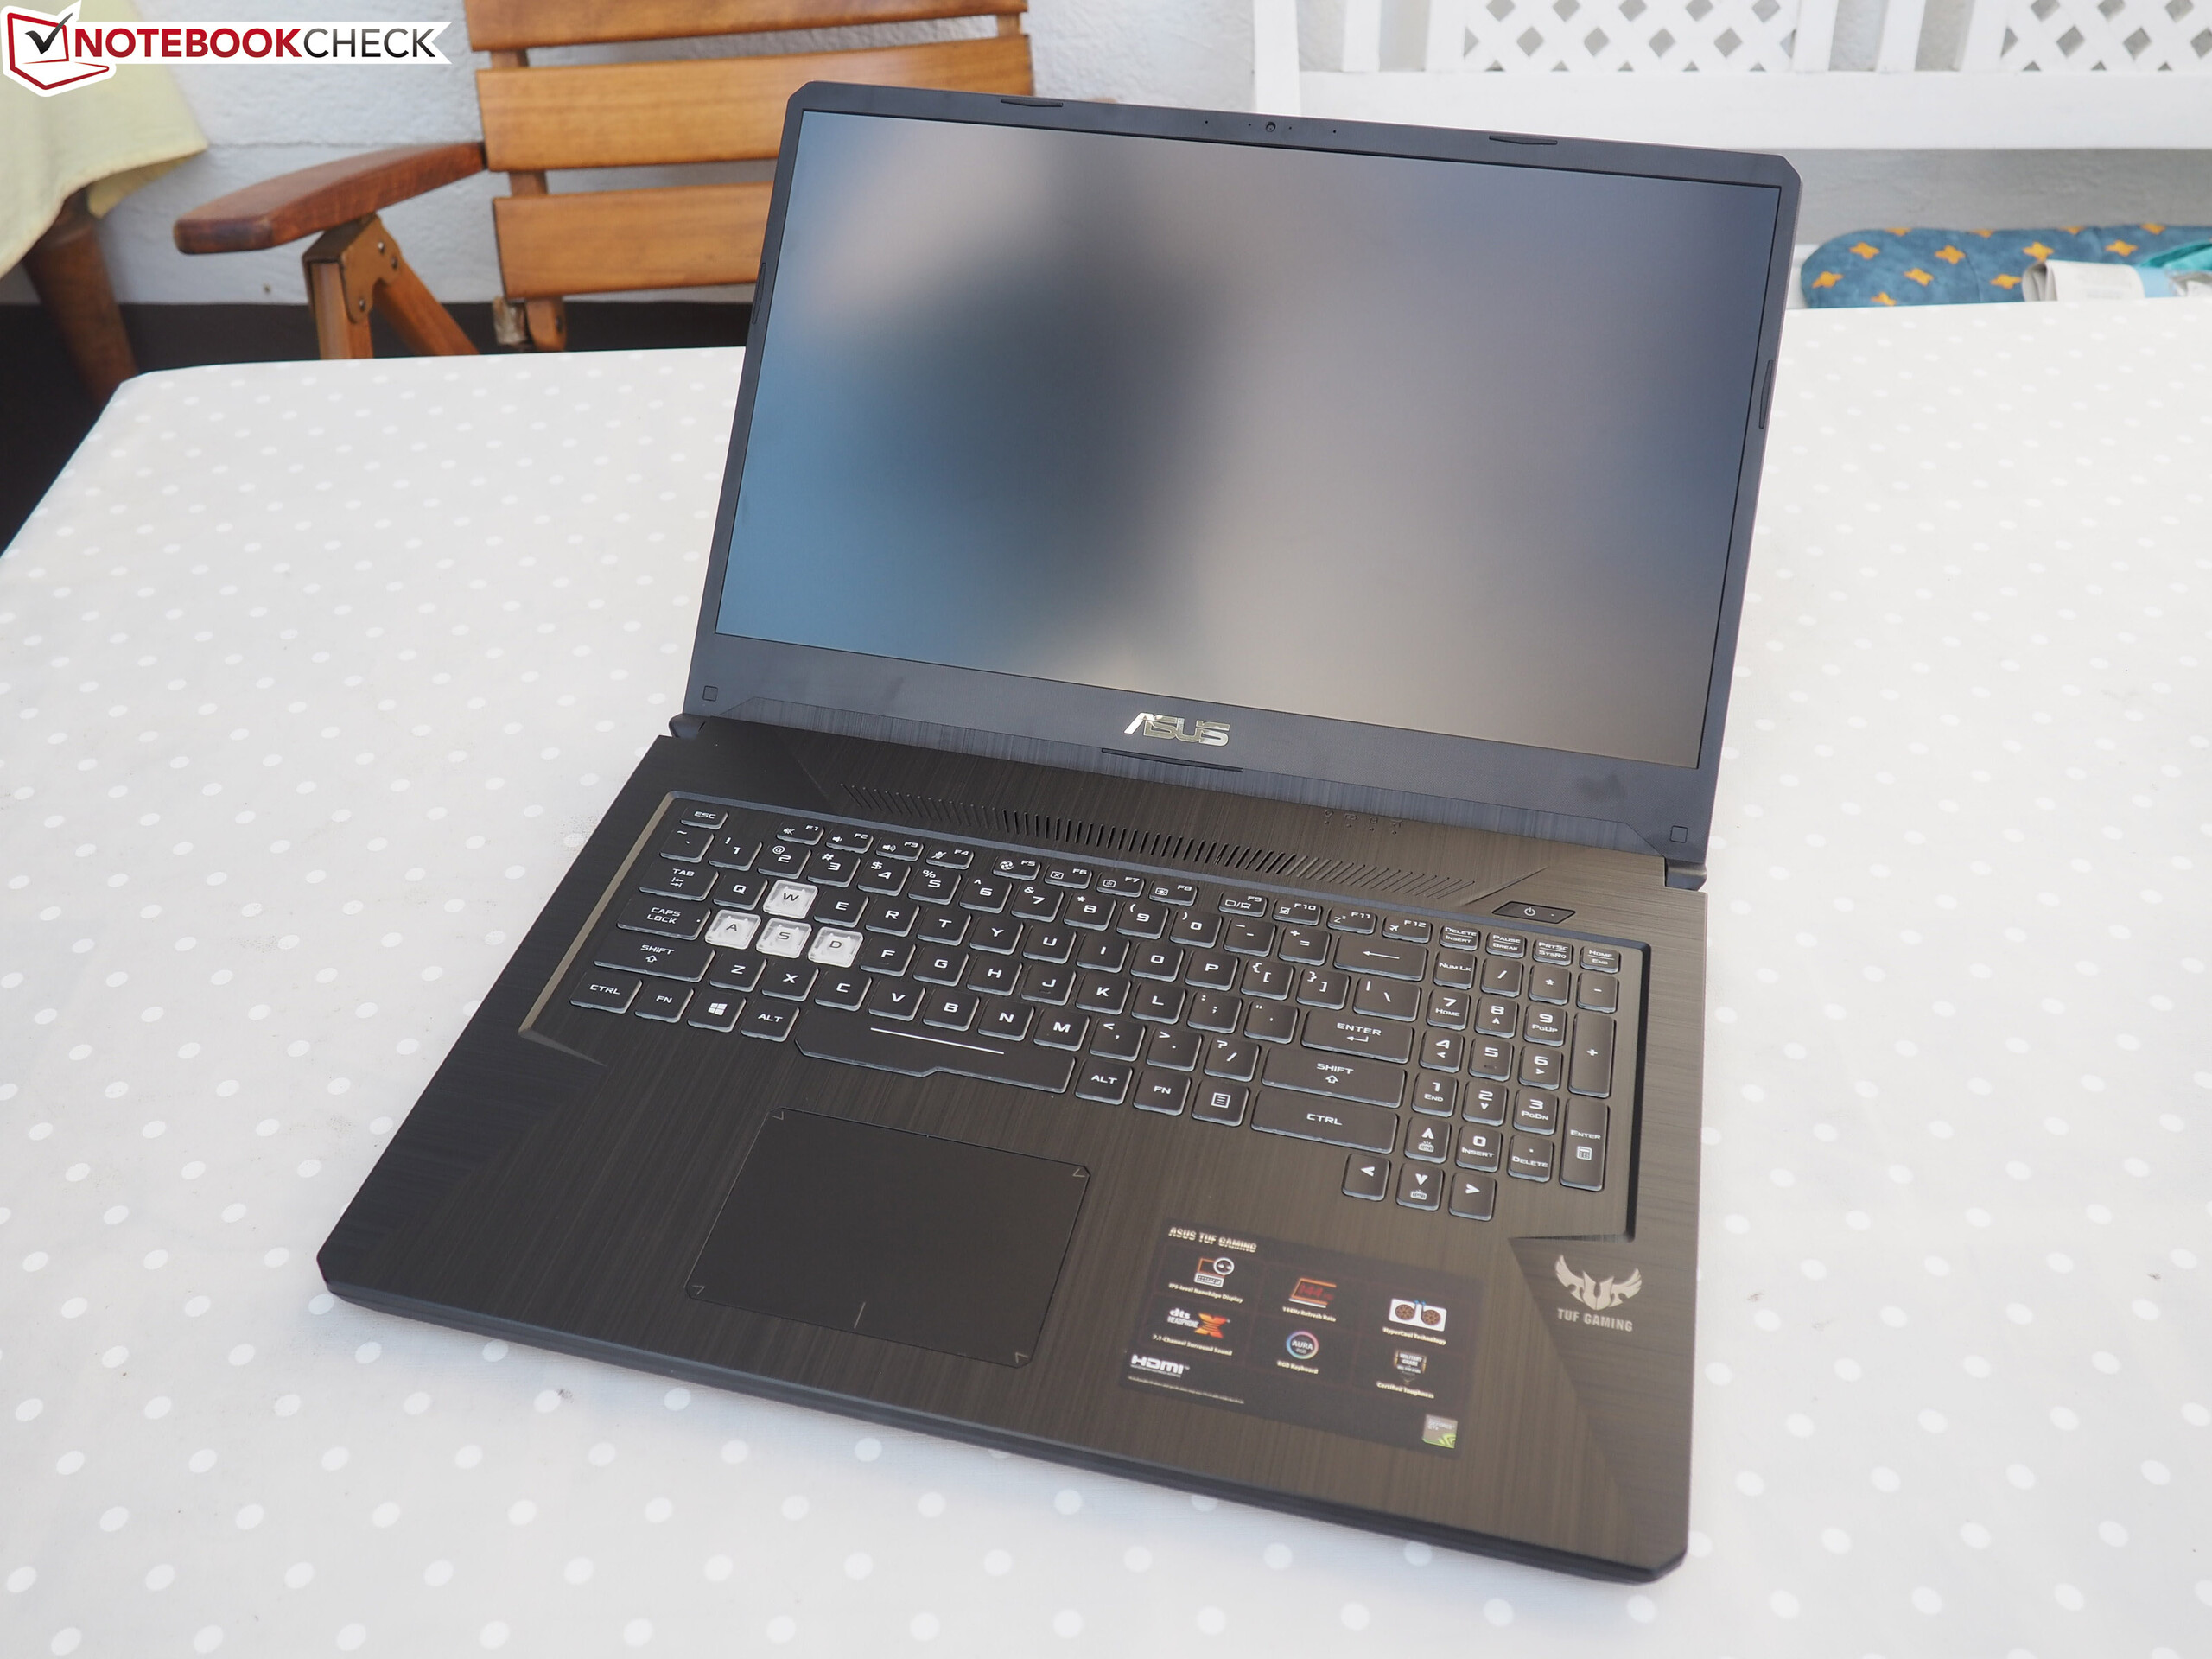
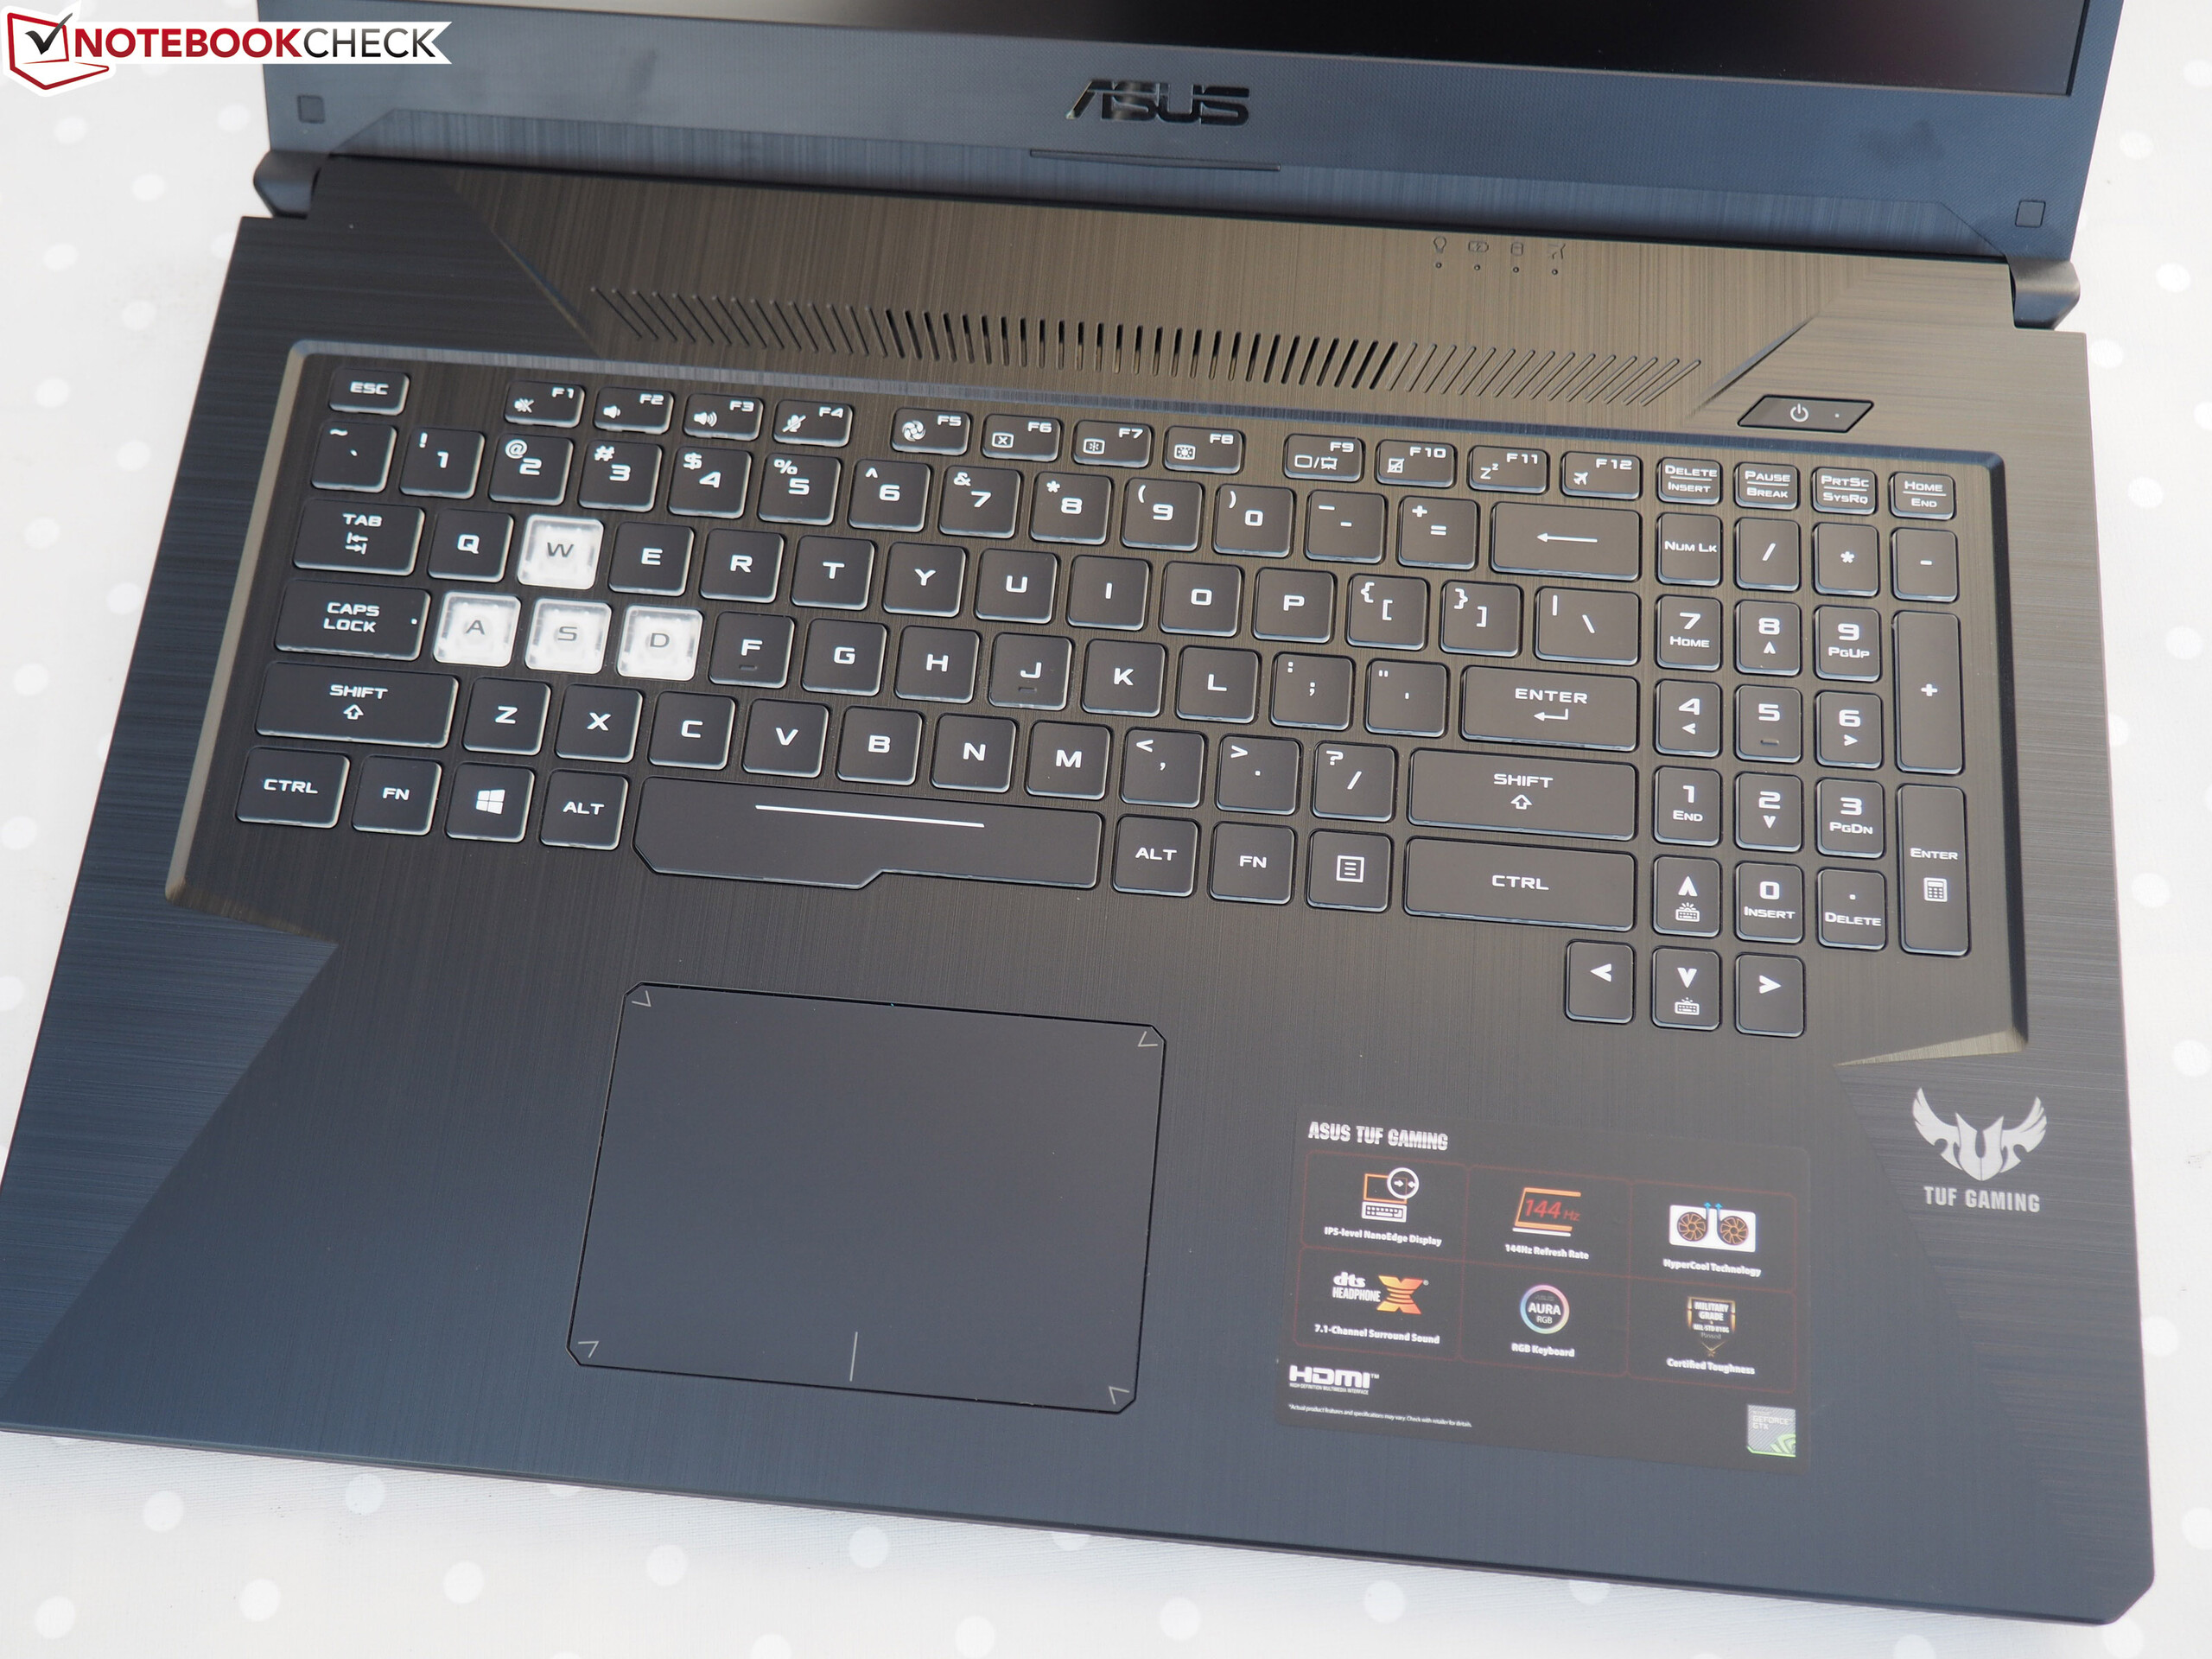
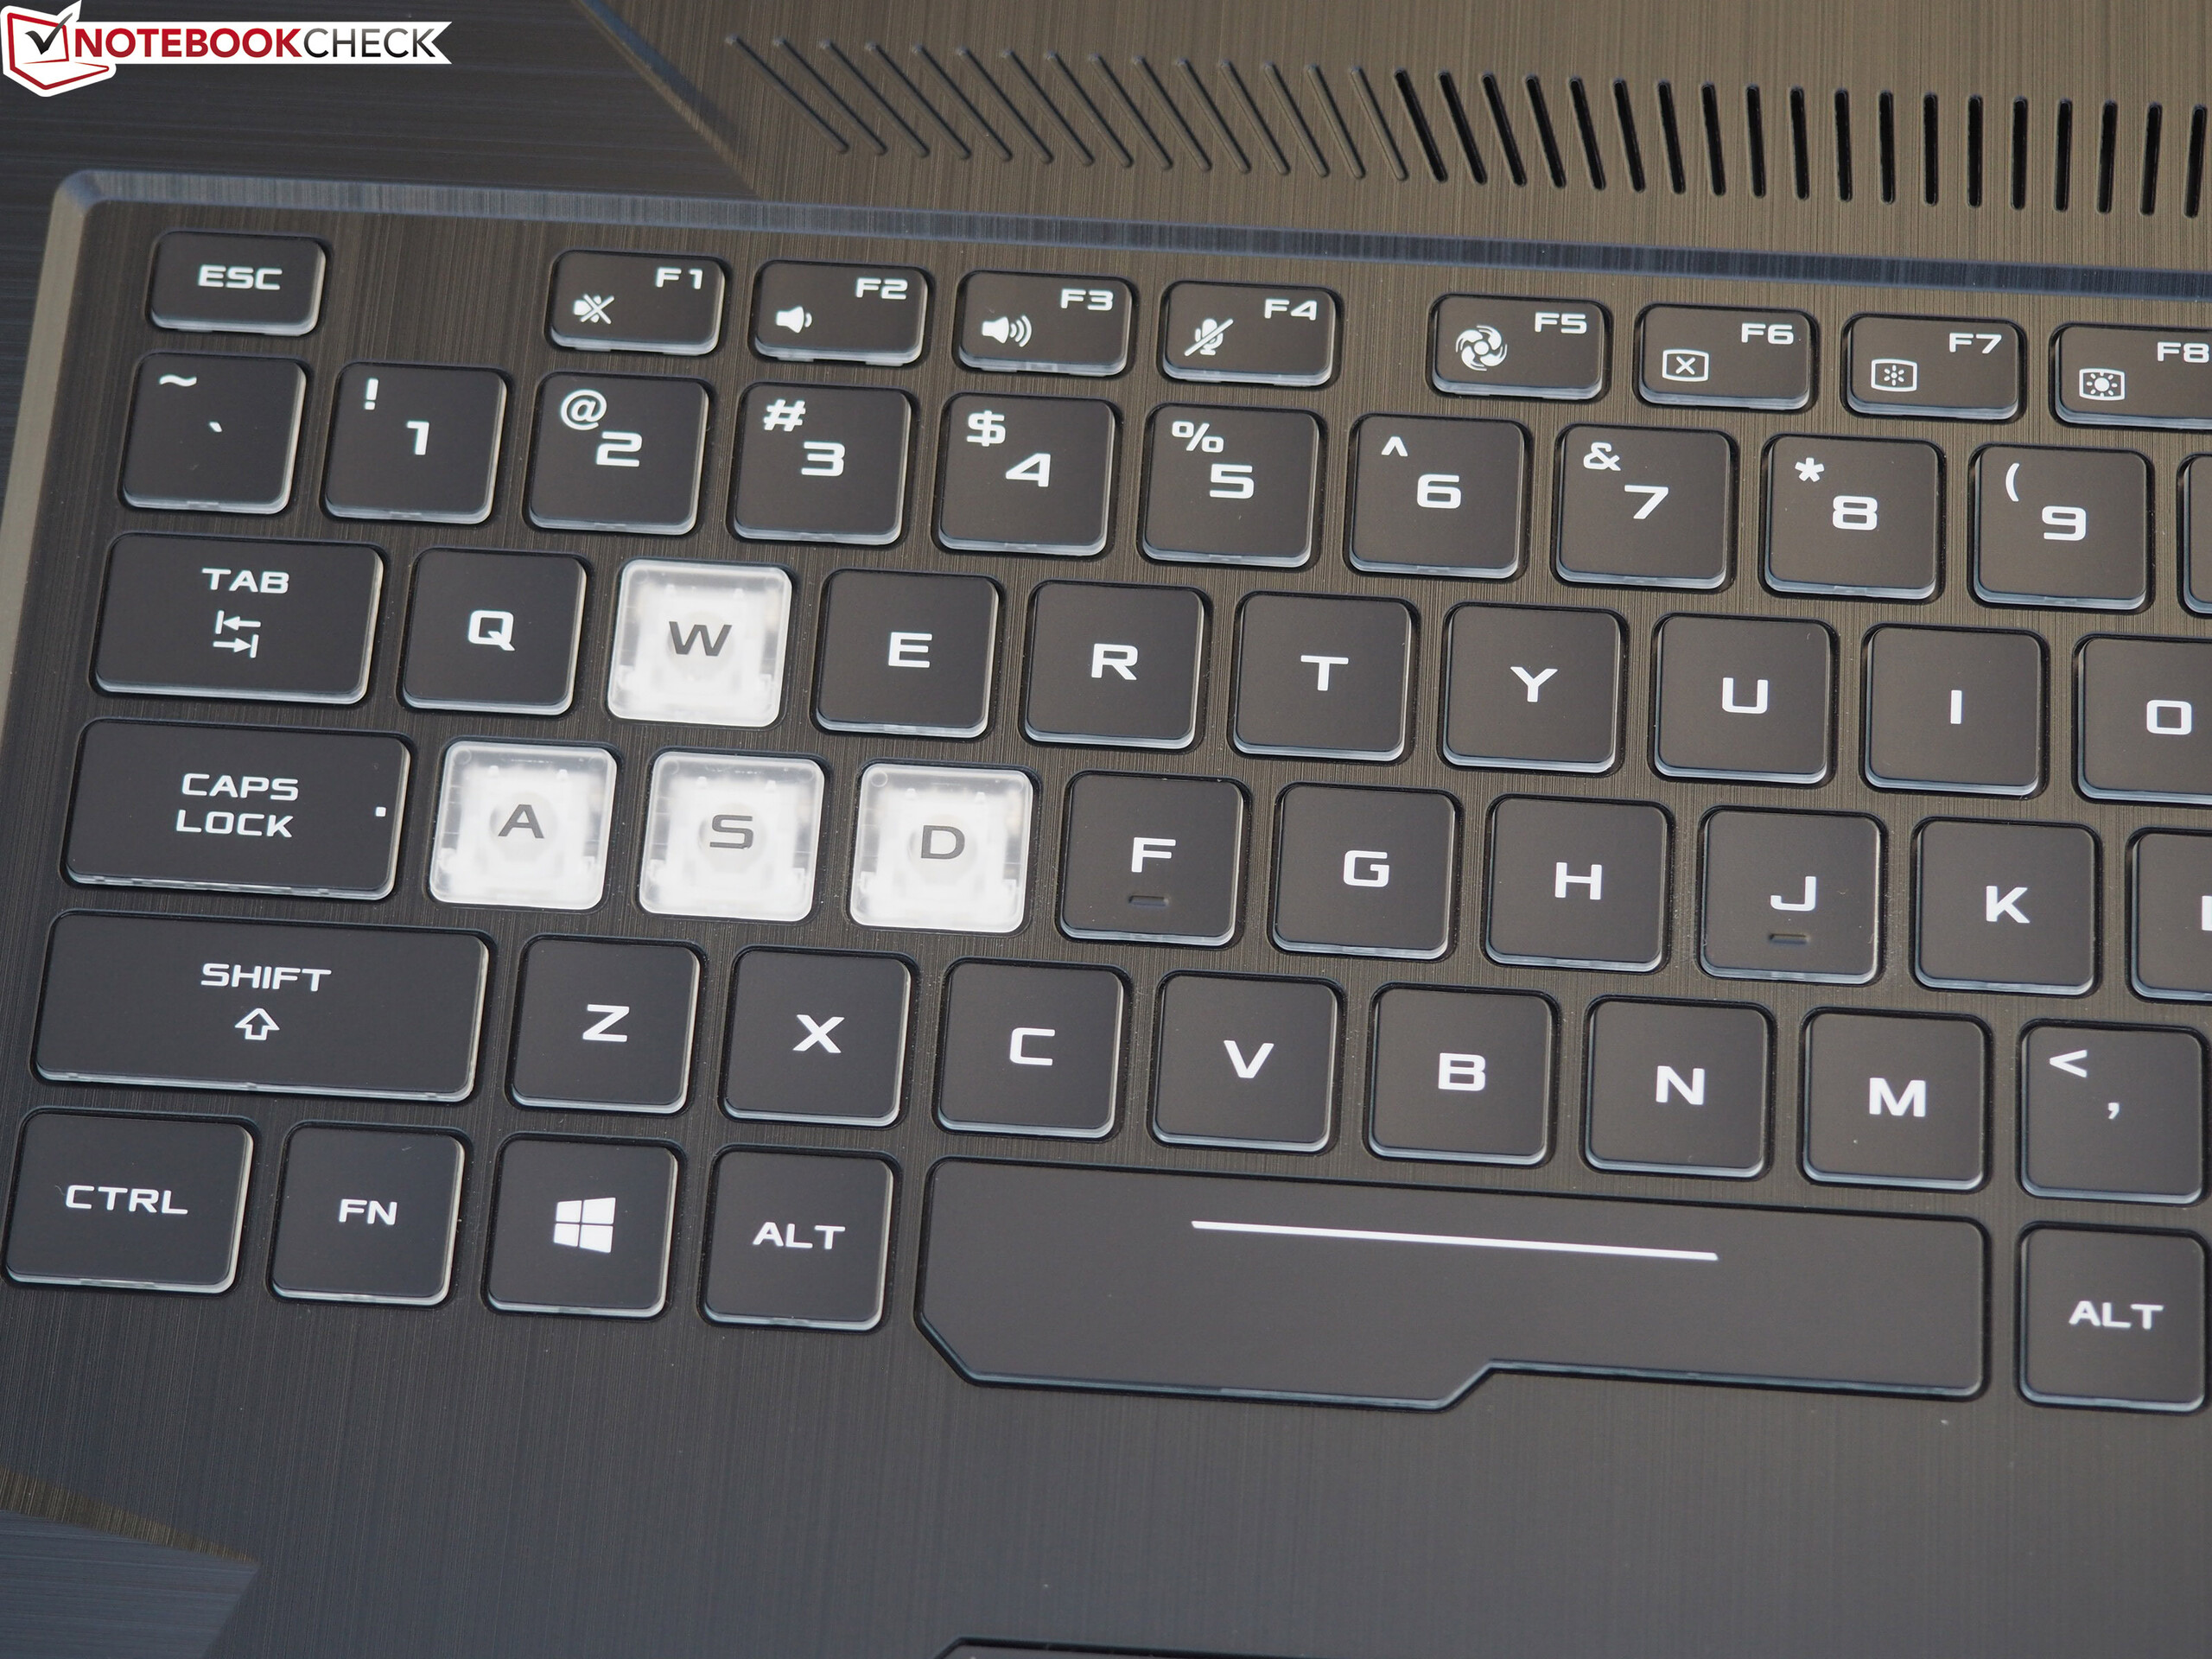
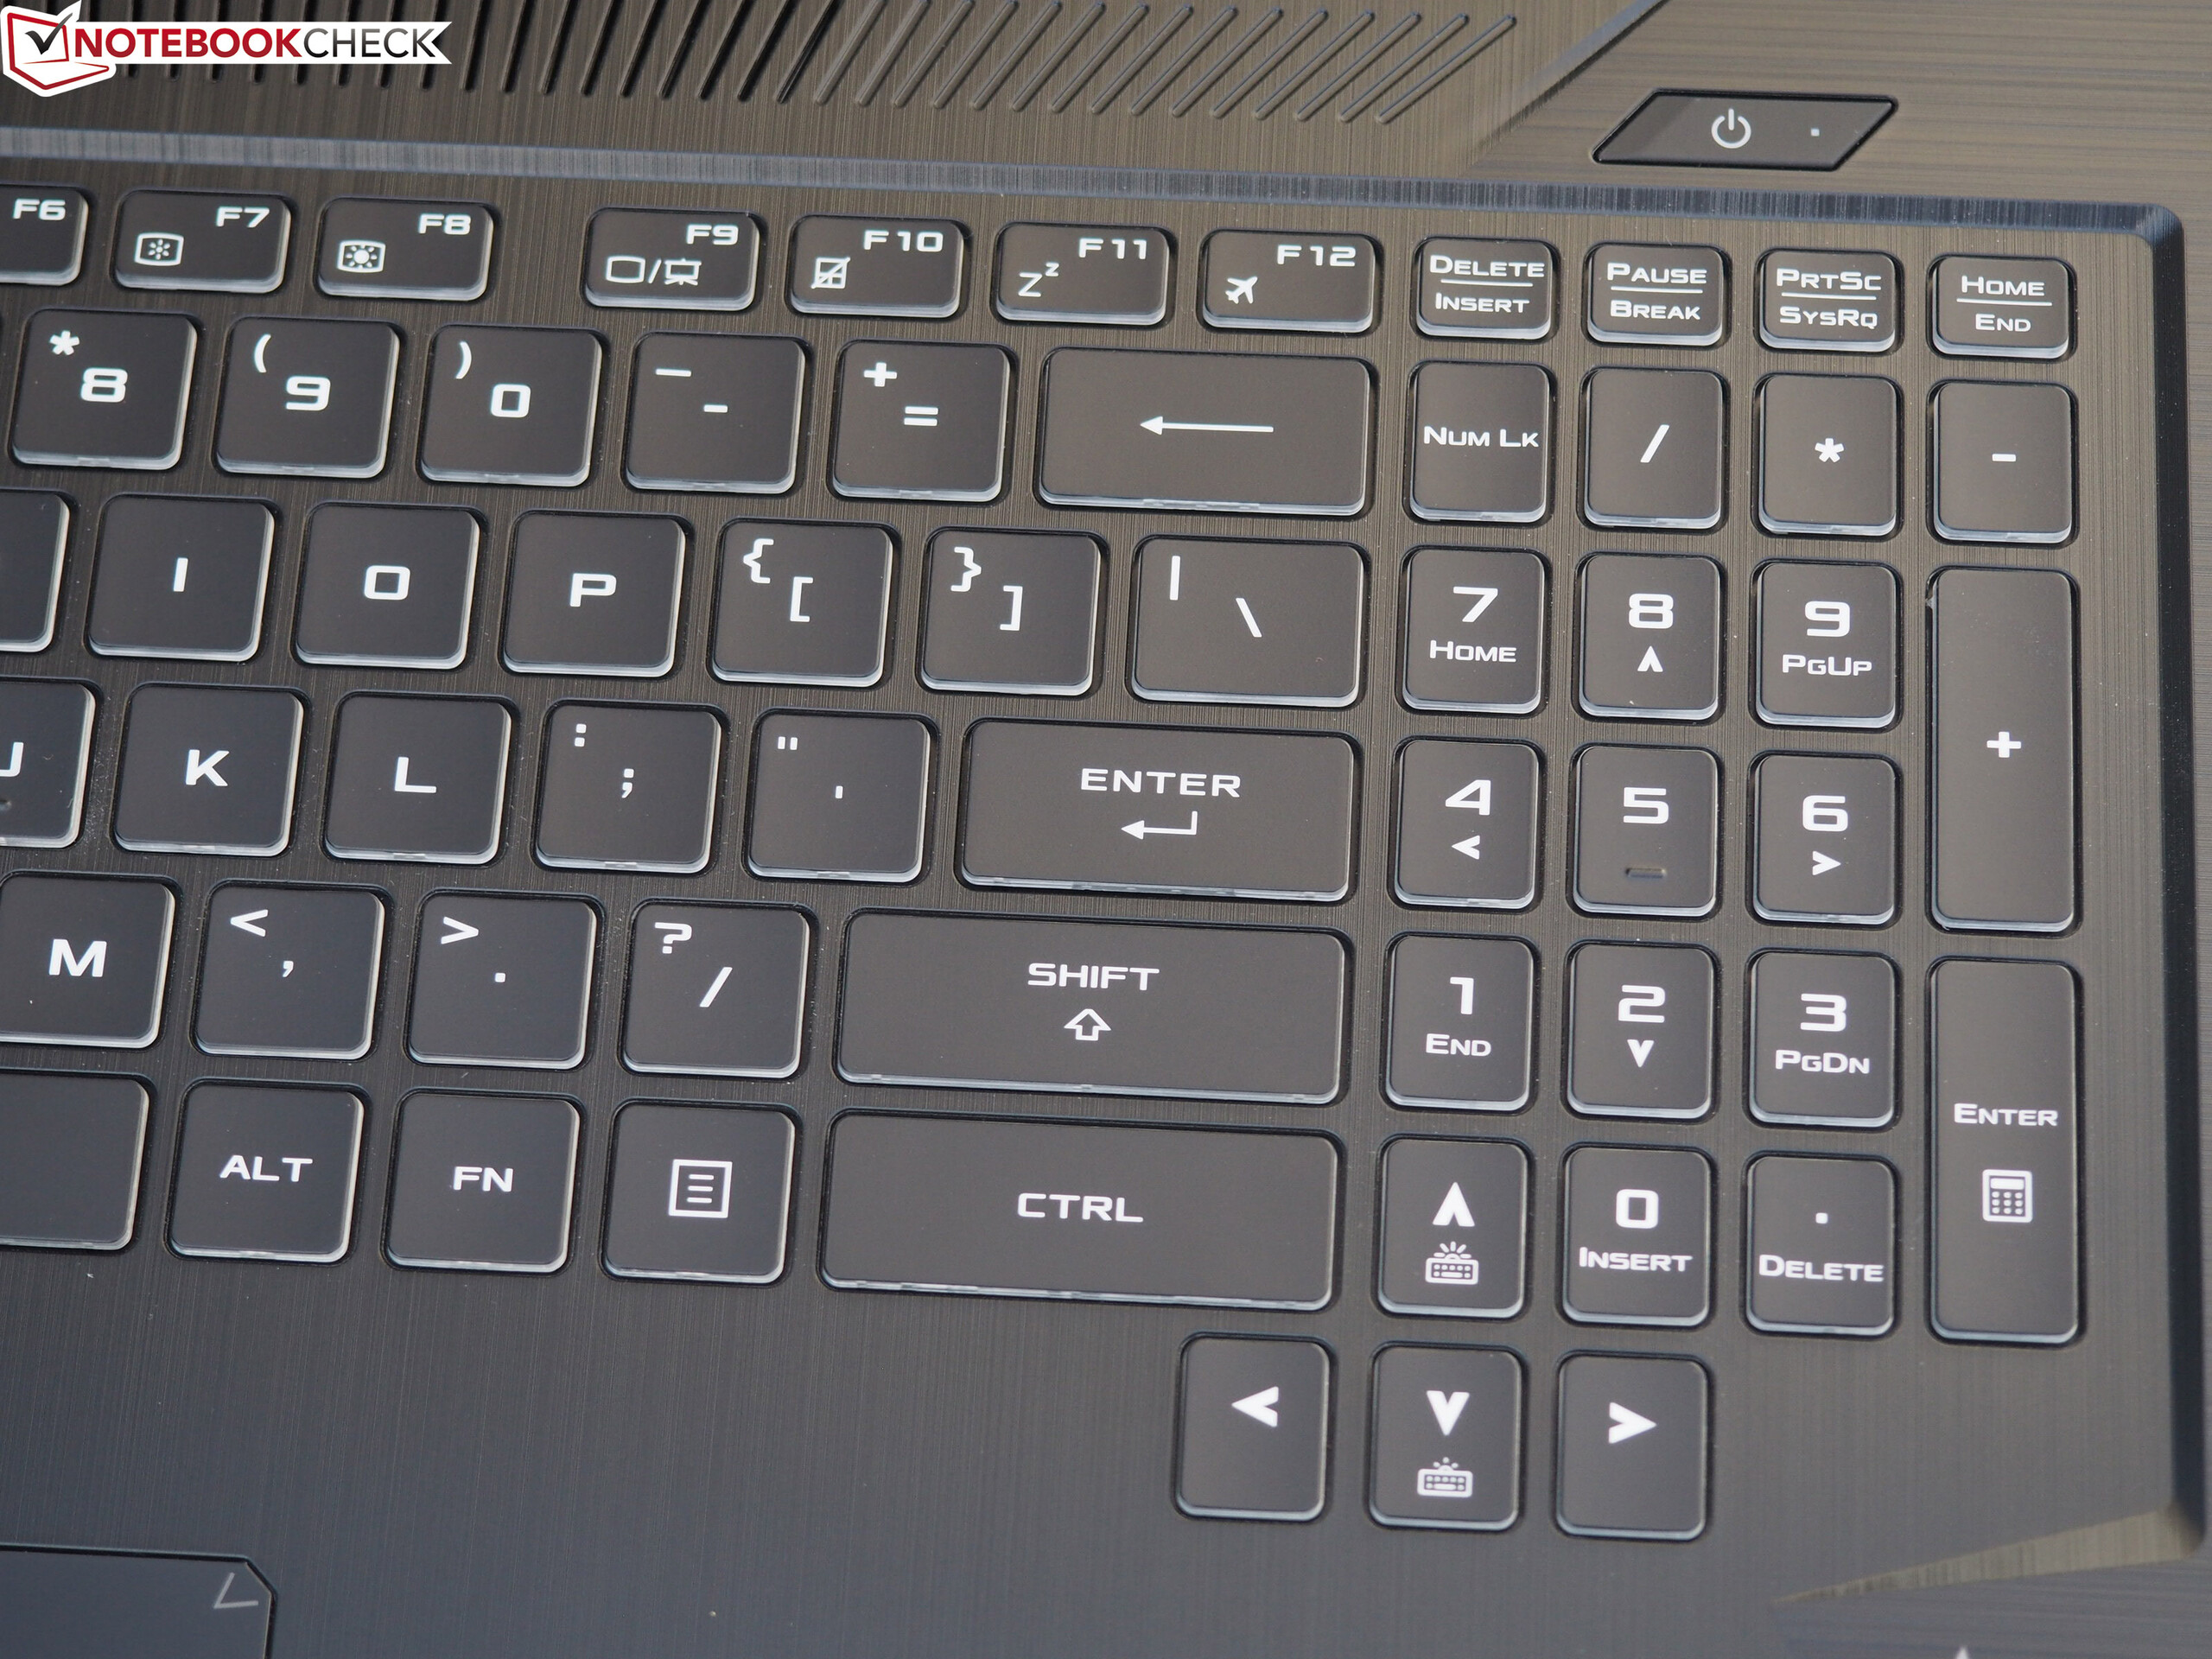
Den matta IPS-skärm med Full HD-upplösning får poäng för bra betraktningsvinklar och mer än godtagbar färgprecision. Den har också helt okej ljusstyrka och kontrast. Vidare har den ett RGB-bakgrundsbelyst tangentbord som passar bra för dagligt skrivande. Exceptionellt bra batteritid rundar av paketet.
Men vi får dra av poäng för det tillgängliga portutbudet. Precis som med syskonmodellerna vi också recenserat saknar den kortläsare och USB Typ C-portar. Den har dessutom bara en videoutgång. Om du tycker att ett stort utbud av portar är viktigt när du väljer laptop bör du leta någon annanstans. Lenovo Legion Y730-17ICH har exempelvis två videoutgångar och Thunderbolt 3.
Asus TUF FX705DT-AU068T
- 09/20/2019 v7 (old)
Sascha Mölck