Test: HP Pavilion 15-cs0053cl (i5-8250U, HD) Laptop (Sammanfattning)
| SD Card Reader | |
| average JPG Copy Test (av. of 3 runs) | |
| Dell XPS 15 9570 i7 UHD (Toshiba Exceria Pro SDXC 64 GB UHS-II) | |
| HP Spectre x360 15-ch011nr (Toshiba Exceria Pro SDXC 64 GB UHS-II) | |
| HP Pavilion 15-cs0053cl (Toshiba Exceria Pro SDXC 64 GB UHS-II) | |
| maximum AS SSD Seq Read Test (1GB) | |
| HP Spectre x360 15-ch011nr (Toshiba Exceria Pro SDXC 64 GB UHS-II) | |
| Dell XPS 15 9570 i7 UHD (Toshiba Exceria Pro SDXC 64 GB UHS-II) | |
| HP Pavilion 15-cs0053cl (Toshiba Exceria Pro SDXC 64 GB UHS-II) | |
| Networking | |
| iperf3 transmit AX12 | |
| Dell XPS 15 9570 i7 UHD | |
| HP Spectre x360 15-ch011nr | |
| HP Pavilion 15-cs0053cl | |
| iperf3 receive AX12 | |
| HP Spectre x360 15-ch011nr | |
| Dell XPS 15 9570 i7 UHD | |
| HP Pavilion 15-cs0053cl | |
| |||||||||||||||||||||||||
Distribution av ljusstyrkan: 93 %
Mitt på batteriet: 220.1 cd/m²
Kontrast: 759:1 (Svärta: 0.29 cd/m²)
ΔE ColorChecker Calman: 11.4 | ∀{0.5-29.43 Ø4.71}
calibrated: 4.09
ΔE Greyscale Calman: 12 | ∀{0.09-98 Ø4.96}
57.5% sRGB (Argyll 1.6.3 3D)
36.5% AdobeRGB 1998 (Argyll 1.6.3 3D)
39.65% AdobeRGB 1998 (Argyll 3D)
57.7% sRGB (Argyll 3D)
38.37% Display P3 (Argyll 3D)
Gamma: 2.09
CCT: 12625 K
| HP Pavilion 15-cs0053cl AU Optronics B156XW02 V0, TN LED, 15.6", 1366x768 | Asus VivoBook 15 X570UD AU Optronics B156HAN06.1, IPS, 15.6", 1920x1080 | Dell Inspiron 15 5579-9672 AUO, B156HW01, IPS, 15.6", 1920x1080 | Acer Aspire 3 A315-41-R7BM Chi Mei CMN15D5, TN LED, 15.6", 1920x1080 | Dell XPS 15 2018 i5 FHD 97Wh Sharp SHP149A LQ156M1, LED IGZO IPS InfinityEdge, 15.6", 1920x1080 | |
|---|---|---|---|---|---|
| Display | 1% | -4% | 4% | 69% | |
| Display P3 Coverage (%) | 38.37 | 38.66 1% | 37 -4% | 40.09 4% | 66 72% |
| sRGB Coverage (%) | 57.7 | 57.9 0% | 55.6 -4% | 59.7 3% | 96.5 67% |
| AdobeRGB 1998 Coverage (%) | 39.65 | 39.94 1% | 38.23 -4% | 41.47 5% | 66.7 68% |
| Response Times | -33% | -43% | 4% | -55% | |
| Response Time Grey 50% / Grey 80% * (ms) | 43.6 ? | 32 ? 27% | 41 ? 6% | 44 ? -1% | 49 ? -12% |
| Response Time Black / White * (ms) | 15.2 ? | 29.2 ? -92% | 29 ? -91% | 14 ? 8% | 30 ? -97% |
| PWM Frequency (Hz) | 25000 ? | 961 ? | |||
| Screen | 23% | 29% | -4% | 60% | |
| Brightness middle (cd/m²) | 220.1 | 240.1 9% | 251 14% | 234 6% | 413 88% |
| Brightness (cd/m²) | 210 | 233 11% | 240 14% | 211 0% | 378 80% |
| Brightness Distribution (%) | 93 | 91 -2% | 84 -10% | 83 -11% | 86 -8% |
| Black Level * (cd/m²) | 0.29 | 0.23 21% | 0.2 31% | 0.43 -48% | 0.29 -0% |
| Contrast (:1) | 759 | 1044 38% | 1255 65% | 544 -28% | 1424 88% |
| Colorchecker dE 2000 * | 11.4 | 4.25 63% | 5.25 54% | 11.27 1% | 2.44 79% |
| Colorchecker dE 2000 max. * | 25.96 | 17.84 31% | 10.04 61% | 18.03 31% | 4.46 83% |
| Colorchecker dE 2000 calibrated * | 4.09 | 4 2% | 2.48 39% | ||
| Greyscale dE 2000 * | 12 | 2.8 77% | 3.28 73% | 11.54 4% | 2.48 79% |
| Gamma | 2.09 105% | 2.3 96% | 2.15 102% | 2.09 105% | 2.43 91% |
| CCT | 12625 51% | 6503 100% | 6502 100% | 11607 56% | 7006 93% |
| Color Space (Percent of AdobeRGB 1998) (%) | 36.5 | 36.8 1% | 35 -4% | 38 4% | 62 70% |
| Color Space (Percent of sRGB) (%) | 57.5 | 57.8 1% | 55 -4% | 60 4% | 96 67% |
| Totalt genomsnitt (program/inställningar) | -3% /
12% | -6% /
13% | 1% /
-1% | 25% /
48% |
* ... mindre är bättre
Visa svarstider
| ↔ Svarstid svart till vitt | ||
|---|---|---|
| 15.2 ms ... stiga ↗ och falla ↘ kombinerat | ↗ 10 ms stiga | 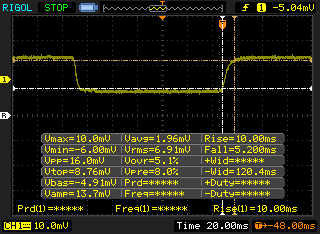 |
| ↘ 5.2 ms hösten | ||
| Skärmen visar bra svarsfrekvens i våra tester, men kan vara för långsam för konkurrenskraftiga spelare. I jämförelse sträcker sig alla testade enheter från 0.1 (minst) till 240 (maximalt) ms. » 37 % av alla enheter är bättre. Det betyder att den uppmätta svarstiden är bättre än genomsnittet av alla testade enheter (19.8 ms). | ||
| ↔ Svarstid 50 % grått till 80 % grått | ||
| 43.6 ms ... stiga ↗ och falla ↘ kombinerat | ↗ 20 ms stiga | 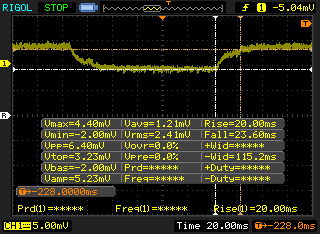 |
| ↘ 23.6 ms hösten | ||
| Skärmen visar långsamma svarsfrekvenser i våra tester och kommer att vara otillfredsställande för spelare. I jämförelse sträcker sig alla testade enheter från 0.165 (minst) till 636 (maximalt) ms. » 73 % av alla enheter är bättre. Detta innebär att den uppmätta svarstiden är sämre än genomsnittet av alla testade enheter (31 ms). | ||
Skärmflimmer / PWM (Puls-Width Modulation)
| Skärmflimmer / PWM upptäcktes inte |  | ||
Som jämförelse: 52 % av alla testade enheter använder inte PWM för att dämpa skärmen. Om PWM upptäcktes mättes ett medelvärde av 7754 (minst: 5 - maximum: 343500) Hz. | |||
| Cinebench R11.5 | |
| CPU Single 64Bit | |
| HP Pavilion 15-cs0053cl | |
| Genomsnitt Intel Core i5-8250U (0.91 - 1.79, n=35) | |
| HP Envy x360 15-bq102ng | |
| CPU Multi 64Bit | |
| HP Envy x360 15-bq102ng | |
| Genomsnitt Intel Core i5-8250U (3.15 - 7.76, n=35) | |
| HP Pavilion 15-cs0053cl | |
| PCMark 8 | |
| Home Score Accelerated v2 | |
| Asus VivoBook 15 X570UD | |
| HP Pavilion 15-cs0053cl | |
| Genomsnitt Intel Core i5-8250U, Intel UHD Graphics 620 (2986 - 4458, n=69) | |
| HP Spectre x360 15-ch011nr | |
| Acer Aspire 3 A315-41-R7BM | |
| HP Envy x360 15m-bq121dx | |
| Dell Inspiron 15 5579-9672 | |
| Work Score Accelerated v2 | |
| HP Pavilion 15-cs0053cl | |
| Genomsnitt Intel Core i5-8250U, Intel UHD Graphics 620 (2699 - 5106, n=58) | |
| Acer Aspire 3 A315-41-R7BM | |
| Dell Inspiron 15 5579-9672 | |
| HP Spectre x360 15-ch011nr | |
| PCMark 8 Home Score Accelerated v2 | 3675 poäng | |
| PCMark 8 Work Score Accelerated v2 | 4654 poäng | |
| PCMark 10 Score | 3250 poäng | |
Hjälp | ||
| HP Pavilion 15-cs0053cl Toshiba MQ04ABF100 | HP Envy x360 15m-bq121dx HGST Travelstar 7K1000 HTS721010A9E630 | Dell G3 15 3579 Seagate Mobile HDD 1TB ST1000LX015-1U7172 | Asus VivoBook 15 X570UD SK hynix PC300 HFS512GD9MND | Dell Inspiron 15 5579-9672 SK hynix SC311 SATA | |
|---|---|---|---|---|---|
| CrystalDiskMark 5.2 / 6 | -22% | -44% | 6194% | 3535% | |
| Write 4K (MB/s) | 3.885 | 1.168 -70% | 0.202 -95% | 95.9 2368% | 48.25 1142% |
| Read 4K (MB/s) | 0.426 | 0.536 26% | 0.461 8% | 31.32 7252% | 23.77 5480% |
| Write Seq (MB/s) | 121 | 114.1 -6% | 53.5 -56% | 746 517% | 444.9 268% |
| Read Seq (MB/s) | 142.6 | 114.9 -19% | 107.2 -25% | 1347 845% | 497.5 249% |
| Write 4K Q32T1 (MB/s) | 4.249 | 1.212 -71% | 0.882 -79% | 294.6 6833% | 223.5 5160% |
| Read 4K Q32T1 (MB/s) | 1.106 | 1.189 8% | 1.057 -4% | 334 30099% | 171.8 15433% |
| Write Seq Q32T1 (MB/s) | 134.3 | 113.2 -16% | 63.7 -53% | 766 470% | 511 280% |
| Read Seq Q32T1 (MB/s) | 149.8 | 114.1 -24% | 77.1 -49% | 1896 1166% | 553 269% |
| Write 4K Q8T8 (MB/s) | 310.2 | ||||
| Read 4K Q8T8 (MB/s) | 349.5 |

| 3DMark 11 | |
| 1280x720 Performance GPU | |
| HP Spectre x360 15-ch011nr | |
| Acer Swift 3 SF315-41-R6J9 | |
| HP Envy x360 15-bq102ng | |
| Dell Latitude 5491 | |
| Asus VivoBook S410UQ-NH74 | |
| Dell XPS 13 9360 FHD i7 Iris | |
| Genomsnitt Intel UHD Graphics 620 (1144 - 3432, n=244) | |
| HP Pavilion 15-cs0053cl | |
| Asus ZenBook Flip S UX370 | |
| HP Stream 14-ax002ng | |
| 1280x720 Performance Combined | |
| HP Spectre x360 15-ch011nr | |
| Dell Latitude 5491 | |
| Acer Swift 3 SF315-41-R6J9 | |
| HP Envy x360 15-bq102ng | |
| Asus VivoBook S410UQ-NH74 | |
| Dell XPS 13 9360 FHD i7 Iris | |
| Genomsnitt Intel UHD Graphics 620 (927 - 2505, n=244) | |
| Asus ZenBook Flip S UX370 | |
| HP Pavilion 15-cs0053cl | |
| HP Stream 14-ax002ng | |
| 3DMark | |
| 1280x720 Cloud Gate Standard Graphics | |
| HP Spectre x360 15-ch011nr | |
| Acer Swift 3 SF315-41-R6J9 | |
| HP Envy x360 15-bq102ng | |
| Dell Latitude 5491 | |
| Dell XPS 13 9360 FHD i7 Iris | |
| Asus VivoBook S410UQ-NH74 | |
| LG Gram 15Z980-B.AA78B | |
| Genomsnitt Intel UHD Graphics 620 (6205 - 16400, n=225) | |
| Asus ZenBook Flip S UX370 | |
| HP Pavilion 15-cs0053cl | |
| 1920x1080 Fire Strike Graphics | |
| HP Spectre x360 15-ch011nr | |
| Acer Swift 3 SF315-41-R6J9 | |
| Dell Latitude 5491 | |
| HP Envy x360 15-bq102ng | |
| Asus VivoBook S410UQ-NH74 | |
| Dell XPS 13 9360 FHD i7 Iris | |
| LG Gram 15Z980-B.AA78B | |
| Genomsnitt Intel UHD Graphics 620 (557 - 2608, n=213) | |
| Asus ZenBook Flip S UX370 | |
| 1920x1080 Ice Storm Extreme Graphics | |
| HP Envy x360 15-bq102ng | |
| Asus ZenBook Flip S UX370 | |
| Genomsnitt Intel UHD Graphics 620 (26409 - 59483, n=71) | |
| 3DMark 11 Performance | 1840 poäng | |
| 3DMark Cloud Gate Standard Score | 7721 poäng | |
Hjälp | ||
| låg | med. | hög | ultra | |
|---|---|---|---|---|
| BioShock Infinite (2013) | 39.2 | 18.3 | 15.7 | |
| Metro: Last Light (2013) | 23.3 | 16.4 | ||
| Rise of the Tomb Raider (2016) | 10.4 | 6.5 |
Ljudnivå
| Låg belastning |
| 31.7 / 31.7 / 32 dB(A) |
| Hög belastning |
| 32.8 / 35 dB(A) |
 | ||
30 dB tyst 40 dB(A) hörbar 50 dB(A) högt ljud |
||
min: | ||
| HP Pavilion 15-cs0053cl UHD Graphics 620, i5-8250U, Toshiba MQ04ABF100 | Asus VivoBook 15 X570UD GeForce GTX 1050 Mobile, i5-8550U, SK hynix PC300 HFS512GD9MND | Dell Inspiron 15 5579-9672 UHD Graphics 620, i5-8250U, SK hynix SC311 SATA | Acer Aspire 3 A315-41-R7BM Vega 3, R3 2200U, SK Hynix HFS256G39TND-N210A | LG Gram 15Z980-B.AA78B UHD Graphics 620, i5-8550U, SK Hynix Canvas SC300 512GB M.2 (HFS512G39TNF) | HP Envy x360 15m-bq121dx Vega 8, R5 2500U, HGST Travelstar 7K1000 HTS721010A9E630 | |
|---|---|---|---|---|---|---|
| Noise | -8% | 3% | -5% | 0% | -9% | |
| av / miljö * (dB) | 28.2 | 29.2 -4% | 30.4 -8% | 30.3 -7% | 29.7 -5% | 28.5 -1% |
| Idle Minimum * (dB) | 31.7 | 29.3 8% | 30.4 4% | 30.3 4% | 30.3 4% | 32.3 -2% |
| Idle Average * (dB) | 31.7 | 29.5 7% | 30.4 4% | 30.3 4% | 30.3 4% | 32.4 -2% |
| Idle Maximum * (dB) | 32 | 30.5 5% | 31.2 2% | 30.9 3% | 31.1 3% | 34.2 -7% |
| Load Average * (dB) | 32.8 | 41.2 -26% | 31.5 4% | 37.8 -15% | 34.9 -6% | 36.2 -10% |
| Load Maximum * (dB) | 35 | 47.2 -35% | 31.5 10% | 40.6 -16% | 34.9 -0% | 45.3 -29% |
| Witcher 3 ultra * (dB) | 44 | 34.3 | 42.8 |
* ... mindre är bättre
(+) Den maximala temperaturen på ovansidan är 35.8 °C / 96 F, jämfört med genomsnittet av 36.8 °C / 98 F , allt från 21 till 71 °C för klassen Multimedia.
(±) Botten värms upp till maximalt 41.4 °C / 107 F, jämfört med genomsnittet av 39.1 °C / 102 F
(+) Vid tomgångsbruk är medeltemperaturen för ovansidan 24.4 °C / 76 F, jämfört med enhetsgenomsnittet på 31.3 °C / ### class_avg_f### F.
(+) Handledsstöden och pekplattan är kallare än hudtemperaturen med maximalt 26.8 °C / 80.2 F och är därför svala att ta på.
(±) Medeltemperaturen för handledsstödsområdet på liknande enheter var 28.7 °C / 83.7 F (+1.9 °C / 3.5 F).
HP Pavilion 15-cs0053cl ljudanalys
(±) | högtalarljudstyrkan är genomsnittlig men bra (72.1 dB)
Bas 100 - 315 Hz
(-) | nästan ingen bas - i genomsnitt 19.7% lägre än medianen
(-) | basen är inte linjär (15.7% delta till föregående frekvens)
Mellan 400 - 2000 Hz
(+) | balanserad mellan - endast 4.1% från medianen
(±) | linjäriteten för mids är genomsnittlig (7.9% delta till föregående frekvens)
Högsta 2 - 16 kHz
(+) | balanserade toppar - endast 2.1% från medianen
(±) | linjäriteten för toppar är genomsnittlig (7.3% delta till föregående frekvens)
Totalt 100 - 16 000 Hz
(±) | linjäriteten för det totala ljudet är genomsnittlig (21.8% skillnad mot median)
Jämfört med samma klass
» 77% av alla testade enheter i den här klassen var bättre, 5% liknande, 18% sämre
» Den bästa hade ett delta på 5%, genomsnittet var 17%, sämst var 45%
Jämfört med alla testade enheter
» 62% av alla testade enheter var bättre, 7% liknande, 31% sämre
» Den bästa hade ett delta på 4%, genomsnittet var 23%, sämst var 134%
Apple MacBook 12 (Early 2016) 1.1 GHz ljudanalys
(+) | högtalare kan spela relativt högt (83.6 dB)
Bas 100 - 315 Hz
(±) | reducerad bas - i genomsnitt 11.3% lägre än medianen
(±) | linjäriteten för basen är genomsnittlig (14.2% delta till föregående frekvens)
Mellan 400 - 2000 Hz
(+) | balanserad mellan - endast 2.4% från medianen
(+) | mids är linjära (5.5% delta till föregående frekvens)
Högsta 2 - 16 kHz
(+) | balanserade toppar - endast 2% från medianen
(+) | toppar är linjära (4.5% delta till föregående frekvens)
Totalt 100 - 16 000 Hz
(+) | det totala ljudet är linjärt (10.2% skillnad mot median)
Jämfört med samma klass
» 7% av alla testade enheter i den här klassen var bättre, 2% liknande, 90% sämre
» Den bästa hade ett delta på 5%, genomsnittet var 18%, sämst var 53%
Jämfört med alla testade enheter
» 5% av alla testade enheter var bättre, 1% liknande, 94% sämre
» Den bästa hade ett delta på 4%, genomsnittet var 23%, sämst var 134%
| Av/Standby | |
| Låg belastning | |
| Hög belastning |
|
Förklaring:
min: | |
| HP Pavilion 15-cs0053cl i5-8250U, UHD Graphics 620, Toshiba MQ04ABF100, TN LED, 1366x768, 15.6" | Asus VivoBook 15 X570UD i5-8550U, GeForce GTX 1050 Mobile, SK hynix PC300 HFS512GD9MND, IPS, 1920x1080, 15.6" | Dell Inspiron 15 5579-9672 i5-8250U, UHD Graphics 620, SK hynix SC311 SATA, IPS, 1920x1080, 15.6" | Acer Aspire 3 A315-41-R7BM R3 2200U, Vega 3, SK Hynix HFS256G39TND-N210A, TN LED, 1920x1080, 15.6" | HP Envy x360 15m-bq121dx R5 2500U, Vega 8, HGST Travelstar 7K1000 HTS721010A9E630, IPS, 1920x1080, 15.6" | LG Gram 15Z980-B.AA78B i5-8550U, UHD Graphics 620, SK Hynix Canvas SC300 512GB M.2 (HFS512G39TNF), IPS LED, 1920x1080, 15.6" | |
|---|---|---|---|---|---|---|
| Power Consumption | -80% | 4% | -19% | -32% | -17% | |
| Idle Minimum * (Watt) | 5.6 | 5.1 9% | 3.9 30% | 5.6 -0% | 5.9 -5% | 3.7 34% |
| Idle Average * (Watt) | 7.1 | 6.3 11% | 6.6 7% | 8.5 -20% | 8.7 -23% | 8.5 -20% |
| Idle Maximum * (Watt) | 7.9 | 10.5 -33% | 9.3 -18% | 8.4 -6% | 10.5 -33% | 10 -27% |
| Load Average * (Watt) | 32.8 | 82.2 -151% | 30.2 8% | 41 -25% | 45.7 -39% | 36 -10% |
| Load Maximum * (Watt) | 30.5 | 103.2 -238% | 33.2 -9% | 44.2 -45% | 49.4 -62% | 48.7 -60% |
| Witcher 3 ultra * (Watt) | 85.9 | 32 | 45.8 |
* ... mindre är bättre
| HP Pavilion 15-cs0053cl i5-8250U, UHD Graphics 620, 41 Wh | Asus VivoBook 15 X570UD i5-8550U, GeForce GTX 1050 Mobile, 48 Wh | Dell Inspiron 15 5579-9672 i5-8250U, UHD Graphics 620, 42 Wh | Acer Aspire 3 A315-41-R7BM R3 2200U, Vega 3, 37 Wh | Dell XPS 15 9570 i7 UHD i7-8750H, GeForce GTX 1050 Ti Max-Q, 97 Wh | HP Envy x360 15m-bq121dx R5 2500U, Vega 8, 55.8 Wh | |
|---|---|---|---|---|---|---|
| Batteridrifttid | -24% | -7% | -27% | -2% | -19% | |
| Reader / Idle (h) | 12 | 11.2 -7% | 8.9 -26% | 10.9 -9% | ||
| WiFi v1.3 (h) | 7 | 5.3 -24% | 7.3 4% | 5.7 -19% | 9.6 37% | 6.6 -6% |
| Load (h) | 2.2 | 1.8 -18% | 1.4 -36% | 1.3 -41% | 1.3 -41% | |
| Witcher 3 ultra (h) | 1 |
För
Emot
Läs den fullständiga versionen av den här recensionen på engelska här.
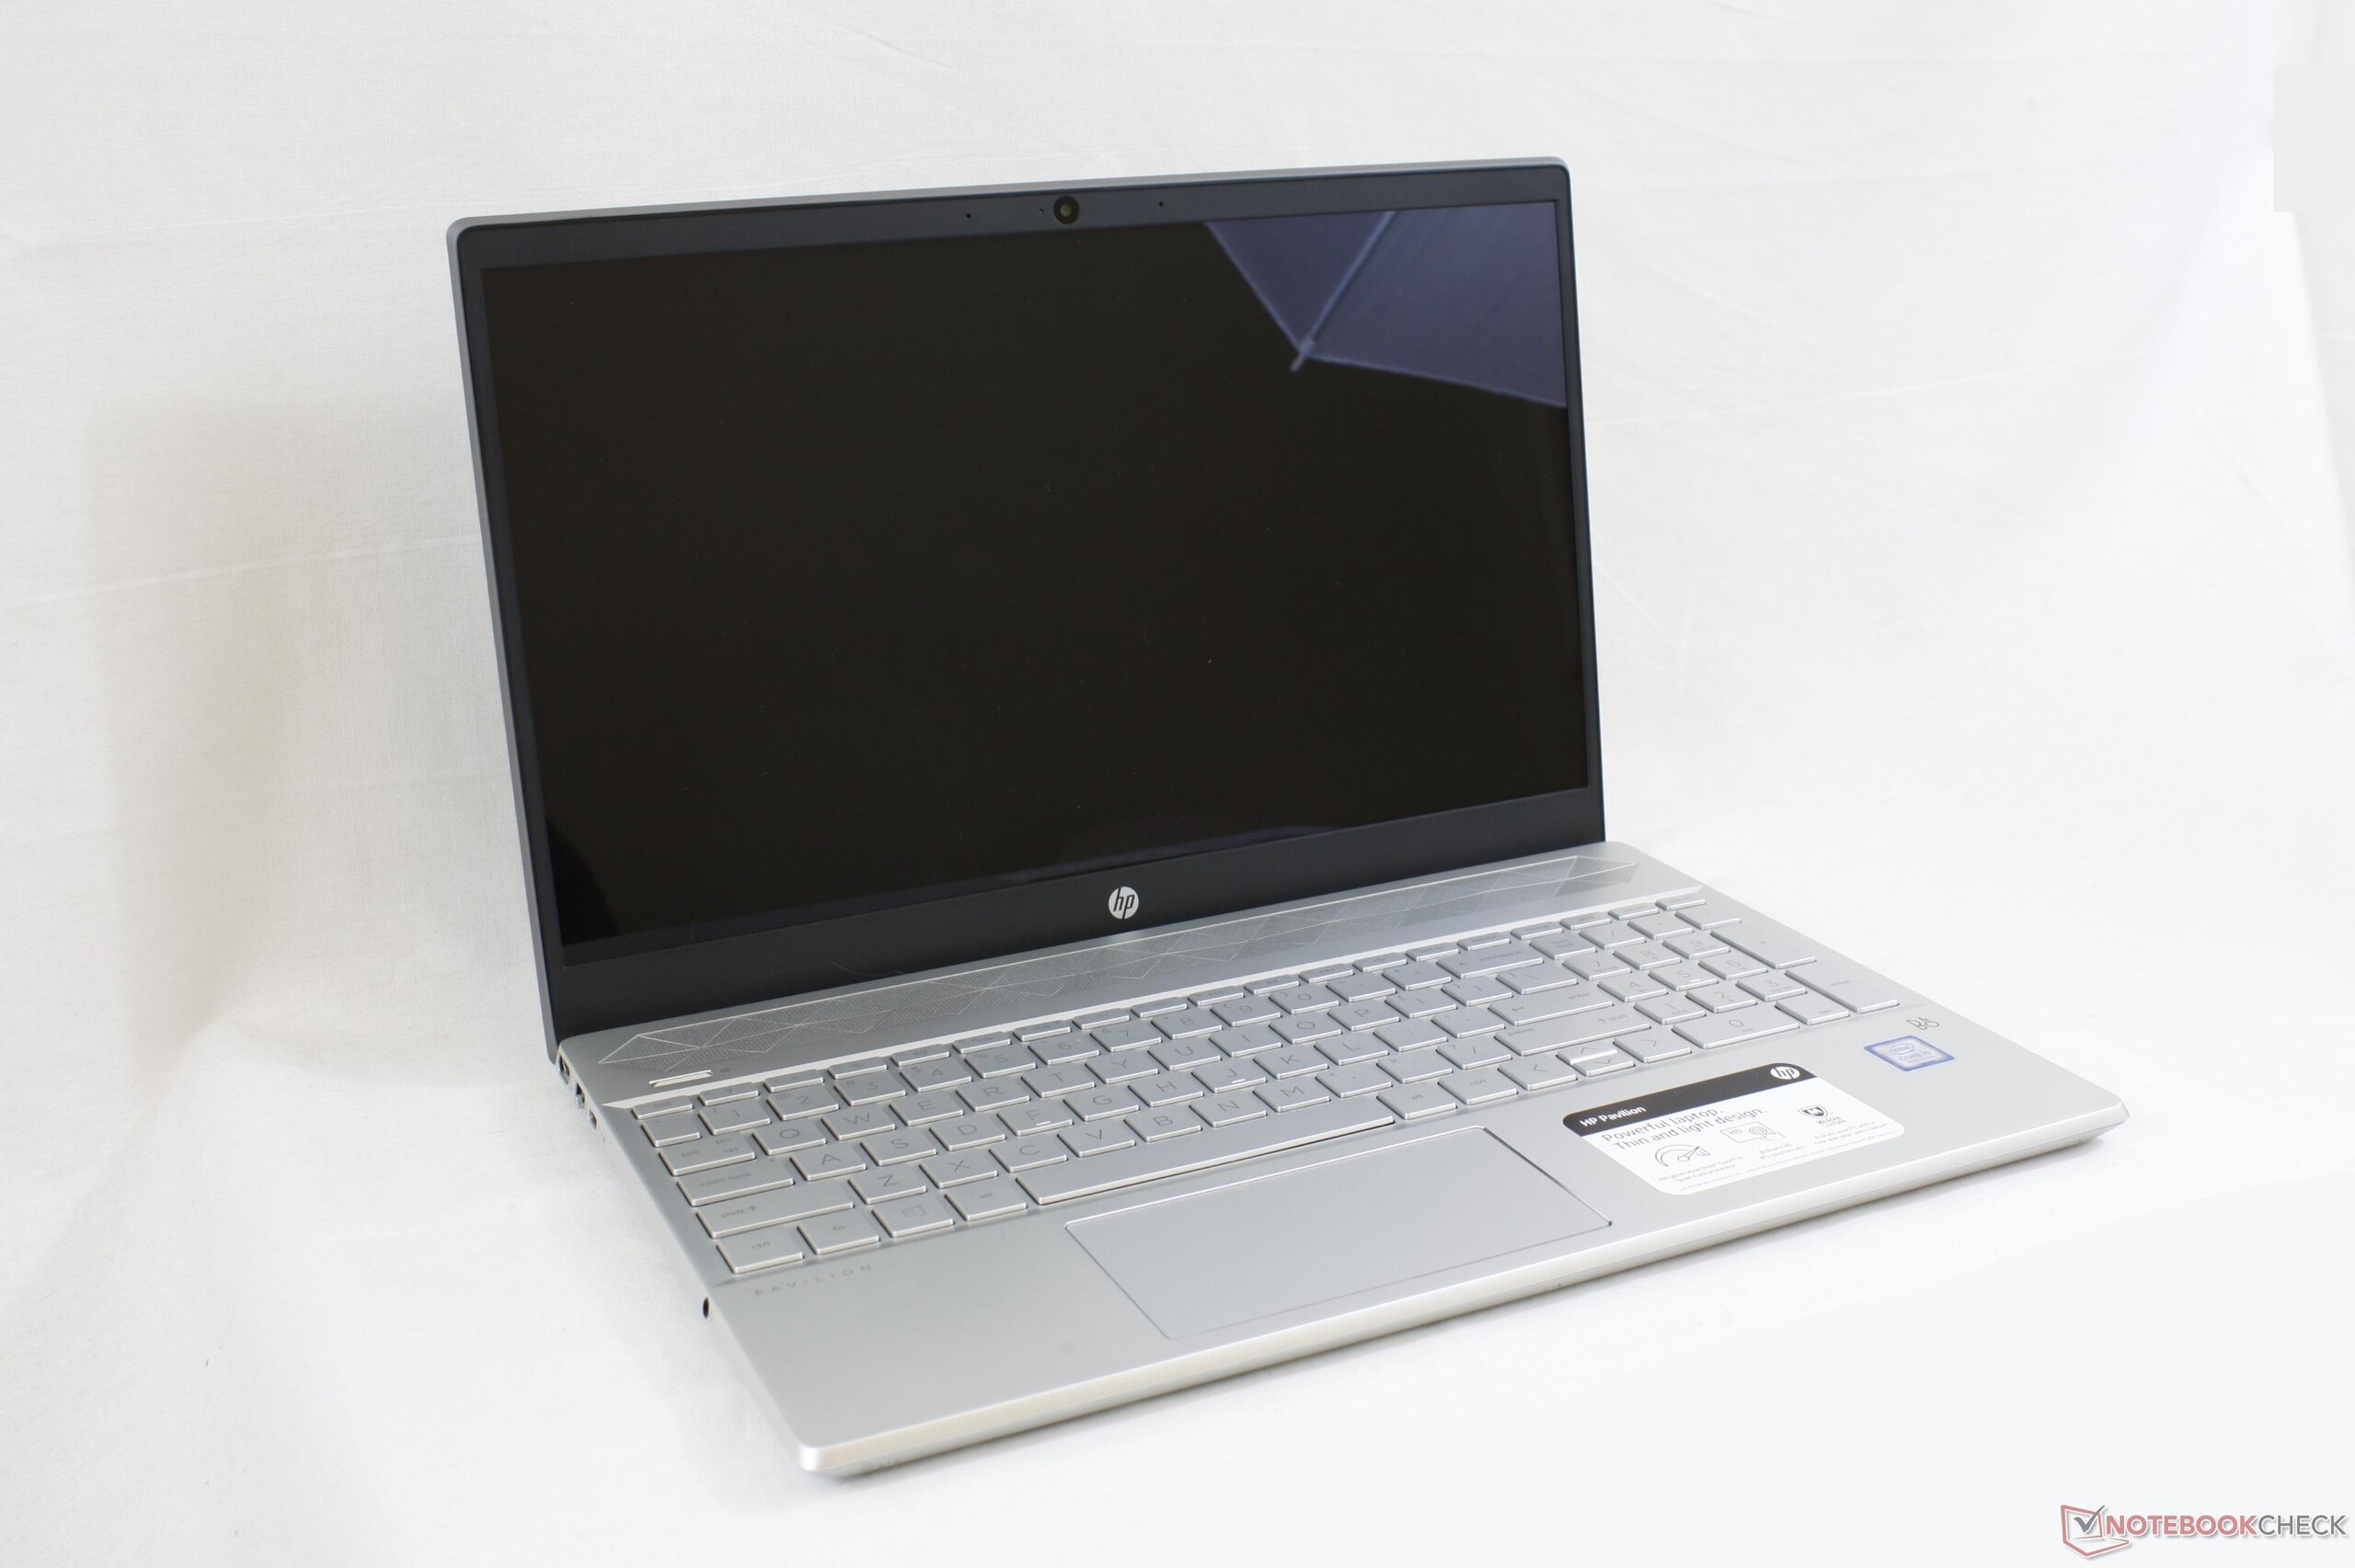
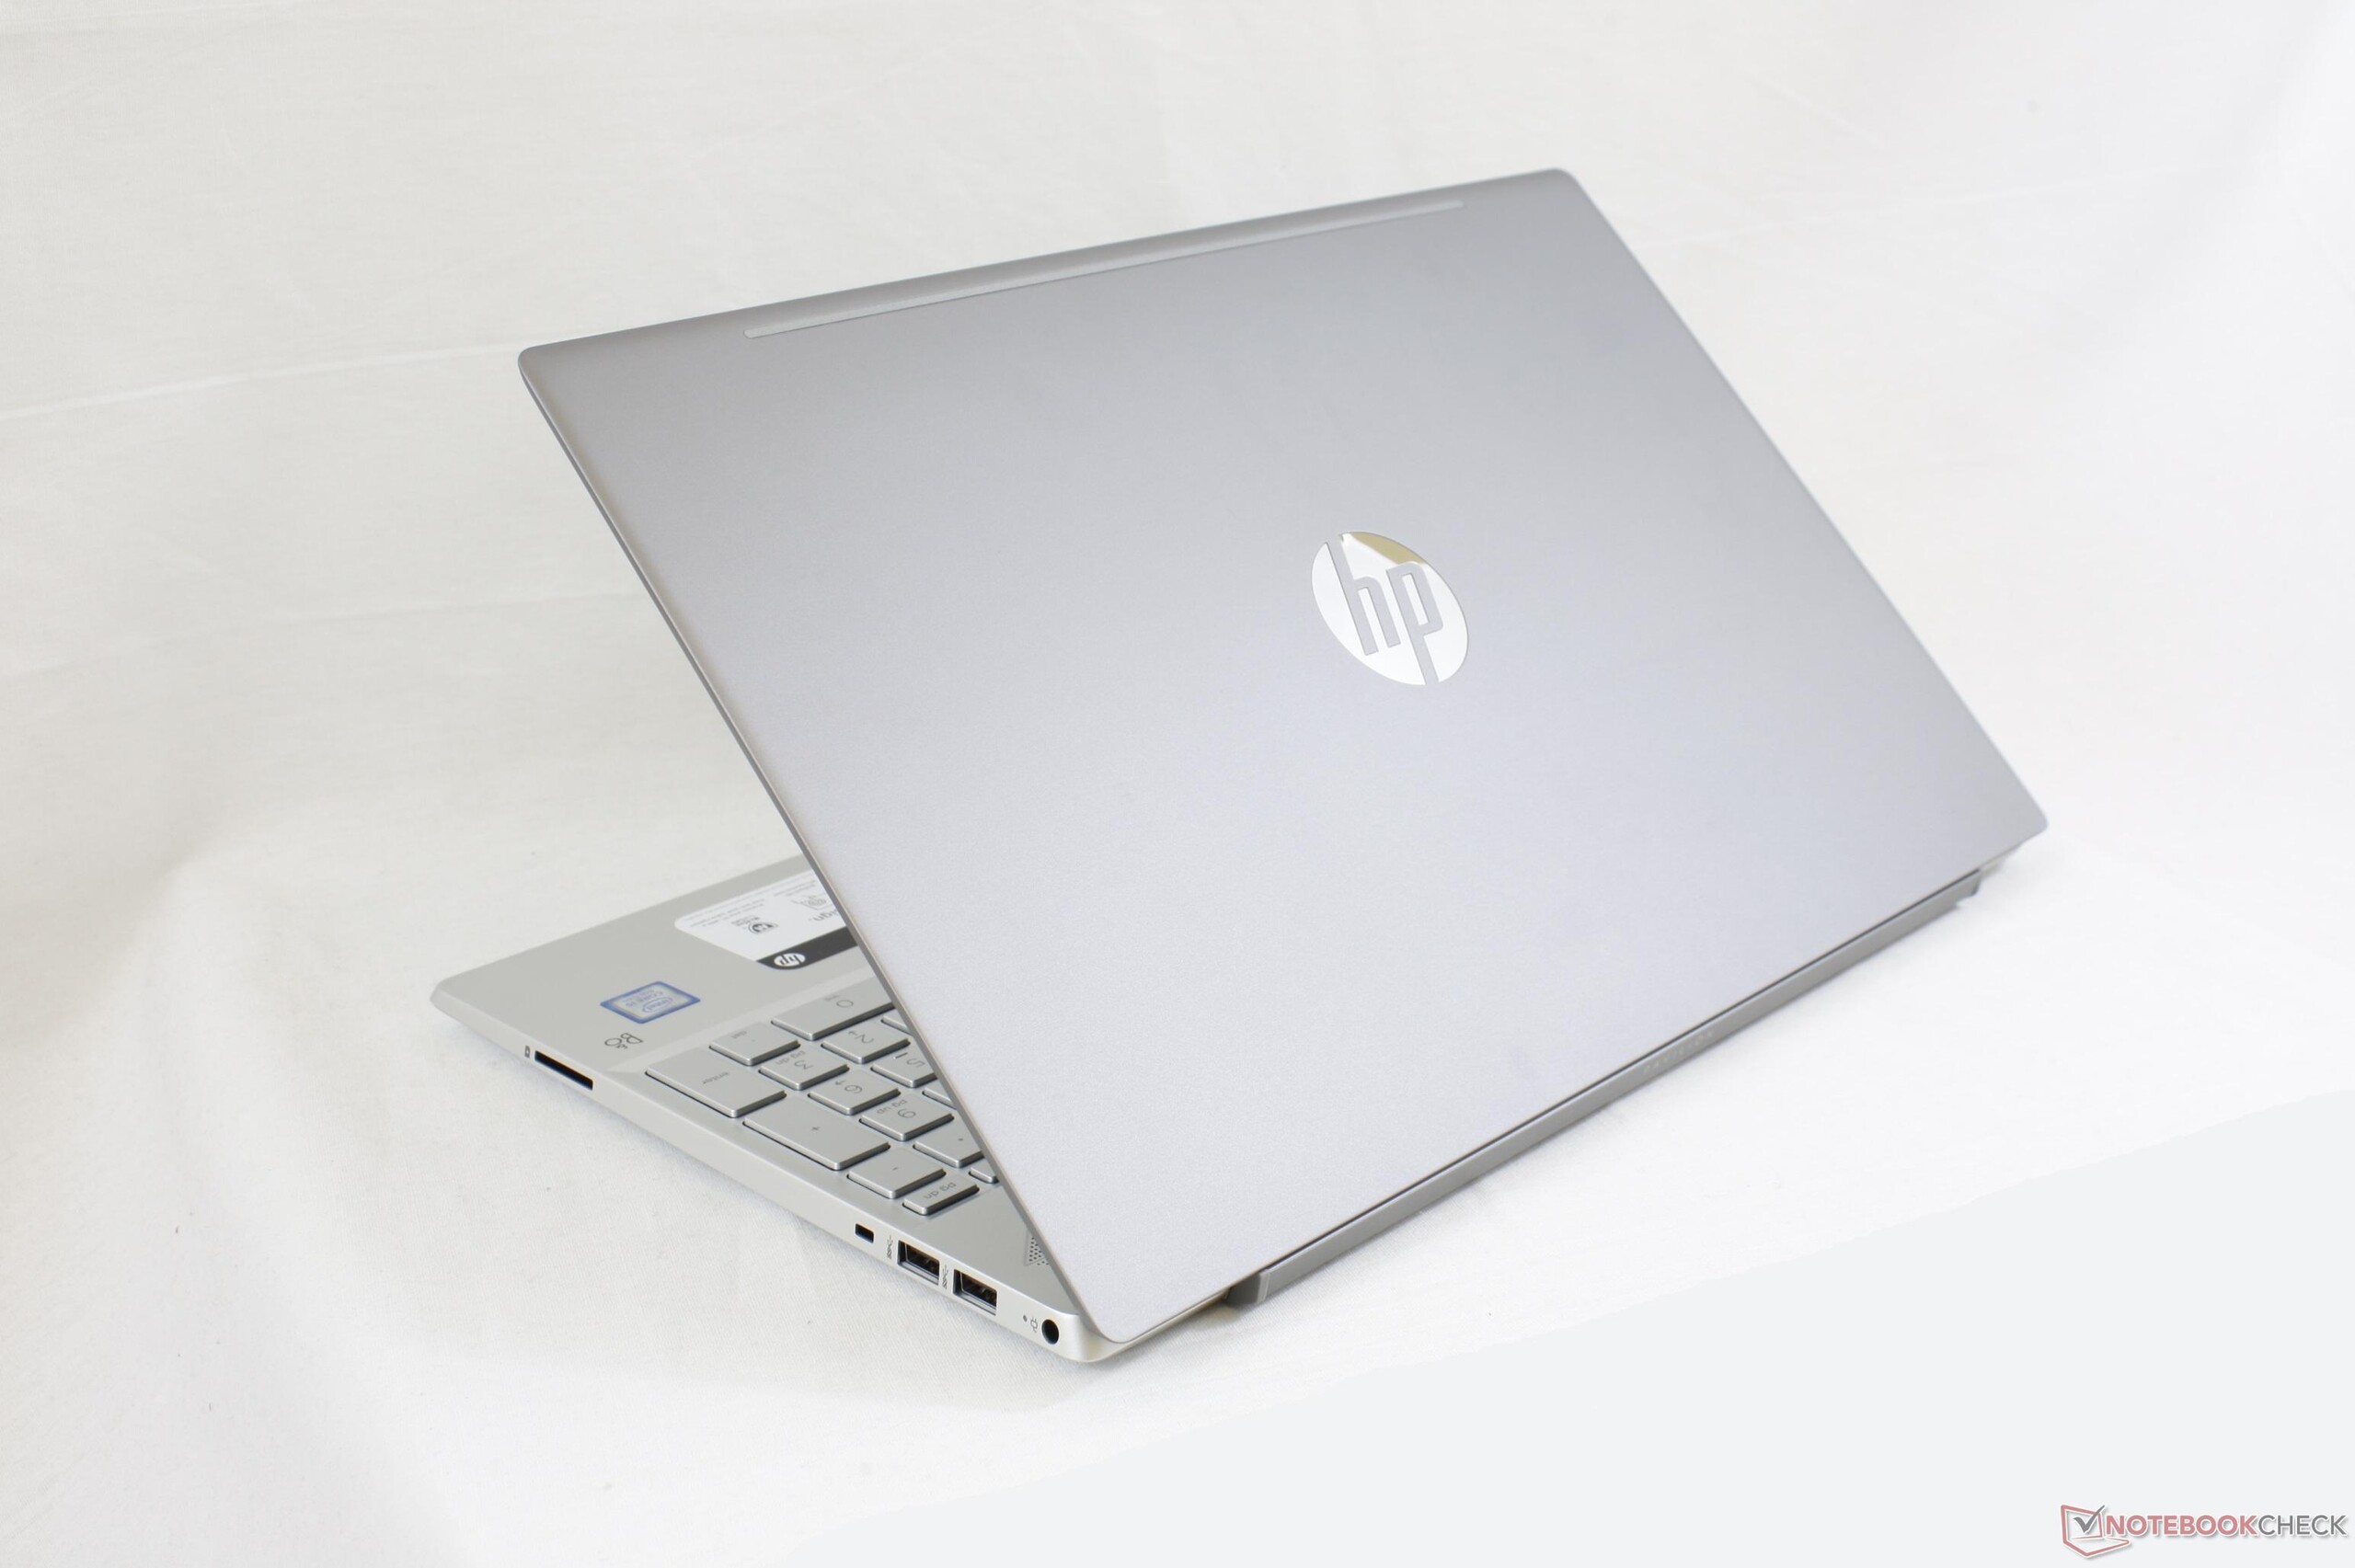
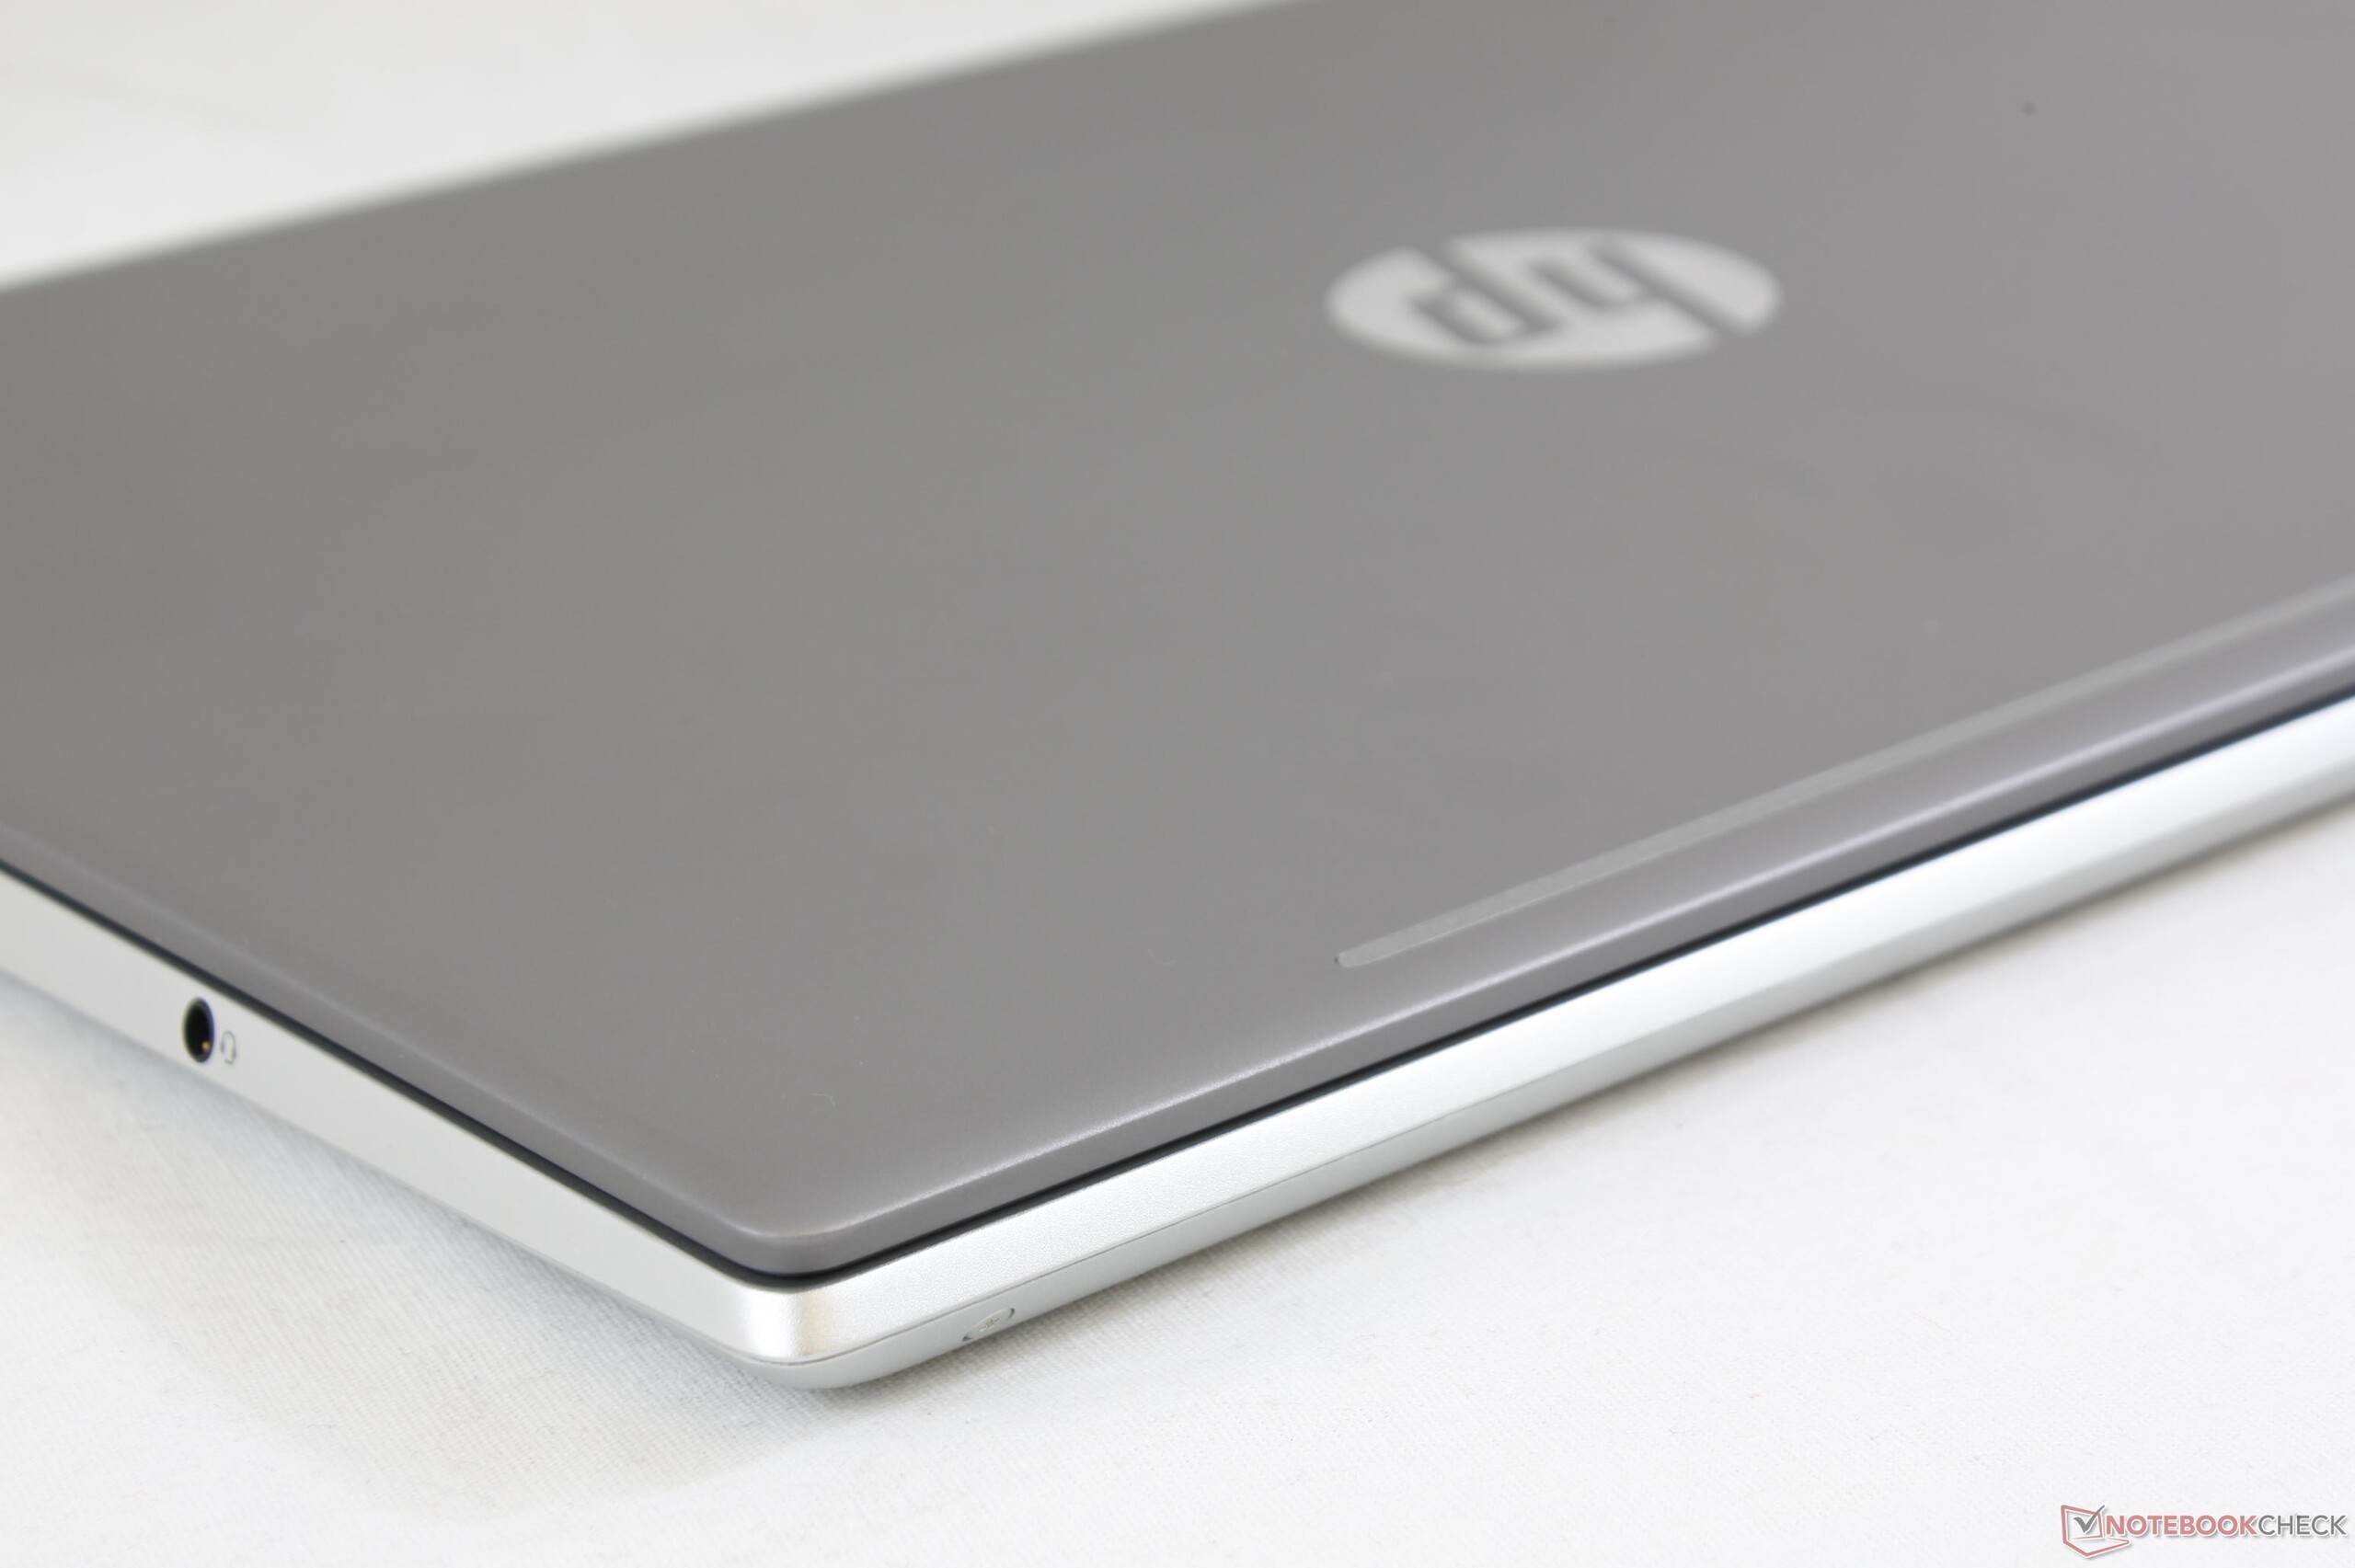
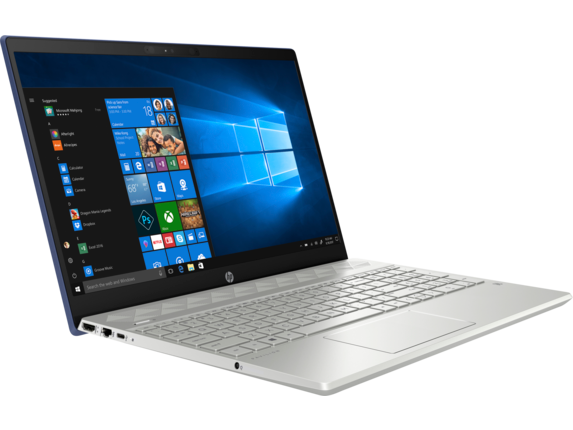
Känslan av oattraktiv budget-design var en av nyckelfaktorerna som talade mot tidigare Pavilion 15-modeller. En snabb titt på den gamla Pavilion 15 från 2015 jämfört med en MacBook Pro visar varför Pavilion bara kostade hälften så mycket. Denna skillnad finns även mellan den nya Pavilion 15 från 2018 och Apples senaste motsvarighet, men det är inte i närheten så dåligt som det brukade vara. För målgruppen studenter och yngre användare kan denna märkbara visuella uppgradering göra Pavilion värd att överväga.
På insidan imponerades vi av förmågan att upprätthålla Turbo Boost, dom låga kärntemperaturerna och den i allmänhet tysta fläkten. Dessa aspekter är inte så vanliga som vi hade önskat, särskilt när det kommer till dyrare Ultrabook-modeller där kylningen oftast hamnar i skymundan till förmån för liten storlek och låg vikt.
De sämsta aspekterna av nya Pavilion är dess mjuka tangentbordsknappar, mjuka styrplatteknappar och gungande skärm. Dessa aspekter i kombination gör att Pavilion känns som en billig, plastig laptop trots den nya visuella designen.
I det lägre skiktet runt 4.000 - 7.000 kronor kan Pavilion 15 vara värd en titt för den som behöver tänka på budgeten. Undvik dom dyrare varianterna till varje pris då det i så fall är bättre att investera pengarna i någon Envy- eller Spectre-modell.
HP Pavilion 15-cs0053cl
- 08/05/2018 v6 (old)
Allen Ngo
Price comparison
