Test: Dell Latitude 5491 (8750H, MX130, FHD) Laptop (Sammanfattning)
| SD Card Reader | |
| average JPG Copy Test (av. of 3 runs) | |
| Dell Latitude 5491 (Toshiba Exceria Pro SDXC 64 GB UHS-II) | |
| Acer TravelMate P648-G2-M-73T0 (Toshiba Exceria Pro SDXC 64 GB UHS-II) | |
| Lenovo ThinkPad T480-20L6S01V00 (Toshiba Exceria Pro SDXC 64 GB UHS-II) | |
| Lenovo ThinkPad T480s-20L8S02E00 (Toshiba Exceria Pro SDXC 64 GB UHS-II) | |
| Toshiba Tecra X40-E-10W (Toshiba Exceria Pro M501 microSDXC 64GB) | |
| Genomsnitt av klass Office (19.8 - 198.5, n=22, senaste 2 åren) | |
| maximum AS SSD Seq Read Test (1GB) | |
| Dell Latitude 5491 (Toshiba Exceria Pro SDXC 64 GB UHS-II) | |
| Lenovo ThinkPad T480s-20L8S02E00 (Toshiba Exceria Pro SDXC 64 GB UHS-II) | |
| Acer TravelMate P648-G2-M-73T0 (Toshiba Exceria Pro SDXC 64 GB UHS-II) | |
| Toshiba Tecra X40-E-10W (Toshiba Exceria Pro M501 microSDXC 64GB) | |
| Lenovo ThinkPad T480-20L6S01V00 (Toshiba Exceria Pro SDXC 64 GB UHS-II) | |
| Genomsnitt av klass Office (27.4 - 249, n=21, senaste 2 åren) | |
| |||||||||||||||||||||||||
Distribution av ljusstyrkan: 82 %
Mitt på batteriet: 189.4 cd/m²
Kontrast: 947:1 (Svärta: 0.2 cd/m²)
ΔE ColorChecker Calman: 6.74 | ∀{0.5-29.43 Ø4.72}
calibrated: 4.73
ΔE Greyscale Calman: 5.5 | ∀{0.09-98 Ø4.97}
53.8% sRGB (Argyll 1.6.3 3D)
37% AdobeRGB 1998 (Argyll 1.6.3 3D)
36.96% AdobeRGB 1998 (Argyll 3D)
53.8% sRGB (Argyll 3D)
35.78% Display P3 (Argyll 3D)
Gamma: 2.37
CCT: 6740 K
| Dell Latitude 5491 AU Optronics AUO133D B140HAK, IPS, 14", 1920x1080 | Lenovo ThinkPad T480s-20L8S02E00 LP140QH2-SPB1, IPS LED, 14", 2560x1440 | Toshiba Tecra X40-E-10W Toshiba TOS508F, IPS, 14", 1920x1080 | HP EliteBook 840 G5-3JX61EA IVO M140NVF7 R0, IPS, 14", 1920x1080 | Acer TravelMate P648-G2-M-73T0 IPS, 14", 1920x1080 | |
|---|---|---|---|---|---|
| Display | 92% | 13% | 67% | 79% | |
| Display P3 Coverage (%) | 35.78 | 71.4 100% | 40.55 13% | 61 70% | 67.2 88% |
| sRGB Coverage (%) | 53.8 | 96.6 80% | 61 13% | 87.7 63% | 90.8 69% |
| AdobeRGB 1998 Coverage (%) | 36.96 | 72.1 95% | 41.9 13% | 62.1 68% | 66.4 80% |
| Response Times | 4% | 33% | 11% | 7% | |
| Response Time Grey 50% / Grey 80% * (ms) | 38.4 ? | 36 ? 6% | 22 ? 43% | 33 ? 14% | 38 ? 1% |
| Response Time Black / White * (ms) | 28.4 ? | 28 ? 1% | 22 ? 23% | 26 ? 8% | 25 ? 12% |
| PWM Frequency (Hz) | 21000 ? | 3125 ? | |||
| Screen | 38% | 25% | 59% | 33% | |
| Brightness middle (cd/m²) | 189.4 | 311 64% | 266 40% | 655 246% | 275 45% |
| Brightness (cd/m²) | 196 | 302 54% | 244 24% | 630 221% | 253 29% |
| Brightness Distribution (%) | 82 | 91 11% | 86 5% | 93 13% | 85 4% |
| Black Level * (cd/m²) | 0.2 | 0.36 -80% | 0.2 -0% | 0.56 -180% | 0.25 -25% |
| Contrast (:1) | 947 | 864 -9% | 1330 40% | 1170 24% | 1100 16% |
| Colorchecker dE 2000 * | 6.74 | 3 55% | 4.61 32% | 3.27 51% | 3.49 48% |
| Colorchecker dE 2000 max. * | 25.5 | 6.1 76% | 7.46 71% | 5.92 77% | 6.77 73% |
| Colorchecker dE 2000 calibrated * | 4.73 | 1.7 64% | 3.22 32% | ||
| Greyscale dE 2000 * | 5.5 | 4 27% | 4.31 22% | 2.85 48% | 4.91 11% |
| Gamma | 2.37 93% | 2.17 101% | 2.54 87% | 2.45 90% | 2.39 92% |
| CCT | 6740 96% | 6961 93% | 6848 95% | 6065 107% | 6271 104% |
| Color Space (Percent of AdobeRGB 1998) (%) | 37 | 66.7 80% | 39 5% | 57 54% | 59 59% |
| Color Space (Percent of sRGB) (%) | 53.8 | 96.7 80% | 61 13% | 88 64% | 91 69% |
| Totalt genomsnitt (program/inställningar) | 45% /
44% | 24% /
24% | 46% /
55% | 40% /
39% |
* ... mindre är bättre
Visa svarstider
| ↔ Svarstid svart till vitt | ||
|---|---|---|
| 28.4 ms ... stiga ↗ och falla ↘ kombinerat | ↗ 16.4 ms stiga | 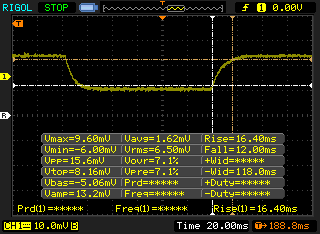 |
| ↘ 12 ms hösten | ||
| Skärmen visar relativt långsamma svarsfrekvenser i våra tester och kan vara för långsam för spelare. I jämförelse sträcker sig alla testade enheter från 0.1 (minst) till 240 (maximalt) ms. » 75 % av alla enheter är bättre. Detta innebär att den uppmätta svarstiden är sämre än genomsnittet av alla testade enheter (19.8 ms). | ||
| ↔ Svarstid 50 % grått till 80 % grått | ||
| 38.4 ms ... stiga ↗ och falla ↘ kombinerat | ↗ 18.8 ms stiga | 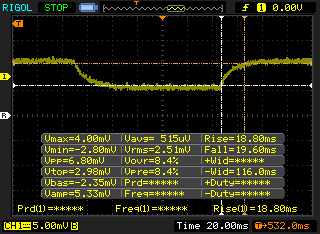 |
| ↘ 19.6 ms hösten | ||
| Skärmen visar långsamma svarsfrekvenser i våra tester och kommer att vara otillfredsställande för spelare. I jämförelse sträcker sig alla testade enheter från 0.165 (minst) till 636 (maximalt) ms. » 57 % av alla enheter är bättre. Detta innebär att den uppmätta svarstiden är sämre än genomsnittet av alla testade enheter (31 ms). | ||
Skärmflimmer / PWM (Puls-Width Modulation)
| Skärmflimmer / PWM upptäcktes inte | 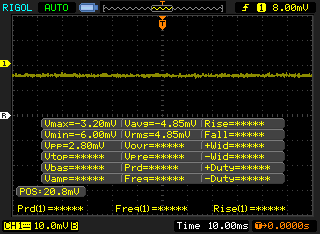 | ||
Som jämförelse: 52 % av alla testade enheter använder inte PWM för att dämpa skärmen. Om PWM upptäcktes mättes ett medelvärde av 7775 (minst: 5 - maximum: 343500) Hz. | |||
| PCMark 8 Home Score Accelerated v2 | 4174 poäng | |
| PCMark 8 Work Score Accelerated v2 | 5428 poäng | |
| PCMark 10 Score | 4269 poäng | |
Hjälp | ||
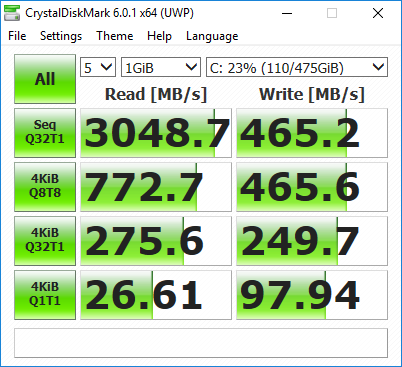
| Dell Latitude 5491 Toshiba XG5 KXG50ZNV512G | Lenovo ThinkPad T480-20L6S01V00 Samsung SSD PM981 MZVLB512HAJQ | HP EliteBook 840 G5-3JX61EA Toshiba KXG50ZNV1T02 | Acer TravelMate P648-G2-M-73T0 SK Hynix HFS256G39TND-N210A | Dell Latitude 5490 Samsung PM961 MZVLW256HEHP | |
|---|---|---|---|---|---|
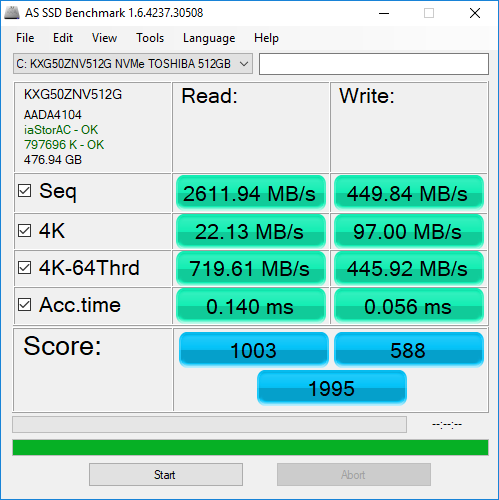
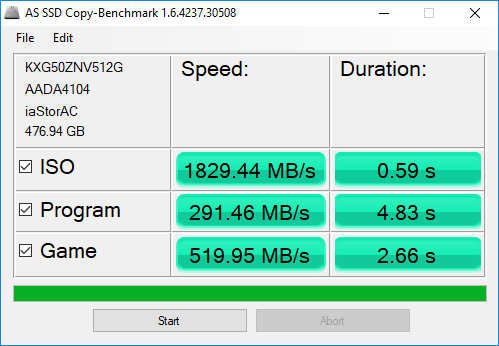
| AS SSD | -310% | 34% | -62% | -5% | |
| Copy Game MB/s (MB/s) | 520 | 676 30% | 905 74% | 172 -67% | 273.6 -47% |
| Copy Program MB/s (MB/s) | 291.5 | 254.8 -13% | 326.2 12% | 92.5 -68% | 214 -27% |
| Copy ISO MB/s (MB/s) | 1829 | 921 -50% | 1688 -8% | 216.6 -88% | 514 -72% |
| Score Total (Points) | 1995 | 2348 18% | 2630 32% | 969 -51% | 1834 -8% |
| Score Write (Points) | 588 | 147 -75% | 1084 84% | 283 -52% | 449 -24% |
| Score Read (Points) | 1003 | 1480 48% | 1070 7% | 456 -55% | 916 -9% |
| Access Time Write * (ms) | 0.056 | 2.515 -4391% | 0.055 2% | 0.229 -309% | 0.037 34% |
| Access Time Read * (ms) | 0.14 | 0.041 71% | 0.059 58% | 0.081 42% | 0.067 52% |
| 4K-64 Write (MB/s) | 445.9 | 96.2 -78% | 908 104% | 184.1 -59% | 300.9 -33% |
| 4K-64 Read (MB/s) | 720 | 1278 78% | 813 13% | 375.2 -48% | 793 10% |
| 4K Write (MB/s) | 97 | 1.76 -98% | 90 -7% | 73.7 -24% | 93.6 -4% |
| 4K Read (MB/s) | 22.13 | 58 162% | 26.75 21% | 30.07 36% | 45.99 108% |
| Seq Write (MB/s) | 449.8 | 487.1 8% | 856 90% | 248.1 -45% | 541 20% |
| Seq Read (MB/s) | 2612 | 1441 -45% | 2300 -12% | 511 -80% | 768 -71% |
* ... mindre är bättre

| 3DMark 11 Performance | 3403 poäng | |
| 3DMark Cloud Gate Standard Score | 13241 poäng | |
| 3DMark Fire Strike Score | 2303 poäng | |
Hjälp | ||
| Rise of the Tomb Raider | |
| 1024x768 Lowest Preset (sortera efter värde) | |
| Dell Latitude 5491 | |
| Lenovo ThinkPad T480-20L6S01V00 | |
| Acer TravelMate P2510-M-51ZQ | |
| Genomsnitt NVIDIA GeForce MX130 (30.7 - 51.2, n=8) | |
| 1366x768 Medium Preset AF:2x (sortera efter värde) | |
| Dell Latitude 5491 | |
| Lenovo ThinkPad T480-20L6S01V00 | |
| Dell XPS 15 2018 i5 FHD 97Wh | |
| Genomsnitt NVIDIA GeForce MX130 (22.5 - 31.3, n=8) | |
| 1920x1080 High Preset AA:FX AF:4x (sortera efter värde) | |
| Dell Latitude 5491 | |
| Lenovo ThinkPad T480-20L6S01V00 | |
| Dell XPS 15 2018 i5 FHD 97Wh | |
| Genomsnitt NVIDIA GeForce MX130 (13.2 - 16.9, n=8) | |
| 1920x1080 Very High Preset AA:FX AF:16x (sortera efter värde) | |
| Dell Latitude 5491 | |
| Lenovo ThinkPad T480-20L6S01V00 | |
| Dell XPS 15 2018 i5 FHD 97Wh | |
| Genomsnitt NVIDIA GeForce MX130 (12.1 - 14, n=7) | |
| låg | med. | hög | ultra | |
|---|---|---|---|---|
| BioShock Infinite (2013) | 146.1 | 82.2 | 66 | 25.1 |
| Rise of the Tomb Raider (2016) | 50.7 | 31 | 16.9 | 14 |
Ljudnivå
| Låg belastning |
| 29.5 / 29.5 / 31.5 dB(A) |
| Hög belastning |
| 46.2 / 46.2 dB(A) |
 | ||
30 dB tyst 40 dB(A) hörbar 50 dB(A) högt ljud |
||
min: | ||
| Dell Latitude 5491 GeForce MX130, i7-8850H, Toshiba XG5 KXG50ZNV512G | Dell Latitude 5490 UHD Graphics 620, i7-8650U, Samsung PM961 MZVLW256HEHP | Lenovo ThinkPad T480-20L6S01V00 GeForce MX150, i5-8550U, Samsung SSD PM981 MZVLB512HAJQ | Toshiba Tecra X40-E-10W UHD Graphics 620, i5-8250U, Samsung PM961 MZVLW256HEHP | HP EliteBook 840 G5-3JX61EA UHD Graphics 620, i5-8550U, Toshiba KXG50ZNV1T02 | Acer TravelMate P648-G2-M-73T0 HD Graphics 620, i7-7500U, SK Hynix HFS256G39TND-N210A | |
|---|---|---|---|---|---|---|
| Noise | 9% | 10% | 2% | 8% | 8% | |
| av / miljö * (dB) | 29.5 | 27.8 6% | 29 2% | 30.5 -3% | 30.3 -3% | 30.6 -4% |
| Idle Minimum * (dB) | 29.5 | 27.8 6% | 29 2% | 30.5 -3% | 30.3 -3% | 30.6 -4% |
| Idle Average * (dB) | 29.5 | 27.8 6% | 29 2% | 30.5 -3% | 30.3 -3% | 30.6 -4% |
| Idle Maximum * (dB) | 31.5 | 31 2% | 29 8% | 31.2 1% | 30.3 4% | 31 2% |
| Load Average * (dB) | 46.2 | 34.2 26% | 35.6 23% | 43.9 5% | 33.8 27% | 34.5 25% |
| Load Maximum * (dB) | 46.2 | 42.7 8% | 35.6 23% | 40.1 13% | 33.8 27% | 32.4 30% |
| Witcher 3 ultra * (dB) | 32.5 |
* ... mindre är bättre
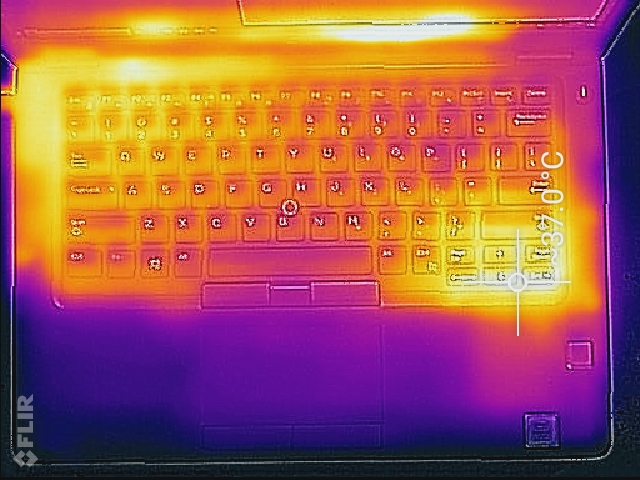
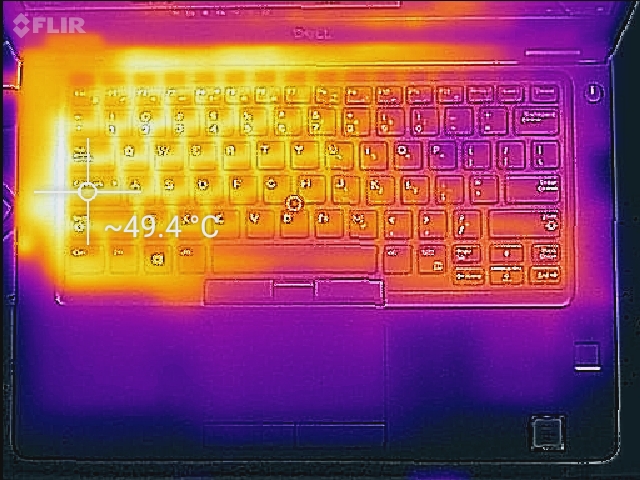
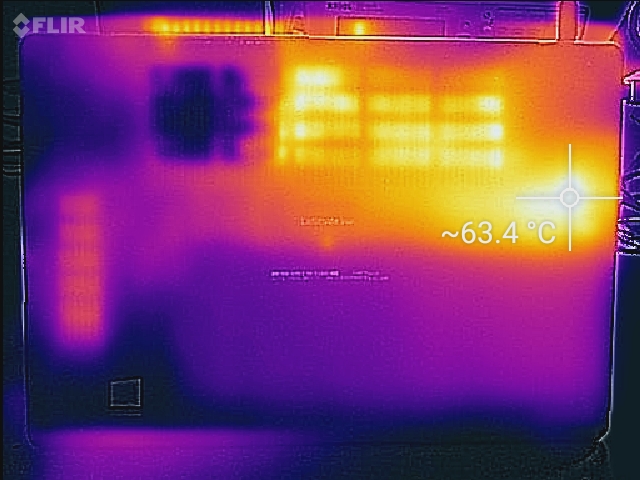
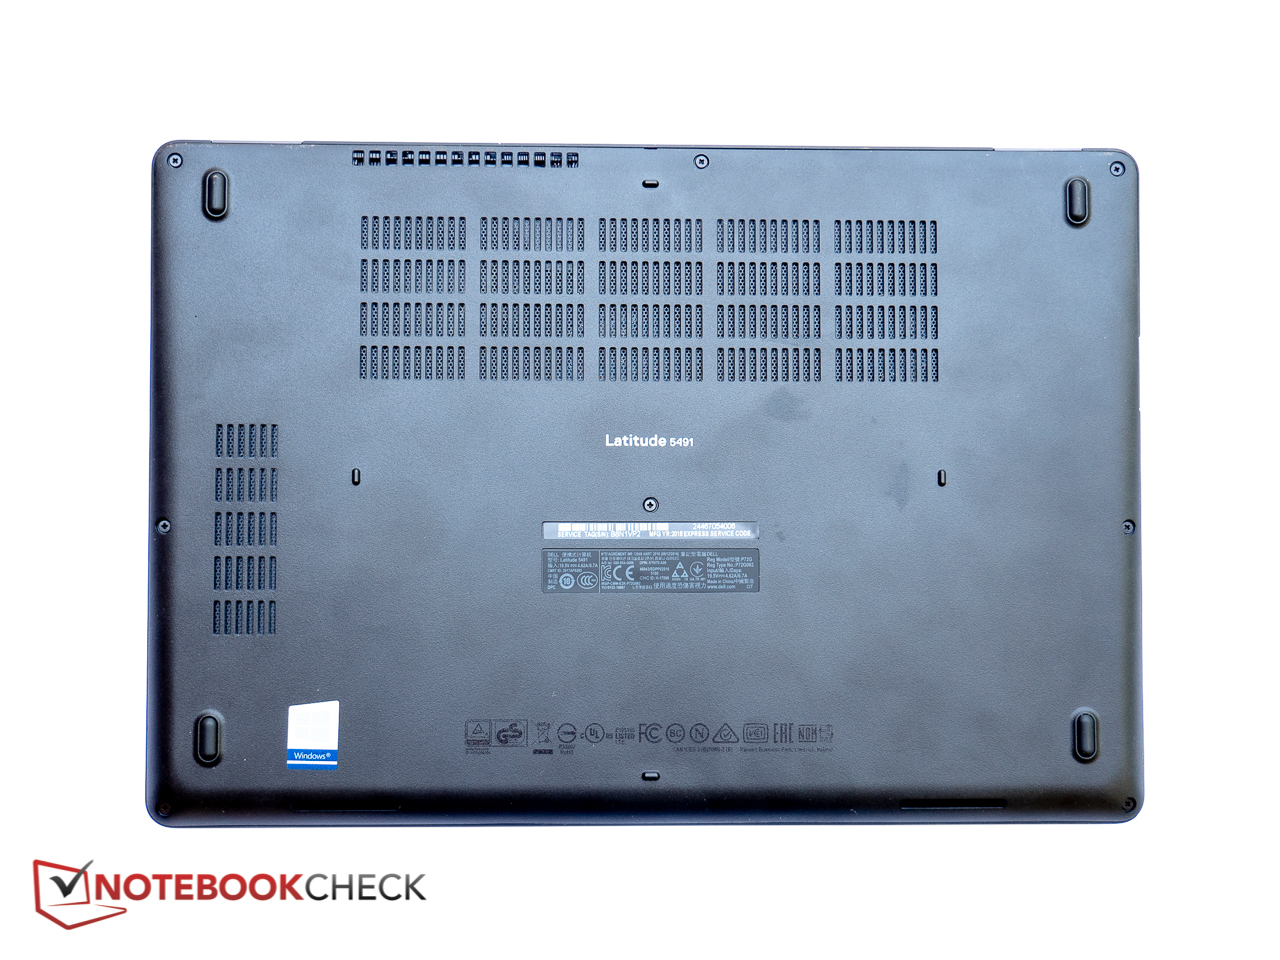
(-) Den maximala temperaturen på ovansidan är 48.6 °C / 119 F, jämfört med genomsnittet av 34.3 °C / 94 F , allt från 21.2 till 62.5 °C för klassen Office.
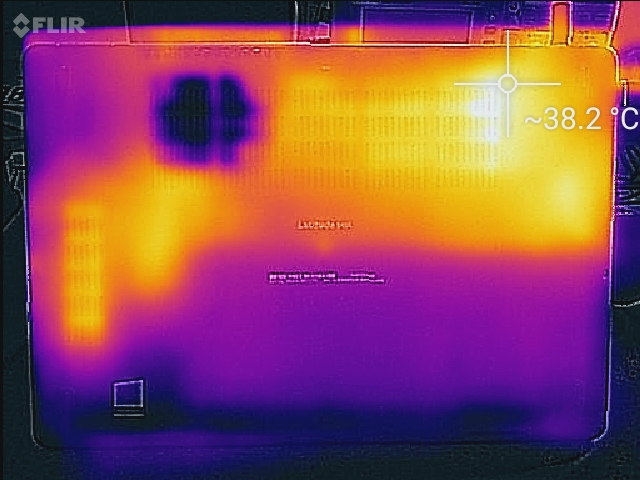
(-) Botten värms upp till maximalt 62.8 °C / 145 F, jämfört med genomsnittet av 36.8 °C / 98 F
(+) Vid tomgångsbruk är medeltemperaturen för ovansidan 31.1 °C / 88 F, jämfört med enhetsgenomsnittet på 29.5 °C / ### class_avg_f### F.
(+) Handledsstöden och pekplattan är kallare än hudtemperaturen med maximalt 29 °C / 84.2 F och är därför svala att ta på.
(±) Medeltemperaturen för handledsstödsområdet på liknande enheter var 27.5 °C / 81.5 F (-1.5 °C / -2.7 F).
Dell Latitude 5491 ljudanalys
(±) | högtalarljudstyrkan är genomsnittlig men bra (76.3 dB)
Bas 100 - 315 Hz
(-) | nästan ingen bas - i genomsnitt 15.6% lägre än medianen
(±) | linjäriteten för basen är genomsnittlig (8.5% delta till föregående frekvens)
Mellan 400 - 2000 Hz
(±) | högre mellan - i genomsnitt 5.7% högre än median
(±) | linjäriteten för mids är genomsnittlig (7.2% delta till föregående frekvens)
Högsta 2 - 16 kHz
(±) | högre toppar - i genomsnitt 6.8% högre än medianen
(±) | linjäriteten för toppar är genomsnittlig (13.4% delta till föregående frekvens)
Totalt 100 - 16 000 Hz
(±) | linjäriteten för det totala ljudet är genomsnittlig (22.4% skillnad mot median)
Jämfört med samma klass
» 59% av alla testade enheter i den här klassen var bättre, 9% liknande, 32% sämre
» Den bästa hade ett delta på 7%, genomsnittet var 21%, sämst var 53%
Jämfört med alla testade enheter
» 65% av alla testade enheter var bättre, 6% liknande, 29% sämre
» Den bästa hade ett delta på 4%, genomsnittet var 24%, sämst var 134%
Apple MacBook 12 (Early 2016) 1.1 GHz ljudanalys
(+) | högtalare kan spela relativt högt (83.6 dB)
Bas 100 - 315 Hz
(±) | reducerad bas - i genomsnitt 11.3% lägre än medianen
(±) | linjäriteten för basen är genomsnittlig (14.2% delta till föregående frekvens)
Mellan 400 - 2000 Hz
(+) | balanserad mellan - endast 2.4% från medianen
(+) | mids är linjära (5.5% delta till föregående frekvens)
Högsta 2 - 16 kHz
(+) | balanserade toppar - endast 2% från medianen
(+) | toppar är linjära (4.5% delta till föregående frekvens)
Totalt 100 - 16 000 Hz
(+) | det totala ljudet är linjärt (10.2% skillnad mot median)
Jämfört med samma klass
» 7% av alla testade enheter i den här klassen var bättre, 2% liknande, 91% sämre
» Den bästa hade ett delta på 5%, genomsnittet var 18%, sämst var 53%
Jämfört med alla testade enheter
» 5% av alla testade enheter var bättre, 1% liknande, 94% sämre
» Den bästa hade ett delta på 4%, genomsnittet var 24%, sämst var 134%
| Av/Standby | |
| Låg belastning | |
| Hög belastning |
|
Förklaring:
min: | |
| Dell Latitude 5491 i7-8850H, GeForce MX130, Toshiba XG5 KXG50ZNV512G, IPS, 1920x1080, 14" | Lenovo ThinkPad T480-20L6S01V00 i5-8550U, GeForce MX150, Samsung SSD PM981 MZVLB512HAJQ, IPS, 1920x1080, 14" | Lenovo ThinkPad T480s-20L8S02E00 i5-8550U, GeForce MX150, Samsung SSD PM981 MZVLB512HAJQ, IPS LED, 2560x1440, 14" | Toshiba Tecra X40-E-10W i5-8250U, UHD Graphics 620, Samsung PM961 MZVLW256HEHP, IPS, 1920x1080, 14" | HP EliteBook 840 G5-3JX61EA i5-8550U, UHD Graphics 620, Toshiba KXG50ZNV1T02, IPS, 1920x1080, 14" | Dell Latitude 5490 i7-8650U, UHD Graphics 620, Samsung PM961 MZVLW256HEHP, IPS, 1920x1080, 14" | Dell XPS 15 2018 i5 FHD 97Wh i5-8300H, GeForce GTX 1050 Mobile, Lite-On CA3-8D256-Q11, LED IGZO IPS InfinityEdge, 1920x1080, 15.6" | |
|---|---|---|---|---|---|---|---|
| Power Consumption | 31% | 31% | 43% | 40% | 44% | 28% | |
| Idle Minimum * (Watt) | 7.5 | 3.6 52% | 3.4 55% | 4.5 40% | 3.8 49% | 3.9 48% | 2.9 61% |
| Idle Average * (Watt) | 9.7 | 7.1 27% | 7.5 23% | 8.2 15% | 8.3 14% | 6.2 36% | 5.8 40% |
| Idle Maximum * (Watt) | 13 | 9.5 27% | 10.8 17% | 9.3 28% | 10.7 18% | 7.7 41% | 7.5 42% |
| Load Average * (Watt) | 74.3 | 63.9 14% | 55.4 25% | 30.4 59% | 35.5 52% | 43.9 41% | 77.5 -4% |
| Load Maximum * (Watt) | 106.6 | 67.3 37% | 70.3 34% | 30.4 71% | 37 65% | 47.7 55% | 107 -0% |
| Witcher 3 ultra * (Watt) | 53.9 | 34 | 84 |
* ... mindre är bättre
| Dell Latitude 5491 i7-8850H, GeForce MX130, 68 Wh | Lenovo ThinkPad T480-20L6S01V00 i5-8550U, GeForce MX150, 72 Wh | Toshiba Tecra X40-E-10W i5-8250U, UHD Graphics 620, 48 Wh | HP EliteBook 840 G5-3JX61EA i5-8550U, UHD Graphics 620, 50 Wh | Dell Latitude 5490 i7-8650U, UHD Graphics 620, 68 Wh | Lenovo ThinkPad T480s-20L8S02E00 i5-8550U, GeForce MX150, 57 Wh | |
|---|---|---|---|---|---|---|
| Batteridrifttid | 71% | -14% | -23% | 21% | 9% | |
| Reader / Idle (h) | 16.8 | 27.9 66% | 22.8 36% | |||
| WiFi v1.3 (h) | 9.6 | 13.2 38% | 8.3 -14% | 7.4 -23% | 11.6 21% | 8.8 -8% |
| Load (h) | 1.3 | 2.7 108% | 1.3 0% |
För
Emot
Läs den fullständiga versionen av den här recensionen på engelska här.
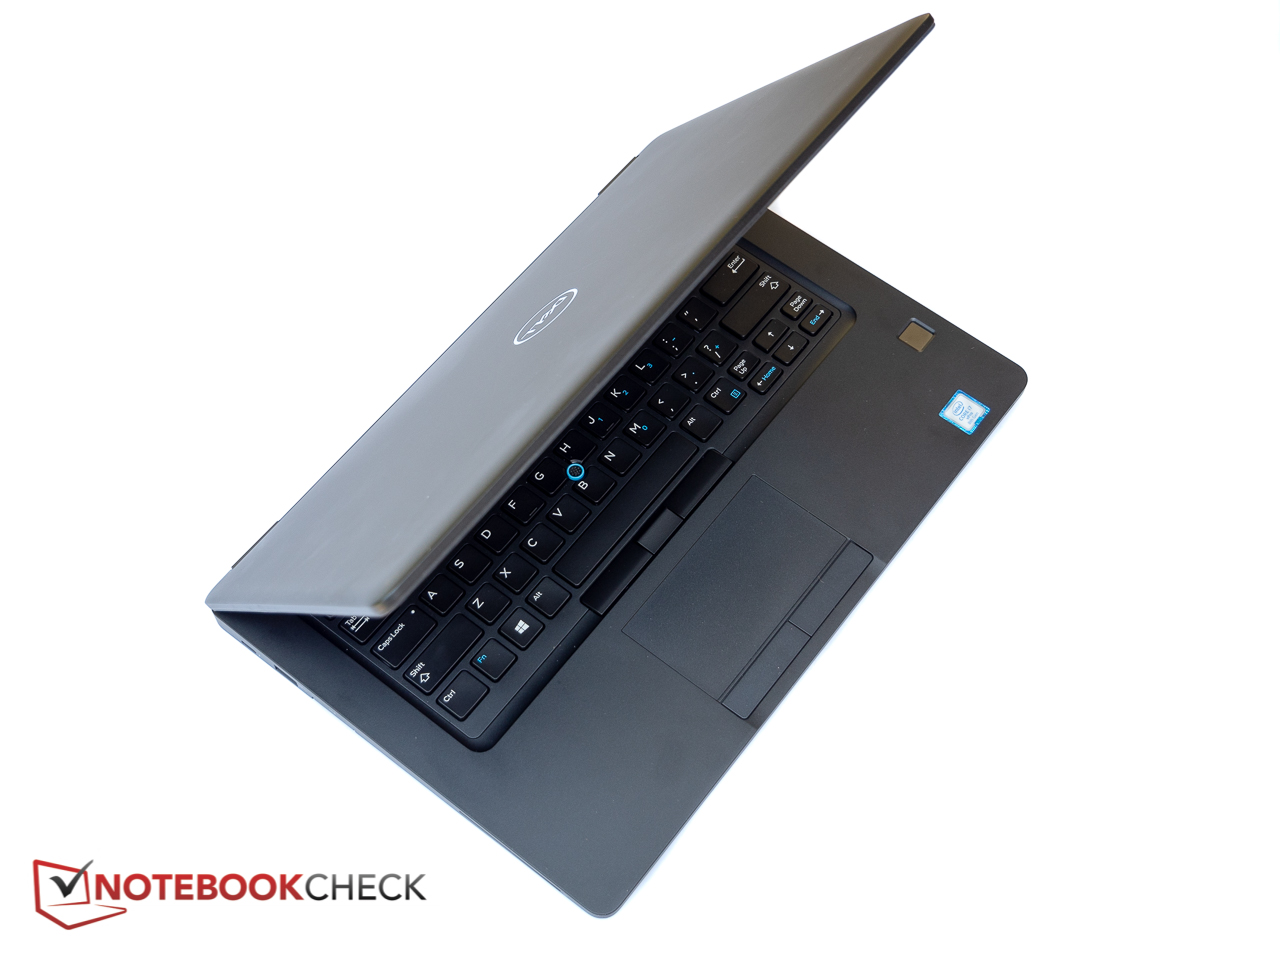
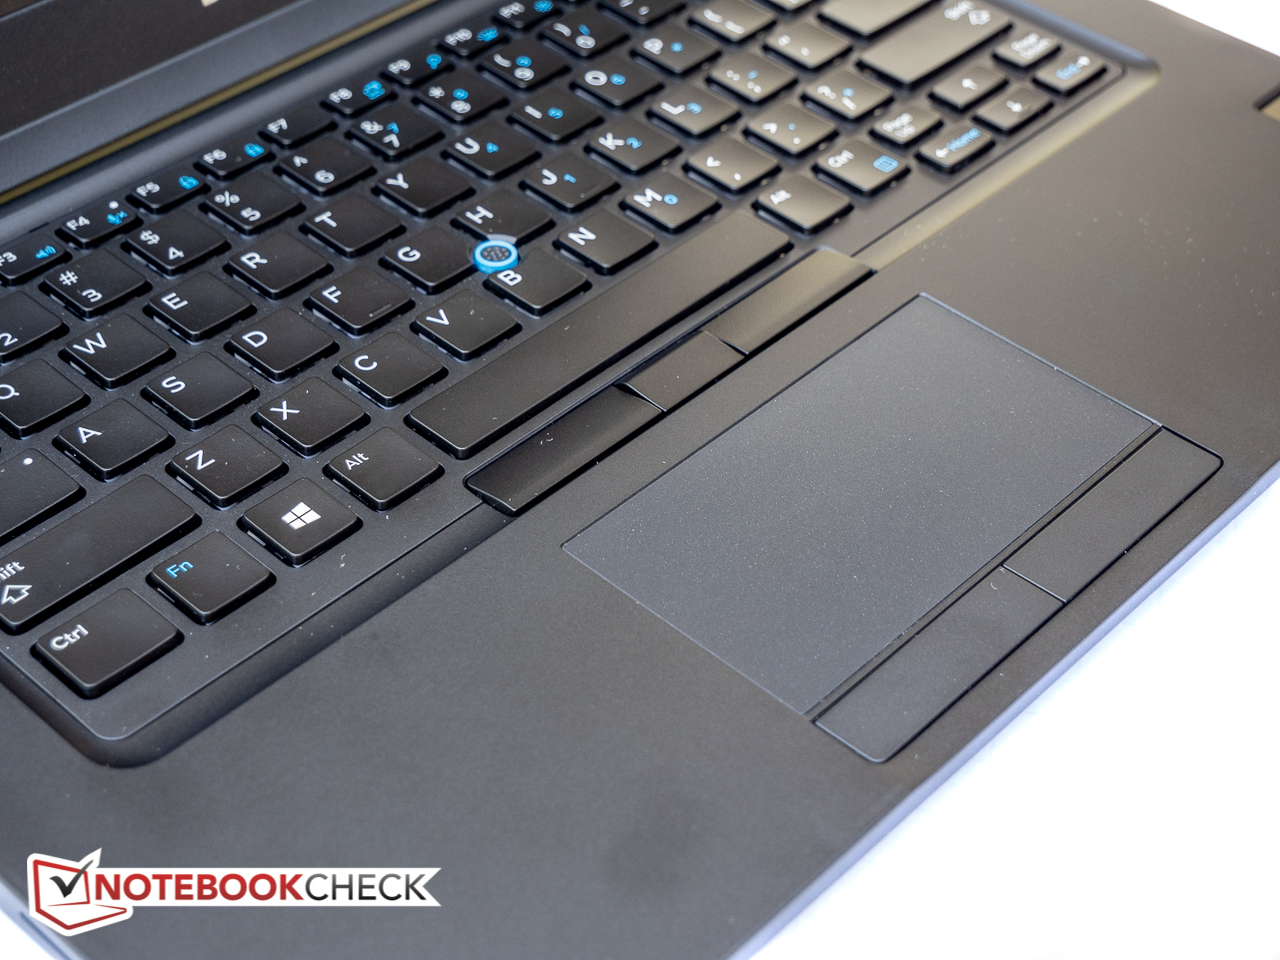
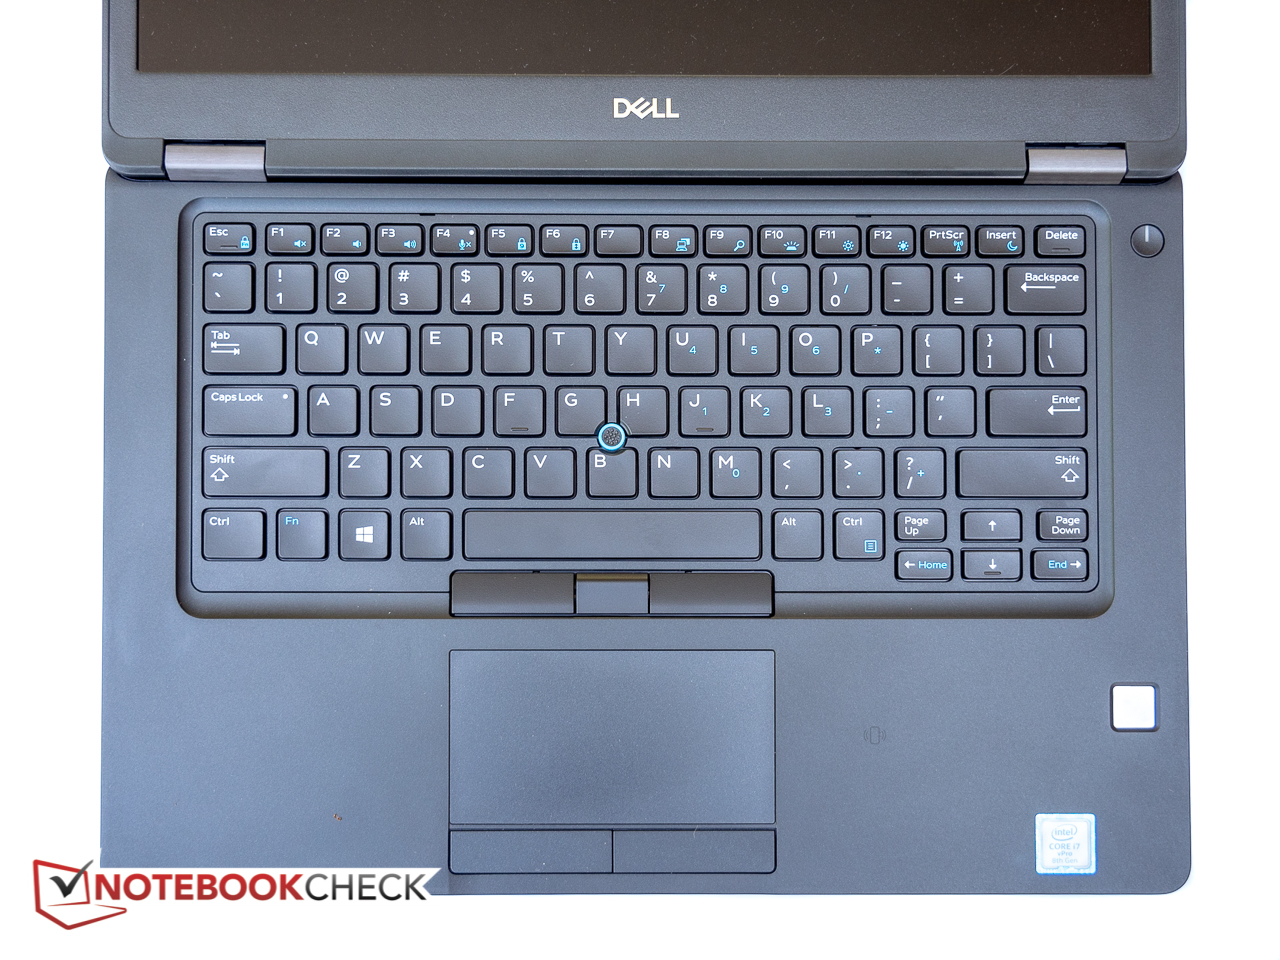
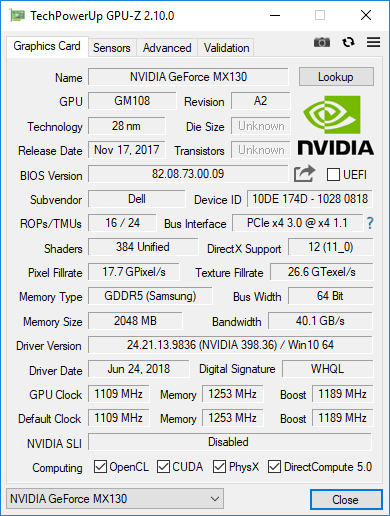
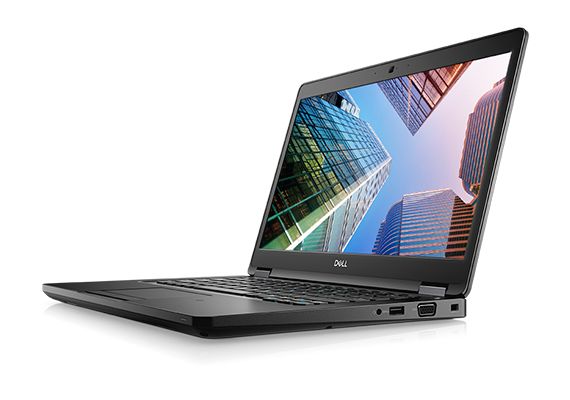
Latitude 5491 med en sexkärnig i7-8550H CPU och Nvidia GeForce MX130-grafik presterar bättre än Latitude 5490-modellerna med ULV CPU:er och integrerad grafik - ibland med stor marginal. Det förstås, för att kunna dra nytta av dom två extra CPU-kärnorna behöver program vara designade för att använda de extra trådarna. Utöver en rejäl ökning i prestanda så bockar Latitude 5491 av alla korrekta rutor då den fortfarande är samma väldesignade och säkra företagslaptop med utmärkta inmatningsenheter och god ergonomi.
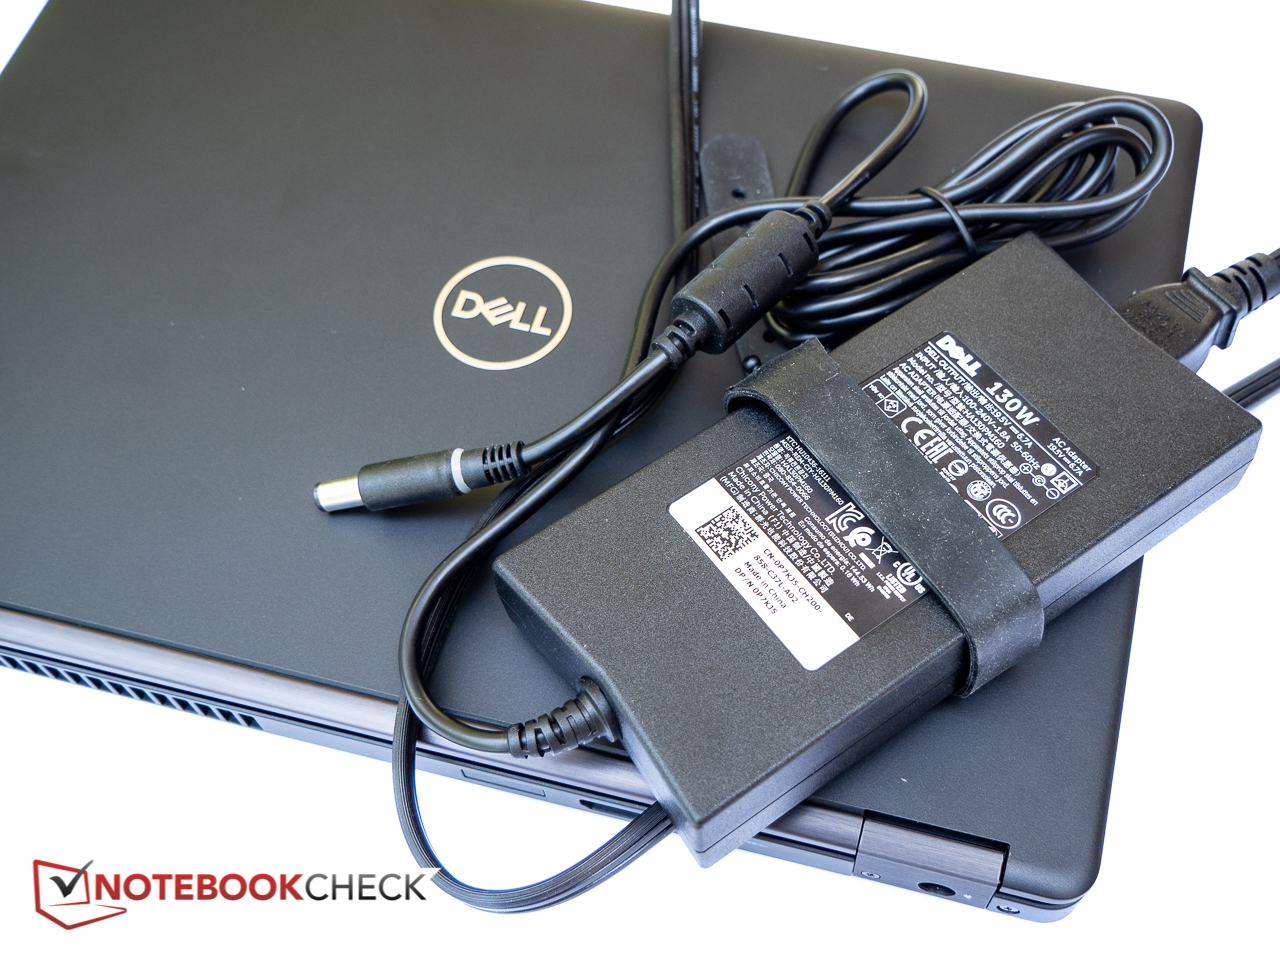
Med det sagt så finns det fortfarande rum för förbättring: nya Latitude blir väldigt varm vid belastning och på grund av det är den sämre på att upprätthålla turbo boost. Fläktarna behöver jobba hårdare så systemet låter mer än tidigare. Dell har också valt att använda samma blanka tryckkänsliga FHD-skärm som Latitude 5490 är utrustad med. Panelen lämnar mycket att önska, då ljusstyrkan är alldeles för låg för att den ska kunna användas utomhus och både färgomfång och färgnoggrannhet misslyckas med att imponera. Dessutom kommer den här modellen med en större och mycket tyngre nätadapter och den håller inte lika länge på en laddning.
Vägkrigare som i huvudsak fokuserar på ordbehandling, kalkylblad och webbsurfande kommer troligen klara sig bättre med Latitude 5490, som har längre batteritid och inte blir i närheten lika varm och högljudd. Den som är nöjd med prestandan en ULV CPU kan erbjuda borde även överväga Lenovos utmärkta ThinkPad T480 eller T480s.
Dell Latitude 5491
- 07/30/2018 v6 (old)
Bernie Pechlaner
Price comparison
