Test: Asus VivoBook S14 S410UQ (i7-8550U, 940MX, Full HD) Laptop (Sammanfattning)
| SD Card Reader | |
| average JPG Copy Test (av. of 3 runs) | |
| Dell XPS 13 9370 i5 UHD (Toshiba Exceria Pro M501 64 GB UHS-II) | |
| Genomsnitt av klass Multimedia (23 - 531, n=37, senaste 2 åren) | |
| Dell Latitude 7480 (Toshiba (Exceria Pro SDXC UHS-II 64 GB) | |
| Asus ZenBook 13 UX331UN (Toshiba Exceria Pro M501) | |
| Lenovo IdeaPad 320s-14IKB (Toshiba Exceria Pro SDXC 64 GB UHS-II) | |
| Asus VivoBook S410UQ-NH74 (Toshiba Exceria Pro SDXC 64 GB UHS-II) | |
| Acer Swift 3 SF314-52G-89SL (Toshiba Exceria Pro SDXC 64 GB UHS-II) | |
| maximum AS SSD Seq Read Test (1GB) | |
| Dell XPS 13 9370 i5 UHD (Toshiba Exceria Pro M501 64 GB UHS-II) | |
| Genomsnitt av klass Multimedia (37.3 - 1455, n=36, senaste 2 åren) | |
| Dell Latitude 7480 (Toshiba (Exceria Pro SDXC UHS-II 64 GB) | |
| Lenovo IdeaPad 320s-14IKB (Toshiba Exceria Pro SDXC 64 GB UHS-II) | |
| Asus ZenBook 13 UX331UN (Toshiba Exceria Pro M501) | |
| Asus VivoBook S410UQ-NH74 (Toshiba Exceria Pro SDXC 64 GB UHS-II) | |
| Acer Swift 3 SF314-52G-89SL (Toshiba Exceria Pro SDXC 64 GB UHS-II) | |
| Networking | |
| iperf3 transmit AX12 | |
| Acer Swift 3 SF314-52G-89SL | |
| HP Spectre 13-af033ng | |
| Asus VivoBook S410UQ-NH74 | |
| Dell XPS 13 9370 i5 UHD | |
| Lenovo IdeaPad 320s-14IKB | |
| Asus VivoBook S14 S406UA-BV023T | |
| iperf3 receive AX12 | |
| Dell XPS 13 9370 i5 UHD | |
| Asus VivoBook S410UQ-NH74 | |
| HP Spectre 13-af033ng | |
| Asus VivoBook S14 S406UA-BV023T | |
| Lenovo IdeaPad 320s-14IKB | |
| Acer Swift 3 SF314-52G-89SL | |
| |||||||||||||||||||||||||
Distribution av ljusstyrkan: 84 %
Mitt på batteriet: 253.9 cd/m²
Kontrast: 819:1 (Svärta: 0.31 cd/m²)
ΔE ColorChecker Calman: 6.03 | ∀{0.5-29.43 Ø4.71}
calibrated: 4.52
ΔE Greyscale Calman: 5.9 | ∀{0.09-98 Ø4.96}
56.59% sRGB (Calman 2D)
56.59% sRGB (Argyll 1.6.3 3D)
39.3% AdobeRGB 1998 (Argyll 1.6.3 3D)
39.3% AdobeRGB 1998 (Argyll 3D)
56.6% sRGB (Argyll 3D)
38.04% Display P3 (Argyll 3D)
Gamma: 2.25
CCT: 5814 K
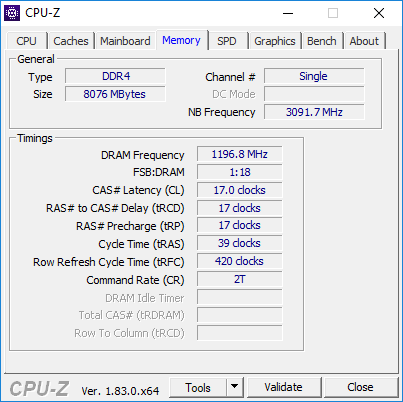
| Asus VivoBook S410UQ-NH74 AUO B140HAN04.2, IPS, 14", 1920x1080 | Asus Zenbook UX3410UQ-GV077T Chi Mei N140HCE-EN1, IPS, 14", 1920x1080 | Acer Swift 3 SF314-52G-89SL AU Optronics B140HAN02.1, IPS, 14", 1920x1080 | Lenovo IdeaPad 320s-14IKB BOE CQ NV140FHM-N49, IPS, 14", 1920x1080 | Dell XPS 13 9370 i5 UHD ID: Sharp SHP148B, Name: LQ133D1, Dell P/N: 8XDHY, IPS, 13.3", 3840x2160 | Asus VivoBook S14 S406UA-BV023T BOE CQ NT140WHM-N44, TN LED, 14", 1366x768 | |
|---|---|---|---|---|---|---|
| Display | 76% | -5% | 3% | 77% | 2% | |
| Display P3 Coverage (%) | 38.04 | 67.2 77% | 36.09 -5% | 39.26 3% | 68.9 81% | 38.82 2% |
| sRGB Coverage (%) | 56.6 | 99.2 75% | 54.2 -4% | 57.6 2% | 98.4 74% | 58.2 3% |
| AdobeRGB 1998 Coverage (%) | 39.3 | 69.3 76% | 37.28 -5% | 40.56 3% | 69.5 77% | 40.11 2% |
| Response Times | -10% | 1% | -12% | -63% | 22% | |
| Response Time Grey 50% / Grey 80% * (ms) | 38.8 ? | 44 ? -13% | 41 ? -6% | 44 ? -13% | 67.2 ? -73% | 42 ? -8% |
| Response Time Black / White * (ms) | 27.2 ? | 29 ? -7% | 25 ? 8% | 30 ? -10% | 41.6 ? -53% | 13 ? 52% |
| PWM Frequency (Hz) | 60 ? | 357 ? | 2500 ? | 200 ? | ||
| Screen | 42% | 6% | 19% | 45% | -20% | |
| Brightness middle (cd/m²) | 253.9 | 381 50% | 233 -8% | 245 -4% | 496.4 96% | 215 -15% |
| Brightness (cd/m²) | 239 | 368 54% | 217 -9% | 235 -2% | 469 96% | 208 -13% |
| Brightness Distribution (%) | 84 | 84 0% | 88 5% | 71 -15% | 84 0% | 81 -4% |
| Black Level * (cd/m²) | 0.31 | 0.3 3% | 0.27 13% | 0.21 32% | 0.5 -61% | 0.4 -29% |
| Contrast (:1) | 819 | 1270 55% | 863 5% | 1167 42% | 993 21% | 538 -34% |
| Colorchecker dE 2000 * | 6.03 | 2.84 53% | 5.85 3% | 4.85 20% | 2.9 52% | 9.37 -55% |
| Colorchecker dE 2000 max. * | 24.7 | 6.5 74% | 11.51 53% | 8.99 64% | 5.26 79% | 15.84 36% |
| Colorchecker dE 2000 calibrated * | 4.52 | |||||
| Greyscale dE 2000 * | 5.9 | 4.02 32% | 4.87 17% | 2.64 55% | 3.9 34% | 10.52 -78% |
| Gamma | 2.25 98% | 2.42 91% | 2.47 89% | 2.18 101% | 2.066 106% | 2.45 90% |
| CCT | 5814 112% | 7430 87% | 6908 94% | 6161 106% | 7169 91% | 11214 58% |
| Color Space (Percent of AdobeRGB 1998) (%) | 39.3 | 56 42% | 34 -13% | 37 -6% | 63.9 63% | 37 -6% |
| Color Space (Percent of sRGB) (%) | 56.59 | 86 52% | 54 -5% | 57 1% | 98.2 74% | 58 2% |
| Totalt genomsnitt (program/inställningar) | 36% /
42% | 1% /
3% | 3% /
11% | 20% /
37% | 1% /
-10% |
* ... mindre är bättre
Visa svarstider
| ↔ Svarstid svart till vitt | ||
|---|---|---|
| 27.2 ms ... stiga ↗ och falla ↘ kombinerat | ↗ 14 ms stiga | 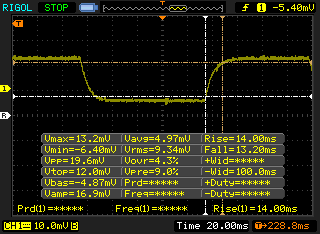 |
| ↘ 13.2 ms hösten | ||
| Skärmen visar relativt långsamma svarsfrekvenser i våra tester och kan vara för långsam för spelare. I jämförelse sträcker sig alla testade enheter från 0.1 (minst) till 240 (maximalt) ms. » 69 % av alla enheter är bättre. Detta innebär att den uppmätta svarstiden är sämre än genomsnittet av alla testade enheter (19.8 ms). | ||
| ↔ Svarstid 50 % grått till 80 % grått | ||
| 38.8 ms ... stiga ↗ och falla ↘ kombinerat | ↗ 20 ms stiga | 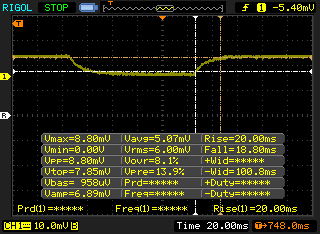 |
| ↘ 18.8 ms hösten | ||
| Skärmen visar långsamma svarsfrekvenser i våra tester och kommer att vara otillfredsställande för spelare. I jämförelse sträcker sig alla testade enheter från 0.165 (minst) till 636 (maximalt) ms. » 58 % av alla enheter är bättre. Detta innebär att den uppmätta svarstiden är sämre än genomsnittet av alla testade enheter (31 ms). | ||
Skärmflimmer / PWM (Puls-Width Modulation)
| Skärmflimmer / PWM upptäcktes inte | 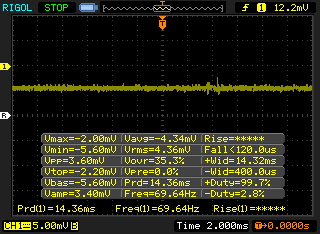 | ||
Som jämförelse: 52 % av alla testade enheter använder inte PWM för att dämpa skärmen. Om PWM upptäcktes mättes ett medelvärde av 7757 (minst: 5 - maximum: 343500) Hz. | |||
| Cinebench R15 | |
| CPU Single 64Bit | |
| Genomsnitt av klass Multimedia (184.8 - 326, n=59, senaste 2 åren) | |
| Acer Swift 3 SF314-52G-89SL | |
| Dell Latitude 7480 | |
| Asus ZenBook 13 UX331UN | |
| Asus VivoBook S410UQ-NH74 | |
| Genomsnitt Intel Core i7-8550U (108 - 172, n=76) | |
| Asus Zenbook UX3410UQ-GV077T | |
| HP Spectre 13-af033ng | |
| Asus VivoBook S14 S406UA-BV023T | |
| Dell XPS 13 9370 i5 UHD | |
| Lenovo IdeaPad 320s-14IKB | |
| CPU Multi 64Bit | |
| Genomsnitt av klass Multimedia (856 - 5224, n=61, senaste 2 åren) | |
| Asus VivoBook S410UQ-NH74 | |
| Dell XPS 13 9370 i5 UHD | |
| Asus ZenBook 13 UX331UN | |
| Asus VivoBook S14 S406UA-BV023T | |
| Genomsnitt Intel Core i7-8550U (301 - 761, n=78) | |
| Acer Swift 3 SF314-52G-89SL | |
| HP Spectre 13-af033ng | |
| Dell Latitude 7480 | |
| Asus Zenbook UX3410UQ-GV077T | |
| Lenovo IdeaPad 320s-14IKB | |
| Cinebench R10 | |
| Rendering Multiple CPUs 32Bit | |
| Genomsnitt av klass Multimedia (17722 - 84729, n=8, senaste 2 åren) | |
| Dell XPS 13 9370 i5 UHD | |
| Asus VivoBook S410UQ-NH74 | |
| Asus VivoBook S14 S406UA-BV023T | |
| Genomsnitt Intel Core i7-8550U (11694 - 24180, n=31) | |
| Acer Swift 3 SF314-52G-89SL | |
| Dell Latitude 7480 | |
| Asus Zenbook UX3410UQ-GV077T | |
| Lenovo IdeaPad 320s-14IKB | |
| Rendering Single 32Bit | |
| Genomsnitt av klass Multimedia (3234 - 11576, n=8, senaste 2 åren) | |
| Asus VivoBook S410UQ-NH74 | |
| Acer Swift 3 SF314-52G-89SL | |
| Genomsnitt Intel Core i7-8550U (4202 - 8211, n=31) | |
| Dell Latitude 7480 | |
| Asus Zenbook UX3410UQ-GV077T | |
| Dell XPS 13 9370 i5 UHD | |
| Asus VivoBook S14 S406UA-BV023T | |
| Lenovo IdeaPad 320s-14IKB | |
| wPrime 2.10 - 1024m | |
| Dell Latitude 7480 | |
| Asus VivoBook S410UQ-NH74 | |
| Genomsnitt Intel Core i7-8550U (258 - 435, n=11) | |
| Genomsnitt av klass Multimedia (227 - 340, n=6, senaste 2 åren) | |
| Dell XPS 13 9370 i5 UHD | |
* ... mindre är bättre
| PCMark 8 | |
| Home Score Accelerated v2 | |
| Genomsnitt av klass Multimedia (n=1senaste 2 åren) | |
| Dell Latitude 7480 | |
| Acer Swift 3 SF314-52G-89SL | |
| Asus VivoBook S14 S406UA-BV023T | |
| Asus Zenbook UX3410UQ-GV077T | |
| Asus ZenBook 13 UX331UN | |
| Genomsnitt Intel Core i7-8550U, NVIDIA GeForce 940MX (3778 - 3906, n=3) | |
| Asus VivoBook S410UQ-NH74 | |
| HP Spectre 13-af033ng | |
| Lenovo IdeaPad 320s-14IKB | |
| Work Score Accelerated v2 | |
| Asus VivoBook S14 S406UA-BV023T | |
| Asus VivoBook S410UQ-NH74 | |
| Dell Latitude 7480 | |
| Asus ZenBook 13 UX331UN | |
| Genomsnitt Intel Core i7-8550U, NVIDIA GeForce 940MX (4987 - 5054, n=3) | |
| HP Spectre 13-af033ng | |
| Lenovo IdeaPad 320s-14IKB | |
| Creative Score Accelerated v2 | |
| HP Spectre 13-af033ng | |
| Dell Latitude 7480 | |
| Asus VivoBook S14 S406UA-BV023T | |
| Asus VivoBook S410UQ-NH74 | |
| Genomsnitt Intel Core i7-8550U, NVIDIA GeForce 940MX (n=1) | |
| Lenovo IdeaPad 320s-14IKB | |
| PCMark 8 Home Score Accelerated v2 | 3792 poäng | |
| PCMark 8 Creative Score Accelerated v2 | 4871 poäng | |
| PCMark 8 Work Score Accelerated v2 | 5054 poäng | |
| PCMark 10 Score | 3433 poäng | |
Hjälp | ||
| Asus VivoBook S410UQ-NH74 Micron 1100 MTFDDAV256TBN | Acer Swift 3 SF314-52G-89SL Intel SSD 600p SSDPEKKW512G7 | Lenovo IdeaPad 320s-14IKB Liteonit CV3-DE256 | HP Spectre 13-af033ng Samsung PM961 NVMe MZVLW512HMJP | Asus Zenbook UX3410UQ-GV077T SanDisk SD8SNAT256G1002 | Dell Latitude 7480 Intel SSDSCKKF256H6 | Genomsnitt Micron 1100 MTFDDAV256TBN | |
|---|---|---|---|---|---|---|---|
| CrystalDiskMark 3.0 | 56% | -5% | 88% | -15% | 3% | -8% | |
| Write 4k QD32 (MB/s) | 295.6 | 496.2 68% | 238.7 -19% | 476 61% | 257.2 -13% | 252.8 -14% | 233 ? -21% |
| Read 4k QD32 (MB/s) | 248 | 462.6 87% | 334.8 35% | 543 119% | 147 -41% | 280.2 13% | 227 ? -8% |
| Write 4k (MB/s) | 101.9 | 133.6 31% | 61.6 -40% | 144 41% | 79.5 -22% | 90.5 -11% | 80.8 ? -21% |
| Read 4k (MB/s) | 28.01 | 13.98 -50% | 25.9 -8% | 60 114% | 22.78 -19% | 29.25 4% | 24.6 ? -12% |
| Write 512 (MB/s) | 352.3 | 483.3 37% | 258 -27% | 546 55% | 288 -18% | 306.8 -13% | 315 ? -11% |
| Read 512 (MB/s) | 259.4 | 616 137% | 272.8 5% | 515 99% | 289 11% | 354.3 37% | 315 ? 21% |
| Write Seq (MB/s) | 389.2 | 552 42% | 417.8 7% | 878 126% | 323.7 -17% | 418.6 8% | 379 ? -3% |
| Read Seq (MB/s) | 490.2 | 944 93% | 511 4% | 907 85% | 497 1% | 486.5 -1% | 465 ? -5% |

| 3DMark | |
| 1280x720 Cloud Gate Standard Graphics | |
| Genomsnitt av klass Multimedia (16765 - 143501, n=32, senaste 2 åren) | |
| Asus ZenBook 13 UX331UN | |
| Acer Swift 3 SF315-41-R4W1 | |
| Genomsnitt NVIDIA GeForce 940MX (8165 - 14485, n=37) | |
| Asus VivoBook S410UQ-NH74 | |
| Lenovo IdeaPad 320s-14IKB | |
| Asus VivoBook S14 S406UA-BV023T | |
| Dell XPS 13 9370 i5 UHD | |
| HP Spectre 13-af033ng | |
| Dell Latitude 7480 | |
| 1920x1080 Fire Strike Graphics | |
| Genomsnitt av klass Multimedia (2328 - 48907, n=58, senaste 2 åren) | |
| Asus ZenBook 13 UX331UN | |
| Acer Swift 3 SF315-41-R4W1 | |
| Asus VivoBook S410UQ-NH74 | |
| Genomsnitt NVIDIA GeForce 940MX (1540 - 2403, n=37) | |
| Lenovo IdeaPad 320s-14IKB | |
| Dell XPS 13 9370 i5 UHD | |
| Asus VivoBook S14 S406UA-BV023T | |
| HP Spectre 13-af033ng | |
| Dell Latitude 7480 | |
| 1920x1080 Ice Storm Extreme Graphics | |
| Genomsnitt av klass Multimedia (162458 - 237569, n=2, senaste 2 åren) | |
| Lenovo IdeaPad 320s-14IKB | |
| Dell Latitude 7480 | |
| Genomsnitt NVIDIA GeForce 940MX (26424 - 67037, n=16) | |
| Dell XPS 13 9370 i5 UHD | |
| 3DMark 11 Performance | 2844 poäng | |
| 3DMark Ice Storm Standard Score | 43801 poäng | |
| 3DMark Cloud Gate Standard Score | 9025 poäng | |
| 3DMark Fire Strike Score | 1917 poäng | |
| 3DMark Fire Strike Extreme Score | 940 poäng | |
Hjälp | ||
| Tomb Raider | |
| 1920x1080 Ultra Preset AA:FX AF:16x (sortera efter värde) | |
| Asus VivoBook S410UQ-NH74 | |
| Dell Latitude 7480 | |
| Acer Swift 3 SF315-41-R4W1 | |
| Genomsnitt NVIDIA GeForce 940MX (18.3 - 29.4, n=7) | |
| 1366x768 High Preset AA:FX AF:8x (sortera efter värde) | |
| Asus VivoBook S410UQ-NH74 | |
| Dell Latitude 7480 | |
| Acer Swift 3 SF315-41-R4W1 | |
| Genomsnitt NVIDIA GeForce 940MX (34.5 - 62.6, n=8) | |
| 1366x768 Normal Preset AA:FX AF:4x (sortera efter värde) | |
| Asus VivoBook S410UQ-NH74 | |
| Dell Latitude 7480 | |
| Acer Swift 3 SF315-41-R4W1 | |
| Genomsnitt NVIDIA GeForce 940MX (58.6 - 96.4, n=7) | |
| 1024x768 Low Preset (sortera efter värde) | |
| Asus VivoBook S410UQ-NH74 | |
| Dell Latitude 7480 | |
| Acer Swift 3 SF315-41-R4W1 | |
| Genomsnitt NVIDIA GeForce 940MX (132.9 - 184.4, n=7) | |
| Rise of the Tomb Raider | |
| 1920x1080 Very High Preset AA:FX AF:16x (sortera efter värde) | |
| Asus VivoBook S410UQ-NH74 | |
| Genomsnitt NVIDIA GeForce 940MX (8.2 - 13.8, n=10) | |
| 1920x1080 High Preset AA:FX AF:4x (sortera efter värde) | |
| Asus VivoBook S410UQ-NH74 | |
| HP Spectre 13-af033ng | |
| Acer Swift 3 SF315-41-R4W1 | |
| Genomsnitt NVIDIA GeForce 940MX (10.4 - 17, n=17) | |
| 1366x768 Medium Preset AF:2x (sortera efter värde) | |
| Asus VivoBook S410UQ-NH74 | |
| HP Spectre 13-af033ng | |
| Genomsnitt NVIDIA GeForce 940MX (13.4 - 30.6, n=20) | |
| 1024x768 Lowest Preset (sortera efter värde) | |
| Asus VivoBook S410UQ-NH74 | |
| HP Spectre 13-af033ng | |
| Acer Swift 3 SF315-41-R4W1 | |
| Genomsnitt NVIDIA GeForce 940MX (26.9 - 52.8, n=20) | |
| låg | med. | hög | ultra | |
|---|---|---|---|---|
| Tomb Raider (2013) | 157.9 | 77 | 48.1 | 23.7 |
| BioShock Infinite (2013) | 108.4 | 63.1 | 53.2 | 19.8 |
| The Witcher 3 (2015) | 23 | |||
| Rise of the Tomb Raider (2016) | 44.8 | 26.5 | 14.5 | 11.3 |
Ljudnivå
| Låg belastning |
| 28.3 / 28.3 / 29.8 dB(A) |
| Hög belastning |
| 39 / 42.6 dB(A) |
 | ||
30 dB tyst 40 dB(A) hörbar 50 dB(A) högt ljud |
||
min: | ||
| Asus VivoBook S410UQ-NH74 GeForce 940MX, i5-8550U, Micron 1100 MTFDDAV256TBN | Acer Swift 3 SF314-52G-89SL GeForce MX150, i5-8550U, Intel SSD 600p SSDPEKKW512G7 | Asus ZenBook 13 UX331UN GeForce MX150, i5-8550U, SanDisk SD8SN8U512G1002 | Lenovo IdeaPad 320s-14IKB GeForce 920MX, i5-7200U, Liteonit CV3-DE256 | Dell Latitude 7480 HD Graphics 620, i7-7600U, Intel SSDSCKKF256H6 | HP Spectre 13-af033ng UHD Graphics 620, i5-8550U, Samsung PM961 NVMe MZVLW512HMJP | Dell XPS 13 9370 i5 UHD UHD Graphics 620, i5-8250U, Toshiba XG5 KXG50ZNV256G | Asus VivoBook S14 S406UA-BV023T UHD Graphics 620, i5-8250U, SanDisk SD8SN8U256G1002 | Acer Swift 3 SF315-41-R4W1 Vega 8, R5 2500U, Intel SSD 600p SSDPEKKW256G7 | |
|---|---|---|---|---|---|---|---|---|---|
| Noise | 2% | -4% | -1% | 10% | 4% | 4% | -4% | -2% | |
| av / miljö * (dB) | 28.3 | 30.5 -8% | 29.6 -5% | 30.13 -6% | 30.13 -6% | 29 -2% | 30.2 -7% | 31.8 -12% | |
| Idle Minimum * (dB) | 28.3 | 30.5 -8% | 29.6 -5% | 30.8 -9% | 28.6 -1% | 30.13 -6% | 29 -2% | 30.2 -7% | 31.8 -12% |
| Idle Average * (dB) | 28.3 | 30.5 -8% | 29.6 -5% | 30.8 -9% | 28.6 -1% | 30.13 -6% | 29 -2% | 30.2 -7% | 32.1 -13% |
| Idle Maximum * (dB) | 29.8 | 30.9 -4% | 29.6 1% | 30.8 -3% | 28.6 4% | 30.13 -1% | 29 3% | 31.3 -5% | 32.1 -8% |
| Load Average * (dB) | 39 | 35.6 9% | 41.7 -7% | 35.5 9% | 30.2 23% | 31.5 19% | 32 18% | 40.1 -3% | 33 15% |
| Witcher 3 ultra * (dB) | 40.6 | 35.1 14% | 43.5 -7% | ||||||
| Load Maximum * (dB) | 42.6 | 35.6 16% | 43.5 -2% | 36.2 15% | 31.2 27% | 33.5 21% | 40.1 6% | 40.4 5% | 34.8 18% |
* ... mindre är bättre
(+) Den maximala temperaturen på ovansidan är 39 °C / 102 F, jämfört med genomsnittet av 36.8 °C / 98 F , allt från 21 till 71 °C för klassen Multimedia.
(-) Botten värms upp till maximalt 47 °C / 117 F, jämfört med genomsnittet av 39.1 °C / 102 F
(+) Vid tomgångsbruk är medeltemperaturen för ovansidan 25.8 °C / 78 F, jämfört med enhetsgenomsnittet på 31.3 °C / ### class_avg_f### F.
(+) När du spelar The Witcher 3 är medeltemperaturen för ovansidan 27.9 °C / 82 F, jämfört med enhetsgenomsnittet på 31.3 °C / ## #class_avg_f### F.
(+) Handledsstöden och pekplattan är kallare än hudtemperaturen med maximalt 29.6 °C / 85.3 F och är därför svala att ta på.
(±) Medeltemperaturen för handledsstödsområdet på liknande enheter var 28.7 °C / 83.7 F (-0.9 °C / -1.6 F).
Asus VivoBook S410UQ-NH74 ljudanalys
(-) | inte särskilt höga högtalare (59.9 dB)
Bas 100 - 315 Hz
(-) | nästan ingen bas - i genomsnitt 15.6% lägre än medianen
(±) | linjäriteten för basen är genomsnittlig (13.5% delta till föregående frekvens)
Mellan 400 - 2000 Hz
(±) | reducerade mids - i genomsnitt 5.2% lägre än median
(±) | linjäriteten för mids är genomsnittlig (8.3% delta till föregående frekvens)
Högsta 2 - 16 kHz
(+) | balanserade toppar - endast 2.9% från medianen
(±) | linjäriteten för toppar är genomsnittlig (9.9% delta till föregående frekvens)
Totalt 100 - 16 000 Hz
(±) | linjäriteten för det totala ljudet är genomsnittlig (26.3% skillnad mot median)
Jämfört med samma klass
» 92% av alla testade enheter i den här klassen var bättre, 1% liknande, 6% sämre
» Den bästa hade ett delta på 5%, genomsnittet var 17%, sämst var 45%
Jämfört med alla testade enheter
» 81% av alla testade enheter var bättre, 4% liknande, 15% sämre
» Den bästa hade ett delta på 4%, genomsnittet var 23%, sämst var 134%
Apple MacBook 12 (Early 2016) 1.1 GHz ljudanalys
(+) | högtalare kan spela relativt högt (83.6 dB)
Bas 100 - 315 Hz
(±) | reducerad bas - i genomsnitt 11.3% lägre än medianen
(±) | linjäriteten för basen är genomsnittlig (14.2% delta till föregående frekvens)
Mellan 400 - 2000 Hz
(+) | balanserad mellan - endast 2.4% från medianen
(+) | mids är linjära (5.5% delta till föregående frekvens)
Högsta 2 - 16 kHz
(+) | balanserade toppar - endast 2% från medianen
(+) | toppar är linjära (4.5% delta till föregående frekvens)
Totalt 100 - 16 000 Hz
(+) | det totala ljudet är linjärt (10.2% skillnad mot median)
Jämfört med samma klass
» 7% av alla testade enheter i den här klassen var bättre, 2% liknande, 90% sämre
» Den bästa hade ett delta på 5%, genomsnittet var 18%, sämst var 53%
Jämfört med alla testade enheter
» 5% av alla testade enheter var bättre, 1% liknande, 94% sämre
» Den bästa hade ett delta på 4%, genomsnittet var 23%, sämst var 134%
| Av/Standby | |
| Låg belastning | |
| Hög belastning |
|
Förklaring:
min: | |
| Asus VivoBook S410UQ-NH74 i5-8550U, GeForce 940MX, Micron 1100 MTFDDAV256TBN, IPS, 1920x1080, 14" | Acer Swift 3 SF314-52G-89SL i5-8550U, GeForce MX150, Intel SSD 600p SSDPEKKW512G7, IPS, 1920x1080, 14" | Lenovo IdeaPad 320s-14IKB i5-7200U, GeForce 920MX, Liteonit CV3-DE256, IPS, 1920x1080, 14" | HP Spectre 13-af033ng i5-8550U, UHD Graphics 620, Samsung PM961 NVMe MZVLW512HMJP, IPS, 1920x1080, 13.3" | Dell XPS 13 9370 i5 UHD i5-8250U, UHD Graphics 620, Toshiba XG5 KXG50ZNV256G, IPS, 3840x2160, 13.3" | Asus VivoBook S14 S406UA-BV023T i5-8250U, UHD Graphics 620, SanDisk SD8SN8U256G1002, TN LED, 1366x768, 14" | Acer Swift 3 SF315-41-R4W1 R5 2500U, Vega 8, Intel SSD 600p SSDPEKKW256G7, IPS, 1920x1080, 15.6" | |
|---|---|---|---|---|---|---|---|
| Power Consumption | -14% | 12% | 7% | -14% | 9% | -47% | |
| Idle Minimum * (Watt) | 3.5 | 4.4 -26% | 3.2 9% | 2.8 20% | 4.3 -23% | 3.7 -6% | 7.3 -109% |
| Idle Average * (Watt) | 5.65 | 6.6 -17% | 5.9 -4% | 6.2 -10% | 8 -42% | 5.6 1% | 9.7 -72% |
| Idle Maximum * (Watt) | 6.5 | 9.2 -42% | 6.7 -3% | 9.4 -45% | 8.1 -25% | 7.6 -17% | 13 -100% |
| Load Average * (Watt) | 52.3 | 61 -17% | 36.7 30% | 32.2 38% | 46.6 11% | 37.4 28% | 40.4 23% |
| Witcher 3 ultra * (Watt) | 46.2 | 40 13% | |||||
| Load Maximum * (Watt) | 54.5 | 50 8% | 39 28% | 36.6 33% | 49.8 9% | 33 39% | 42.2 23% |
* ... mindre är bättre
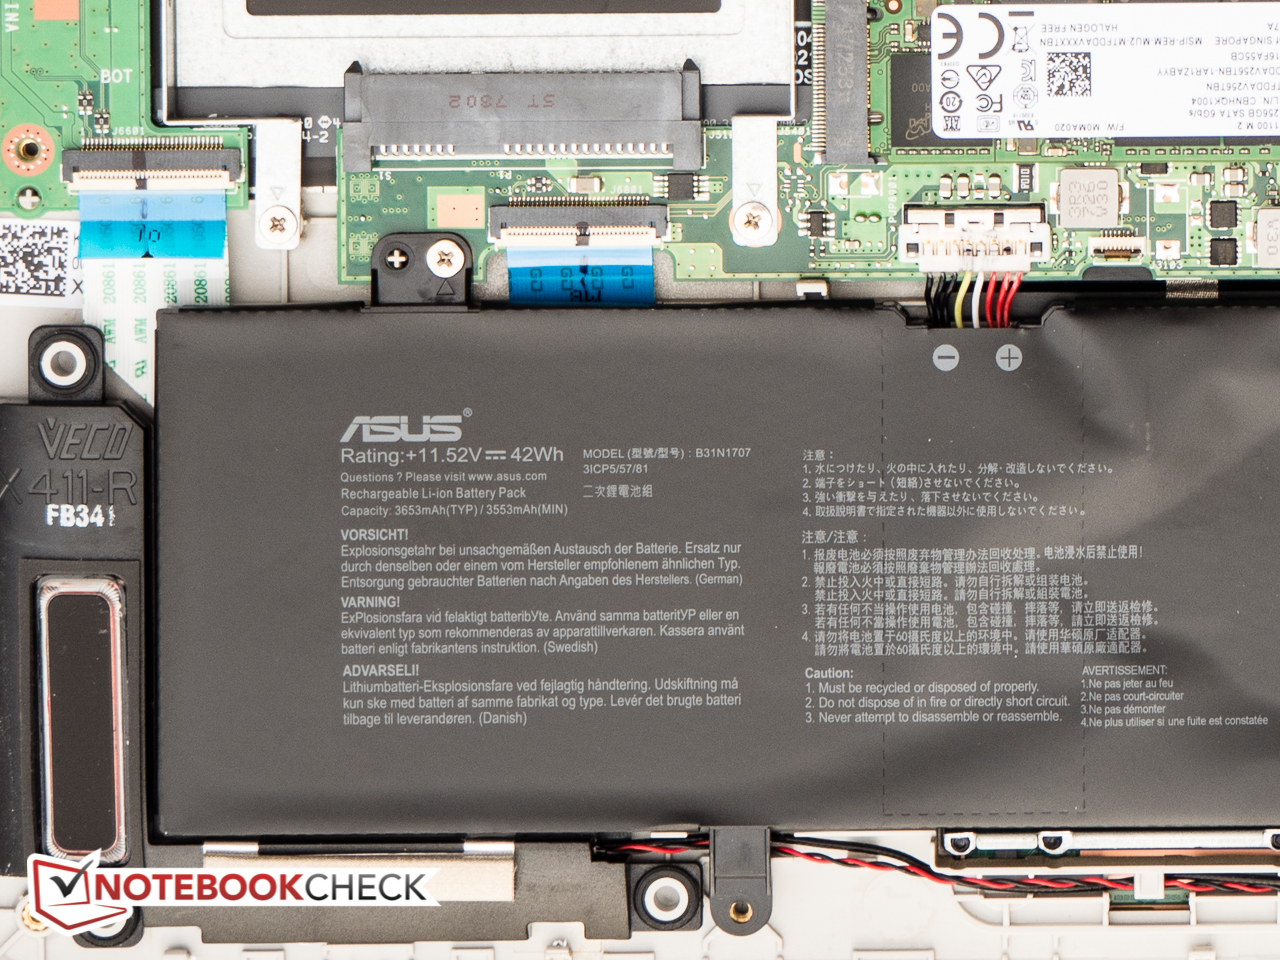
| Asus VivoBook S410UQ-NH74 i5-8550U, GeForce 940MX, 42 Wh | Acer Swift 3 SF314-52G-89SL i5-8550U, GeForce MX150, 48 Wh | Asus ZenBook 13 UX331UN i5-8550U, GeForce MX150, 50 Wh | Lenovo IdeaPad 320s-14IKB i5-7200U, GeForce 920MX, 52.5 Wh | Dell Latitude 7480 i7-7600U, HD Graphics 620, 60 Wh | HP Spectre 13-af033ng i5-8550U, UHD Graphics 620, 43 Wh | Dell XPS 13 9370 i5 UHD i5-8250U, UHD Graphics 620, 52 Wh | Asus VivoBook S14 S406UA-BV023T i5-8250U, UHD Graphics 620, 39 Wh | Acer Swift 3 SF315-41-R4W1 R5 2500U, Vega 8, 48 Wh | |
|---|---|---|---|---|---|---|---|---|---|
| Batteridrifttid | -4% | 35% | 9% | 84% | -11% | 4% | -2% | -17% | |
| Reader / Idle (h) | 12.5 | 22 76% | 27.7 122% | 14.5 16% | 12.2 -2% | ||||
| WiFi v1.3 (h) | 8.1 | 7.8 -4% | 8.4 4% | 8.8 9% | 12 48% | 5.9 -27% | 6.8 -16% | 7.9 -2% | 5.2 -36% |
| Load (h) | 1.6 | 2 25% | 2.9 81% | 1.7 6% | 1.8 13% | 1.4 -13% |
För
Emot

Läs den fullständiga versionen av den här recensionen på engelska här.
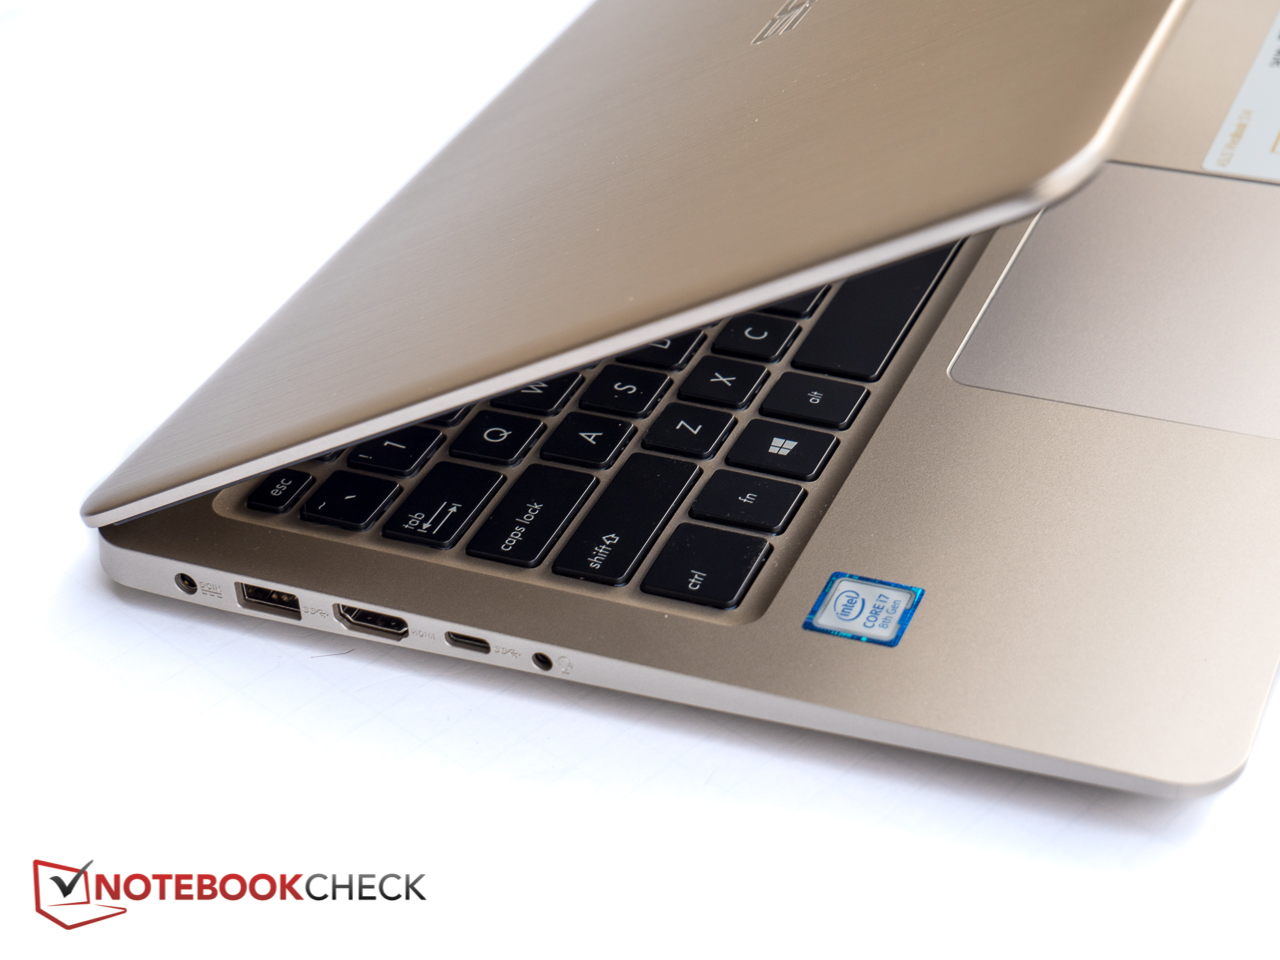
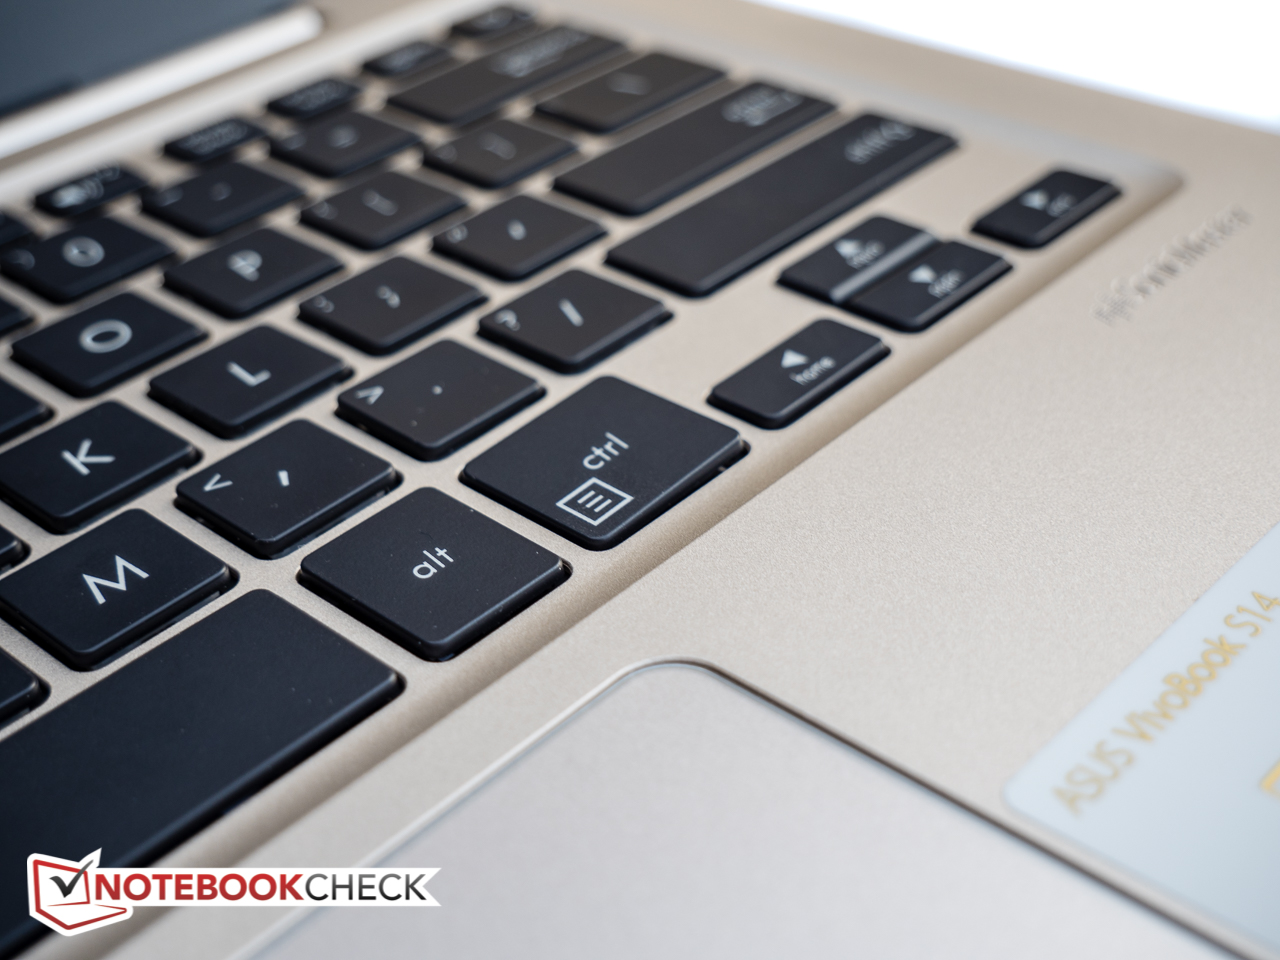
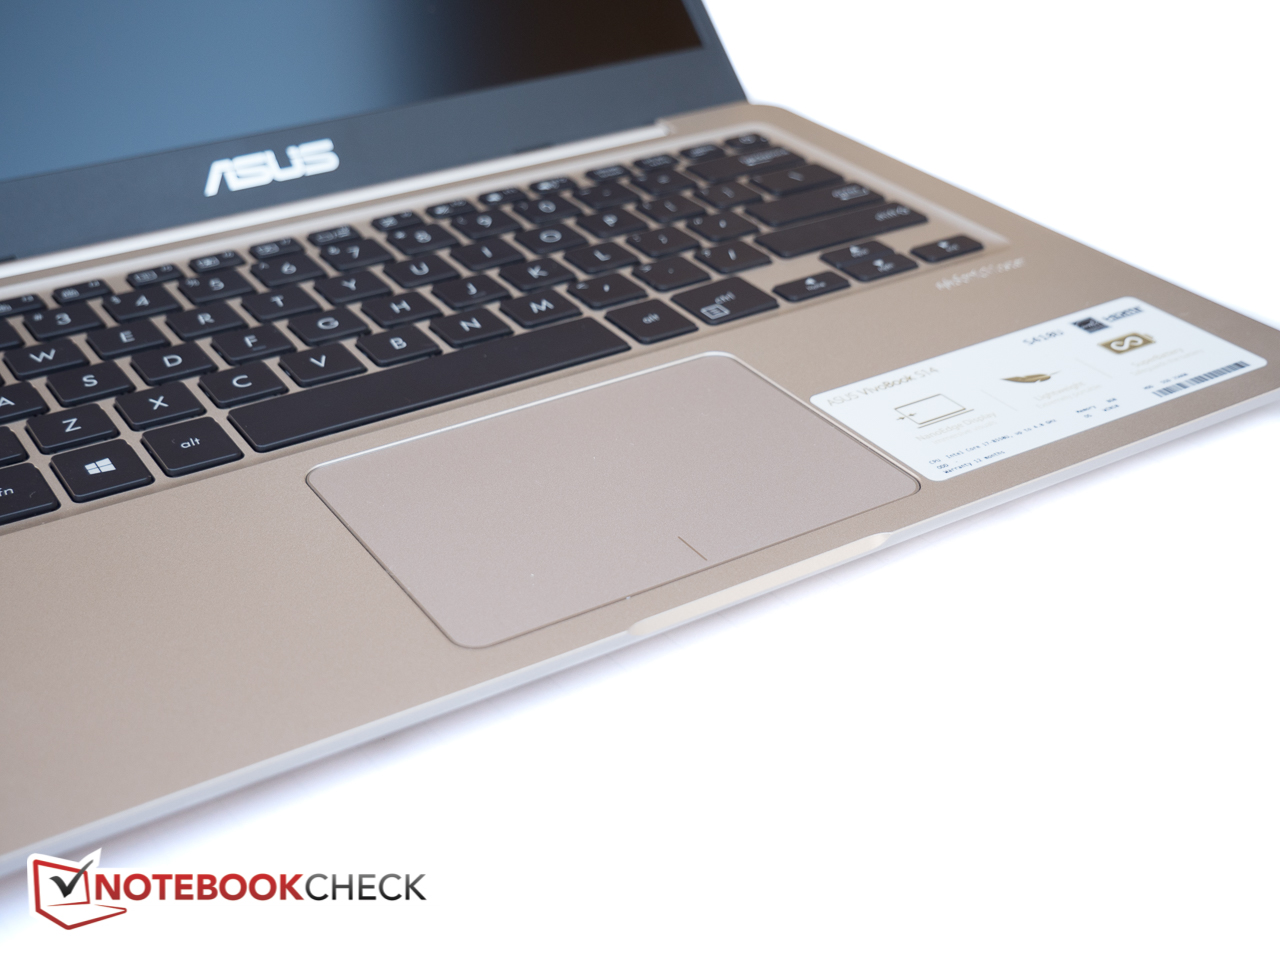
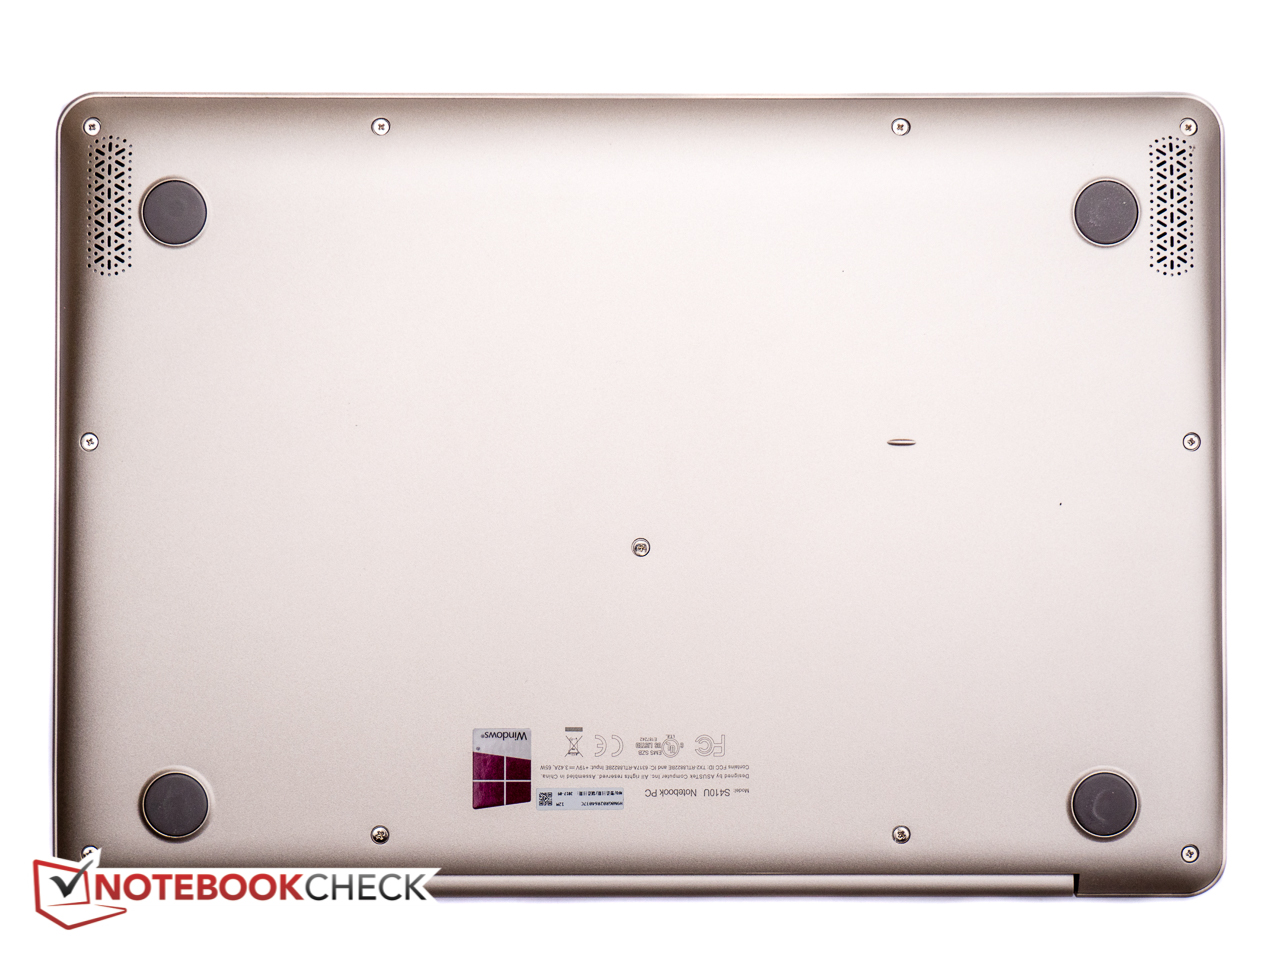
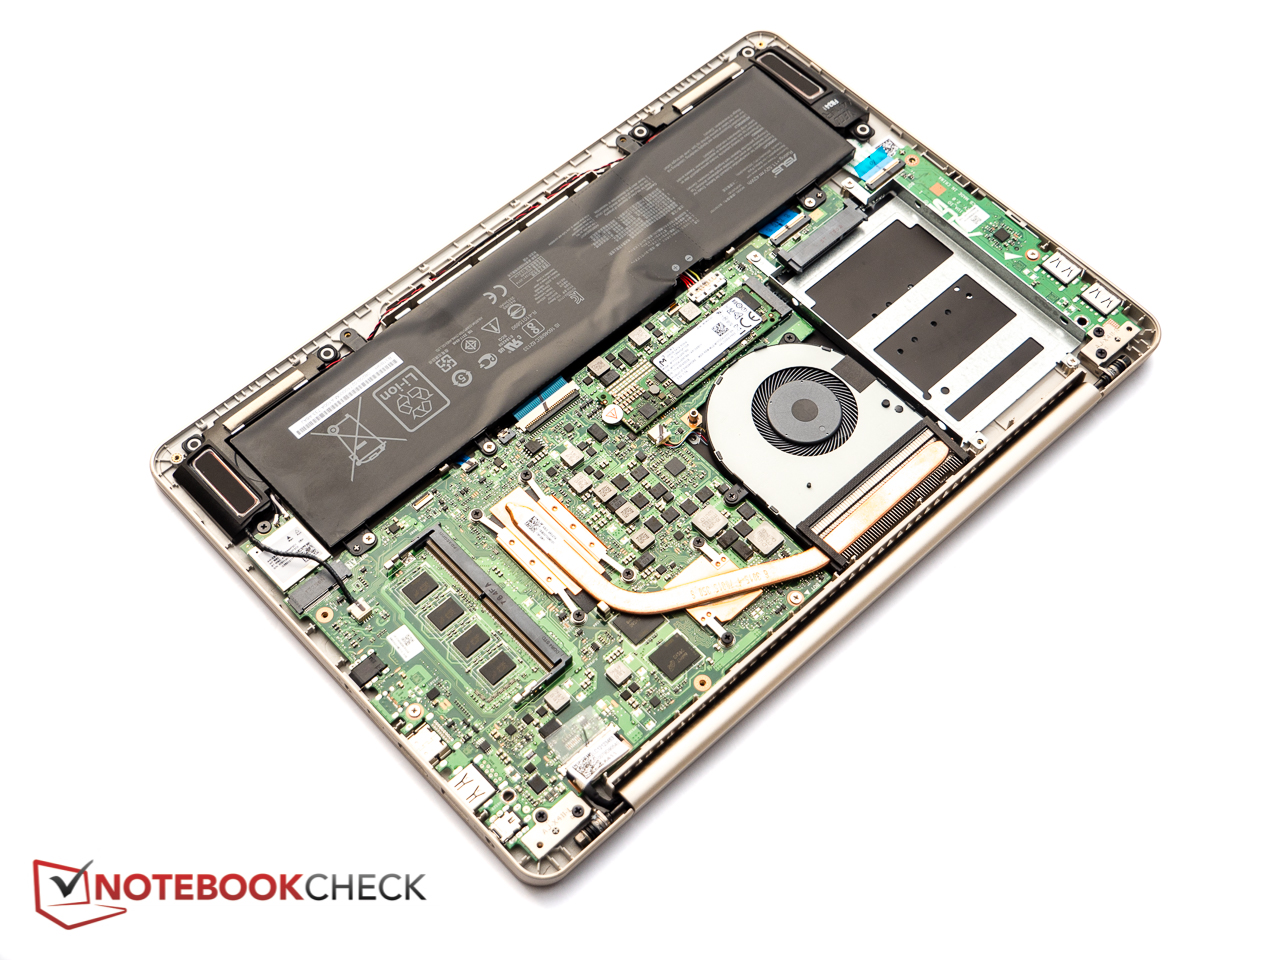
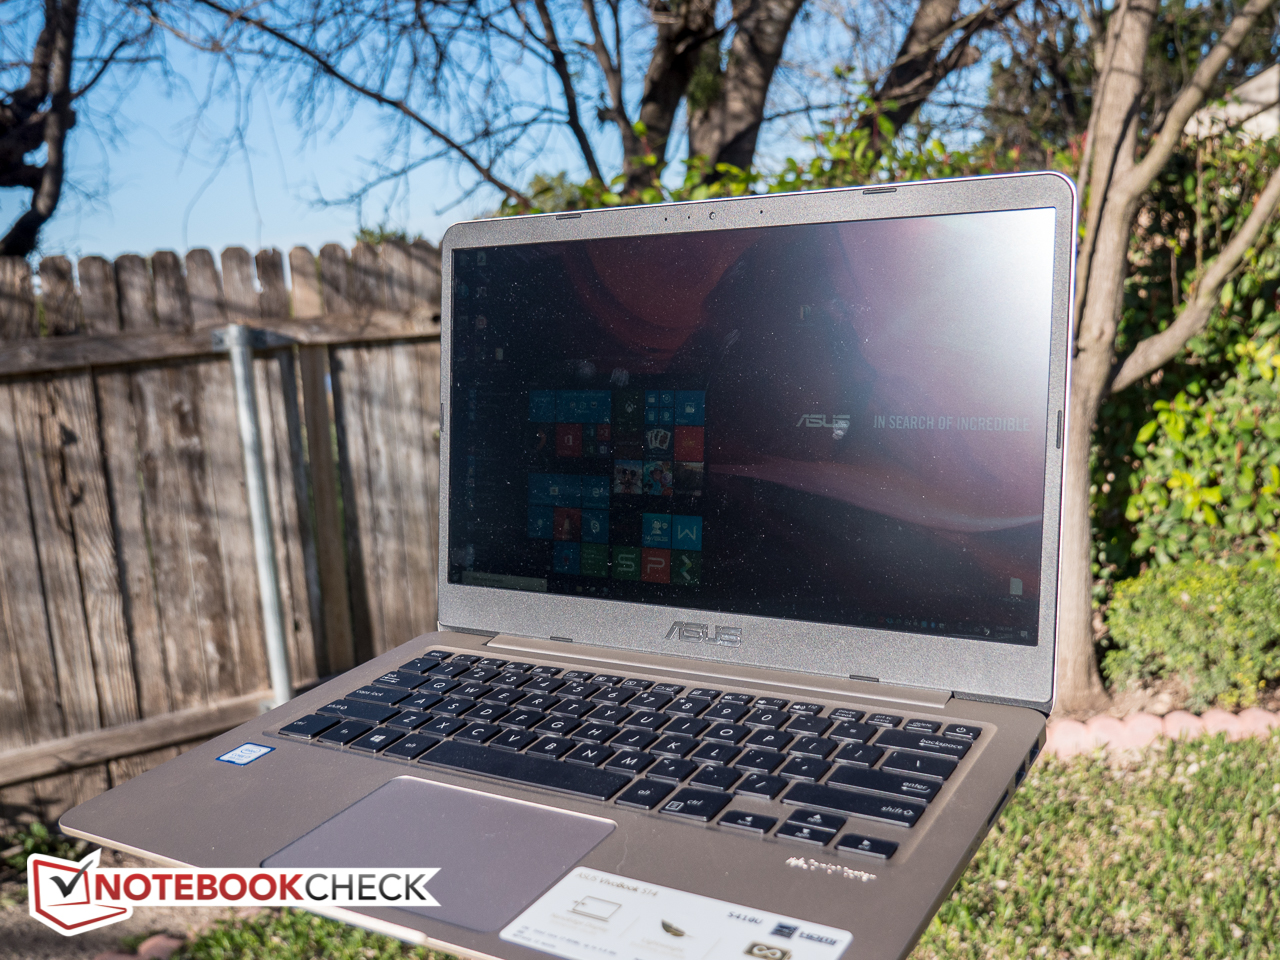
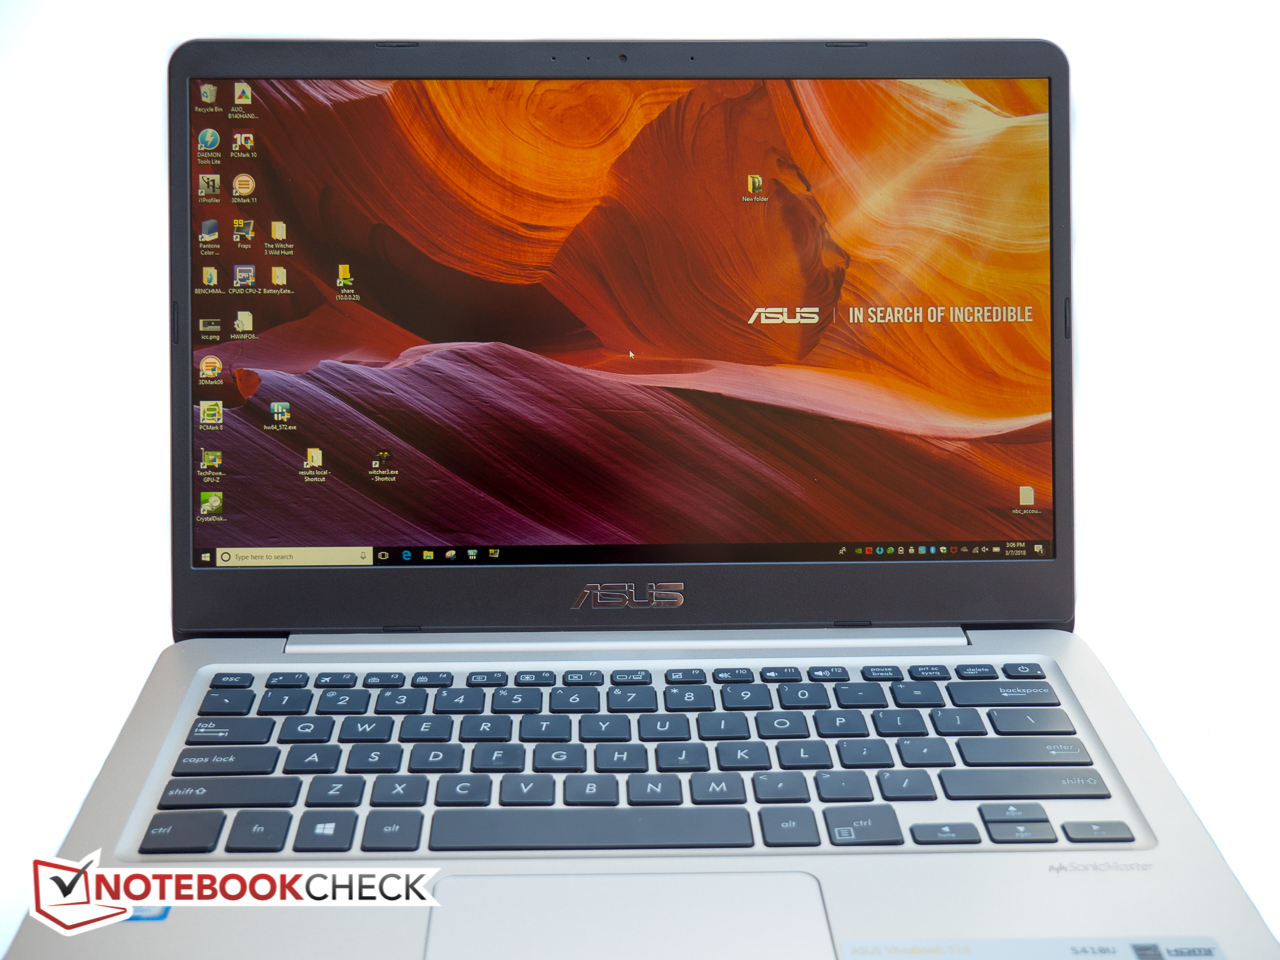
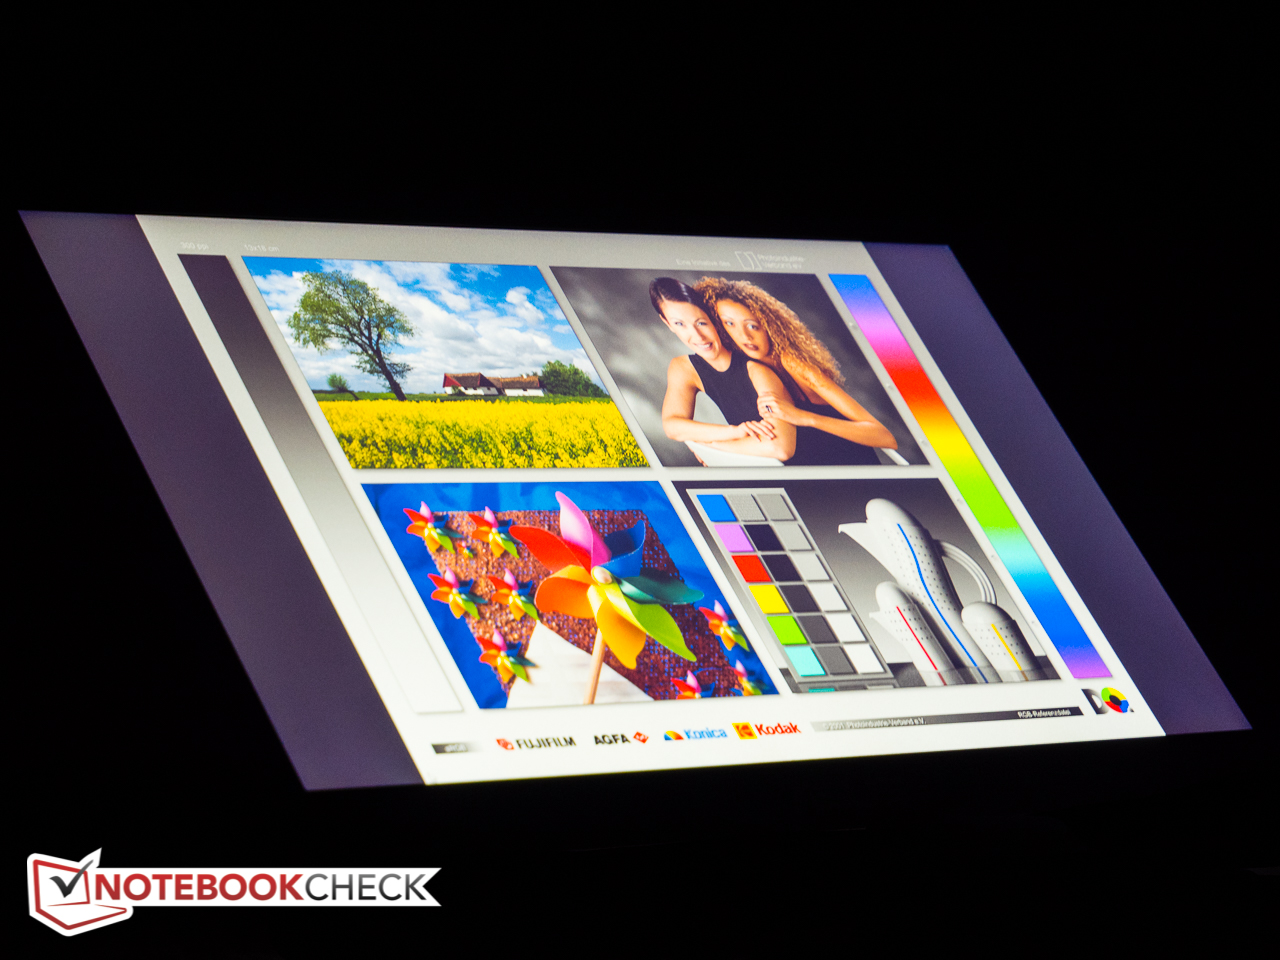
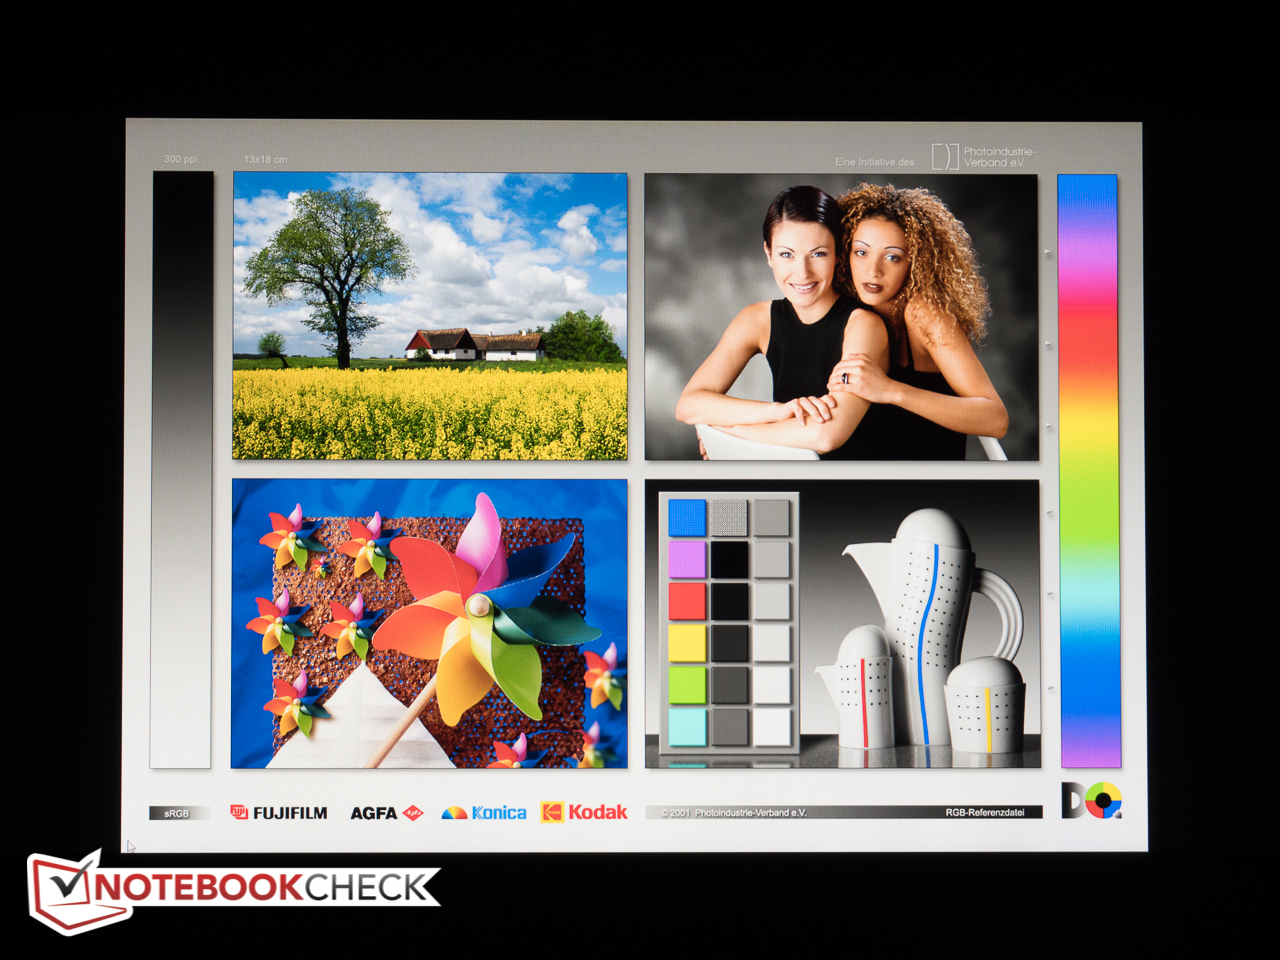
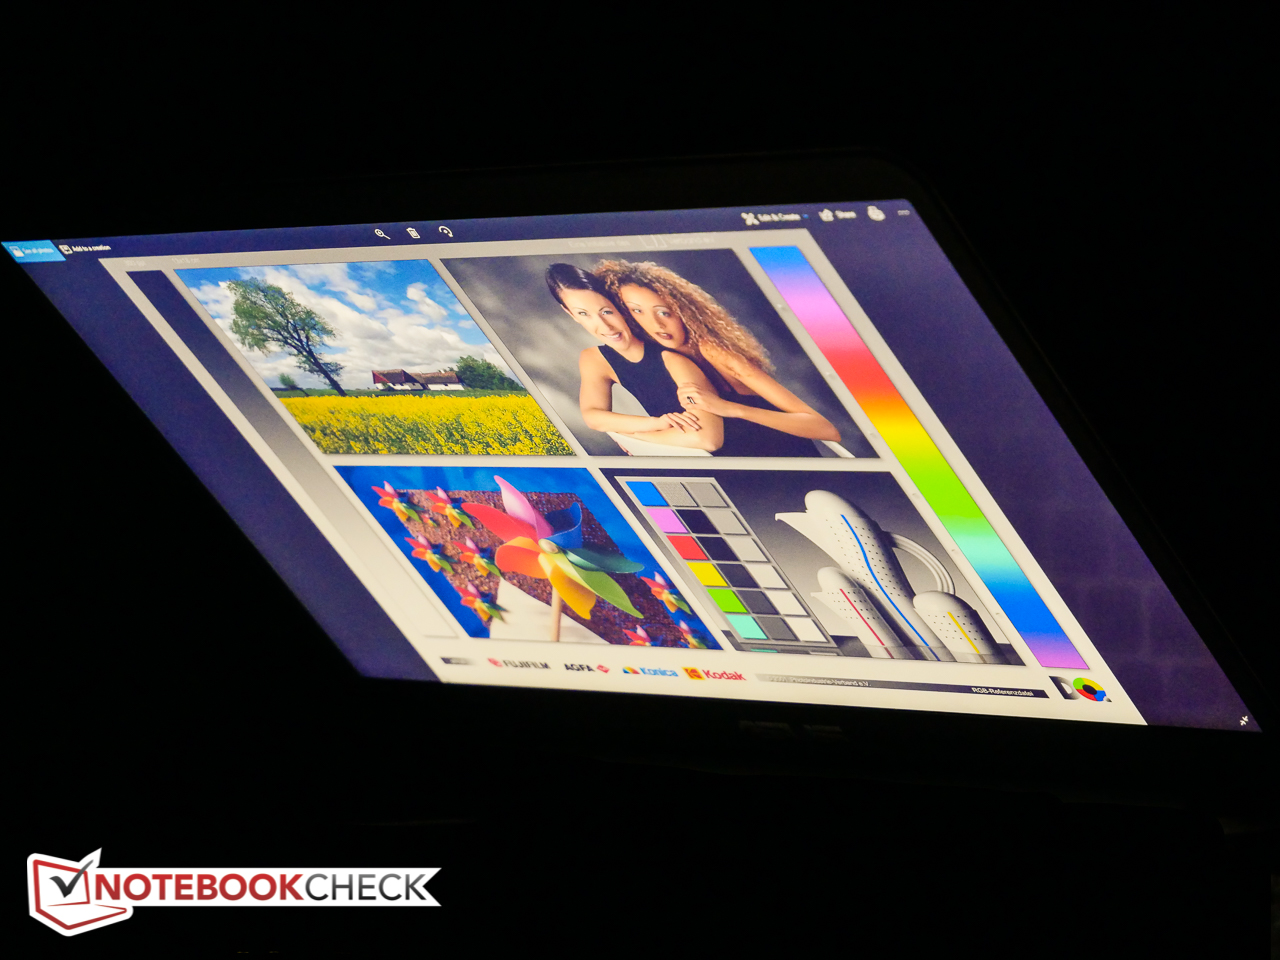
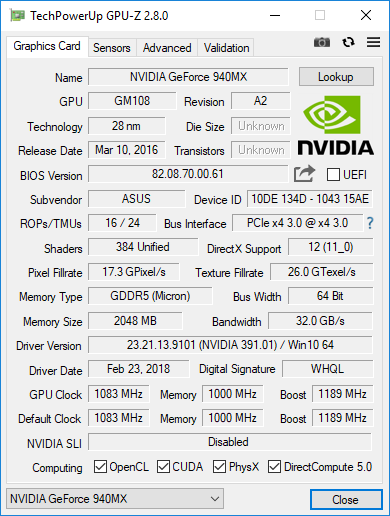
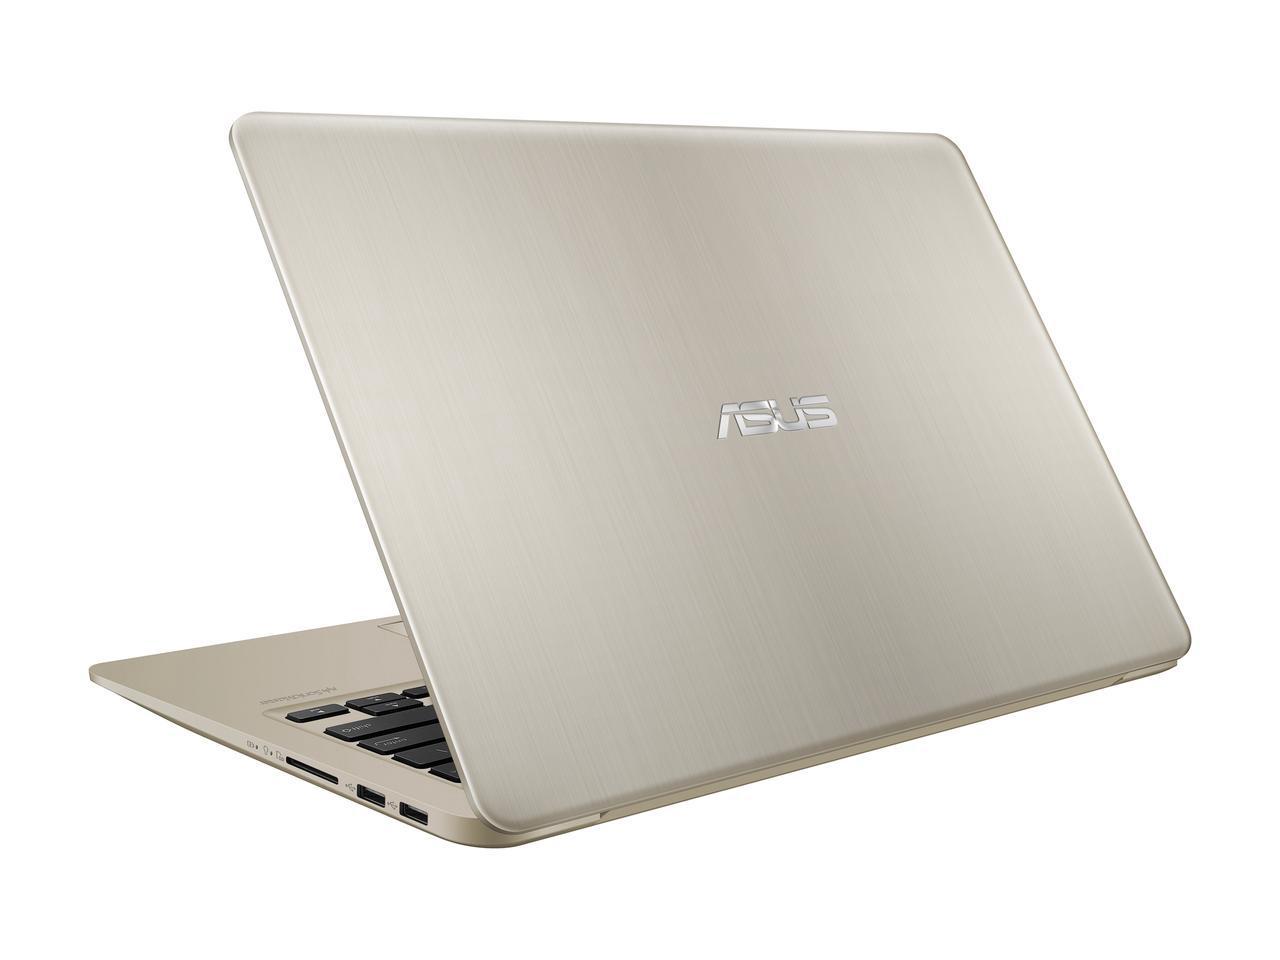
VivoBook S14 S410UQ-NH74 kommer med en Full HD-skärm på 14 tum och ett 13.3 tums chassi. Tyvärr är skärmen inte särskilt ljusstark och lider av oexakt färgåtergivning samt medelmåttig täckning av dom professionella färgrymderna. Med det sagt: IPS-skärmen är utan tvekan en värdig uppgradering över den HD TN-skärm som VivoBook S14 S406UA är utrustad med. Även om laptopen onekligen ser tjusig ut med sin smidiga metall och plastdesign så böjer sig tangentbordsplattan för mycket för att vara bekväm redan vid en måttlig mängd tryck. Som ett resultat är skrivupplevelsen inte i närheten av så praktisk som den hade kunnat vara. Systemprestandan är hyfsad, men vi stötte på kraftig strypning vid maximal belastning, då designen med ett enkelt värmerör / enkel fläkt inte riktigt håller jämna steg med värmeutvecklingen. Vi ifrågasätter också Asus val att kombinera en 8:e generationens i7-CPU med ett utdaterat instegs-grafikkort. Många konkurrerande modeller använder redan det mycket kraftfullare MX150 istället.
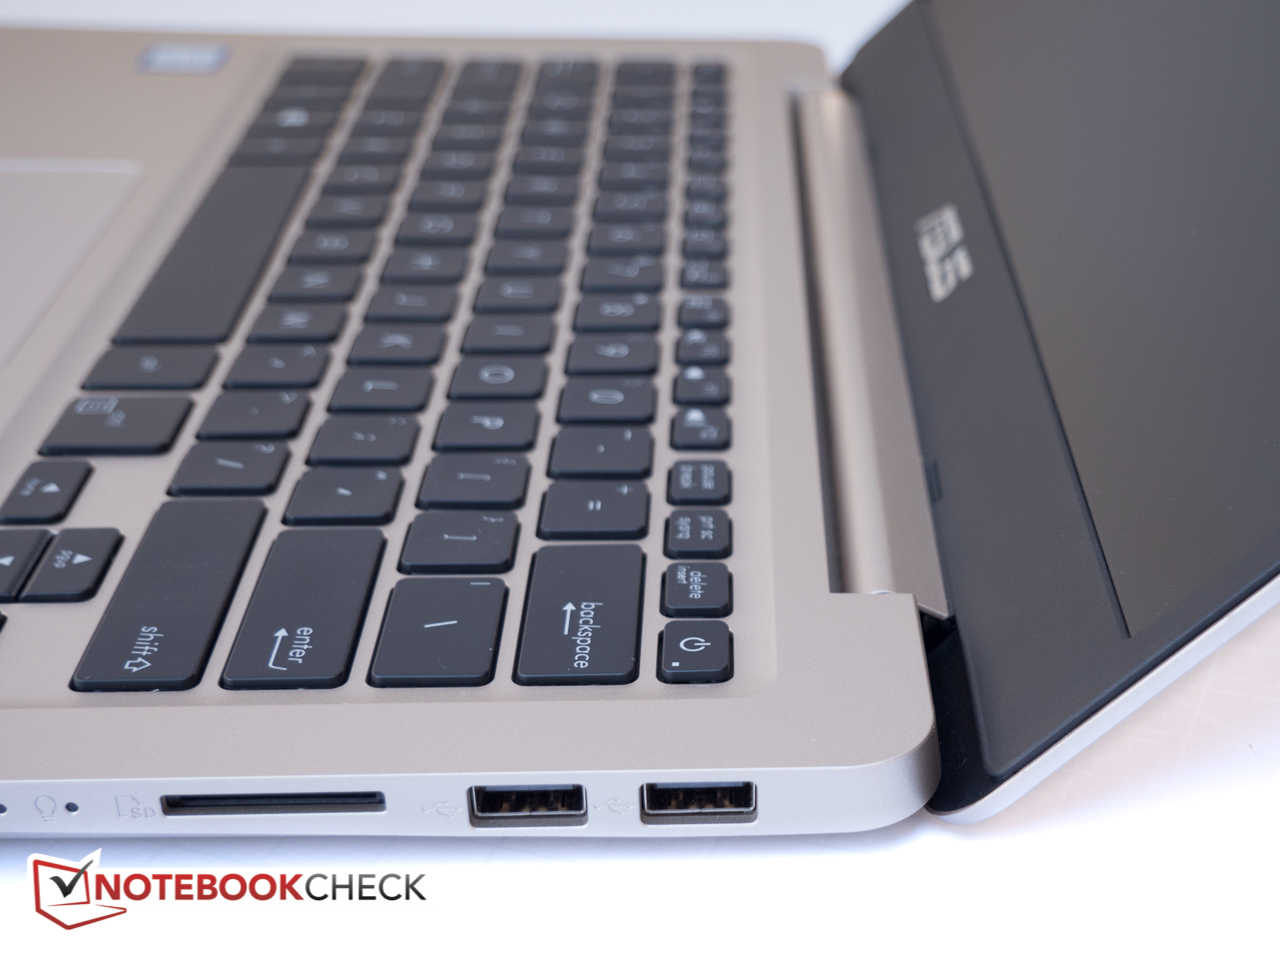
Trots det så håller sig denna laptop diskret vid lättare arbeten och batteriet kan hålla hela dagen med försiktig batterihantering. Vi uppskattade också den tunna och lätta samt tilltalande designen och det faktum att S14 kommer med en tom 2.5-tums hårddisk-plats och motsvarande SATA 3-anslutning. Den som behöver mer plats kan därför lätt och billigt utöka lagringen utan att behöva ta till externa enheter.
På grund av hur mycket tangentbordet böjer sig så kanske VivoBook S14 inte är den starkaste kandidaten i multimediasegmentet, men den är ändå ett hyfsat val för den som kan acceptera tidigare nämnda tillkortakommanden.
Asus VivoBook S410UQ-NH74
- 03/10/2018 v6 (old)
Bernie Pechlaner
Price comparison
