Test: HP Pavilion 15 (Core i5-8265U, GeForce MX250, 16 GB RAM) Laptop (Sammanfattning)
| SD Card Reader | |
| average JPG Copy Test (av. of 3 runs) | |
| Genomsnitt av klass Multimedia (23 - 531, n=36, senaste 2 åren) | |
| Acer Aspire 5 A515-52G-723L (Toshiba Exceria Pro SDXC 64 GB UHS-II) | |
| HP Pavilion 15-cw0003ng (Toshiba Exceria Pro SDXC 64 GB UHS-II) | |
| HP Pavilion 15-cs2019ng (Toshiba Exceria Pro SDXC 64 GB UHS-II) | |
| HP Pavilion 15-cs0003ng (Toshiba Exceria Pro SDXC 64 GB UHS-II) | |
| Asus VivoBook S15 S530UN-BQ097T (Toshiba Exceria Pro M501 64 GB UHS-II) | |
| MSI PS63 Modern 8RC (Toshiba Exceria Pro SDXC 64 GB UHS-II) | |
| maximum AS SSD Seq Read Test (1GB) | |
| Genomsnitt av klass Multimedia (37.3 - 1455, n=35, senaste 2 åren) | |
| Acer Aspire 5 A515-52G-723L (Toshiba Exceria Pro SDXC 64 GB UHS-II) | |
| HP Pavilion 15-cw0003ng (Toshiba Exceria Pro SDXC 64 GB UHS-II) | |
| HP Pavilion 15-cs0003ng (Toshiba Exceria Pro SDXC 64 GB UHS-II) | |
| HP Pavilion 15-cs2019ng (Toshiba Exceria Pro SDXC 64 GB UHS-II) | |
| Asus VivoBook S15 S530UN-BQ097T (Toshiba Exceria Pro M501 64 GB UHS-II) | |
| MSI PS63 Modern 8RC (Toshiba Exceria Pro SDXC 64 GB UHS-II) | |
| Networking | |
| iperf3 transmit AX12 | |
| Acer Aspire 5 A515-52G-723L | |
| MSI PS63 Modern 8RC | |
| Asus VivoBook S15 S530UN-BQ097T | |
| HP Pavilion 15-cs2019ng | |
| HP Pavilion 15-cs0003ng | |
| HP Pavilion 15-cw0003ng | |
| iperf3 receive AX12 | |
| HP Pavilion 15-cs2019ng | |
| MSI PS63 Modern 8RC | |
| Acer Aspire 5 A515-52G-723L | |
| Asus VivoBook S15 S530UN-BQ097T | |
| HP Pavilion 15-cw0003ng | |
| HP Pavilion 15-cs0003ng | |
| |||||||||||||||||||||||||
Distribution av ljusstyrkan: 86 %
Mitt på batteriet: 273 cd/m²
Kontrast: 1231:1 (Svärta: 0.26 cd/m²)
ΔE ColorChecker Calman: 4.5 | ∀{0.5-29.43 Ø4.71}
ΔE Greyscale Calman: 4.71 | ∀{0.09-98 Ø4.96}
88% sRGB (Argyll 1.6.3 3D)
58% AdobeRGB 1998 (Argyll 1.6.3 3D)
64.4% AdobeRGB 1998 (Argyll 3D)
88.1% sRGB (Argyll 3D)
67.2% Display P3 (Argyll 3D)
Gamma: 2.45
CCT: 7085 K
| HP Pavilion 15-cs2019ng BOE080D, , 1920x1080, 15.6" | Acer Aspire 5 A515-52G-723L BOE NV156FHM-N48, , 1920x1080, 15.6" | Asus VivoBook S15 S530UN-BQ097T LP156WFC-SPD1, , 1920x1080, 15.6" | MSI PS63 Modern 8RC Chi Mei CMN15E8 N156HCE/EN1, , 1920x1080, 15.6" | HP Pavilion 15-cw0003ng AU Optronics AUO23ED, , 1920x1080, 15.6" | HP Pavilion 15-cs0003ng 1920x1080, 15.6" | |
|---|---|---|---|---|---|---|
| Display | -37% | -38% | -2% | -41% | -42% | |
| Display P3 Coverage (%) | 67.2 | 40.02 -40% | 38.51 -43% | 63.5 -6% | 36.7 -45% | 36.27 -46% |
| sRGB Coverage (%) | 88.1 | 58.5 -34% | 57.9 -34% | 87.9 0% | 55 -38% | 54.6 -38% |
| AdobeRGB 1998 Coverage (%) | 64.4 | 41.34 -36% | 39.79 -38% | 63.9 -1% | 37.91 -41% | 37.47 -42% |
| Response Times | -10% | 9% | -4% | 9% | -1% | |
| Response Time Grey 50% / Grey 80% * (ms) | 43 ? | 45 ? -5% | 38.8 ? 10% | 42 ? 2% | 40 ? 7% | 45 ? -5% |
| Response Time Black / White * (ms) | 29 ? | 33 ? -14% | 26.8 ? 8% | 32 ? -10% | 26 ? 10% | 28 ? 3% |
| PWM Frequency (Hz) | 208 ? | 250 ? | 25000 ? | |||
| Screen | -6% | -12% | 9% | -16% | -37% | |
| Brightness middle (cd/m²) | 320 | 278 -13% | 262 -18% | 289 -10% | 186 -42% | 240 -25% |
| Brightness (cd/m²) | 293 | 271 -8% | 256 -13% | 262 -11% | 180 -39% | 237 -19% |
| Brightness Distribution (%) | 86 | 89 3% | 90 5% | 75 -13% | 88 2% | 90 5% |
| Black Level * (cd/m²) | 0.26 | 0.26 -0% | 0.21 19% | 0.26 -0% | 0.15 42% | 0.42 -62% |
| Contrast (:1) | 1231 | 1069 -13% | 1248 1% | 1112 -10% | 1240 1% | 571 -54% |
| Colorchecker dE 2000 * | 4.5 | 4.73 -5% | 5.8 -29% | 2.9 36% | 5.94 -32% | 7.43 -65% |
| Colorchecker dE 2000 max. * | 8.81 | 8.38 5% | 14.3 -62% | 5.71 35% | 10.81 -23% | 12.42 -41% |
| Greyscale dE 2000 * | 4.71 | 2.59 45% | 2.5 47% | 1.42 70% | 4.44 6% | 6.26 -33% |
| Gamma | 2.45 90% | 2.38 92% | 1.99 111% | 2.39 92% | 2.81 78% | 2.96 74% |
| CCT | 7085 92% | 6160 106% | 6528 100% | 6705 97% | 6272 104% | 6661 98% |
| Color Space (Percent of AdobeRGB 1998) (%) | 58 | 36 -38% | 36.6 -37% | 57 -2% | 35 -40% | 35 -40% |
| Color Space (Percent of sRGB) (%) | 88 | 58 -34% | 57.6 -35% | 87 -1% | 55 -37% | 54 -39% |
| Colorchecker dE 2000 calibrated * | 5.17 | 4.6 | 2.88 | 6.07 | ||
| Totalt genomsnitt (program/inställningar) | -18% /
-12% | -14% /
-15% | 1% /
5% | -16% /
-18% | -27% /
-33% |
* ... mindre är bättre
Visa svarstider
| ↔ Svarstid svart till vitt | ||
|---|---|---|
| 29 ms ... stiga ↗ och falla ↘ kombinerat | ↗ 16 ms stiga | 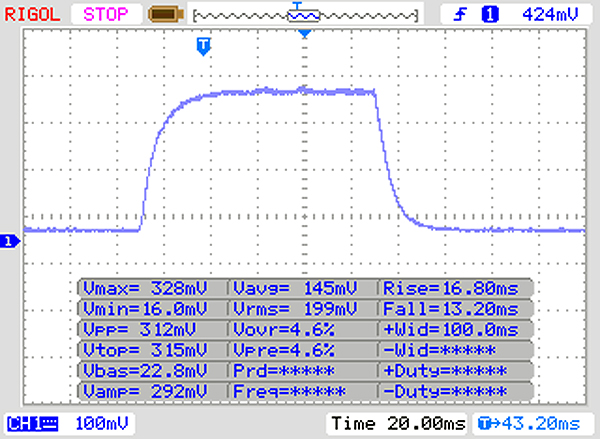 |
| ↘ 13 ms hösten | ||
| Skärmen visar relativt långsamma svarsfrekvenser i våra tester och kan vara för långsam för spelare. I jämförelse sträcker sig alla testade enheter från 0.1 (minst) till 240 (maximalt) ms. » 77 % av alla enheter är bättre. Detta innebär att den uppmätta svarstiden är sämre än genomsnittet av alla testade enheter (19.8 ms). | ||
| ↔ Svarstid 50 % grått till 80 % grått | ||
| 43 ms ... stiga ↗ och falla ↘ kombinerat | ↗ 22 ms stiga | 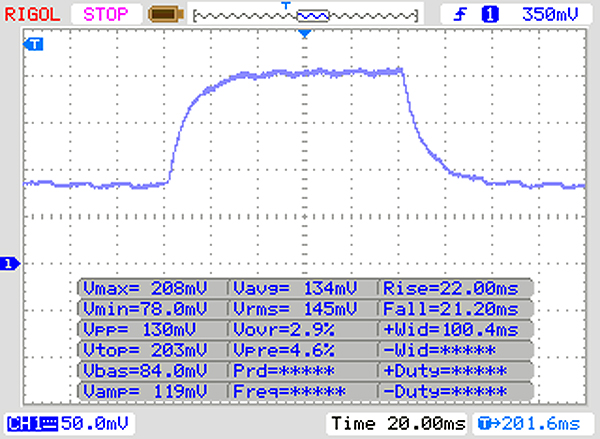 |
| ↘ 21 ms hösten | ||
| Skärmen visar långsamma svarsfrekvenser i våra tester och kommer att vara otillfredsställande för spelare. I jämförelse sträcker sig alla testade enheter från 0.165 (minst) till 636 (maximalt) ms. » 71 % av alla enheter är bättre. Detta innebär att den uppmätta svarstiden är sämre än genomsnittet av alla testade enheter (30.9 ms). | ||
Skärmflimmer / PWM (Puls-Width Modulation)
| Skärmflimmer / PWM upptäckt | 208 Hz | ≤ 90 % ljusstyrka inställning | 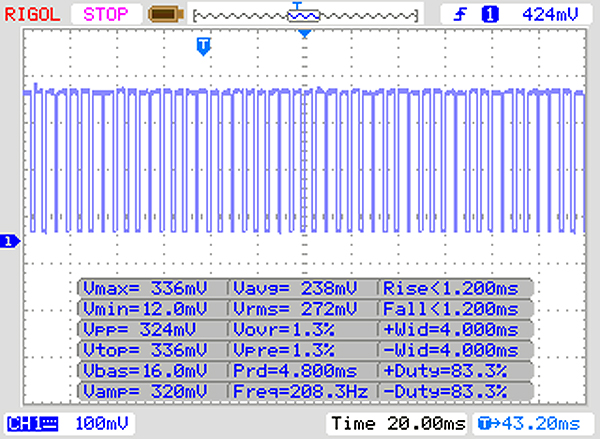 |
Displayens bakgrundsbelysning flimrar vid 208 Hz (i värsta fall, t.ex. med PWM) Flimrande upptäckt vid en ljusstyrkeinställning på 90 % och lägre. Det ska inte finnas något flimmer eller PWM över denna ljusstyrkeinställning. Frekvensen för 208 Hz är relativt låg, så känsliga användare kommer sannolikt att märka flimmer och uppleva ansträngda ögon vid den angivna ljusstyrkeinställningen och nedan. Som jämförelse: 52 % av alla testade enheter använder inte PWM för att dämpa skärmen. Om PWM upptäcktes mättes ett medelvärde av 7741 (minst: 5 - maximum: 343500) Hz. | |||
| Cinebench R15 | |
| CPU Single 64Bit | |
| Genomsnitt av klass Multimedia (184.8 - 326, n=58, senaste 2 åren) | |
| MSI PS63 Modern 8RC | |
| Asus VivoBook S15 S530UN-BQ097T | |
| Acer Aspire 5 A515-52G-723L | |
| HP Pavilion 15-cs2019ng | |
| Genomsnitt Intel Core i5-8265U (111 - 164, n=35) | |
| HP Pavilion 15-cs0003ng | |
| HP Pavilion 15-cw0003ng | |
| CPU Multi 64Bit | |
| Genomsnitt av klass Multimedia (856 - 5224, n=60, senaste 2 åren) | |
| Asus VivoBook S15 S530UN-BQ097T | |
| HP Pavilion 15-cw0003ng | |
| Genomsnitt Intel Core i5-8265U (457 - 750, n=38) | |
| MSI PS63 Modern 8RC | |
| HP Pavilion 15-cs2019ng | |
| HP Pavilion 15-cs0003ng | |
| Acer Aspire 5 A515-52G-723L | |
| PCMark 8 | |
| Home Score Accelerated v2 | |
| Genomsnitt av klass Multimedia (n=1senaste 2 åren) | |
| Acer Aspire 5 A515-52G-723L | |
| Genomsnitt Intel Core i5-8265U, NVIDIA GeForce MX250 (3603 - 4220, n=2) | |
| MSI PS63 Modern 8RC | |
| HP Pavilion 15-cs0003ng | |
| Asus VivoBook S15 S530UN-BQ097T | |
| HP Pavilion 15-cs2019ng | |
| HP Pavilion 15-cw0003ng | |
| Work Score Accelerated v2 | |
| Acer Aspire 5 A515-52G-723L | |
| HP Pavilion 15-cs2019ng | |
| Genomsnitt Intel Core i5-8265U, NVIDIA GeForce MX250 (4965 - 5223, n=2) | |
| Asus VivoBook S15 S530UN-BQ097T | |
| MSI PS63 Modern 8RC | |
| HP Pavilion 15-cs0003ng | |
| HP Pavilion 15-cw0003ng | |
| PCMark 8 Home Score Accelerated v2 | 3603 poäng | |
| PCMark 8 Work Score Accelerated v2 | 5223 poäng | |
| PCMark 10 Score | 4190 poäng | |
Hjälp | ||
| HP Pavilion 15-cs2019ng Toshiba KBG30ZMV256G | Acer Aspire 5 A515-52G-723L WDC PC SN520 SDAPNUW-512G | Asus VivoBook S15 S530UN-BQ097T SanDisk SD9SN8W256G1027 | MSI PS63 Modern 8RC WDC PC SN520 SDAPNUW-512G | HP Pavilion 15-cw0003ng Intel SSD 600p SSDPEKKW512G7 | HP Pavilion 15-cs0003ng SK Hynix SC313 HFS256G39TNF | Genomsnitt Toshiba KBG30ZMV256G | |
|---|---|---|---|---|---|---|---|
| CrystalDiskMark 5.2 / 6 | 20% | -48% | 12% | -19% | -46% | -8% | |
| Write 4K (MB/s) | 149.3 | 130.1 -13% | 51.5 -66% | 121.3 -19% | 105.8 -29% | 66.9 -55% | 114.9 ? -23% |
| Read 4K (MB/s) | 52.7 | 27.64 -48% | 28.53 -46% | 44.07 -16% | 29.22 -45% | 30.33 -42% | 48 ? -9% |
| Write Seq (MB/s) | 667 | 1438 116% | 444.2 -33% | 1176 76% | 581 -13% | 447.6 -33% | 727 ? 9% |
| Read Seq (MB/s) | 818 | 1319 61% | 477.7 -42% | 1139 39% | 1065 30% | 534 -35% | 885 ? 8% |
| Write 4K Q32T1 (MB/s) | 332.1 | 323.3 -3% | 208.7 -37% | 257.8 -22% | 201 -39% | 197.5 -41% | 253 ? -24% |
| Read 4K Q32T1 (MB/s) | 467.1 | 359.9 -23% | 224.3 -52% | 325.9 -30% | 278.6 -40% | 234.5 -50% | 400 ? -14% |
| Write Seq Q32T1 (MB/s) | 985 | 1454 48% | 515 -48% | 1455 48% | 584 -41% | 495.6 -50% | 849 ? -14% |
| Read Seq Q32T1 (MB/s) | 1454 | 1740 20% | 559 -62% | 1741 20% | 1824 25% | 559 -62% | 1493 ? 3% |
| Write 4K Q8T8 (MB/s) | 207.5 | 536 ? | |||||
| Read 4K Q8T8 (MB/s) | 223.6 | 560 ? | |||||
| AS SSD | 69% | -57% | 69% | -6% | -24% | -13% | |
| Seq Read (MB/s) | 1153 | 1557 35% | 504 -56% | 1372 19% | 1480 28% | 522 -55% | 1283 ? 11% |
| Seq Write (MB/s) | 736 | 1237 68% | 202.7 -72% | 1244 69% | 540 -27% | 476.1 -35% | 676 ? -8% |
| 4K Read (MB/s) | 46.51 | 42.56 -8% | 27.67 -41% | 43.34 -7% | 20.36 -56% | 30.14 -35% | 42.7 ? -8% |
| 4K Write (MB/s) | 114.1 | 127.2 11% | 51.1 -55% | 162.2 42% | 54 -53% | 64.3 -44% | 87.7 ? -23% |
| 4K-64 Read (MB/s) | 618 | 1034 67% | 373.6 -40% | 1044 69% | 491.4 -20% | 319.2 -48% | 575 ? -7% |
| 4K-64 Write (MB/s) | 461.4 | 1186 157% | 173 -63% | 1111 141% | 390.3 -15% | 239.8 -48% | 270 ? -41% |
| Access Time Read * (ms) | 0.421 | 0.077 82% | 0.365 13% | 0.058 86% | 0.138 67% | 0.131 69% | 0.2746 ? 35% |
| Access Time Write * (ms) | 0.233 | 0.028 88% | 0.603 -159% | 0.024 90% | 0.078 67% | 0.056 76% | 0.3361 ? -44% |
| Score Read (Points) | 780 | 1233 58% | 452 -42% | 1224 57% | 660 -15% | 402 -48% | 746 ? -4% |
| Score Write (Points) | 649 | 1437 121% | 244 -62% | 1398 115% | 498 -23% | 352 -46% | 426 ? -34% |
| Score Total (Points) | 1822 | 3291 81% | 921 -49% | 3249 78% | 1451 -20% | 967 -47% | 1536 ? -16% |
| Copy ISO MB/s (MB/s) | 1313 | 810 | 491.3 | 761 ? | |||
| Copy Program MB/s (MB/s) | 334.6 | 332.5 | 203.9 | 243 ? | |||
| Copy Game MB/s (MB/s) | 684 | 557 | 359.3 | 457 ? | |||
| Totalt genomsnitt (program/inställningar) | 45% /
48% | -53% /
-53% | 41% /
45% | -13% /
-12% | -35% /
-33% | -11% /
-11% |
* ... mindre är bättre

| 3DMark 11 - 1280x720 Performance GPU | |
| Genomsnitt av klass Multimedia (3749 - 60002, n=54, senaste 2 åren) | |
| MSI PS63 Modern 8RC | |
| HP Pavilion 15-cs2019ng | |
| Acer Aspire 5 A515-52G-723L | |
| Asus VivoBook S15 S530UN-BQ097T | |
| Genomsnitt NVIDIA GeForce MX250 (3585 - 4942, n=29) | |
| HP Pavilion 15-cs0003ng | |
| HP Pavilion 15-cw0003ng | |
| 3DMark | |
| 1280x720 Cloud Gate Standard Graphics | |
| Genomsnitt av klass Multimedia (16765 - 143501, n=32, senaste 2 åren) | |
| MSI PS63 Modern 8RC | |
| HP Pavilion 15-cs2019ng | |
| Acer Aspire 5 A515-52G-723L | |
| Genomsnitt NVIDIA GeForce MX250 (13805 - 23863, n=25) | |
| Asus VivoBook S15 S530UN-BQ097T | |
| HP Pavilion 15-cs0003ng | |
| HP Pavilion 15-cw0003ng | |
| 1920x1080 Fire Strike Graphics | |
| Genomsnitt av klass Multimedia (2328 - 48907, n=57, senaste 2 åren) | |
| MSI PS63 Modern 8RC | |
| HP Pavilion 15-cs2019ng | |
| Acer Aspire 5 A515-52G-723L | |
| Genomsnitt NVIDIA GeForce MX250 (2939 - 3885, n=29) | |
| Asus VivoBook S15 S530UN-BQ097T | |
| HP Pavilion 15-cs0003ng | |
| HP Pavilion 15-cw0003ng | |
| 2560x1440 Time Spy Graphics | |
| Genomsnitt av klass Multimedia (696 - 19403, n=57, senaste 2 åren) | |
| Acer Aspire 5 A515-52G-723L | |
| Genomsnitt NVIDIA GeForce MX250 (881 - 1169, n=22) | |
| Asus VivoBook S15 S530UN-BQ097T | |
| 3DMark 11 Performance | 4994 poäng | |
| 3DMark Cloud Gate Standard Score | 13164 poäng | |
| 3DMark Fire Strike Score | 3318 poäng | |
Hjälp | ||
| The Witcher 3 | |
| 1024x768 Low Graphics & Postprocessing | |
| Genomsnitt av klass Multimedia (68 - 147, n=3, senaste 2 åren) | |
| HP Pavilion 15-cs2019ng | |
| Acer Aspire 5 A515-52G-723L | |
| Genomsnitt NVIDIA GeForce MX250 (47.4 - 70, n=24) | |
| Asus VivoBook S15 S530UN-BQ097T | |
| 1366x768 Medium Graphics & Postprocessing | |
| Genomsnitt av klass Multimedia (41 - 73, n=2, senaste 2 åren) | |
| Acer Aspire 5 A515-52G-723L | |
| HP Pavilion 15-cs2019ng | |
| Asus VivoBook S15 S530UN-BQ097T | |
| Genomsnitt NVIDIA GeForce MX250 (30 - 40, n=27) | |
| 1920x1080 High Graphics & Postprocessing (Nvidia HairWorks Off) | |
| Genomsnitt av klass Multimedia (22 - 157, n=5, senaste 2 åren) | |
| HP Pavilion 15-cs2019ng | |
| Acer Aspire 5 A515-52G-723L | |
| Genomsnitt NVIDIA GeForce MX250 (16.3 - 23.1, n=27) | |
| Asus VivoBook S15 S530UN-BQ097T | |
| 1920x1080 Ultra Graphics & Postprocessing (HBAO+) | |
| Genomsnitt av klass Multimedia (11 - 107, n=5, senaste 2 åren) | |
| HP Pavilion 15-cs2019ng | |
| Genomsnitt NVIDIA GeForce MX250 (9 - 16, n=24) | |
| Acer Aspire 5 A515-52G-723L | |
| Asus VivoBook S15 S530UN-BQ097T | |
| BioShock Infinite | |
| 1280x720 Very Low Preset | |
| HP Pavilion 15-cs2019ng | |
| Genomsnitt NVIDIA GeForce MX250 (133.9 - 212, n=14) | |
| Acer Aspire 5 A515-52G-723L | |
| Asus VivoBook S15 S530UN-BQ097T | |
| HP Pavilion 15-cs0003ng | |
| 1366x768 Medium Preset | |
| HP Pavilion 15-cs2019ng | |
| Genomsnitt NVIDIA GeForce MX250 (98.4 - 117.5, n=14) | |
| Acer Aspire 5 A515-52G-723L | |
| Asus VivoBook S15 S530UN-BQ097T | |
| HP Pavilion 15-cs0003ng | |
| 1366x768 High Preset | |
| MSI PS63 Modern 8RC | |
| Acer Aspire 5 A515-52G-723L | |
| Genomsnitt NVIDIA GeForce MX250 (84 - 100.5, n=14) | |
| HP Pavilion 15-cs2019ng | |
| Asus VivoBook S15 S530UN-BQ097T | |
| HP Pavilion 15-cs0003ng | |
| 1920x1080 Ultra Preset, DX11 (DDOF) | |
| MSI PS63 Modern 8RC | |
| Genomsnitt NVIDIA GeForce MX250 (32.3 - 38.1, n=14) | |
| HP Pavilion 15-cs2019ng | |
| Acer Aspire 5 A515-52G-723L | |
| Asus VivoBook S15 S530UN-BQ097T | |
| HP Pavilion 15-cs0003ng | |
| låg | med. | hög | ultra | |
|---|---|---|---|---|
| BioShock Infinite (2013) | 197 | 110 | 93 | 35 |
| Dota 2 (2013) | 101 | 88 | 64 | |
| Thief (2014) | 66.8 | 47.5 | 44.3 | 21 |
| The Witcher 3 (2015) | 65 | 37 | 21 | 16 |
| Rise of the Tomb Raider (2016) | 71 | 39 | 24 | 20 |
Ljudnivå
| Låg belastning |
| 31.5 / 31.5 / 31.5 dB(A) |
| Hög belastning |
| 42.5 / 42.5 dB(A) |
 | ||
30 dB tyst 40 dB(A) hörbar 50 dB(A) högt ljud |
||
min: | ||
(-) Den maximala temperaturen på ovansidan är 46 °C / 115 F, jämfört med genomsnittet av 36.8 °C / 98 F , allt från 21 till 71 °C för klassen Multimedia.
(±) Botten värms upp till maximalt 44.6 °C / 112 F, jämfört med genomsnittet av 39.1 °C / 102 F
(+) Vid tomgångsbruk är medeltemperaturen för ovansidan 26 °C / 79 F, jämfört med enhetsgenomsnittet på 31.3 °C / ### class_avg_f### F.
(+) Handledsstöden och pekplattan är kallare än hudtemperaturen med maximalt 30.8 °C / 87.4 F och är därför svala att ta på.
(-) Medeltemperaturen för handledsstödsområdet på liknande enheter var 28.7 °C / 83.7 F (-2.1 °C / -3.7 F).
HP Pavilion 15-cs2019ng ljudanalys
(-) | inte särskilt höga högtalare (71.6 dB)
Bas 100 - 315 Hz
(-) | nästan ingen bas - i genomsnitt 27.4% lägre än medianen
(±) | linjäriteten för basen är genomsnittlig (10.6% delta till föregående frekvens)
Mellan 400 - 2000 Hz
(+) | balanserad mellan - endast 2.5% från medianen
(±) | linjäriteten för mids är genomsnittlig (8.3% delta till föregående frekvens)
Högsta 2 - 16 kHz
(+) | balanserade toppar - endast 3.2% från medianen
(+) | toppar är linjära (4.8% delta till föregående frekvens)
Totalt 100 - 16 000 Hz
(±) | linjäriteten för det totala ljudet är genomsnittlig (20.8% skillnad mot median)
Jämfört med samma klass
» 71% av alla testade enheter i den här klassen var bättre, 7% liknande, 22% sämre
» Den bästa hade ett delta på 5%, genomsnittet var 17%, sämst var 45%
Jämfört med alla testade enheter
» 56% av alla testade enheter var bättre, 8% liknande, 36% sämre
» Den bästa hade ett delta på 4%, genomsnittet var 23%, sämst var 134%
Apple MacBook 12 (Early 2016) 1.1 GHz ljudanalys
(+) | högtalare kan spela relativt högt (83.6 dB)
Bas 100 - 315 Hz
(±) | reducerad bas - i genomsnitt 11.3% lägre än medianen
(±) | linjäriteten för basen är genomsnittlig (14.2% delta till föregående frekvens)
Mellan 400 - 2000 Hz
(+) | balanserad mellan - endast 2.4% från medianen
(+) | mids är linjära (5.5% delta till föregående frekvens)
Högsta 2 - 16 kHz
(+) | balanserade toppar - endast 2% från medianen
(+) | toppar är linjära (4.5% delta till föregående frekvens)
Totalt 100 - 16 000 Hz
(+) | det totala ljudet är linjärt (10.2% skillnad mot median)
Jämfört med samma klass
» 7% av alla testade enheter i den här klassen var bättre, 2% liknande, 90% sämre
» Den bästa hade ett delta på 5%, genomsnittet var 18%, sämst var 53%
Jämfört med alla testade enheter
» 5% av alla testade enheter var bättre, 1% liknande, 94% sämre
» Den bästa hade ett delta på 4%, genomsnittet var 23%, sämst var 134%
| Av/Standby | |
| Låg belastning | |
| Hög belastning |
|
Förklaring:
min: | |
| HP Pavilion 15-cs2019ng i5-8265U, GeForce MX250, Toshiba KBG30ZMV256G, IPS, 1920x1080, 15.6" | Acer Aspire 5 A515-52G-723L i7-8565U, GeForce MX250, WDC PC SN520 SDAPNUW-512G, IPS, 1920x1080, 15.6" | Asus VivoBook S15 S530UN-BQ097T i5-8550U, GeForce MX150, SanDisk SD9SN8W256G1027, IPS LED, 1920x1080, 15.6" | MSI PS63 Modern 8RC i7-8565U, GeForce GTX 1050 Max-Q, WDC PC SN520 SDAPNUW-512G, IPS, 1920x1080, 15.6" | HP Pavilion 15-cw0003ng R5 2500U, Vega 8, Intel SSD 600p SSDPEKKW512G7, IPS, 1920x1080, 15.6" | HP Pavilion 15-cs0003ng i5-8250U, GeForce MX130, SK Hynix SC313 HFS256G39TNF, IPS, 1920x1080, 15.6" | Genomsnitt NVIDIA GeForce MX250 | Genomsnitt av klass Multimedia | |
|---|---|---|---|---|---|---|---|---|
| Power Consumption | -7% | 3% | -50% | 11% | 1% | -13% | -54% | |
| Idle Minimum * (Watt) | 4.9 | 4.4 10% | 3.1 37% | 6.8 -39% | 4.5 8% | 3.3 33% | 4.1 ? 16% | 5.62 ? -15% |
| Idle Average * (Watt) | 7.9 | 6.9 13% | 6.3 20% | 9.8 -24% | 7.3 8% | 6.1 23% | 7.91 ? -0% | 10.2 ? -29% |
| Idle Maximum * (Watt) | 10.1 | 9.9 2% | 8.6 15% | 11.4 -13% | 9.4 7% | 8.3 18% | 10.4 ? -3% | 12.5 ? -24% |
| Load Average * (Watt) | 60 | 55 8% | 56.4 6% | 76 -27% | 34 43% | 56 7% | 58.6 ? 2% | 65 ? -8% |
| Load Maximum * (Watt) | 38 | 63.4 -67% | 62.7 -65% | 93 -145% | 41.9 -10% | 67 -76% | 68.9 ? -81% | 111.9 ? -194% |
| Witcher 3 ultra * (Watt) | 45 |
* ... mindre är bättre
| HP Pavilion 15-cs2019ng i5-8265U, GeForce MX250, 41 Wh | Acer Aspire 5 A515-52G-723L i7-8565U, GeForce MX250, 48 Wh | Asus VivoBook S15 S530UN-BQ097T i5-8550U, GeForce MX150, 42 Wh | MSI PS63 Modern 8RC i7-8565U, GeForce GTX 1050 Max-Q, 82 Wh | HP Pavilion 15-cw0003ng R5 2500U, Vega 8, 41 Wh | HP Pavilion 15-cs0003ng i5-8250U, GeForce MX130, 41 Wh | Genomsnitt av klass Multimedia | |
|---|---|---|---|---|---|---|---|
| Batteridrifttid | 51% | 30% | 106% | 22% | 17% | 128% | |
| Reader / Idle (h) | 8 | 12.9 61% | 14 75% | 8.4 5% | 8.2 2% | 24.9 ? 211% | |
| WiFi v1.3 (h) | 5 | 6.9 38% | 6.5 30% | 11.4 128% | 5 0% | 4.7 -6% | 12.3 ? 146% |
| Load (h) | 1.3 | 2 54% | 2.8 115% | 2.1 62% | 2 54% | 1.645 ? 27% |
För
Emot

Läs den fullständiga versionen av den här recensionen på engelska här.
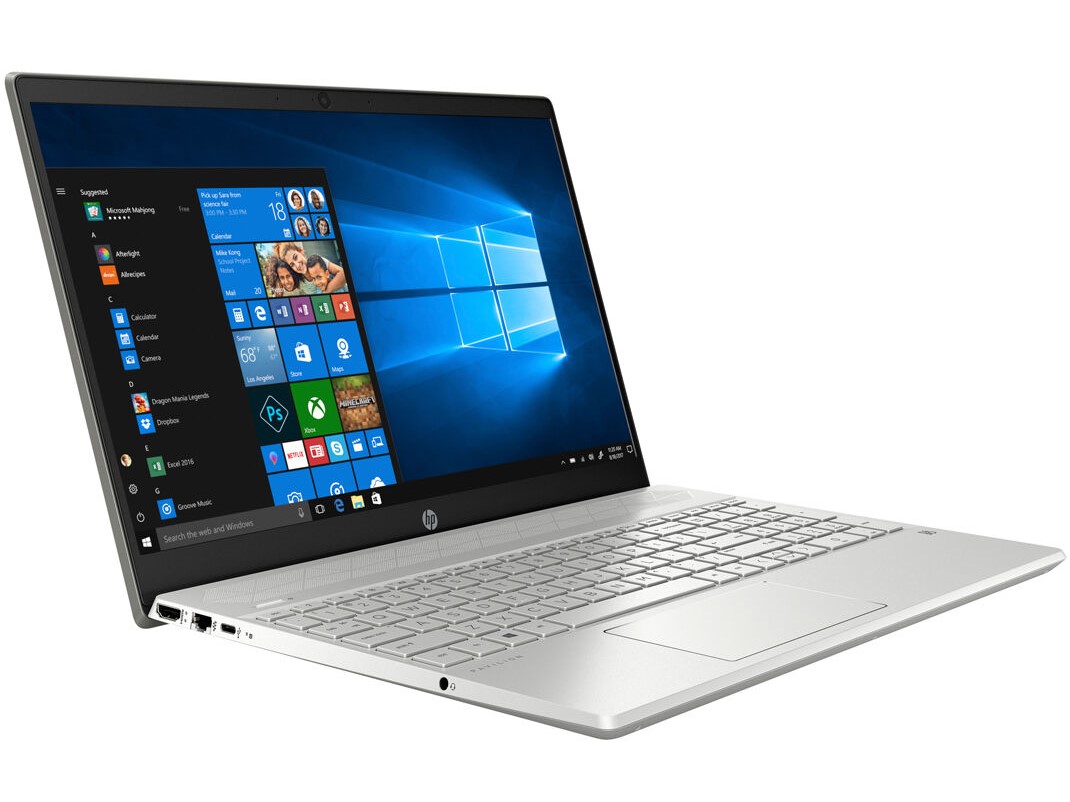
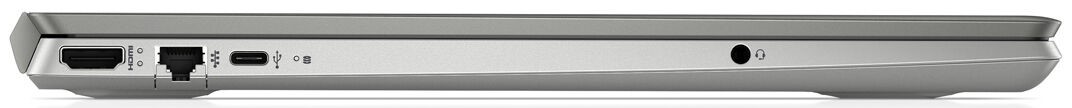
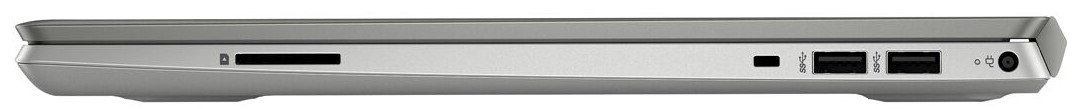
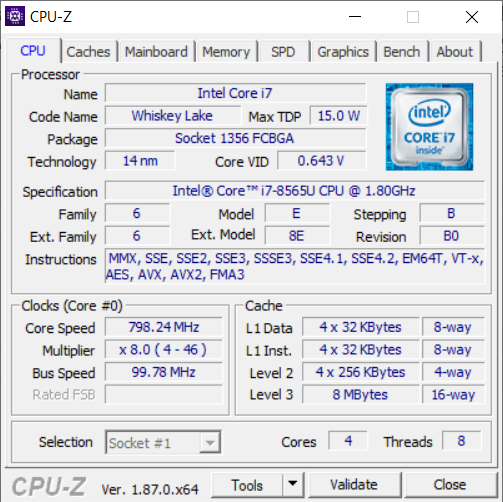
HP Pavilion 15-cs2019ng är en måttfull uppgradering jämfört med syskonmodellerna och bekräftar våra tidigare intryck om serien. Pavilion 15 är en välbyggd enhet som ser dyr ut och har ett rejält utbud av portar. cs2019ng har dessutom mer än tillräckligt med kraft för alla vardagsuppgifter och kan till och med hantera en del lättare spel. Uppgraderingen till en Whiskey Lake CPU och en GeForce MX250 GPU ger dessutom en blygsam ökning i prestanda.
HP Pavilion 15-cs2019ng är en tjusig laptop på 15.6 tum med mycket som talar för den. Den dåliga batteritiden och faktum att den använder PWM skymmer dock glansen från vad som i övrigt är en kompetent multimedialaptop.
Tyvärr har cs2019ng samma tillkortakommanden som sina syskon. Den har jämförelsevis kort batteritid och det är krångligt att komma åt de interna komponenterna. Att den dessutom använder PWM är en besvikelse och kommer att ge en del personer hälsoproblem. Totalt sett har Pavilion 15-cs2019ng mer styrka än sina Kaby Lake- och AMD-drivna syskon samtidigt som den behåller den lyxiga designen och den goda kylprestandan.
HP Pavilion 15-cs2019ng
- 04/21/2019 v6 (old)
Mike Wobker
Price comparison
