Test: Lenovo Legion Y530 (Core i5-8300H, GTX 1050 Ti) Laptop (Sammanfattning)
| |||||||||||||||||||||||||
Distribution av ljusstyrkan: 88 %
Mitt på batteriet: 282.8 cd/m²
Kontrast: 673:1 (Svärta: 0.42 cd/m²)
ΔE ColorChecker Calman: 4.93 | ∀{0.5-29.43 Ø4.72}
calibrated: 4.07
ΔE Greyscale Calman: 3.8 | ∀{0.09-98 Ø4.97}
57% sRGB (Argyll 1.6.3 3D)
36% AdobeRGB 1998 (Argyll 1.6.3 3D)
39.58% AdobeRGB 1998 (Argyll 3D)
57.3% sRGB (Argyll 3D)
38.31% Display P3 (Argyll 3D)
Gamma: 2.449
CCT: 6112 K
| Lenovo Legion Y530-15ICH B156HAN02.1, IPS, 15.6", 1920x1080 | Dell XPS 15 2018 i5 FHD 97Wh Sharp SHP149A LQ156M1, LED IGZO IPS InfinityEdge, 15.6", 1920x1080 | Razer Blade 15 GTX 1060 LGD05C0, IPS, 15.6", 1920x1080 | Lenovo Legion Y520-15IKBA-80WY001VGE LG Philips LGD0533, IPS, 15.6", 1920x1080 | Alienware 15 R4 LG Philips LP156WF6 (LGD0540), IPS, 15.6", 1920x1080 | Dell G5 15 5587 LGD053F, 156WF6, IPS, 15.6", 1920x1080 | MSI GS63VR 7RG-005 Chi Mei N156HHE-GA1 (CMN15F4), TN LED, 15.6", 1920x1080 | |
|---|---|---|---|---|---|---|---|
| Display | 70% | 65% | 3% | 60% | -0% | 111% | |
| Display P3 Coverage (%) | 38.31 | 66 72% | 64.4 68% | 39.53 3% | 65.7 71% | 38.13 0% | 91.6 139% |
| sRGB Coverage (%) | 57.3 | 96.5 68% | 93.4 63% | 59.2 3% | 86.4 51% | 56.8 -1% | 100 75% |
| AdobeRGB 1998 Coverage (%) | 39.58 | 66.7 69% | 65.5 65% | 40.86 3% | 63.1 59% | 39.47 0% | 86.6 119% |
| Response Times | -3% | 66% | 11% | 20% | 25% | 78% | |
| Response Time Grey 50% / Grey 80% * (ms) | 43.6 ? | 49 ? -12% | 13.6 ? 69% | 42 ? 4% | 37.6 ? 14% | 33 ? 24% | 10.4 ? 76% |
| Response Time Black / White * (ms) | 32.4 ? | 30 ? 7% | 12 ? 63% | 27 ? 17% | 24 ? 26% | 24 ? 26% | 6.6 ? 80% |
| PWM Frequency (Hz) | 961 ? | 24900 ? | 20830 ? | 25510 ? | |||
| Screen | 52% | 38% | -3% | 23% | -7% | 44% | |
| Brightness middle (cd/m²) | 282.8 | 413 46% | 304.3 8% | 243 -14% | 292 3% | 229 -19% | 269 -5% |
| Brightness (cd/m²) | 264 | 378 43% | 293 11% | 231 -12% | 278 5% | 224 -15% | 254 -4% |
| Brightness Distribution (%) | 88 | 86 -2% | 80 -9% | 87 -1% | 88 0% | 87 -1% | 85 -3% |
| Black Level * (cd/m²) | 0.42 | 0.29 31% | 0.38 10% | 0.24 43% | 0.29 31% | 0.28 33% | 0.21 50% |
| Contrast (:1) | 673 | 1424 112% | 801 19% | 1013 51% | 1007 50% | 818 22% | 1281 90% |
| Colorchecker dE 2000 * | 4.93 | 2.44 51% | 1.79 64% | 6.36 -29% | 4.9 1% | 6.1 -24% | 3 39% |
| Colorchecker dE 2000 max. * | 17.65 | 4.46 75% | 3.69 79% | 12.76 28% | 10.08 43% | 12.2 31% | 5.62 68% |
| Colorchecker dE 2000 calibrated * | 4.07 | 2.48 39% | 6.51 -60% | 2.27 44% | 6.12 -50% | ||
| Greyscale dE 2000 * | 3.8 | 2.48 35% | 1.1 71% | 5.63 -48% | 4.89 -29% | 5.68 -49% | 3.18 16% |
| Gamma | 2.449 90% | 2.43 91% | 2.27 97% | 2.47 89% | 2.36 93% | 2.4 92% | 2.25 98% |
| CCT | 6112 106% | 7006 93% | 6665 98% | 7411 88% | 7598 86% | 6989 93% | 7274 89% |
| Color Space (Percent of AdobeRGB 1998) (%) | 36 | 62 72% | 59.8 66% | 38 6% | 56 56% | 36 0% | 77 114% |
| Color Space (Percent of sRGB) (%) | 57 | 96 68% | 92.8 63% | 59 4% | 86 51% | 57 0% | 100 75% |
| Totalt genomsnitt (program/inställningar) | 40% /
48% | 56% /
47% | 4% /
-0% | 34% /
30% | 6% /
-1% | 78% /
62% |
* ... mindre är bättre
Visa svarstider
| ↔ Svarstid svart till vitt | ||
|---|---|---|
| 32.4 ms ... stiga ↗ och falla ↘ kombinerat | ↗ 18 ms stiga | 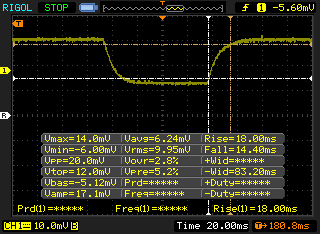 |
| ↘ 14.4 ms hösten | ||
| Skärmen visar långsamma svarsfrekvenser i våra tester och kommer att vara otillfredsställande för spelare. I jämförelse sträcker sig alla testade enheter från 0.1 (minst) till 240 (maximalt) ms. » 88 % av alla enheter är bättre. Detta innebär att den uppmätta svarstiden är sämre än genomsnittet av alla testade enheter (19.9 ms). | ||
| ↔ Svarstid 50 % grått till 80 % grått | ||
| 43.6 ms ... stiga ↗ och falla ↘ kombinerat | ↗ 19.2 ms stiga | 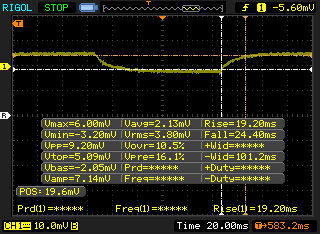 |
| ↘ 24.4 ms hösten | ||
| Skärmen visar långsamma svarsfrekvenser i våra tester och kommer att vara otillfredsställande för spelare. I jämförelse sträcker sig alla testade enheter från 0.165 (minst) till 636 (maximalt) ms. » 73 % av alla enheter är bättre. Detta innebär att den uppmätta svarstiden är sämre än genomsnittet av alla testade enheter (31.1 ms). | ||
Skärmflimmer / PWM (Puls-Width Modulation)
| Skärmflimmer / PWM upptäcktes inte | 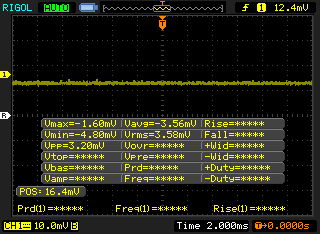 | ||
Som jämförelse: 52 % av alla testade enheter använder inte PWM för att dämpa skärmen. Om PWM upptäcktes mättes ett medelvärde av 7784 (minst: 5 - maximum: 343500) Hz. | |||
| PCMark 8 Home Score Accelerated v2 | 4129 poäng | |
| PCMark 8 Work Score Accelerated v2 | 5369 poäng | |
| PCMark 10 Score | 4812 poäng | |
Hjälp | ||
| Lenovo Legion Y530-15ICH Toshiba KBG30ZMT128G | Dell XPS 15 2018 i5 FHD 97Wh Lite-On CA3-8D256-Q11 | Razer Blade 15 GTX 1060 Samsung SSD PM981 MZVLB512HAJQ | Alienware 15 R4 Toshiba XG5 KXG50ZNV256G | Dell G5 15 5587 SK hynix SC311 M.2 | MSI GS63VR 7RG-005 Samsung SM961 MZVPW256HEGL | Lenovo Legion Y520-15IKBN 80WK0042GE Samsung PM961 NVMe MZVLW128HEGR | Genomsnitt Toshiba KBG30ZMT128G | |
|---|---|---|---|---|---|---|---|---|
| AS SSD | -17% | 550% | 111% | 16% | 392% | 138% | 0% | |
| Copy Game MB/s (MB/s) | 465.9 | 882 | 130.9 | 892 | 197.3 | 122.3 ? | ||
| Copy Program MB/s (MB/s) | 117.2 | 370.7 | 95.7 | 317.5 | 127.3 | 122.6 ? | ||
| Copy ISO MB/s (MB/s) | 632 | 1452 | 146.6 | 1698 | 497.6 | 174.8 ? | ||
| Score Total (Points) | 838 | 750 -11% | 4095 389% | 1416 69% | 557 -34% | 3848 359% | 1434 71% | 656 ? -22% |
| Score Write (Points) | 128 | 58 -55% | 1955 1427% | 435 240% | 199 55% | 1185 826% | 368 188% | 149 ? 16% |
| Score Read (Points) | 497 | 492 -1% | 1407 183% | 714 44% | 240 -52% | 1795 261% | 746 50% | 360 ? -28% |
| Access Time Write * (ms) | 0.287 | 0.889 -210% | 0.037 87% | 0.053 82% | 0.066 77% | 0.03 90% | 0.032 89% | 0.27 ? 6% |
| Access Time Read * (ms) | 0.626 | 0.086 86% | 0.05 92% | 0.116 81% | 0.128 80% | 0.039 94% | 0.07 89% | 0.3803 ? 39% |
| 4K-64 Write (MB/s) | 78.9 | 19.19 -76% | 1664 2009% | 310.5 294% | 112.4 42% | 932 1081% | 158.6 101% | 75.1 ? -5% |
| 4K-64 Read (MB/s) | 335.3 | 301.8 -10% | 1177 251% | 437.4 30% | 164.1 -51% | 1506 349% | 463.2 38% | 222 ? -34% |
| 4K Write (MB/s) | 35.74 | 5.12 -86% | 99.2 178% | 94.8 165% | 62.2 74% | 124.7 249% | 127.9 258% | 60.8 ? 70% |
| 4K Read (MB/s) | 38.71 | 32.5 -16% | 48.56 25% | 32.87 -15% | 24.44 -37% | 51 32% | 46.98 21% | 30.3 ? -22% |
| Seq Write (MB/s) | 131.6 | 340.3 159% | 1917 1357% | 300.4 128% | 243.7 85% | 1281 873% | 814 519% | 122.4 ? -7% |
| Seq Read (MB/s) | 1231 | 1574 28% | 1820 48% | 2441 98% | 511 -58% | 2382 94% | 2362 92% | 1074 ? -13% |
* ... mindre är bättre

| 3DMark 11 Performance | 9285 poäng | |
| 3DMark Cloud Gate Standard Score | 22978 poäng | |
| 3DMark Fire Strike Score | 6809 poäng | |
Hjälp | ||
| Metro: Last Light | |
| 1024x768 Low (DX10) AF:4x (sortera efter värde) | |
| Lenovo Legion Y530-15ICH | |
| Genomsnitt NVIDIA GeForce GTX 1050 Ti Mobile (113 - 115, n=2) | |
| 1366x768 Medium (DX10) AF:4x (sortera efter värde) | |
| Lenovo Legion Y530-15ICH | |
| Genomsnitt NVIDIA GeForce GTX 1050 Ti Mobile (106 - 108, n=2) | |
| 1366x768 High (DX11) AF:16x (sortera efter värde) | |
| Lenovo Legion Y530-15ICH | |
| Genomsnitt NVIDIA GeForce GTX 1050 Ti Mobile (87 - 98, n=2) | |
| 1920x1080 Very High (DX11) AF:16x (sortera efter värde) | |
| Lenovo Legion Y530-15ICH | |
| Genomsnitt NVIDIA GeForce GTX 1050 Ti Mobile (47 - 59, n=3) | |
| The Witcher 3 - 1920x1080 Ultra Graphics & Postprocessing (HBAO+) (sortera efter värde) | |
| Lenovo Legion Y530-15ICH | |
| Dell XPS 15 2018 i5 FHD 97Wh | |
| Razer Blade 15 GTX 1060 | |
| Lenovo Legion Y520-15IKBA-80WY001VGE | |
| Alienware 15 R4 | |
| Dell G5 15 5587 | |
| MSI GS63VR 7RG-005 | |
| Genomsnitt NVIDIA GeForce GTX 1050 Ti Mobile (14 - 38, n=31) | |
| Genomsnitt av klass Gaming (95 - 240, n=8, senaste 2 åren) | |
| låg | med. | hög | ultra | |
|---|---|---|---|---|
| BioShock Infinite (2013) | 238 | 201 | 155 | 61 |
| Metro: Last Light (2013) | 115 | 108 | 98 | 47 |
| The Witcher 3 (2015) | 37 | |||
| Rise of the Tomb Raider (2016) | 88 | 60 | 33 | 29 |
Ljudnivå
| Låg belastning |
| 28 / 28 / 28.5 dB(A) |
| Hög belastning |
| 34.9 / 49.6 dB(A) |
 | ||
30 dB tyst 40 dB(A) hörbar 50 dB(A) högt ljud |
||
min: | ||
| Lenovo Legion Y530-15ICH GeForce GTX 1050 Ti Mobile, i5-8300H, Toshiba KBG30ZMT128G | Dell XPS 15 2018 i5 FHD 97Wh GeForce GTX 1050 Mobile, i5-8300H, Lite-On CA3-8D256-Q11 | Razer Blade 15 GTX 1060 GeForce GTX 1060 Max-Q, i7-8750H, Samsung SSD PM981 MZVLB512HAJQ | Lenovo Legion Y520-15IKBA-80WY001VGE Radeon RX 560 (Laptop), i5-7300HQ, Seagate Mobile HDD 1TB ST1000LM035 | Alienware 15 R4 GeForce GTX 1070 Mobile, i9-8950HK, Toshiba XG5 KXG50ZNV256G | Dell G5 15 5587 GeForce GTX 1060 Max-Q, i5-8300H, SK hynix SC311 M.2 | MSI GS63VR 7RG-005 GeForce GTX 1070 Max-Q, i7-7700HQ, Samsung SM961 MZVPW256HEGL | |
|---|---|---|---|---|---|---|---|
| Noise | -4% | -9% | -3% | -26% | -7% | -12% | |
| av / miljö * (dB) | 28 | 30.3 -8% | 28.1 -0% | 30.3 -8% | 29 -4% | 30.3 -8% | 30 -7% |
| Idle Minimum * (dB) | 28 | 30.3 -8% | 28.1 -0% | 31.3 -12% | 32 -14% | 31.1 -11% | 31 -11% |
| Idle Average * (dB) | 28 | 30.3 -8% | 33 -18% | 31.3 -12% | 33 -18% | 31.1 -11% | 34 -21% |
| Idle Maximum * (dB) | 28.5 | 30.3 -6% | 33.5 -18% | 31.3 -10% | 50 -75% | 34.2 -20% | 35 -23% |
| Load Average * (dB) | 34.9 | 37.1 -6% | 42.2 -21% | 32.8 6% | 50 -43% | 34.9 -0% | 42 -20% |
| Witcher 3 ultra * (dB) | 40 | 43.3 -8% | 45.3 -13% | 41.2 -3% | 51 -27% | 42.7 -7% | 44 -10% |
| Load Maximum * (dB) | 49.6 | 43 13% | 45.7 8% | 39 21% | 51 -3% | 44 11% | 46 7% |
* ... mindre är bättre
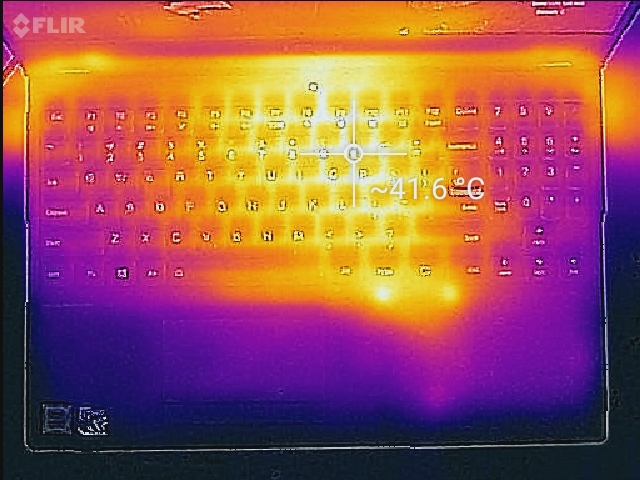
(±) Den maximala temperaturen på ovansidan är 42.8 °C / 109 F, jämfört med genomsnittet av 40.4 °C / 105 F , allt från 21.2 till 68.8 °C för klassen Gaming.
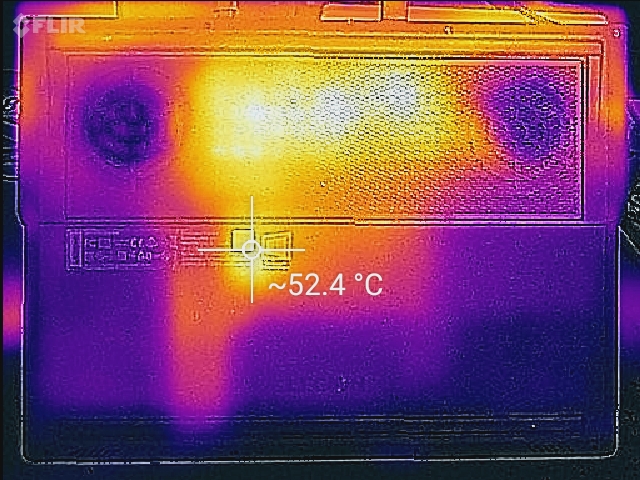
(-) Botten värms upp till maximalt 52 °C / 126 F, jämfört med genomsnittet av 43.2 °C / 110 F
(+) Vid tomgångsbruk är medeltemperaturen för ovansidan 27.4 °C / 81 F, jämfört med enhetsgenomsnittet på 33.9 °C / ### class_avg_f### F.
(+) När du spelar The Witcher 3 är medeltemperaturen för ovansidan 30.9 °C / 88 F, jämfört med enhetsgenomsnittet på 33.9 °C / ## #class_avg_f### F.
(+) Handledsstöden och pekplattan är kallare än hudtemperaturen med maximalt 31 °C / 87.8 F och är därför svala att ta på.
(-) Medeltemperaturen för handledsstödsområdet på liknande enheter var 28.8 °C / 83.8 F (-2.2 °C / -4 F).
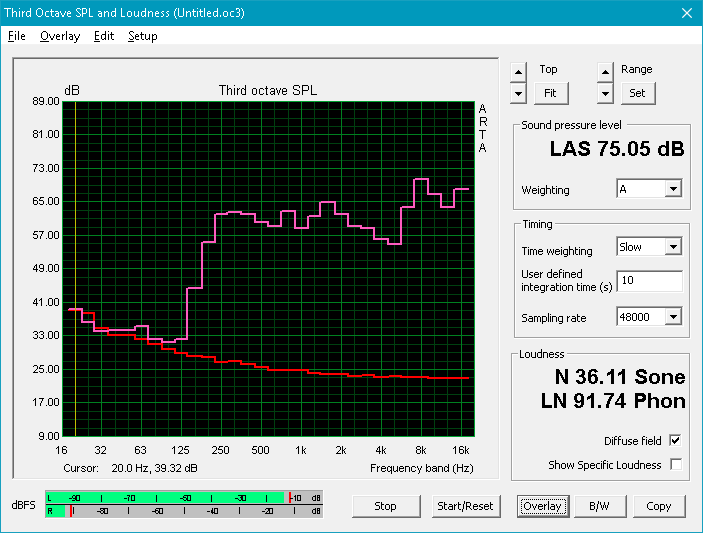
Lenovo Legion Y530-15ICH ljudanalys
(±) | högtalarljudstyrkan är genomsnittlig men bra (75.1 dB)
Bas 100 - 315 Hz
(±) | reducerad bas - i genomsnitt 14% lägre än medianen
(±) | linjäriteten för basen är genomsnittlig (14.1% delta till föregående frekvens)
Mellan 400 - 2000 Hz
(+) | balanserad mellan - endast 1.5% från medianen
(+) | mids är linjära (6.7% delta till föregående frekvens)
Högsta 2 - 16 kHz
(+) | balanserade toppar - endast 4.8% från medianen
(±) | linjäriteten för toppar är genomsnittlig (10% delta till föregående frekvens)
Totalt 100 - 16 000 Hz
(±) | linjäriteten för det totala ljudet är genomsnittlig (18.9% skillnad mot median)
Jämfört med samma klass
» 63% av alla testade enheter i den här klassen var bättre, 8% liknande, 29% sämre
» Den bästa hade ett delta på 6%, genomsnittet var 18%, sämst var 132%
Jämfört med alla testade enheter
» 44% av alla testade enheter var bättre, 8% liknande, 48% sämre
» Den bästa hade ett delta på 4%, genomsnittet var 24%, sämst var 134%
Dell XPS 15 2018 i5 FHD 97Wh ljudanalys
(±) | högtalarljudstyrkan är genomsnittlig men bra (73 dB)
Bas 100 - 315 Hz
(±) | reducerad bas - i genomsnitt 10.9% lägre än medianen
(+) | basen är linjär (4.9% delta till föregående frekvens)
Mellan 400 - 2000 Hz
(±) | högre mellan - i genomsnitt 6.8% högre än median
(+) | mids är linjära (6.8% delta till föregående frekvens)
Högsta 2 - 16 kHz
(+) | balanserade toppar - endast 3.7% från medianen
(+) | toppar är linjära (6.9% delta till föregående frekvens)
Totalt 100 - 16 000 Hz
(±) | linjäriteten för det totala ljudet är genomsnittlig (16.6% skillnad mot median)
Jämfört med samma klass
» 44% av alla testade enheter i den här klassen var bättre, 7% liknande, 49% sämre
» Den bästa hade ett delta på 5%, genomsnittet var 17%, sämst var 45%
Jämfört med alla testade enheter
» 29% av alla testade enheter var bättre, 6% liknande, 65% sämre
» Den bästa hade ett delta på 4%, genomsnittet var 24%, sämst var 134%
| Av/Standby | |
| Låg belastning | |
| Hög belastning |
|
Förklaring:
min: | |
| Lenovo Legion Y530-15ICH i5-8300H, GeForce GTX 1050 Ti Mobile, Toshiba KBG30ZMT128G, IPS, 1920x1080, 15.6" | Dell XPS 15 2018 i5 FHD 97Wh i5-8300H, GeForce GTX 1050 Mobile, Lite-On CA3-8D256-Q11, LED IGZO IPS InfinityEdge, 1920x1080, 15.6" | Razer Blade 15 GTX 1060 i7-8750H, GeForce GTX 1060 Max-Q, Samsung SSD PM981 MZVLB512HAJQ, IPS, 1920x1080, 15.6" | Lenovo Legion Y520-15IKBA-80WY001VGE i5-7300HQ, Radeon RX 560 (Laptop), Seagate Mobile HDD 1TB ST1000LM035, IPS, 1920x1080, 15.6" | Alienware 15 R4 i9-8950HK, GeForce GTX 1070 Mobile, Toshiba XG5 KXG50ZNV256G, IPS, 1920x1080, 15.6" | Dell G5 15 5587 i5-8300H, GeForce GTX 1060 Max-Q, SK hynix SC311 M.2, IPS, 1920x1080, 15.6" | MSI GS63VR 7RG-005 i7-7700HQ, GeForce GTX 1070 Max-Q, Samsung SM961 MZVPW256HEGL, TN LED, 1920x1080, 15.6" | |
|---|---|---|---|---|---|---|---|
| Power Consumption | 29% | -63% | 17% | -143% | 4% | -53% | |
| Idle Minimum * (Watt) | 4.5 | 2.9 36% | 14.9 -231% | 4.7 -4% | 23 -411% | 4.9 -9% | 12 -167% |
| Idle Average * (Watt) | 10 | 5.8 42% | 17.5 -75% | 7.8 22% | 26 -160% | 8.5 15% | 16 -60% |
| Idle Maximum * (Watt) | 13.8 | 7.5 46% | 19.2 -39% | 8.4 39% | 30 -117% | 9.1 34% | 21 -52% |
| Load Average * (Watt) | 92.5 | 77.5 16% | 103.2 -12% | 76.5 17% | 111 -20% | 90.7 2% | 85 8% |
| Witcher 3 ultra * (Watt) | 108.1 | 84 22% | 123.1 -14% | 93 14% | 182 -68% | 110 -2% | 128 -18% |
| Load Maximum * (Watt) | 123.2 | 107 13% | 132.7 -8% | 106 14% | 222 -80% | 144 -17% | 162 -31% |
* ... mindre är bättre
| Lenovo Legion Y530-15ICH i5-8300H, GeForce GTX 1050 Ti Mobile, 52.5 Wh | Dell XPS 15 2018 i5 FHD 97Wh i5-8300H, GeForce GTX 1050 Mobile, 97 Wh | Razer Blade 15 GTX 1060 i7-8750H, GeForce GTX 1060 Max-Q, 80 Wh | Lenovo Legion Y520-15IKBA-80WY001VGE i5-7300HQ, Radeon RX 560 (Laptop), 45 Wh | Alienware 15 R4 i9-8950HK, GeForce GTX 1070 Mobile, 99 Wh | Dell G5 15 5587 i5-8300H, GeForce GTX 1060 Max-Q, 56 Wh | MSI GS63VR 7RG-005 i7-7700HQ, GeForce GTX 1070 Max-Q, 52.4 Wh | |
|---|---|---|---|---|---|---|---|
| Batteridrifttid | 283% | 63% | 37% | 24% | 59% | -5% | |
| WiFi v1.3 (h) | 4.1 | 15.7 283% | 6.7 63% | 5.6 37% | 5.1 24% | 6.5 59% | 3.9 -5% |
| Witcher 3 ultra (h) | 1 |
För
Emot
Läs den fullständiga versionen av den här recensionen på engelska här.
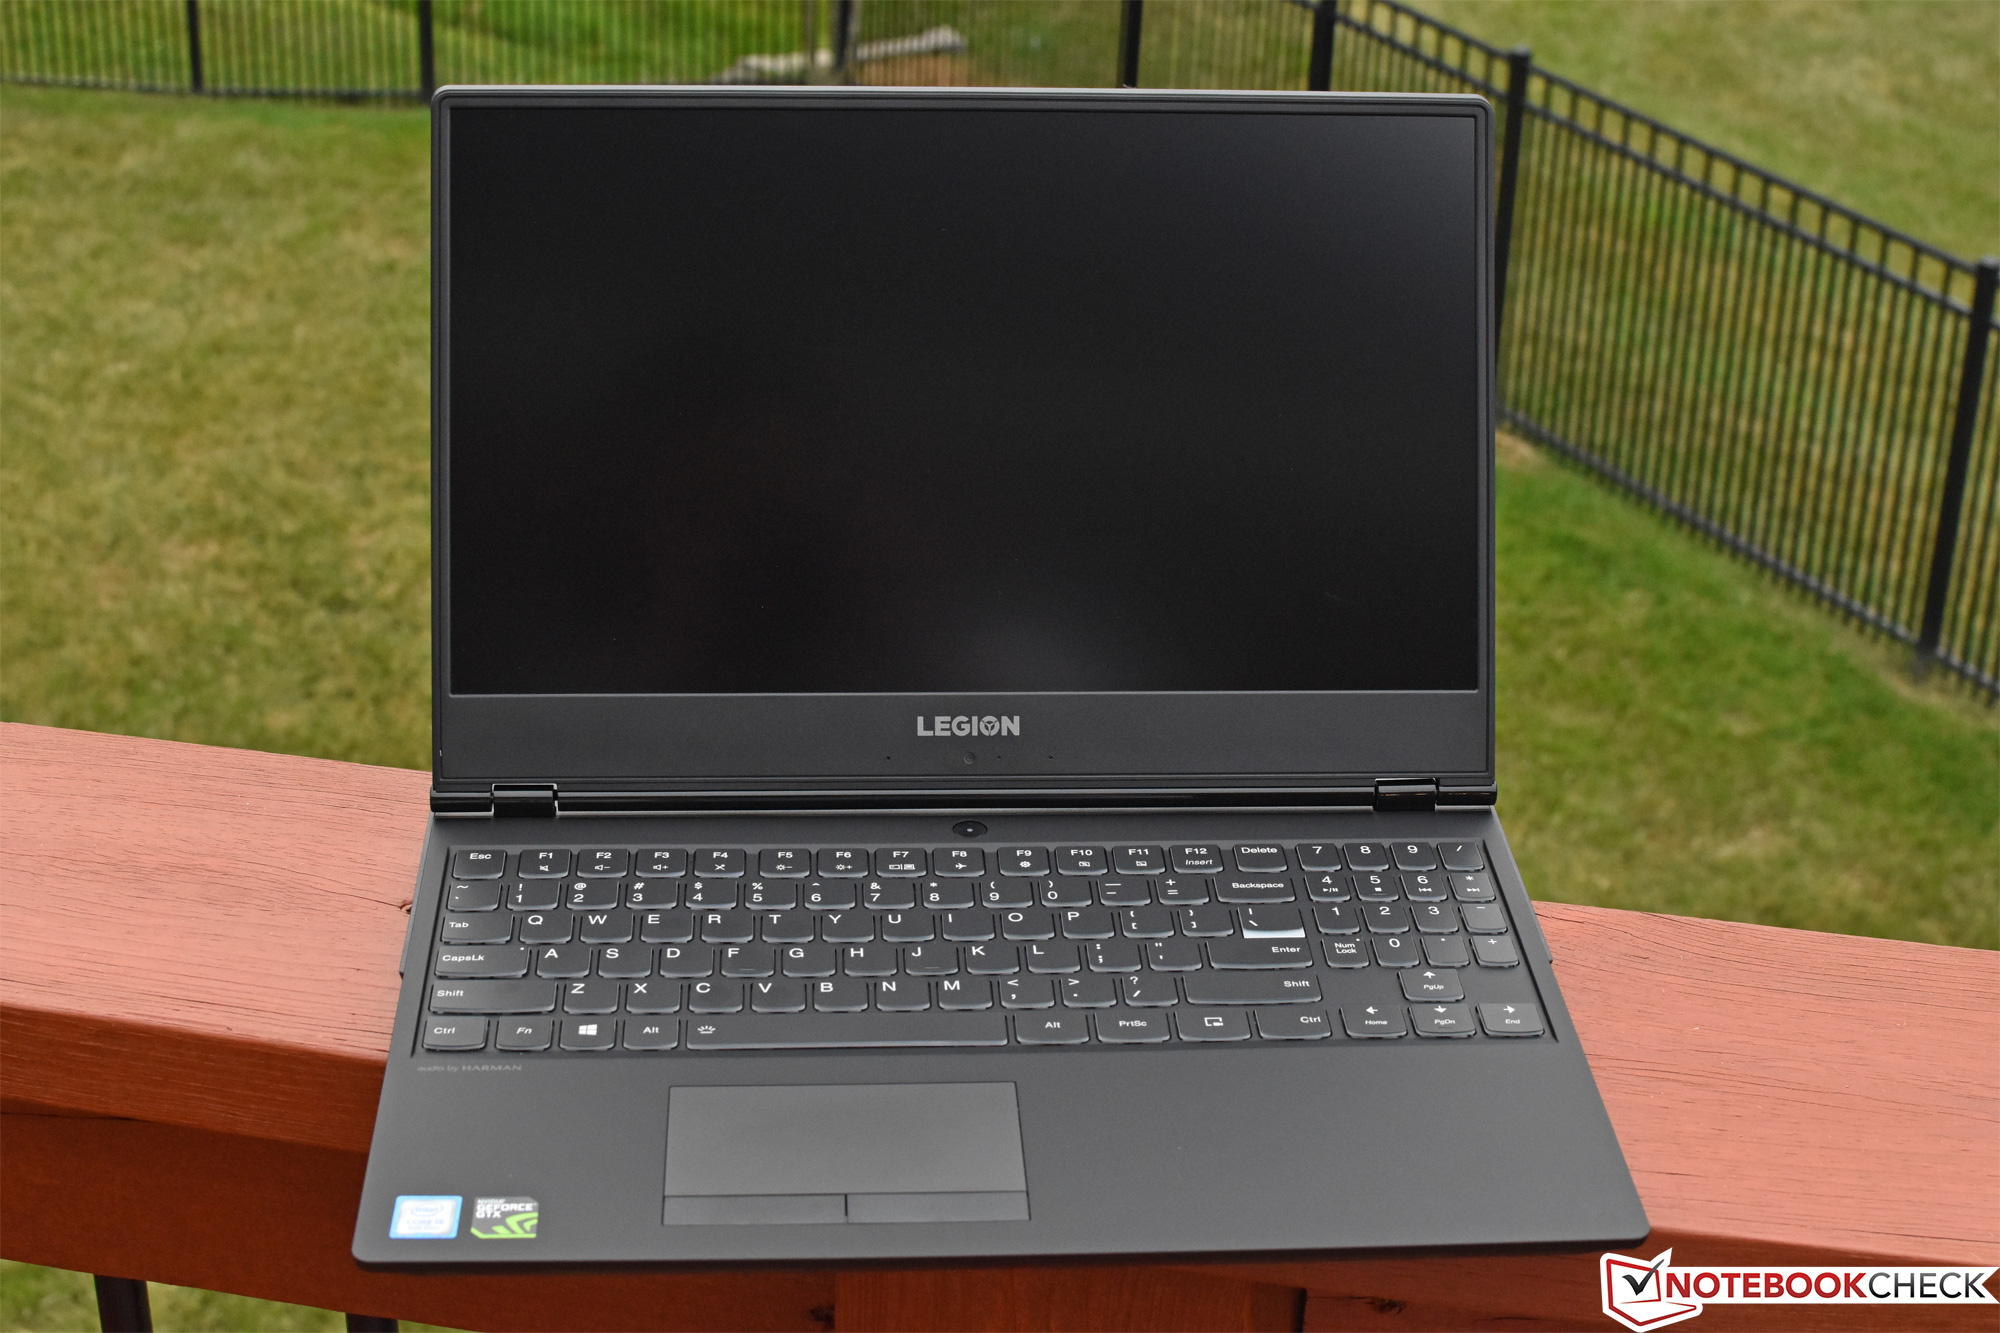
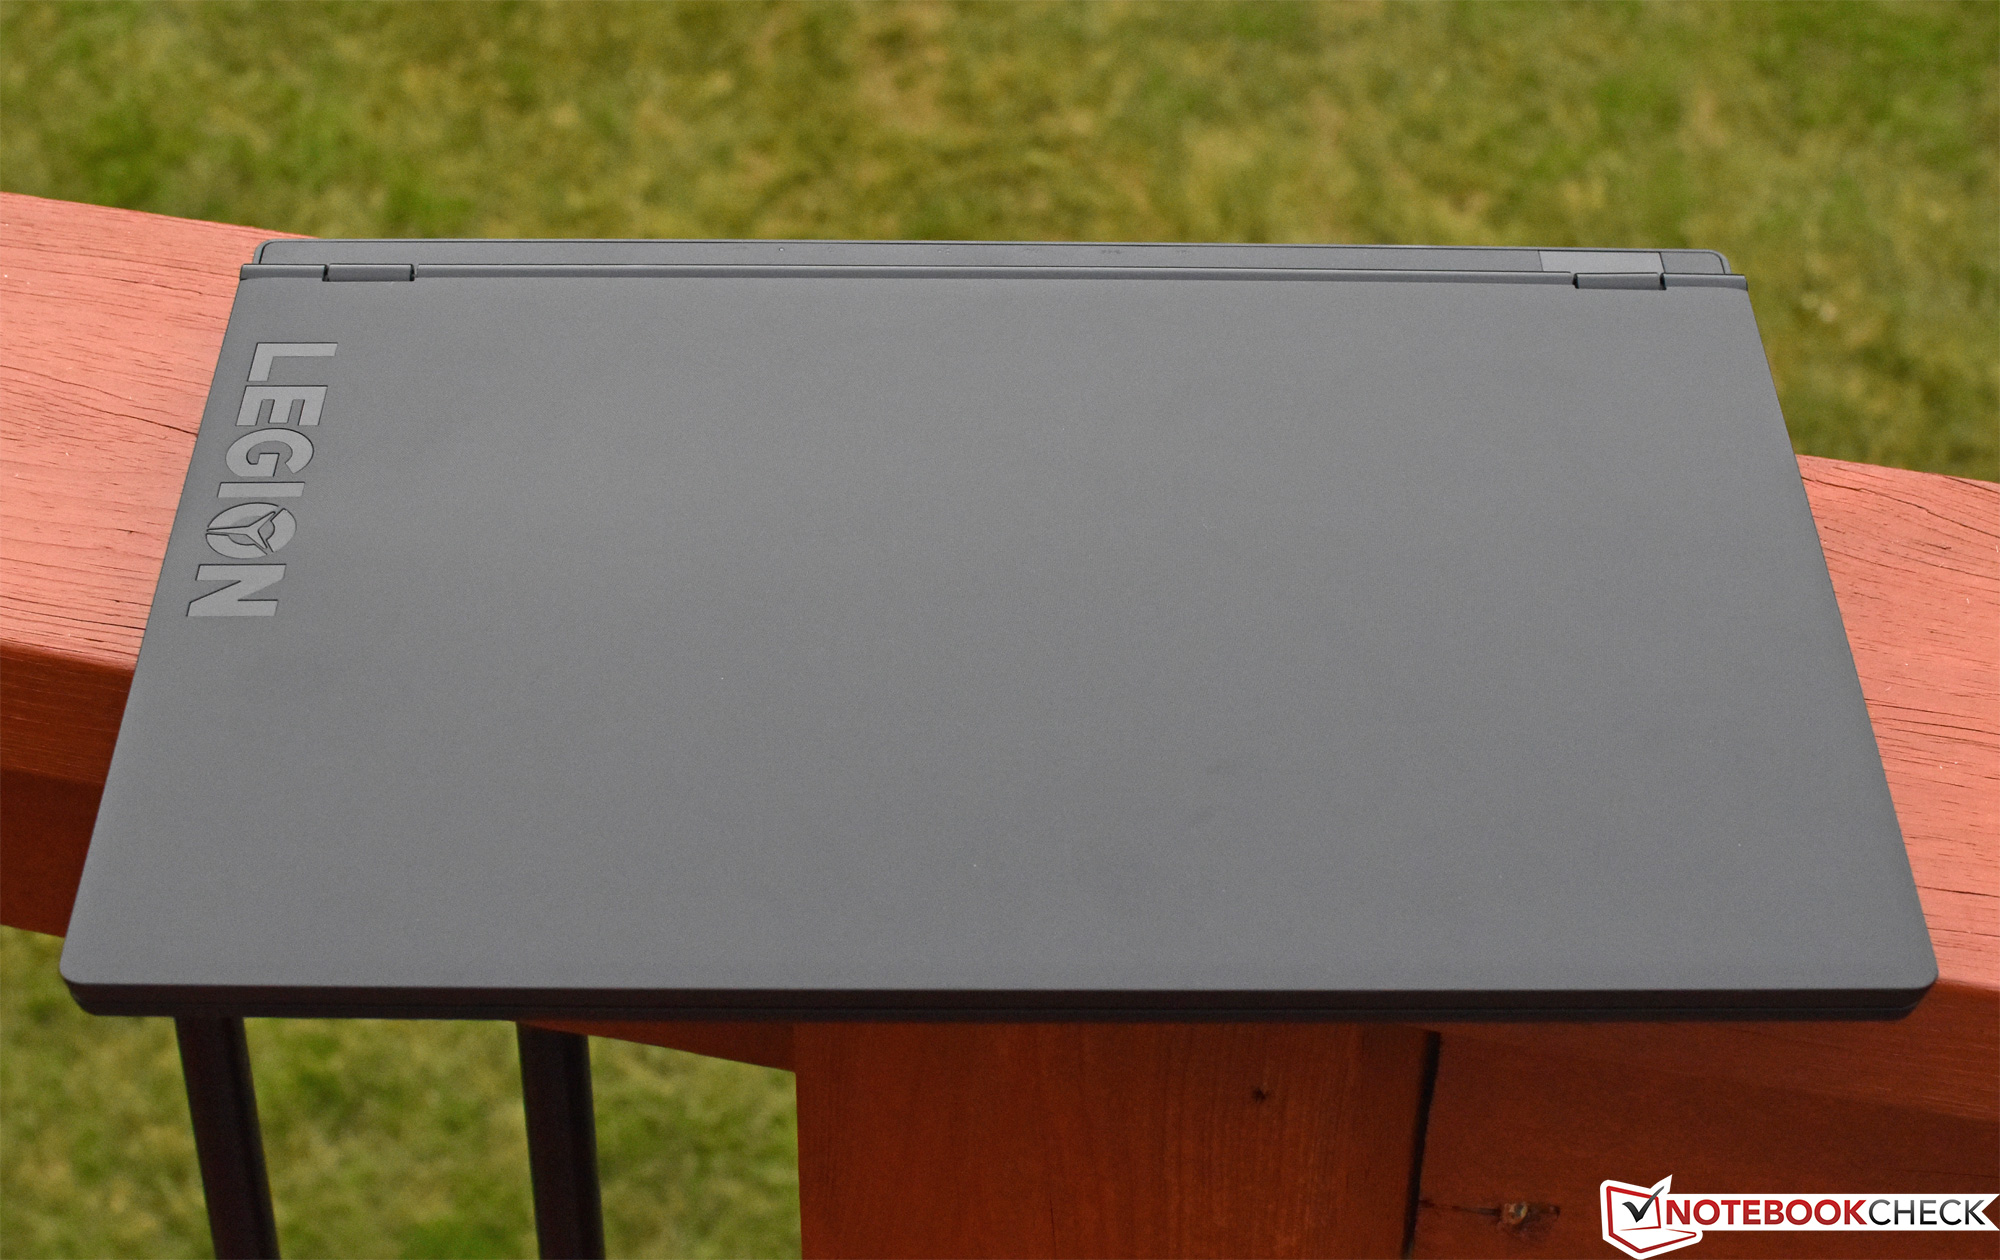
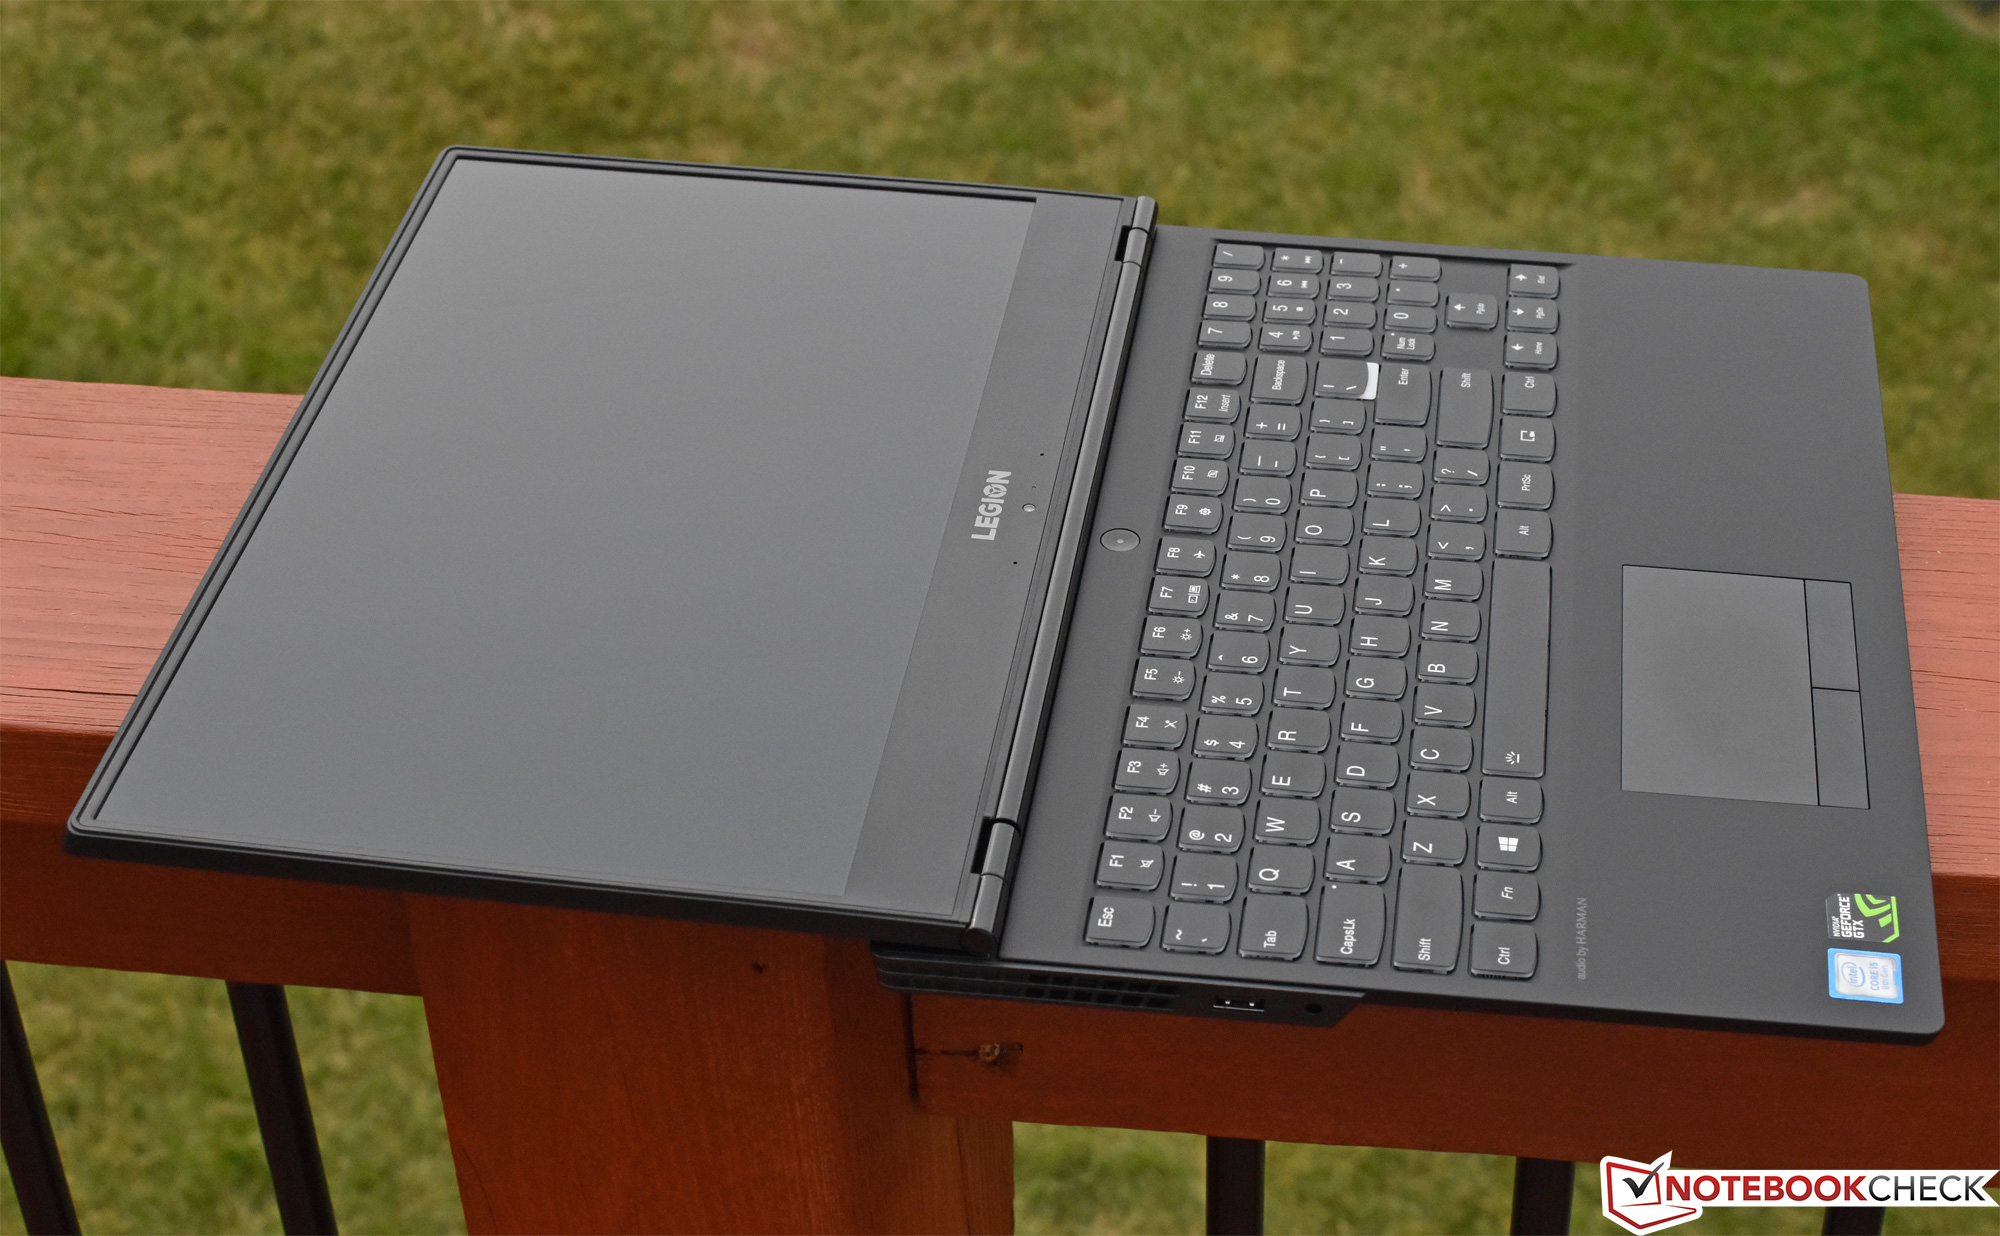
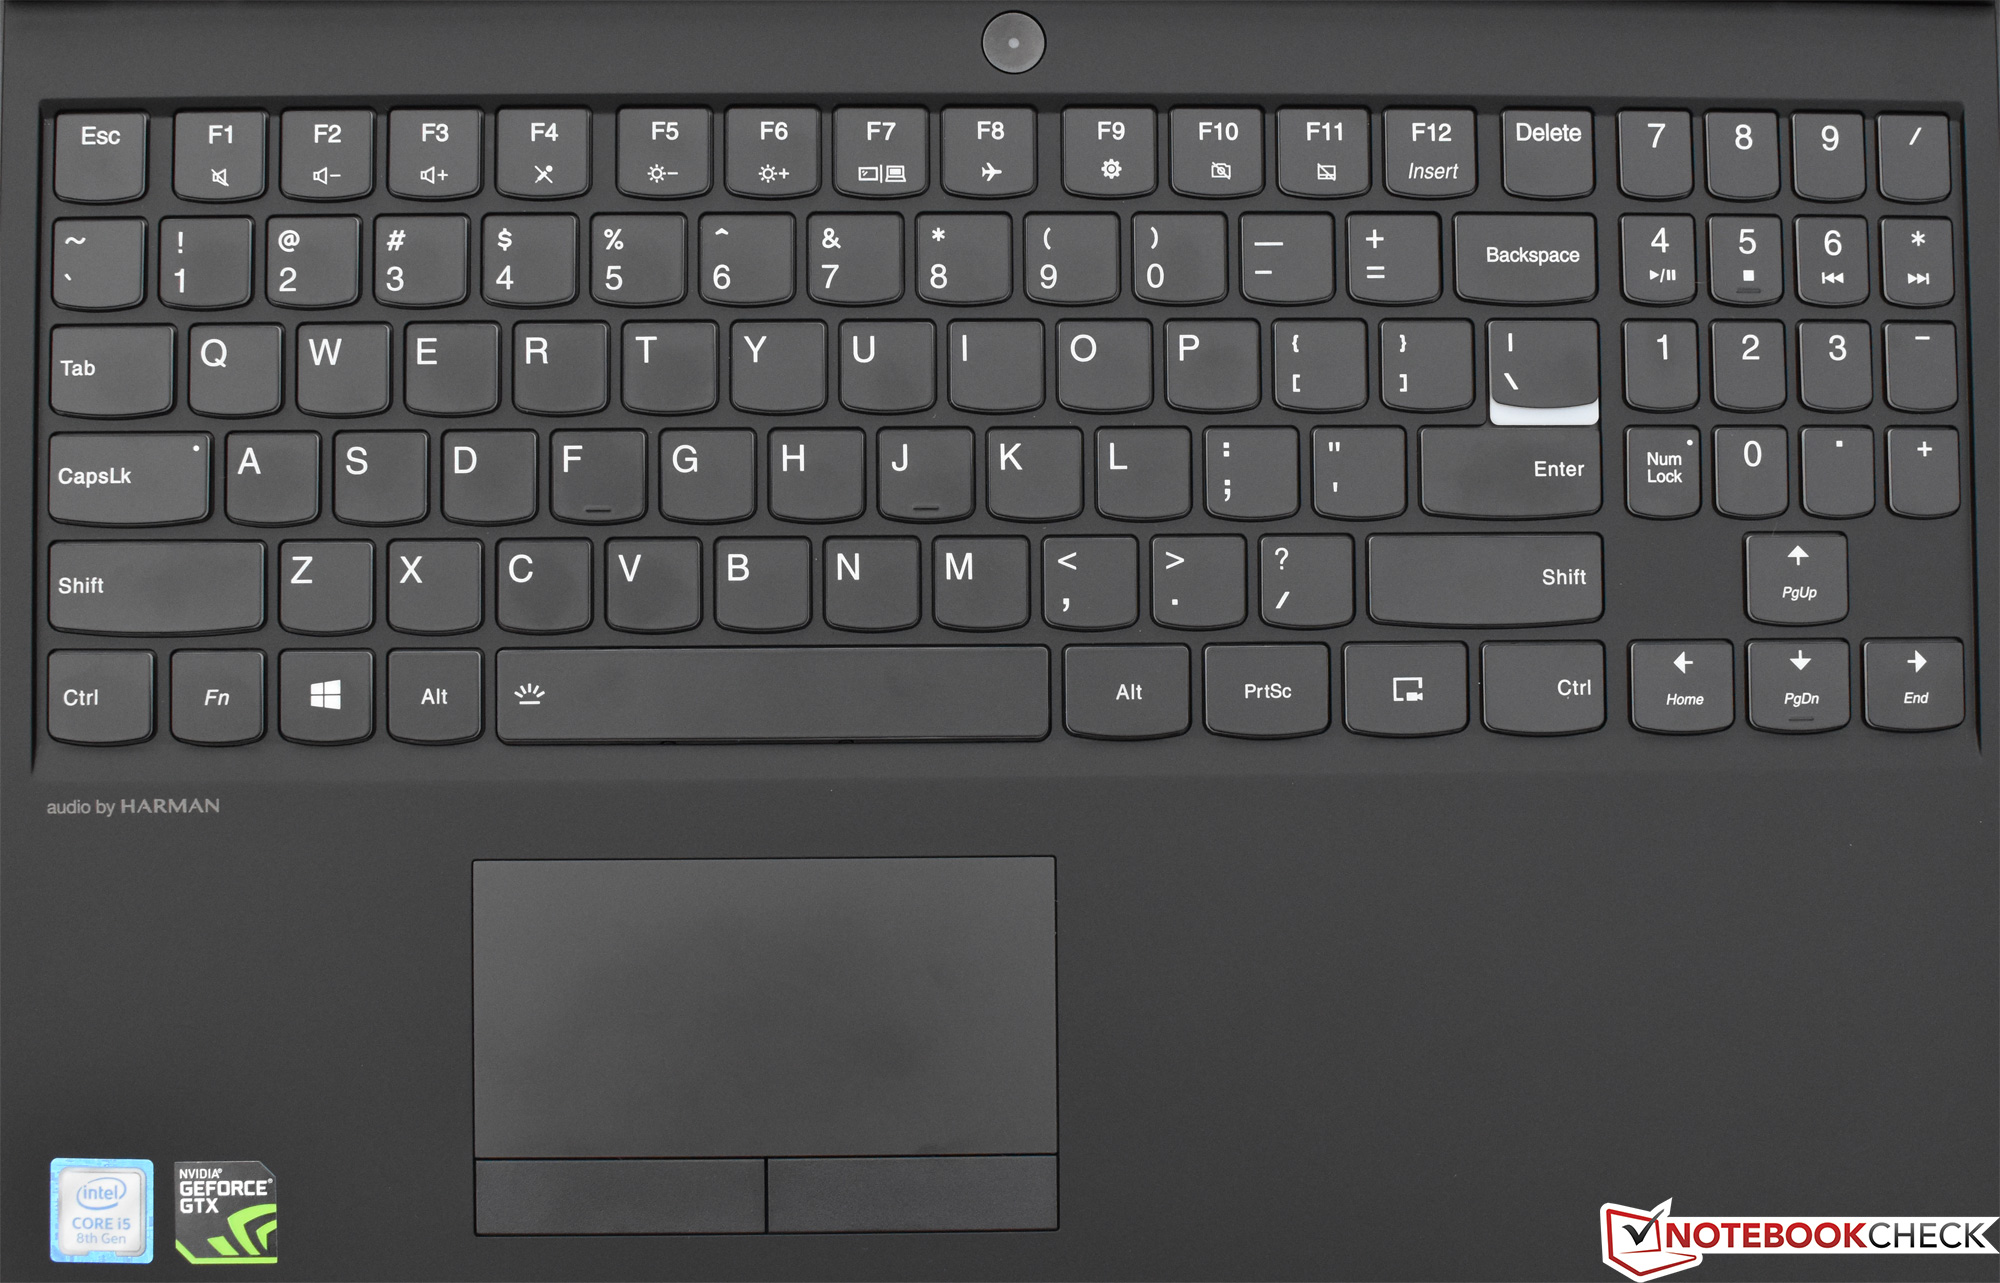
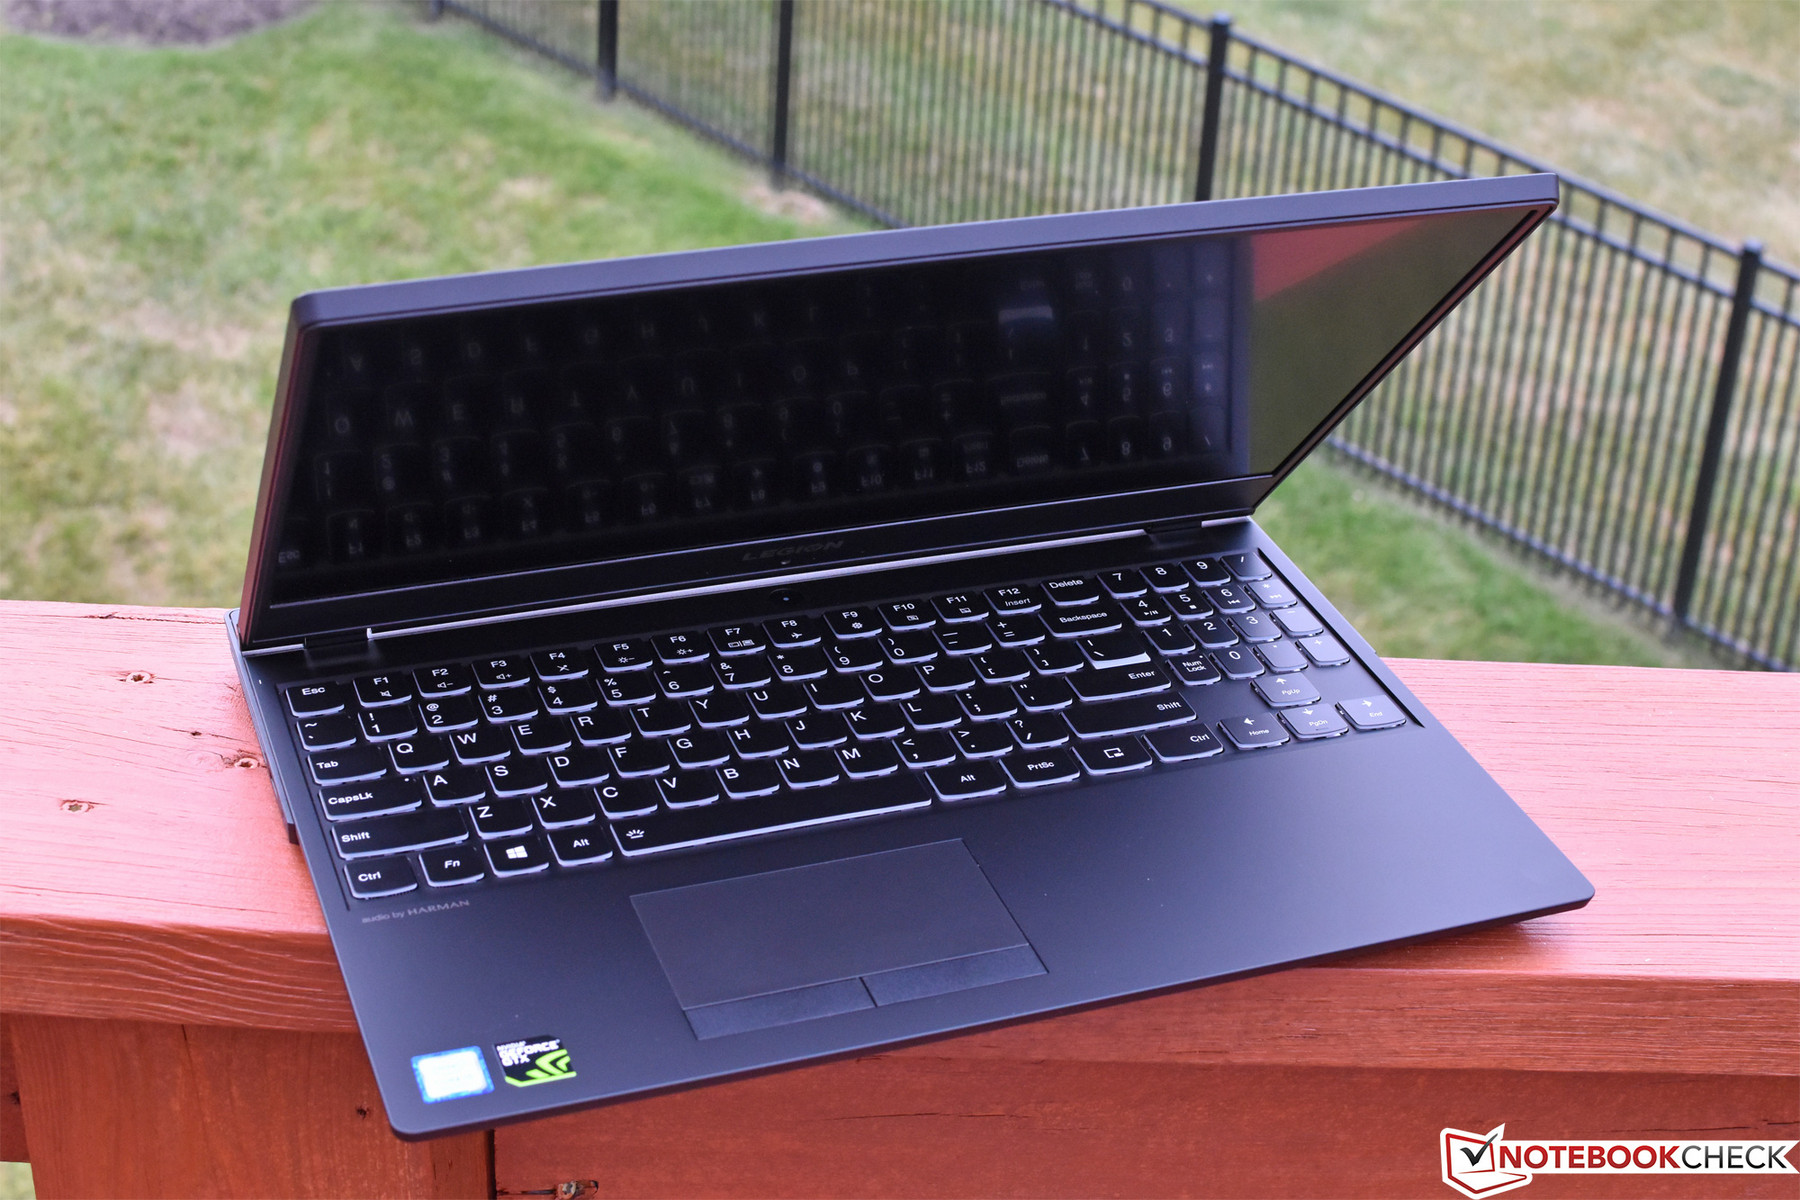
Lenovo Legion Y530 är en utmärkt startpunkt för den som letar efter en grundläggande spellaptop som i huvudsak hanterar alla viktiga grundstenar utan att lägga tid på pompa och ståt. Den satsar dubbelt på den filosofi som förra årets Y520 utgick ifrån genom att ta bort de sista resterna av färgglada accenter och har istället bytt ut dom mot en mycker mer professionell (eller åtminstone nedtonad) vit-på-svart färgpalett. Även om den är utrustad med en ganska enkel GPU (GeForce GTX 1050 Ti) och "bara" en fyrkärnig Core i5-8300H CPU så är prestandan sällsynt stabil och temperaturerna (och dom behagliga ljudnivåerna) hamnar aldrig ur kontroll. Således kan den lätt hantera dom flesta moderna spel på medium-inställningar, och en del till och med på höga inställningar i skärmens egna upplösning.
Lenovo Legion Y530 är en utmärkt startpunkt för den som letar efter en grundläggande spellaptop som i stort hanterar alla viktiga grundstenar utan att satsa stort på pompa och ståt
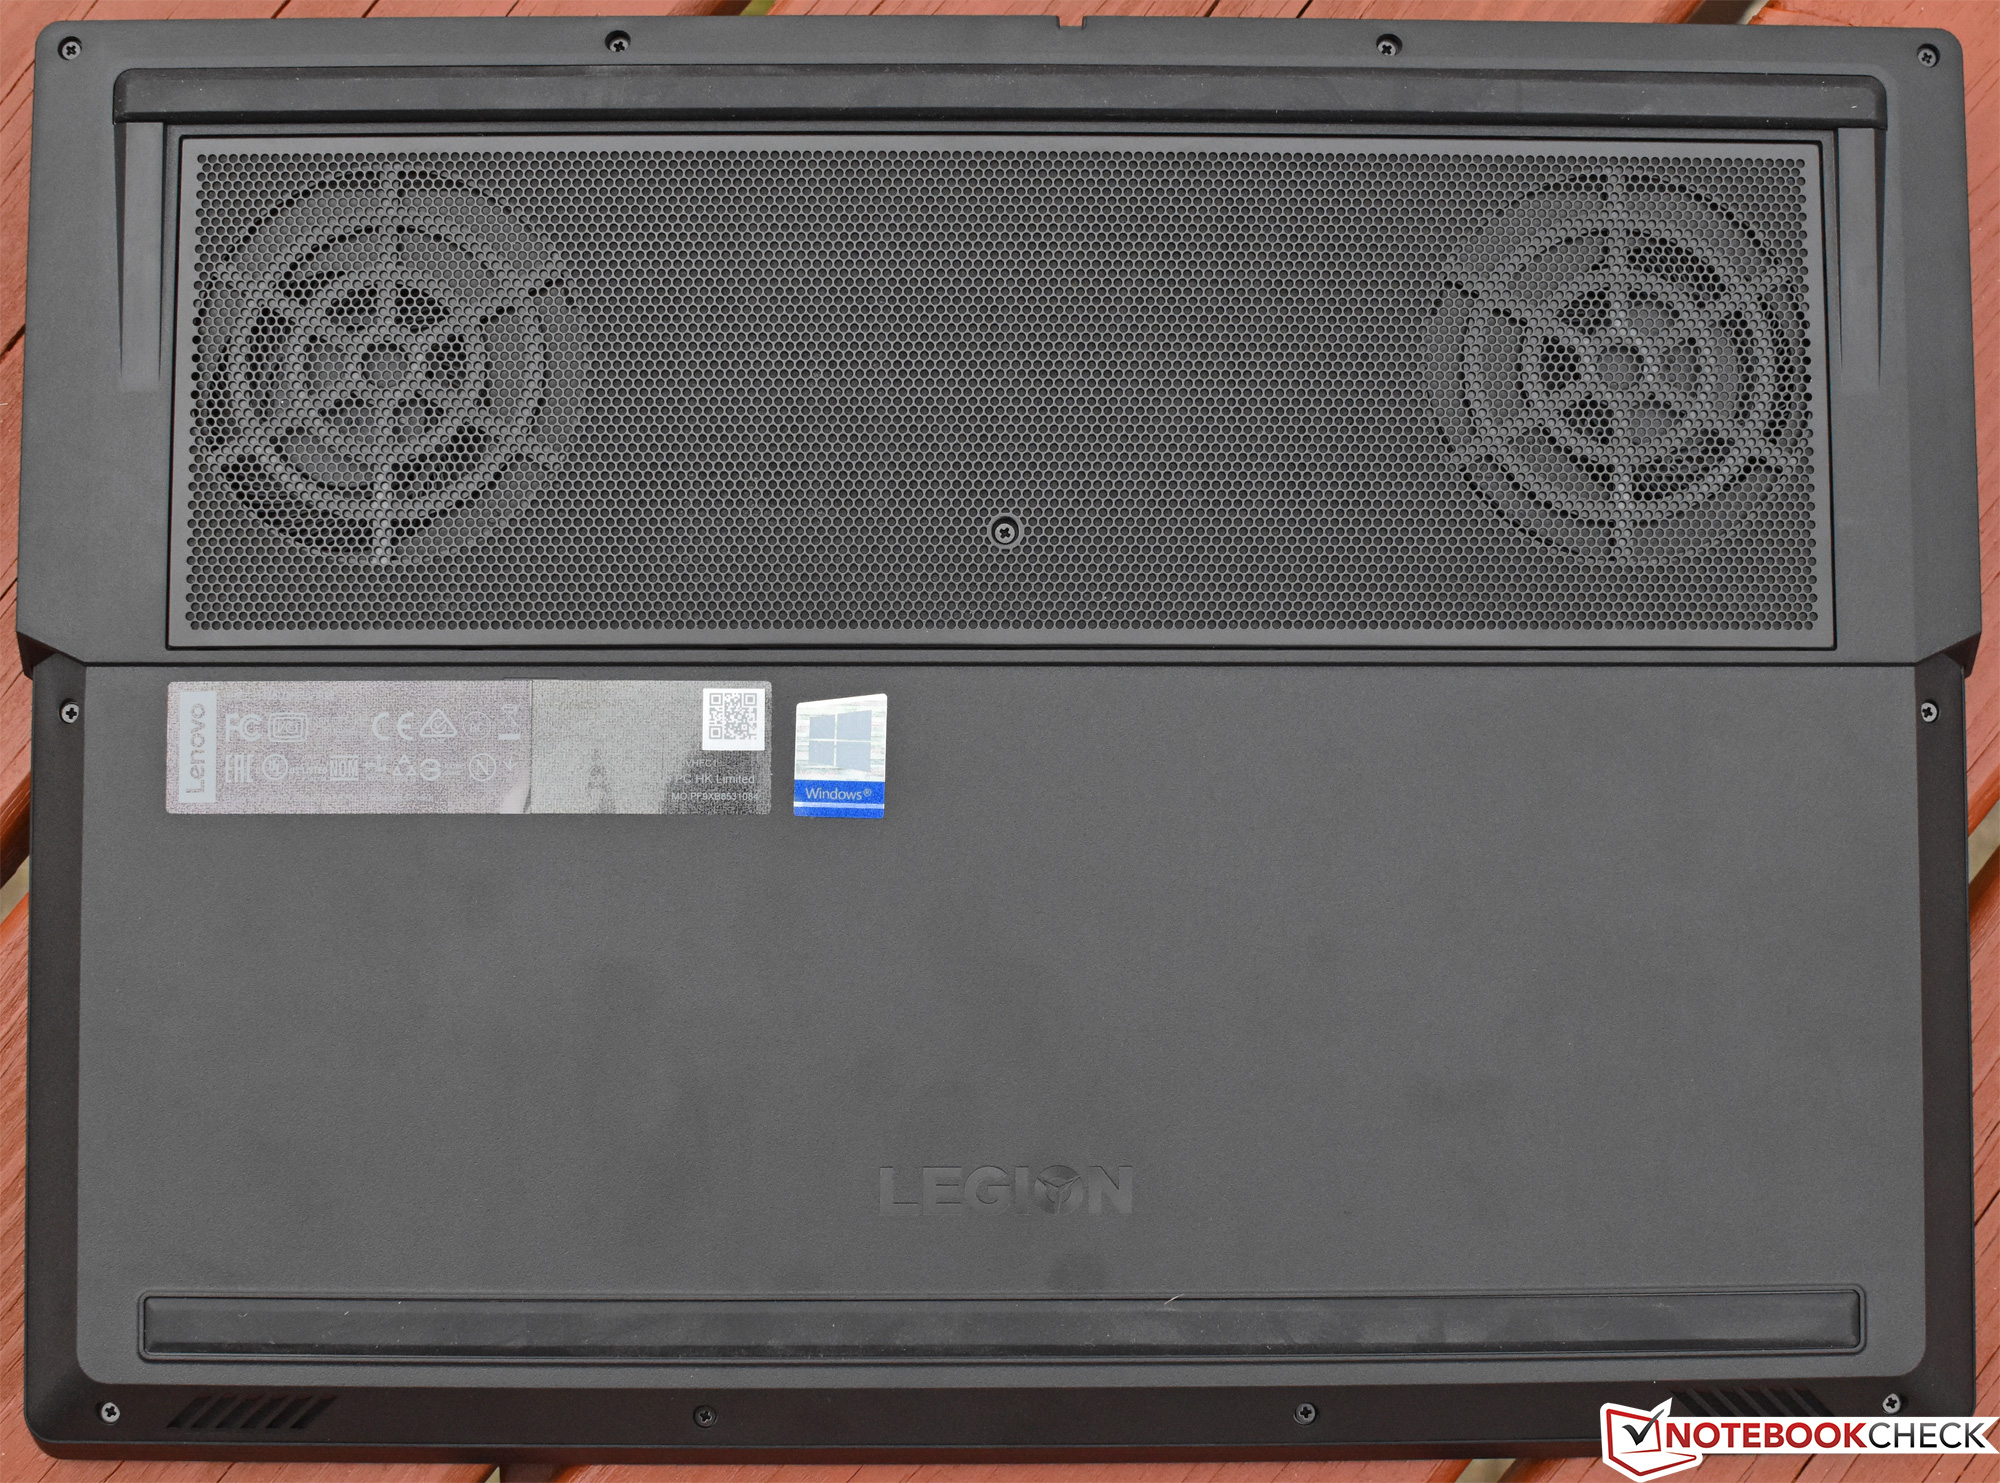
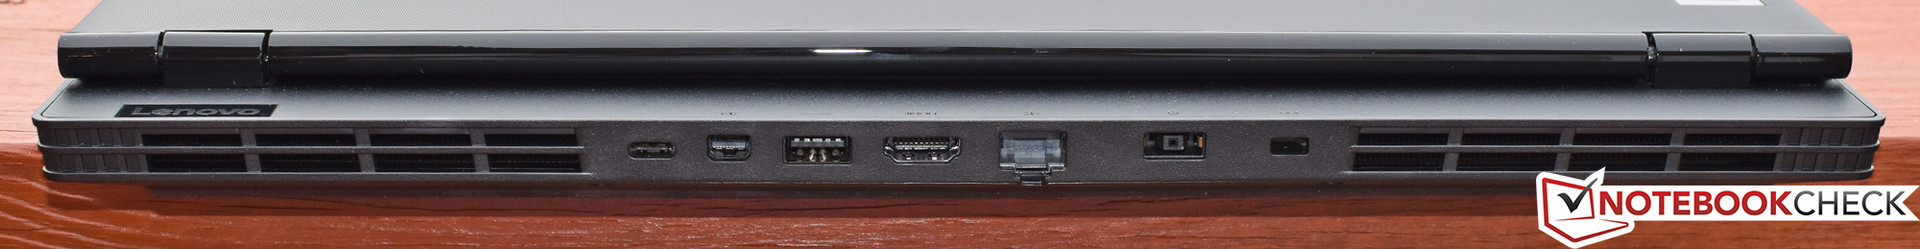
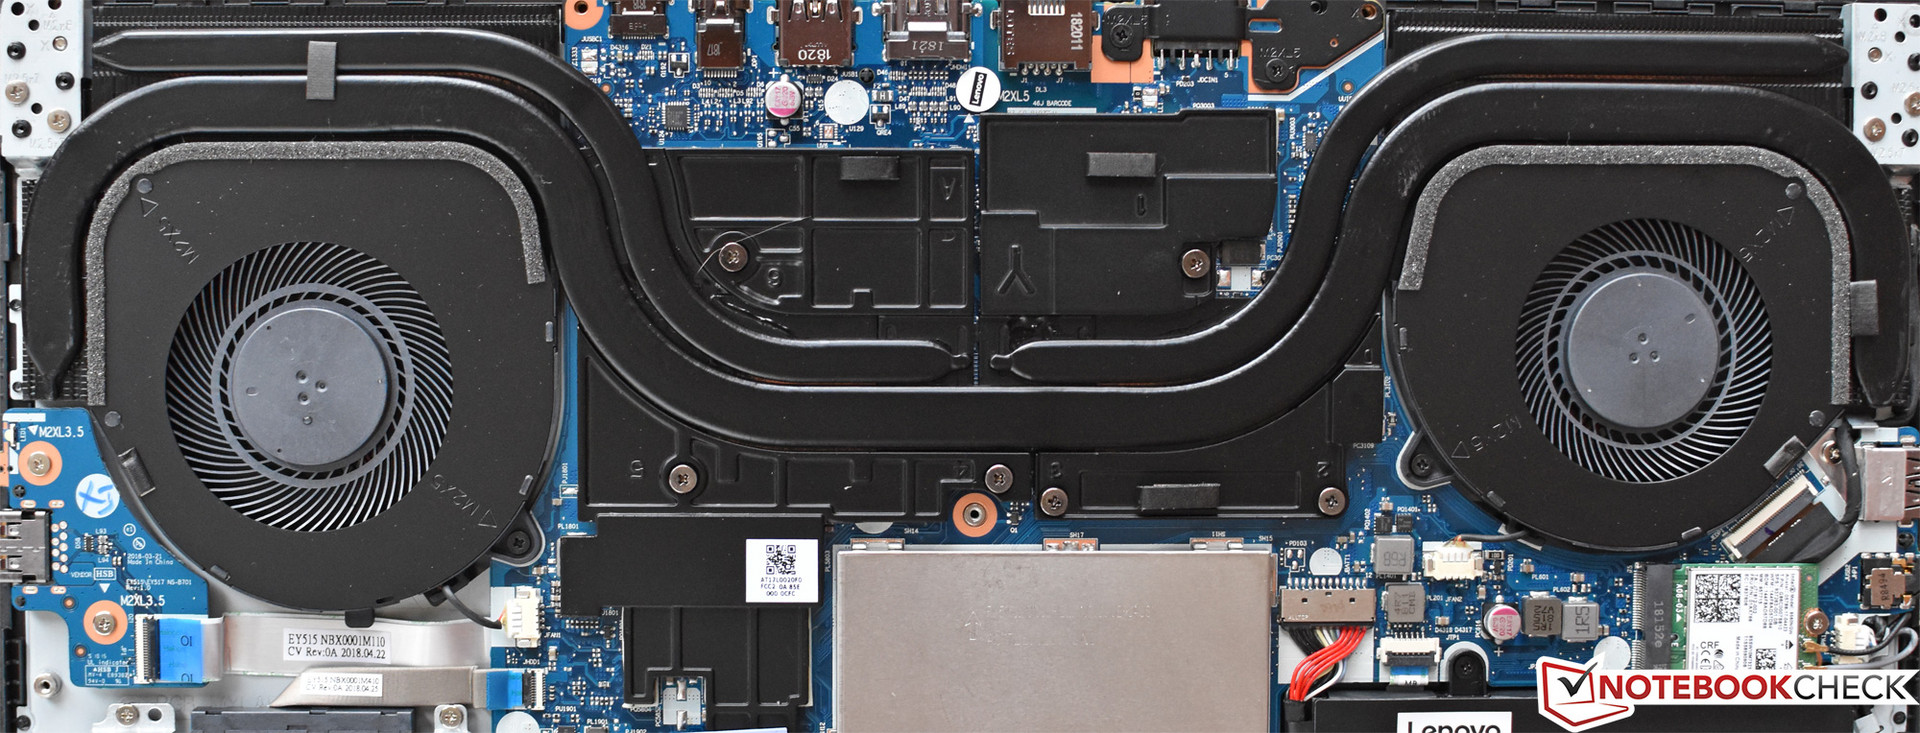
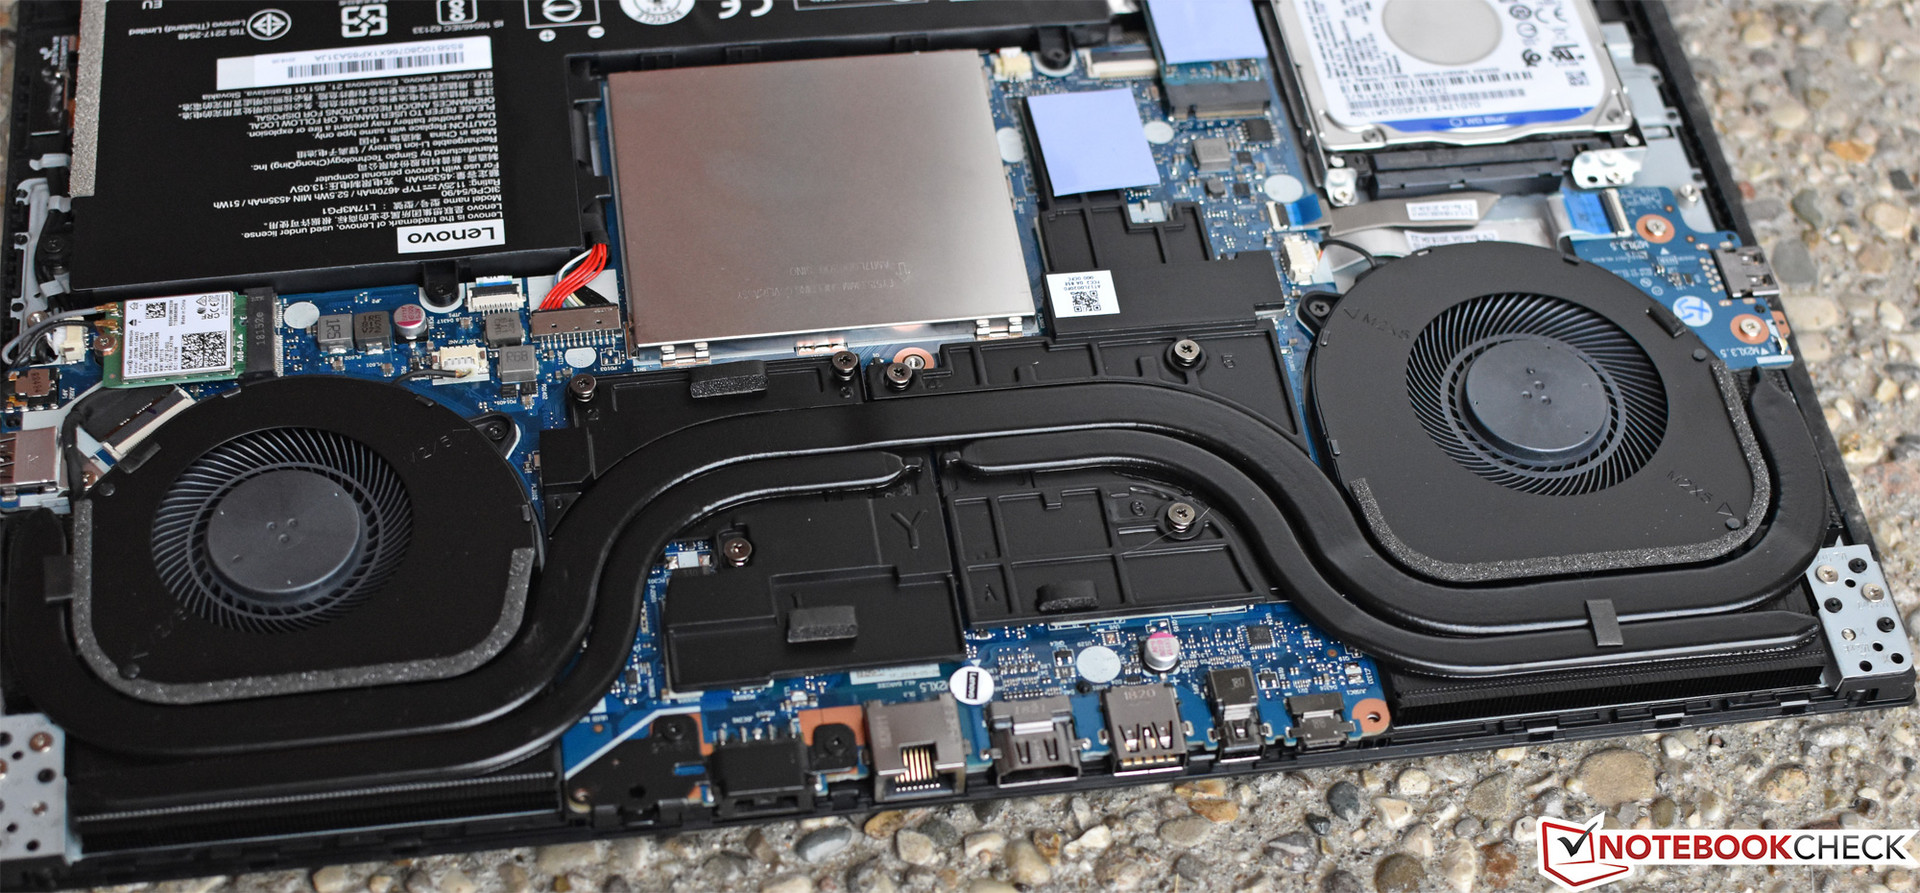
På tal om det är skärmen den första punkten på vår lista över klagomål. Den har inga riktiga fördelar jämfört med skärmen på den tidigare Y520-modellen - ljusstyrkan är aningen bättre men den har lägre kontrast och har samma sorgliga urvattnade färgåtergivning. Bortsett från det har dess Toshiba M.2 2242 NVMe SSD-enhet skrivhastigheter som till och med bleknar i jämförelse med en del SATA-enheter, och även om den här konfigurationen inkluderar dual-lagring (där en 1 TB HDD-enhet på 7200 RPM även ingår) så är det onödigt svårt att serva eller uppgradera datorn på grund av en aningen kinkig bottenlucka som känns som om den skulle gå sönder om man inte är extremt försiktig när man tar bort dom många spännena. På det stora hela känns plastkonstruktionen tillräckligt stabil, men den är onekligen av lägre kvalitet än motsvarigheterna som återfinns hos kategorins ledande modeller, för att inte tala om på dom extra lyxiga modellerna Dell XPS 15 och Razer Blade 15.
Den som har djupare fickor kan även vilja överväga dessa två alternativ, även om de båda har sina egna unika begränsningar: XPS är ganska dyr och Razer Blade får kämpa för att upprätthålla turbofrekvenser och blir dessutom ganska varm (bland annat). Men oavsett vilket laptop man köper är det en fråga om kompromisser, särskilt när det gäller portabla spelmaskiner. Och det är faktiskt så att om man kan se bortom den dåliga skärmen så passar det utbud av fördelar som Y530 har dom egenskaper man kan tänkas vara intresserad av inför sitt första köp av en spellaptop, eller kanske är den helt enkelt lämplig för den som vill ha en skapligt kapabel spelmaskin som inte ser ut som en spelmaskin.
Lenovo Legion Y530-15ICH
- 11/30/2018 v6 (old)
Steve Schardein
Price comparison
