Test: HP Envy 13 - En välavrundad subnotebook med bra funktioner (Sammanfattning)
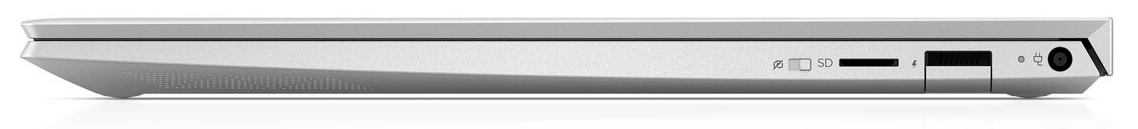
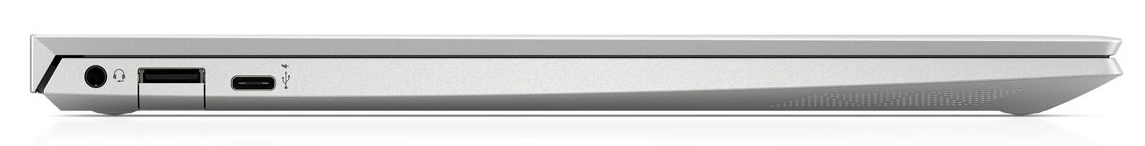
Port Selection
| SD Card Reader | |
| average JPG Copy Test (av. of 3 runs) | |
| HP Envy 13-ah0003ng (Toshiba Exceria Pro M501 microSDXC 64GB) | |
| HP Envy 13-aq0003ng (Toshiba Exceria Pro M501 microSDXC 64GB) | |
| Genomsnitt av klass Subnotebook (23.7 - 188, n=9, senaste 2 åren) | |
| Asus ZenBook S13 UX392FN (Toshiba Exceria Pro M501 64 GB UHS-II) | |
| maximum AS SSD Seq Read Test (1GB) | |
| Genomsnitt av klass Subnotebook (24.9 - 195, n=8, senaste 2 åren) | |
| HP Envy 13-ah0003ng (Toshiba Exceria Pro M501 microSDXC 64GB) | |
| Asus ZenBook S13 UX392FN (Toshiba Exceria Pro M501 64 GB UHS-II) | |
| HP Envy 13-aq0003ng (Toshiba Exceria Pro M501 microSDXC 64GB) | |
| Networking | |
| iperf3 transmit AX12 | |
| Lenovo IdeaPad 730S-13IWL 81JB0004US | |
| HP Envy 13-aq0003ng | |
| HP Envy 13-ah0003ng | |
| Asus ZenBook S13 UX392FN | |
| Lenovo Ideapad 720S-13ARR | |
| Lenovo Ideapad 720S-13ARR | |
| iperf3 receive AX12 | |
| Asus ZenBook S13 UX392FN | |
| Lenovo IdeaPad 730S-13IWL 81JB0004US | |
| HP Envy 13-aq0003ng | |
| HP Envy 13-ah0003ng | |
| Lenovo Ideapad 720S-13ARR | |
| Lenovo Ideapad 720S-13ARR | |
| |||||||||||||||||||||||||
Distribution av ljusstyrkan: 82 %
Mitt på batteriet: 733 cd/m²
Kontrast: 1600:1 (Svärta: 0.48 cd/m²)
ΔE ColorChecker Calman: 3.49 | ∀{0.5-29.43 Ø4.71}
calibrated: 2.07
ΔE Greyscale Calman: 4.09 | ∀{0.09-98 Ø4.96}
92% sRGB (Argyll 1.6.3 3D)
60% AdobeRGB 1998 (Argyll 1.6.3 3D)
65.2% AdobeRGB 1998 (Argyll 3D)
91.7% sRGB (Argyll 3D)
64.4% Display P3 (Argyll 3D)
Gamma: 2.54
CCT: 6452 K
| HP Envy 13-aq0003ng IPS, 1920x1080, 13.3" | HP Envy 13-ah0003ng IPS, 1920x1080, 13.3" | Asus ZenBook S13 UX392FN IPS, 1920x1080, 13.9" | Huawei MateBook 13 i7 IPS, 2160x1440, 13" | Lenovo IdeaPad 730S-13IWL 81JB0004US IPS, 1920x1080, 13.3" | Lenovo Ideapad 720S-13ARR IPS, 1920x1080, 13.3" | Lenovo Ideapad 720S-13ARR IPS, 1920x1080, 13.3" | |
|---|---|---|---|---|---|---|---|
| Display | -13% | 5% | 6% | 3% | -5% | -5% | |
| Display P3 Coverage (%) | 64.4 | 54.8 -15% | 67.5 5% | 68.1 6% | 65.6 2% | 65.1 1% | 65.2 1% |
| sRGB Coverage (%) | 91.7 | 82.5 -10% | 95.8 4% | 97.7 7% | 95.5 4% | 83.1 -9% | 83.3 -9% |
| AdobeRGB 1998 Coverage (%) | 65.2 | 56.6 -13% | 69 6% | 69.2 6% | 66.7 2% | 60.8 -7% | 60.9 -7% |
| Response Times | 0% | -28% | -36% | -101% | 9% | -12% | |
| Response Time Grey 50% / Grey 80% * (ms) | 31 ? | 31 ? -0% | 47.2 ? -52% | 43.2 ? -39% | 75.2 ? -143% | 31 ? -0% | 36 ? -16% |
| Response Time Black / White * (ms) | 24 ? | 24 ? -0% | 24.8 ? -3% | 32 ? -33% | 38 ? -58% | 20 ? 17% | 26 ? -8% |
| PWM Frequency (Hz) | 4000 ? | 1000 ? | 544 | 65000 ? | 128000 ? | ||
| Screen | 10% | 10% | -4% | -2% | -23% | -15% | |
| Brightness middle (cd/m²) | 768 | 289 -62% | 466 -39% | 366.6 -52% | 355.1 -54% | 324 -58% | 299 -61% |
| Brightness (cd/m²) | 778 | 310 -60% | 462 -41% | 360 -54% | 336 -57% | 293 -62% | 306 -61% |
| Brightness Distribution (%) | 82 | 85 4% | 90 10% | 93 13% | 83 1% | 78 -5% | 90 10% |
| Black Level * (cd/m²) | 0.48 | 0.23 52% | 0.33 31% | 0.39 19% | 0.32 33% | 0.32 33% | 0.27 44% |
| Contrast (:1) | 1600 | 1257 -21% | 1412 -12% | 940 -41% | 1110 -31% | 1013 -37% | 1107 -31% |
| Colorchecker dE 2000 * | 3.49 | 1.64 53% | 1.93 45% | 2.76 21% | 2.93 16% | 5.52 -58% | 4.46 -28% |
| Colorchecker dE 2000 max. * | 7.41 | 3.31 55% | 4.26 43% | 6.19 16% | 4.39 41% | 10.91 -47% | 10.51 -42% |
| Colorchecker dE 2000 calibrated * | 2.07 | 0.99 52% | 1.99 4% | 1.53 26% | 1.83 12% | ||
| Greyscale dE 2000 * | 4.09 | 1.71 58% | 1.7 58% | 4.2 -3% | 3.6 12% | 3.36 18% | 2.41 41% |
| Gamma | 2.54 87% | 2.32 95% | 2.15 102% | 2.22 99% | 2.071 106% | 2.23 99% | 2.29 96% |
| CCT | 6452 101% | 6291 103% | 6382 102% | 6271 104% | 7161 91% | 6687 97% | 6757 96% |
| Color Space (Percent of AdobeRGB 1998) (%) | 60 | 52 -13% | 62.2 4% | 63.2 5% | 61 2% | 55 -8% | 55 -8% |
| Color Space (Percent of sRGB) (%) | 92 | 82 -11% | 95.7 4% | 97.6 6% | 95 3% | 83 -10% | 83 -10% |
| Totalt genomsnitt (program/inställningar) | -1% /
4% | -4% /
4% | -11% /
-6% | -33% /
-13% | -6% /
-15% | -11% /
-12% |
* ... mindre är bättre
Visa svarstider
| ↔ Svarstid svart till vitt | ||
|---|---|---|
| 24 ms ... stiga ↗ och falla ↘ kombinerat | ↗ 14 ms stiga | 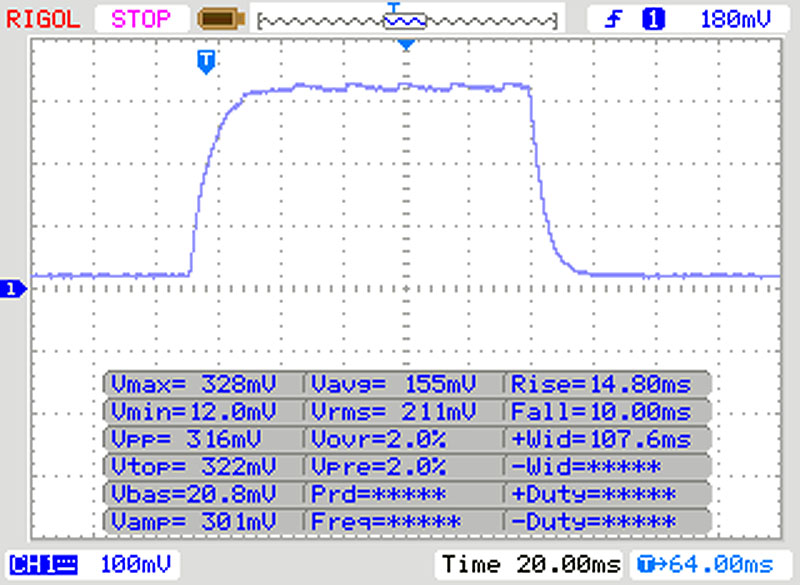 |
| ↘ 10 ms hösten | ||
| Skärmen visar bra svarsfrekvens i våra tester, men kan vara för långsam för konkurrenskraftiga spelare. I jämförelse sträcker sig alla testade enheter från 0.1 (minst) till 240 (maximalt) ms. » 54 % av alla enheter är bättre. Detta innebär att den uppmätta svarstiden är sämre än genomsnittet av alla testade enheter (19.8 ms). | ||
| ↔ Svarstid 50 % grått till 80 % grått | ||
| 31 ms ... stiga ↗ och falla ↘ kombinerat | ↗ 15 ms stiga | 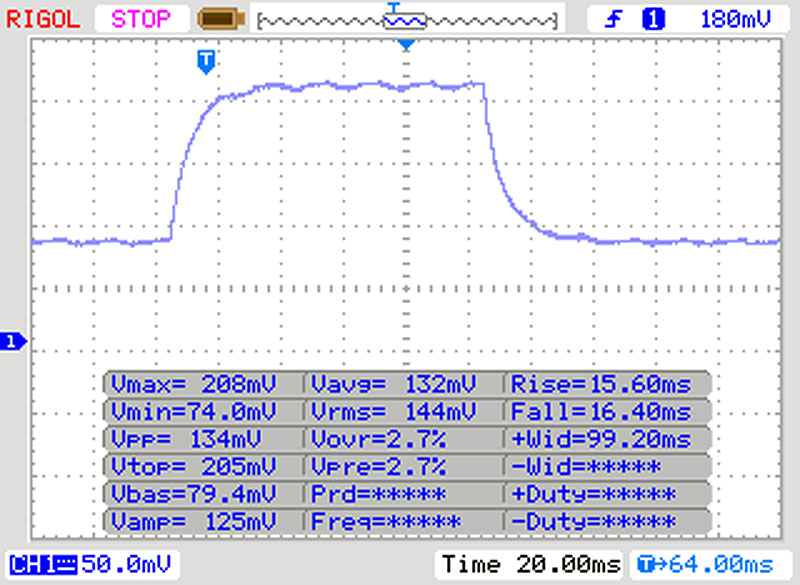 |
| ↘ 16 ms hösten | ||
| Skärmen visar långsamma svarsfrekvenser i våra tester och kommer att vara otillfredsställande för spelare. I jämförelse sträcker sig alla testade enheter från 0.165 (minst) till 636 (maximalt) ms. » 42 % av alla enheter är bättre. Det betyder att den uppmätta svarstiden liknar genomsnittet av alla testade enheter (31 ms). | ||
Skärmflimmer / PWM (Puls-Width Modulation)
| Skärmflimmer / PWM upptäckt | 4000 Hz | ≤ 90 % ljusstyrka inställning | 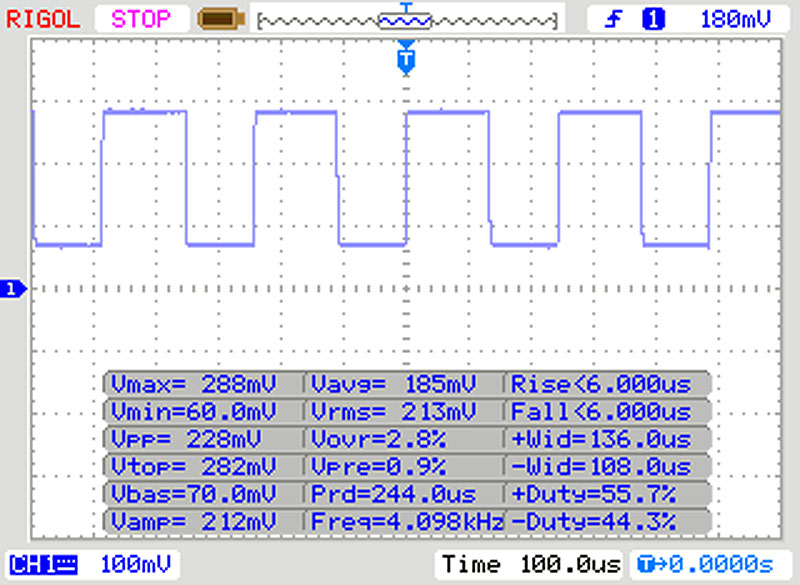 |
Displayens bakgrundsbelysning flimrar vid 4000 Hz (i värsta fall, t.ex. med PWM) Flimrande upptäckt vid en ljusstyrkeinställning på 90 % och lägre. Det ska inte finnas något flimmer eller PWM över denna ljusstyrkeinställning. Frekvensen för 4000 Hz är ganska hög, så de flesta användare som är känsliga för PWM bör inte märka något flimmer. Som jämförelse: 52 % av alla testade enheter använder inte PWM för att dämpa skärmen. Om PWM upptäcktes mättes ett medelvärde av 7754 (minst: 5 - maximum: 343500) Hz. | |||
| Cinebench R10 | |
| Rendering Single 32Bit | |
| Genomsnitt av klass Subnotebook (2299 - 10697, n=14, senaste 2 åren) | |
| Genomsnitt Intel Core i7-8565U (2682 - 8906, n=16) | |
| HP Envy 13-aq0003ng | |
| HP Envy 13-ah0003ng | |
| Lenovo Ideapad 720S-13ARR | |
| Rendering Multiple CPUs 32Bit | |
| Genomsnitt av klass Subnotebook (14395 - 51868, n=14, senaste 2 åren) | |
| Genomsnitt Intel Core i7-8565U (13806 - 23118, n=16) | |
| HP Envy 13-aq0003ng | |
| HP Envy 13-ah0003ng | |
| Lenovo Ideapad 720S-13ARR | |
| Geekbench 3 | |
| 32 Bit Multi-Core Score | |
| Genomsnitt av klass Subnotebook (n=1senaste 2 åren) | |
| Genomsnitt Intel Core i7-8565U (10521 - 13703, n=12) | |
| HP Envy 13-ah0003ng | |
| HP Envy 13-aq0003ng | |
| Lenovo Ideapad 720S-13ARR | |
| 32 Bit Single-Core Score | |
| Genomsnitt av klass Subnotebook (n=1senaste 2 åren) | |
| Genomsnitt Intel Core i7-8565U (3340 - 4820, n=12) | |
| HP Envy 13-ah0003ng | |
| HP Envy 13-aq0003ng | |
| Lenovo Ideapad 720S-13ARR | |
| Geekbench 4.4 | |
| 64 Bit Multi-Core Score | |
| Genomsnitt av klass Subnotebook (27854 - 45023, n=7, senaste 2 åren) | |
| HP Envy 13-ah0003ng | |
| Genomsnitt Intel Core i7-8565U (8142 - 16968, n=30) | |
| HP Envy 13-aq0003ng | |
| Lenovo Ideapad 720S-13ARR | |
| 64 Bit Single-Core Score | |
| Genomsnitt av klass Subnotebook (5976 - 8929, n=7, senaste 2 åren) | |
| Genomsnitt Intel Core i7-8565U (2357 - 5547, n=30) | |
| HP Envy 13-ah0003ng | |
| HP Envy 13-aq0003ng | |
| Lenovo Ideapad 720S-13ARR | |
| Mozilla Kraken 1.1 - Total | |
| Huawei MateBook 13 i7 (Edge 42.17134.1.0) | |
| Lenovo IdeaPad 730S-13IWL 81JB0004US (Microsoft Edge 44.17763.1.0) | |
| HP Envy 13-aq0003ng (Edge 44) | |
| Lenovo Ideapad 720S-13ARR | |
| HP Envy 13-ah0003ng (Edge 42) | |
| Genomsnitt Intel Core i7-8565U (730 - 2622, n=43) | |
| Asus ZenBook S13 UX392FN (Edge 44.17763.1.0) | |
| Genomsnitt av klass Subnotebook (234 - 1104, n=61, senaste 2 åren) | |
| Octane V2 - Total Score | |
| Genomsnitt av klass Subnotebook (35801 - 142020, n=28, senaste 2 åren) | |
| Asus ZenBook S13 UX392FN (Edge 44.17763.1.0) | |
| Genomsnitt Intel Core i7-8565U (13935 - 49795, n=42) | |
| HP Envy 13-aq0003ng (Edge 44) | |
| HP Envy 13-ah0003ng (Edge 42) | |
| Lenovo IdeaPad 730S-13IWL 81JB0004US (Microsoft Edge 44.17763.1.0) | |
| Huawei MateBook 13 i7 (Edge 42.17134.1.0) | |
| Lenovo Ideapad 720S-13ARR | |
| JetStream 1.1 - 1.1 Total | |
| Asus ZenBook S13 UX392FN (Edge 44.17763.1.0) | |
| Lenovo IdeaPad 730S-13IWL 81JB0004US (Microsoft Edge 44.17763.1.0) | |
| Genomsnitt Intel Core i7-8565U (107.6 - 277, n=37) | |
| HP Envy 13-aq0003ng (Edge 44) | |
| HP Envy 13-ah0003ng (Edge 42) | |
| Genomsnitt av klass Subnotebook (n=1senaste 2 åren) | |
| Huawei MateBook 13 i7 (Edge 42.17134.1.0) | |
| Lenovo Ideapad 720S-13ARR (Edge 42) | |
| Lenovo Ideapad 720S-13ARR | |
* ... mindre är bättre
| PCMark 8 Home Score Accelerated v2 | 3331 poäng | |
| PCMark 8 Creative Score Accelerated v2 | 3378 poäng | |
| PCMark 8 Work Score Accelerated v2 | 4922 poäng | |
| PCMark 10 Score | 3882 poäng | |
Hjälp | ||

| HP Envy 13-aq0003ng Toshiba KBG30ZMV512G | HP Envy 13-ah0003ng SK Hynix BC501 HFM512GDJTNG | Asus ZenBook S13 UX392FN WDC PC SN520 SDAPNUW-512G | Huawei MateBook 13 i7 Samsung SSD PM981 MZVLB512HAJQ | Lenovo IdeaPad 730S-13IWL 81JB0004US Samsung SSD PM981 MZVLB256HAHQ | Lenovo Ideapad 720S-13ARR Samsung PM961 MZVLW256HEHP | Lenovo Ideapad 720S-13ARR Samsung PM961 NVMe MZVLW128HEGR | Genomsnitt Toshiba KBG30ZMV512G | Genomsnitt av klass Subnotebook | |
|---|---|---|---|---|---|---|---|---|---|
| CrystalDiskMark 5.2 / 6 | 3% | 58% | 97% | 44% | 25% | 23% | 6% | 197% | |
| Write 4K (MB/s) | 106.2 | 112.9 6% | 149.2 40% | 159.4 50% | 117 10% | 87.5 -18% | 127 20% | 93.8 ? -12% | 150.7 ? 42% |
| Read 4K (MB/s) | 44.89 | 38.69 -14% | 47.18 5% | 47.31 5% | 40.65 -9% | 31.39 -30% | 42.21 -6% | 44.6 ? -1% | 63.8 ? 42% |
| Write Seq (MB/s) | 639 | 654 2% | 750 17% | 1899 197% | 1456 128% | 1281 100% | 781 22% | 695 ? 9% | 2836 ? 344% |
| Read Seq (MB/s) | 849 | 642 -24% | 1137 34% | 2173 156% | 1181 39% | 1453 71% | 1552 83% | 990 ? 17% | 3298 ? 288% |
| Write 4K Q32T1 (MB/s) | 217.4 | 305.9 41% | 749 245% | 368.1 69% | 232.3 7% | 169.4 -22% | 189.6 -13% | 228 ? 5% | 434 ? 100% |
| Read 4K Q32T1 (MB/s) | 322.1 | 351.6 9% | 478.7 49% | 526 63% | 311.3 -3% | 241.8 -25% | 312.5 -3% | 424 ? 32% | 500 ? 55% |
| Write Seq Q32T1 (MB/s) | 865 | 869 0% | 1453 68% | 1914 121% | 1463 69% | 1337 55% | 783 -9% | 821 ? -5% | 4701 ? 443% |
| Read Seq Q32T1 (MB/s) | 1630 | 1683 3% | 1713 5% | 3487 114% | 3480 113% | 2786 71% | 3079 89% | 1615 ? -1% | 5866 ? 260% |
| 3DMark 11 Performance | 3978 poäng | |
| 3DMark Ice Storm Standard Score | 83688 poäng | |
| 3DMark Cloud Gate Standard Score | 14231 poäng | |
| 3DMark Fire Strike Score | 2773 poäng | |
| 3DMark Time Spy Score | 1000 poäng | |
Hjälp | ||
| 3DMark 11 - 1280x720 Performance GPU | |
| Genomsnitt av klass Subnotebook (995 - 18489, n=55, senaste 2 åren) | |
| Lenovo IdeaPad S540-14IWL | |
| Acer Aspire 5 A515-52G-723L | |
| Huawei MateBook 13 i7 | |
| Genomsnitt NVIDIA GeForce MX250 (3585 - 4942, n=29) | |
| Lenovo ThinkPad T590-20N4002VGE | |
| HP Envy 13-aq0003ng | |
| Acer Swift 3 SF314-55G-768V | |
| Asus ZenBook S13 UX392FN | |
| HP Envy 13-ah0003ng | |
| Lenovo Ideapad 720S-13ARR | |
| Lenovo IdeaPad 730S-13IWL 81JB0004US | |
| Lenovo Ideapad 720S-13ARR | |
| låg | med. | hög | ultra | |
|---|---|---|---|---|
| BioShock Infinite (2013) | 179.1 | 99.4 | 86.6 | 32.9 |
| The Witcher 3 (2015) | 59.2 | 32.9 | 18.3 | 10.6 |
| Battlefield V (2018) | 36.2 | 19.9 | 15.8 | 14 |
| Apex Legends (2019) | 59 | 25.6 | 19.6 | 19 |
| Far Cry New Dawn (2019) | 40 | 20 | 18 | 16 |
| Anthem (2019) | 15.4 | 10.7 | 8.5 | 5.1 |
| Dirt Rally 2.0 (2019) | 81.4 | 28.6 | 22.2 | 10.6 |
| The Division 2 (2019) | 48 | 20 | 14 | 8 |
| Anno 1800 (2019) | 56.3 | 22.7 | 13.8 | 7.7 |
| Rage 2 (2019) | 30.6 | 14.2 | 11.1 | 9.6 |
| Total War: Three Kingdoms (2019) | 71.2 | 19.8 | 9.9 | 6.2 |
| F1 2019 (2019) | 73 | 31 | 27 | 17 |
| BioShock Infinite - 1366x768 High Preset | |
| Lenovo ThinkPad T590-20N4002VGE | |
| Lenovo IdeaPad S540-14IWL | |
| Acer Aspire 5 A515-52G-723L | |
| Genomsnitt NVIDIA GeForce MX250 (84 - 100.5, n=14) | |
| Huawei MateBook 13 i7 | |
| HP Envy 13-aq0003ng | |
| Acer Swift 3 SF314-55G-768V | |
| Asus ZenBook S13 UX392FN | |
| HP Envy 13-ah0003ng | |
| Lenovo IdeaPad 730S-13IWL 81JB0004US | |
| Lenovo Ideapad 720S-13ARR | |
| The Witcher 3 - 1024x768 Low Graphics & Postprocessing | |
| Genomsnitt av klass Subnotebook (38.8 - 176, n=12, senaste 2 åren) | |
| Huawei MateBook 13 i7 | |
| Acer Aspire 5 A515-52G-723L | |
| Genomsnitt NVIDIA GeForce MX250 (47.4 - 70, n=24) | |
| HP Envy 13-aq0003ng | |
| Acer Swift 3 SF314-55G-768V | |
| Asus ZenBook S13 UX392FN | |
| Lenovo ThinkPad T590-20N4002VGE | |
| Lenovo IdeaPad S540-14IWL | |
| HP Envy 13-ah0003ng | |
| Apex Legends - 1280x720 Minimum Settings | |
| HP Envy 13-aq0003ng | |
| Genomsnitt NVIDIA GeForce MX250 (57 - 59, n=2) | |
| Acer Aspire 5 A515-52G-723L | |
| F1 2019 - 1280x720 Ultra Low Preset | |
| HP Envy 13-aq0003ng | |
| Genomsnitt NVIDIA GeForce MX250 (66 - 73, n=2) | |
| Lenovo IdeaPad S540-14IWL | |
| Total War: Three Kingdoms - 1280x720 Low (incl textures) | |
| Genomsnitt NVIDIA GeForce MX250 (71.2 - 78.2, n=2) | |
| HP Envy 13-aq0003ng | |
| Dirt Rally 2.0 - 1280x720 Ultra Low Preset AF:2x | |
| Acer Aspire 5 A515-52G-723L | |
| Genomsnitt NVIDIA GeForce MX250 (81.4 - 89.7, n=2) | |
| HP Envy 13-aq0003ng | |
| The Division 2 - 1280x720 Low Preset (100% Res. Scale) | |
| HP Envy 13-aq0003ng | |
| Genomsnitt NVIDIA GeForce MX250 (46 - 48, n=2) | |
| Acer Aspire 5 A515-52G-723L | |
Ljudnivå
| Låg belastning |
| 30 / 30 / 30 dB(A) |
| Hög belastning |
| / 39.5 dB(A) |
 | ||
30 dB tyst 40 dB(A) hörbar 50 dB(A) högt ljud |
||
min: | ||
(±) Den maximala temperaturen på ovansidan är 41 °C / 106 F, jämfört med genomsnittet av 35.9 °C / 97 F , allt från 21.4 till 59 °C för klassen Subnotebook.
(±) Botten värms upp till maximalt 42.9 °C / 109 F, jämfört med genomsnittet av 39.2 °C / 103 F
(+) Vid tomgångsbruk är medeltemperaturen för ovansidan 28.2 °C / 83 F, jämfört med enhetsgenomsnittet på 30.8 °C / ### class_avg_f### F.
(+) Handledsstöden och pekplattan når maximal hudtemperatur (32.7 °C / 90.9 F) och är därför inte varma.
(-) Medeltemperaturen för handledsstödsområdet på liknande enheter var 28.2 °C / 82.8 F (-4.5 °C / -8.1 F).
HP Envy 13-aq0003ng ljudanalys
(±) | högtalarljudstyrkan är genomsnittlig men bra (73 dB)
Bas 100 - 315 Hz
(-) | nästan ingen bas - i genomsnitt 18% lägre än medianen
(±) | linjäriteten för basen är genomsnittlig (11.8% delta till föregående frekvens)
Mellan 400 - 2000 Hz
(+) | balanserad mellan - endast 1.9% från medianen
(+) | mids är linjära (4.4% delta till föregående frekvens)
Högsta 2 - 16 kHz
(+) | balanserade toppar - endast 2.2% från medianen
(+) | toppar är linjära (6.1% delta till föregående frekvens)
Totalt 100 - 16 000 Hz
(±) | linjäriteten för det totala ljudet är genomsnittlig (15.1% skillnad mot median)
Jämfört med samma klass
» 33% av alla testade enheter i den här klassen var bättre, 5% liknande, 62% sämre
» Den bästa hade ett delta på 5%, genomsnittet var 18%, sämst var 53%
Jämfört med alla testade enheter
» 21% av alla testade enheter var bättre, 4% liknande, 75% sämre
» Den bästa hade ett delta på 4%, genomsnittet var 23%, sämst var 134%
Asus ZenBook S13 UX392FN ljudanalys
(±) | högtalarljudstyrkan är genomsnittlig men bra (74.1 dB)
Bas 100 - 315 Hz
(±) | reducerad bas - i genomsnitt 10.9% lägre än medianen
(±) | linjäriteten för basen är genomsnittlig (12% delta till föregående frekvens)
Mellan 400 - 2000 Hz
(±) | högre mellan - i genomsnitt 6.4% högre än median
(±) | linjäriteten för mids är genomsnittlig (8.4% delta till föregående frekvens)
Högsta 2 - 16 kHz
(+) | balanserade toppar - endast 2.3% från medianen
(±) | linjäriteten för toppar är genomsnittlig (7.6% delta till föregående frekvens)
Totalt 100 - 16 000 Hz
(±) | linjäriteten för det totala ljudet är genomsnittlig (21.9% skillnad mot median)
Jämfört med samma klass
» 74% av alla testade enheter i den här klassen var bättre, 6% liknande, 20% sämre
» Den bästa hade ett delta på 5%, genomsnittet var 18%, sämst var 53%
Jämfört med alla testade enheter
» 63% av alla testade enheter var bättre, 7% liknande, 30% sämre
» Den bästa hade ett delta på 4%, genomsnittet var 23%, sämst var 134%
| Av/Standby | |
| Låg belastning | |
| Hög belastning |
|
Förklaring:
min: | |
| Battery Runtime - WiFi Websurfing | |
| Genomsnitt av klass Subnotebook (7.25 - 26.4, n=60, senaste 2 åren) | |
| Lenovo IdeaPad 730S-13IWL 81JB0004US | |
| HP Envy 13-aq0003ng | |
| Asus ZenBook S13 UX392FN | |
| HP Envy 13-ah0003ng | |
| Huawei MateBook 13 i7 | |
| Lenovo Ideapad 720S-13ARR | |
| Lenovo Ideapad 720S-13ARR | |
För
Emot
Läs den fullständiga versionen av den här recensionen på engelska här.
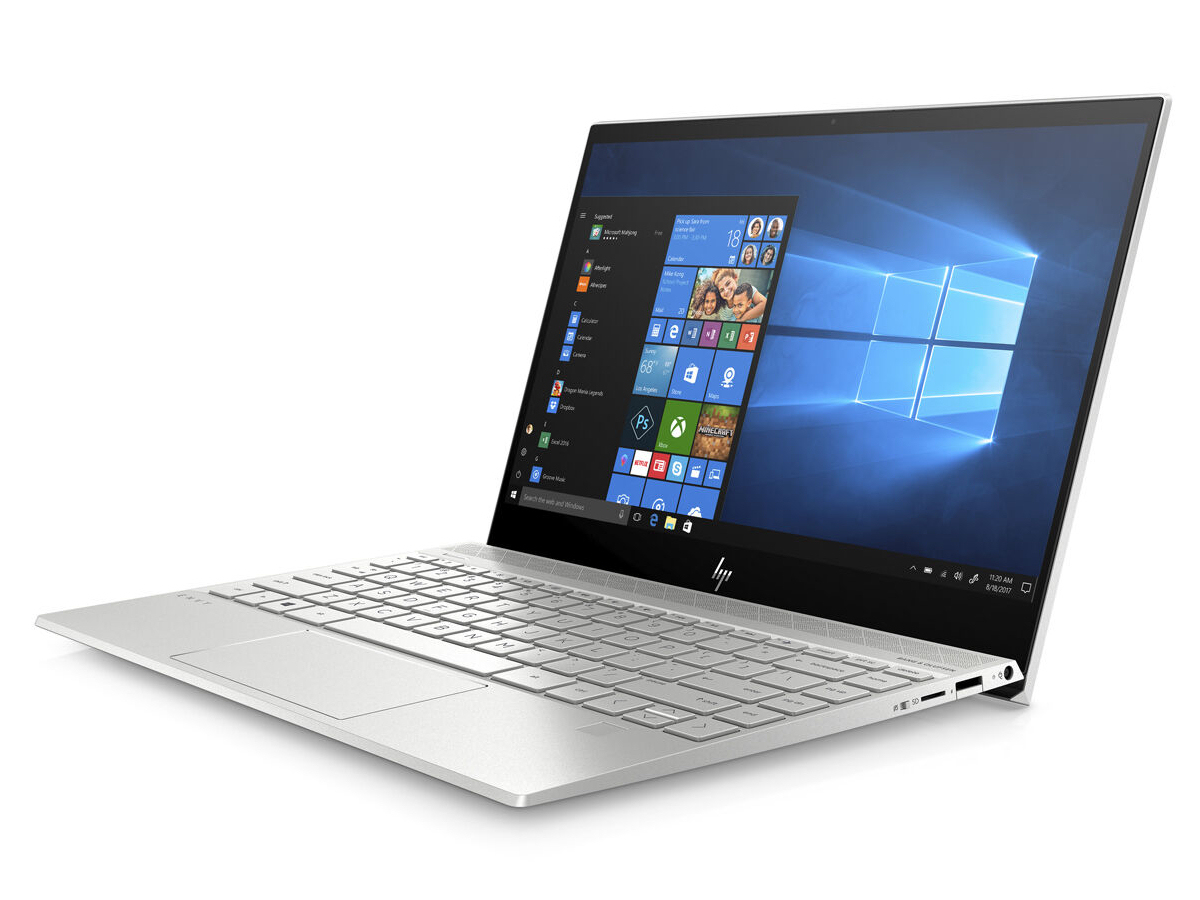
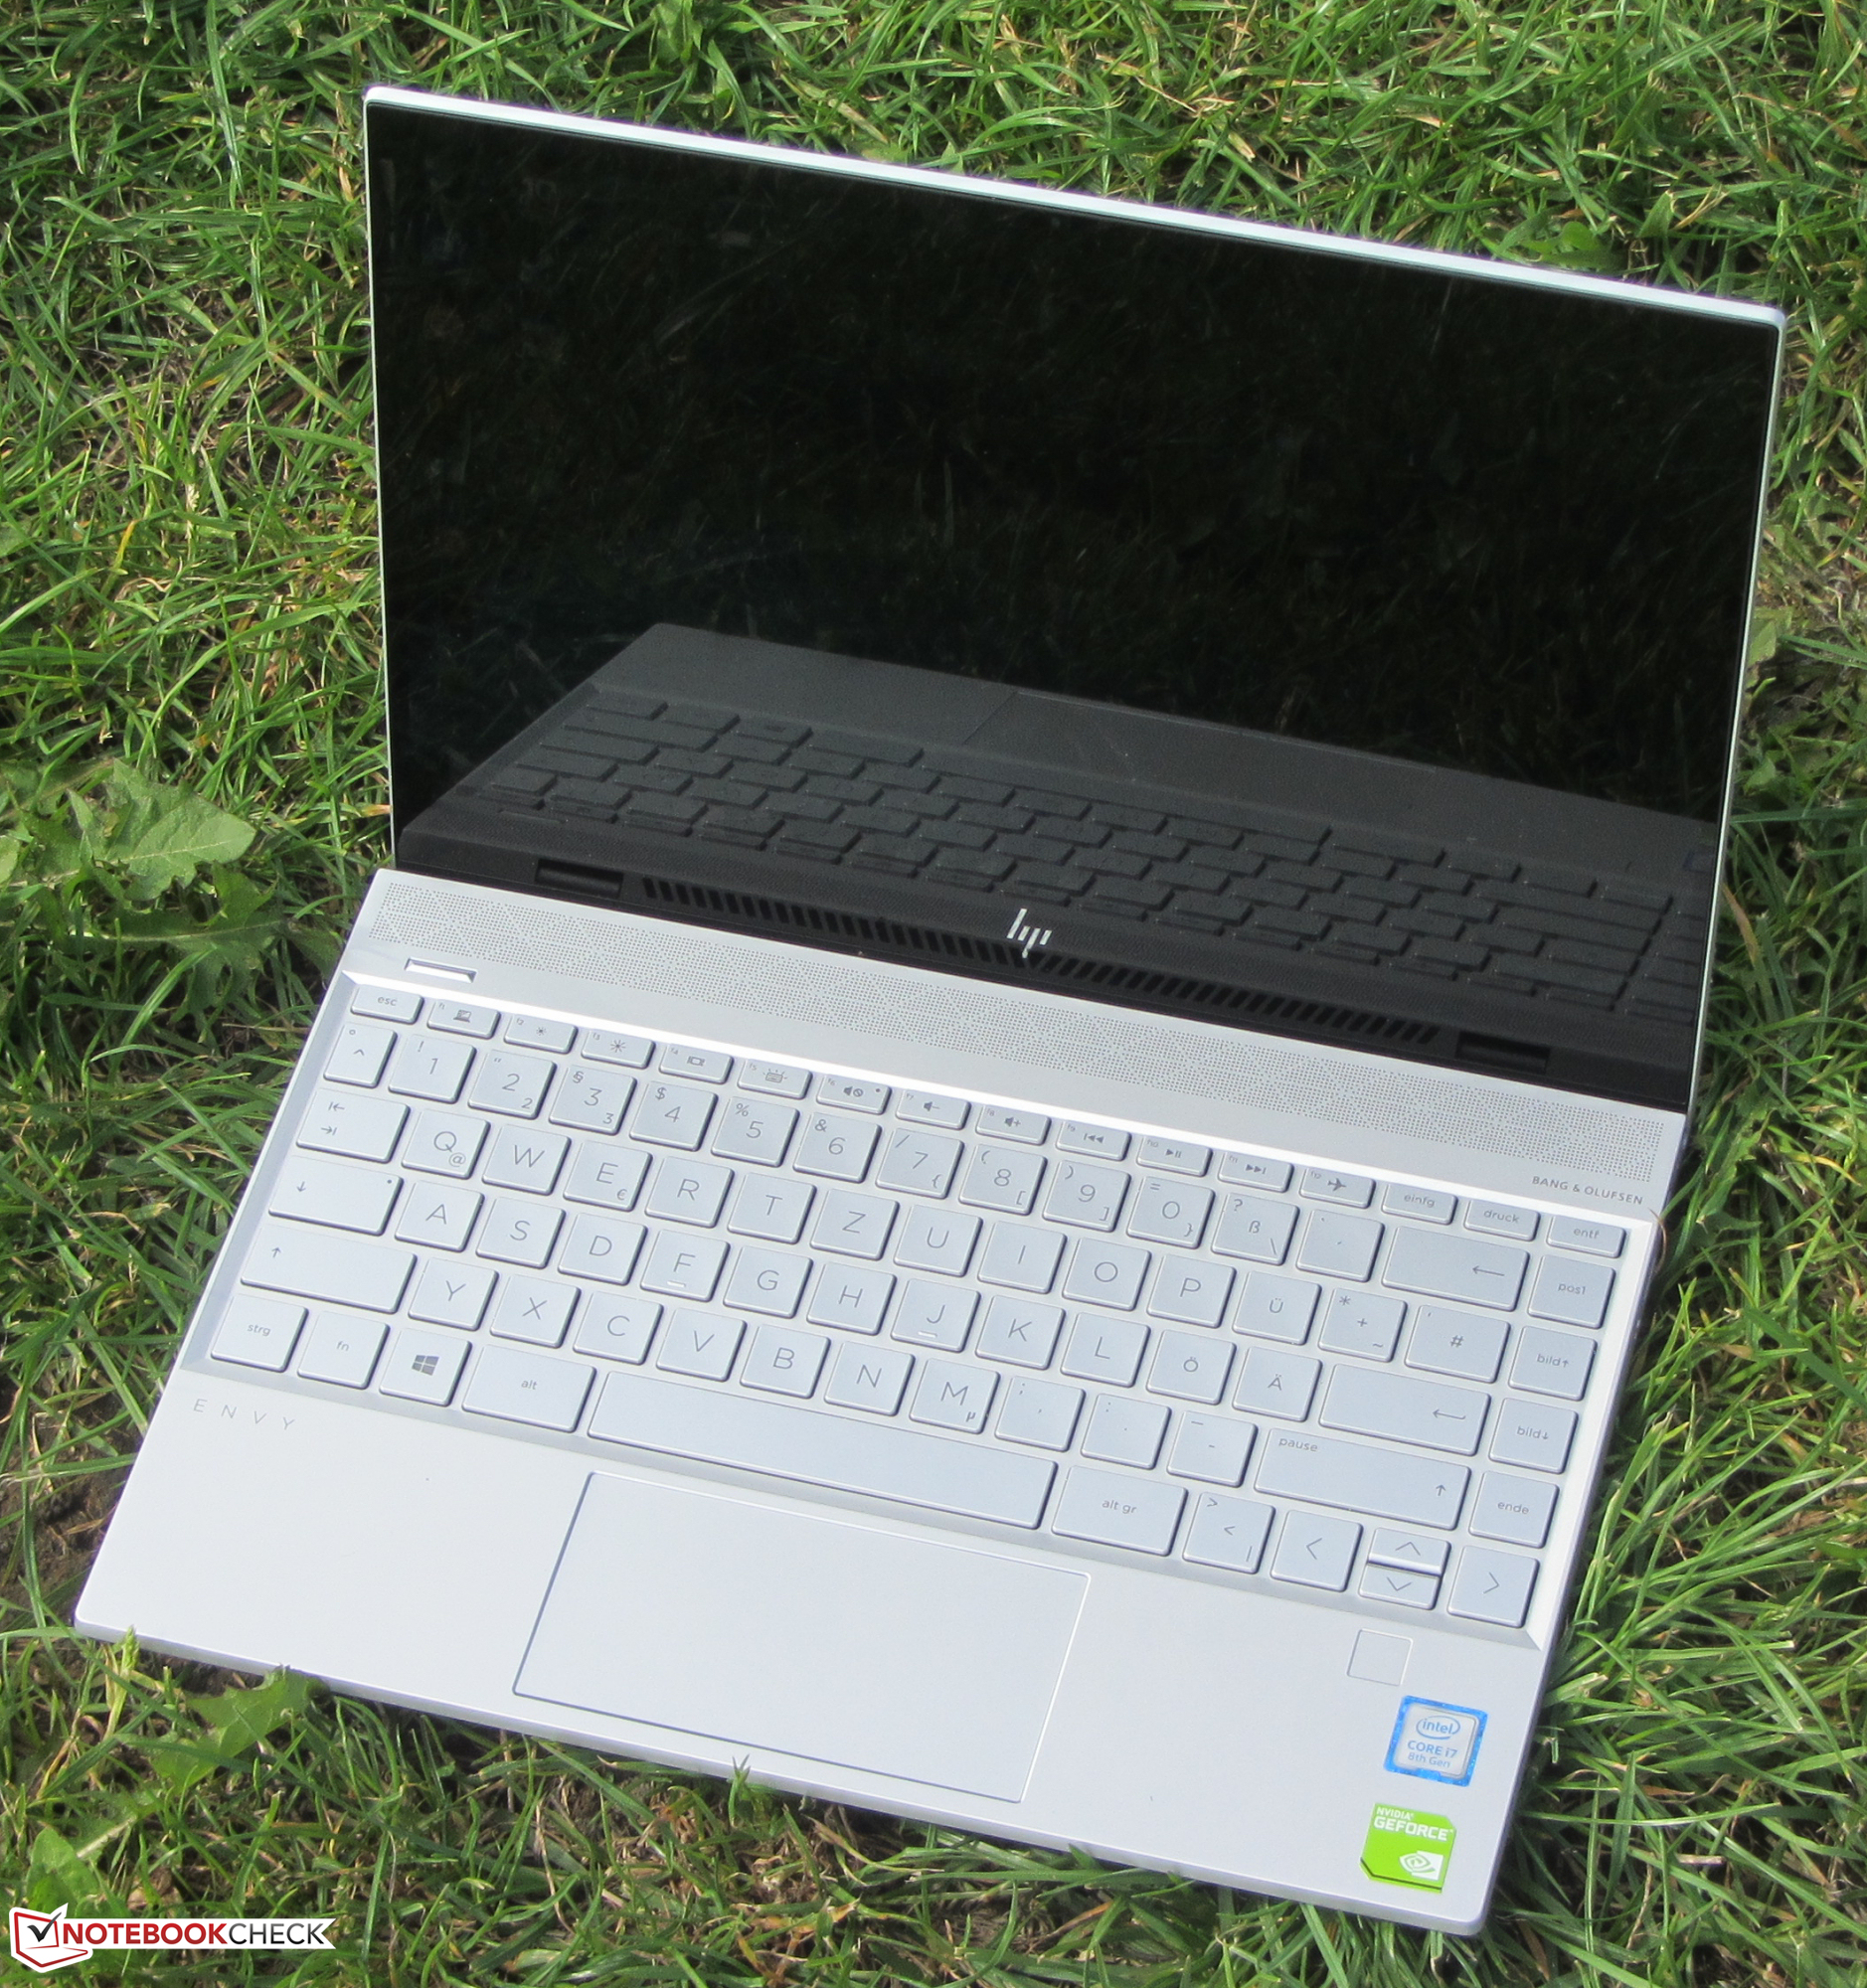
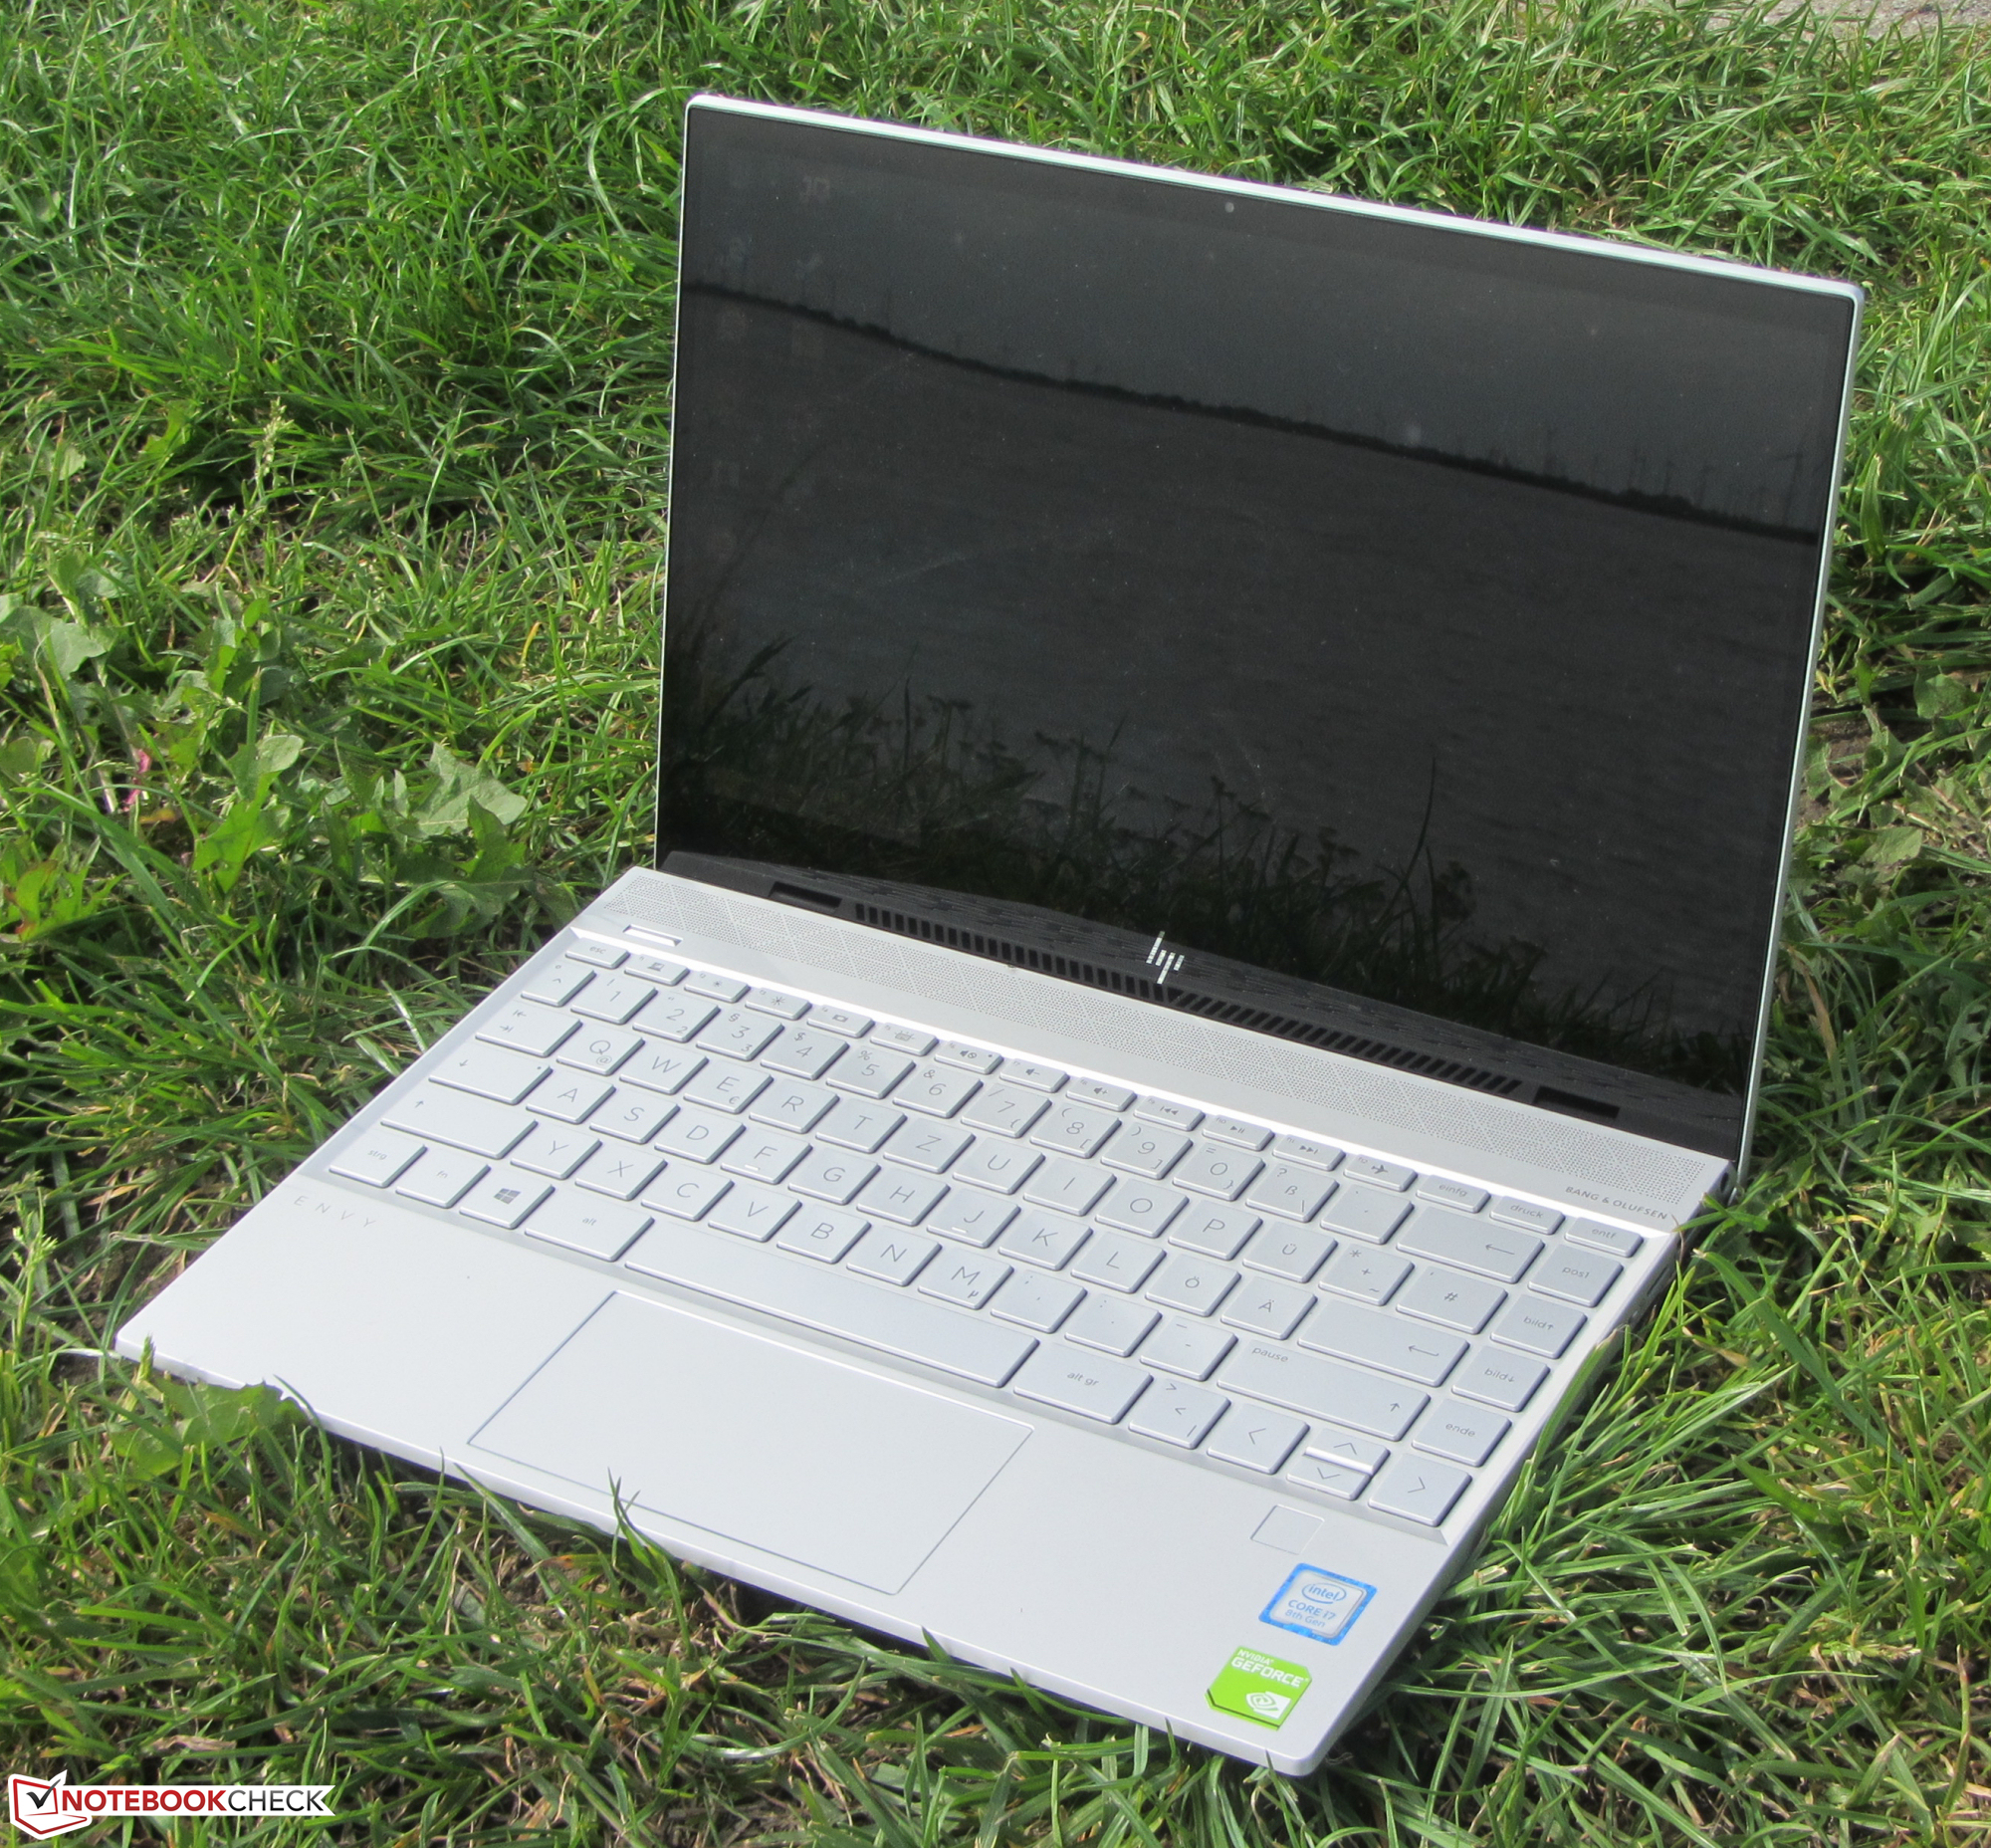
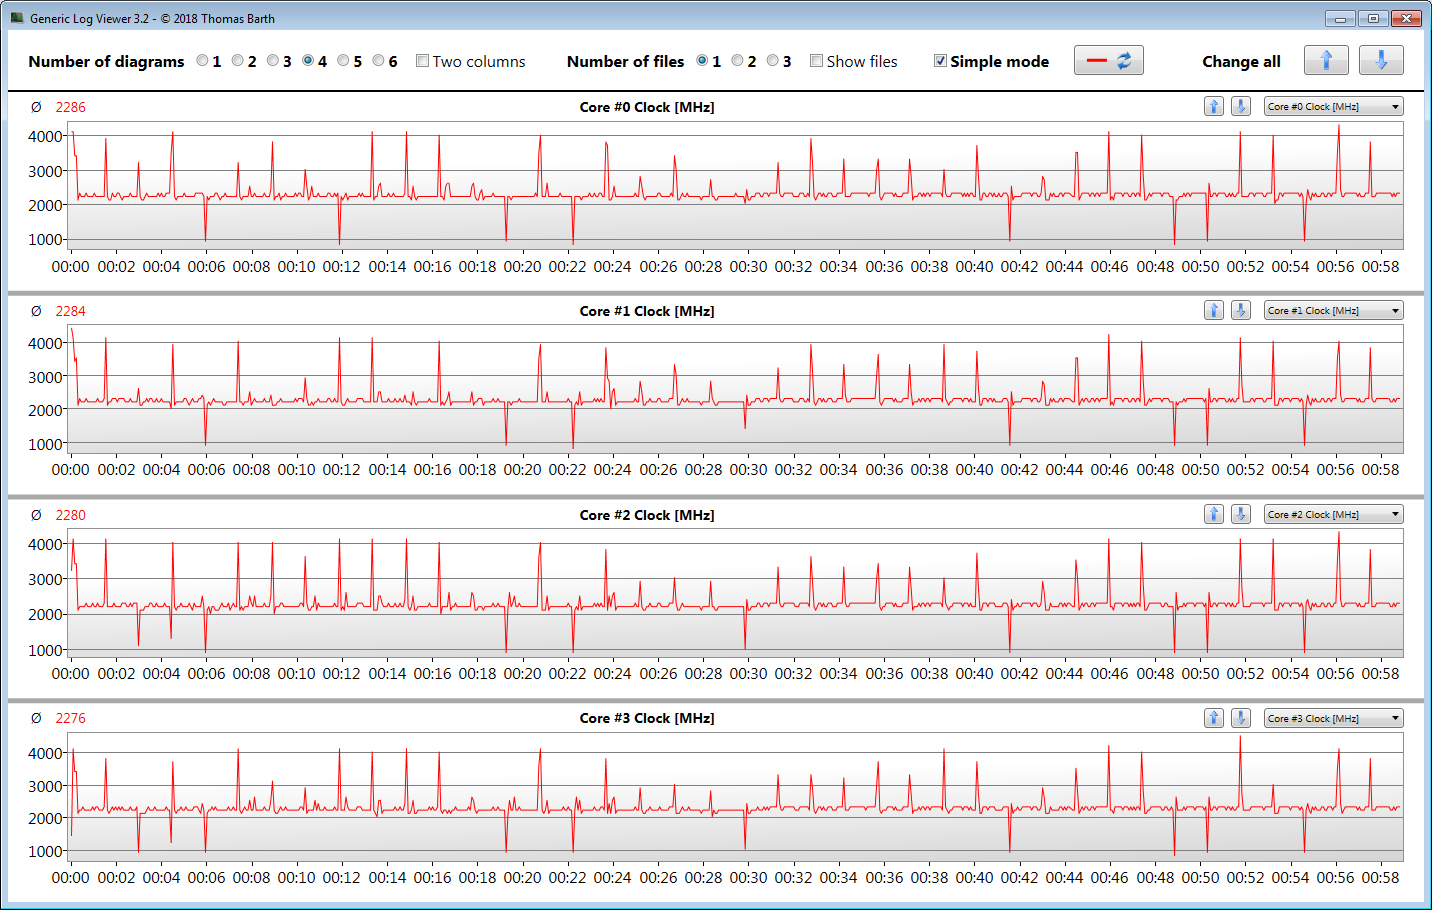
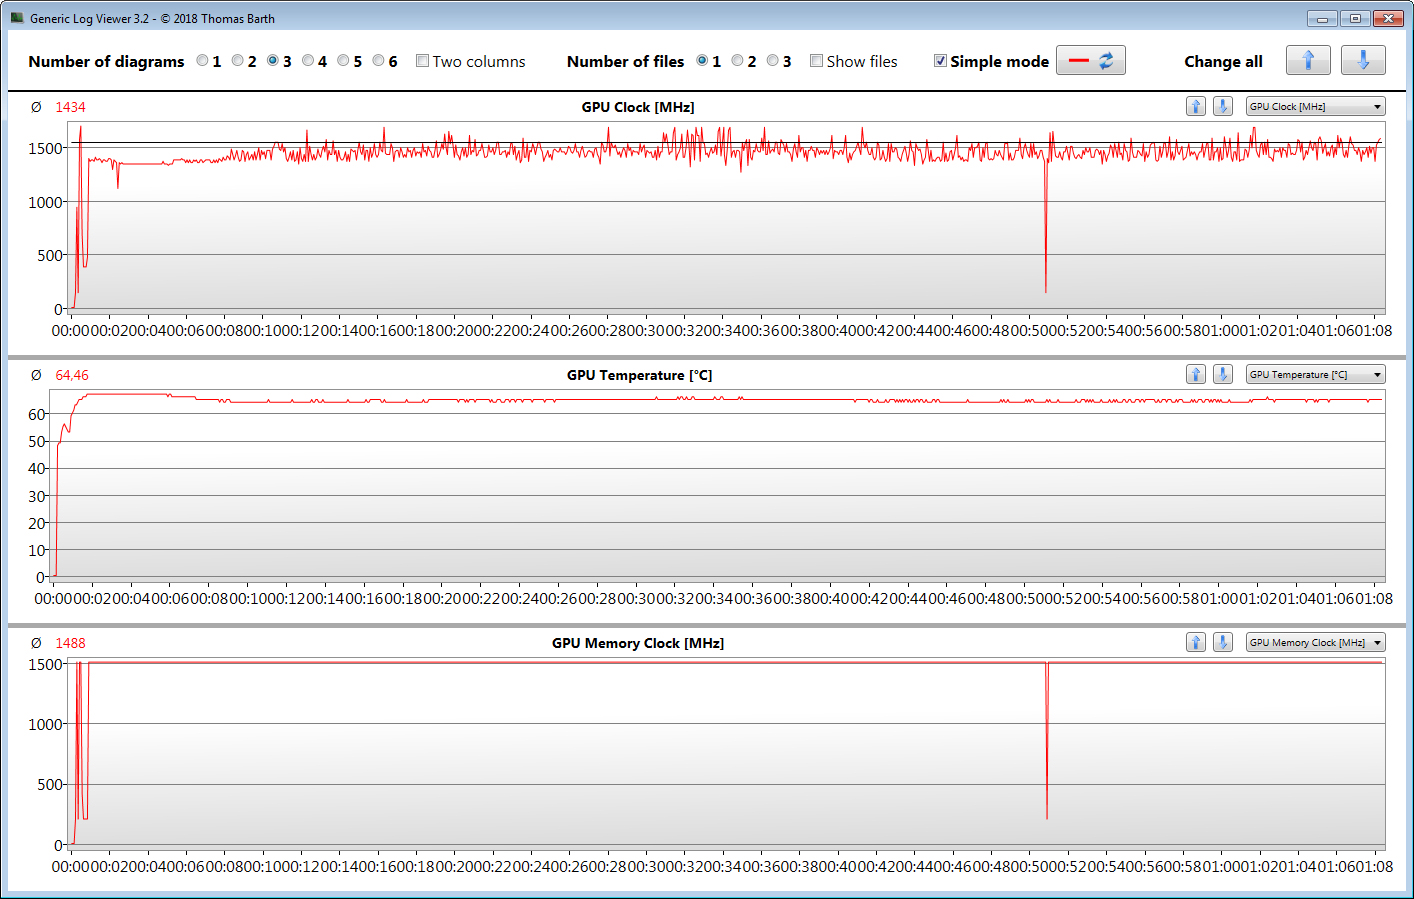
Hewlett Packard har tryckt in en fyrkärnig processor och ett GeForce MX250 i ett tunt och snyggt metallhölje. Tyvärr kan processorn inte nå sin fulla potential i en såpass tight omgivning och klarar bara av en svag turbo boost i multitrådade applikationer. GPU:n HP har valt visar sig vara den strypta versionen av MX250. Men trots det klarar Envy av att visa de flesta spelen i vår databas smidigt.
HP har skapat en välavrundad subnotebook som inte har några större svagheter.
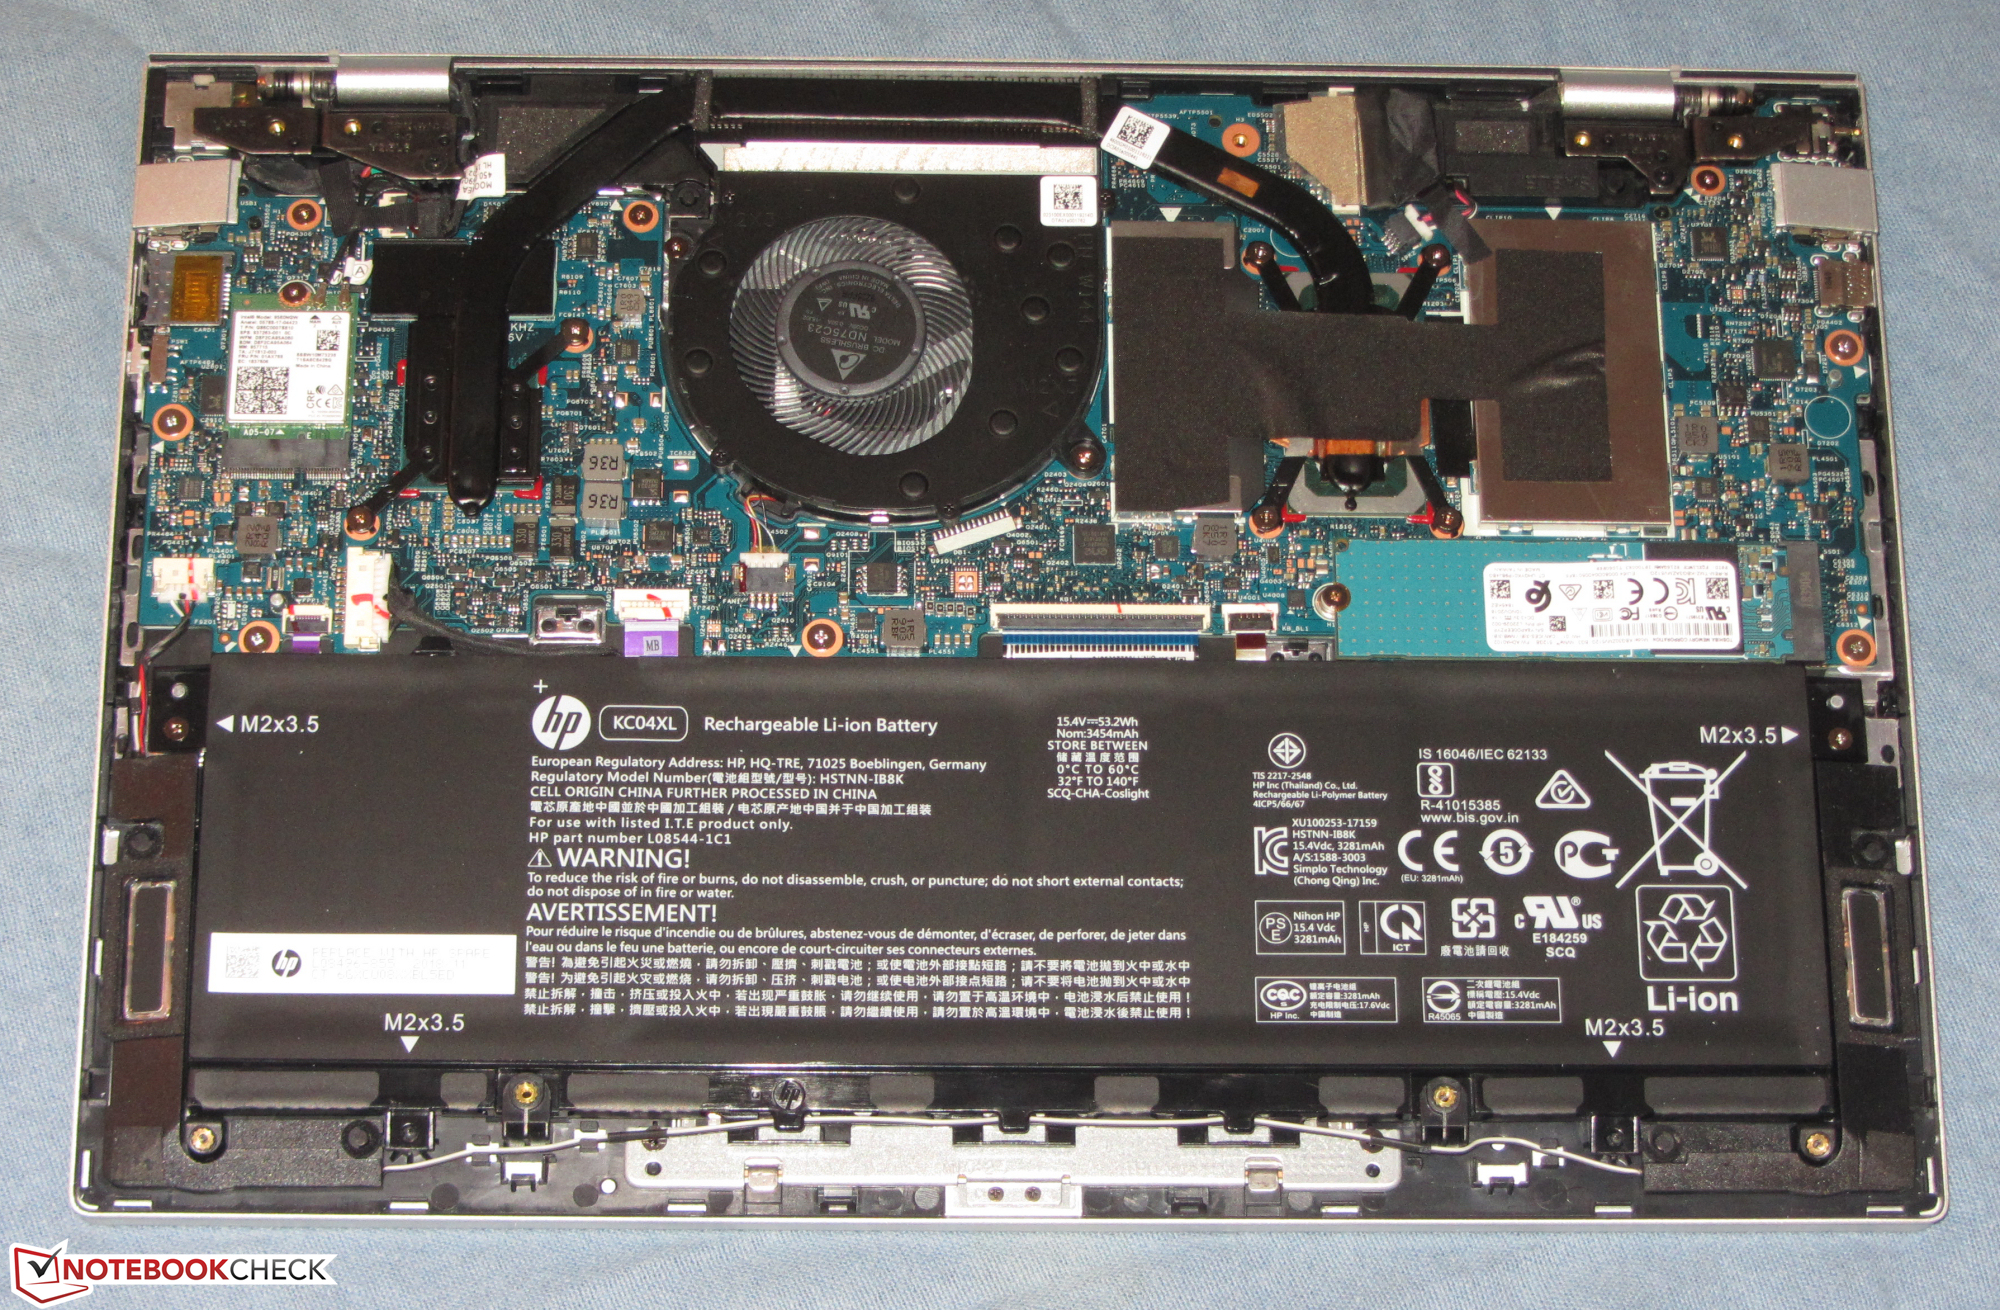
Datorn har rikligt med lagringsutrymme. Den kommer med en NVMe SSD-enhet på 512 GB, som också säkrar snabb systemprestanda. Vid behov går det att byta ut lagringsenheten även om det kräver att man öppnar datorn eftersom en servicelucka saknas.
Envy 13 har en riktigt ljusstark IPS-skärm med bra kontrastförhållande och stabila betraktningsvinklar som visar färger väl. Integritetsfunktionen "Sure View" går att aktivera med ett knapptryck. Den gör det svårt eller närmast omöjligt att läsa skärmen om man inte sitter rakt framför den.
Envy har också ett skaplig tangentbord med bakgrundsbelysning (två nivåer). Batteritiden är också lovande. Vidare uppskattade vi att USB Typ C-porten hade stöd för DisplayPort-via-USB C (även om det kräver en specialadapter som inte följer med datorn). Det går också att ladda datorn genom den porten (Power Delivery 3.0).
HP Envy 13-aq0003ng
- 10/22/2019 v7 (old)
Sascha Mölck
Price comparison
