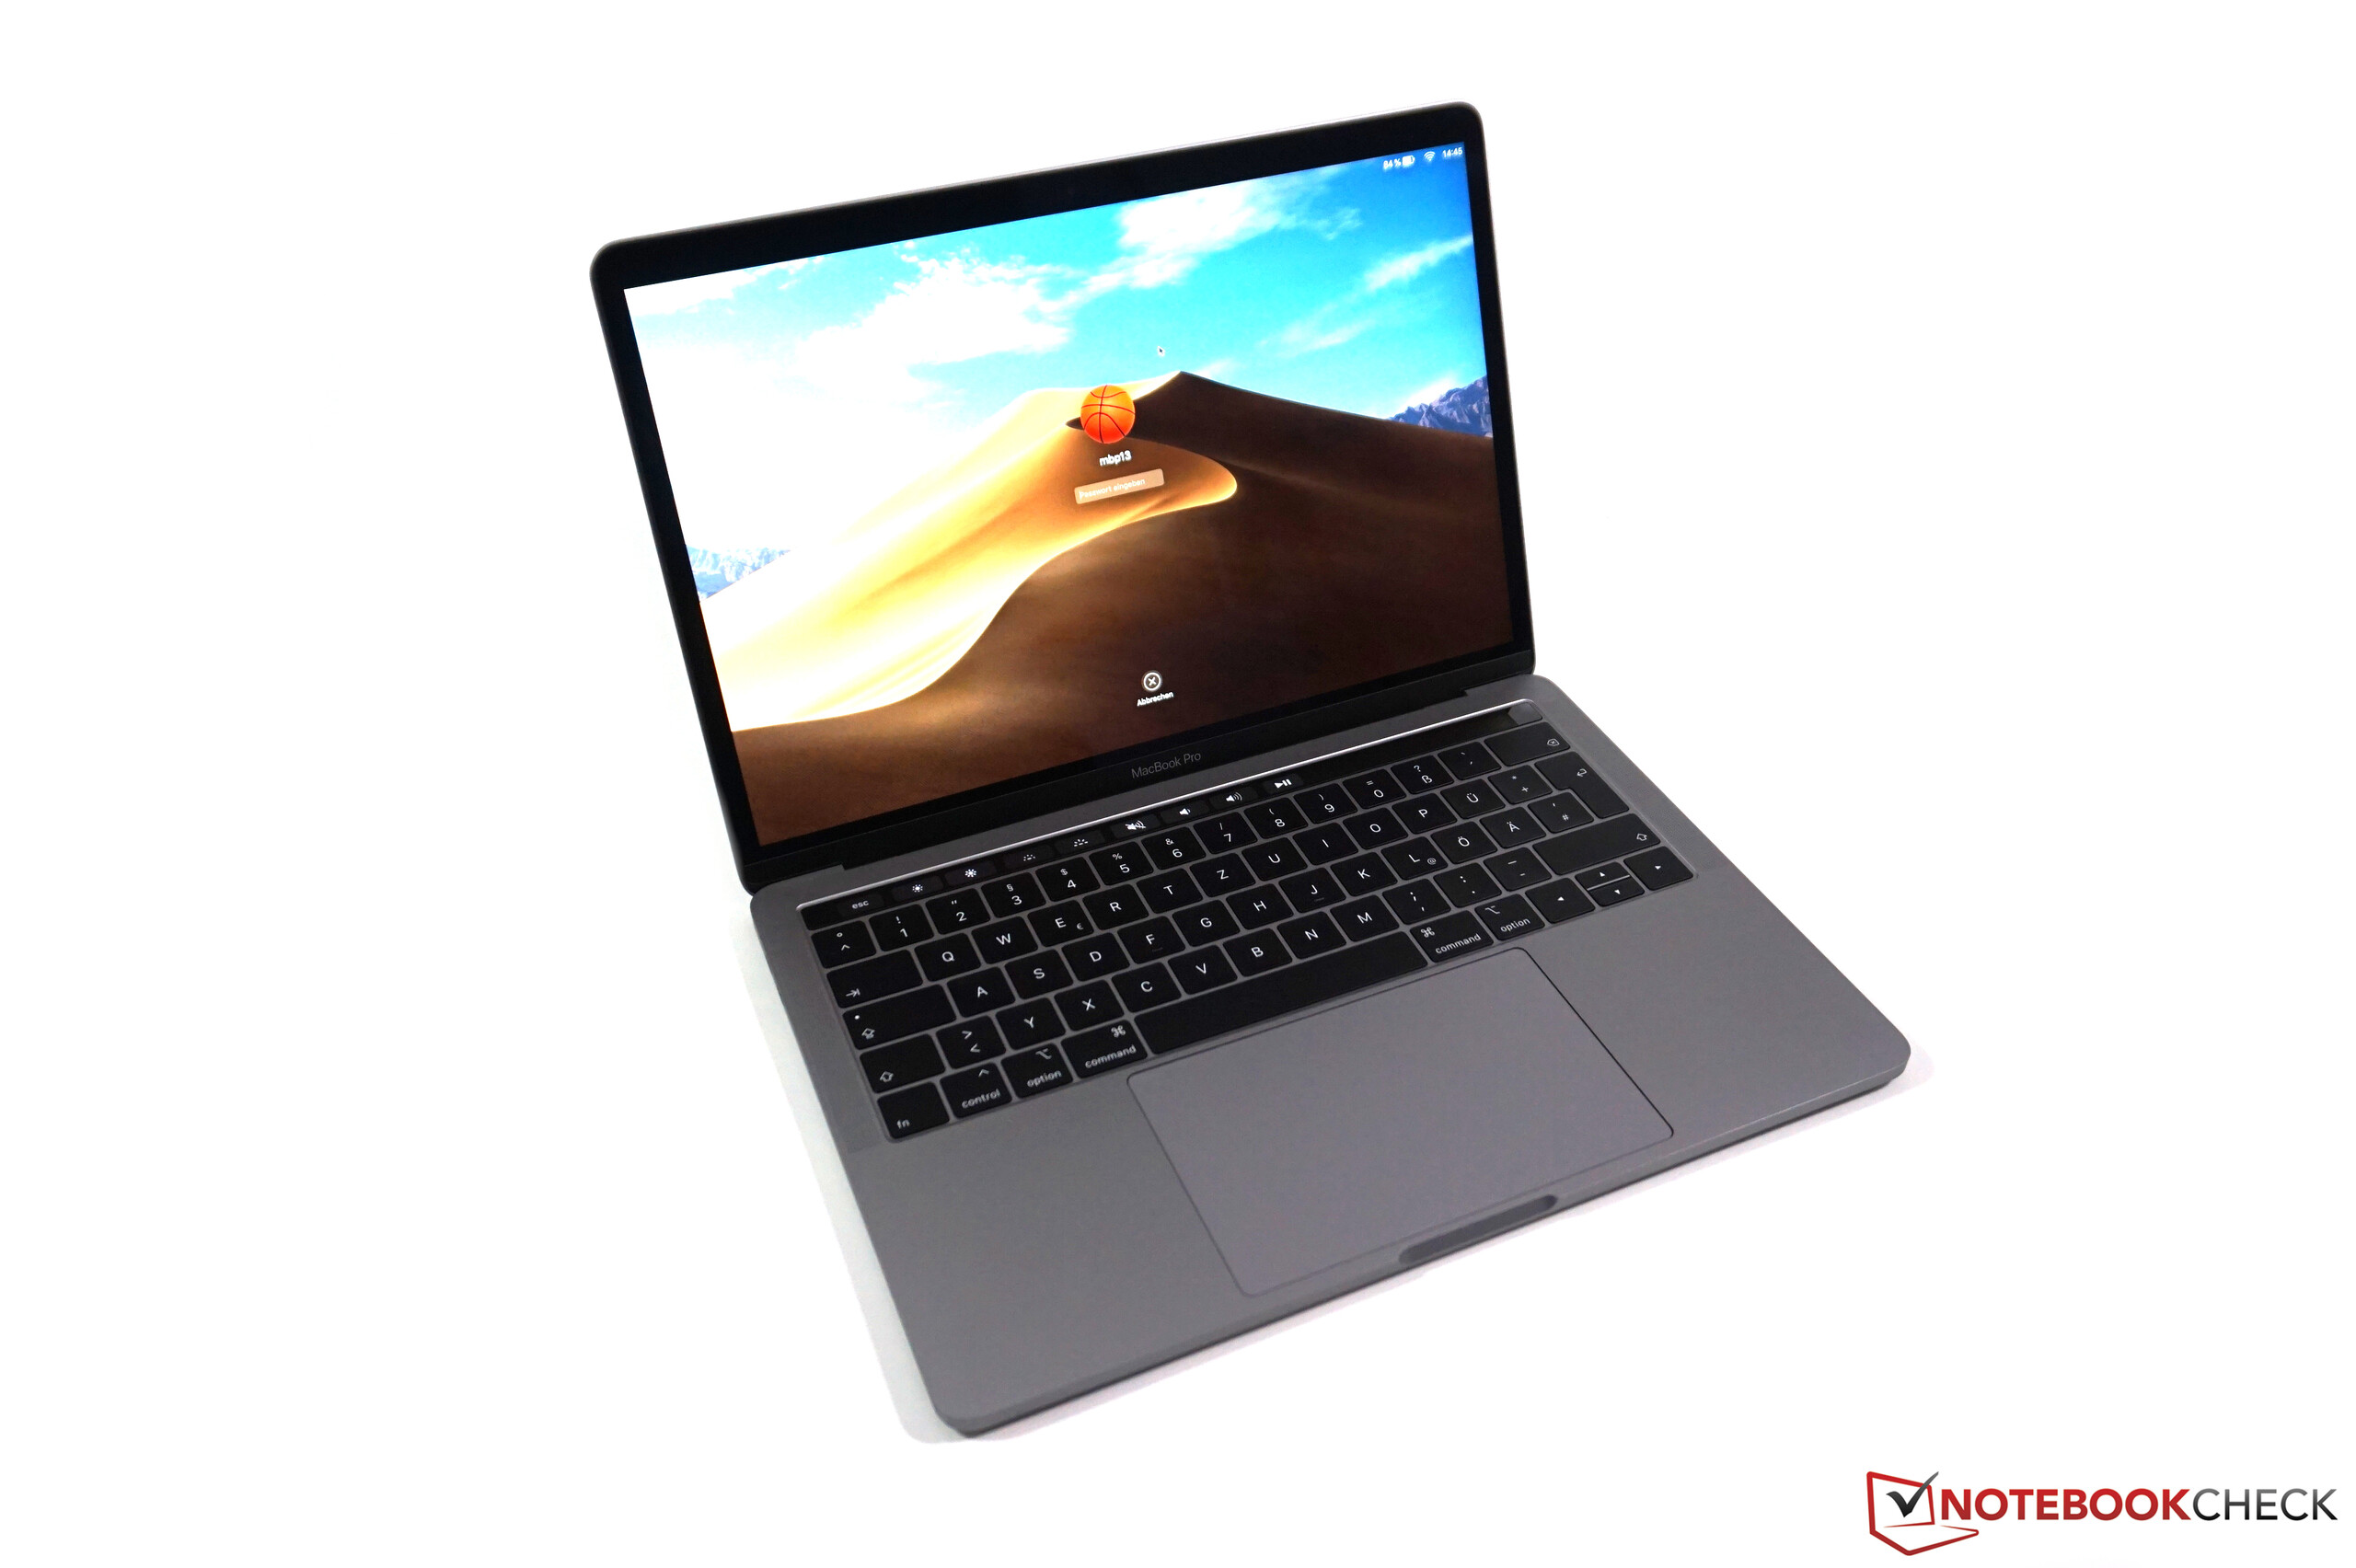
Test: Apple MacBook Pro 13 2019 - Instegsversion med Touch Bar (Sammanfattning)
Gradering | Datum | Modell | Vikt | Höjd | Storlek | Upplösning | Pris |
|---|---|---|---|---|---|---|---|
| 90.6 % v7 (old) | 02/2020 | Apple MacBook Pro 13 2019 2TB3 i5-8257U, Iris Plus Graphics 645 | 1.4 kg | 14.9 mm | 13.30" | 2560x1600 | |
| 90.7 % v7 (old) | 11/2019 | Apple MacBook Pro 13 2019 i5 4TB3 i5-8279U, Iris Plus Graphics 655 | 1.4 kg | 14.9 mm | 13.30" | 2560x1600 | |
| 88.1 % v6 (old) | 08/2017 | Apple MacBook Pro 13 2017 i5-7360U, Iris Plus Graphics 640 | 1.4 kg | 14.9 mm | 13.30" | 2560x1600 | |
| 85.6 % v7 (old) | 02/2020 | Apple Macbook Air 2019 i5-8210Y, UHD Graphics 617 | 1.3 kg | 15.6 mm | 13.30" | 2560x1600 | |
| 87.7 % v6 (old) | 02/2019 | Dell XPS 13 9380 i7 4K i7-8565U, UHD Graphics 620 | 1.2 kg | 11.6 mm | 13.30" | 3840x2160 | |
| 86.3 % v7 (old) | 10/2019 | Razer Blade Stealth i7-1065G7 Iris Plus i7-1065G7, Iris Plus Graphics G7 (Ice Lake 64 EU) | 1.4 kg | 15.3 mm | 13.30" | 1920x1080 | |
| 84.5 % v7 (old) | 08/2019 | HP Envy 13-aq0003ng i7-8565U, GeForce MX250 | 1.2 kg | 14.7 mm | 13.30" | 1920x1080 |
| |||||||||||||||||||||||||
Distribution av ljusstyrkan: 92 %
Mitt på batteriet: 602 cd/m²
Kontrast: 1723:1 (Svärta: 0.35 cd/m²)
ΔE ColorChecker Calman: 1.7 | ∀{0.5-29.43 Ø4.73}
calibrated: 0.7
ΔE Greyscale Calman: 2.1 | ∀{0.09-98 Ø4.97}
99.4% sRGB (Argyll 1.6.3 3D)
76.7% AdobeRGB 1998 (Argyll 1.6.3 3D)
85.6% AdobeRGB 1998 (Argyll 3D)
99.4% sRGB (Argyll 3D)
96.1% Display P3 (Argyll 3D)
Gamma: 2.18
CCT: 6843 K
| Apple MacBook Pro 13 2019 2TB3 APPA03D, IPS, 2560x1600, 13.3" | Apple MacBook Pro 13 2019 i5 4TB3 APPA03E, IPS, 2560x1600, 13.3" | Apple MacBook Pro 13 2017 APPA033, IPS, 2560x1600, 13.3" | Apple Macbook Air 2019 APPA041, IPS, 2560x1600, 13.3" | Dell XPS 13 9380 i7 4K ID: AUO 282B B133ZAN Dell: 90NTH, IPS, 3840x2160, 13.3" | Razer Blade Stealth i7-1065G7 Iris Plus Sharp LQ133M1JW41, IPS, 1920x1080, 13.3" | HP Envy 13-aq0003ng InfoVision M133NVF3 R2, IPS, 1920x1080, 13.3" | |
|---|---|---|---|---|---|---|---|
| Display | 2% | 2% | -18% | -21% | -18% | -22% | |
| Display P3 Coverage (%) | 96.1 | 98.7 3% | 99.2 3% | 67.4 -30% | 64.8 -33% | 66.2 -31% | 64.4 -33% |
| sRGB Coverage (%) | 99.4 | 100 1% | 99.9 1% | 94.7 -5% | 93.6 -6% | 97.2 -2% | 91.7 -8% |
| AdobeRGB 1998 Coverage (%) | 85.6 | 87.7 2% | 87.1 2% | 69.1 -19% | 65.8 -23% | 67.1 -22% | 65.2 -24% |
| Response Times | 15% | 17% | 16% | -19% | 8% | 35% | |
| Response Time Grey 50% / Grey 80% * (ms) | 50.4 ? | 43.2 ? 14% | 42.8 ? 15% | 42.4 ? 16% | 64.8 ? -29% | 45.2 ? 10% | 31 ? 38% |
| Response Time Black / White * (ms) | 35.2 ? | 29.6 ? 16% | 28.8 ? 18% | 29.6 ? 16% | 38 ? -8% | 33.2 ? 6% | 24 ? 32% |
| PWM Frequency (Hz) | 116300 ? | 111100 ? | 22730 ? | 4000 ? | |||
| Screen | -26% | -6% | -8% | -45% | -5% | -51% | |
| Brightness middle (cd/m²) | 603 | 518 -14% | 588 -2% | 421 -30% | 428.3 -29% | 422.6 -30% | 768 27% |
| Brightness (cd/m²) | 577 | 480 -17% | 561 -3% | 393 -32% | 414 -28% | 404 -30% | 778 35% |
| Brightness Distribution (%) | 92 | 87 -5% | 92 0% | 88 -4% | 88 -4% | 87 -5% | 82 -11% |
| Black Level * (cd/m²) | 0.35 | 0.34 3% | 0.45 -29% | 0.34 3% | 0.27 23% | 0.35 -0% | 0.48 -37% |
| Contrast (:1) | 1723 | 1524 -12% | 1307 -24% | 1238 -28% | 1586 -8% | 1207 -30% | 1600 -7% |
| Colorchecker dE 2000 * | 1.7 | 1.5 12% | 1.7 -0% | 1.5 12% | 2.69 -58% | 1.02 40% | 3.49 -105% |
| Colorchecker dE 2000 max. * | 3.1 | 2.8 10% | 3.5 -13% | 3.8 -23% | 6.19 -100% | 3.06 1% | 7.41 -139% |
| Colorchecker dE 2000 calibrated * | 0.7 | 2.6 -271% | 2.01 -187% | 0.95 -36% | 2.07 -196% | ||
| Greyscale dE 2000 * | 2.1 | 2 5% | 1.9 10% | 1.2 43% | 3.7 -76% | 1 52% | 4.09 -95% |
| Gamma | 2.18 101% | 2.22 99% | 2.33 94% | 2.21 100% | 2.1 105% | 2.21 100% | 2.54 87% |
| CCT | 6843 95% | 6898 94% | 6738 96% | 6694 97% | 6706 97% | 6502 100% | 6452 101% |
| Color Space (Percent of AdobeRGB 1998) (%) | 76.7 | 78.4 2% | 77.92 2% | 61.3 -20% | 60.4 -21% | 62.1 -19% | 60 -22% |
| Color Space (Percent of sRGB) (%) | 99.4 | 99.9 1% | 99.94 1% | 94.6 -5% | 93.5 -6% | 97.1 -2% | 92 -7% |
| Totalt genomsnitt (program/inställningar) | -3% /
-16% | 4% /
-1% | -3% /
-7% | -28% /
-37% | -5% /
-6% | -13% /
-35% |
* ... mindre är bättre
Visa svarstider
| ↔ Svarstid svart till vitt | ||
|---|---|---|
| 35.2 ms ... stiga ↗ och falla ↘ kombinerat | ↗ 19.6 ms stiga | 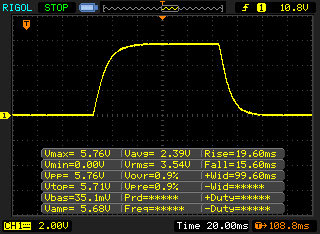 |
| ↘ 15.6 ms hösten | ||
| Skärmen visar långsamma svarsfrekvenser i våra tester och kommer att vara otillfredsställande för spelare. I jämförelse sträcker sig alla testade enheter från 0.1 (minst) till 240 (maximalt) ms. » 93 % av alla enheter är bättre. Detta innebär att den uppmätta svarstiden är sämre än genomsnittet av alla testade enheter (19.9 ms). | ||
| ↔ Svarstid 50 % grått till 80 % grått | ||
| 50.4 ms ... stiga ↗ och falla ↘ kombinerat | ↗ 24.4 ms stiga | 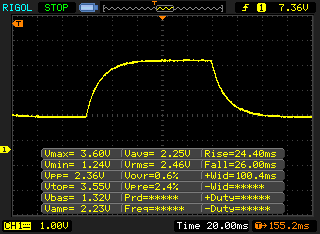 |
| ↘ 26 ms hösten | ||
| Skärmen visar långsamma svarsfrekvenser i våra tester och kommer att vara otillfredsställande för spelare. I jämförelse sträcker sig alla testade enheter från 0.165 (minst) till 636 (maximalt) ms. » 87 % av alla enheter är bättre. Detta innebär att den uppmätta svarstiden är sämre än genomsnittet av alla testade enheter (31.1 ms). | ||
Skärmflimmer / PWM (Puls-Width Modulation)
| Skärmflimmer / PWM upptäckt | 116300 Hz | ≤ 66 % ljusstyrka inställning | 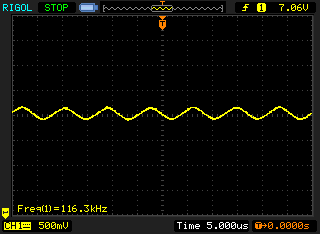 |
Displayens bakgrundsbelysning flimrar vid 116300 Hz (i värsta fall, t.ex. med PWM) Flimrande upptäckt vid en ljusstyrkeinställning på 66 % och lägre. Det ska inte finnas något flimmer eller PWM över denna ljusstyrkeinställning. Frekvensen för 116300 Hz är ganska hög, så de flesta användare som är känsliga för PWM bör inte märka något flimmer. Som jämförelse: 52 % av alla testade enheter använder inte PWM för att dämpa skärmen. Om PWM upptäcktes mättes ett medelvärde av 7791 (minst: 5 - maximum: 343500) Hz. | |||

| PCMark 8 Home Score Accelerated v2 | 3986 poäng | |
| PCMark 8 Creative Score Accelerated v2 | 5589 poäng | |
| PCMark 8 Work Score Accelerated v2 | 4238 poäng | |
| PCMark 10 Score | 3751 poäng | |
Hjälp | ||

| 3DMark 11 Performance | 3238 poäng | |
| 3DMark Fire Strike Score | 1736 poäng | |
| 3DMark Time Spy Score | 624 poäng | |
Hjälp | ||
| låg | med. | hög | ultra | |
|---|---|---|---|---|
| BioShock Infinite (2013) | 104.6 | 60 | 51.6 | 22.1 |
| Dota 2 Reborn (2015) | 76.5 | 57.3 | 29 | 26.9 |
| X-Plane 11.11 (2018) | 37.4 | 26.1 | 22.5 |
Ljudnivå
| Låg belastning |
| 29.5 / 29.5 / 29.5 dB(A) |
| Hög belastning |
| 31.1 / 39.3 dB(A) |
 | ||
30 dB tyst 40 dB(A) hörbar 50 dB(A) högt ljud |
||
min: | ||
| Apple MacBook Pro 13 2019 2TB3 Iris Plus Graphics 645, i5-8257U, Apple SSD AP0256 | Apple MacBook Pro 13 2019 i5 4TB3 Iris Plus Graphics 655, i5-8279U, Apple SSD AP0512 | Apple MacBook Pro 13 2017 Iris Plus Graphics 640, i5-7360U, Apple SSD AP0128 | Apple Macbook Air 2019 UHD Graphics 617, i5-8210Y, Apple SSD AP0256 | Dell XPS 13 9380 i7 4K UHD Graphics 620, i7-8565U, Samsung SSD PM981 MZVLB512HAJQ | Razer Blade Stealth i7-1065G7 Iris Plus Iris Plus Graphics G7 (Ice Lake 64 EU), i7-1065G7, Samsung SSD PM981 MZVLB256HAHQ | HP Envy 13-aq0003ng GeForce MX250, i7-8565U, Toshiba KBG30ZMV512G | |
|---|---|---|---|---|---|---|---|
| Noise | -1% | -2% | -2% | -4% | -3% | -2% | |
| av / miljö * (dB) | 29.5 | 29 2% | 30.2 -2% | 29.5 -0% | 28.4 4% | 28.3 4% | 30 -2% |
| Idle Minimum * (dB) | 29.5 | 29 2% | 30.2 -2% | 29.5 -0% | 29.4 -0% | 28.3 4% | 30 -2% |
| Idle Average * (dB) | 29.5 | 29 2% | 30.2 -2% | 29.5 -0% | 29.4 -0% | 28.3 4% | 30 -2% |
| Idle Maximum * (dB) | 29.5 | 29 2% | 30.2 -2% | 29.5 -0% | 29.4 -0% | 28.3 4% | 30 -2% |
| Load Average * (dB) | 31.1 | 33.9 -9% | 32.9 -6% | 34 -9% | 34.6 -11% | 33.5 -8% | |
| Load Maximum * (dB) | 39.3 | 41.8 -6% | 39.3 -0% | 41 -4% | 46.8 -19% | 49.4 -26% | 39.5 -1% |
| Witcher 3 ultra * (dB) | 34.5 |
* ... mindre är bättre
(±) Den maximala temperaturen på ovansidan är 44.9 °C / 113 F, jämfört med genomsnittet av 35.9 °C / 97 F , allt från 21.4 till 59 °C för klassen Subnotebook.
(-) Botten värms upp till maximalt 45.1 °C / 113 F, jämfört med genomsnittet av 39.2 °C / 103 F
(+) Vid tomgångsbruk är medeltemperaturen för ovansidan 24.8 °C / 77 F, jämfört med enhetsgenomsnittet på 30.8 °C / ### class_avg_f### F.
(+) Handledsstöden och pekplattan når maximal hudtemperatur (32.1 °C / 89.8 F) och är därför inte varma.
(-) Medeltemperaturen för handledsstödsområdet på liknande enheter var 28.2 °C / 82.8 F (-3.9 °C / -7 F).
Apple MacBook Pro 13 2019 2TB3 ljudanalys
(±) | högtalarljudstyrkan är genomsnittlig men bra (79.1 dB)
Bas 100 - 315 Hz
(±) | reducerad bas - i genomsnitt 10.7% lägre än medianen
(±) | linjäriteten för basen är genomsnittlig (8.7% delta till föregående frekvens)
Mellan 400 - 2000 Hz
(+) | balanserad mellan - endast 4.6% från medianen
(+) | mids är linjära (3.8% delta till föregående frekvens)
Högsta 2 - 16 kHz
(+) | balanserade toppar - endast 2.3% från medianen
(+) | toppar är linjära (4.7% delta till föregående frekvens)
Totalt 100 - 16 000 Hz
(±) | linjäriteten för det totala ljudet är genomsnittlig (15.6% skillnad mot median)
Jämfört med samma klass
» 36% av alla testade enheter i den här klassen var bättre, 5% liknande, 59% sämre
» Den bästa hade ett delta på 5%, genomsnittet var 18%, sämst var 53%
Jämfört med alla testade enheter
» 23% av alla testade enheter var bättre, 5% liknande, 72% sämre
» Den bästa hade ett delta på 4%, genomsnittet var 24%, sämst var 134%
Apple MacBook Pro 13 2019 i5 4TB3 ljudanalys
(±) | högtalarljudstyrkan är genomsnittlig men bra (79.7 dB)
Bas 100 - 315 Hz
(±) | reducerad bas - i genomsnitt 12.8% lägre än medianen
(±) | linjäriteten för basen är genomsnittlig (11.2% delta till föregående frekvens)
Mellan 400 - 2000 Hz
(+) | balanserad mellan - endast 3.2% från medianen
(+) | mids är linjära (4.6% delta till föregående frekvens)
Högsta 2 - 16 kHz
(+) | balanserade toppar - endast 3.4% från medianen
(+) | toppar är linjära (5.3% delta till föregående frekvens)
Totalt 100 - 16 000 Hz
(+) | det totala ljudet är linjärt (13.7% skillnad mot median)
Jämfört med samma klass
» 24% av alla testade enheter i den här klassen var bättre, 5% liknande, 71% sämre
» Den bästa hade ett delta på 5%, genomsnittet var 18%, sämst var 53%
Jämfört med alla testade enheter
» 15% av alla testade enheter var bättre, 4% liknande, 81% sämre
» Den bästa hade ett delta på 4%, genomsnittet var 24%, sämst var 134%
| Av/Standby | |
| Låg belastning | |
| Hög belastning |
|
Förklaring:
min: | |
| Apple MacBook Pro 13 2019 2TB3 i5-8257U, Iris Plus Graphics 645, Apple SSD AP0256, IPS, 2560x1600, 13.3" | Apple MacBook Pro 13 2019 i5 4TB3 i5-8279U, Iris Plus Graphics 655, Apple SSD AP0512, IPS, 2560x1600, 13.3" | Apple MacBook Pro 13 2017 i5-7360U, Iris Plus Graphics 640, Apple SSD AP0128, IPS, 2560x1600, 13.3" | Dell XPS 13 9380 i7 4K i7-8565U, UHD Graphics 620, Samsung SSD PM981 MZVLB512HAJQ, IPS, 3840x2160, 13.3" | Razer Blade Stealth i7-1065G7 Iris Plus i7-1065G7, Iris Plus Graphics G7 (Ice Lake 64 EU), Samsung SSD PM981 MZVLB256HAHQ, IPS, 1920x1080, 13.3" | HP Envy 13-aq0003ng i7-8565U, GeForce MX250, Toshiba KBG30ZMV512G, IPS, 1920x1080, 13.3" | Genomsnitt Intel Iris Plus Graphics 645 | Genomsnitt av klass Subnotebook | |
|---|---|---|---|---|---|---|---|---|
| Power Consumption | -8% | -5% | -37% | -45% | -32% | -4% | -16% | |
| Idle Minimum * (Watt) | 2.1 | 2.2 -5% | 3.7 -76% | 5.2 -148% | 5.9 -181% | 3.9 -86% | 2.2 ? -5% | 3.82 ? -82% |
| Idle Average * (Watt) | 6.9 | 7.2 -4% | 5.2 25% | 8.6 -25% | 8.1 -17% | 7.8 -13% | 7.4 ? -7% | 6.61 ? 4% |
| Idle Maximum * (Watt) | 7.8 | 8.2 -5% | 7.6 3% | 10.5 -35% | 11.2 -44% | 10.8 -38% | 8.2 ? -5% | 7.99 ? -2% |
| Load Average * (Watt) | 42 | 54 -29% | 41.6 1% | 44.2 -5% | 44.3 -5% | 53 -26% | 44 ? -5% | 41.9 ? -0% |
| Load Maximum * (Watt) | 64.5 | 63.9 1% | 50.5 22% | 47.5 26% | 50.2 22% | 62.7 3% | 64.3 ? -0% | 64.1 ? 1% |
| Witcher 3 ultra * (Watt) | 41.9 |
* ... mindre är bättre
| Apple MacBook Pro 13 2019 2TB3 i5-8257U, Iris Plus Graphics 645, 58.2 Wh | Apple MacBook Pro 13 2019 i5 4TB3 i5-8279U, Iris Plus Graphics 655, 58 Wh | Apple MacBook Pro 13 2017 i5-7360U, Iris Plus Graphics 640, 54.5 Wh | Apple Macbook Air 2019 i5-8210Y, UHD Graphics 617, 49.9 Wh | Dell XPS 13 9380 i7 4K i7-8565U, UHD Graphics 620, 52 Wh | Razer Blade Stealth i7-1065G7 Iris Plus i7-1065G7, Iris Plus Graphics G7 (Ice Lake 64 EU), 53.1 Wh | HP Envy 13-aq0003ng i7-8565U, GeForce MX250, 53.2 Wh | Genomsnitt av klass Subnotebook | |
|---|---|---|---|---|---|---|---|---|
| Battery Runtime | -12% | -12% | -9% | -41% | -25% | -35% | 12% | |
| WiFi Websurfing (h) | 13 | 11.5 -12% | 11.4 -12% | 11.5 -12% | 7.7 -41% | 9.7 -25% | 8.5 -35% | 14 ? 8% |
| WiFi Websurfing max. Brightness (h) | 7.4 | 7 -5% | 8.53 ? 15% |
För
Emot
Omdöme – Billigare är bättre

Läs den fullständiga versionen av den här recensionen på engelska här.
Efter att ha recenserat de båda varianterna av MacBook Pro 13 har vi ett tydligt resultat: Den billigare modellen är för de flesta ett bättre val. Den enda egentliga bristen är färre Thunderbolt 3-portar. Den har också aningen lägre prestanda, men i ärlighetens namn blev vi positivt överraskade av den mindre varianten av MBP 13. Apples specifikationer antyder en större skillnad, men i realiteten är skillnaden väldigt liten och märks inte i vardagssituationer.
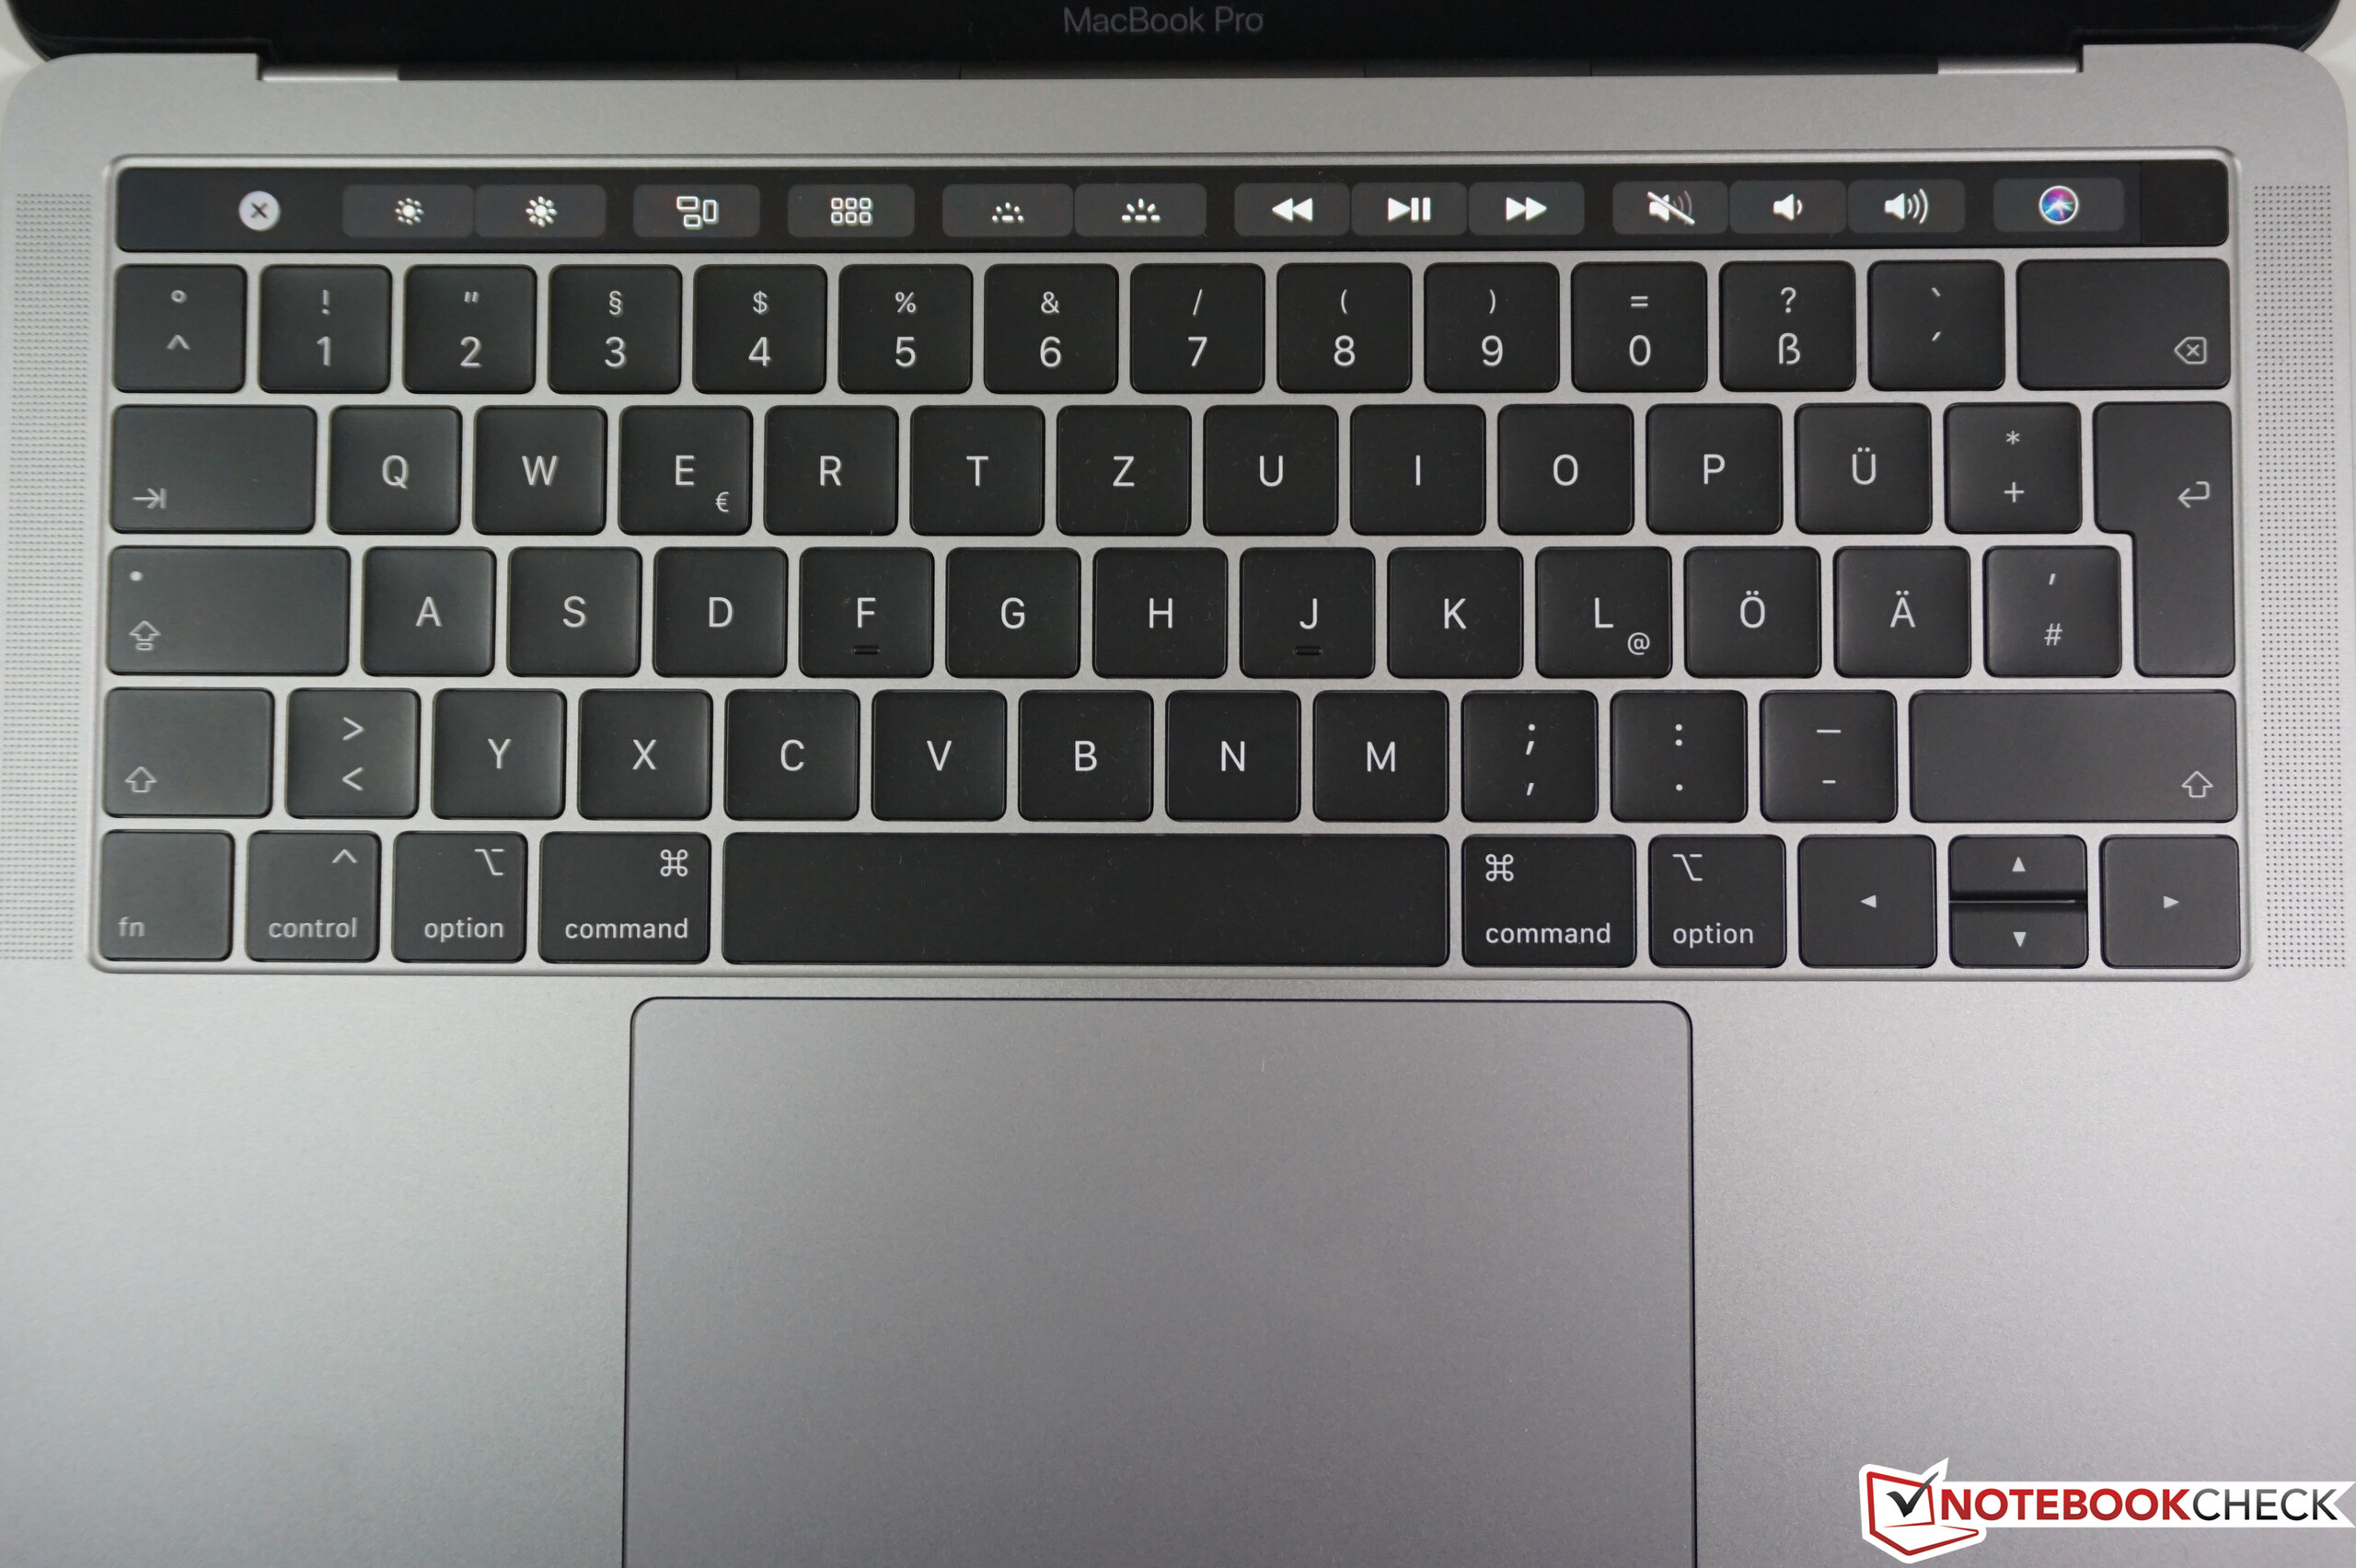
Skärmen är extremt bra och totalt sett är MacBook Pro 13 ett bra paket. Det enda problemet är tangentbordet och eventuella pålitlighetsproblem det kan tänkas lida av. Enligt Apple har förbättringar gjorts, men tidigare års dåliga erfarenheter bådar inte gott för Butterfly-inmatningen. Om du behöver en ny subnotebook precis nu kan du definitivt skaffa den här modellen, men det går ryckten om att nästa MBP 13 (eller MBP 14) kommer få ett nytt tangentbord, så det kan hända att du kan få en ännu bättre enhet om ett par månader.
Den billigare varianten av MacBook Pro 13 är ett bättre val. Den är nästan lika snabb som den dyrare modellen och är mycket mer kraftfull än MacBook Air.
Därmed återstår bara en jämförelse med den lite kompaktare MacBook Air. Air är en aning billigare, men för över 13.000 kronor är den ändå inte direkt ett kap. MacBook Pro 13 är däremot betydligt kraftigare och har en ännu bättre skärm, så vi kan definitivt rekommendera MacBook Pro 13. Den bör dessutom ha prestanda så det räcker under kommande år.
Apple MacBook Pro 13 2019 2TB3
- 02/04/2020 v7 (old)
Andreas Osthoff
Price comparison
