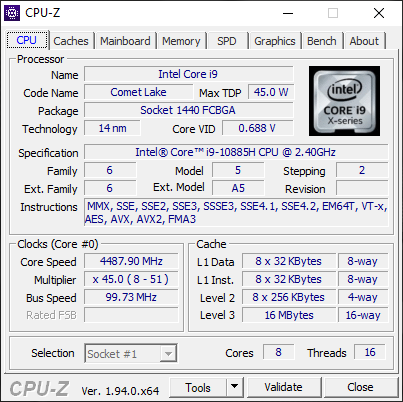
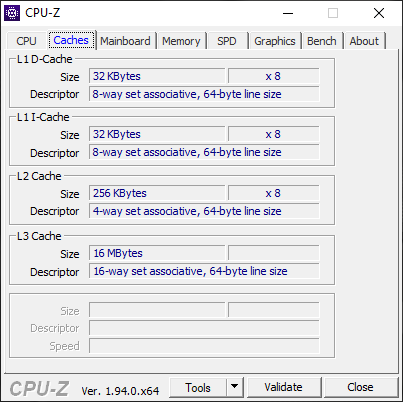
Test: Dell Precision 3551 - Debut för Intel Core i9-10885H (Sammanfattning)
Gradering | Datum | Modell | Vikt | Höjd | Storlek | Upplösning | Pris |
|---|---|---|---|---|---|---|---|
| 81.2 % v7 (old) | 10/2020 | Dell Precision 3000 3551 i9-10885H, Quadro P620 | 2.2 kg | 24.92 mm | 15.60" | 1920x1080 | |
| 82.7 % v7 (old) | 12/2020 | HP ZBook Firefly 15 G7 i7-10610U, Quadro P520 | 1.8 kg | 19.2 mm | 15.60" | 3840x2160 | |
| 86.3 % v7 (old) | 08/2020 | Dell Precision 5550 P91F i7-10875H, Quadro T2000 Max-Q | 2 kg | 18 mm | 15.60" | 3840x2400 | |
| 81.2 % v7 (old) | Lenovo ThinkPad P53s-20N6001NGE i7-8565U, Quadro P520 | 1.9 kg | 19.95 mm | 15.60" | 1920x1080 | ||
| 76 % v7 (old) | 10/2019 | MSI WP65 i7-9750H, Quadro P620 | 1.9 kg | 21.7 mm | 15.60" | 1920x1080 | |
| 84.3 % v6 (old) | 08/2018 | Dell Precision 3530 E-2176M, Quadro P600 | 2.3 kg | 24.3 mm | 15.60" | 1920x1080 |
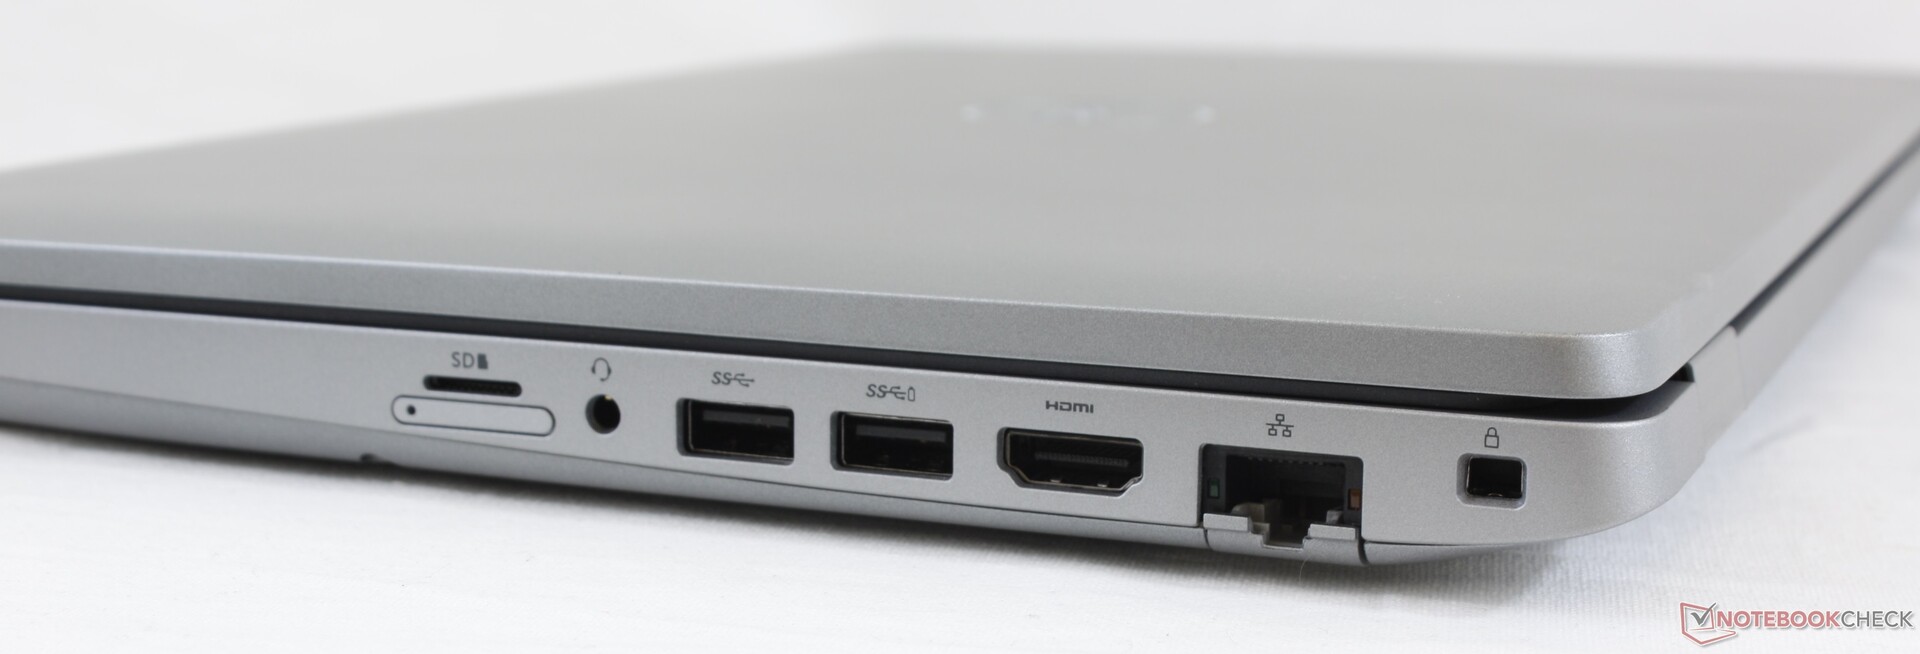
| SD Card Reader | |
| average JPG Copy Test (av. of 3 runs) | |
| Dell Precision 5550 P91F (Toshiba Exceria Pro SDXC 64 GB UHS-II) | |
| Dell Precision 3530 (Toshiba Exceria Pro SDXC 64 GB UHS-II) | |
| Dell Precision 3000 3551 (Toshiba Exceria Pro M501 64 GB UHS-II) | |
| Lenovo ThinkPad P53s-20N6001NGE (Toshiba Exceria Pro M501 64 GB UHS-II) | |
| maximum AS SSD Seq Read Test (1GB) | |
| Dell Precision 3530 (Toshiba Exceria Pro SDXC 64 GB UHS-II) | |
| Dell Precision 5550 P91F (Toshiba Exceria Pro SDXC 64 GB UHS-II) | |
| Dell Precision 3000 3551 (Toshiba Exceria Pro M501 64 GB UHS-II) | |
| Lenovo ThinkPad P53s-20N6001NGE (Toshiba Exceria Pro M501 64 GB UHS-II) | |


| |||||||||||||||||||||||||
Distribution av ljusstyrkan: 89 %
Mitt på batteriet: 235.5 cd/m²
Kontrast: 942:1 (Svärta: 0.25 cd/m²)
ΔE ColorChecker Calman: 5.44 | ∀{0.5-29.43 Ø4.72}
calibrated: 5.2
ΔE Greyscale Calman: 3.1 | ∀{0.09-98 Ø4.97}
56.1% sRGB (Argyll 1.6.3 3D)
35.5% AdobeRGB 1998 (Argyll 1.6.3 3D)
38.74% AdobeRGB 1998 (Argyll 3D)
56.5% sRGB (Argyll 3D)
37.5% Display P3 (Argyll 3D)
Gamma: 2.42
CCT: 7070 K
| Dell Precision 3000 3551 LG Philips 156WFD, IPS, 15.6", 1920x1080 | HP ZBook Firefly 15 G7 LGD064F, IPS LED, 15.6", 3840x2160 | Dell Precision 5550 P91F Sharp LQ156R1, IPS, 15.6", 3840x2400 | Lenovo ThinkPad P53s-20N6001NGE Lenovo LEN40BA, IPS, 15.6", 1920x1080 | MSI WP65 AU Optronics B156HAN02.1, IPS, 15.6", 1920x1080 | Dell Precision 3530 BOE BOE06F1, IPS, 15.6", 1920x1080 | |
|---|---|---|---|---|---|---|
| Display | 79% | 125% | 5% | 5% | 80% | |
| Display P3 Coverage (%) | 37.5 | 68.8 83% | 89.9 140% | 39.58 6% | 39.46 5% | 72.8 94% |
| sRGB Coverage (%) | 56.5 | 97.7 73% | 100 77% | 57.6 2% | 58.8 4% | 94.6 67% |
| AdobeRGB 1998 Coverage (%) | 38.74 | 69.8 80% | 99.9 158% | 40.89 6% | 40.69 5% | 69.3 79% |
| Response Times | -33% | -42% | -50% | -16% | -34% | |
| Response Time Grey 50% / Grey 80% * (ms) | 29.6 ? | 44 ? -49% | 46 ? -55% | 51.2 ? -73% | 37.6 ? -27% | 40.4 ? -36% |
| Response Time Black / White * (ms) | 26.4 ? | 30.8 ? -17% | 34 ? -29% | 33.6 ? -27% | 27.6 ? -5% | 34.8 ? -32% |
| PWM Frequency (Hz) | 1053 ? | |||||
| Screen | 51% | 33% | 4% | -2% | 10% | |
| Brightness middle (cd/m²) | 235.5 | 381 62% | 469.8 99% | 260 10% | 267.4 14% | 285.7 21% |
| Brightness (cd/m²) | 228 | 382 68% | 464 104% | 243 7% | 259 14% | 275 21% |
| Brightness Distribution (%) | 89 | 92 3% | 85 -4% | 88 -1% | 86 -3% | 85 -4% |
| Black Level * (cd/m²) | 0.25 | 0.21 16% | 0.42 -68% | 0.18 28% | 0.37 -48% | 0.31 -24% |
| Contrast (:1) | 942 | 1814 93% | 1119 19% | 1444 53% | 723 -23% | 922 -2% |
| Colorchecker dE 2000 * | 5.44 | 3 45% | 5.16 5% | 6 -10% | 4.21 23% | 5.84 -7% |
| Colorchecker dE 2000 max. * | 13.58 | 5.2 62% | 9.33 31% | 19.2 -41% | 21.1 -55% | 8.76 35% |
| Colorchecker dE 2000 calibrated * | 5.2 | 1.5 71% | 3.75 28% | 4.3 17% | 4.27 18% | 3.14 40% |
| Greyscale dE 2000 * | 3.1 | 3.5 -13% | 5.5 -77% | 4.2 -35% | 2.3 26% | 6.5 -110% |
| Gamma | 2.42 91% | 2.26 97% | 2 110% | 2.49 88% | 2.2 100% | 2.383 92% |
| CCT | 7070 92% | 7254 90% | 6198 105% | 6865 95% | 6578 99% | 7176 91% |
| Color Space (Percent of AdobeRGB 1998) (%) | 35.5 | 64.3 81% | 89.2 151% | 37.6 6% | 37.2 5% | 62 75% |
| Color Space (Percent of sRGB) (%) | 56.1 | 97.5 74% | 100 78% | 59.2 6% | 58.5 4% | 94 68% |
| Totalt genomsnitt (program/inställningar) | 32% /
46% | 39% /
41% | -14% /
-3% | -4% /
-3% | 19% /
18% |
* ... mindre är bättre
Visa svarstider
| ↔ Svarstid svart till vitt | ||
|---|---|---|
| 26.4 ms ... stiga ↗ och falla ↘ kombinerat | ↗ 14 ms stiga | 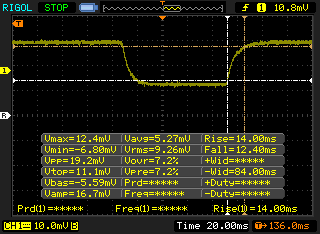 |
| ↘ 12.4 ms hösten | ||
| Skärmen visar relativt långsamma svarsfrekvenser i våra tester och kan vara för långsam för spelare. I jämförelse sträcker sig alla testade enheter från 0.1 (minst) till 240 (maximalt) ms. » 66 % av alla enheter är bättre. Detta innebär att den uppmätta svarstiden är sämre än genomsnittet av alla testade enheter (19.8 ms). | ||
| ↔ Svarstid 50 % grått till 80 % grått | ||
| 29.6 ms ... stiga ↗ och falla ↘ kombinerat | ↗ 16.4 ms stiga | 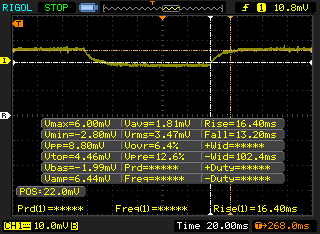 |
| ↘ 13.2 ms hösten | ||
| Skärmen visar relativt långsamma svarsfrekvenser i våra tester och kan vara för långsam för spelare. I jämförelse sträcker sig alla testade enheter från 0.165 (minst) till 636 (maximalt) ms. » 40 % av alla enheter är bättre. Det betyder att den uppmätta svarstiden liknar genomsnittet av alla testade enheter (31 ms). | ||
Skärmflimmer / PWM (Puls-Width Modulation)
| Skärmflimmer / PWM upptäcktes inte | 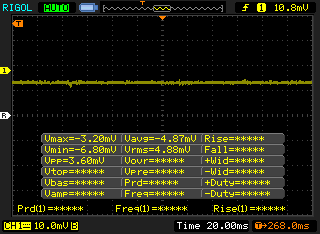 | ||
Som jämförelse: 52 % av alla testade enheter använder inte PWM för att dämpa skärmen. Om PWM upptäcktes mättes ett medelvärde av 7763 (minst: 5 - maximum: 343500) Hz. | |||
Cinebench R15: CPU Multi 64Bit | CPU Single 64Bit
Blender: v2.79 BMW27 CPU
7-Zip 18.03: 7z b 4 -mmt1 | 7z b 4
Geekbench 5.5: Single-Core | Multi-Core
HWBOT x265 Benchmark v2.2: 4k Preset
LibreOffice : 20 Documents To PDF
R Benchmark 2.5: Overall mean
| Cinebench R20 / CPU (Multi Core) | |
| MSI WS66 10TMT-207US | |
| Dell Precision 7550 | |
| Dell Precision 5550 P91F | |
| Genomsnitt Intel Core i9-10885H (2798 - 3762, n=3) | |
| Dell Precision 3000 3551 | |
| Acer ConceptD 3 Pro CN315-71P-73W1 | |
| Lenovo ThinkPad P1 2019-20QT000RGE | |
| HP ZBook Firefly 15 G7 | |
| Acer TravelMate P215-52 | |
| Cinebench R20 / CPU (Single Core) | |
| MSI WS66 10TMT-207US | |
| Dell Precision 5550 P91F | |
| Dell Precision 7550 | |
| Genomsnitt Intel Core i9-10885H (460 - 513, n=3) | |
| HP ZBook Firefly 15 G7 | |
| Dell Precision 3000 3551 | |
| Acer ConceptD 3 Pro CN315-71P-73W1 | |
| Lenovo ThinkPad P1 2019-20QT000RGE | |
| Acer TravelMate P215-52 | |
| Cinebench R15 / CPU Multi 64Bit | |
| MSI WS66 10TMT-207US | |
| Dell Precision 7550 | |
| Dell Precision 5550 P91F | |
| Genomsnitt Intel Core i9-10885H (1264 - 1726, n=3) | |
| Dell Precision 5540 | |
| Dell Precision 3000 3551 | |
| Lenovo ThinkPad P53-20QN000YGE | |
| Fujitsu Celsius H780 | |
| Lenovo ThinkPad P1 2019-20QT000RGE | |
| Acer ConceptD 3 Pro CN315-71P-73W1 | |
| Lenovo ThinkPad P53s-20N6001NGE | |
| HP ZBook Firefly 15 G7 | |
| Acer TravelMate P215-52 | |
| Cinebench R15 / CPU Single 64Bit | |
| MSI WS66 10TMT-207US | |
| Dell Precision 7550 | |
| Genomsnitt Intel Core i9-10885H (197 - 212, n=3) | |
| Dell Precision 5550 P91F | |
| Dell Precision 3000 3551 | |
| Lenovo ThinkPad P53-20QN000YGE | |
| Lenovo ThinkPad P1 2019-20QT000RGE | |
| Dell Precision 5540 | |
| HP ZBook Firefly 15 G7 | |
| Acer ConceptD 3 Pro CN315-71P-73W1 | |
| Fujitsu Celsius H780 | |
| Lenovo ThinkPad P53s-20N6001NGE | |
| Acer TravelMate P215-52 | |
| Blender / v2.79 BMW27 CPU | |
| Acer TravelMate P215-52 | |
| Lenovo ThinkPad P53s-20N6001NGE | |
| HP ZBook Firefly 15 G7 | |
| Lenovo ThinkPad P1 2019-20QT000RGE | |
| Acer ConceptD 3 Pro CN315-71P-73W1 | |
| Fujitsu Celsius H780 | |
| Lenovo ThinkPad P53-20QN000YGE | |
| Dell Precision 5550 P91F | |
| Dell Precision 5540 | |
| Dell Precision 3000 3551 | |
| Genomsnitt Intel Core i9-10885H (283 - 348, n=3) | |
| Dell Precision 7550 | |
| MSI WS66 10TMT-207US | |
| 7-Zip 18.03 / 7z b 4 -mmt1 | |
| Genomsnitt Intel Core i9-10885H (5397 - 5668, n=3) | |
| Dell Precision 7550 | |
| Dell Precision 3000 3551 | |
| Dell Precision 5550 P91F | |
| MSI WS66 10TMT-207US | |
| Dell Precision 5540 | |
| Lenovo ThinkPad P53-20QN000YGE | |
| Lenovo ThinkPad P1 2019-20QT000RGE | |
| Lenovo ThinkPad P53s-20N6001NGE | |
| HP ZBook Firefly 15 G7 | |
| Acer ConceptD 3 Pro CN315-71P-73W1 | |
| Fujitsu Celsius H780 | |
| Acer TravelMate P215-52 | |
| 7-Zip 18.03 / 7z b 4 | |
| MSI WS66 10TMT-207US | |
| Dell Precision 7550 | |
| Genomsnitt Intel Core i9-10885H (36740 - 42993, n=3) | |
| Dell Precision 5550 P91F | |
| Dell Precision 5540 | |
| Dell Precision 3000 3551 | |
| Lenovo ThinkPad P53-20QN000YGE | |
| Fujitsu Celsius H780 | |
| Acer ConceptD 3 Pro CN315-71P-73W1 | |
| Lenovo ThinkPad P1 2019-20QT000RGE | |
| HP ZBook Firefly 15 G7 | |
| Lenovo ThinkPad P53s-20N6001NGE | |
| Acer TravelMate P215-52 | |
| Geekbench 5.5 / Single-Core | |
| MSI WS66 10TMT-207US | |
| Dell Precision 7550 | |
| Dell Precision 5550 P91F | |
| Genomsnitt Intel Core i9-10885H (1216 - 1376, n=3) | |
| HP ZBook Firefly 15 G7 | |
| Dell Precision 3000 3551 | |
| Acer ConceptD 3 Pro CN315-71P-73W1 | |
| Acer TravelMate P215-52 | |
| Geekbench 5.5 / Multi-Core | |
| Dell Precision 5550 P91F | |
| Dell Precision 7550 | |
| MSI WS66 10TMT-207US | |
| Genomsnitt Intel Core i9-10885H (6529 - 7693, n=3) | |
| Dell Precision 3000 3551 | |
| Acer ConceptD 3 Pro CN315-71P-73W1 | |
| HP ZBook Firefly 15 G7 | |
| Acer TravelMate P215-52 | |
| HWBOT x265 Benchmark v2.2 / 4k Preset | |
| Dell Precision 7550 | |
| MSI WS66 10TMT-207US | |
| Genomsnitt Intel Core i9-10885H (10.6 - 12.5, n=3) | |
| Dell Precision 5540 | |
| Dell Precision 3000 3551 | |
| Dell Precision 5550 P91F | |
| Lenovo ThinkPad P53-20QN000YGE | |
| Fujitsu Celsius H780 | |
| Acer ConceptD 3 Pro CN315-71P-73W1 | |
| Lenovo ThinkPad P1 2019-20QT000RGE | |
| HP ZBook Firefly 15 G7 | |
| Lenovo ThinkPad P53s-20N6001NGE | |
| Acer TravelMate P215-52 | |
| LibreOffice / 20 Documents To PDF | |
| HP ZBook Firefly 15 G7 | |
| Acer ConceptD 3 Pro CN315-71P-73W1 | |
| Acer TravelMate P215-52 | |
| Genomsnitt Intel Core i9-10885H (45.9 - 59.6, n=3) | |
| Dell Precision 7550 | |
| Dell Precision 3000 3551 | |
| MSI WS66 10TMT-207US | |
| Dell Precision 5550 P91F | |
| R Benchmark 2.5 / Overall mean | |
| Acer TravelMate P215-52 | |
| Acer ConceptD 3 Pro CN315-71P-73W1 | |
| HP ZBook Firefly 15 G7 | |
| Dell Precision 5550 P91F | |
| MSI WS66 10TMT-207US | |
| Dell Precision 3000 3551 | |
| Dell Precision 7550 | |
| Genomsnitt Intel Core i9-10885H (0.564 - 0.572, n=3) | |
Cinebench R15: CPU Multi 64Bit | CPU Single 64Bit
Blender: v2.79 BMW27 CPU
7-Zip 18.03: 7z b 4 -mmt1 | 7z b 4
Geekbench 5.5: Single-Core | Multi-Core
HWBOT x265 Benchmark v2.2: 4k Preset
LibreOffice : 20 Documents To PDF
R Benchmark 2.5: Overall mean
* ... mindre är bättre
| PCMark 10 | |
| Score | |
| Dell Precision 5550 P91F | |
| Dell Precision 3000 3551 | |
| MSI WP65 | |
| Dell Precision 3530 | |
| Lenovo ThinkPad P53s-20N6001NGE | |
| HP ZBook Firefly 15 G7 | |
| Essentials | |
| Dell Precision 3000 3551 | |
| Dell Precision 5550 P91F | |
| MSI WP65 | |
| Dell Precision 3530 | |
| Lenovo ThinkPad P53s-20N6001NGE | |
| HP ZBook Firefly 15 G7 | |
| Productivity | |
| Dell Precision 3000 3551 | |
| Dell Precision 3530 | |
| Dell Precision 5550 P91F | |
| MSI WP65 | |
| Lenovo ThinkPad P53s-20N6001NGE | |
| HP ZBook Firefly 15 G7 | |
| Digital Content Creation | |
| Dell Precision 5550 P91F | |
| MSI WP65 | |
| Dell Precision 3000 3551 | |
| Dell Precision 3530 | |
| Lenovo ThinkPad P53s-20N6001NGE | |
| HP ZBook Firefly 15 G7 | |
| PCMark 8 | |
| Home Score Accelerated v2 | |
| Dell Precision 3000 3551 | |
| Dell Precision 3530 | |
| MSI WP65 | |
| Lenovo ThinkPad P53s-20N6001NGE | |
| Dell Precision 5550 P91F | |
| HP ZBook Firefly 15 G7 | |
| Work Score Accelerated v2 | |
| Dell Precision 3530 | |
| Dell Precision 3000 3551 | |
| MSI WP65 | |
| Lenovo ThinkPad P53s-20N6001NGE | |
| Dell Precision 5550 P91F | |
| HP ZBook Firefly 15 G7 | |
| PCMark 8 Home Score Accelerated v2 | 4246 poäng | |
| PCMark 8 Work Score Accelerated v2 | 5287 poäng | |
| PCMark 10 Score | 5127 poäng | |
Hjälp | ||
| DPC Latencies / LatencyMon - interrupt to process latency (max), Web, Youtube, Prime95 | |
| Dell Precision 7550 | |
| HP ZBook Firefly 15 G7 | |
| MSI WS66 10TMT-207US | |
| Dell Precision 3000 3551 | |
| Dell Precision 5000 5750 P92F | |
| Dell Precision 5550 P91F | |
* ... mindre är bättre
| Dell Precision 3000 3551 Toshiba Kioxia XG6 KXG60PNV512G | HP ZBook Firefly 15 G7 Toshiba XG6 KXG60ZNV1T02 | Dell Precision 5550 P91F SK Hynix PC601A NVMe 1TB | Lenovo ThinkPad P53s-20N6001NGE Intel SSD 760p SSDPEKKW256G8 | MSI WP65 Samsung SSD PM981 MZVLB512HAJQ | Dell Precision 3530 SK hynix PC400 512 GB | |
|---|---|---|---|---|---|---|
| AS SSD | 13% | -53% | 4% | 10% | -13% | |
| Seq Read (MB/s) | 1833 | 2666 45% | 2039 11% | 2283 25% | 1097 -40% | 2682 46% |
| Seq Write (MB/s) | 1283 | 1257 -2% | 1376 7% | 1042 -19% | 1838 43% | 1272 -1% |
| 4K Read (MB/s) | 44.56 | 48.04 8% | 44.11 -1% | 46.62 5% | 52.9 19% | 25.98 -42% |
| 4K Write (MB/s) | 112.4 | 137.5 22% | 113.3 1% | 172.6 54% | 108.4 -4% | 102.8 -9% |
| 4K-64 Read (MB/s) | 1106 | 977 -12% | 1094 -1% | 759 -31% | 1509 36% | 994 -10% |
| 4K-64 Write (MB/s) | 1262 | 1142 -10% | 1630 29% | 916 -27% | 1695 34% | 908 -28% |
| Access Time Read * (ms) | 0.084 | 0.053 37% | 0.059 30% | 0.06 29% | 0.067 20% | 0.099 -18% |
| Access Time Write * (ms) | 0.105 | 0.03 71% | 0.99 -843% | 0.022 79% | 0.103 2% | 0.053 50% |
| Score Read (Points) | 1334 | 1292 -3% | 1342 1% | 1034 -22% | 1671 25% | 1288 -3% |
| Score Write (Points) | 1503 | 1406 -6% | 1881 25% | 1192 -21% | 1988 32% | 1138 -24% |
| Score Total (Points) | 3498 | 3297 -6% | 3883 11% | 2705 -23% | 4558 30% | 3013 -14% |
| Copy ISO MB/s (MB/s) | 2940 | 2489 -15% | 1800 -39% | 1701 -42% | ||
| Copy Program MB/s (MB/s) | 733 | 682 -7% | 569 -22% | 346.1 -53% | ||
| Copy Game MB/s (MB/s) | 1442 | 1515 5% | 1409 -2% | 1050 -27% | ||
| CrystalDiskMark 5.2 / 6 | 8% | -2% | 16% | 3% | -14% | |
| Write 4K (MB/s) | 120.9 | 133.1 10% | 122.6 1% | 195.9 62% | 126.9 5% | 113.6 -6% |
| Read 4K (MB/s) | 46.79 | 51.6 10% | 42.4 -9% | 74.9 60% | 44.91 -4% | 41.18 -12% |
| Write Seq (MB/s) | 1916 | 1986 4% | 2167 13% | 1194 -38% | 1944 1% | 1417 -26% |
| Read Seq (MB/s) | 2216 | 2208 0% | 1747 -21% | 2309 4% | 1449 -35% | 1896 -14% |
| Write 4K Q32T1 (MB/s) | 393.9 | 462.3 17% | 388.8 -1% | 507 29% | 531 35% | 355 -10% |
| Read 4K Q32T1 (MB/s) | 375.1 | 400.2 7% | 367.3 -2% | 624 66% | 579 54% | 404.3 8% |
| Write Seq Q32T1 (MB/s) | 2795 | 3074 10% | 2629 -6% | 1206 -57% | 1970 -30% | 1411 -50% |
| Read Seq Q32T1 (MB/s) | 3106 | 3268 5% | 3460 11% | 3091 0% | 2990 -4% | 3095 0% |
| Totalt genomsnitt (program/inställningar) | 11% /
11% | -28% /
-35% | 10% /
9% | 7% /
7% | -14% /
-13% |
* ... mindre är bättre

Kontinuerlig inläsning: DiskSpd Read Loop, Queue Depth 8
| 3DMark | |
| 1920x1080 Fire Strike Graphics | |
| Dell Precision 7550 | |
| Acer ConceptD 3 Pro CN315-71P-73W1 | |
| Dell Precision 5550 P91F | |
| Dell Precision 5540 | |
| HP ZBook Studio G5-4QH10EA | |
| MSI WP65 | |
| Genomsnitt NVIDIA Quadro P620 (4600 - 4745, n=2) | |
| Dell Precision 3000 3551 | |
| Lenovo ThinkPad P53s-20N6001NGE | |
| HP ZBook Firefly 15 G7 | |
| HP ZBook 15u G6 6TP54EA | |
| 2560x1440 Time Spy Graphics | |
| Dell Precision 7550 | |
| Dell Precision 7540 | |
| Acer ConceptD 3 Pro CN315-71P-73W1 | |
| Dell Precision 5550 P91F | |
| Dell Precision 5540 | |
| HP ZBook Studio G5-4QH10EA | |
| Dell Precision 3000 3551 | |
| Genomsnitt NVIDIA Quadro P620 (1383 - 1393, n=2) | |
| MSI WP65 | |
| Lenovo ThinkPad P53s-20N6001NGE | |
| HP ZBook Firefly 15 G7 | |
| HP ZBook 15u G6 6TP54EA | |
| 3DMark 11 | |
| 1280x720 Performance GPU | |
| Dell Precision 7550 | |
| Acer ConceptD 3 Pro CN315-71P-73W1 | |
| Dell Precision 5540 | |
| Dell Precision 5550 P91F | |
| HP ZBook Studio G5-4QH10EA | |
| Genomsnitt NVIDIA Quadro P620 (5850 - 6059, n=3) | |
| MSI WP65 | |
| Dell Precision 3000 3551 | |
| Lenovo ThinkPad P53s-20N6001NGE | |
| HP ZBook 15u G6 6TP54EA | |
| HP ZBook Firefly 15 G7 | |
| 1280x720 Performance Combined | |
| Dell Precision 5550 P91F | |
| Dell Precision 7550 | |
| Acer ConceptD 3 Pro CN315-71P-73W1 | |
| Dell Precision 5540 | |
| HP ZBook Studio G5-4QH10EA | |
| MSI WP65 | |
| Genomsnitt NVIDIA Quadro P620 (6069 - 6289, n=2) | |
| Dell Precision 3000 3551 | |
| HP ZBook 15u G6 6TP54EA | |
| Lenovo ThinkPad P53s-20N6001NGE | |
| HP ZBook Firefly 15 G7 | |
| 3DMark 06 Standard Score | 35322 poäng | |
| 3DMark 11 Performance | 6519 poäng | |
| 3DMark Cloud Gate Standard Score | 24082 poäng | |
| 3DMark Fire Strike Score | 4402 poäng | |
| 3DMark Time Spy Score | 1593 poäng | |
Hjälp | ||
| låg | med. | hög | ultra | |
|---|---|---|---|---|
| The Witcher 3 (2015) | 90.7 | 51.7 | 31.5 | 16.5 |
| Dota 2 Reborn (2015) | 156 | 139 | 90.2 | 82.8 |
| Final Fantasy XV Benchmark (2018) | 51.7 | 25.8 | 18.5 | |
| X-Plane 11.11 (2018) | 104 | 71.3 | 63.9 |
| Dell Precision 3000 3551 Quadro P620, i9-10885H, Toshiba Kioxia XG6 KXG60PNV512G | HP ZBook Firefly 15 G7 Quadro P520, i7-10610U, Toshiba XG6 KXG60ZNV1T02 | Dell Precision 5550 P91F Quadro T2000 Max-Q, i7-10875H, SK Hynix PC601A NVMe 1TB | Lenovo ThinkPad P53s-20N6001NGE Quadro P520, i7-8565U, Intel SSD 760p SSDPEKKW256G8 | MSI WP65 Quadro P620, i7-9750H, Samsung SSD PM981 MZVLB512HAJQ | Dell Precision 3530 Quadro P600, E-2176M, SK hynix PC400 512 GB | |
|---|---|---|---|---|---|---|
| Noise | 6% | 4% | 3% | -11% | -3% | |
| av / miljö * (dB) | 25.8 | 29.3 -14% | 26.2 -2% | 29.2 -13% | 28.7 -11% | 28.1 -9% |
| Idle Minimum * (dB) | 26.2 | 29.3 -12% | 26.2 -0% | 29.2 -11% | 33.4 -27% | 28.3 -8% |
| Idle Average * (dB) | 26.2 | 29.3 -12% | 26.2 -0% | 29.2 -11% | 33.5 -28% | 28.3 -8% |
| Idle Maximum * (dB) | 26.2 | 30 -15% | 26.2 -0% | 30.8 -18% | 33.5 -28% | 28.4 -8% |
| Load Average * (dB) | 51.2 | 32.8 36% | 39.2 23% | 32.6 36% | 37 28% | 46.2 10% |
| Witcher 3 ultra * (dB) | 42.7 | 32.8 23% | 39 9% | 38.7 9% | ||
| Load Maximum * (dB) | 50.7 | 32.8 35% | 50.6 -0% | 33.8 33% | 59.5 -17% | 48.6 4% |
* ... mindre är bättre
Ljudnivå
| Låg belastning |
| 26.2 / 26.2 / 26.2 dB(A) |
| Hög belastning |
| 51.2 / 50.7 dB(A) |
 | ||
30 dB tyst 40 dB(A) hörbar 50 dB(A) högt ljud |
||
min: | ||
(-) Den maximala temperaturen på ovansidan är 47 °C / 117 F, jämfört med genomsnittet av 38.2 °C / 101 F , allt från 22.2 till 69.8 °C för klassen Workstation.
(-) Botten värms upp till maximalt 54.6 °C / 130 F, jämfört med genomsnittet av 41.1 °C / 106 F
(+) Vid tomgångsbruk är medeltemperaturen för ovansidan 26.3 °C / 79 F, jämfört med enhetsgenomsnittet på 32 °C / ### class_avg_f### F.
(±) När du spelar The Witcher 3 är medeltemperaturen för ovansidan 35.1 °C / 95 F, jämfört med enhetsgenomsnittet på 32 °C / ## #class_avg_f### F.
(+) Handledsstöden och pekplattan är kallare än hudtemperaturen med maximalt 27.4 °C / 81.3 F och är därför svala att ta på.
(±) Medeltemperaturen för handledsstödsområdet på liknande enheter var 27.8 °C / 82 F (+0.4 °C / 0.7 F).
Dell Precision 3000 3551 ljudanalys
(+) | högtalare kan spela relativt högt (84.5 dB)
Bas 100 - 315 Hz
(-) | nästan ingen bas - i genomsnitt 19.8% lägre än medianen
(±) | linjäriteten för basen är genomsnittlig (10.1% delta till föregående frekvens)
Mellan 400 - 2000 Hz
(+) | balanserad mellan - endast 4% från medianen
(+) | mids är linjära (5.4% delta till föregående frekvens)
Högsta 2 - 16 kHz
(+) | balanserade toppar - endast 3.4% från medianen
(+) | toppar är linjära (2.9% delta till föregående frekvens)
Totalt 100 - 16 000 Hz
(±) | linjäriteten för det totala ljudet är genomsnittlig (15.5% skillnad mot median)
Jämfört med samma klass
» 35% av alla testade enheter i den här klassen var bättre, 10% liknande, 55% sämre
» Den bästa hade ett delta på 7%, genomsnittet var 17%, sämst var 35%
Jämfört med alla testade enheter
» 23% av alla testade enheter var bättre, 4% liknande, 73% sämre
» Den bästa hade ett delta på 4%, genomsnittet var 24%, sämst var 134%
Apple MacBook 12 (Early 2016) 1.1 GHz ljudanalys
(+) | högtalare kan spela relativt högt (83.6 dB)
Bas 100 - 315 Hz
(±) | reducerad bas - i genomsnitt 11.3% lägre än medianen
(±) | linjäriteten för basen är genomsnittlig (14.2% delta till föregående frekvens)
Mellan 400 - 2000 Hz
(+) | balanserad mellan - endast 2.4% från medianen
(+) | mids är linjära (5.5% delta till föregående frekvens)
Högsta 2 - 16 kHz
(+) | balanserade toppar - endast 2% från medianen
(+) | toppar är linjära (4.5% delta till föregående frekvens)
Totalt 100 - 16 000 Hz
(+) | det totala ljudet är linjärt (10.2% skillnad mot median)
Jämfört med samma klass
» 7% av alla testade enheter i den här klassen var bättre, 2% liknande, 91% sämre
» Den bästa hade ett delta på 5%, genomsnittet var 18%, sämst var 53%
Jämfört med alla testade enheter
» 5% av alla testade enheter var bättre, 1% liknande, 94% sämre
» Den bästa hade ett delta på 4%, genomsnittet var 24%, sämst var 134%
| Av/Standby | |
| Låg belastning | |
| Hög belastning |
|
Förklaring:
min: | |
| Dell Precision 3000 3551 i9-10885H, Quadro P620, Toshiba Kioxia XG6 KXG60PNV512G, IPS, 1920x1080, 15.6" | HP ZBook Firefly 15 G7 i7-10610U, Quadro P520, Toshiba XG6 KXG60ZNV1T02, IPS LED, 3840x2160, 15.6" | Dell Precision 5550 P91F i7-10875H, Quadro T2000 Max-Q, SK Hynix PC601A NVMe 1TB, IPS, 3840x2400, 15.6" | Lenovo ThinkPad P53s-20N6001NGE i7-8565U, Quadro P520, Intel SSD 760p SSDPEKKW256G8, IPS, 1920x1080, 15.6" | MSI WP65 i7-9750H, Quadro P620, Samsung SSD PM981 MZVLB512HAJQ, IPS, 1920x1080, 15.6" | Dell Precision 3530 E-2176M, Quadro P600, SK hynix PC400 512 GB, IPS, 1920x1080, 15.6" | |
|---|---|---|---|---|---|---|
| Power Consumption | 26% | -31% | 33% | -43% | -10% | |
| Idle Minimum * (Watt) | 5.7 | 3.5 39% | 5.6 2% | 2.74 52% | 5.6 2% | 5.3 7% |
| Idle Average * (Watt) | 8.7 | 6.7 23% | 11.2 -29% | 6.4 26% | 8.6 1% | 10.7 -23% |
| Idle Maximum * (Watt) | 9 | 9.6 -7% | 18.4 -104% | 9.7 -8% | 30.7 -241% | 14.1 -57% |
| Load Average * (Watt) | 100.2 | 60 40% | 114 -14% | 55.2 45% | 78 22% | 85.4 15% |
| Witcher 3 ultra * (Watt) | 56 | 49.3 12% | 76.7 -37% | 63.5 -13% | 75.5 -35% | |
| Load Maximum * (Watt) | 133.2 | 68.6 48% | 134.2 -1% | 69.4 48% | 170.2 -28% | 91.9 31% |
* ... mindre är bättre
| Dell Precision 3000 3551 i9-10885H, Quadro P620, 97 Wh | HP ZBook Firefly 15 G7 i7-10610U, Quadro P520, 53 Wh | Dell Precision 5550 P91F i7-10875H, Quadro T2000 Max-Q, 86 Wh | Lenovo ThinkPad P53s-20N6001NGE i7-8565U, Quadro P520, 57 Wh | MSI WP65 i7-9750H, Quadro P620, 51 Wh | Dell Precision 3530 E-2176M, Quadro P600, 92 Wh | |
|---|---|---|---|---|---|---|
| Batteridrifttid | -33% | -34% | -37% | -56% | -32% | |
| WiFi v1.3 (h) | 13.6 | 9.1 -33% | 9 -34% | 8.6 -37% | 6 -56% | 9.3 -32% |
| Load (h) | 2 | 1.4 | 2.5 | 0.6 | 1.6 | |
| Reader / Idle (h) | 22.6 | 25.2 | 10.1 | 18.8 |
För
Emot
Läs den fullständiga versionen av den här recensionen på engelska här.
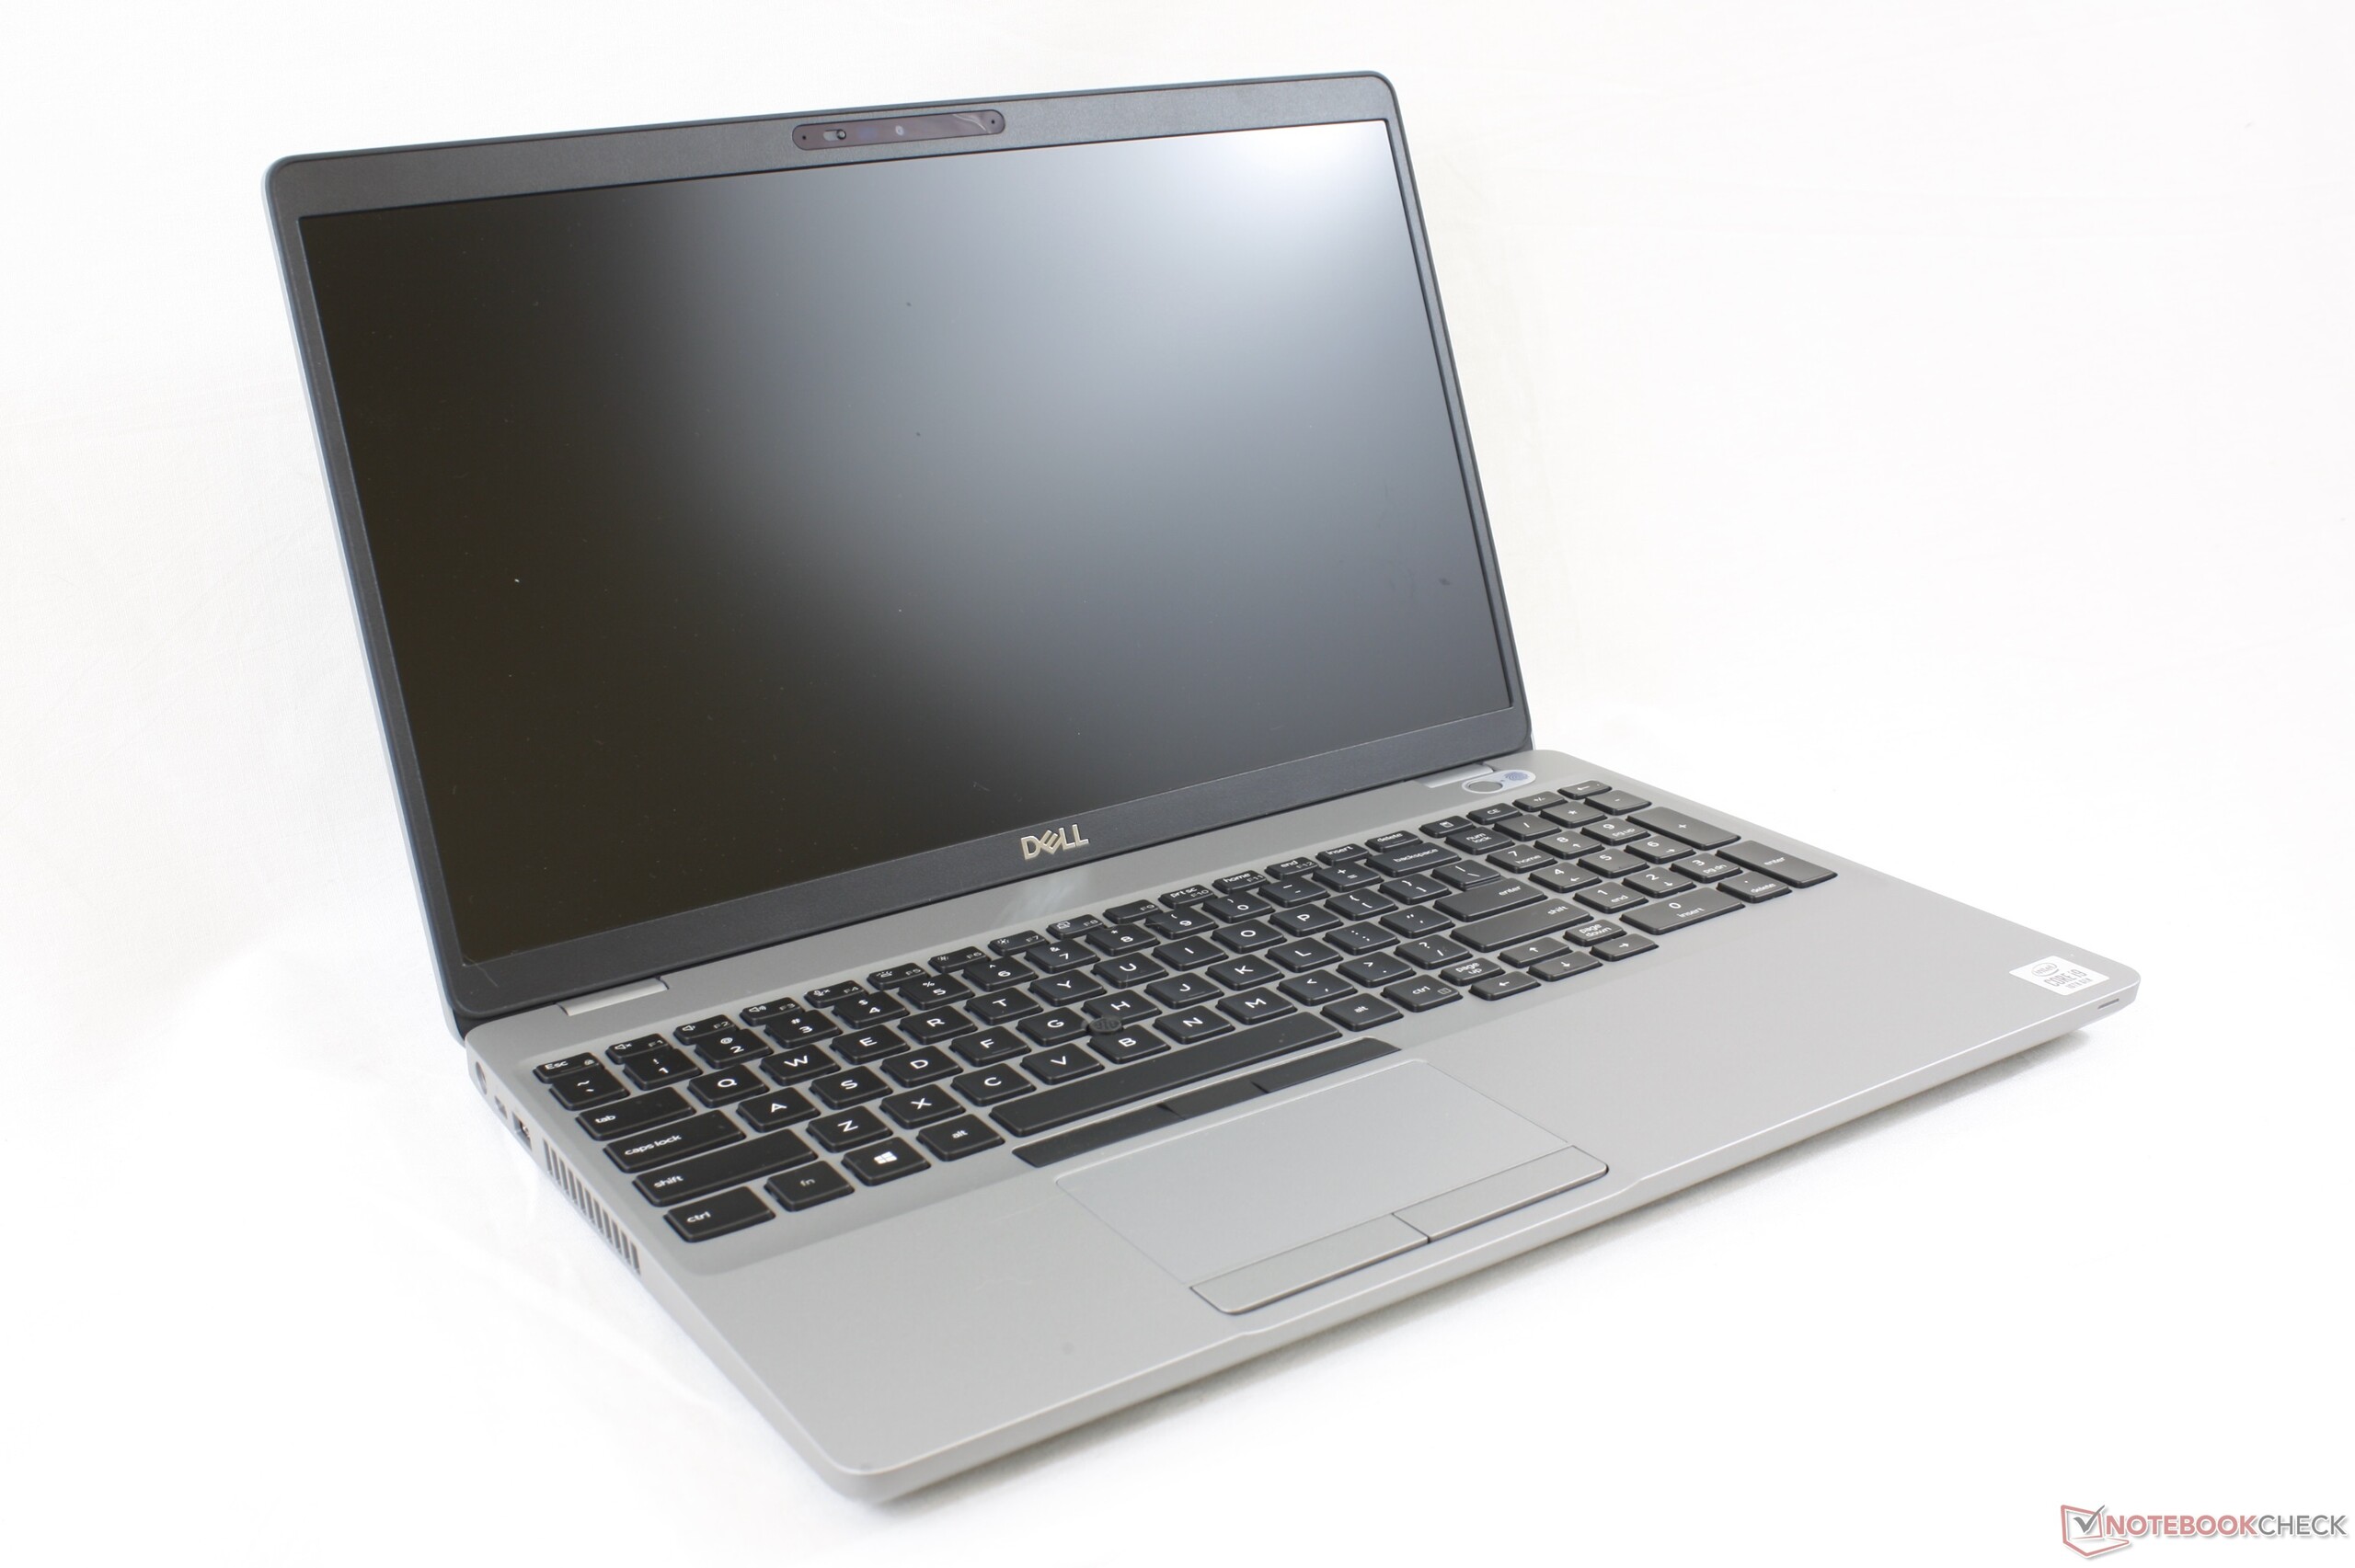
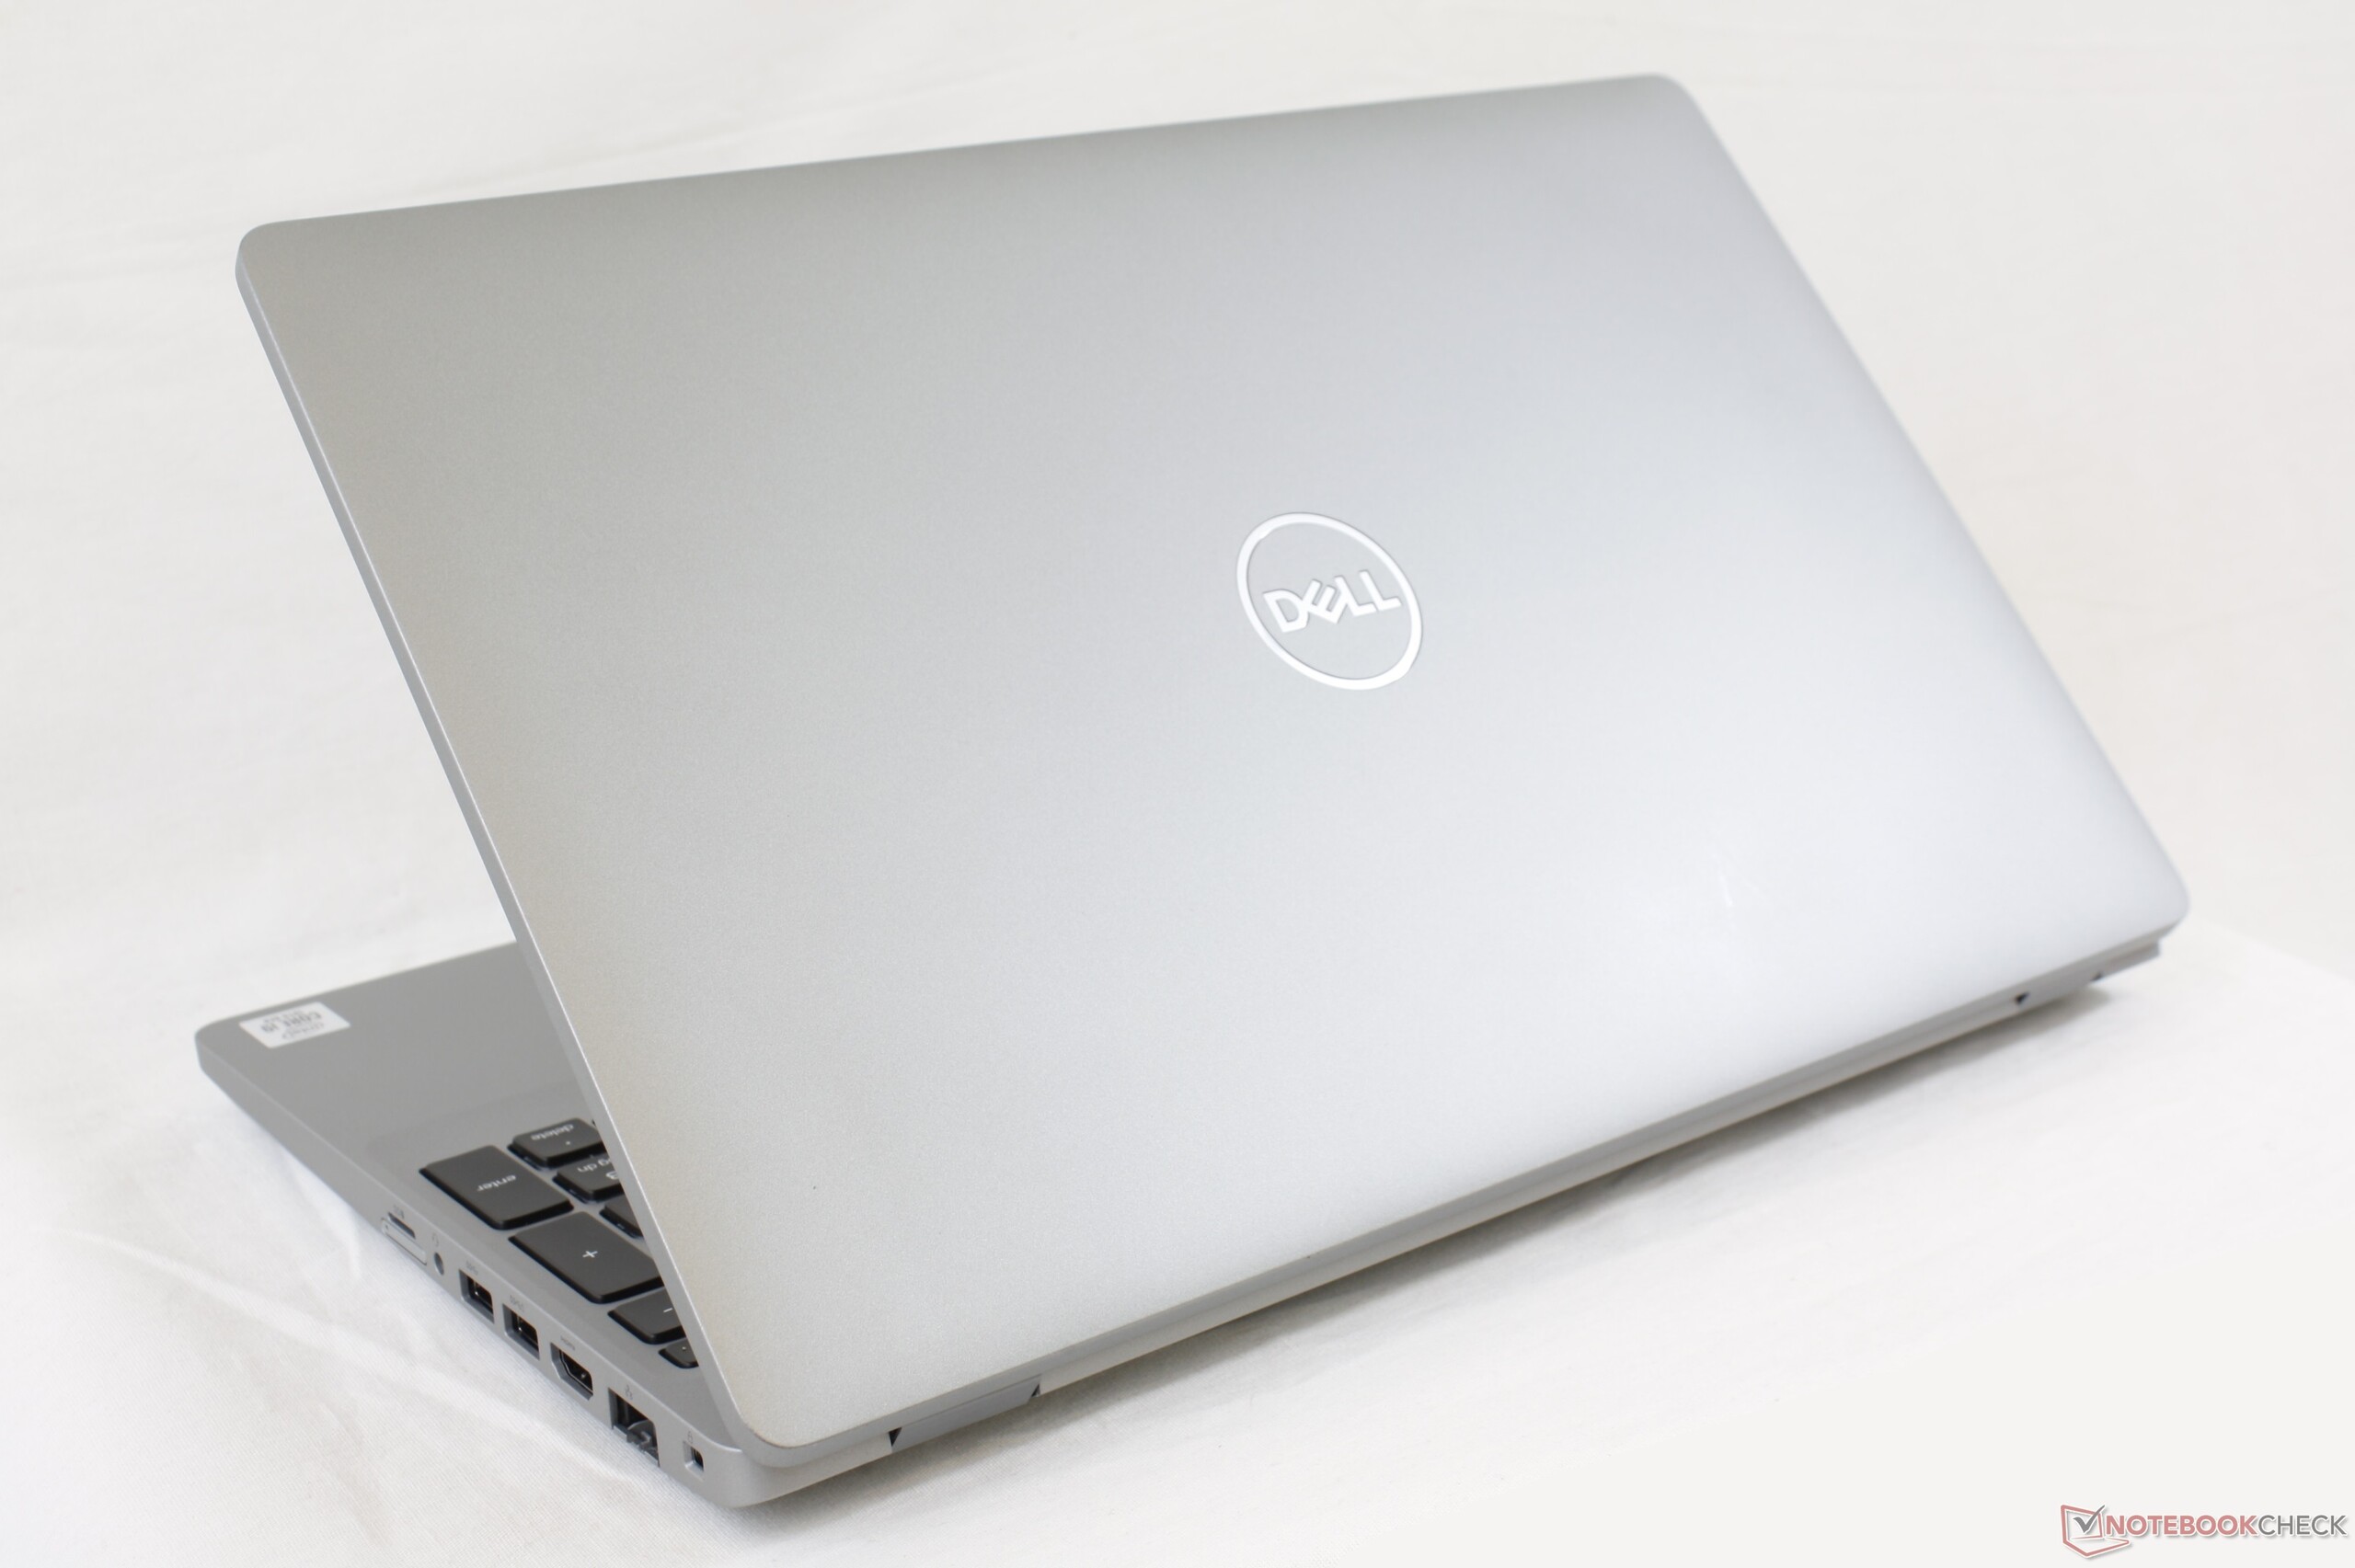
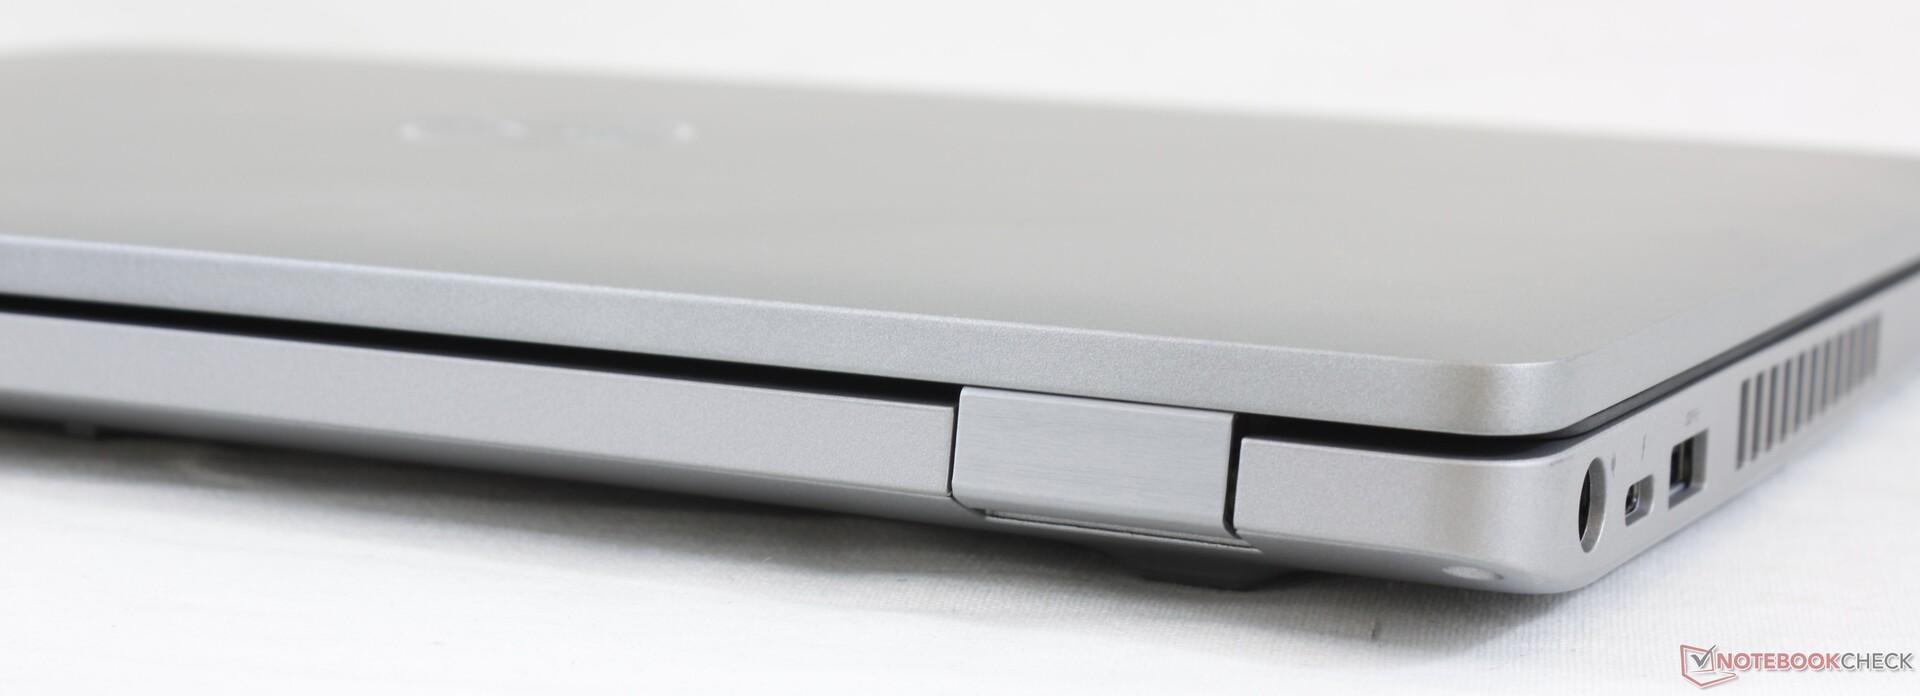
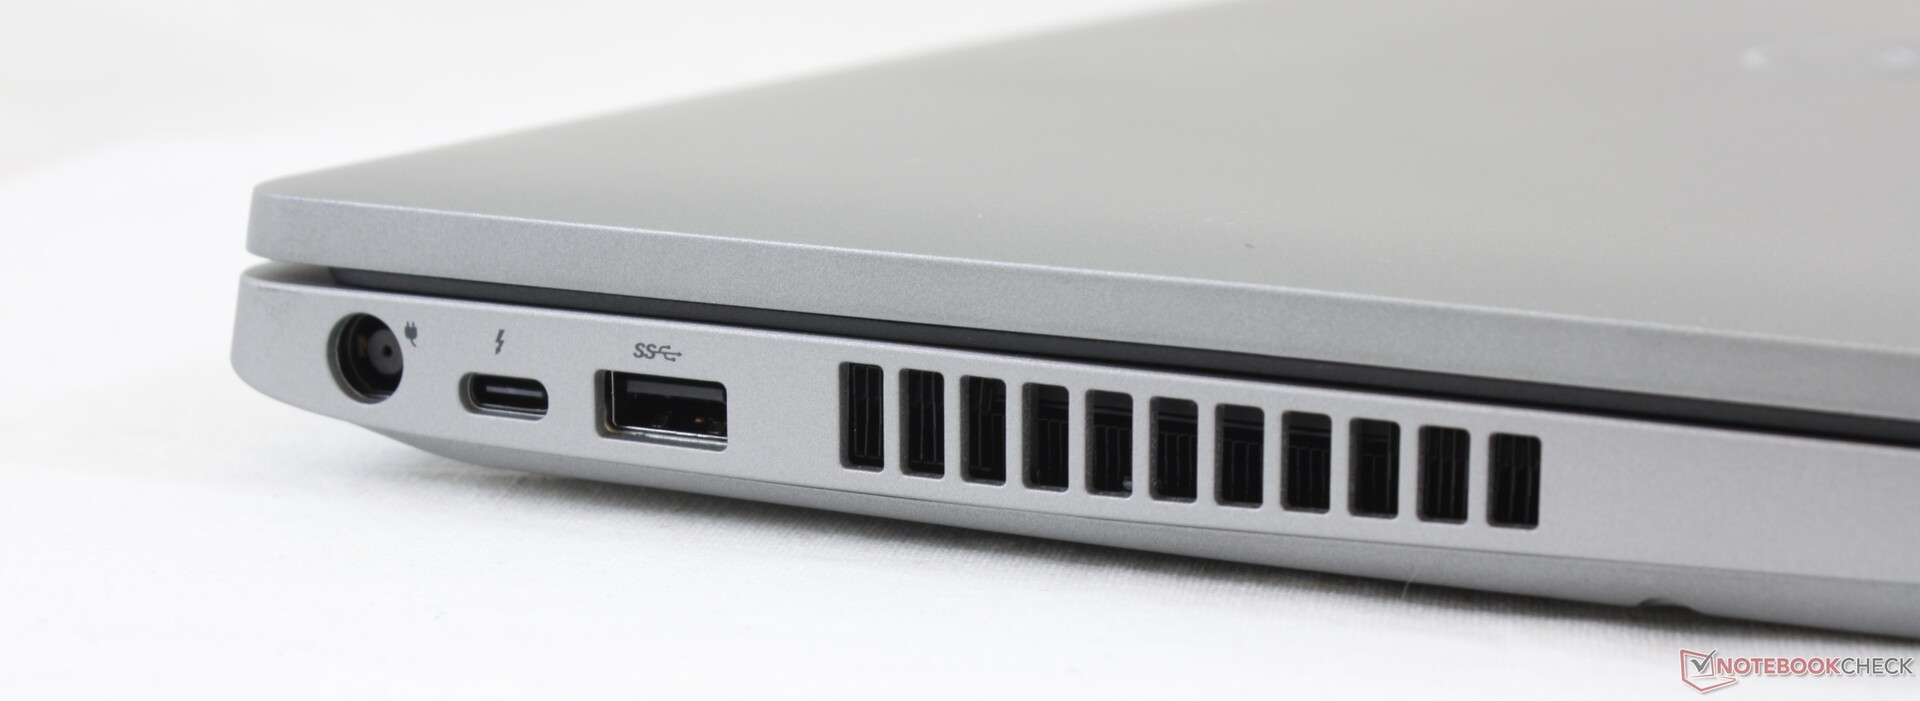
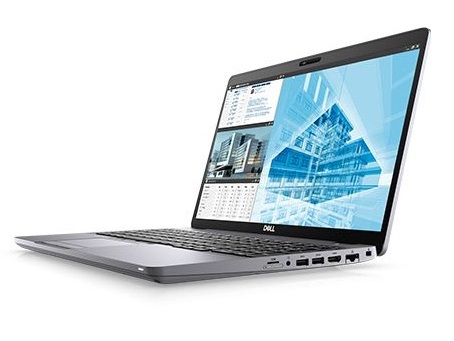
Precision 3551 har alla grunder som en klassisk mobil arbetsstation behöver. TrackPoint, faktiska musknappar, Smart Card, WWAN, servicemöjligheter och ett flertal andra hårdvarumöjligheter inklusive dubbel lagring. Thunderbolt 3 är trevligt, särskilt med tanke på att detta är tänkt att vara en "enkel" arbetsstation. Om portar och användbarhet ligger överst på din lista är Precision 3551 en bra modell utan krusiduller som inte kräver att du tömmer ditt bankkonto.
Men den här arbetsstationen blir mindre imponerande när vi pratar om prestanda och visuell design. Grafiken är begränsad till äldre Quadro P620 och en Core i9-109880H hade varit ännu bättre när det kommer till möjligheten att upprätthålla Turbo Boost. Utseendet är funktionellt, men också tråkigt. Du får leta lite längre upp i högen tills du hittar Precision 5000- eller Precision 7000-serierna om du vill ha ett tjusigare system med högre prestanda.
Utmärkt portutbud och användbara funktioner, även om grafikprestandan är begränsad och chassit har en gammaldags design.
Dell Precision 3000 3551
- 10/09/2020 v7 (old)
Allen Ngo