Test: Lenovo ThinkPad P14s Gen 1 - Enklare arbetsstation med hög värmeutveckling (Sammanfattning)
Testgrupp
Gradering | Datum | Modell | Vikt | Höjd | Storlek | Upplösning | Pris |
|---|---|---|---|---|---|---|---|
| 82.7 % v7 (old) | 01/2021 | Lenovo ThinkPad P14s Gen1 20S40009GE i7-10510U, Quadro P520 | 1.5 kg | 17.9 mm | 14.00" | 1920x1080 | |
| 82.4 % v7 (old) | HP ZBook Firefly 14 G7 i7-10610U, Quadro P520 | 1.4 kg | 17.9 mm | 14.00" | 1920x1080 | ||
| 88 % v7 (old) | 07/2020 | Lenovo ThinkPad T14-20S1S06B00 i5-10210U, UHD Graphics 620 | 1.5 kg | 17.9 mm | 14.00" | 1920x1080 | |
| 88.9 % v7 (old) | 11/2020 | Lenovo ThinkPad T14-20UES00H00 R5 PRO 4650U, Vega 6 | 1.5 kg | 17.9 mm | 14.00" | 1920x1080 | |
| 80.1 % v7 (old) | Lenovo ThinkPad P43s-20RH001FGE i7-8565U, Quadro P520 | 1.5 kg | 18.9 mm | 14.00" | 1920x1080 |
| SD Card Reader | |
| average JPG Copy Test (av. of 3 runs) | |
| Genomsnitt av klass Workstation (49.6 - 681, n=14, senaste 2 åren) | |
| Lenovo ThinkPad P43s-20RH001FGE (Toshiba Exceria Pro M501 64 GB UHS-II) | |
| Lenovo ThinkPad T14-20UES00H00 (Toshiba Exceria Pro M501 64 GB UHS-II) | |
| Lenovo ThinkPad T14-20S1S06B00 (Toshiba Exceria Pro M501 64 GB UHS-II) | |
| Lenovo ThinkPad P14s Gen1 20S40009GE (Toshiba Exceria Pro SDXC 64 GB UHS-II) | |
| maximum AS SSD Seq Read Test (1GB) | |
| Genomsnitt av klass Workstation (87.6 - 1455, n=14, senaste 2 åren) | |
| Lenovo ThinkPad T14-20UES00H00 (Toshiba Exceria Pro M501 64 GB UHS-II) | |
| Lenovo ThinkPad P43s-20RH001FGE (Toshiba Exceria Pro M501 64 GB UHS-II) | |
| Lenovo ThinkPad T14-20S1S06B00 (Toshiba Exceria Pro M501 64 GB UHS-II) | |
| Lenovo ThinkPad P14s Gen1 20S40009GE (Toshiba Exceria Pro SDXC 64 GB UHS-II) | |
| Networking | |
| iperf3 transmit AX12 | |
| Lenovo ThinkPad P14s Gen1 20S40009GE | |
| Genomsnitt Intel Wi-Fi 6 AX201 (49.8 - 1775, n=324) | |
| HP ZBook Firefly 14 G7 | |
| Lenovo ThinkPad T14-20S1S06B00 | |
| Lenovo ThinkPad T14-20UES00H00 | |
| Lenovo ThinkPad P43s-20RH001FGE | |
| iperf3 receive AX12 | |
| Lenovo ThinkPad T14-20S1S06B00 | |
| Lenovo ThinkPad P14s Gen1 20S40009GE | |
| HP ZBook Firefly 14 G7 | |
| Genomsnitt Intel Wi-Fi 6 AX201 (136 - 1743, n=324) | |
| Lenovo ThinkPad T14-20UES00H00 | |
| Lenovo ThinkPad P43s-20RH001FGE | |


| |||||||||||||||||||||||||
Distribution av ljusstyrkan: 88 %
Mitt på batteriet: 389 cd/m²
Kontrast: 2032:1 (Svärta: 0.19 cd/m²)
ΔE ColorChecker Calman: 4.4 | ∀{0.5-29.43 Ø4.73}
calibrated: 1.2
ΔE Greyscale Calman: 5.1 | ∀{0.09-98 Ø4.97}
96.4% sRGB (Argyll 1.6.3 3D)
61.2% AdobeRGB 1998 (Argyll 1.6.3 3D)
66.7% AdobeRGB 1998 (Argyll 3D)
96.6% sRGB (Argyll 3D)
65.5% Display P3 (Argyll 3D)
Gamma: 2.5
CCT: 7464 K
| Lenovo ThinkPad P14s Gen1 20S40009GE B140HAN05.7, LTPS IPS LED, 1920x1080, 14" | HP ZBook Firefly 14 G7 InfoVision IVO8C78 (X140NVFC R0), IPS, 1920x1080, 14" | Lenovo ThinkPad T14-20S1S06B00 B140HAN05.7, LTPS IPS LED, 1920x1080, 14" | Lenovo ThinkPad T14-20UES00H00 B140HAN05.7, IPS, 1920x1080, 14" | Lenovo ThinkPad P43s-20RH001FGE Lenovo N140HCA-EAC, IPS, 1920x1080, 14" | |
|---|---|---|---|---|---|
| Display | 9% | 1% | 0% | -35% | |
| Display P3 Coverage (%) | 65.5 | 73.8 13% | 66 1% | 66.1 1% | 42.23 -36% |
| sRGB Coverage (%) | 96.6 | 99 2% | 96.8 0% | 95.8 -1% | 63.1 -35% |
| AdobeRGB 1998 Coverage (%) | 66.7 | 75.5 13% | 67.1 1% | 67.2 1% | 43.68 -35% |
| Response Times | -16% | 10% | 0% | 17% | |
| Response Time Grey 50% / Grey 80% * (ms) | 64 ? | 54.8 ? 14% | 58.4 ? 9% | 64 ? -0% | 42.6 ? 33% |
| Response Time Black / White * (ms) | 29.6 ? | 43.2 ? -46% | 26.4 ? 11% | 29.6 ? -0% | 29.6 ? -0% |
| PWM Frequency (Hz) | 284.1 ? | 24750 ? | |||
| Screen | 10% | 6% | 6% | -59% | |
| Brightness middle (cd/m²) | 386 | 934 142% | 397 3% | 406 5% | 232 -40% |
| Brightness (cd/m²) | 379 | 937 147% | 394 4% | 403 6% | 214 -44% |
| Brightness Distribution (%) | 88 | 87 -1% | 90 2% | 88 0% | 89 1% |
| Black Level * (cd/m²) | 0.19 | 0.37 -95% | 0.2 -5% | 0.2 -5% | 0.17 11% |
| Contrast (:1) | 2032 | 2524 24% | 1985 -2% | 2030 0% | 1365 -33% |
| Colorchecker dE 2000 * | 4.4 | 4.7 -7% | 3.6 18% | 3.3 25% | 5.9 -34% |
| Colorchecker dE 2000 max. * | 7.2 | 10.5 -46% | 5.9 18% | 4.8 33% | 20.3 -182% |
| Colorchecker dE 2000 calibrated * | 1.2 | 1.6 -33% | 1.2 -0% | 1.5 -25% | 4.4 -267% |
| Greyscale dE 2000 * | 5.1 | 7.1 -39% | 3.9 24% | 3.6 29% | 4.8 6% |
| Gamma | 2.5 88% | 2.31 95% | 2.48 89% | 2.43 91% | 1.98 111% |
| CCT | 7464 87% | 6348 102% | 7090 92% | 6893 94% | 6226 104% |
| Color Space (Percent of AdobeRGB 1998) (%) | 61.2 | 68.5 12% | 61.4 0% | 61.5 0% | 40.2 -34% |
| Color Space (Percent of sRGB) (%) | 96.4 | 98.9 3% | 96.6 0% | 95.5 -1% | 62.8 -35% |
| Totalt genomsnitt (program/inställningar) | 1% /
6% | 6% /
5% | 2% /
4% | -26% /
-45% |
* ... mindre är bättre
Visa svarstider
| ↔ Svarstid svart till vitt | ||
|---|---|---|
| 29.6 ms ... stiga ↗ och falla ↘ kombinerat | ↗ 13.2 ms stiga | 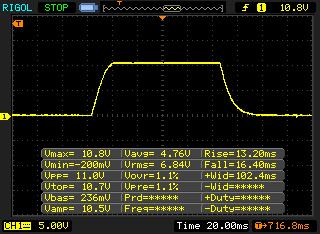 |
| ↘ 16.4 ms hösten | ||
| Skärmen visar relativt långsamma svarsfrekvenser i våra tester och kan vara för långsam för spelare. I jämförelse sträcker sig alla testade enheter från 0.1 (minst) till 240 (maximalt) ms. » 79 % av alla enheter är bättre. Detta innebär att den uppmätta svarstiden är sämre än genomsnittet av alla testade enheter (19.9 ms). | ||
| ↔ Svarstid 50 % grått till 80 % grått | ||
| 64 ms ... stiga ↗ och falla ↘ kombinerat | ↗ 30.8 ms stiga | 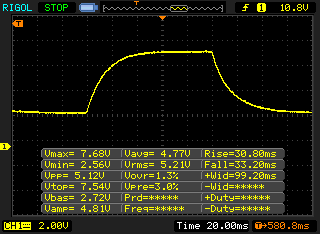 |
| ↘ 33.2 ms hösten | ||
| Skärmen visar långsamma svarsfrekvenser i våra tester och kommer att vara otillfredsställande för spelare. I jämförelse sträcker sig alla testade enheter från 0.165 (minst) till 636 (maximalt) ms. » 97 % av alla enheter är bättre. Detta innebär att den uppmätta svarstiden är sämre än genomsnittet av alla testade enheter (31.1 ms). | ||
Skärmflimmer / PWM (Puls-Width Modulation)
| Skärmflimmer / PWM upptäcktes inte | 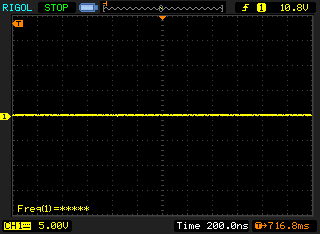 | ||
Som jämförelse: 52 % av alla testade enheter använder inte PWM för att dämpa skärmen. Om PWM upptäcktes mättes ett medelvärde av 7801 (minst: 5 - maximum: 343500) Hz. | |||
Cinebench R15: CPU Multi 64Bit | CPU Single 64Bit
Blender: v2.79 BMW27 CPU
7-Zip 18.03: 7z b 4 -mmt1 | 7z b 4
Geekbench 5.5: Single-Core | Multi-Core
HWBOT x265 Benchmark v2.2: 4k Preset
LibreOffice : 20 Documents To PDF
R Benchmark 2.5: Overall mean
| Cinebench R20 / CPU (Multi Core) | |
| Genomsnitt av klass Workstation (5471 - 15043, n=25, senaste 2 åren) | |
| Lenovo ThinkPad T14-20UES00H00 | |
| HP ZBook Firefly 14 G7 | |
| Lenovo ThinkPad P14s Gen1 20S40009GE | |
| Lenovo ThinkPad T14-20S1S06B00 | |
| Genomsnitt Intel Core i7-10510U (1015 - 1897, n=38) | |
| Lenovo ThinkPad P43s-20RH001FGE | |
| Cinebench R20 / CPU (Single Core) | |
| Genomsnitt av klass Workstation (671 - 857, n=25, senaste 2 åren) | |
| HP ZBook Firefly 14 G7 | |
| Lenovo ThinkPad P14s Gen1 20S40009GE | |
| Lenovo ThinkPad T14-20UES00H00 | |
| Genomsnitt Intel Core i7-10510U (362 - 497, n=37) | |
| Lenovo ThinkPad T14-20S1S06B00 | |
| Lenovo ThinkPad P43s-20RH001FGE | |
| Cinebench R15 / CPU Multi 64Bit | |
| Genomsnitt av klass Workstation (2489 - 5810, n=25, senaste 2 åren) | |
| Lenovo ThinkPad T14-20UES00H00 | |
| HP ZBook Firefly 14 G7 | |
| Lenovo ThinkPad T14-20S1S06B00 | |
| Lenovo ThinkPad P14s Gen1 20S40009GE | |
| Genomsnitt Intel Core i7-10510U (482 - 856, n=45) | |
| Lenovo ThinkPad P43s-20RH001FGE | |
| Cinebench R15 / CPU Single 64Bit | |
| Genomsnitt av klass Workstation (191.4 - 328, n=25, senaste 2 åren) | |
| HP ZBook Firefly 14 G7 | |
| Lenovo ThinkPad P14s Gen1 20S40009GE | |
| Genomsnitt Intel Core i7-10510U (113 - 202, n=42) | |
| Lenovo ThinkPad T14-20UES00H00 | |
| Lenovo ThinkPad T14-20S1S06B00 | |
| Lenovo ThinkPad P43s-20RH001FGE | |
| Blender / v2.79 BMW27 CPU | |
| Lenovo ThinkPad T14-20S1S06B00 | |
| Genomsnitt Intel Core i7-10510U (628 - 1051, n=31) | |
| Lenovo ThinkPad P43s-20RH001FGE | |
| Lenovo ThinkPad P14s Gen1 20S40009GE | |
| HP ZBook Firefly 14 G7 | |
| Lenovo ThinkPad T14-20UES00H00 | |
| Genomsnitt av klass Workstation (91 - 261, n=25, senaste 2 åren) | |
| 7-Zip 18.03 / 7z b 4 -mmt1 | |
| Genomsnitt av klass Workstation (5126 - 6960, n=25, senaste 2 åren) | |
| HP ZBook Firefly 14 G7 | |
| Lenovo ThinkPad P14s Gen1 20S40009GE | |
| Lenovo ThinkPad P43s-20RH001FGE | |
| Genomsnitt Intel Core i7-10510U (3747 - 4981, n=31) | |
| Lenovo ThinkPad T14-20UES00H00 | |
| Lenovo ThinkPad T14-20S1S06B00 | |
| 7-Zip 18.03 / 7z b 4 | |
| Genomsnitt av klass Workstation (54741 - 116969, n=25, senaste 2 åren) | |
| Lenovo ThinkPad T14-20UES00H00 | |
| HP ZBook Firefly 14 G7 | |
| Lenovo ThinkPad P14s Gen1 20S40009GE | |
| Lenovo ThinkPad P43s-20RH001FGE | |
| Genomsnitt Intel Core i7-10510U (12196 - 21298, n=31) | |
| Lenovo ThinkPad T14-20S1S06B00 | |
| Geekbench 5.5 / Single-Core | |
| Genomsnitt av klass Workstation (1781 - 2183, n=25, senaste 2 åren) | |
| HP ZBook Firefly 14 G7 | |
| Lenovo ThinkPad P14s Gen1 20S40009GE | |
| Genomsnitt Intel Core i7-10510U (977 - 1287, n=31) | |
| Lenovo ThinkPad T14-20UES00H00 | |
| Lenovo ThinkPad T14-20S1S06B00 | |
| Geekbench 5.5 / Multi-Core | |
| Genomsnitt av klass Workstation (11542 - 25554, n=25, senaste 2 åren) | |
| Lenovo ThinkPad T14-20UES00H00 | |
| HP ZBook Firefly 14 G7 | |
| Lenovo ThinkPad P14s Gen1 20S40009GE | |
| Genomsnitt Intel Core i7-10510U (2474 - 4484, n=31) | |
| Lenovo ThinkPad T14-20S1S06B00 | |
| HWBOT x265 Benchmark v2.2 / 4k Preset | |
| Genomsnitt av klass Workstation (14.4 - 40.5, n=25, senaste 2 åren) | |
| Lenovo ThinkPad T14-20UES00H00 | |
| HP ZBook Firefly 14 G7 | |
| Lenovo ThinkPad P14s Gen1 20S40009GE | |
| Lenovo ThinkPad P43s-20RH001FGE | |
| Genomsnitt Intel Core i7-10510U (3.41 - 6.04, n=31) | |
| Lenovo ThinkPad T14-20S1S06B00 | |
| LibreOffice / 20 Documents To PDF | |
| HP ZBook Firefly 14 G7 | |
| Lenovo ThinkPad T14-20UES00H00 | |
| Genomsnitt Intel Core i7-10510U (50.7 - 77.8, n=27) | |
| Lenovo ThinkPad T14-20S1S06B00 | |
| Lenovo ThinkPad P14s Gen1 20S40009GE | |
| Genomsnitt av klass Workstation (37.1 - 74.7, n=25, senaste 2 åren) | |
| R Benchmark 2.5 / Overall mean | |
| Lenovo ThinkPad T14-20S1S06B00 | |
| Genomsnitt Intel Core i7-10510U (0.637 - 0.81, n=28) | |
| Lenovo ThinkPad P14s Gen1 20S40009GE | |
| Lenovo ThinkPad T14-20UES00H00 | |
| HP ZBook Firefly 14 G7 | |
| Genomsnitt av klass Workstation (0.3825 - 0.603, n=25, senaste 2 åren) | |
* ... mindre är bättre
| PCMark 8 | |
| Home Score Accelerated v2 | |
| Lenovo ThinkPad T14-20UES00H00 | |
| HP ZBook Firefly 14 G7 | |
| Lenovo ThinkPad P14s Gen1 20S40009GE | |
| Genomsnitt Intel Core i7-10510U, NVIDIA Quadro P520 (3459 - 3805, n=2) | |
| Lenovo ThinkPad T14-20S1S06B00 | |
| Lenovo ThinkPad P43s-20RH001FGE | |
| Work Score Accelerated v2 | |
| Lenovo ThinkPad T14-20UES00H00 | |
| Lenovo ThinkPad P14s Gen1 20S40009GE | |
| Lenovo ThinkPad T14-20S1S06B00 | |
| HP ZBook Firefly 14 G7 | |
| Genomsnitt Intel Core i7-10510U, NVIDIA Quadro P520 (4500 - 5356, n=2) | |
| Lenovo ThinkPad P43s-20RH001FGE | |
| PCMark 8 Home Score Accelerated v2 | 3805 poäng | |
| PCMark 8 Work Score Accelerated v2 | 5356 poäng | |
| PCMark 10 Score | 4171 poäng | |
Hjälp | ||
| DPC Latencies / LatencyMon - interrupt to process latency (max), Web, Youtube, Prime95 | |
| Lenovo ThinkPad P14s Gen1 20S40009GE | |
* ... mindre är bättre
| Lenovo ThinkPad P14s Gen1 20S40009GE Samsung SSD PM981a MZVLB512HBJQ | Lenovo ThinkPad T14-20S1S06B00 Lite-On CA5-8D512 | Lenovo ThinkPad T14-20UES00H00 Samsung SSD PM981a MZVLB512HBJQ | Lenovo ThinkPad P43s-20RH001FGE WDC PC SN720 SDAQNTW-256G | Genomsnitt Samsung SSD PM981a MZVLB512HBJQ | |
|---|---|---|---|---|---|
| CrystalDiskMark 5.2 / 6 | -12% | -11% | -21% | -0% | |
| Write 4K (MB/s) | 145 | 114.1 -21% | 88.1 -39% | 135.3 -7% | 140.8 ? -3% |
| Read 4K (MB/s) | 48.11 | 53.6 11% | 38.28 -20% | 45.09 -6% | 48.6 ? 1% |
| Write Seq (MB/s) | 2138 | 1743 -18% | 2002 -6% | 1576 -26% | 2106 ? -1% |
| Read Seq (MB/s) | 2258 | 2092 -7% | 2153 -5% | 1457 -35% | 2099 ? -7% |
| Write 4K Q32T1 (MB/s) | 467.8 | 394.8 -16% | 423.7 -9% | 356.3 -24% | 451 ? -4% |
| Read 4K Q32T1 (MB/s) | 421.4 | 372.6 -12% | 393.2 -7% | 385.4 -9% | 482 ? 14% |
| Write Seq Q32T1 (MB/s) | 2988 | 2176 -27% | 2889 -3% | 1613 -46% | 2903 ? -3% |
| Read Seq Q32T1 (MB/s) | 3446 | 3204 -7% | 3566 3% | 3017 -12% | 3511 ? 2% |

DiskSpd Read Loop, Queue Depth 8
| 3DMark 11 - 1280x720 Performance GPU | |
| Genomsnitt av klass Workstation (10888 - 69594, n=25, senaste 2 åren) | |
| Lenovo ThinkPad P14s Gen1 20S40009GE | |
| Genomsnitt NVIDIA Quadro P520 (3870 - 4277, n=6) | |
| HP ZBook Firefly 14 G7 | |
| Lenovo ThinkPad P43s-20RH001FGE | |
| Lenovo ThinkPad T14-20UES00H00 | |
| Lenovo ThinkPad T14-20S1S06B00 | |
| 3DMark | |
| 1920x1080 Fire Strike Graphics | |
| Genomsnitt av klass Workstation (7578 - 52560, n=25, senaste 2 åren) | |
| Genomsnitt NVIDIA Quadro P520 (3030 - 3410, n=6) | |
| HP ZBook Firefly 14 G7 | |
| Lenovo ThinkPad P14s Gen1 20S40009GE | |
| Lenovo ThinkPad P43s-20RH001FGE | |
| Lenovo ThinkPad T14-20UES00H00 | |
| Lenovo ThinkPad T14-20S1S06B00 | |
| 2560x1440 Time Spy Graphics | |
| Genomsnitt av klass Workstation (2725 - 24806, n=25, senaste 2 åren) | |
| Lenovo ThinkPad P14s Gen1 20S40009GE | |
| Genomsnitt NVIDIA Quadro P520 (918 - 1043, n=6) | |
| HP ZBook Firefly 14 G7 | |
| Lenovo ThinkPad P43s-20RH001FGE | |
| Lenovo ThinkPad T14-20UES00H00 | |
| Lenovo ThinkPad T14-20S1S06B00 | |
| 3DMark 11 Performance | 4490 poäng | |
| 3DMark Fire Strike Score | 2902 poäng | |
| 3DMark Time Spy Score | 1149 poäng | |
Hjälp | ||
| låg | med. | hög | ultra | |
|---|---|---|---|---|
| The Witcher 3 (2015) | 42.7 | 22.1 | ||
| Dota 2 Reborn (2015) | 110 | 37.5 | 19.5 | 13.8 |
| X-Plane 11.11 (2018) | 17.9 | 13.8 | 13.2 | |
| Shadow of the Tomb Raider (2018) | 31.8 | 12.5 | ||
| Total War: Three Kingdoms (2019) | 69.6 | 14.7 |
Ljudnivå
| Låg belastning |
| 29.7 / 29.7 / 30.6 dB(A) |
| Hög belastning |
| 33.1 / 35 dB(A) |
 | ||
30 dB tyst 40 dB(A) hörbar 50 dB(A) högt ljud |
||
min: | ||
(-) Den maximala temperaturen på ovansidan är 59.5 °C / 139 F, jämfört med genomsnittet av 38.2 °C / 101 F , allt från 22.2 till 69.8 °C för klassen Workstation.
(-) Botten värms upp till maximalt 68.8 °C / 156 F, jämfört med genomsnittet av 41.1 °C / 106 F
(+) Vid tomgångsbruk är medeltemperaturen för ovansidan 23.5 °C / 74 F, jämfört med enhetsgenomsnittet på 32 °C / ### class_avg_f### F.
(±) Handledsstöden och pekplattan kan bli väldigt varma vid beröring med maximalt 36.3 °C / 97.3 F.
(-) Medeltemperaturen för handledsstödsområdet på liknande enheter var 27.8 °C / 82 F (-8.5 °C / -15.3 F).
Lenovo ThinkPad P14s Gen1 20S40009GE ljudanalys
(±) | högtalarljudstyrkan är genomsnittlig men bra (72.1 dB)
Bas 100 - 315 Hz
(-) | nästan ingen bas - i genomsnitt 19.7% lägre än medianen
(±) | linjäriteten för basen är genomsnittlig (9.4% delta till föregående frekvens)
Mellan 400 - 2000 Hz
(±) | högre mellan - i genomsnitt 6.3% högre än median
(±) | linjäriteten för mids är genomsnittlig (8.5% delta till föregående frekvens)
Högsta 2 - 16 kHz
(+) | balanserade toppar - endast 2.7% från medianen
(+) | toppar är linjära (5.6% delta till föregående frekvens)
Totalt 100 - 16 000 Hz
(±) | linjäriteten för det totala ljudet är genomsnittlig (25.8% skillnad mot median)
Jämfört med samma klass
» 87% av alla testade enheter i den här klassen var bättre, 6% liknande, 7% sämre
» Den bästa hade ett delta på 7%, genomsnittet var 17%, sämst var 35%
Jämfört med alla testade enheter
» 79% av alla testade enheter var bättre, 4% liknande, 17% sämre
» Den bästa hade ett delta på 4%, genomsnittet var 24%, sämst var 134%
HP ZBook Firefly 14 G7 ljudanalys
(±) | högtalarljudstyrkan är genomsnittlig men bra (73.7 dB)
Bas 100 - 315 Hz
(±) | reducerad bas - i genomsnitt 13.3% lägre än medianen
(±) | linjäriteten för basen är genomsnittlig (13.1% delta till föregående frekvens)
Mellan 400 - 2000 Hz
(+) | balanserad mellan - endast 2% från medianen
(+) | mids är linjära (2.6% delta till föregående frekvens)
Högsta 2 - 16 kHz
(+) | balanserade toppar - endast 3.8% från medianen
(±) | linjäriteten för toppar är genomsnittlig (7.4% delta till föregående frekvens)
Totalt 100 - 16 000 Hz
(±) | linjäriteten för det totala ljudet är genomsnittlig (17.9% skillnad mot median)
Jämfört med samma klass
» 56% av alla testade enheter i den här klassen var bättre, 11% liknande, 33% sämre
» Den bästa hade ett delta på 7%, genomsnittet var 17%, sämst var 35%
Jämfört med alla testade enheter
» 37% av alla testade enheter var bättre, 8% liknande, 55% sämre
» Den bästa hade ett delta på 4%, genomsnittet var 24%, sämst var 134%
| Av/Standby | |
| Låg belastning | |
| Hög belastning |
|
Förklaring:
min: | |
| Lenovo ThinkPad P14s Gen1 20S40009GE i7-10510U, Quadro P520, Samsung SSD PM981a MZVLB512HBJQ, LTPS IPS LED, 1920x1080, 14" | HP ZBook Firefly 14 G7 i7-10610U, Quadro P520, Toshiba XG6 KXG60ZNV512G, IPS, 1920x1080, 14" | Lenovo ThinkPad T14-20S1S06B00 i5-10210U, UHD Graphics 620, Lite-On CA5-8D512, LTPS IPS LED, 1920x1080, 14" | Lenovo ThinkPad T14-20UES00H00 R5 PRO 4650U, Vega 6, Samsung SSD PM981a MZVLB512HBJQ, IPS, 1920x1080, 14" | Lenovo ThinkPad P43s-20RH001FGE i7-8565U, Quadro P520, WDC PC SN720 SDAQNTW-256G, IPS, 1920x1080, 14" | Genomsnitt NVIDIA Quadro P520 | Genomsnitt av klass Workstation | |
|---|---|---|---|---|---|---|---|
| Power Consumption | -25% | -4% | -21% | 4% | -13% | -135% | |
| Idle Minimum * (Watt) | 2.92 | 3.3 -13% | 3.2 -10% | 5.8 -99% | 2.9 1% | 3.14 ? -8% | 8.94 ? -206% |
| Idle Average * (Watt) | 5.64 | 9.3 -65% | 6.1 -8% | 8.3 -47% | 4.94 12% | 7.3 ? -29% | 13.8 ? -145% |
| Idle Maximum * (Watt) | 8 | 12.1 -51% | 10.4 -30% | 11 -38% | 7.92 1% | 10.4 ? -30% | 17.5 ? -119% |
| Load Average * (Watt) | 64 | 59.4 7% | 45.6 29% | 39.5 38% | 60.8 5% | 60.7 ? 5% | 95 ? -48% |
| Load Maximum * (Watt) | 68.4 | 69.4 -1% | 68.6 -0% | 40.8 40% | 68.2 -0% | 68.9 ? -1% | 175.2 ? -156% |
| Witcher 3 ultra * (Watt) | 52.7 |
* ... mindre är bättre
| Lenovo ThinkPad P14s Gen1 20S40009GE i7-10510U, Quadro P520, 50 Wh | HP ZBook Firefly 14 G7 i7-10610U, Quadro P520, 53 Wh | Lenovo ThinkPad T14-20S1S06B00 i5-10210U, UHD Graphics 620, 50 Wh | Lenovo ThinkPad T14-20UES00H00 R5 PRO 4650U, Vega 6, 50 Wh | Lenovo ThinkPad P43s-20RH001FGE i7-8565U, Quadro P520, 51 Wh | Genomsnitt av klass Workstation | |
|---|---|---|---|---|---|---|
| Batteridrifttid | 0% | -7% | -14% | 11% | -15% | |
| H.264 (h) | 12.4 | 12.5 1% | 10.4 -16% | 11.6 -6% | 12.7 2% | 9.51 ? -23% |
| WiFi v1.3 (h) | 10.1 | 10.1 0% | 11 9% | 8.4 -17% | 8.5 -16% | 8.53 ? -16% |
| Load (h) | 1.5 | 1.5 0% | 1.3 -13% | 1.2 -20% | 2.2 47% | 1.429 ? -5% |
För
Emot
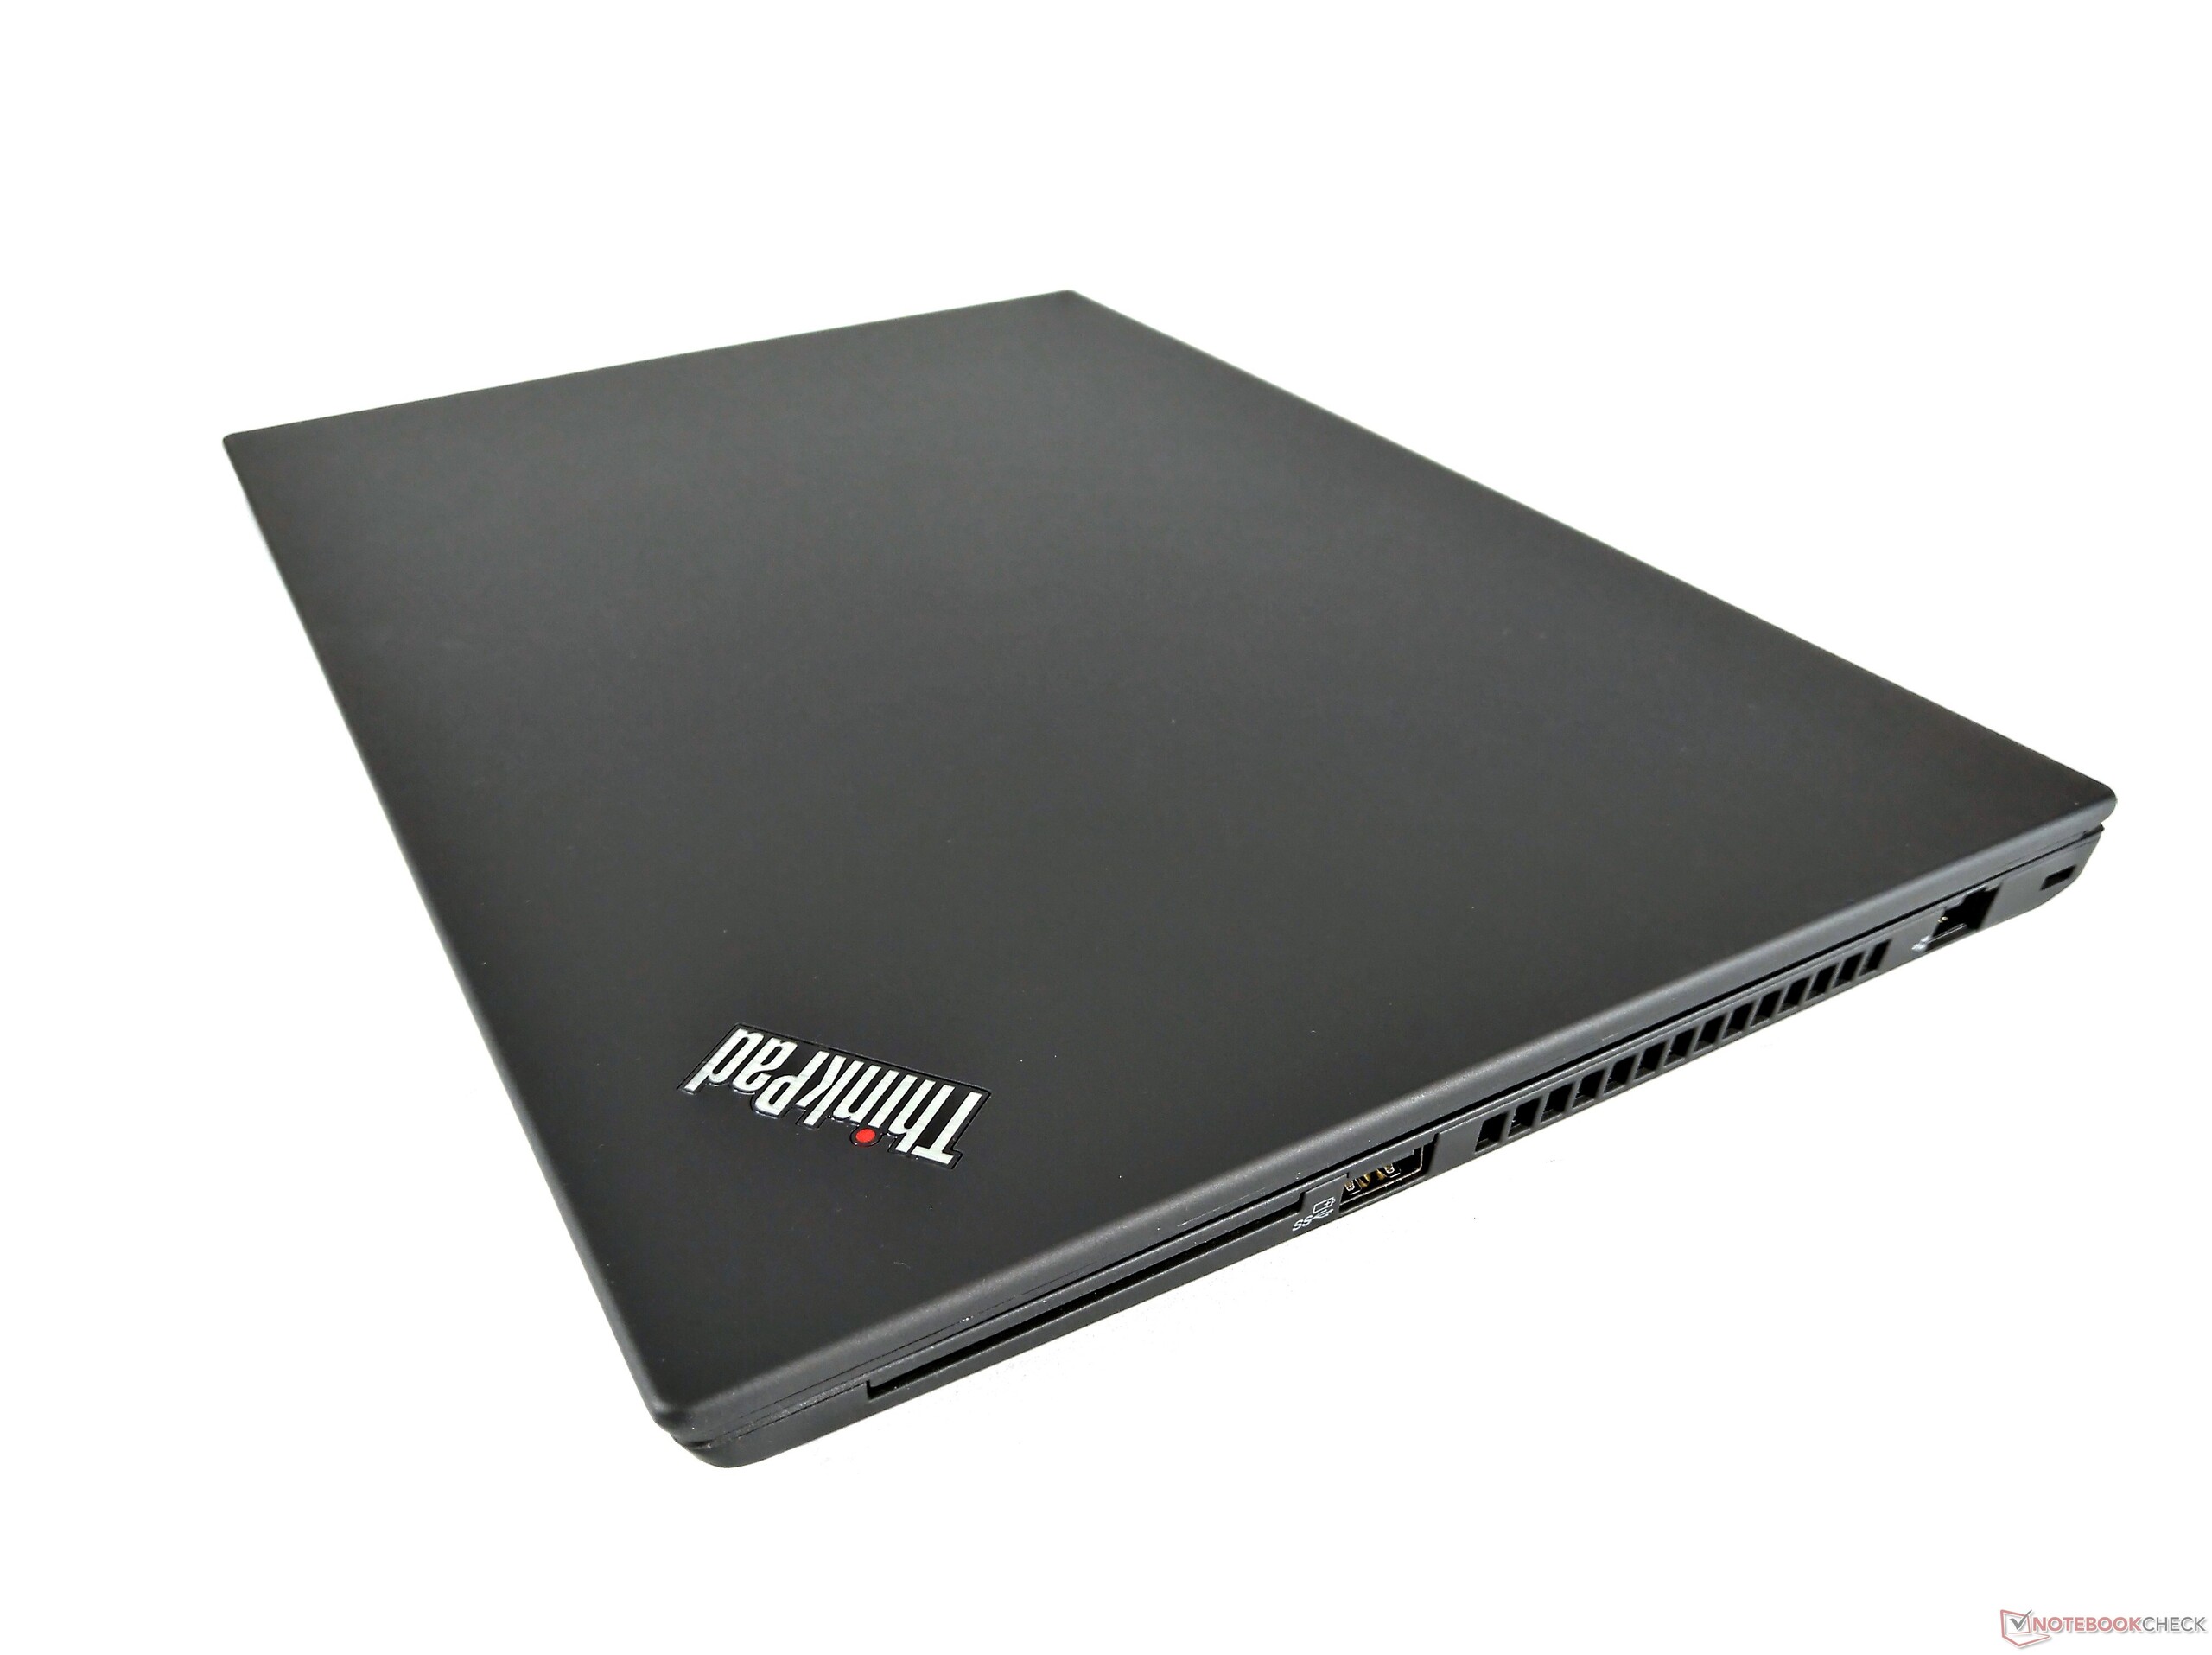
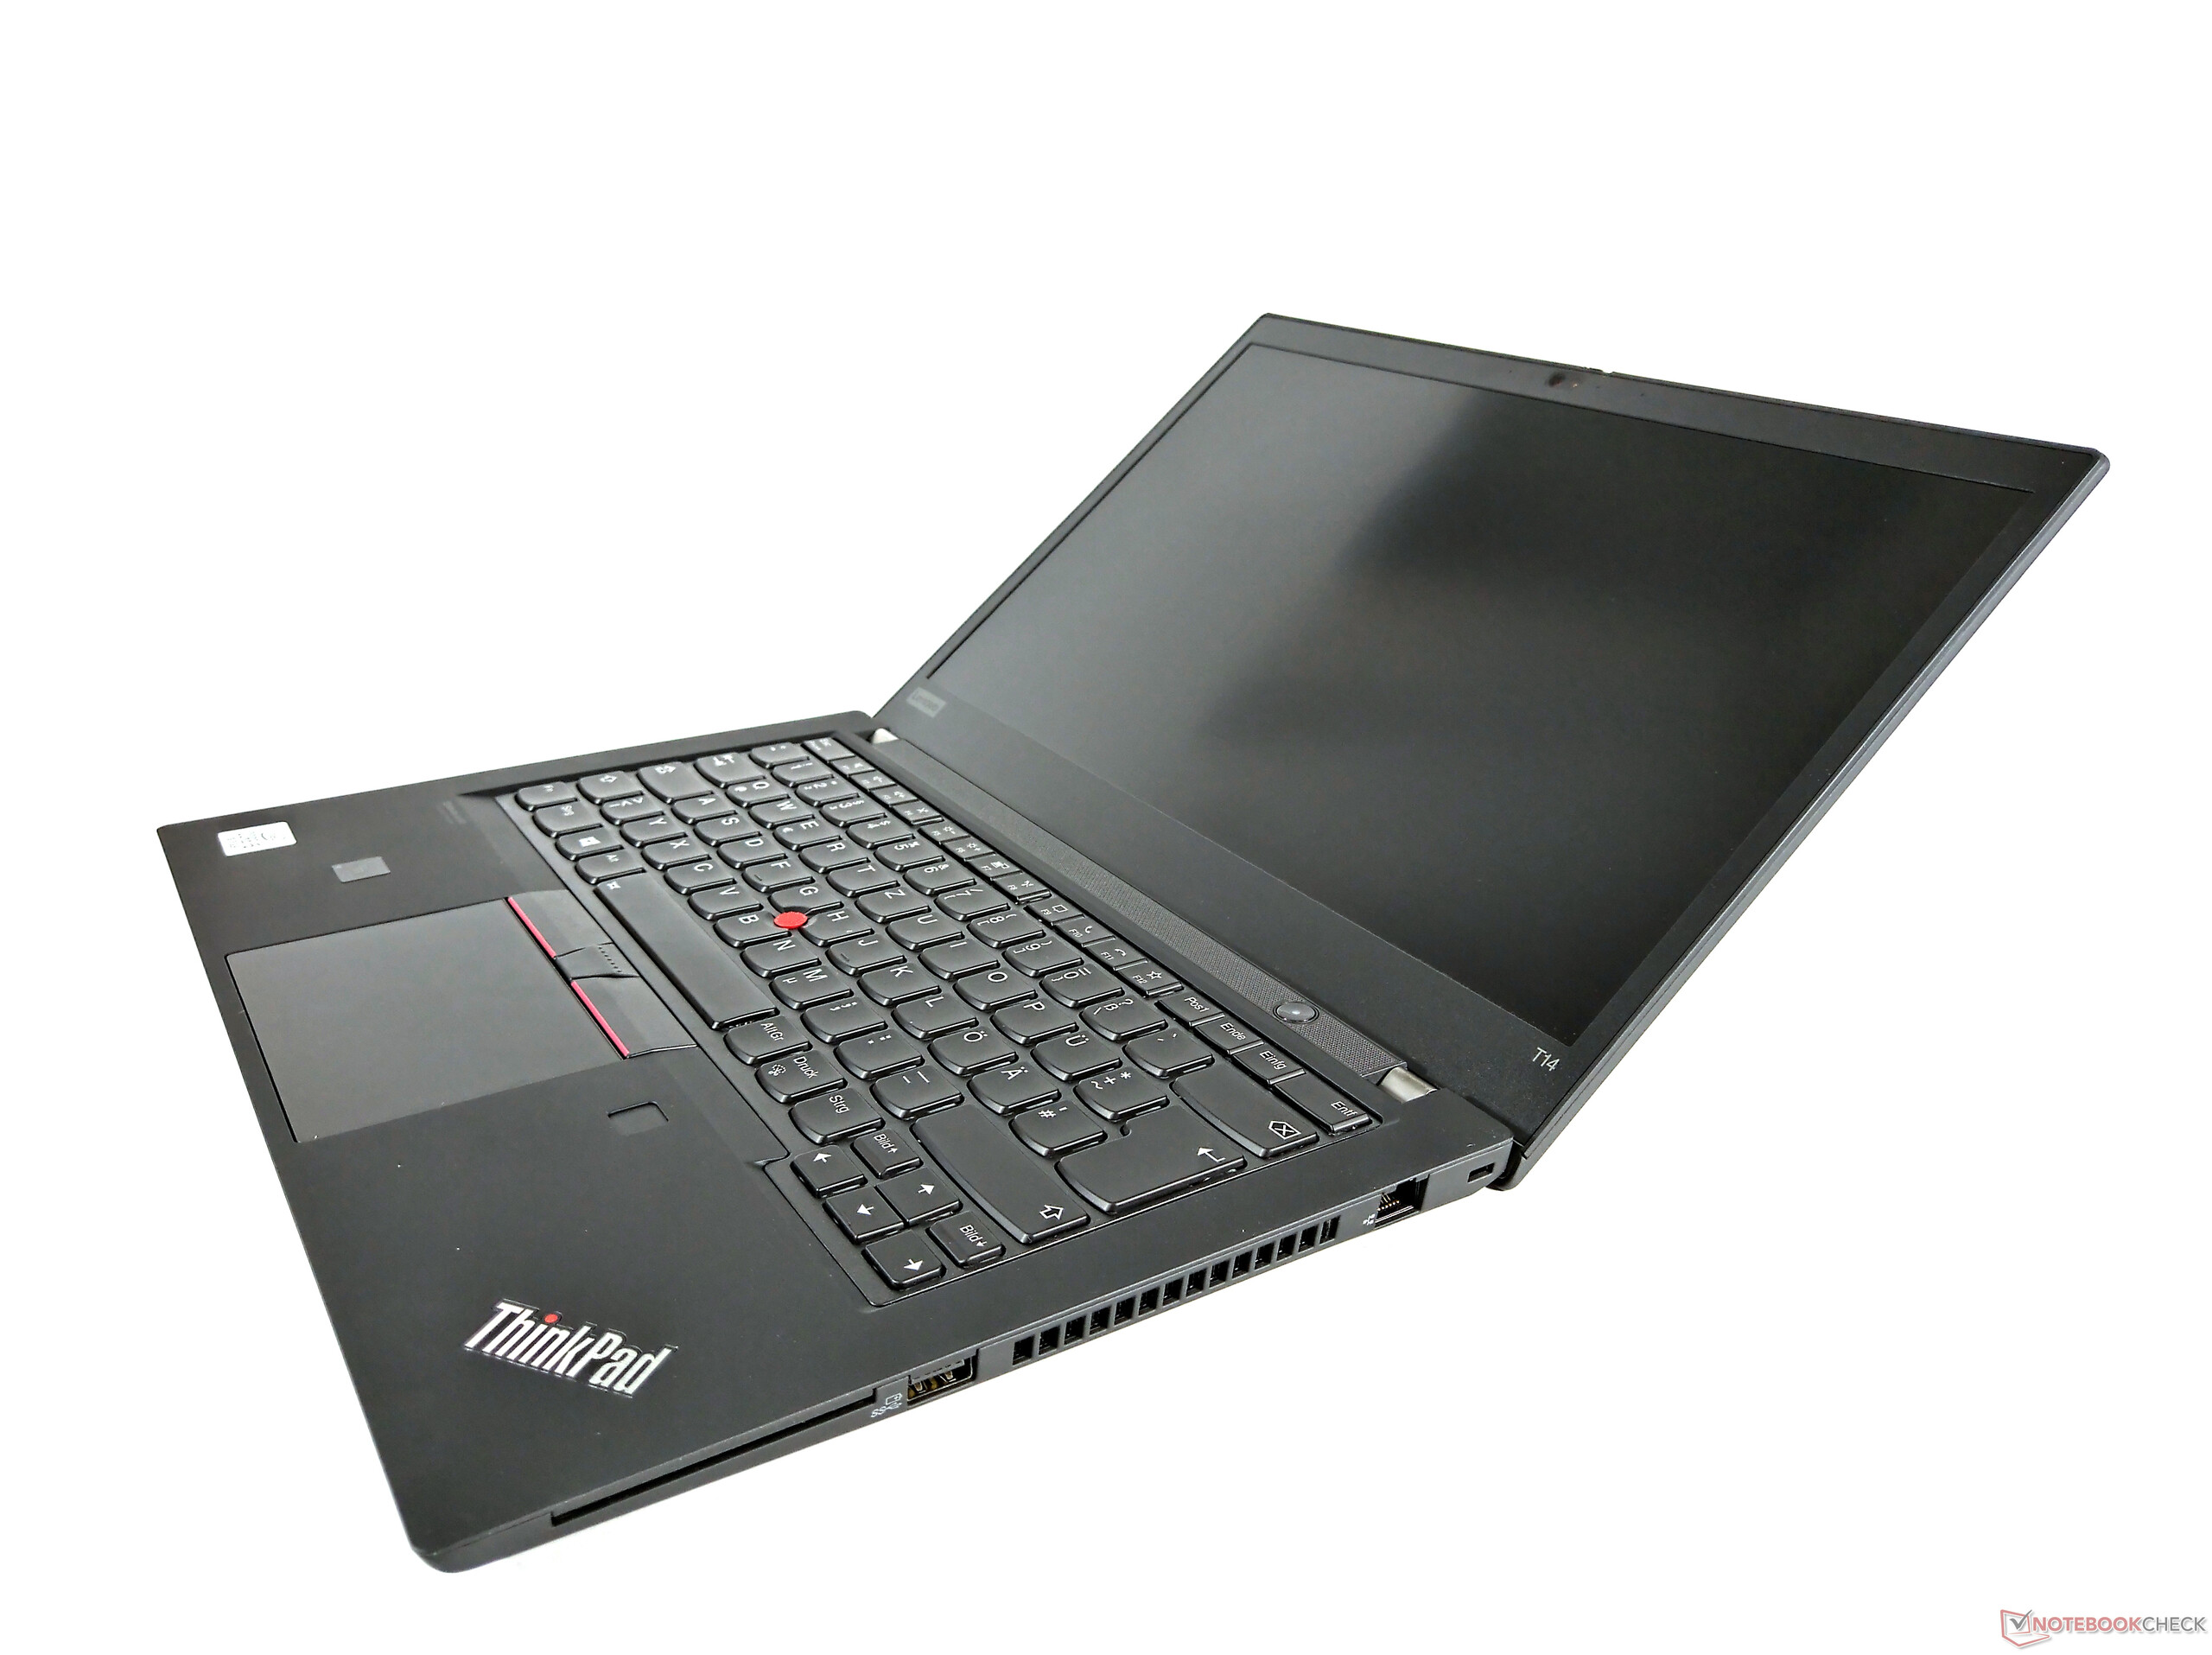
Sammanfattning: ThinkPad T14 med ett annat namn

Läs den fullständiga versionen av den här recensionen på engelska här.
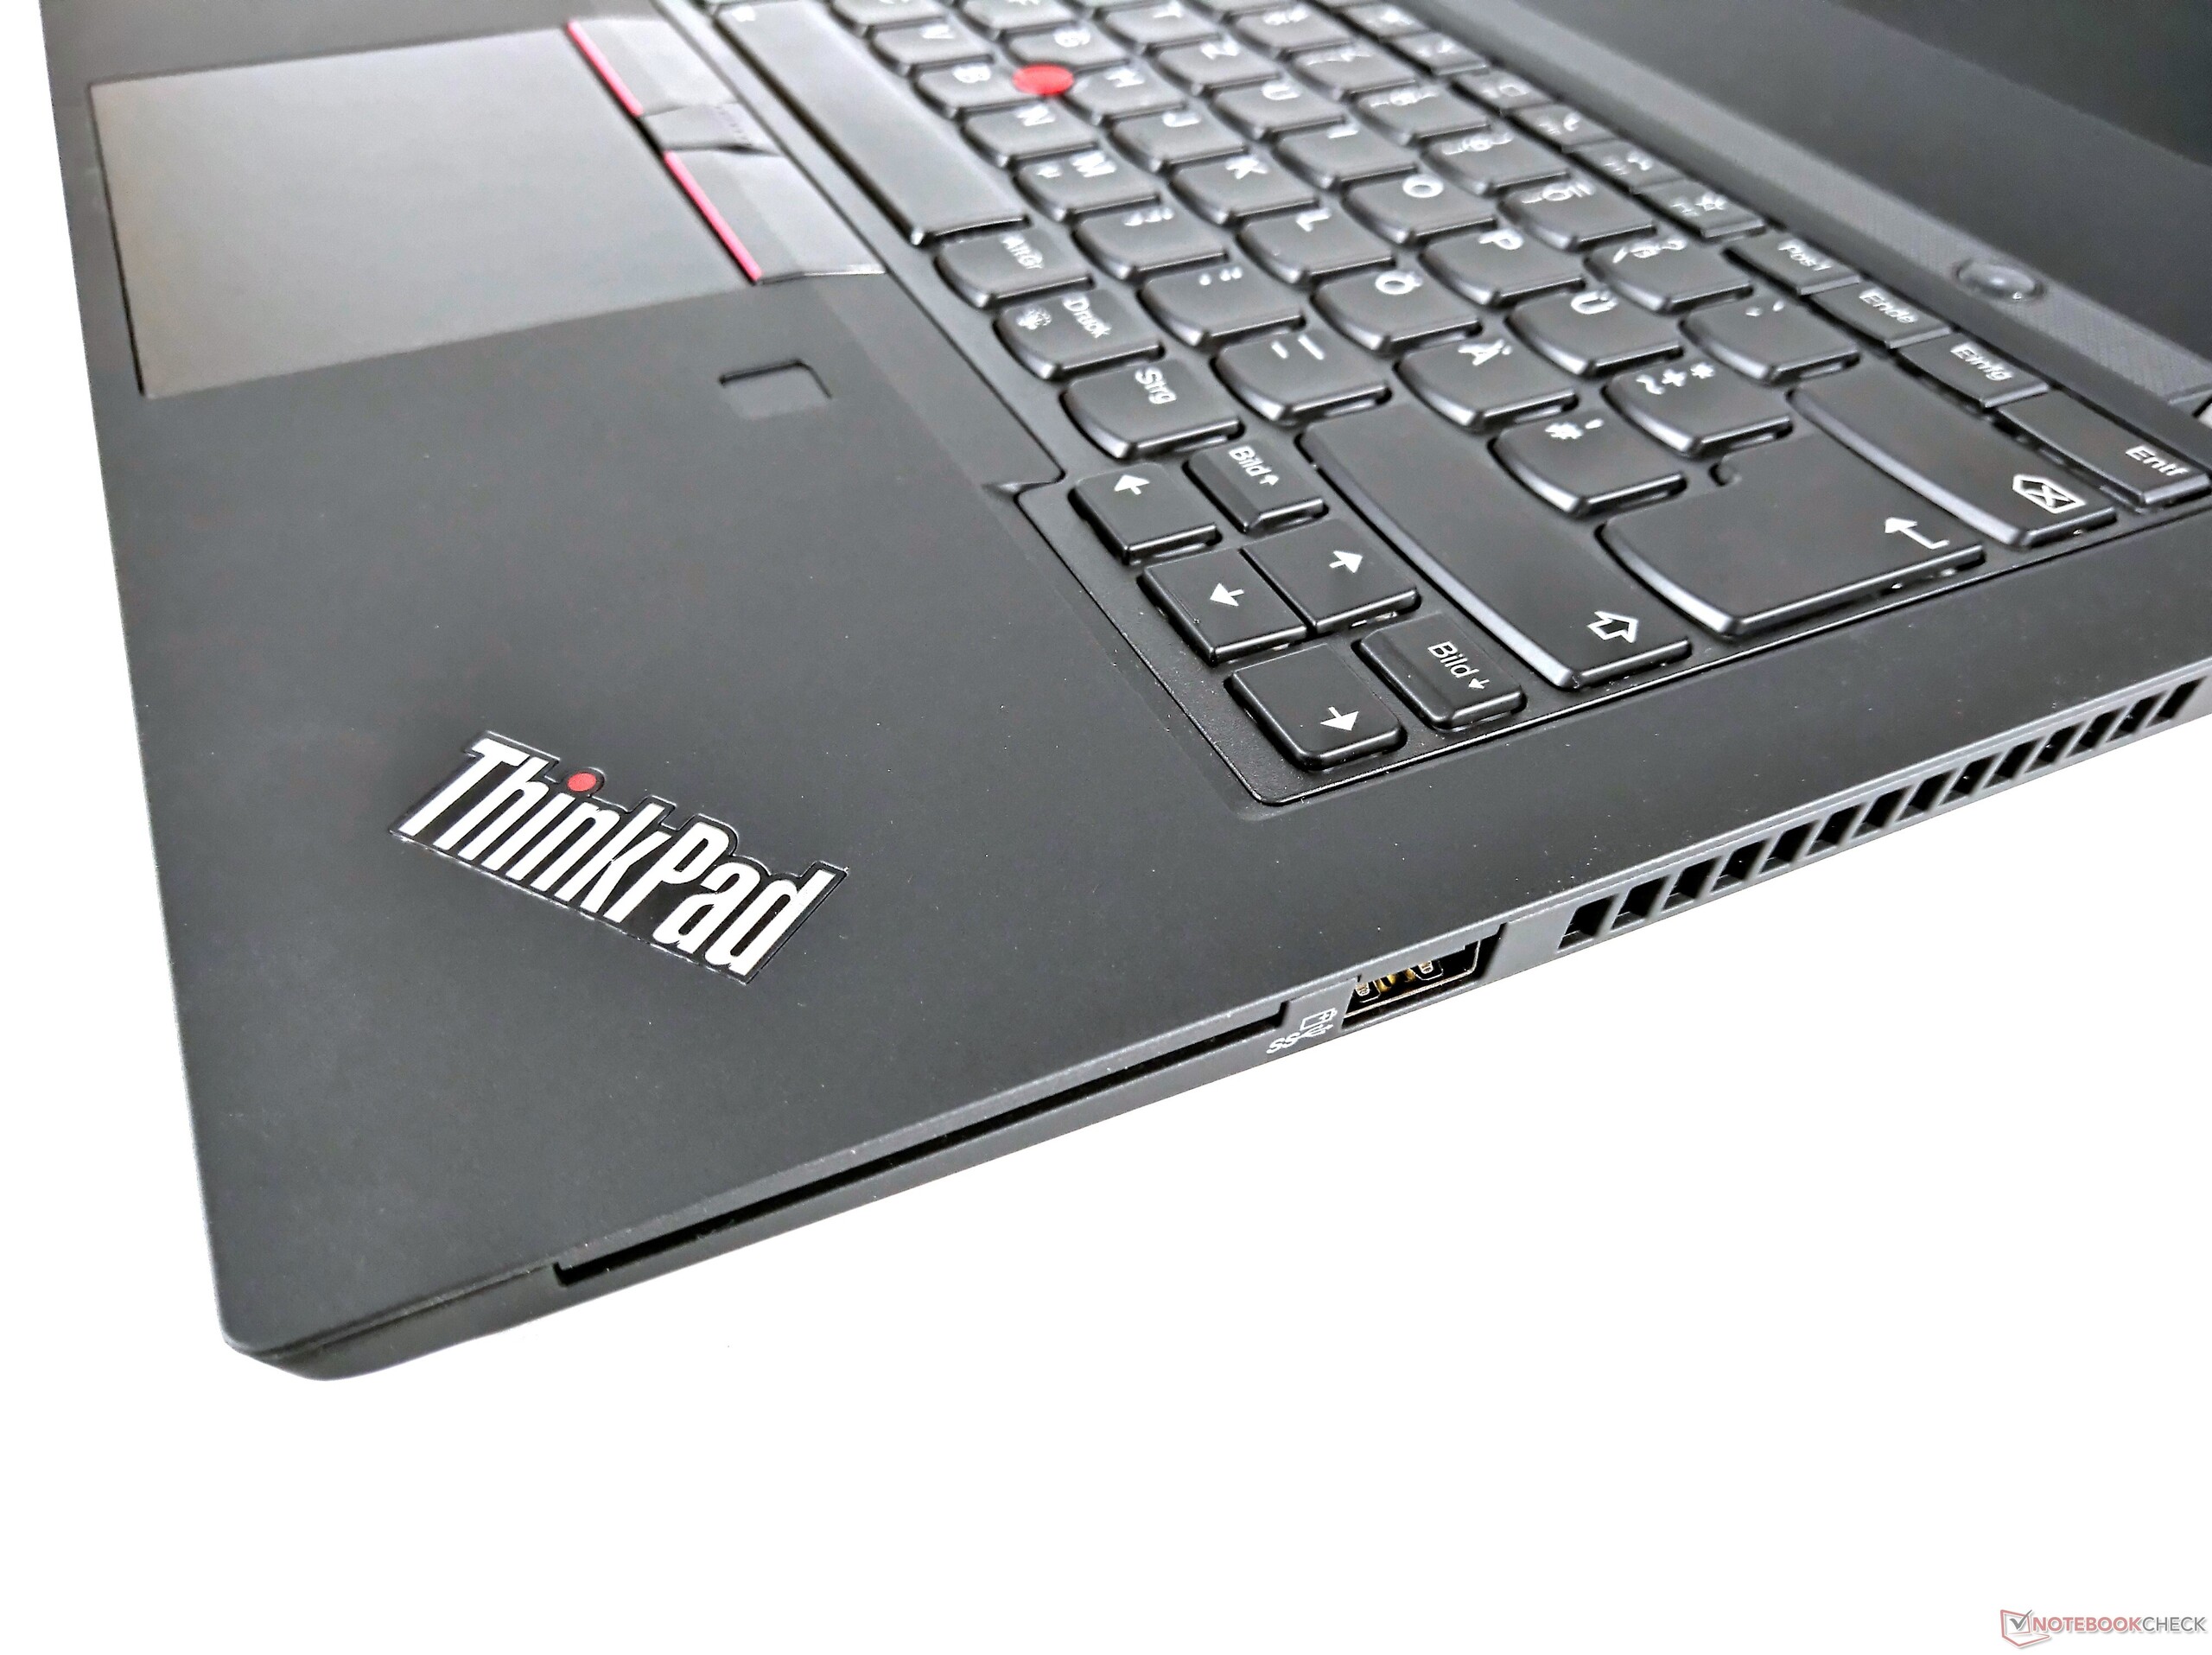
Lenovo ThinkPad P14s Gen 1 är en i princip identisk variant av ThinkPad T14, och delar därmed både styrkor och svagheter med den. Det går egentligen att bara klistra in stora delar av vår sammanfattning av Intel-modellen: På plus-sidan har den utmärkta inmatningsenheter, en skärm av hög kvalitet och rik hårdvara. Däremot får vi ge den kritik för ett svåröppnat hölje samt faktum att den saknar "Power Bridge"-funktionen som fanns på äldre ThinkPads.
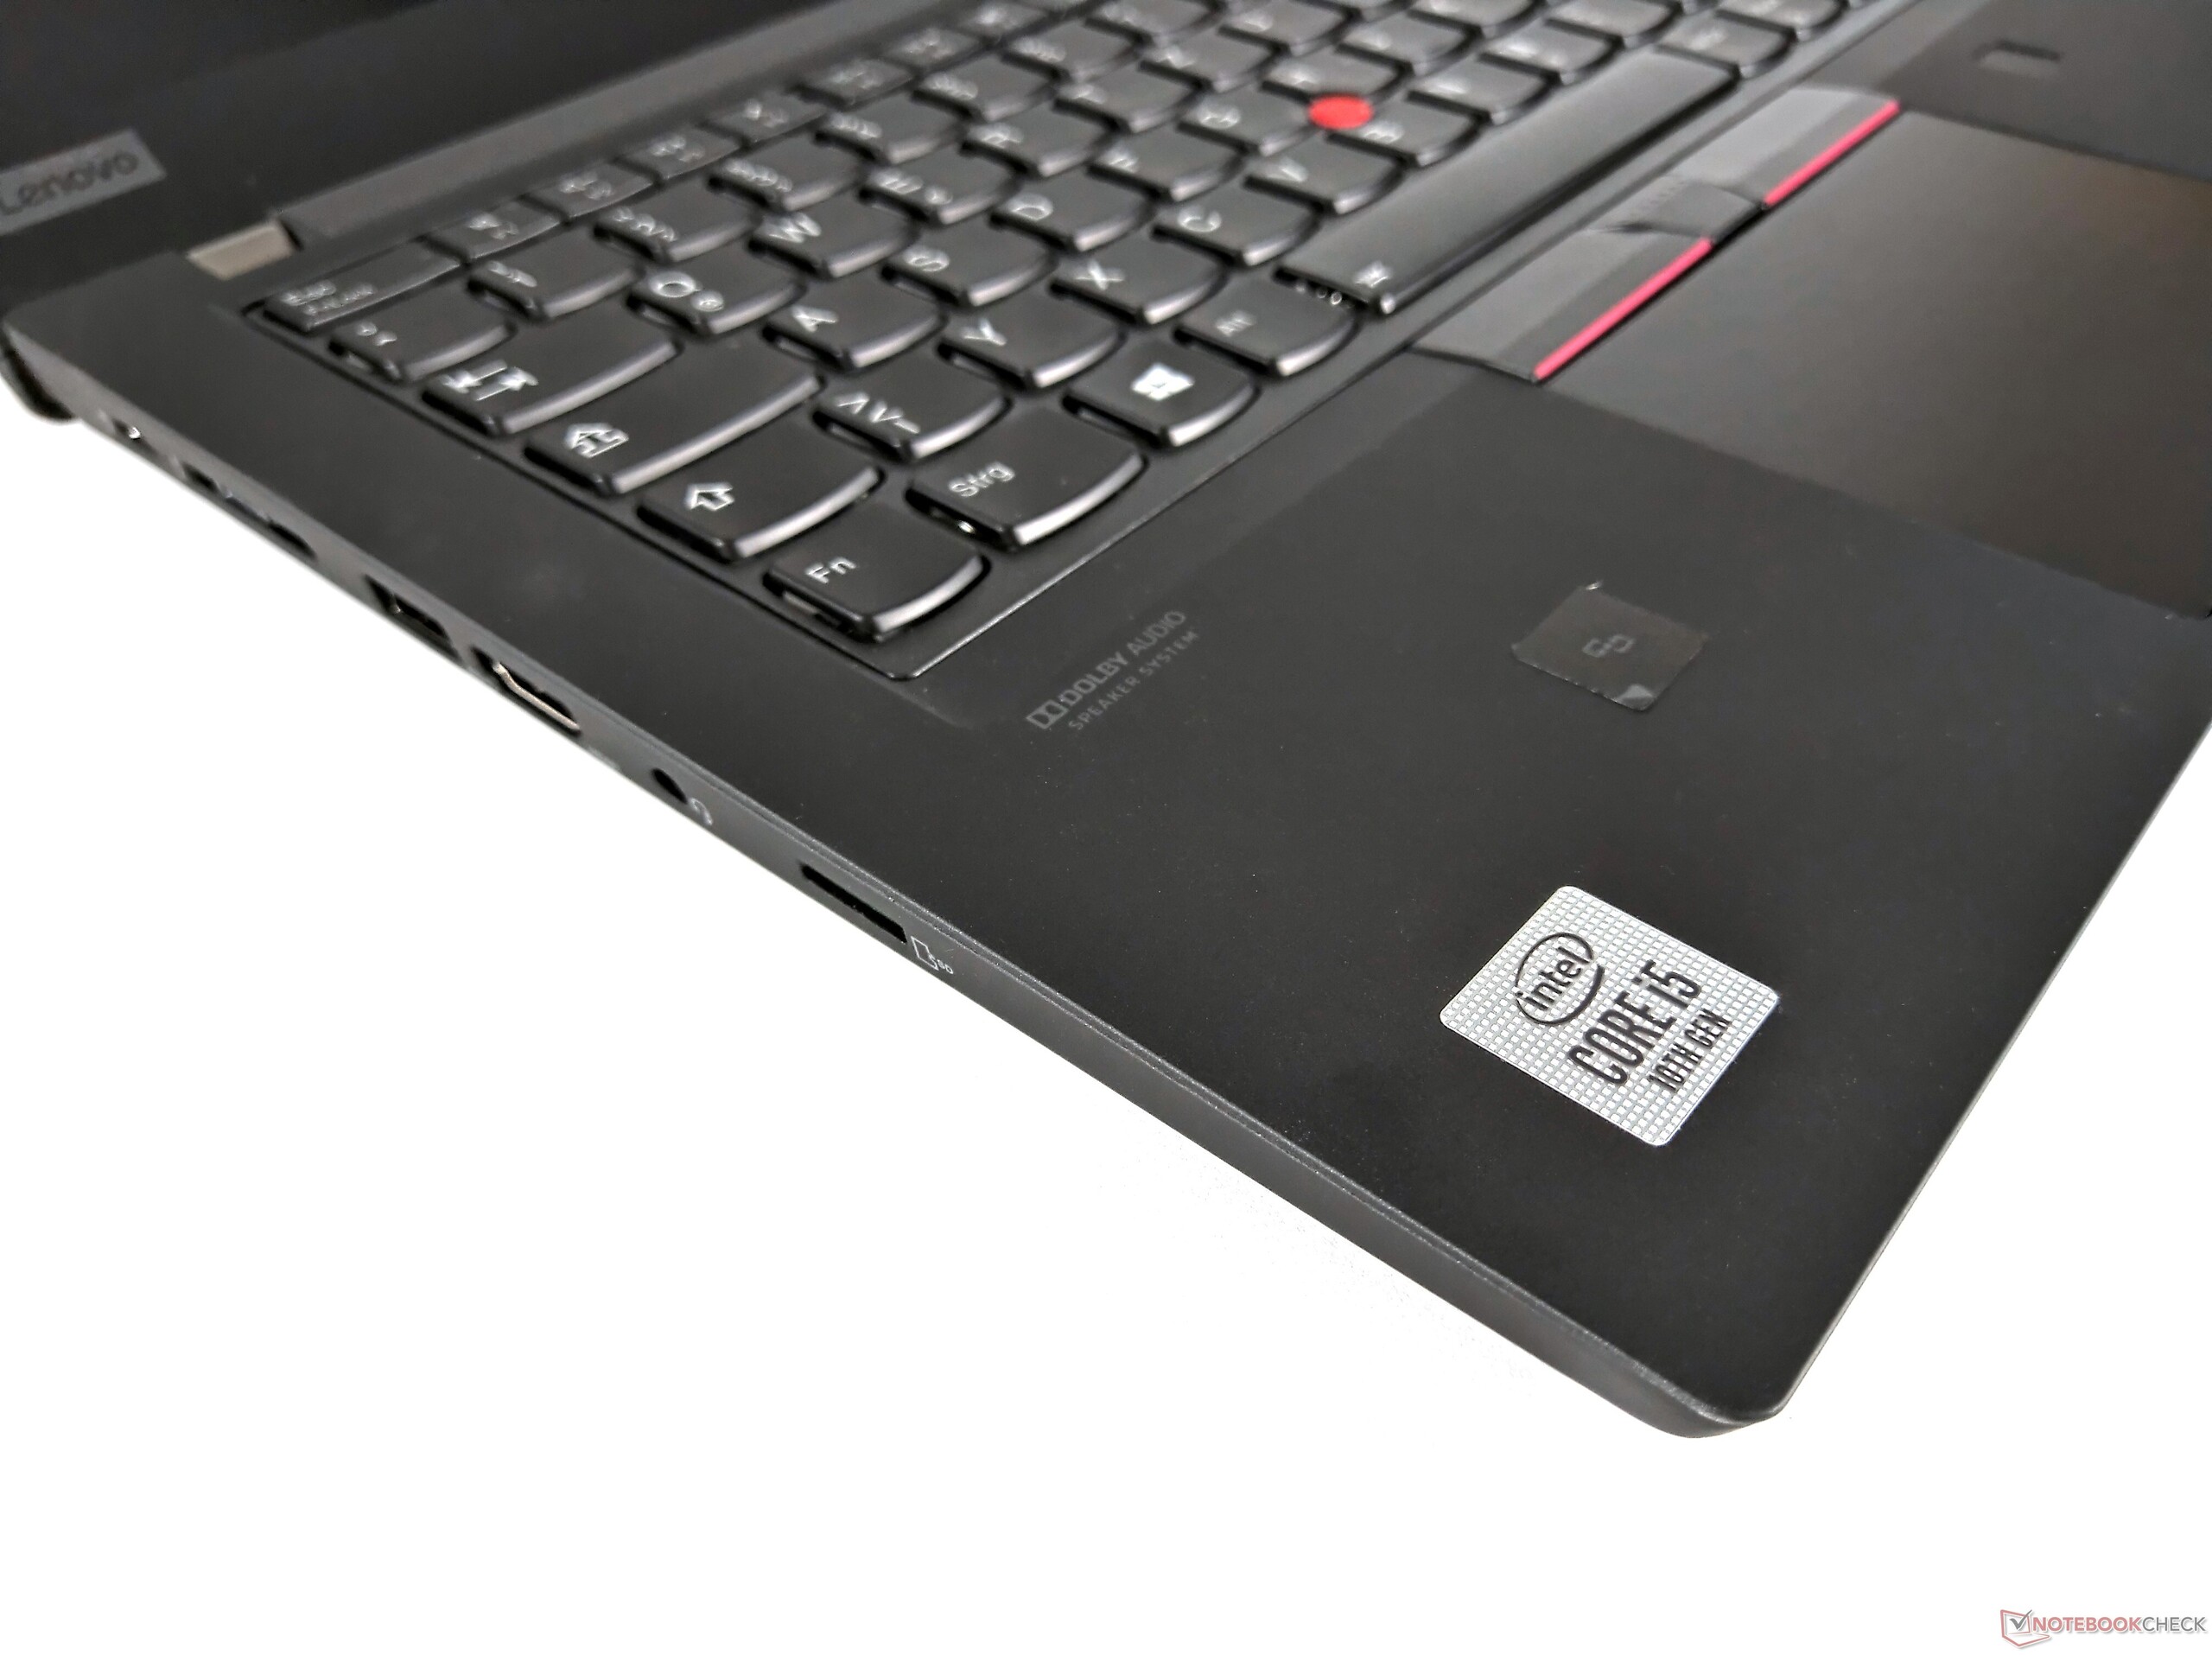
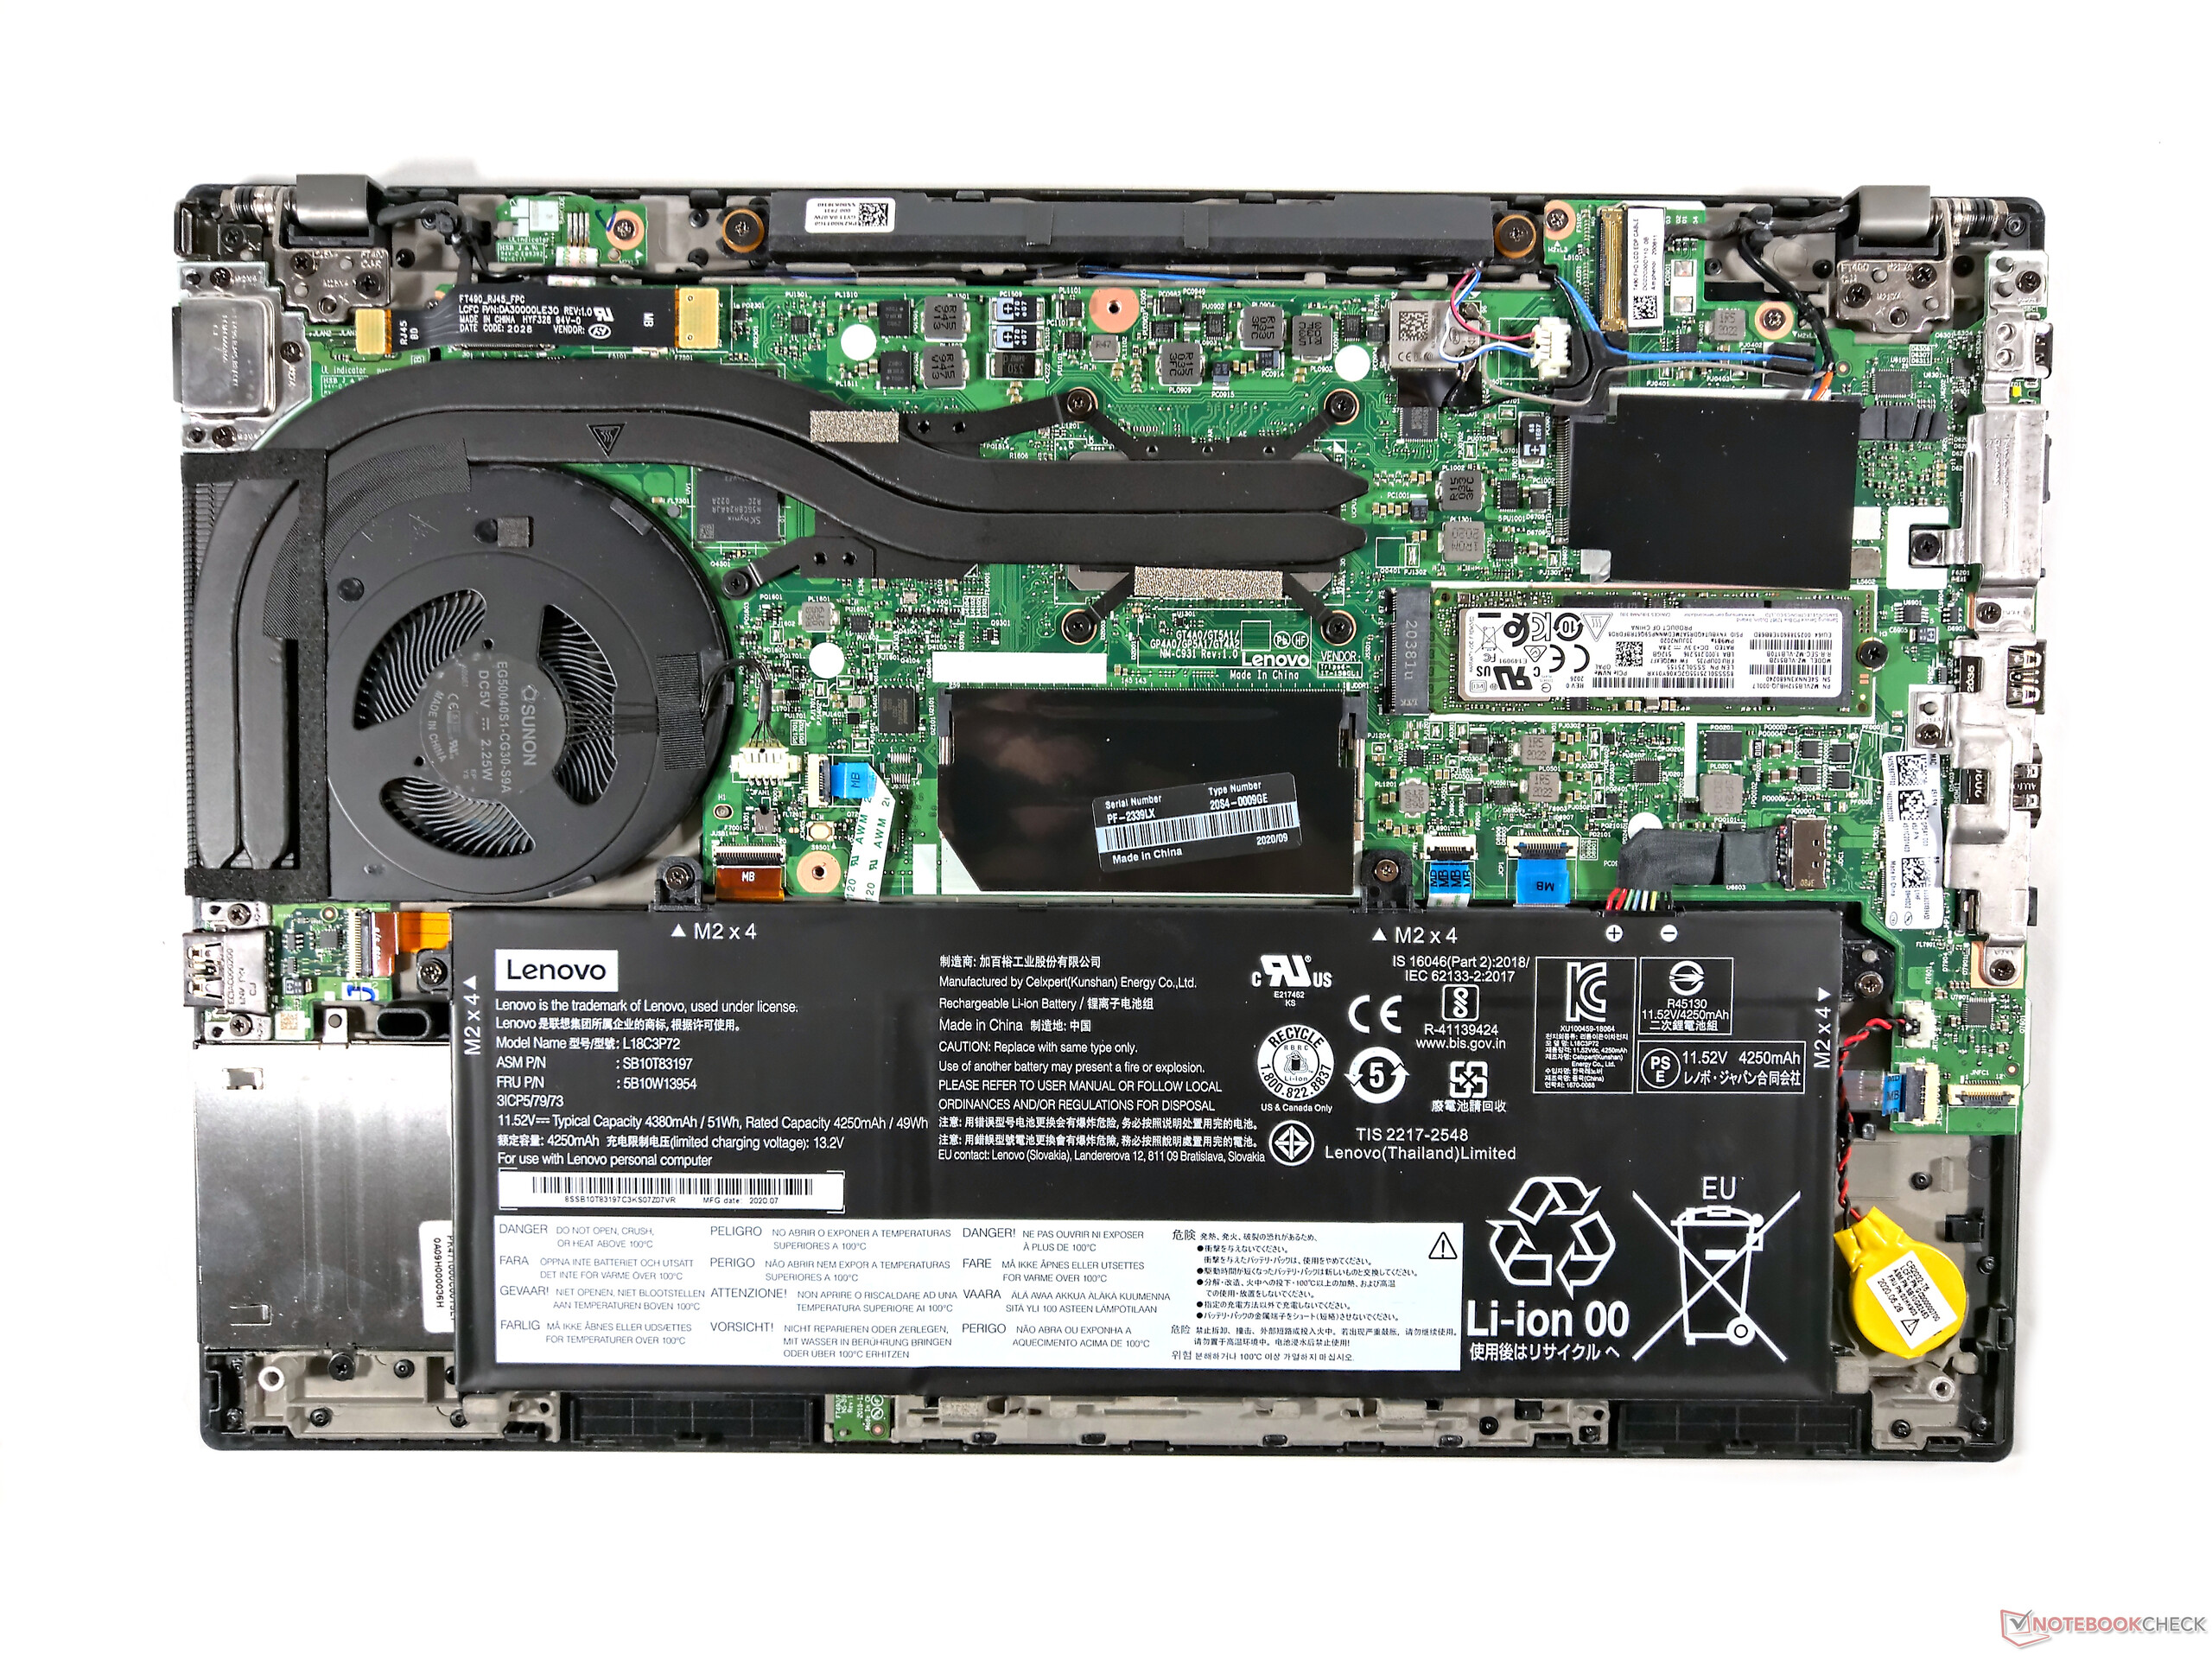
Höga temperaturer var en brist redan på ThinkPad T14. Detta har inte blivit bättre på Lenovos ThinkPad P14s, utan värmenivån har tvärtom blivit en aning värre på grund av Nvidia GPU:n. Nvidia Quadro P520 är den avgörande egenskapen som skiljer P14s från sin kusin. Men en utdaterad instegs-GPU kan inte hantera mer än de enklaste CAD-uppgifterna. Den har helt enkelt för låg prestanda för att ersätta en fullfjädrad arbetsstation. Du får dessutom leva med strypning, särskilt vid belastning.
I princip är Lenovo ThinkPad P14s Gen 1 samma som T14, fast med en Quadro GPU. Om du inte behöver en sådan är det bättre att välja ThinkPad T14.
Slutsatsen är att Lenovo ThinkPad P14s, i likhet med ThinkPad T14, är värd att köpa. Men den måste passa dina behov – om du bara vill köpa en ThinkPad på 14 tum och inte är intresserad av CAD är det bättre du väljer ThinkPad T14 AMD.
Lenovo ThinkPad P14s Gen1 20S40009GE
- 12/28/2020 v7 (old)
Benjamin Herzig
Price comparison
