Test: Acer Swift 5 SF515-51T (i7-8565U, SSD, FHD) Laptop (Sammanfattning)
| |||||||||||||||||||||||||
Distribution av ljusstyrkan: 87 %
Mitt på batteriet: 336 cd/m²
Kontrast: 1100:1 (Svärta: 0.31 cd/m²)
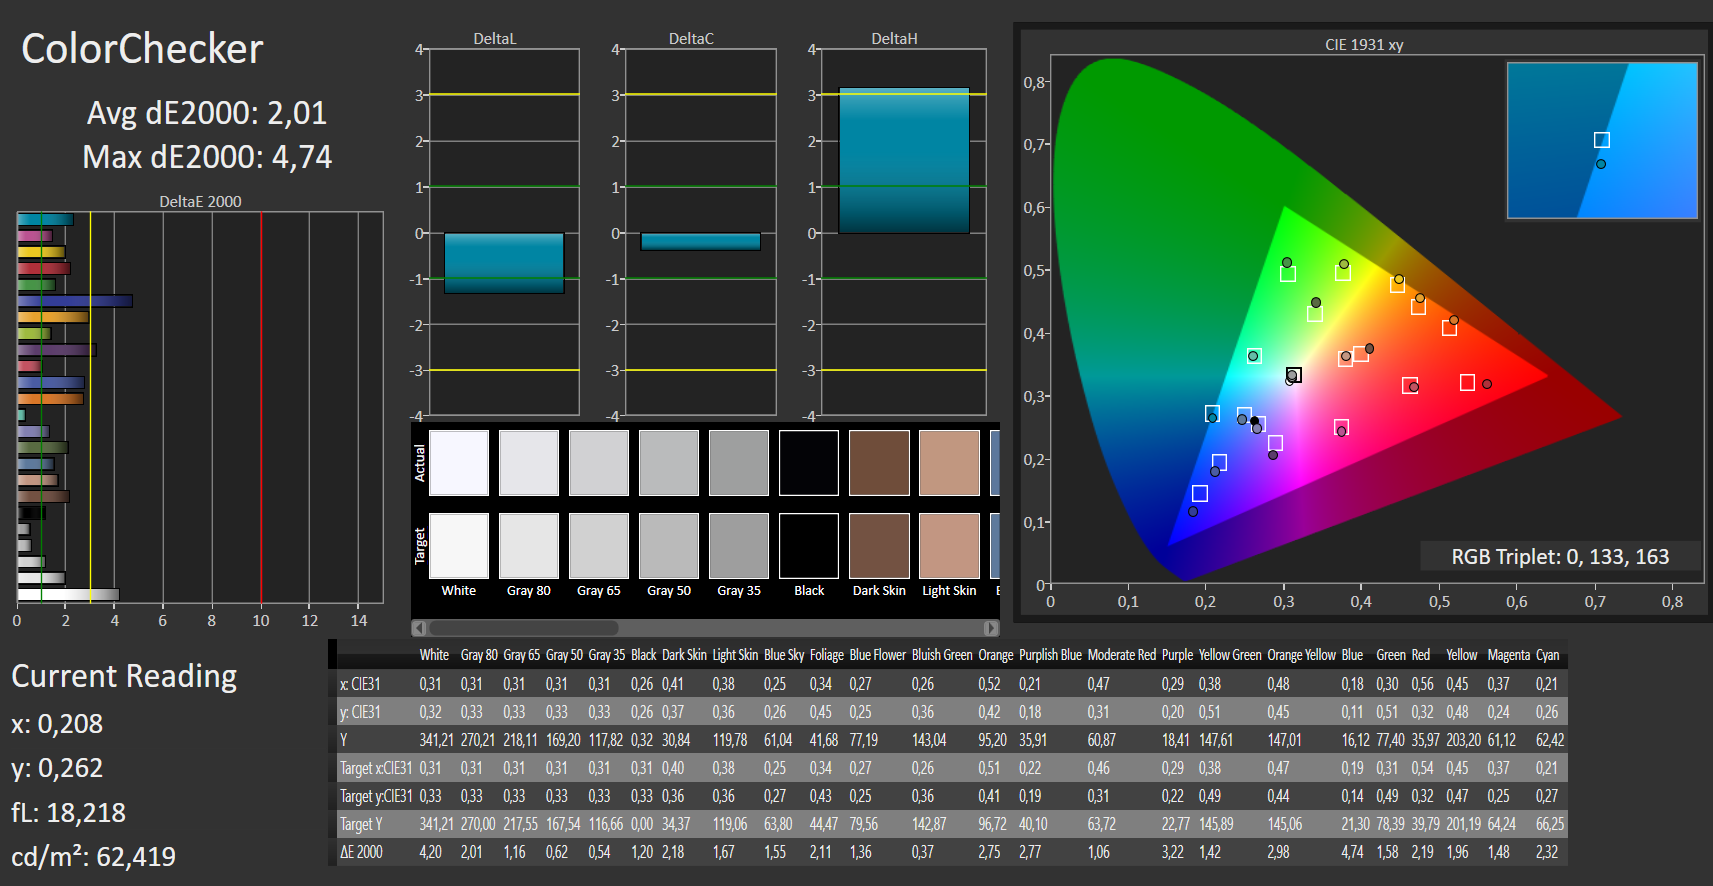
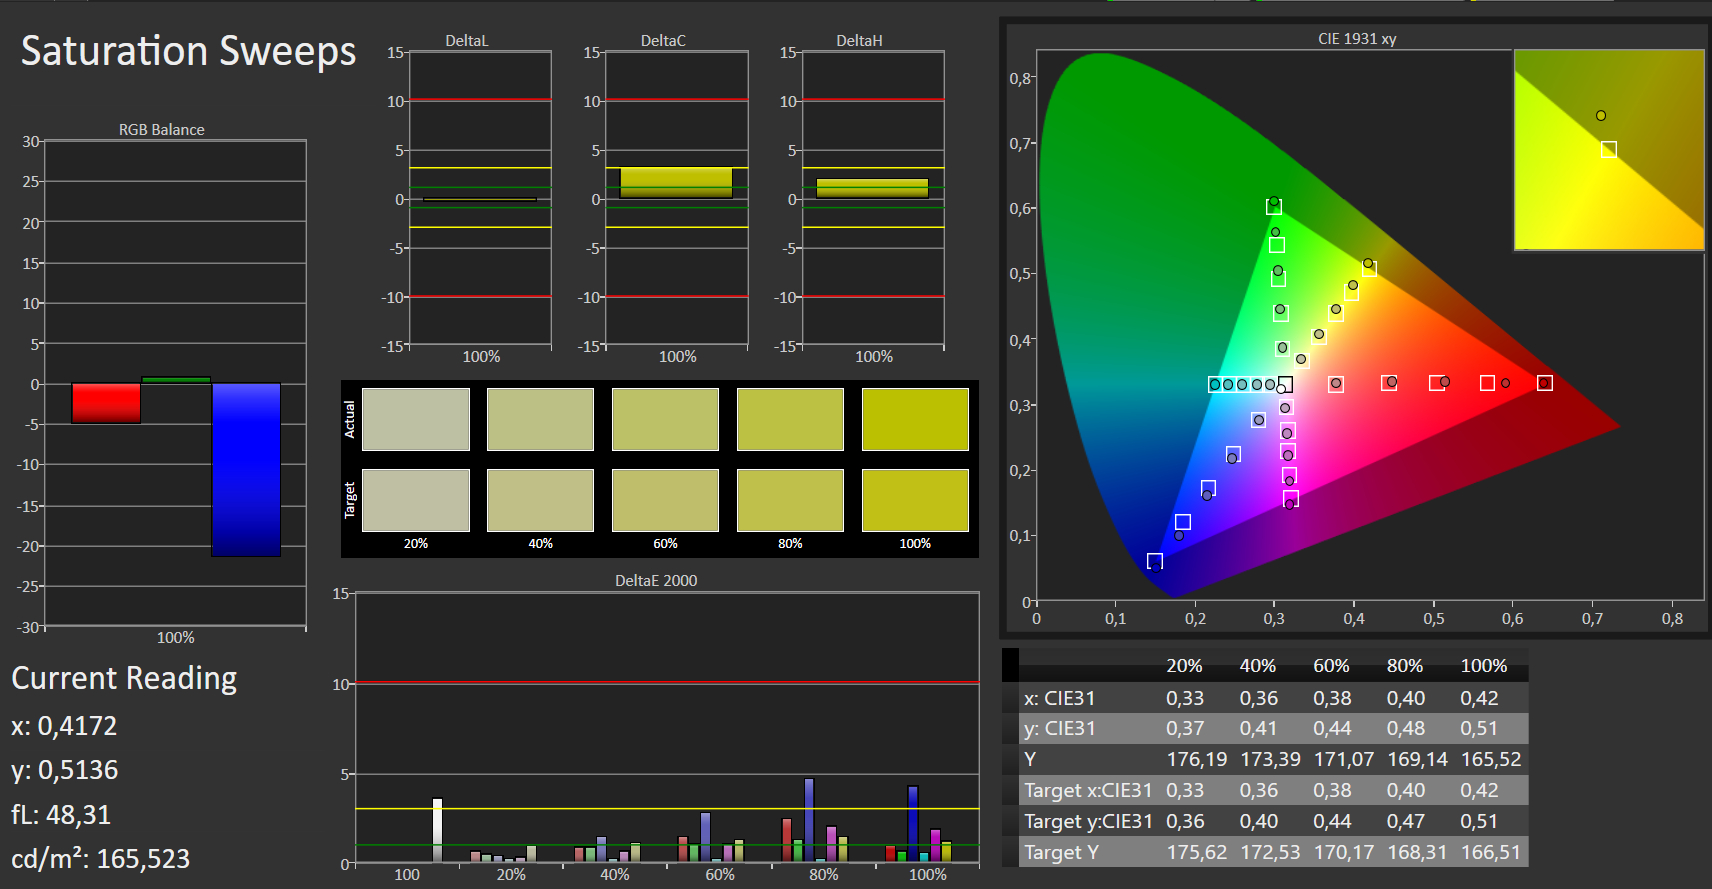
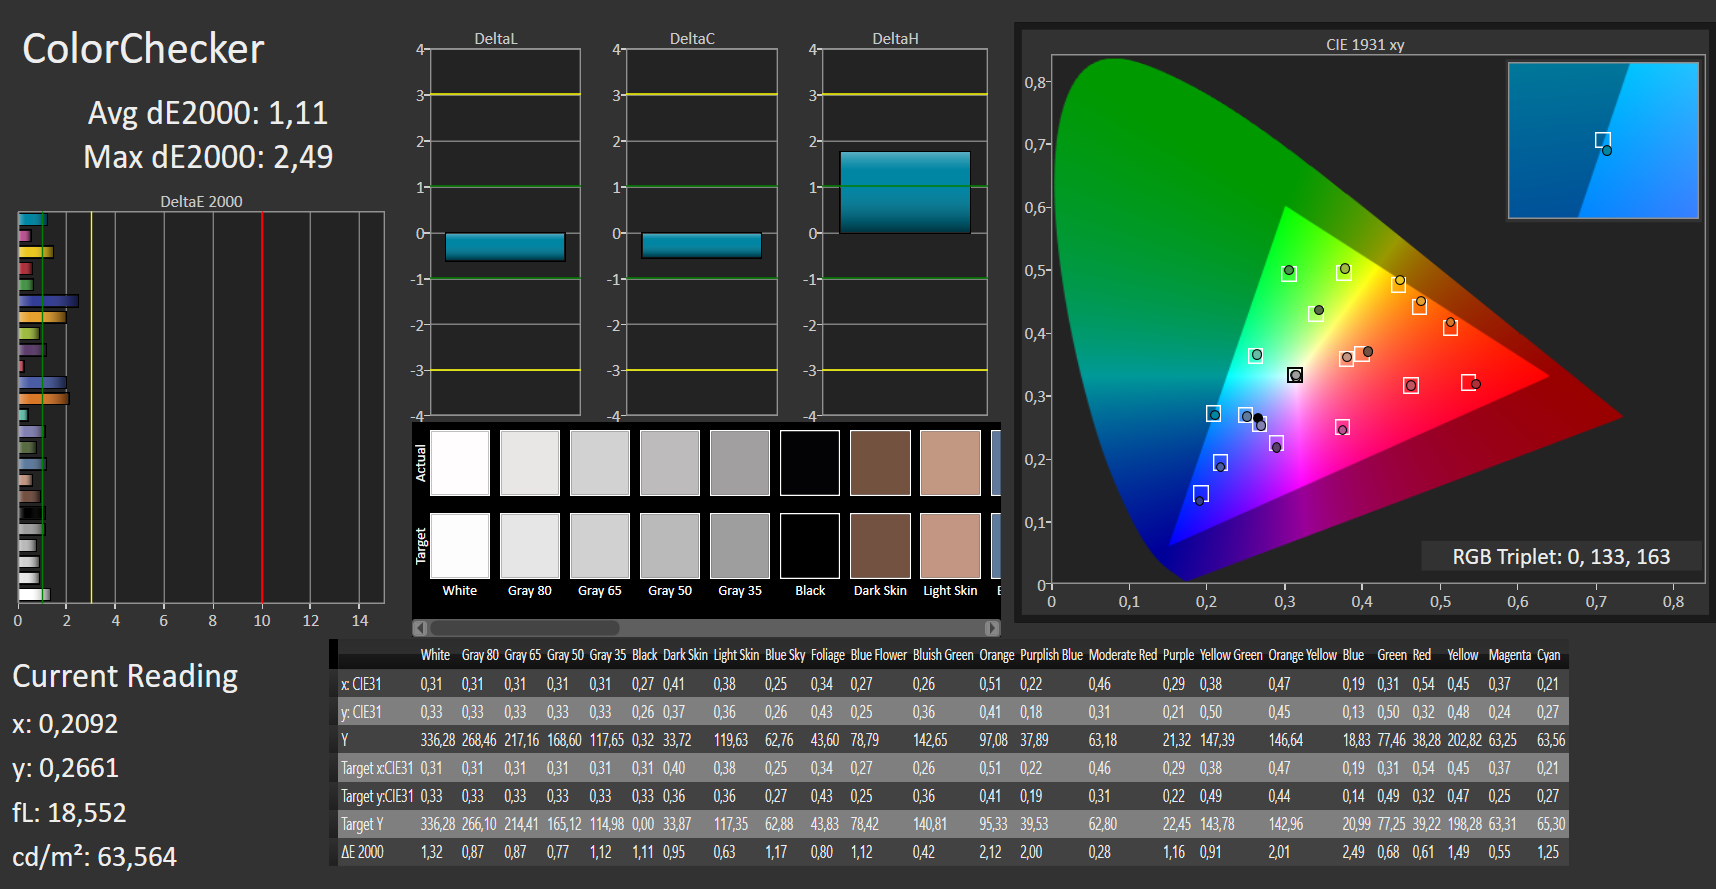
ΔE ColorChecker Calman: 2.01 | ∀{0.5-29.43 Ø4.71}
calibrated: 1.11
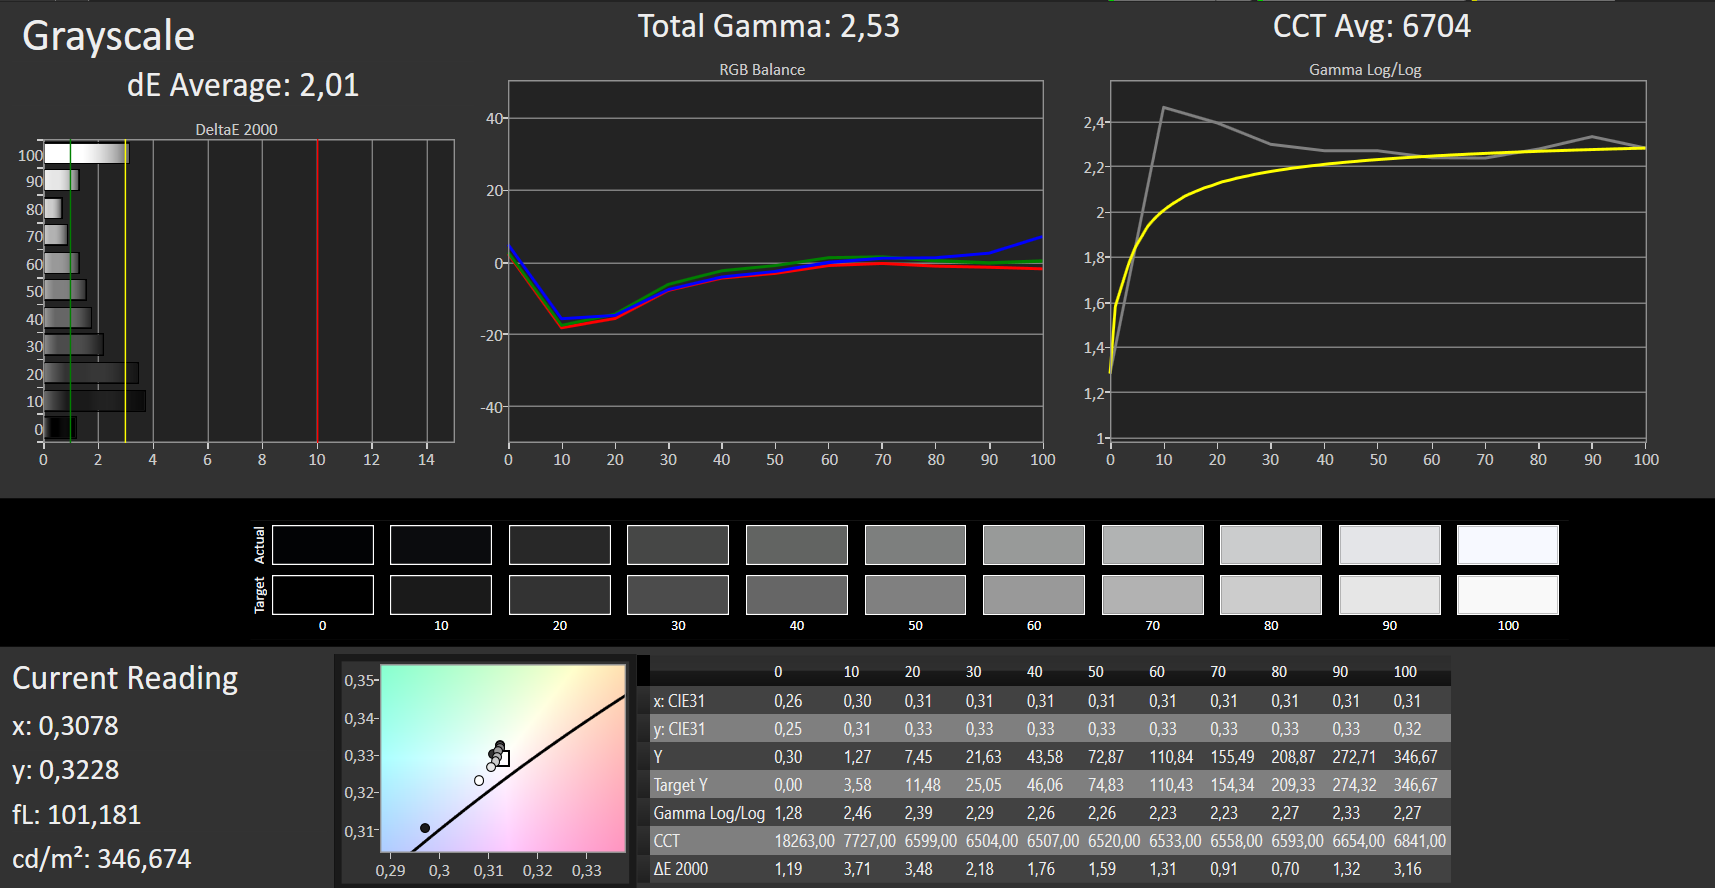
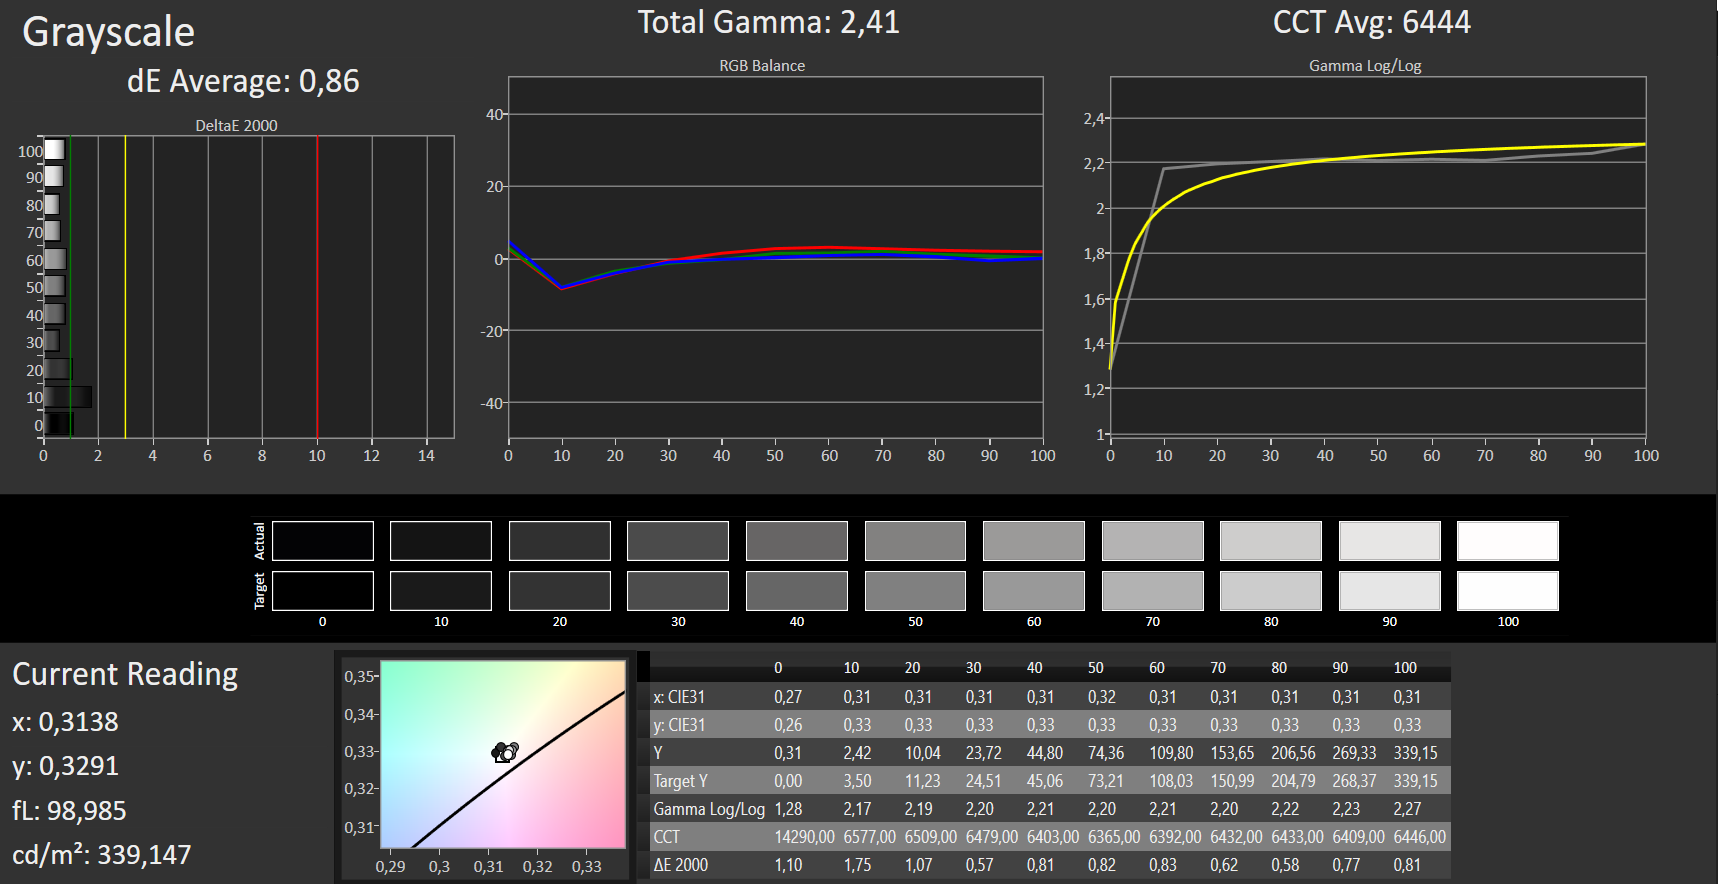
ΔE Greyscale Calman: 2.01 | ∀{0.09-98 Ø4.96}
98% sRGB (Argyll 1.6.3 3D)
63% AdobeRGB 1998 (Argyll 1.6.3 3D)
67.8% AdobeRGB 1998 (Argyll 3D)
98% sRGB (Argyll 3D)
66.8% Display P3 (Argyll 3D)
Gamma: 2.52
CCT: 6704 K
| Acer Swift 5 SF515-51T-76B6 IPS, 1920x1080, 15.6" | Lenovo ThinkPad X1 Carbon G6-20KG0025UK IPS, 1920x1080, 14" | Asus ZenBook 14 UX433FA IPS, 1920x1080, 14" | LG Gram 15Z980-B.AA78B IPS LED, 1920x1080, 15.6" | |
|---|---|---|---|---|
| Display | 0% | -5% | -2% | |
| Display P3 Coverage (%) | 66.8 | 68.3 2% | 64.3 -4% | 65.3 -2% |
| sRGB Coverage (%) | 98 | 94.9 -3% | 89.7 -8% | 96.2 -2% |
| AdobeRGB 1998 Coverage (%) | 67.8 | 69.3 2% | 65.1 -4% | 66.3 -2% |
| Response Times | -3% | 0% | 8% | |
| Response Time Grey 50% / Grey 80% * (ms) | 38 ? | 40 ? -5% | 39.6 ? -4% | 34.3 ? 10% |
| Response Time Black / White * (ms) | 25 ? | 25 ? -0% | 24 ? 4% | 23.7 ? 5% |
| PWM Frequency (Hz) | ||||
| Screen | -0% | -80% | -18% | |
| Brightness middle (cd/m²) | 341 | 298 -13% | 332.8 -2% | 349 2% |
| Brightness (cd/m²) | 319 | 287 -10% | 310 -3% | 331 4% |
| Brightness Distribution (%) | 87 | 91 5% | 87 0% | 84 -3% |
| Black Level * (cd/m²) | 0.31 | 0.2 35% | 0.29 6% | 0.32 -3% |
| Contrast (:1) | 1100 | 1490 35% | 1148 4% | 1091 -1% |
| Colorchecker dE 2000 * | 2.01 | 2.19 -9% | 5.14 -156% | 3.1 -54% |
| Colorchecker dE 2000 max. * | 4.74 | 4.39 7% | 11.88 -151% | 6.6 -39% |
| Colorchecker dE 2000 calibrated * | 1.11 | 1.67 -50% | 3.61 -225% | 1.5 -35% |
| Greyscale dE 2000 * | 2.01 | 1.97 2% | 8.8 -338% | 3.3 -64% |
| Gamma | 2.52 87% | 2.43 91% | 2.33 94% | 2.16 102% |
| CCT | 6704 97% | 6571 99% | 8227 79% | 6973 93% |
| Color Space (Percent of AdobeRGB 1998) (%) | 63 | 62 -2% | 58.1 -8% | 61.46 -2% |
| Color Space (Percent of sRGB) (%) | 98 | 95 -3% | 89.2 -9% | 96.05 -2% |
| Totalt genomsnitt (program/inställningar) | -1% /
-0% | -28% /
-56% | -4% /
-12% |
* ... mindre är bättre
Skärmflimmer / PWM (Puls-Width Modulation)
| Skärmflimmer / PWM upptäcktes inte | 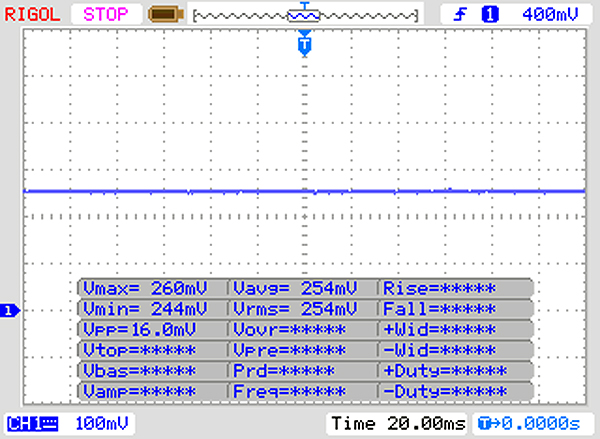 | ||
Som jämförelse: 52 % av alla testade enheter använder inte PWM för att dämpa skärmen. Om PWM upptäcktes mättes ett medelvärde av 7744 (minst: 5 - maximum: 343500) Hz. | |||
Visa svarstider
| ↔ Svarstid svart till vitt | ||
|---|---|---|
| 25 ms ... stiga ↗ och falla ↘ kombinerat | ↗ 14 ms stiga | 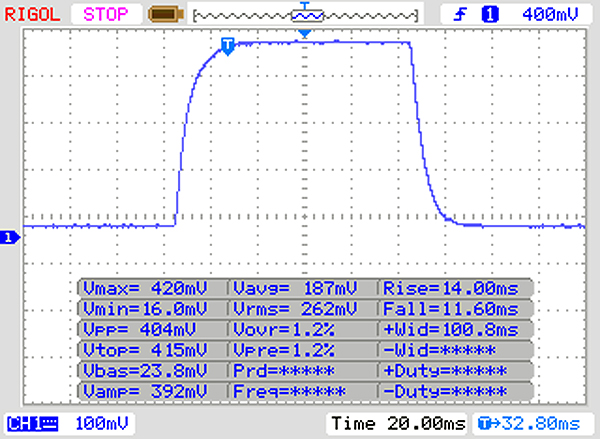 |
| ↘ 11 ms hösten | ||
| Skärmen visar relativt långsamma svarsfrekvenser i våra tester och kan vara för långsam för spelare. I jämförelse sträcker sig alla testade enheter från 0.1 (minst) till 240 (maximalt) ms. » 59 % av alla enheter är bättre. Detta innebär att den uppmätta svarstiden är sämre än genomsnittet av alla testade enheter (19.8 ms). | ||
| ↔ Svarstid 50 % grått till 80 % grått | ||
| 38 ms ... stiga ↗ och falla ↘ kombinerat | ↗ 19 ms stiga | 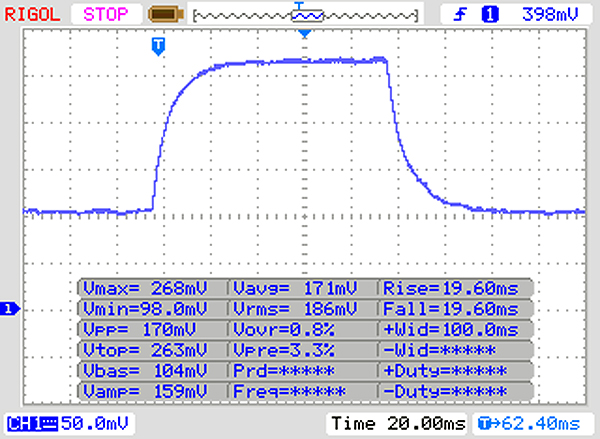 |
| ↘ 19 ms hösten | ||
| Skärmen visar långsamma svarsfrekvenser i våra tester och kommer att vara otillfredsställande för spelare. I jämförelse sträcker sig alla testade enheter från 0.165 (minst) till 636 (maximalt) ms. » 55 % av alla enheter är bättre. Detta innebär att den uppmätta svarstiden är sämre än genomsnittet av alla testade enheter (30.9 ms). | ||
| Geekbench 3 | |
| 32 Bit Multi-Core Score | |
| Genomsnitt av klass Subnotebook (n=1senaste 2 åren) | |
| Genomsnitt Intel Core i7-8565U (10521 - 13703, n=12) | |
| Acer Swift 5 SF515-51T-76B6 | |
| 32 Bit Single-Core Score | |
| Genomsnitt av klass Subnotebook (n=1senaste 2 åren) | |
| Acer Swift 5 SF515-51T-76B6 | |
| Genomsnitt Intel Core i7-8565U (3340 - 4820, n=12) | |
| Geekbench 4.0 | |
| 64 Bit Multi-Core Score | |
| Genomsnitt av klass Subnotebook (n=1senaste 2 åren) | |
| Genomsnitt Intel Core i7-8565U (11576 - 14655, n=4) | |
| Acer Swift 5 SF515-51T-76B6 | |
| 64 Bit Single-Core Score | |
| Genomsnitt av klass Subnotebook (n=1senaste 2 åren) | |
| Acer Swift 5 SF515-51T-76B6 | |
| Genomsnitt Intel Core i7-8565U (4701 - 4791, n=3) | |
| Mozilla Kraken 1.1 - Total | |
| Genomsnitt Intel Core i7-8565U (730 - 2622, n=43) | |
| Acer Swift 5 SF515-51T-76B6 (Edge 44) | |
| Asus ZenBook 14 UX433FA (Edge 42.17134.1.0) | |
| Genomsnitt av klass Subnotebook (234 - 1104, n=60, senaste 2 åren) | |
| Octane V2 - Total Score | |
| Genomsnitt av klass Subnotebook (35801 - 142020, n=28, senaste 2 åren) | |
| Asus ZenBook 14 UX433FA (Edge 42.17134.1.0) | |
| Acer Swift 5 SF515-51T-76B6 (Edge 44) | |
| Genomsnitt Intel Core i7-8565U (13935 - 49795, n=42) | |
| JetStream 1.1 - 1.1 Total | |
| Acer Swift 5 SF515-51T-76B6 (Edge 44) | |
| Asus ZenBook 14 UX433FA (Edge 42.17134.1.0) | |
| Genomsnitt Intel Core i7-8565U (107.6 - 277, n=37) | |
| Genomsnitt av klass Subnotebook (n=1senaste 2 åren) | |
* ... mindre är bättre
| PCMark 7 Score | 6240 poäng | |
| PCMark 8 Home Score Accelerated v2 | 4093 poäng | |
| PCMark 8 Creative Score Accelerated v2 | 5013 poäng | |
| PCMark 8 Work Score Accelerated v2 | 5181 poäng | |
| PCMark 10 Score | 4006 poäng | |
Hjälp | ||

| Acer Swift 5 SF515-51T-76B6 SK Hynix BC501 HFM512GDJTNG | Lenovo ThinkPad X1 Carbon G6-20KG0025UK Lenovo LENSE20256GMSP34MEAT2TA | LG Gram 15Z980-B.AA78B SK Hynix Canvas SC300 512GB M.2 (HFS512G39TNF) | Genomsnitt SK Hynix BC501 HFM512GDJTNG | |
|---|---|---|---|---|
| CrystalDiskMark 3.0 | -20% | -51% | -16% | |
| Write 4k QD32 (MB/s) | 490.1 | 184.7 -62% | 224.2 -54% | 330 ? -33% |
| Read 4k QD32 (MB/s) | 571 | 306.1 -46% | 251.5 -56% | 353 ? -38% |
| Write 4k (MB/s) | 149.1 | 94.1 -37% | 71.1 -52% | 116.2 ? -22% |
| Read 4k (MB/s) | 48.68 | 34.87 -28% | 23.6 -52% | 43.6 ? -10% |
| Write 512 (MB/s) | 678 | 243.3 -64% | 413.8 -39% | 617 ? -9% |
| Read 512 (MB/s) | 875 | 1227 40% | 367 -58% | 824 ? -6% |
| Write Seq (MB/s) | 763 | 479 -37% | 446.7 -41% | 745 ? -2% |
| Read Seq (MB/s) | 1089 | 1880 73% | 488.2 -55% | 1011 ? -7% |
| 3DMark 06 Standard Score | 12132 poäng | |
| 3DMark 11 Performance | 2087 poäng | |
| 3DMark Cloud Gate Standard Score | 9036 poäng | |
| 3DMark Fire Strike Score | 1199 poäng | |
Hjälp | ||
| låg | med. | hög | ultra | |
|---|---|---|---|---|
| Tomb Raider (2013) | 103.7 | 51.8 | 34.4 | 15.2 |
| BioShock Infinite (2013) | 76.5 | 39.9 | 33.5 | 9.4 |
| The Witcher 3 (2015) | 16.9 | 10.9 | 6.1 | 3.1 |
Ljudnivå
| Låg belastning |
| 30.5 / 30.5 / 30.9 dB(A) |
| Hög belastning |
| 34.9 / 35 dB(A) |
 | ||
30 dB tyst 40 dB(A) hörbar 50 dB(A) högt ljud |
||
min: | ||
| Acer Swift 5 SF515-51T-76B6 i7-8565U, UHD Graphics 620 | Lenovo ThinkPad X1 Carbon G6-20KG0025UK i5-8350U, UHD Graphics 620 | Asus ZenBook 14 UX433FA i7-8565U, UHD Graphics 620 | LG Gram 15Z980-B.AA78B i5-8550U, UHD Graphics 620 | Genomsnitt Intel UHD Graphics 620 | Genomsnitt av klass Subnotebook | |
|---|---|---|---|---|---|---|
| Noise | 4% | 1% | 1% | 3% | 10% | |
| av / miljö * (dB) | 30.5 | 30.25 1% | 28.8 6% | 29.7 3% | 29 ? 5% | 24.2 ? 21% |
| Idle Minimum * (dB) | 30.5 | 30.25 1% | 28.8 6% | 30.3 1% | 29.1 ? 5% | 24.3 ? 20% |
| Idle Average * (dB) | 30.5 | 30.25 1% | 28.8 6% | 30.3 1% | 29.1 ? 5% | 24.5 ? 20% |
| Idle Maximum * (dB) | 30.9 | 30.25 2% | 29.1 6% | 31.1 -1% | 29.7 ? 4% | 25.1 ? 19% |
| Load Average * (dB) | 34.9 | 31.3 10% | 36.1 -3% | 34.9 -0% | 33.5 ? 4% | 34.6 ? 1% |
| Load Maximum * (dB) | 35 | 31.3 11% | 41.2 -18% | 34.9 -0% | 36.1 ? -3% | 42.1 ? -20% |
* ... mindre är bättre
(±) Den maximala temperaturen på ovansidan är 44.4 °C / 112 F, jämfört med genomsnittet av 35.9 °C / 97 F , allt från 21.4 till 59 °C för klassen Subnotebook.
(-) Botten värms upp till maximalt 45.7 °C / 114 F, jämfört med genomsnittet av 39.2 °C / 103 F
(+) Vid tomgångsbruk är medeltemperaturen för ovansidan 24.1 °C / 75 F, jämfört med enhetsgenomsnittet på 30.8 °C / ### class_avg_f### F.
(±) Handledsstöden och pekplattan kan bli väldigt varma vid beröring med maximalt 38.9 °C / 102 F.
(-) Medeltemperaturen för handledsstödsområdet på liknande enheter var 28.2 °C / 82.8 F (-10.7 °C / -19.2 F).
| Acer Swift 5 SF515-51T-76B6 i7-8565U, UHD Graphics 620 | Lenovo ThinkPad X1 Carbon G6-20KG0025UK i5-8350U, UHD Graphics 620 | Asus ZenBook 14 UX433FA i7-8565U, UHD Graphics 620 | LG Gram 15Z980-B.AA78B i5-8550U, UHD Graphics 620 | Genomsnitt Intel UHD Graphics 620 | Genomsnitt av klass Subnotebook | |
|---|---|---|---|---|---|---|
| Heat | 0% | -9% | -1% | -1% | 0% | |
| Maximum Upper Side * (°C) | 44.4 | 40.7 8% | 42.4 5% | 43 3% | 41.1 ? 7% | 41.7 ? 6% |
| Maximum Bottom * (°C) | 45.7 | 41.6 9% | 45 2% | 41 10% | 44.3 ? 3% | 43.5 ? 5% |
| Idle Upper Side * (°C) | 25.4 | 28 -10% | 31 -22% | 28 -10% | 26.8 ? -6% | 26.7 ? -5% |
| Idle Bottom * (°C) | 25.8 | 27.4 -6% | 30.8 -19% | 27 -5% | 27.7 ? -7% | 27.3 ? -6% |
* ... mindre är bättre
Acer Swift 5 SF515-51T-76B6 ljudanalys
(-) | inte särskilt höga högtalare (62.4 dB)
Bas 100 - 315 Hz
(±) | reducerad bas - i genomsnitt 14.5% lägre än medianen
(±) | linjäriteten för basen är genomsnittlig (13.9% delta till föregående frekvens)
Mellan 400 - 2000 Hz
(±) | högre mellan - i genomsnitt 5.6% högre än median
(±) | linjäriteten för mids är genomsnittlig (7.8% delta till föregående frekvens)
Högsta 2 - 16 kHz
(+) | balanserade toppar - endast 1.9% från medianen
(+) | toppar är linjära (6.1% delta till föregående frekvens)
Totalt 100 - 16 000 Hz
(±) | linjäriteten för det totala ljudet är genomsnittlig (23.5% skillnad mot median)
Jämfört med samma klass
» 81% av alla testade enheter i den här klassen var bättre, 3% liknande, 16% sämre
» Den bästa hade ett delta på 5%, genomsnittet var 18%, sämst var 53%
Jämfört med alla testade enheter
» 70% av alla testade enheter var bättre, 6% liknande, 24% sämre
» Den bästa hade ett delta på 4%, genomsnittet var 23%, sämst var 134%
LG Gram 15Z980-B.AA78B ljudanalys
(+) | högtalare kan spela relativt högt (82.2 dB)
Bas 100 - 315 Hz
(-) | nästan ingen bas - i genomsnitt 24.1% lägre än medianen
(±) | linjäriteten för basen är genomsnittlig (12.3% delta till föregående frekvens)
Mellan 400 - 2000 Hz
(±) | högre mellan - i genomsnitt 5.4% högre än median
(+) | mids är linjära (6.5% delta till föregående frekvens)
Högsta 2 - 16 kHz
(+) | balanserade toppar - endast 1.1% från medianen
(+) | toppar är linjära (3.7% delta till föregående frekvens)
Totalt 100 - 16 000 Hz
(±) | linjäriteten för det totala ljudet är genomsnittlig (19.3% skillnad mot median)
Jämfört med samma klass
» 60% av alla testade enheter i den här klassen var bättre, 7% liknande, 34% sämre
» Den bästa hade ett delta på 5%, genomsnittet var 18%, sämst var 53%
Jämfört med alla testade enheter
» 47% av alla testade enheter var bättre, 8% liknande, 46% sämre
» Den bästa hade ett delta på 4%, genomsnittet var 23%, sämst var 134%
| Av/Standby | |
| Låg belastning | |
| Hög belastning |
|
Förklaring:
min: | |
| Acer Swift 5 SF515-51T-76B6 i7-8565U, UHD Graphics 620 | Lenovo ThinkPad X1 Carbon G6-20KG0025UK i5-8350U, UHD Graphics 620 | Asus ZenBook 14 UX433FA i7-8565U, UHD Graphics 620 | LG Gram 15Z980-B.AA78B i5-8550U, UHD Graphics 620 | Genomsnitt Intel UHD Graphics 620 | Genomsnitt av klass Subnotebook | |
|---|---|---|---|---|---|---|
| Power Consumption | 1% | -6% | -13% | -6% | -17% | |
| Idle Minimum * (Watt) | 3 | 4.7 -57% | 3.9 -30% | 3.7 -23% | 3.81 ? -27% | 3.73 ? -24% |
| Idle Average * (Watt) | 7.7 | 7.3 5% | 5.9 23% | 8.5 -10% | 6.94 ? 10% | 6.57 ? 15% |
| Idle Maximum * (Watt) | 11.6 | 9.4 19% | 8.8 24% | 10 14% | 8.75 ? 25% | 7.93 ? 32% |
| Load Average * (Watt) | 34 | 28 18% | 41.7 -23% | 36 -6% | 35 ? -3% | 42.1 ? -24% |
| Load Maximum * (Watt) | 35 | 28.2 19% | 44 -26% | 48.7 -39% | 47.5 ? -36% | 65.1 ? -86% |
* ... mindre är bättre
| Acer Swift 5 SF515-51T-76B6 i7-8565U, UHD Graphics 620, 53.9 Wh | LG Gram 15Z980-B.AA78B i5-8550U, UHD Graphics 620, 72 Wh | Lenovo ThinkPad X1 Carbon G6-20KG0025UK i5-8350U, UHD Graphics 620, 57 Wh | Asus ZenBook 14 UX433FA i7-8565U, UHD Graphics 620, 50 Wh | Genomsnitt av klass Subnotebook | |
|---|---|---|---|---|---|
| Batteridrifttid | 103% | 32% | 34% | 64% | |
| Reader / Idle (h) | 16.2 | 24.5 51% | 19.1 18% | 26.4 ? 63% | |
| H.264 (h) | 7.2 | 15.8 119% | 11 53% | 15.3 ? 113% | |
| WiFi v1.3 (h) | 7.2 | 13.4 86% | 10.4 44% | 10.5 46% | 13.9 ? 93% |
| Load (h) | 2.4 | 1.9 -21% | 3.3 38% | 2.04 ? -15% |
För
Emot
Läs den fullständiga versionen av den här recensionen på engelska här.
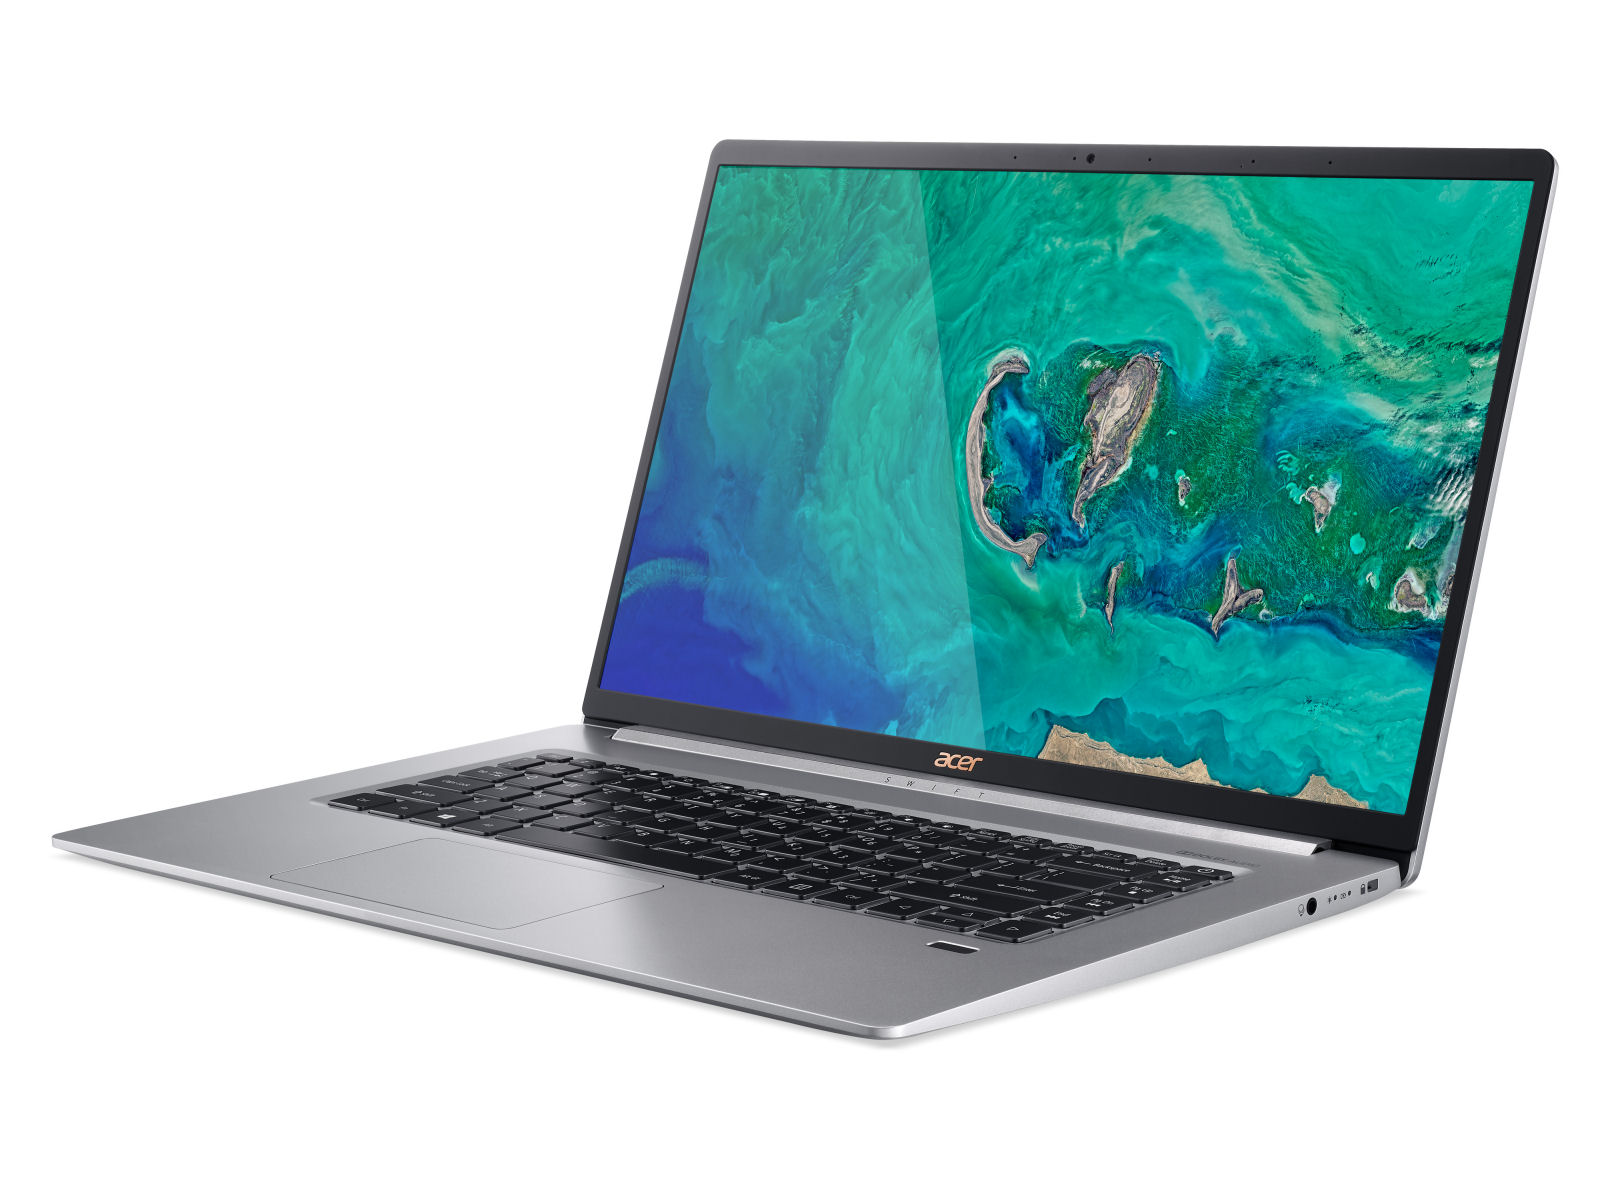
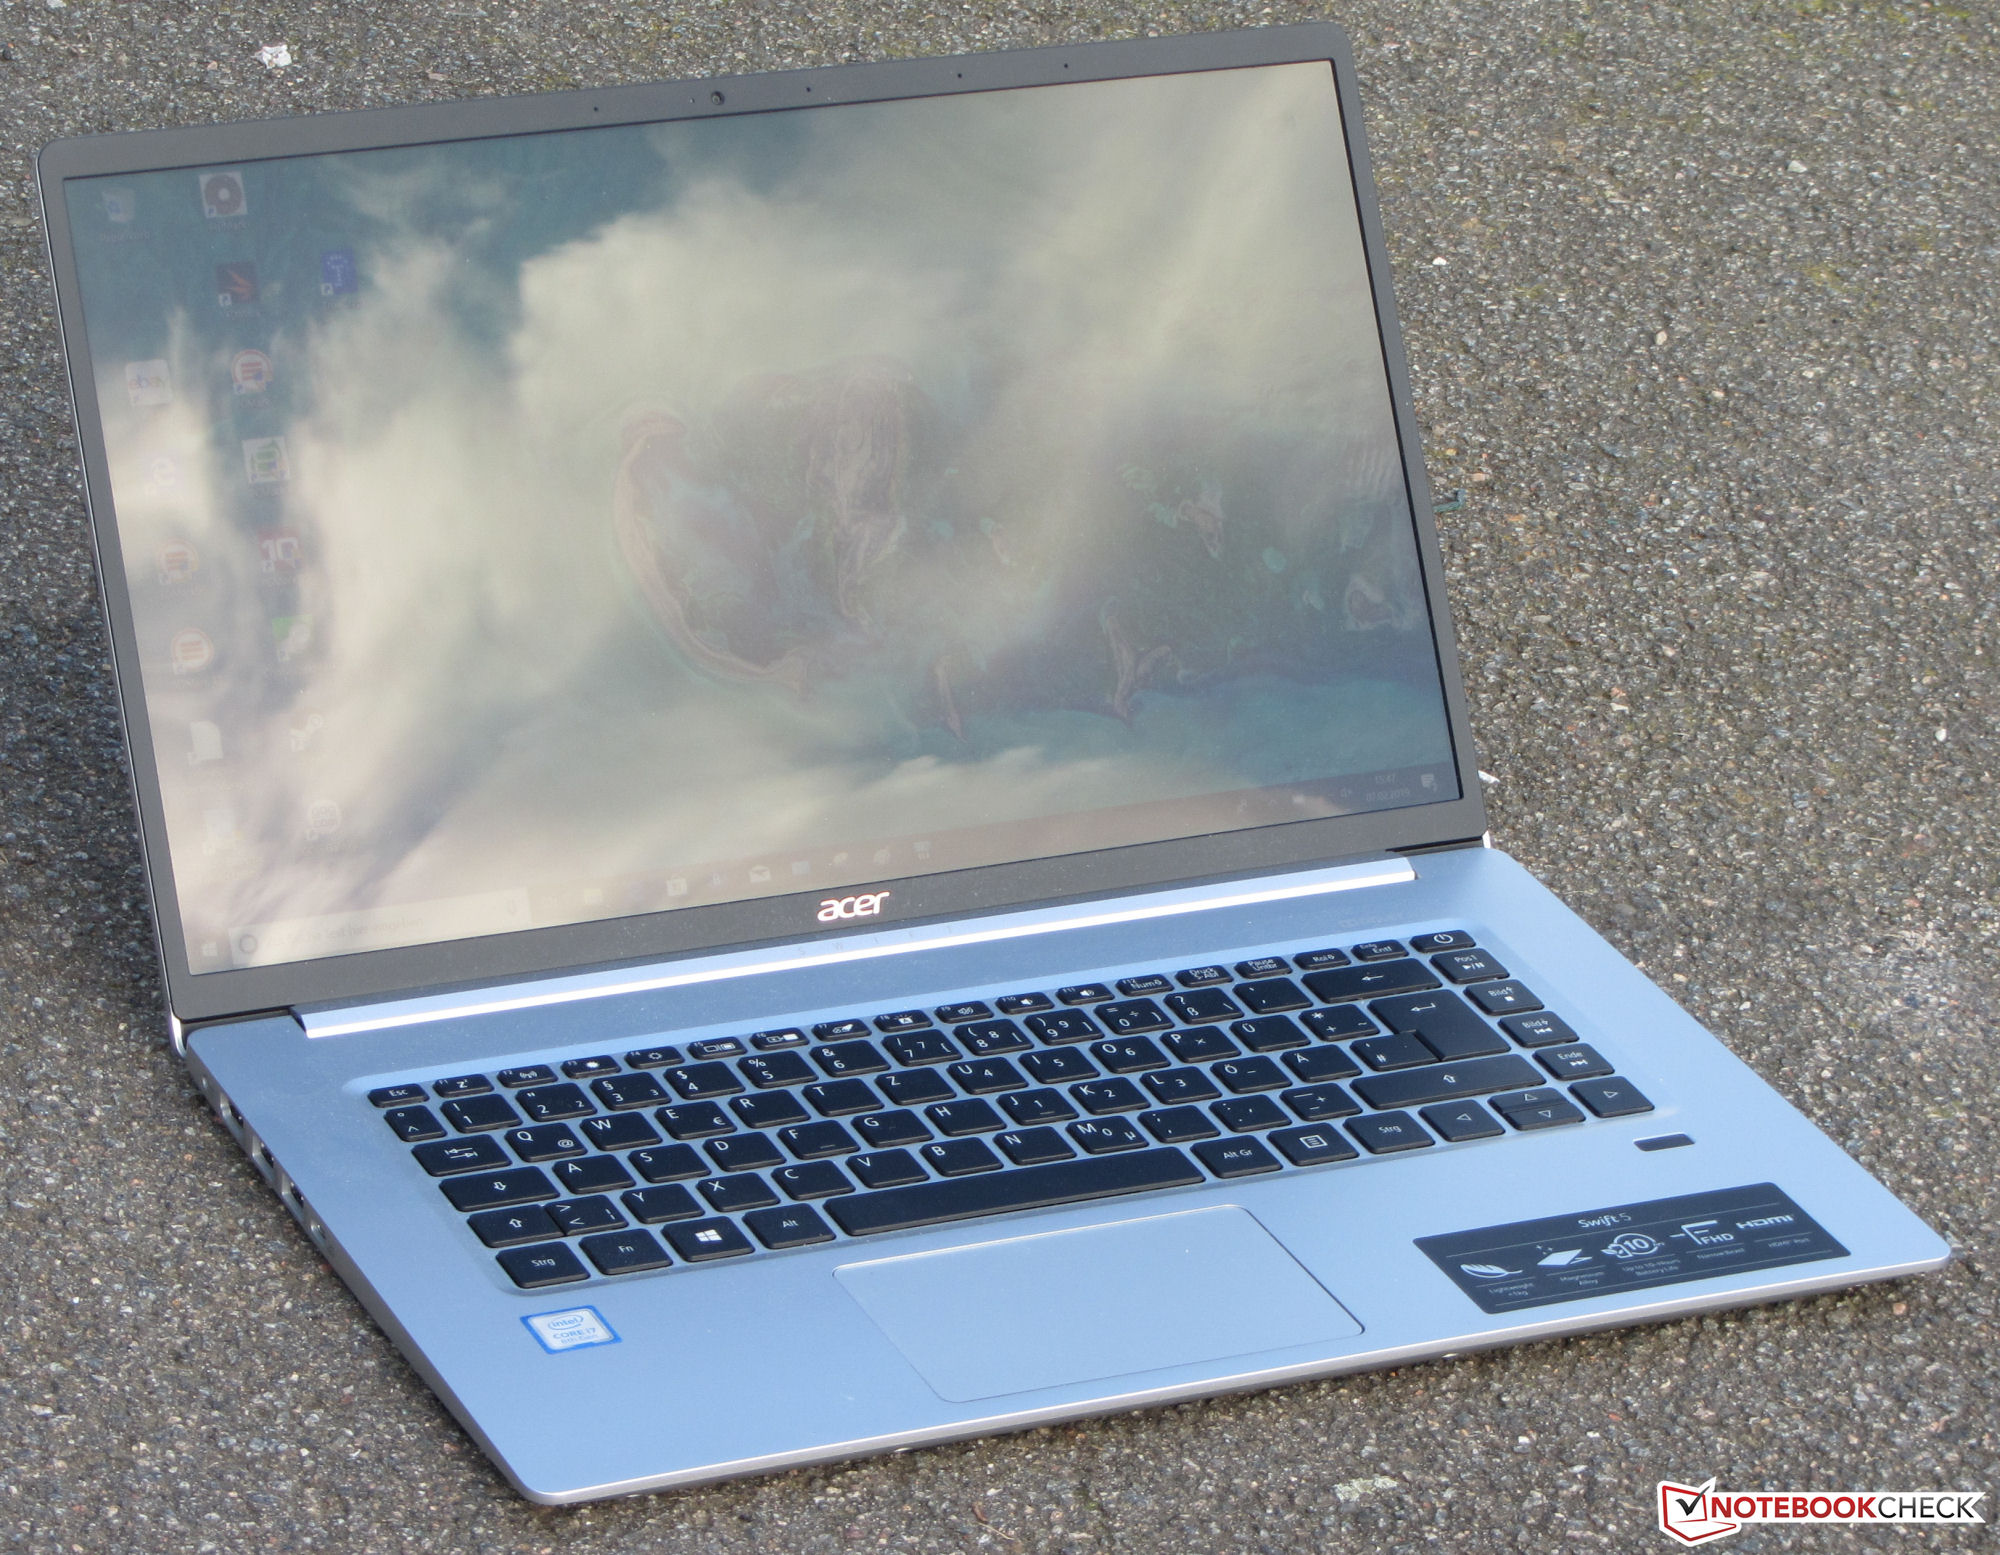
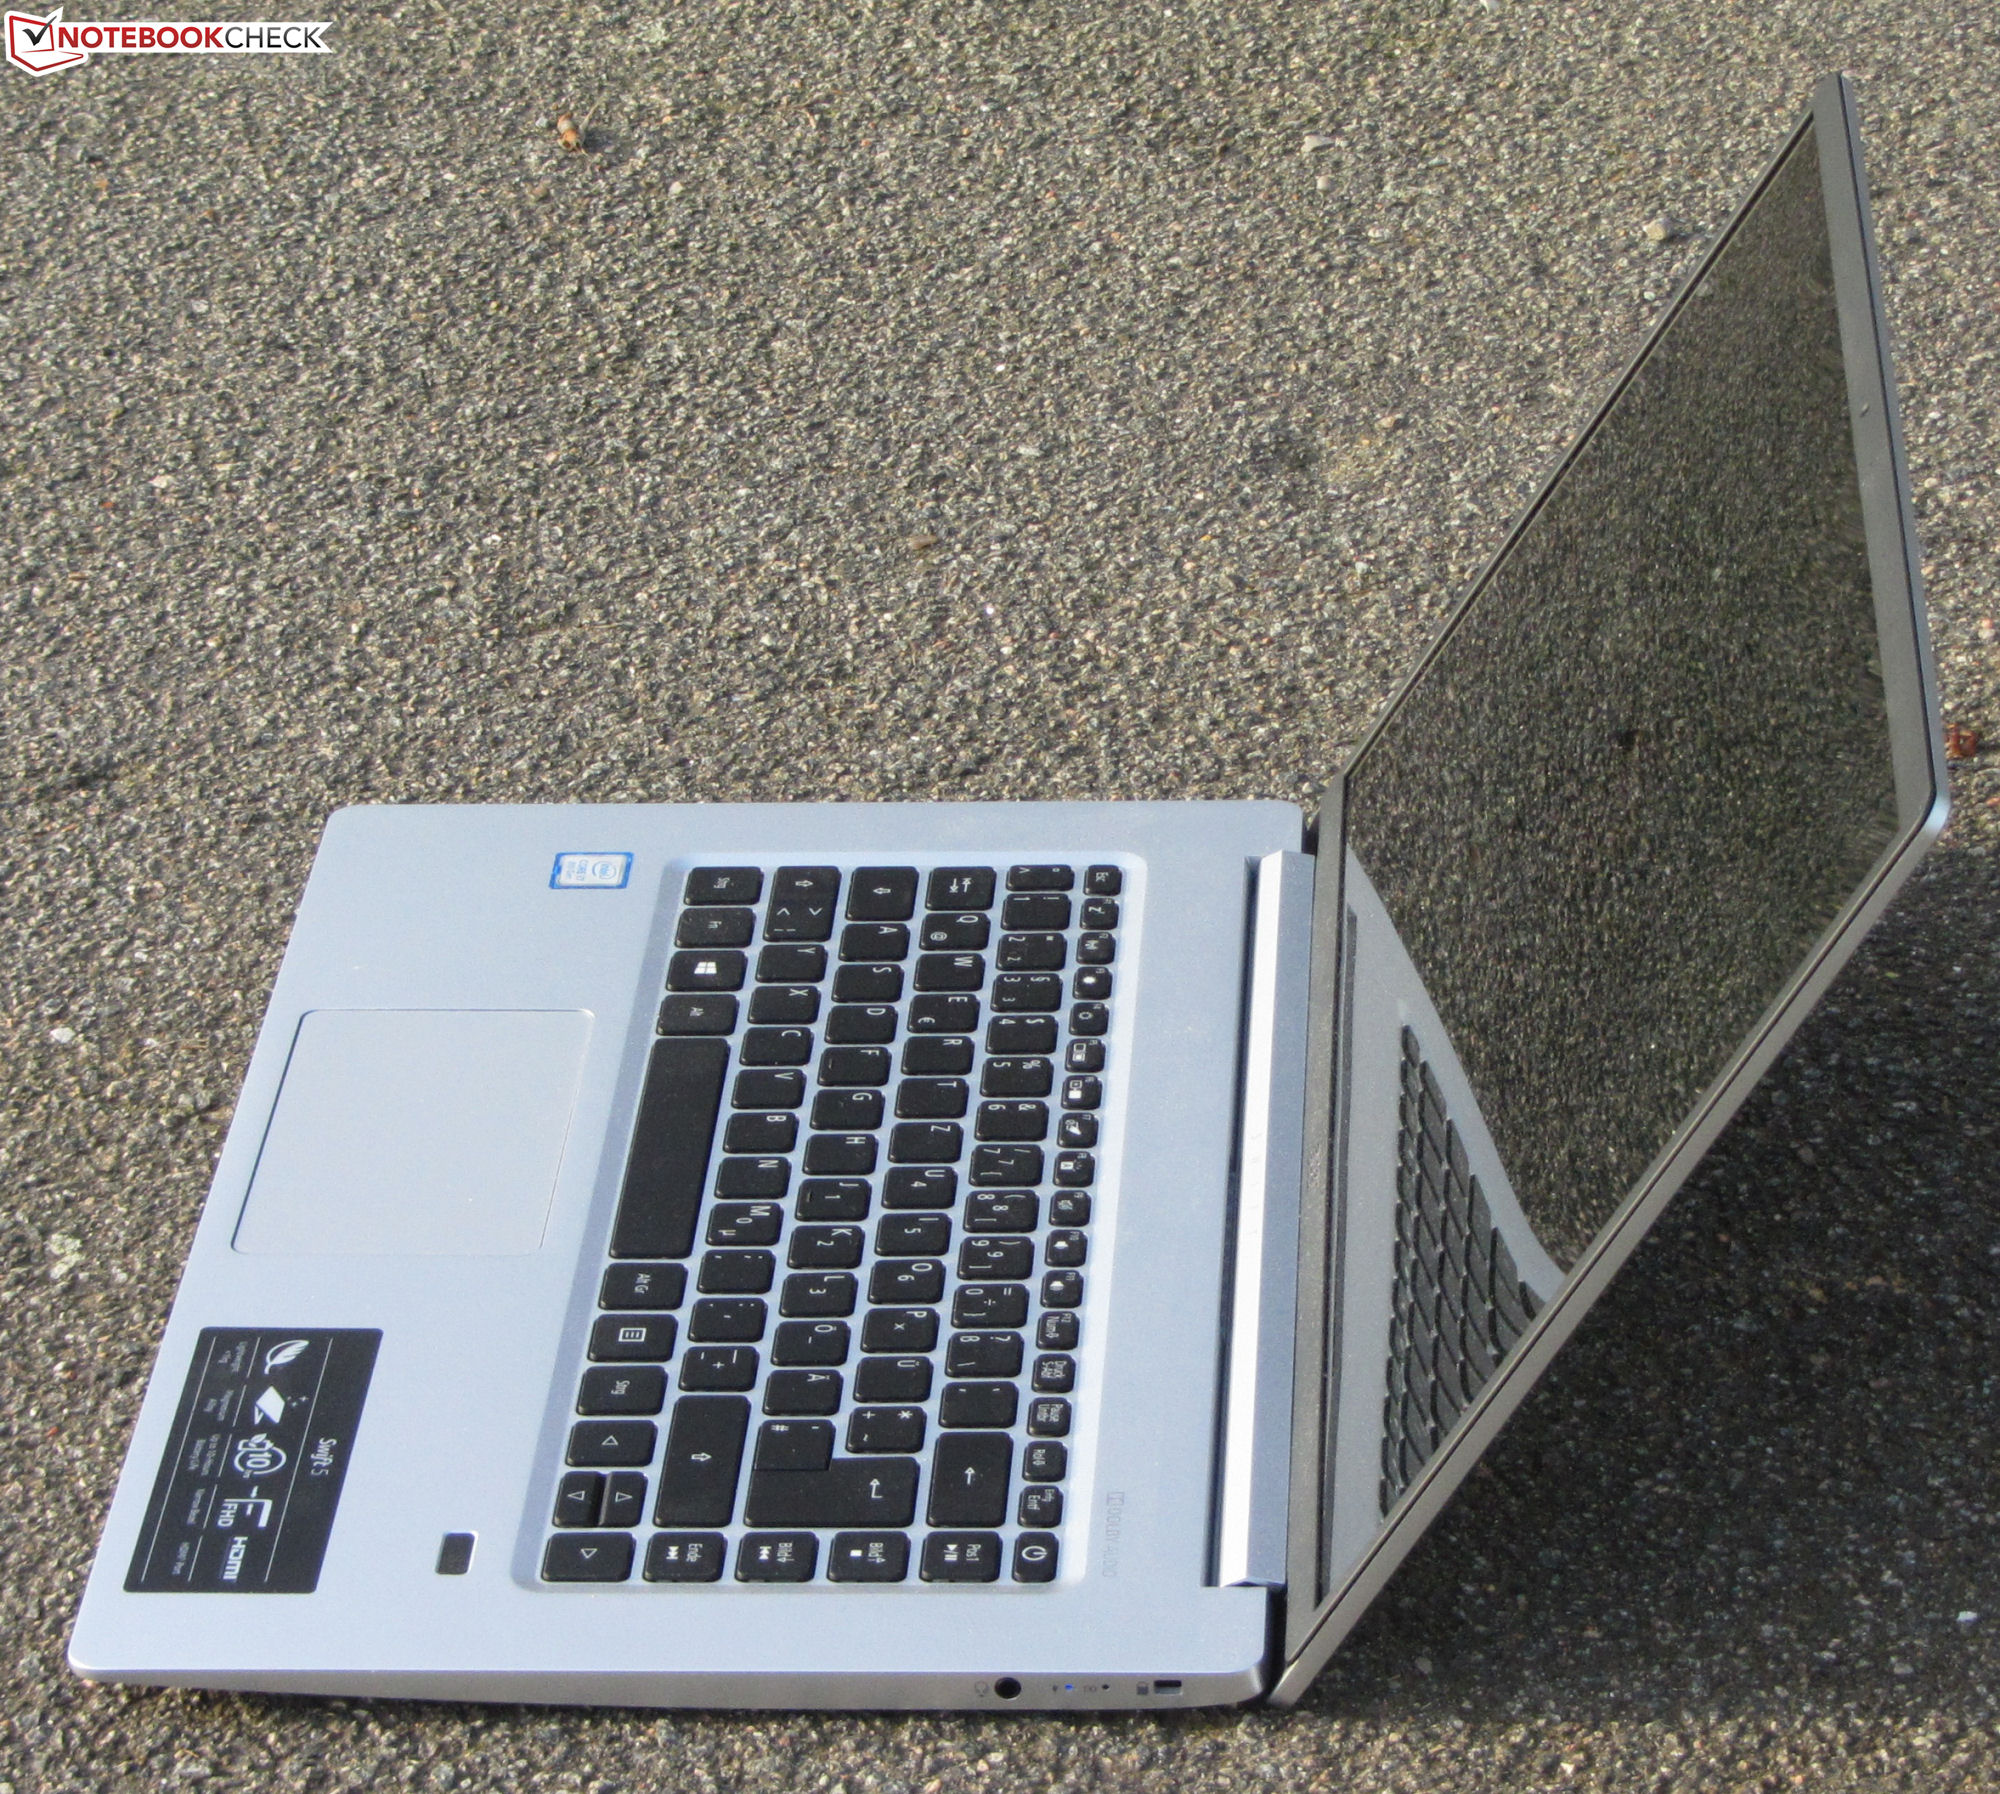
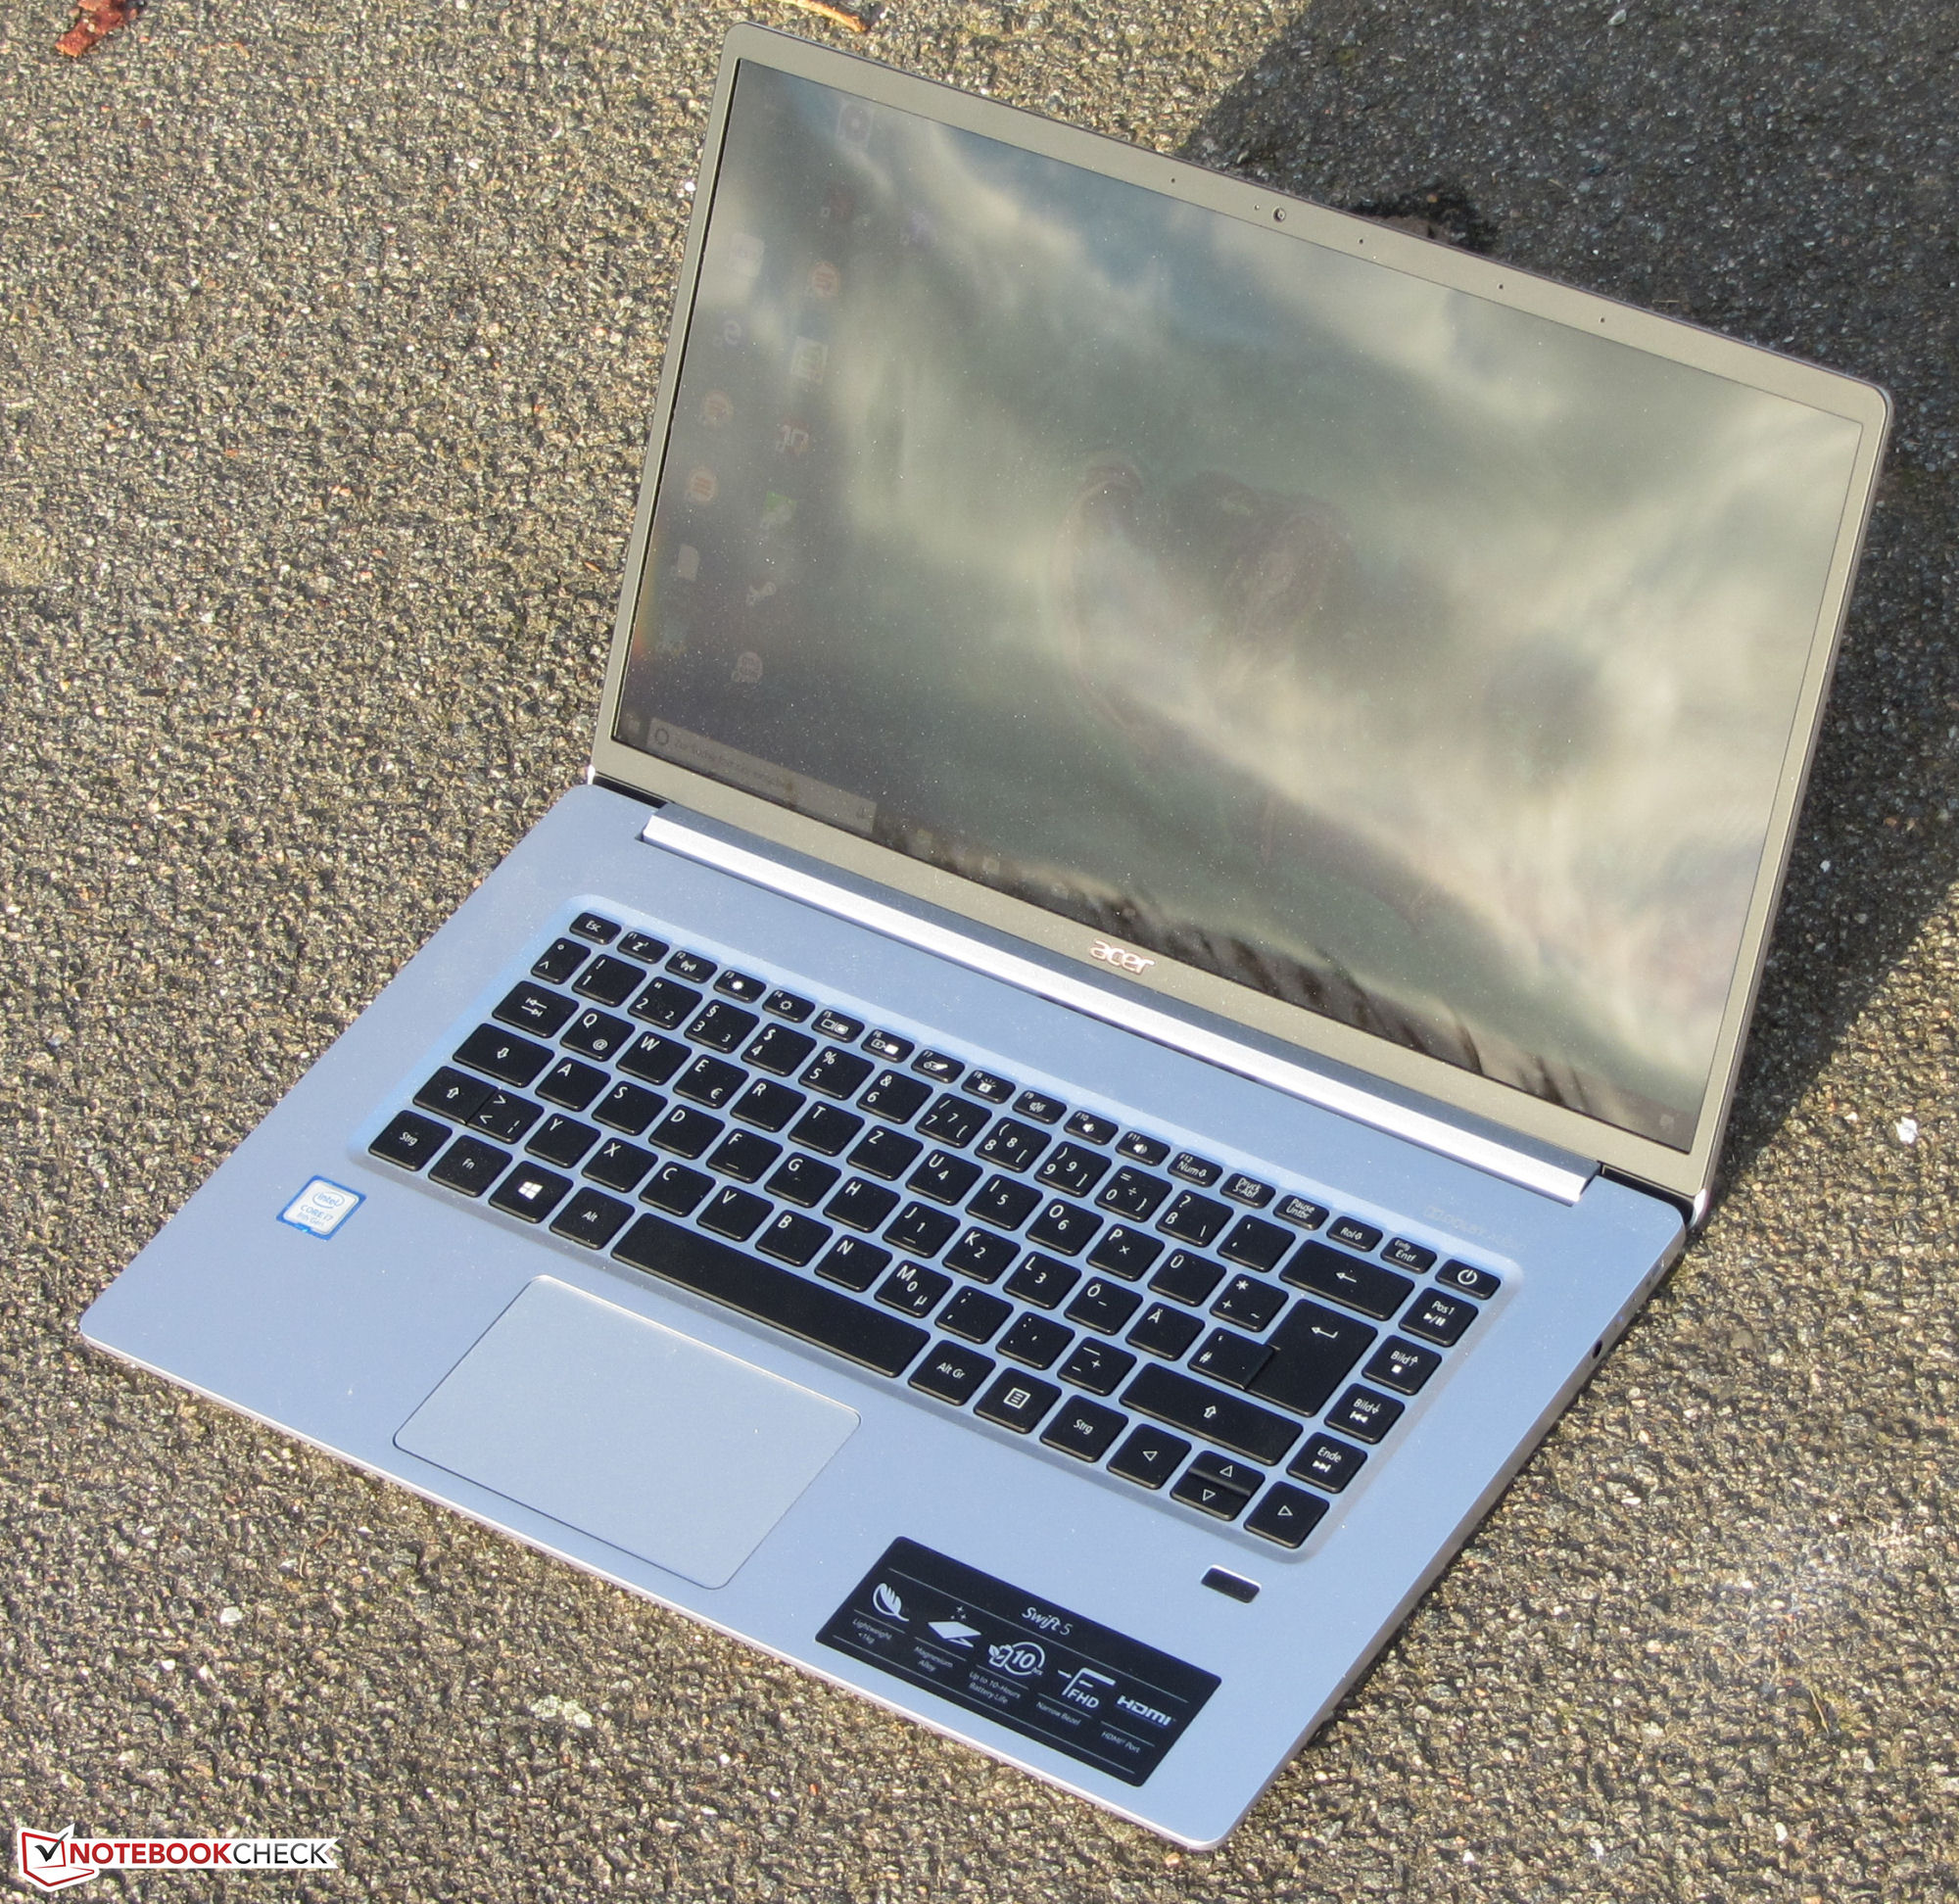
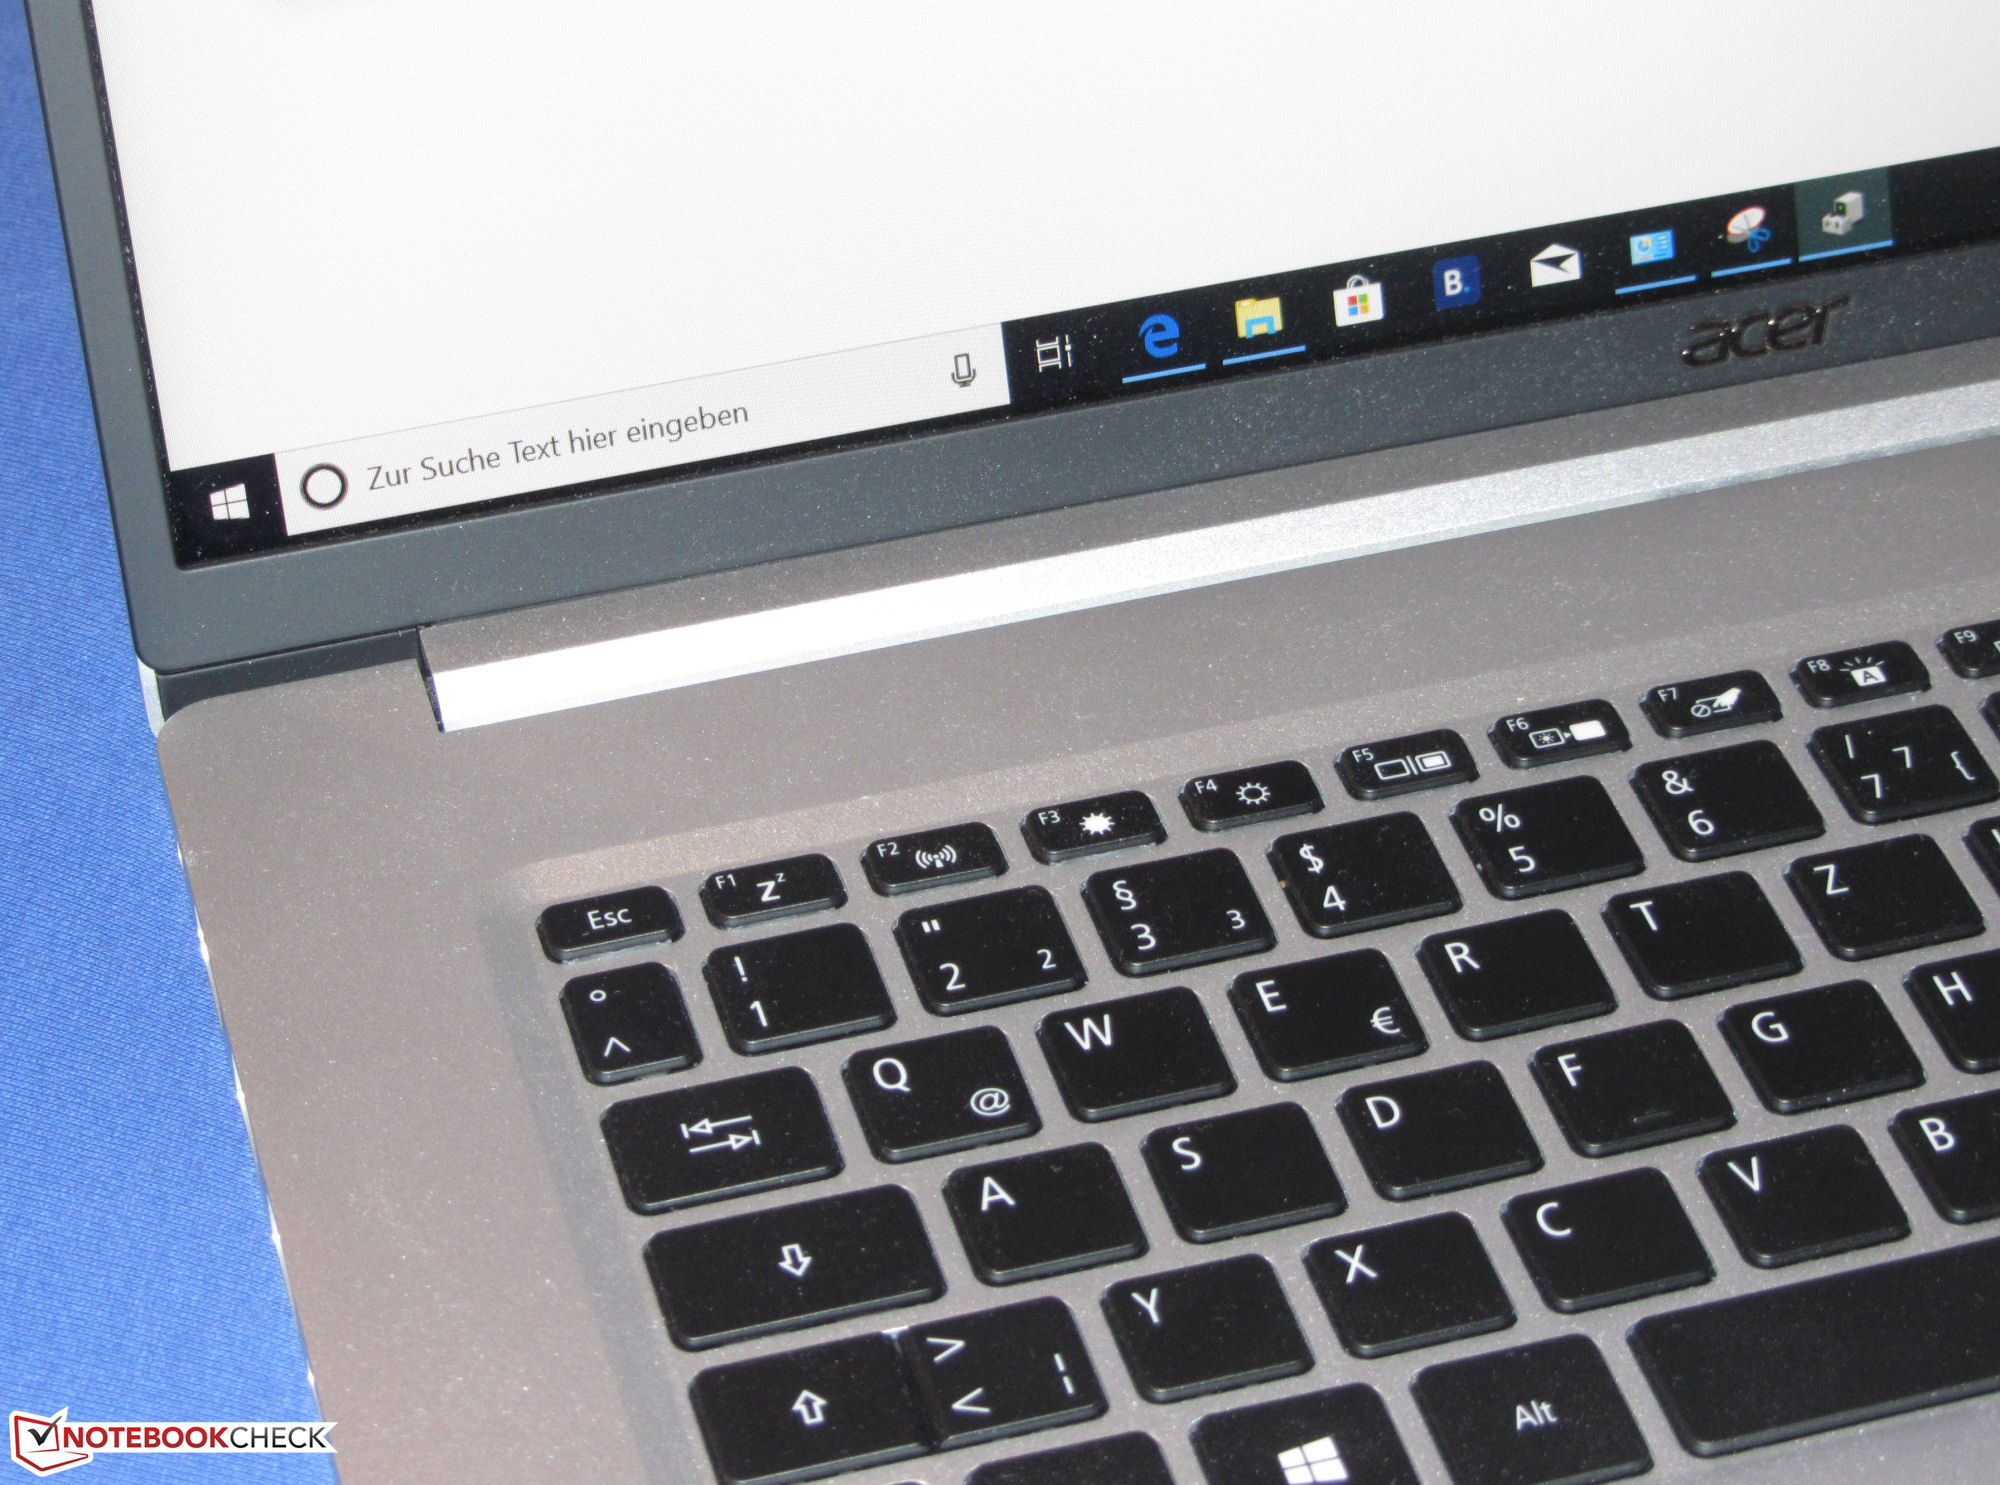
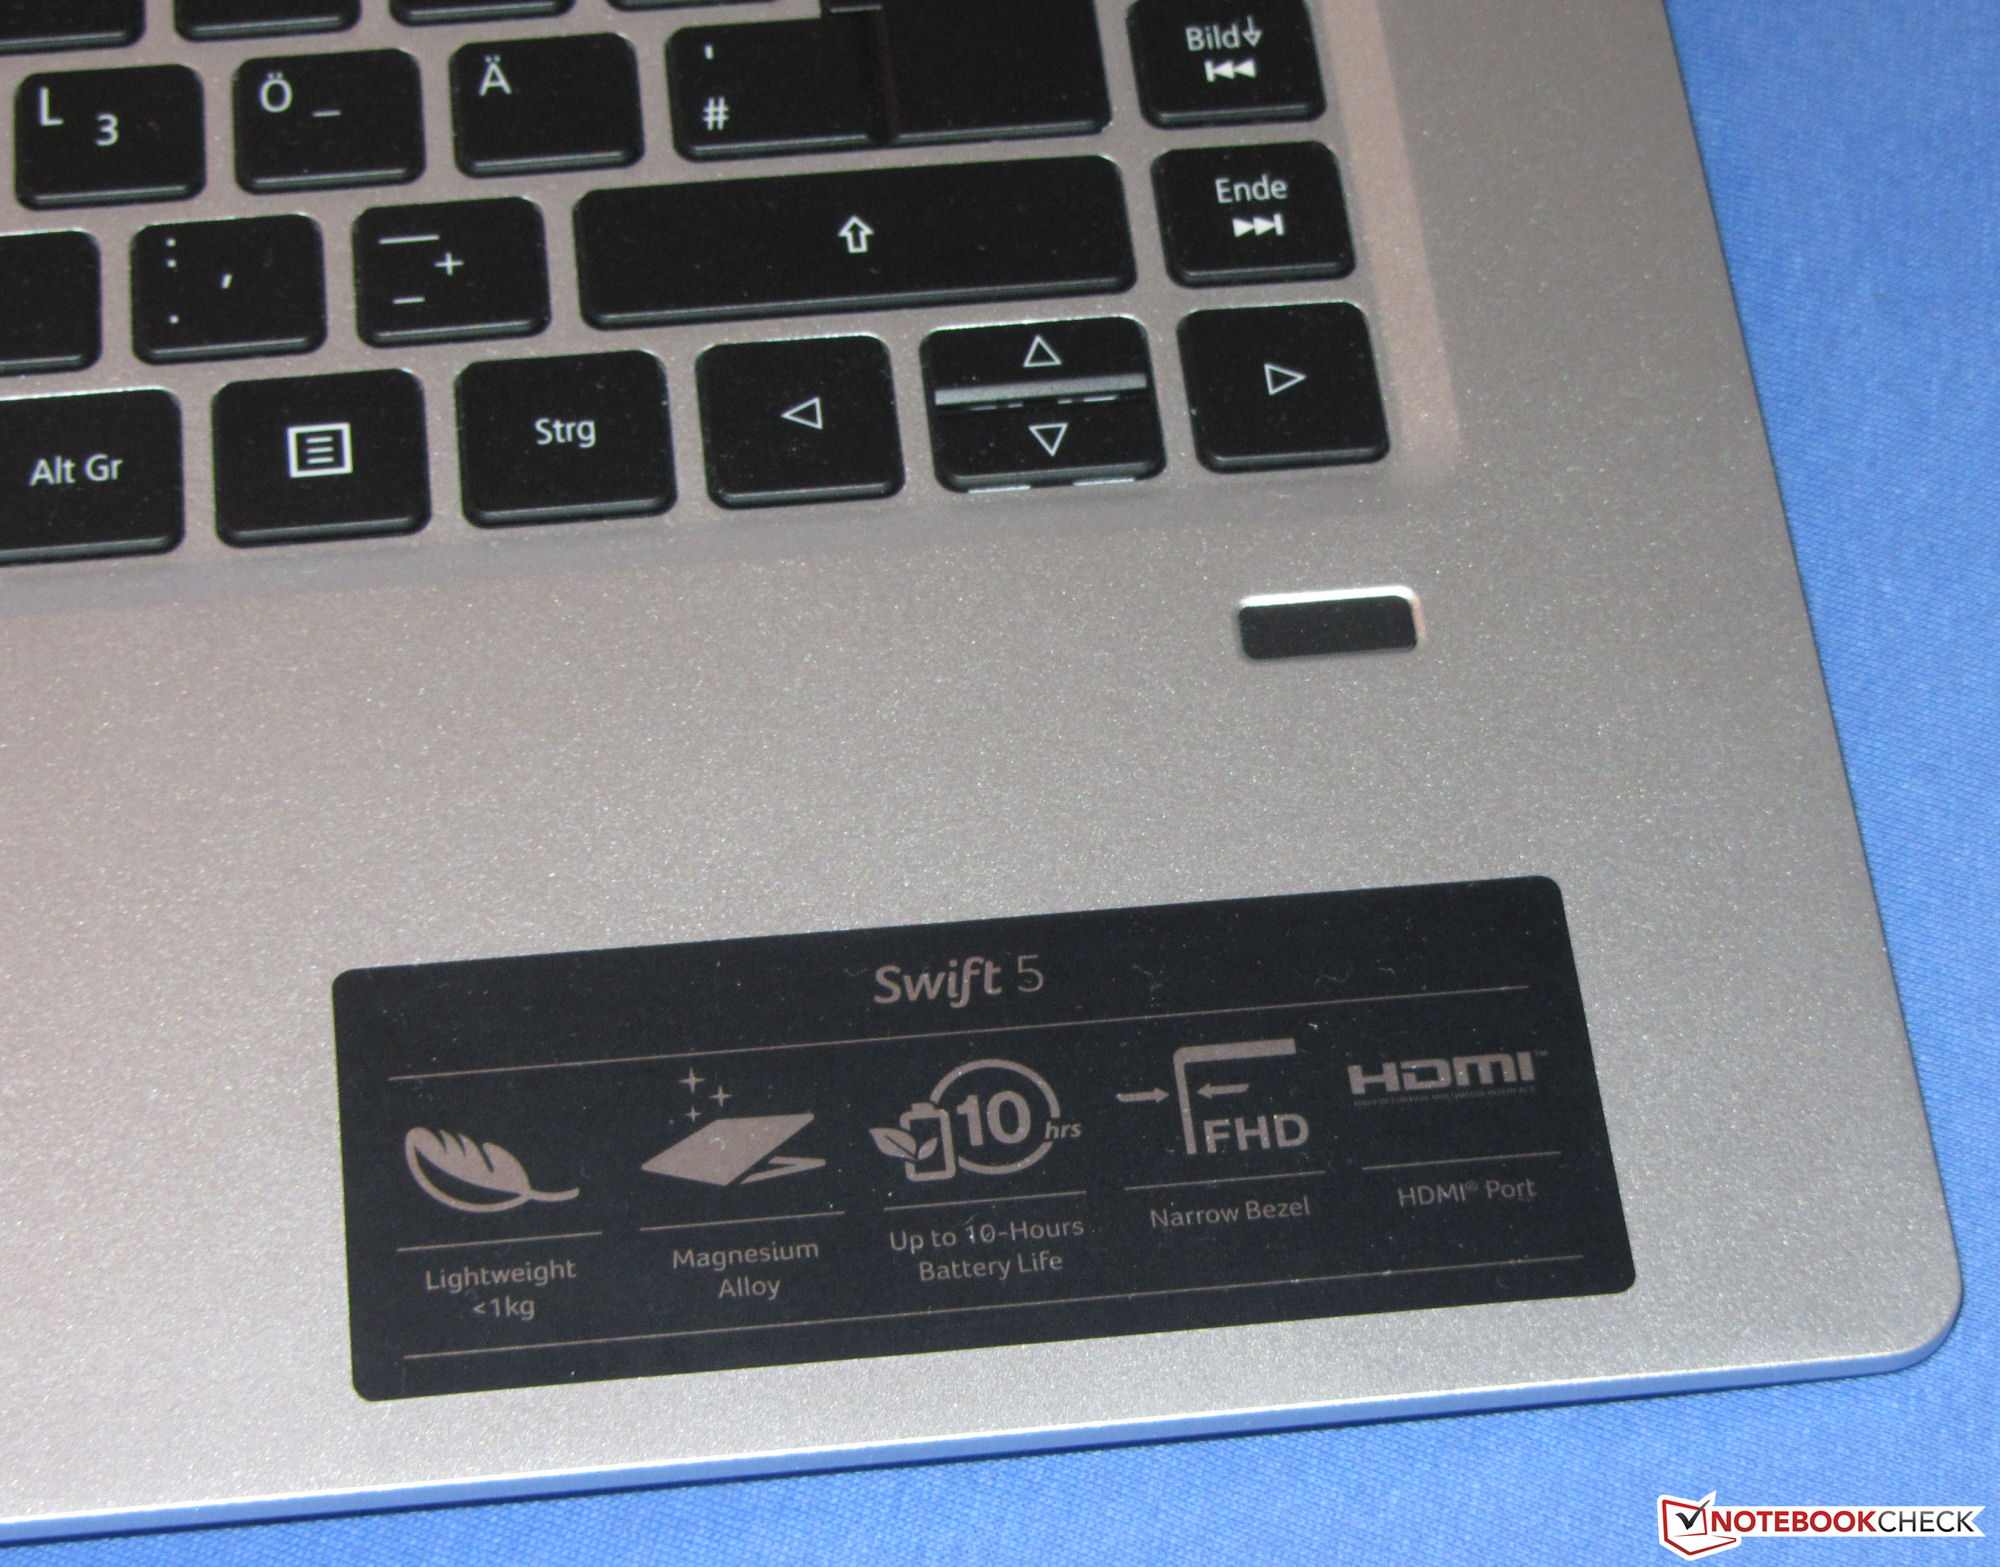
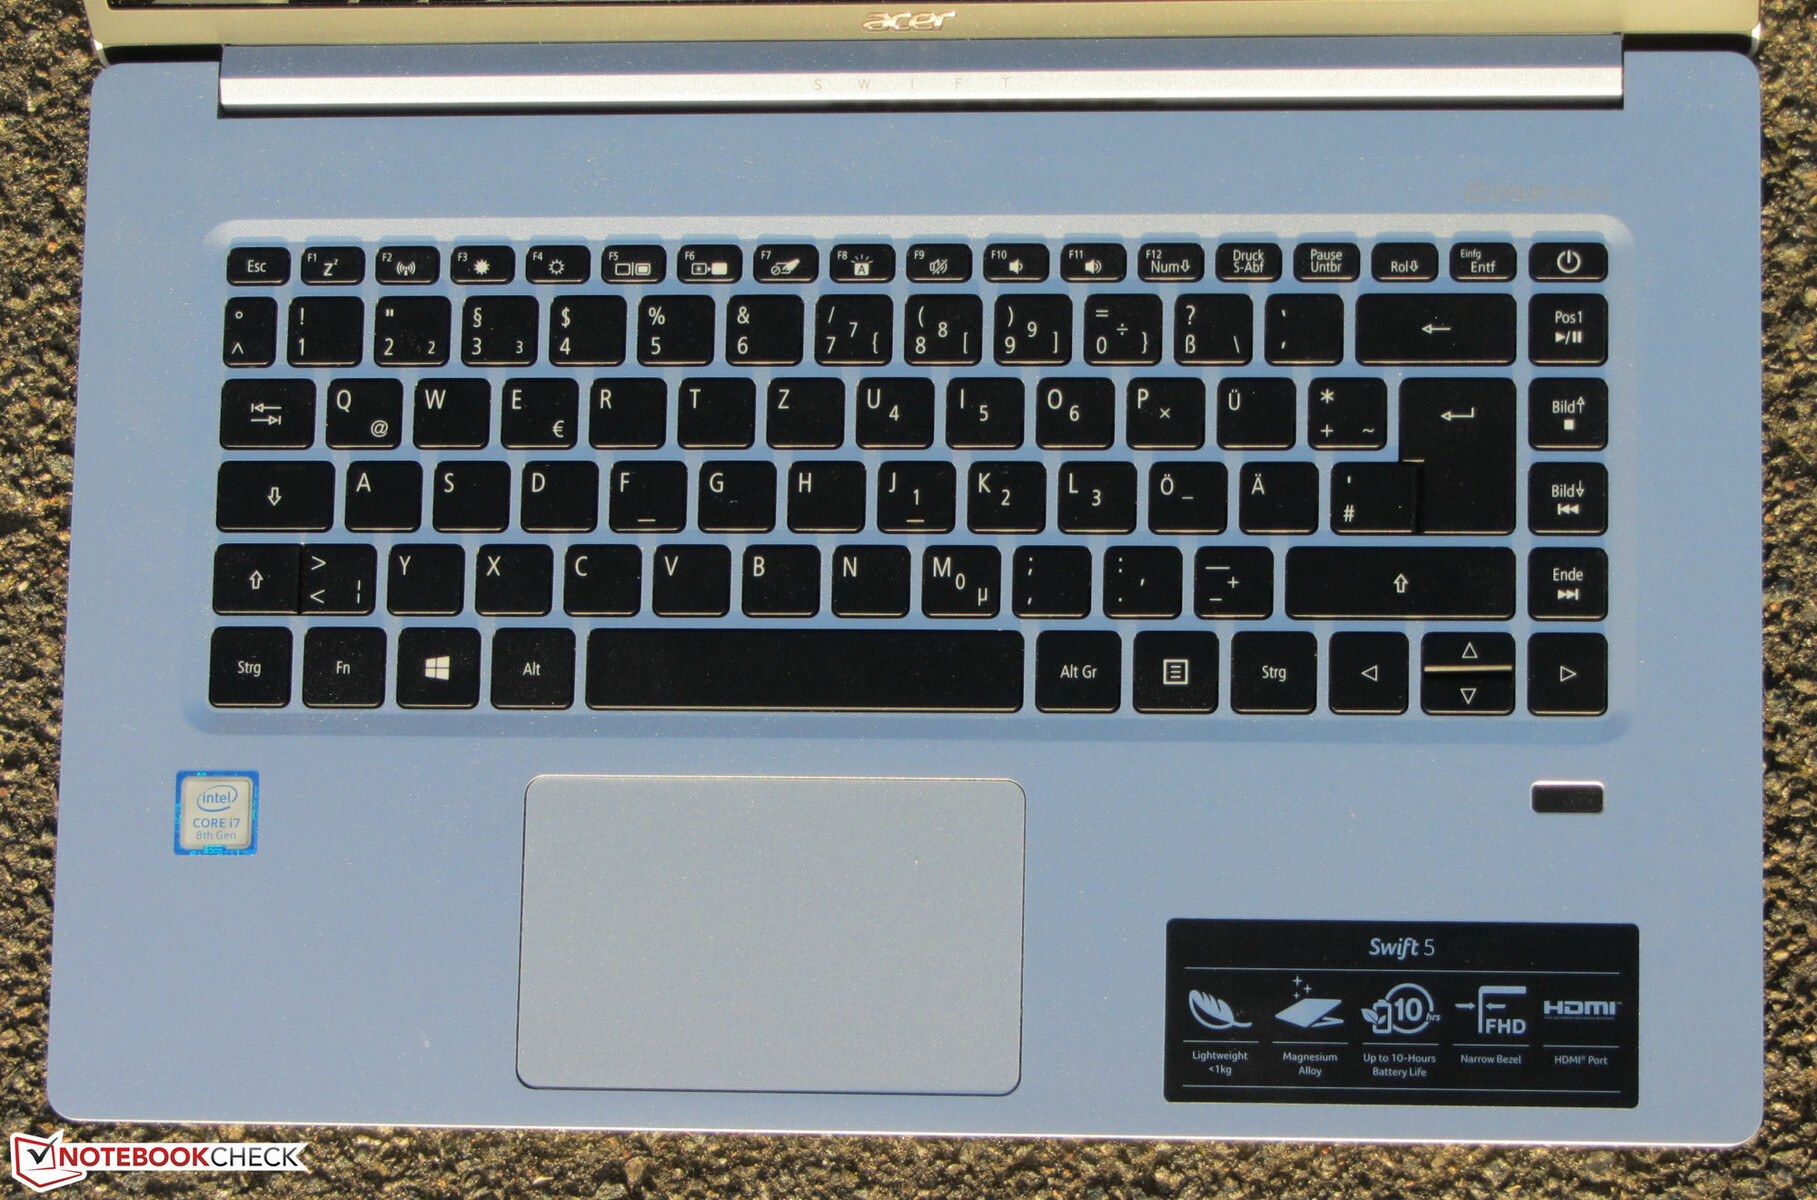
Acers Swift 5 SF515-51T är en riktigt lätt laptop gjord för den som reser ofta och inte vill vara utan en stor skärm på 15.6 tum.
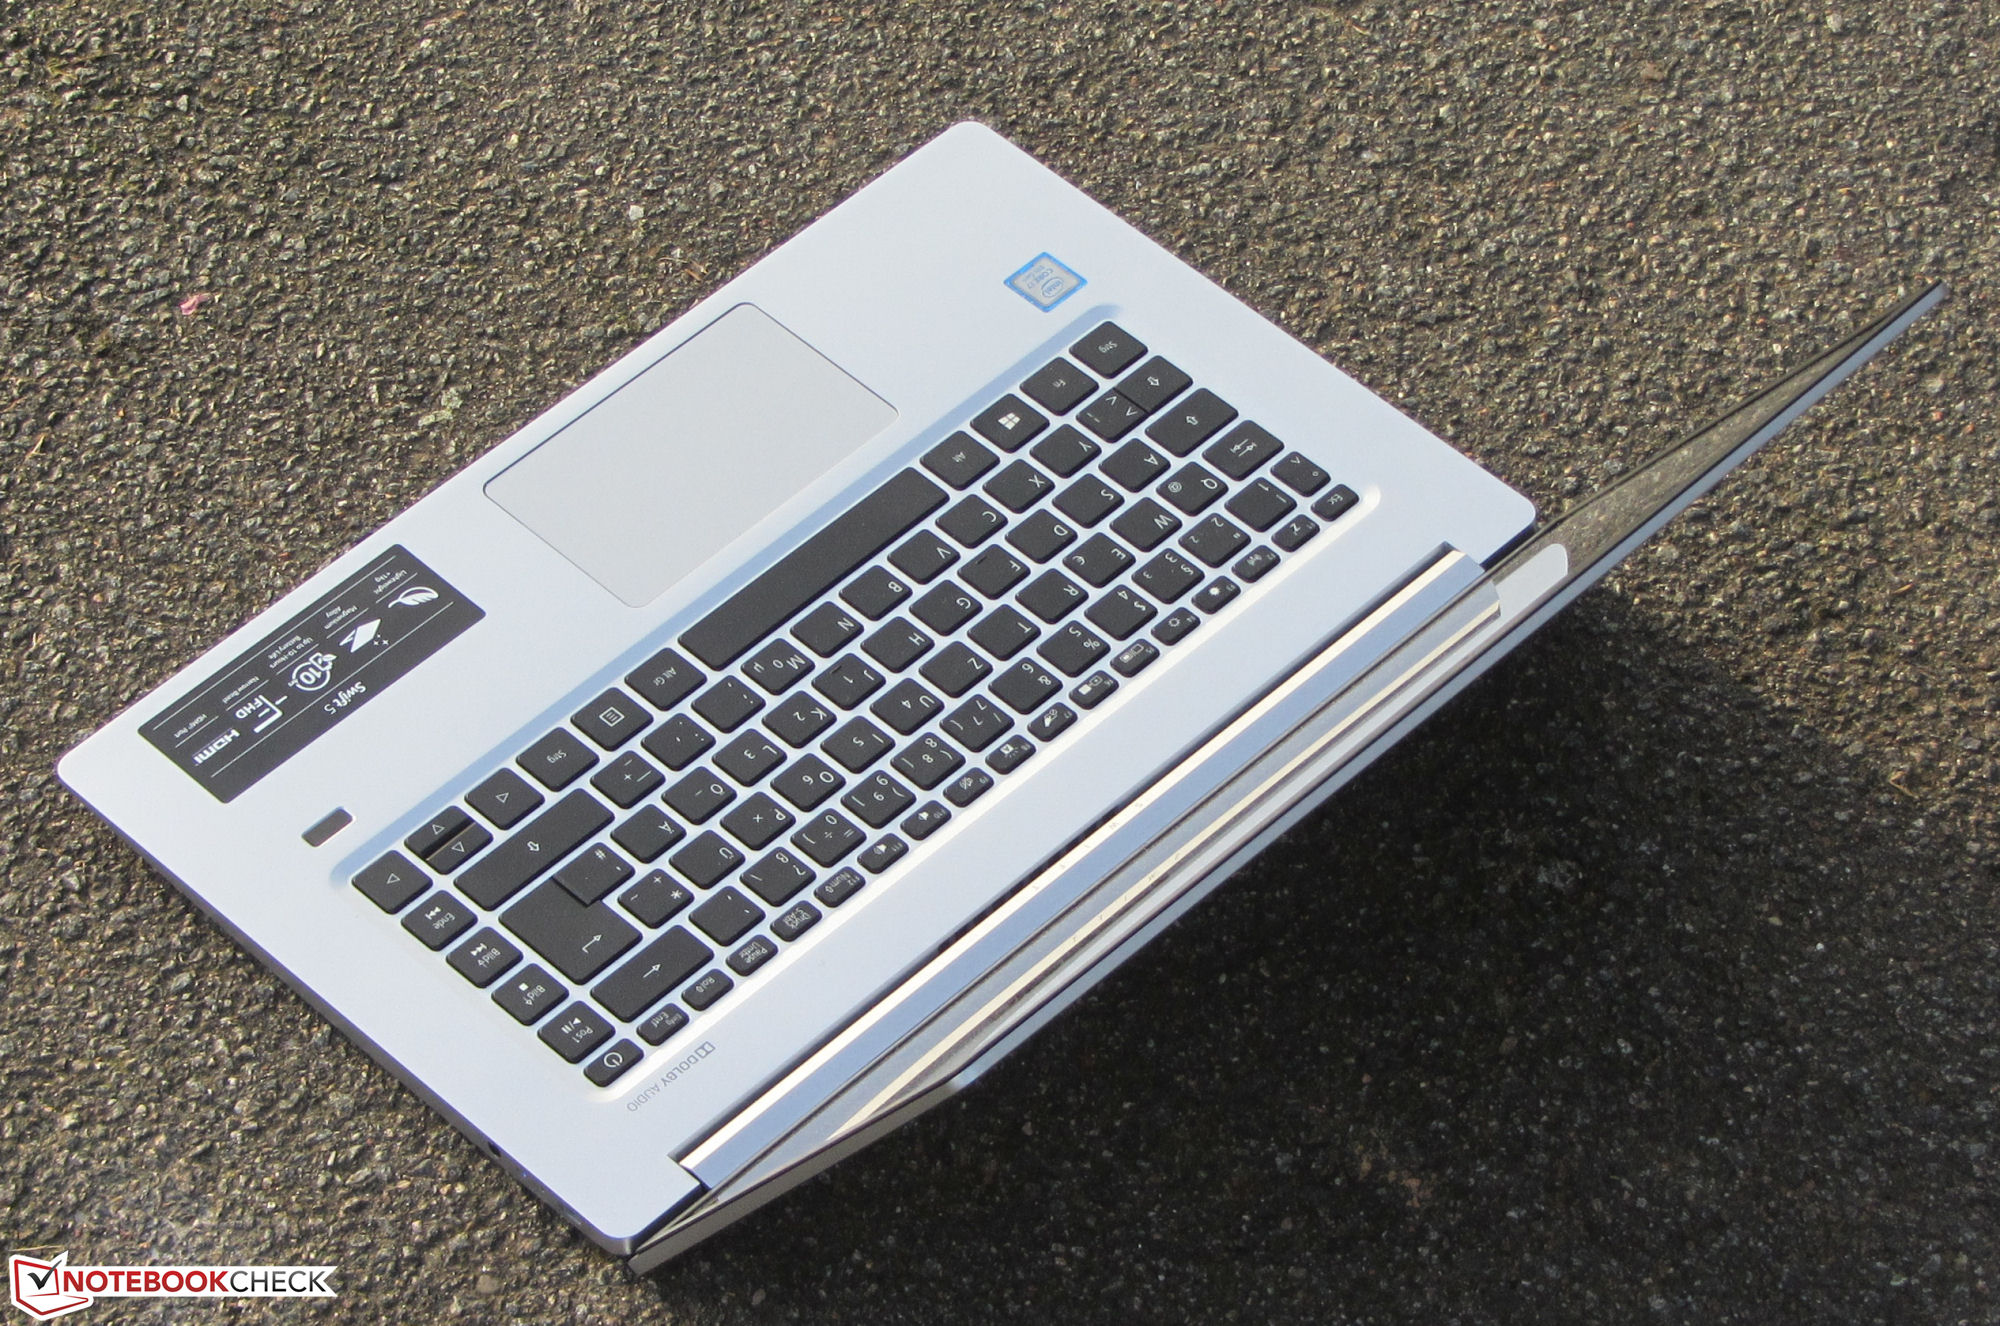
Med en vikt på under 1 kg märks denna enhet knappt i väskan - inga överansträngda axlar här inte!
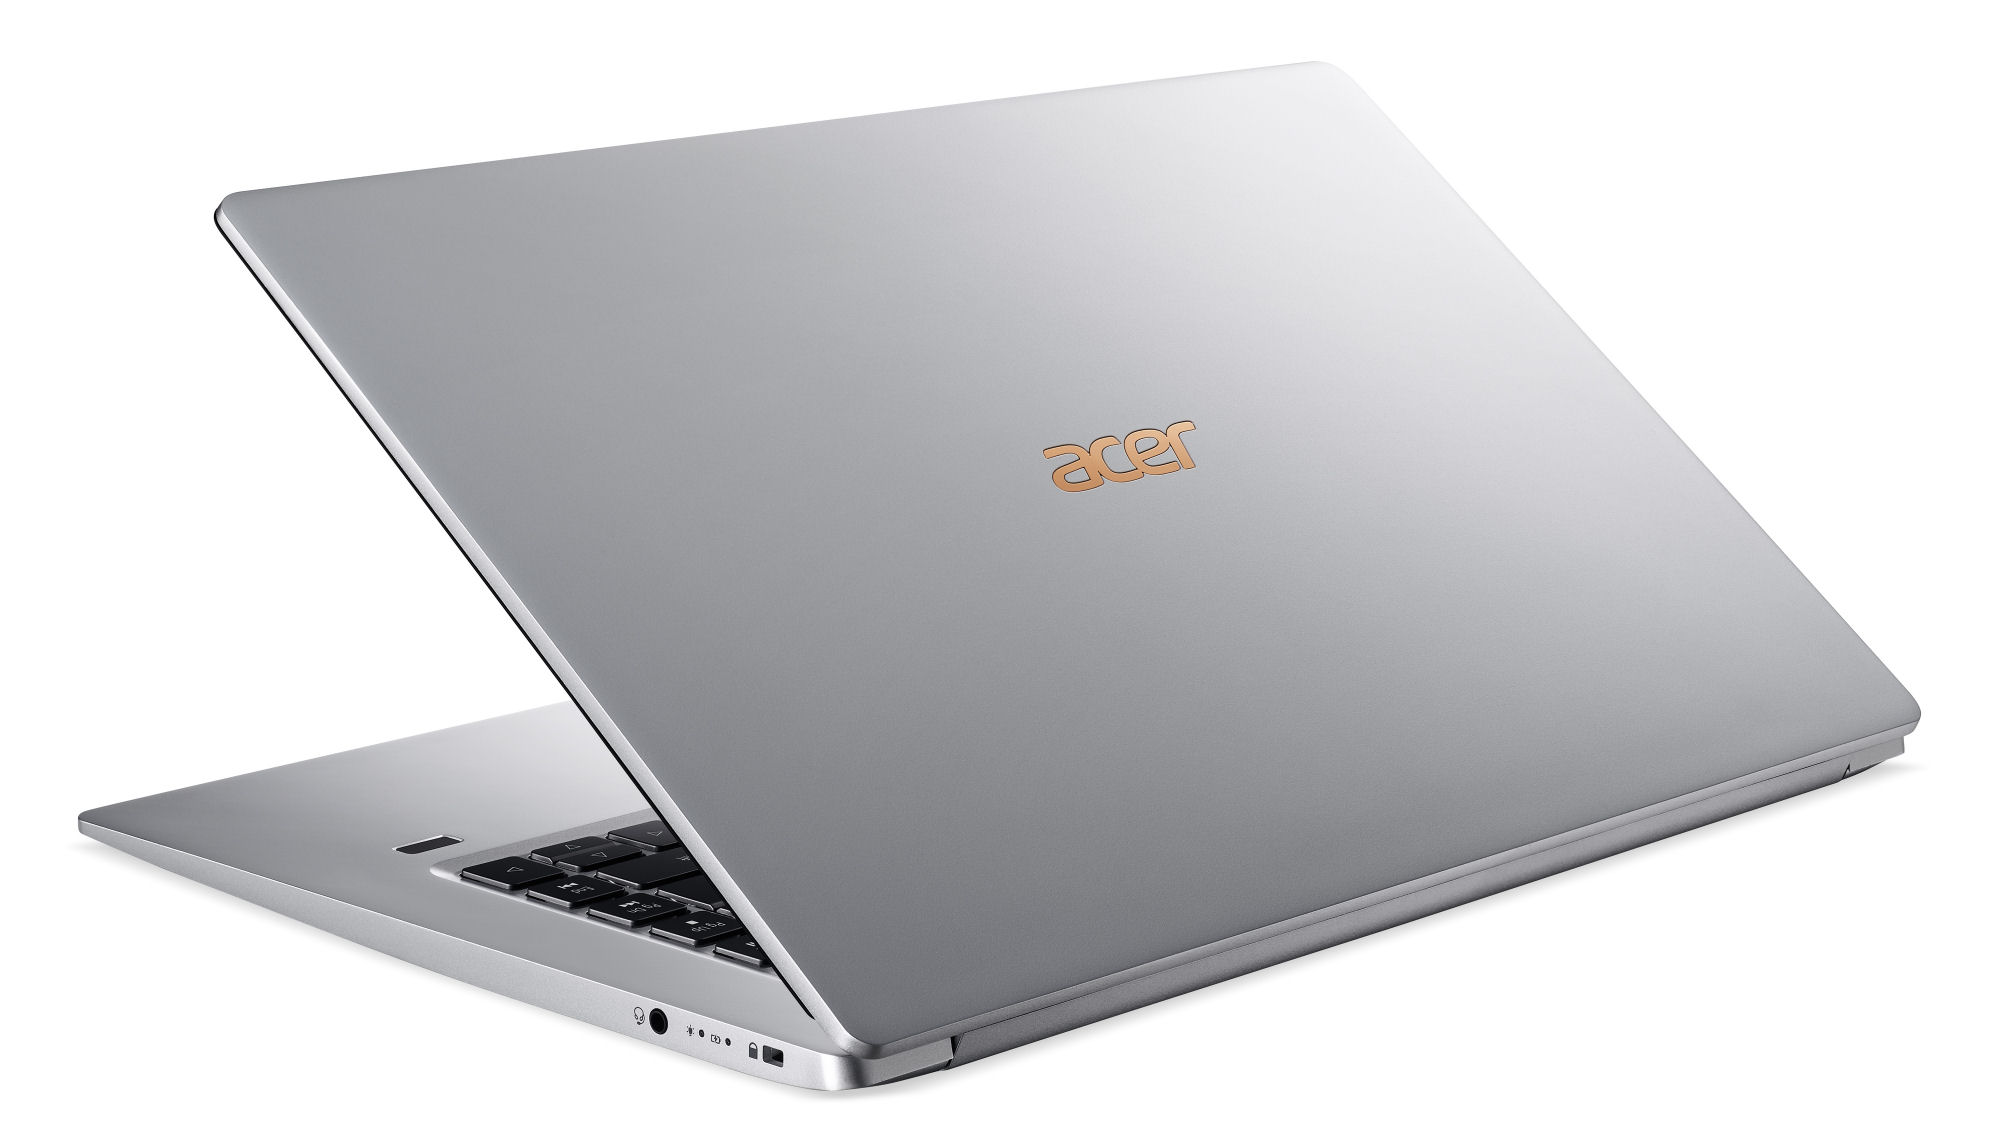
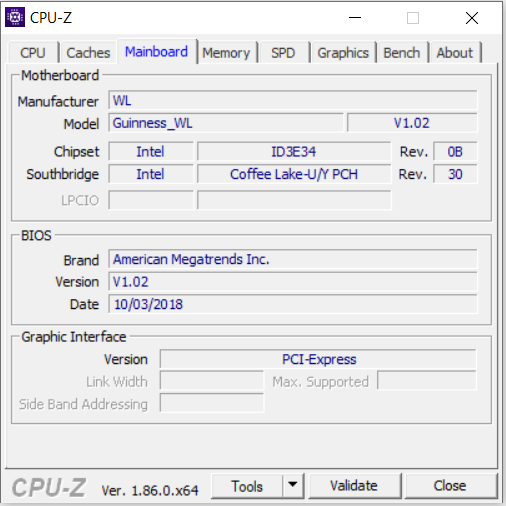
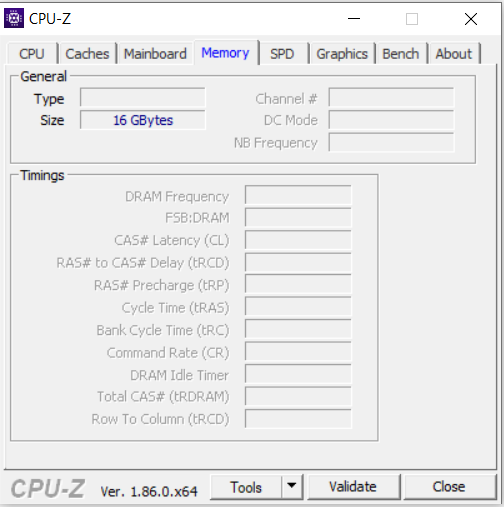
För att kunna nå en så låg vikt har Acer valt ett hölje av magnesium och genomfört ett antal begränsningar. RAM-minnet, SSD-enheten och WiFi-modulen är alla fastlödda på moderkortet, vilket gör att ingen av dessa komponenter kan bytas ut eller utökas. Du bör därför vara medveten om hur mycket lagringsutrymme du kommer att behöva under de kommande åren innan du köper en Swift 5. Det finns åtminstone en ledig M.2 2280-plats, så det går att lägga till en del NVMe-lagring i efterhand.
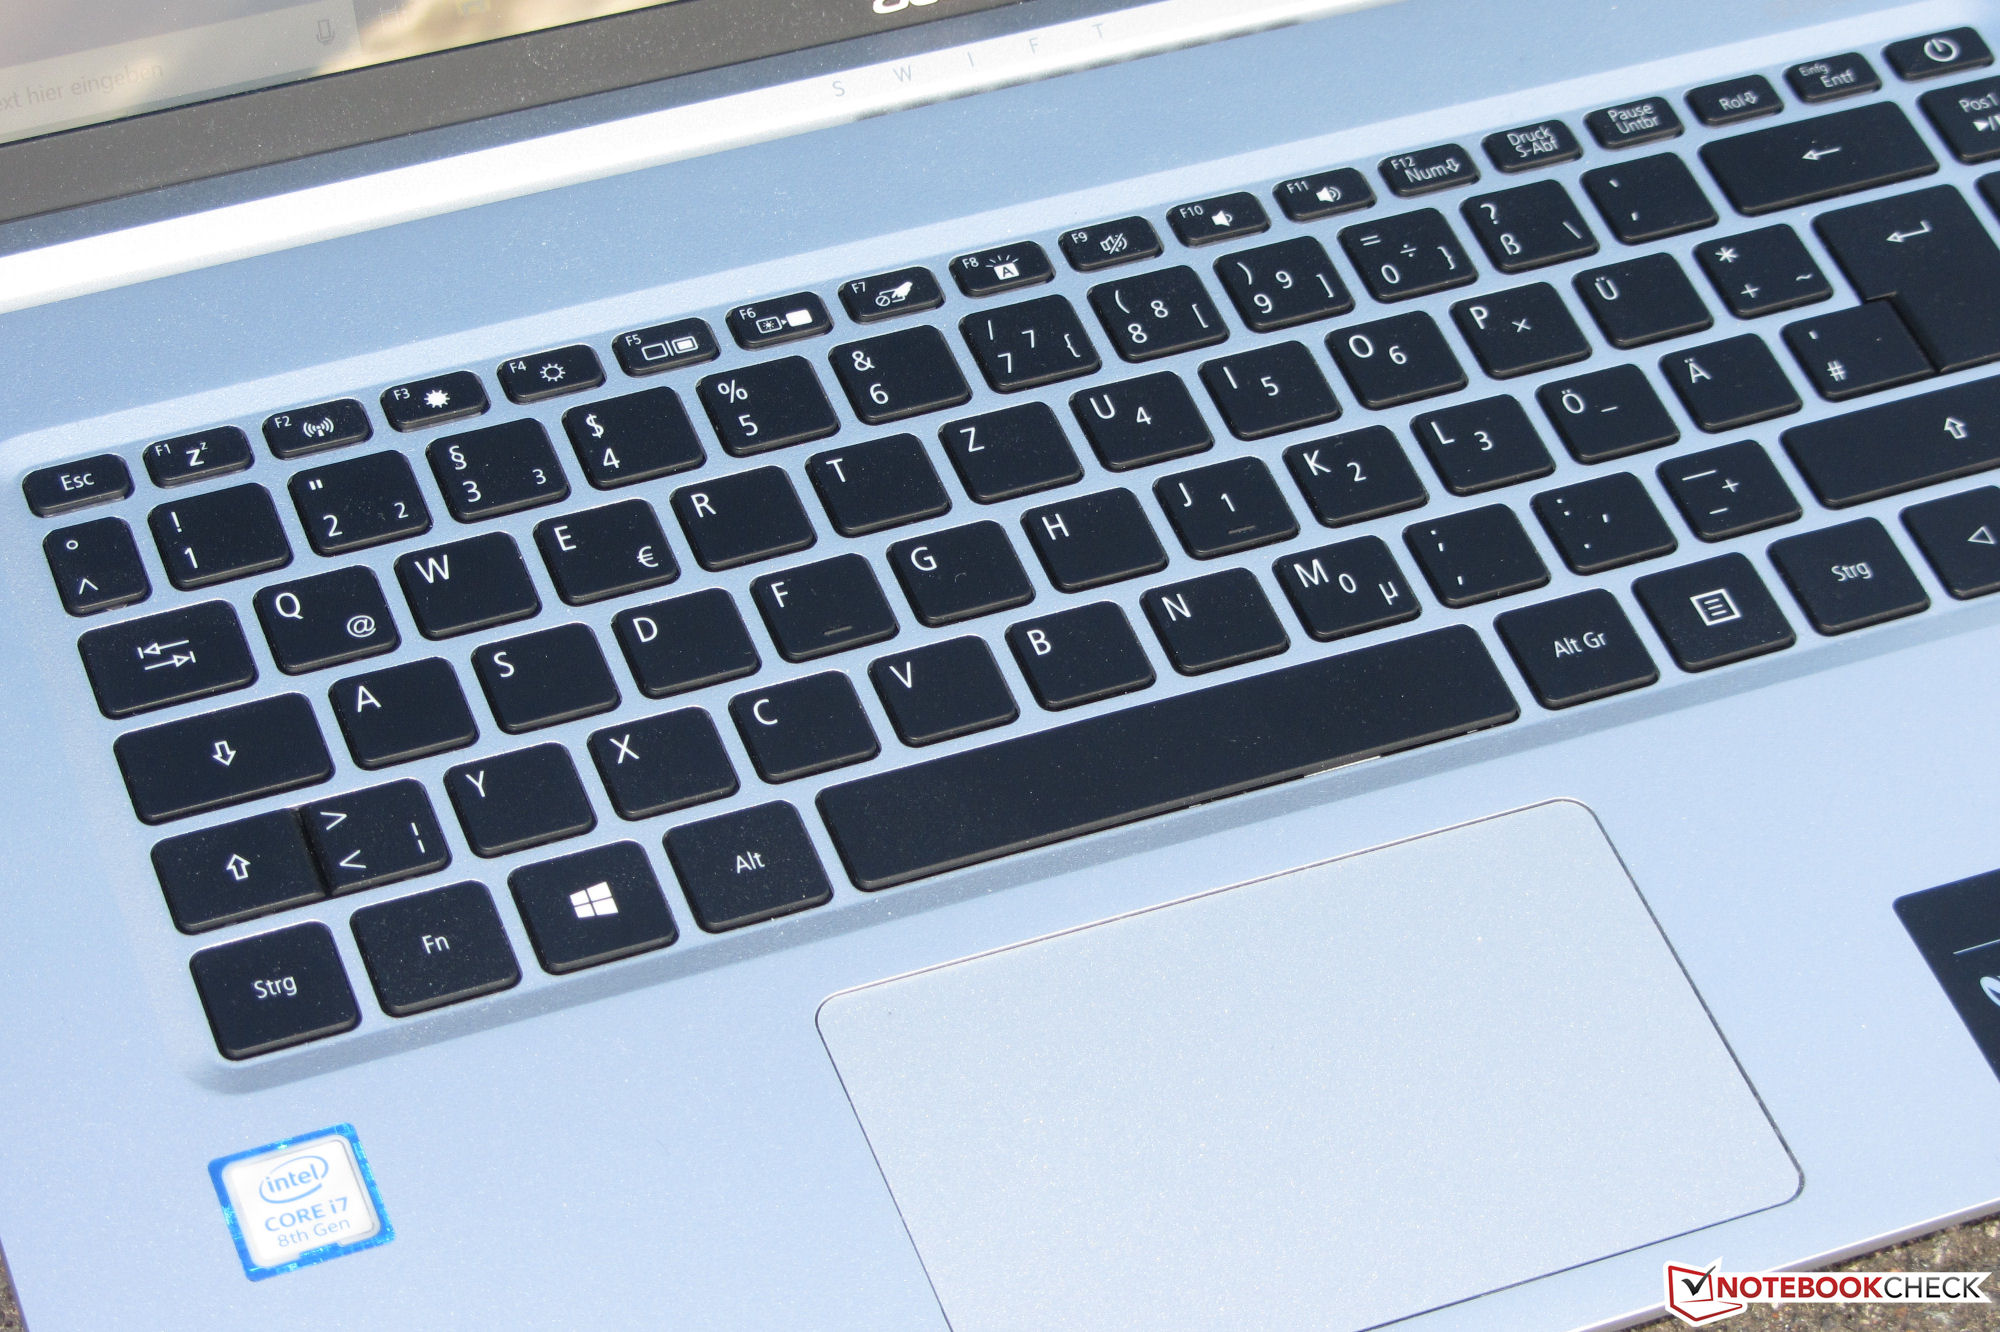
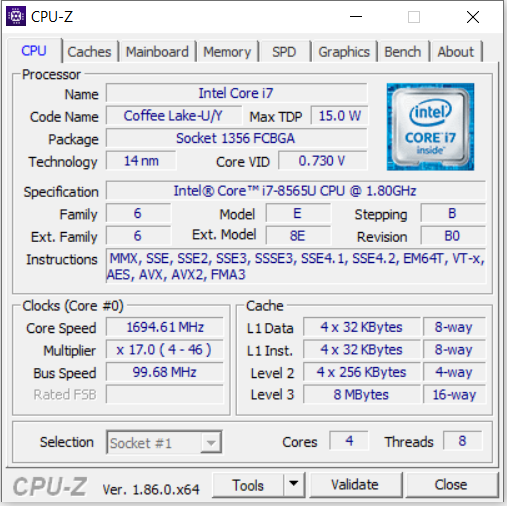
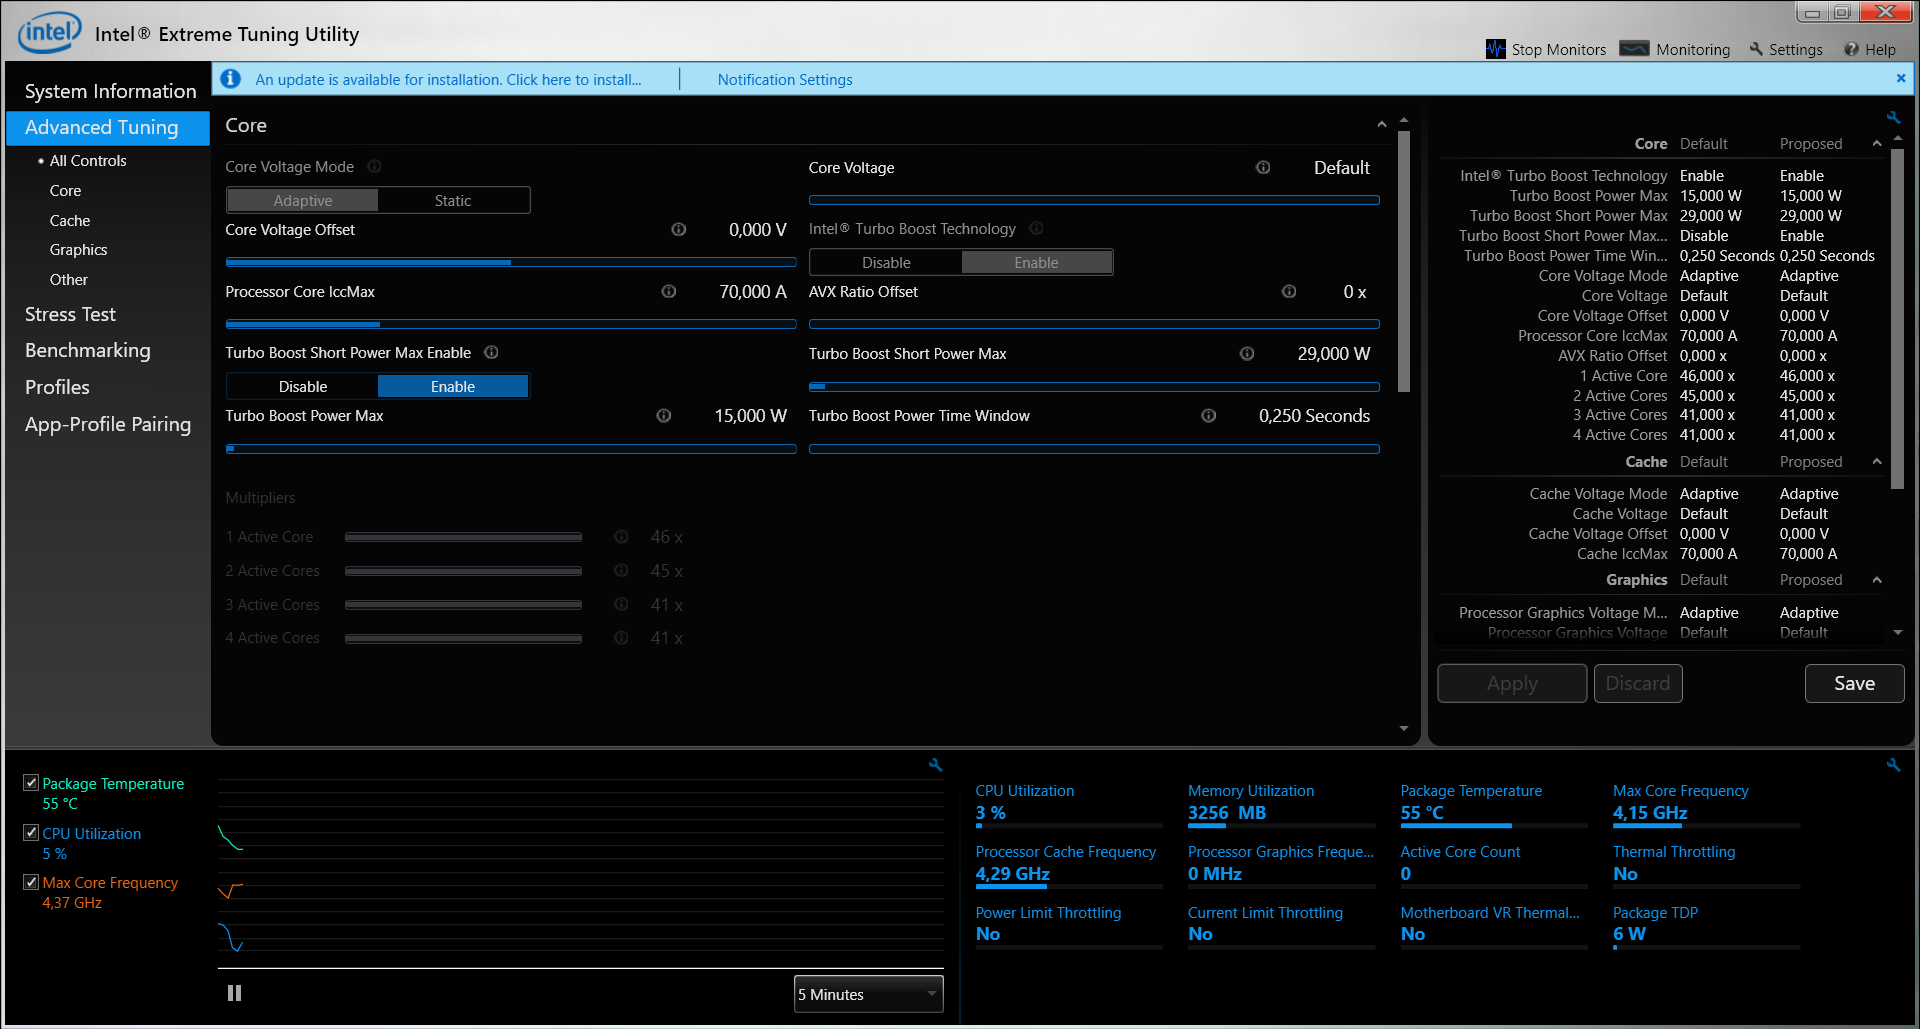
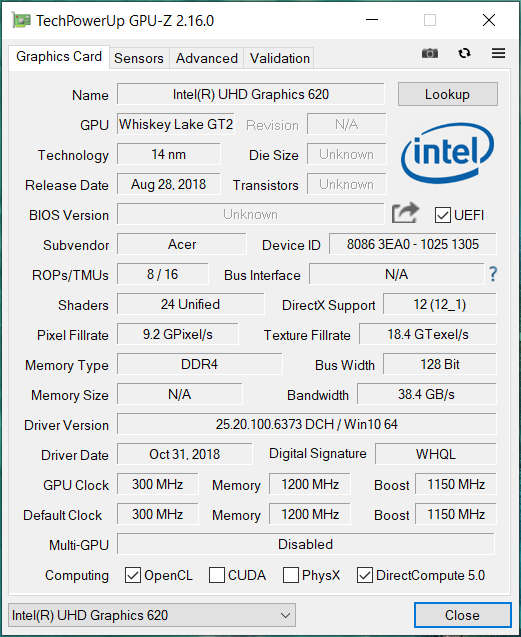
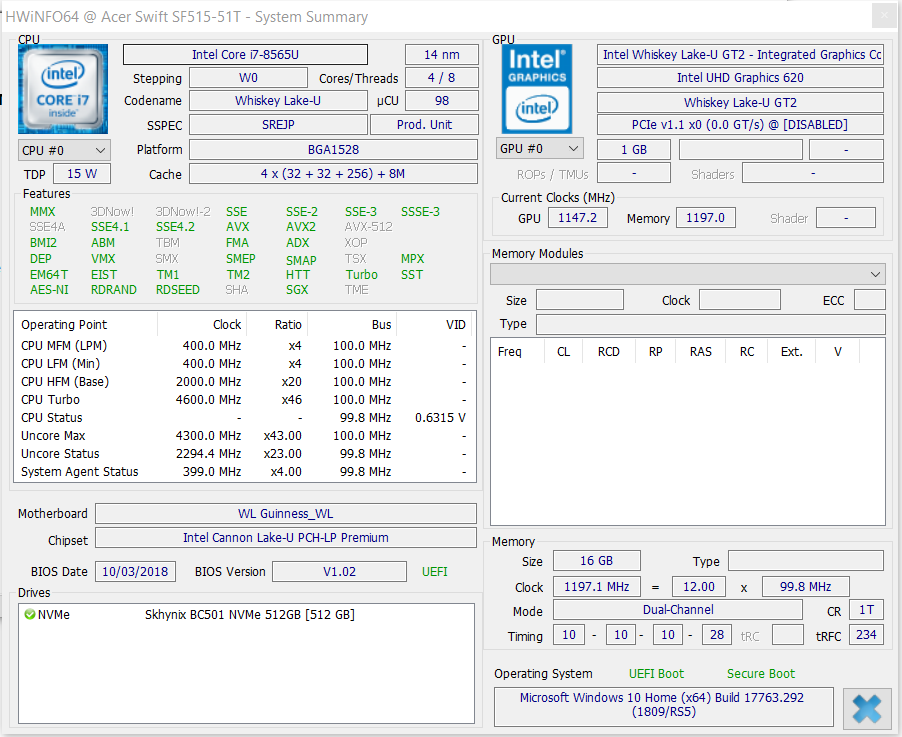
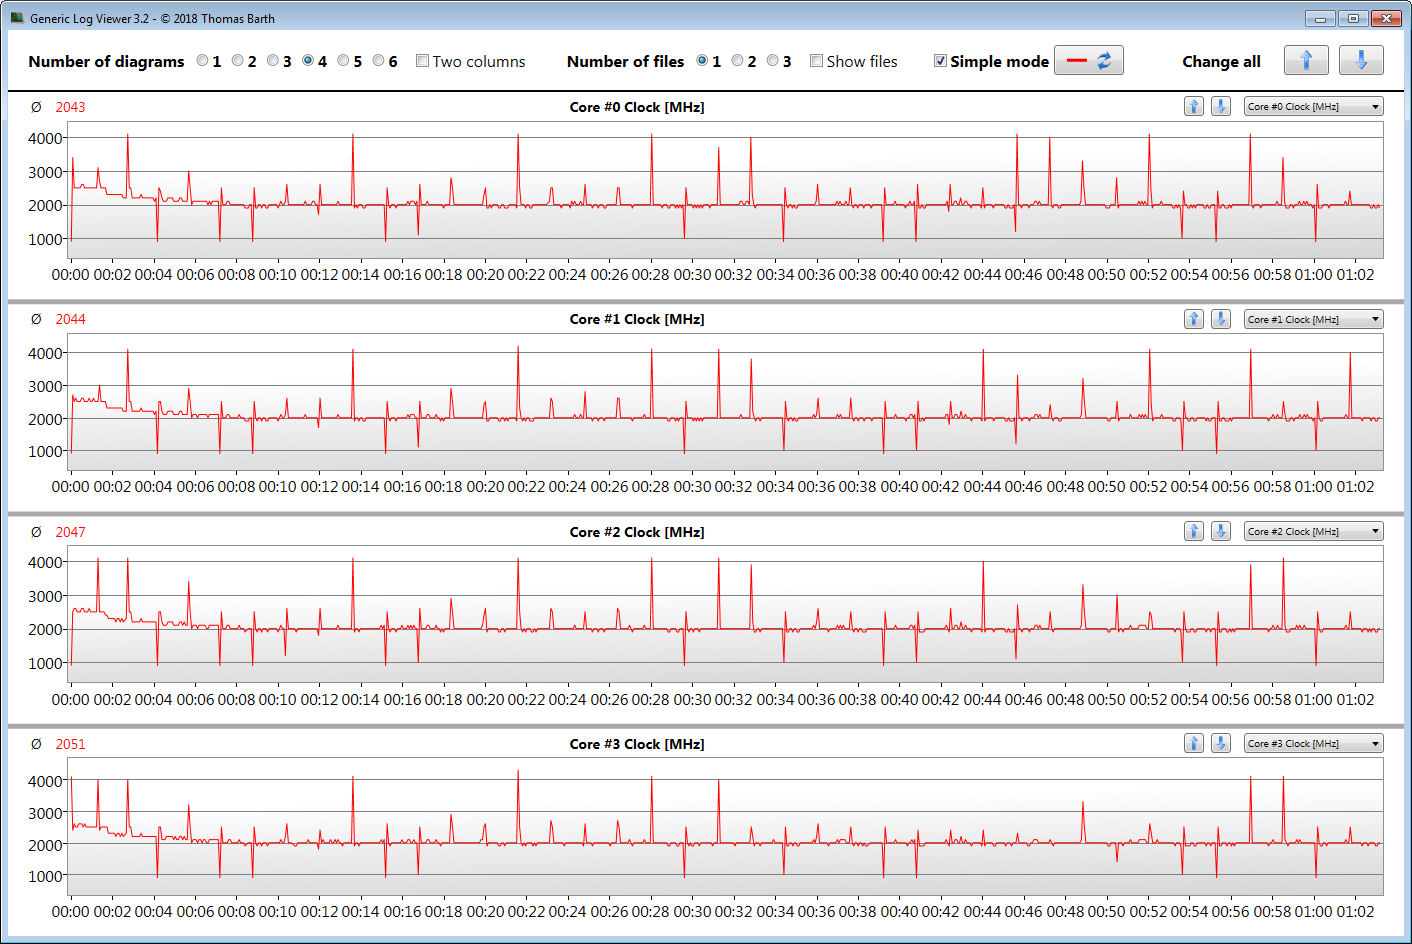
Enheten drivs av en Core i7 Whiskey Lake-processor som har tillräckligt med processorkraft för kontors- och internetapplikationer. Tyvärr kan Swift 5 inte utnyttja sin CPU fullt ut vid längre arbete, särskilt när det kommer till multitrådade uppgifter. Om du behöver oavbruten maximal prestanda bör du leta någon annanstans.
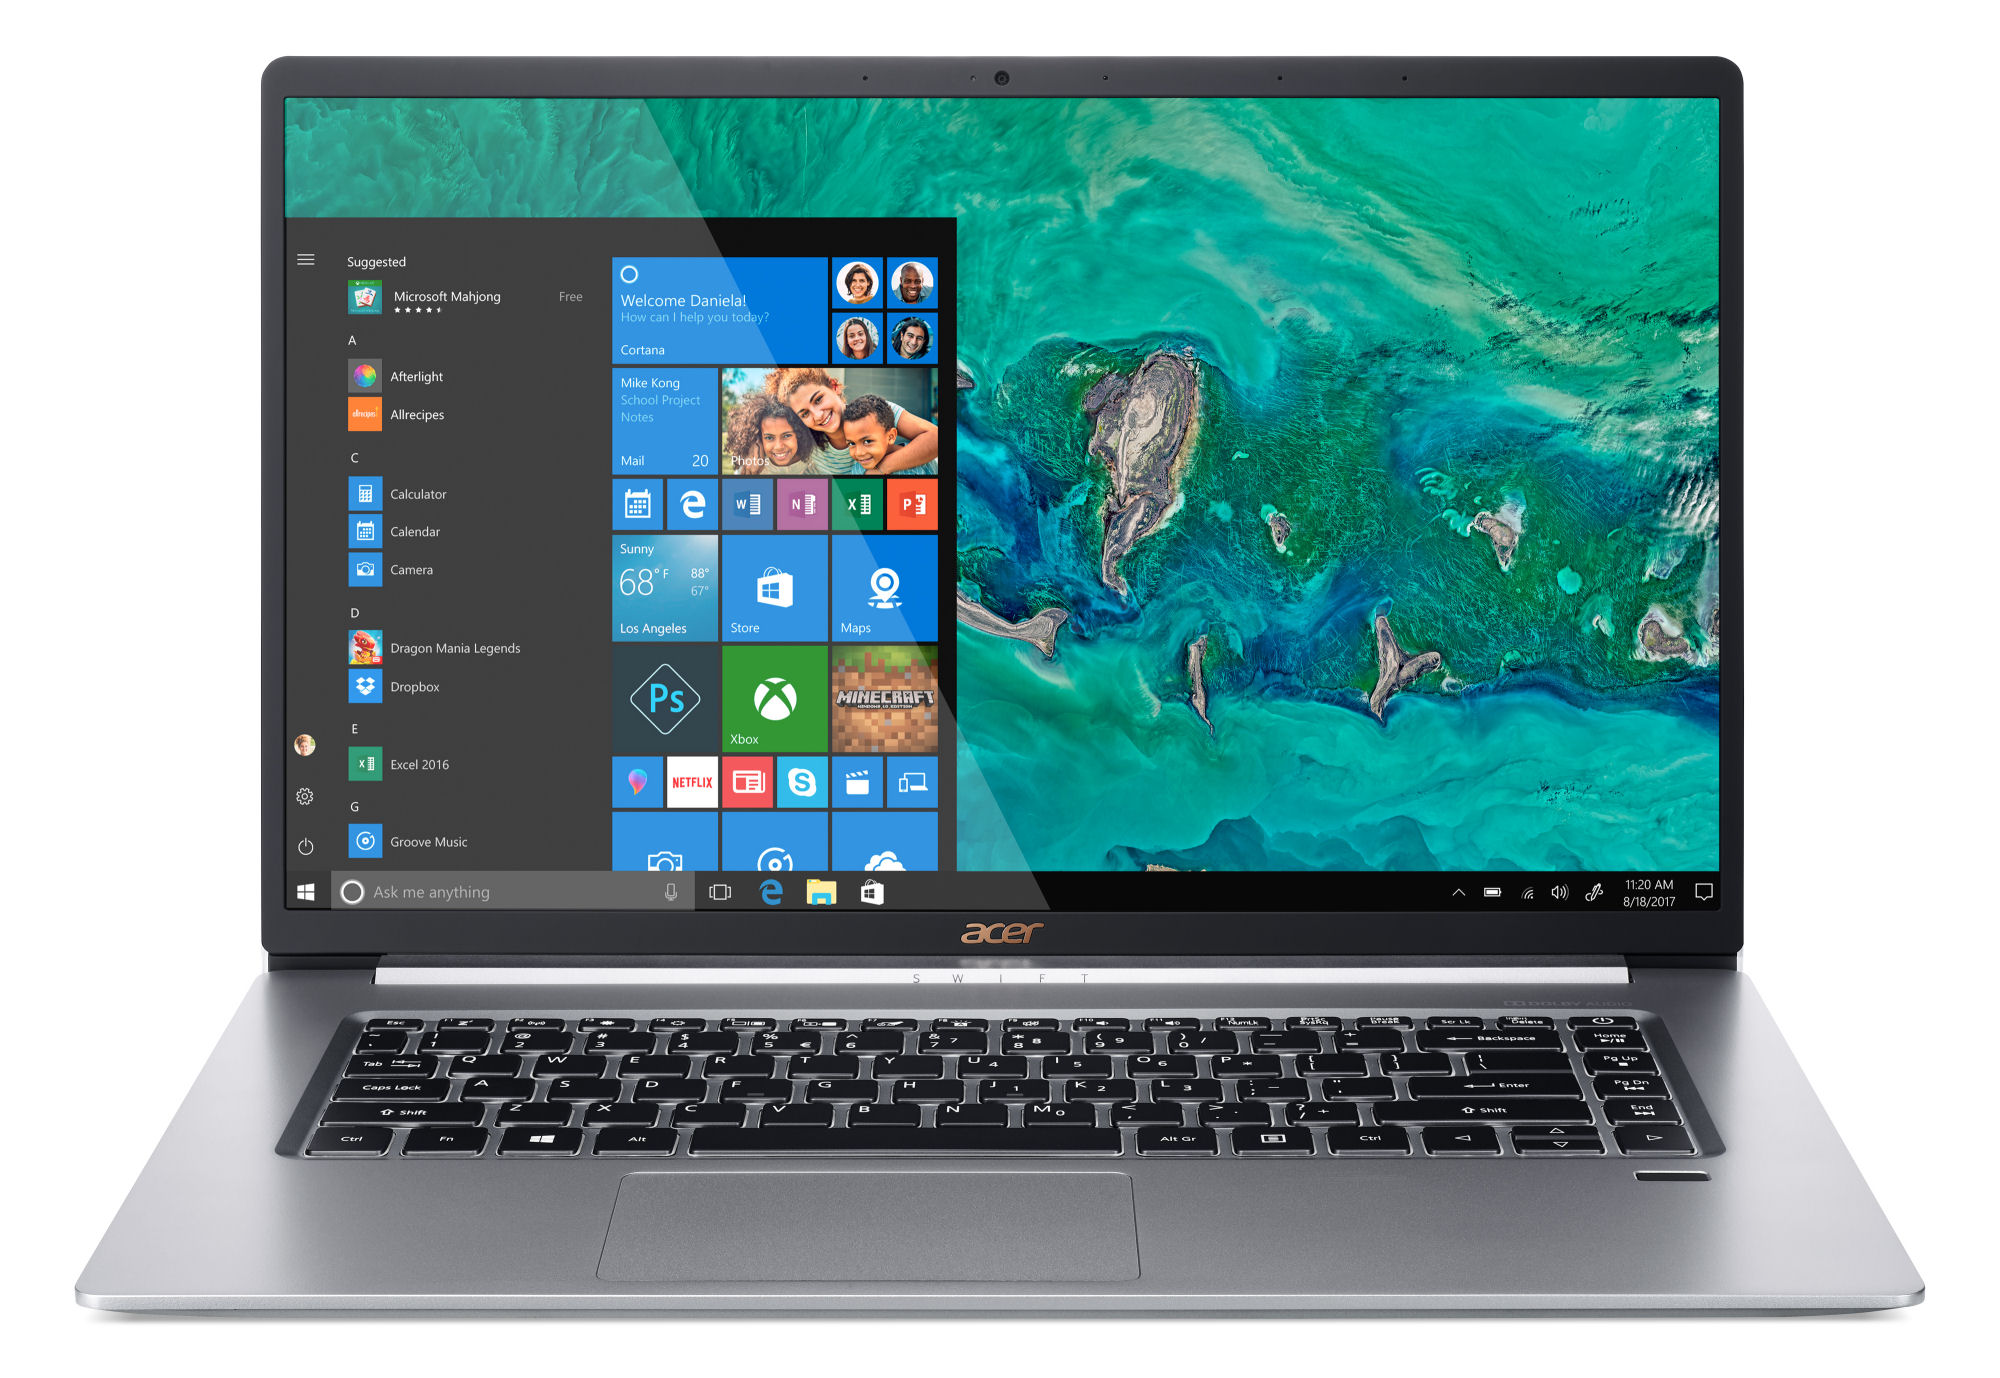
Swift 5 har ett skapligt tangentbord med bakgrundsbelysning i ett steg samt relativt bra batteritid. Den tryckkänsliga IPS-skärmen lämnade också ett gott intryck. Den har genomsnittliga värden för kontrast och ljusstyrka och färgåtergivningen är tillfredsställande. Men kom ihåg att det är en blank skärm. Optimalt hade varit om Acer erbjöd en matt skärm utan tryckkänslighet som ett alternativ.
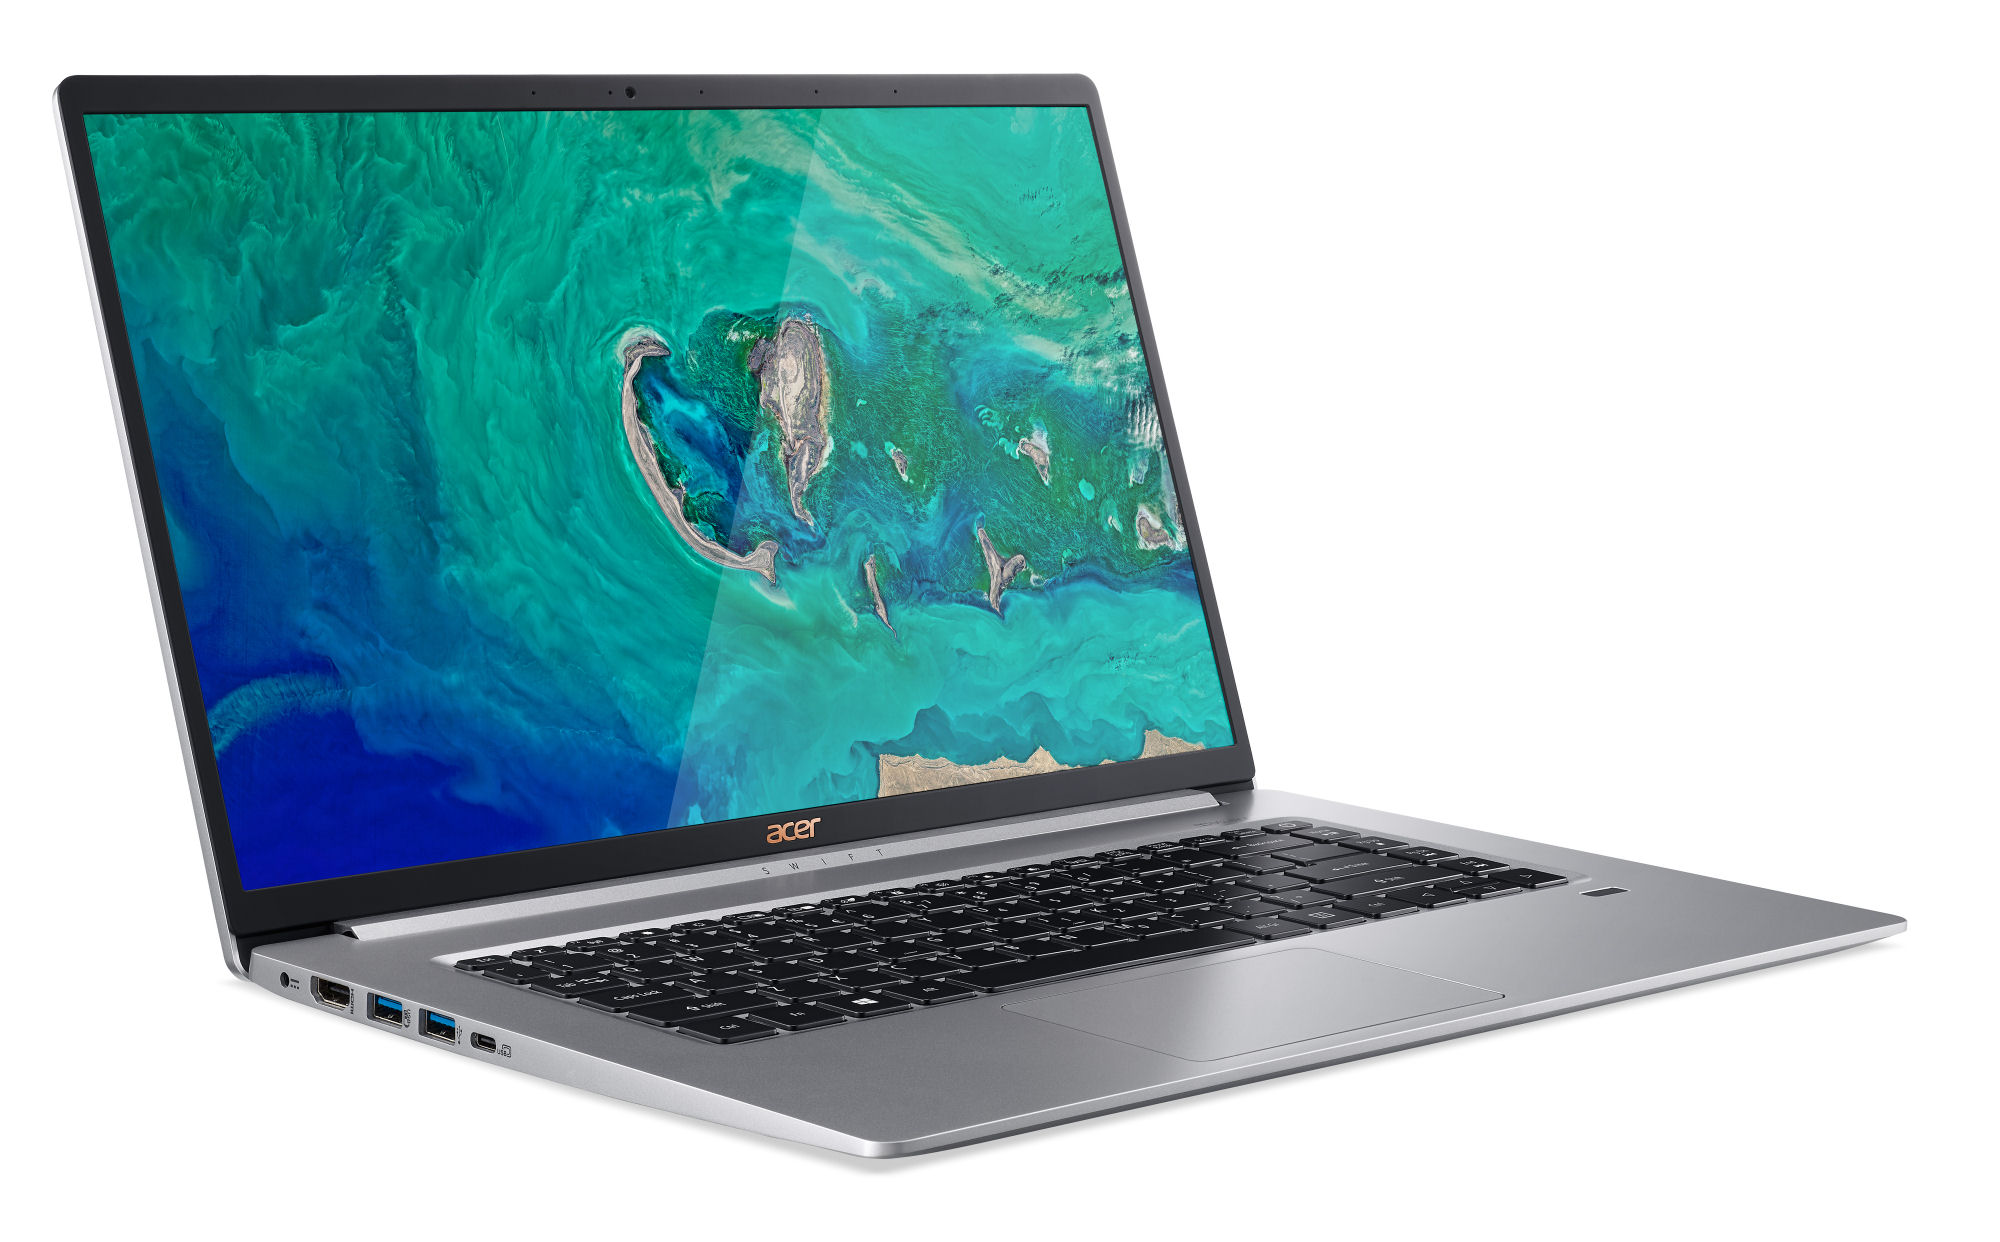
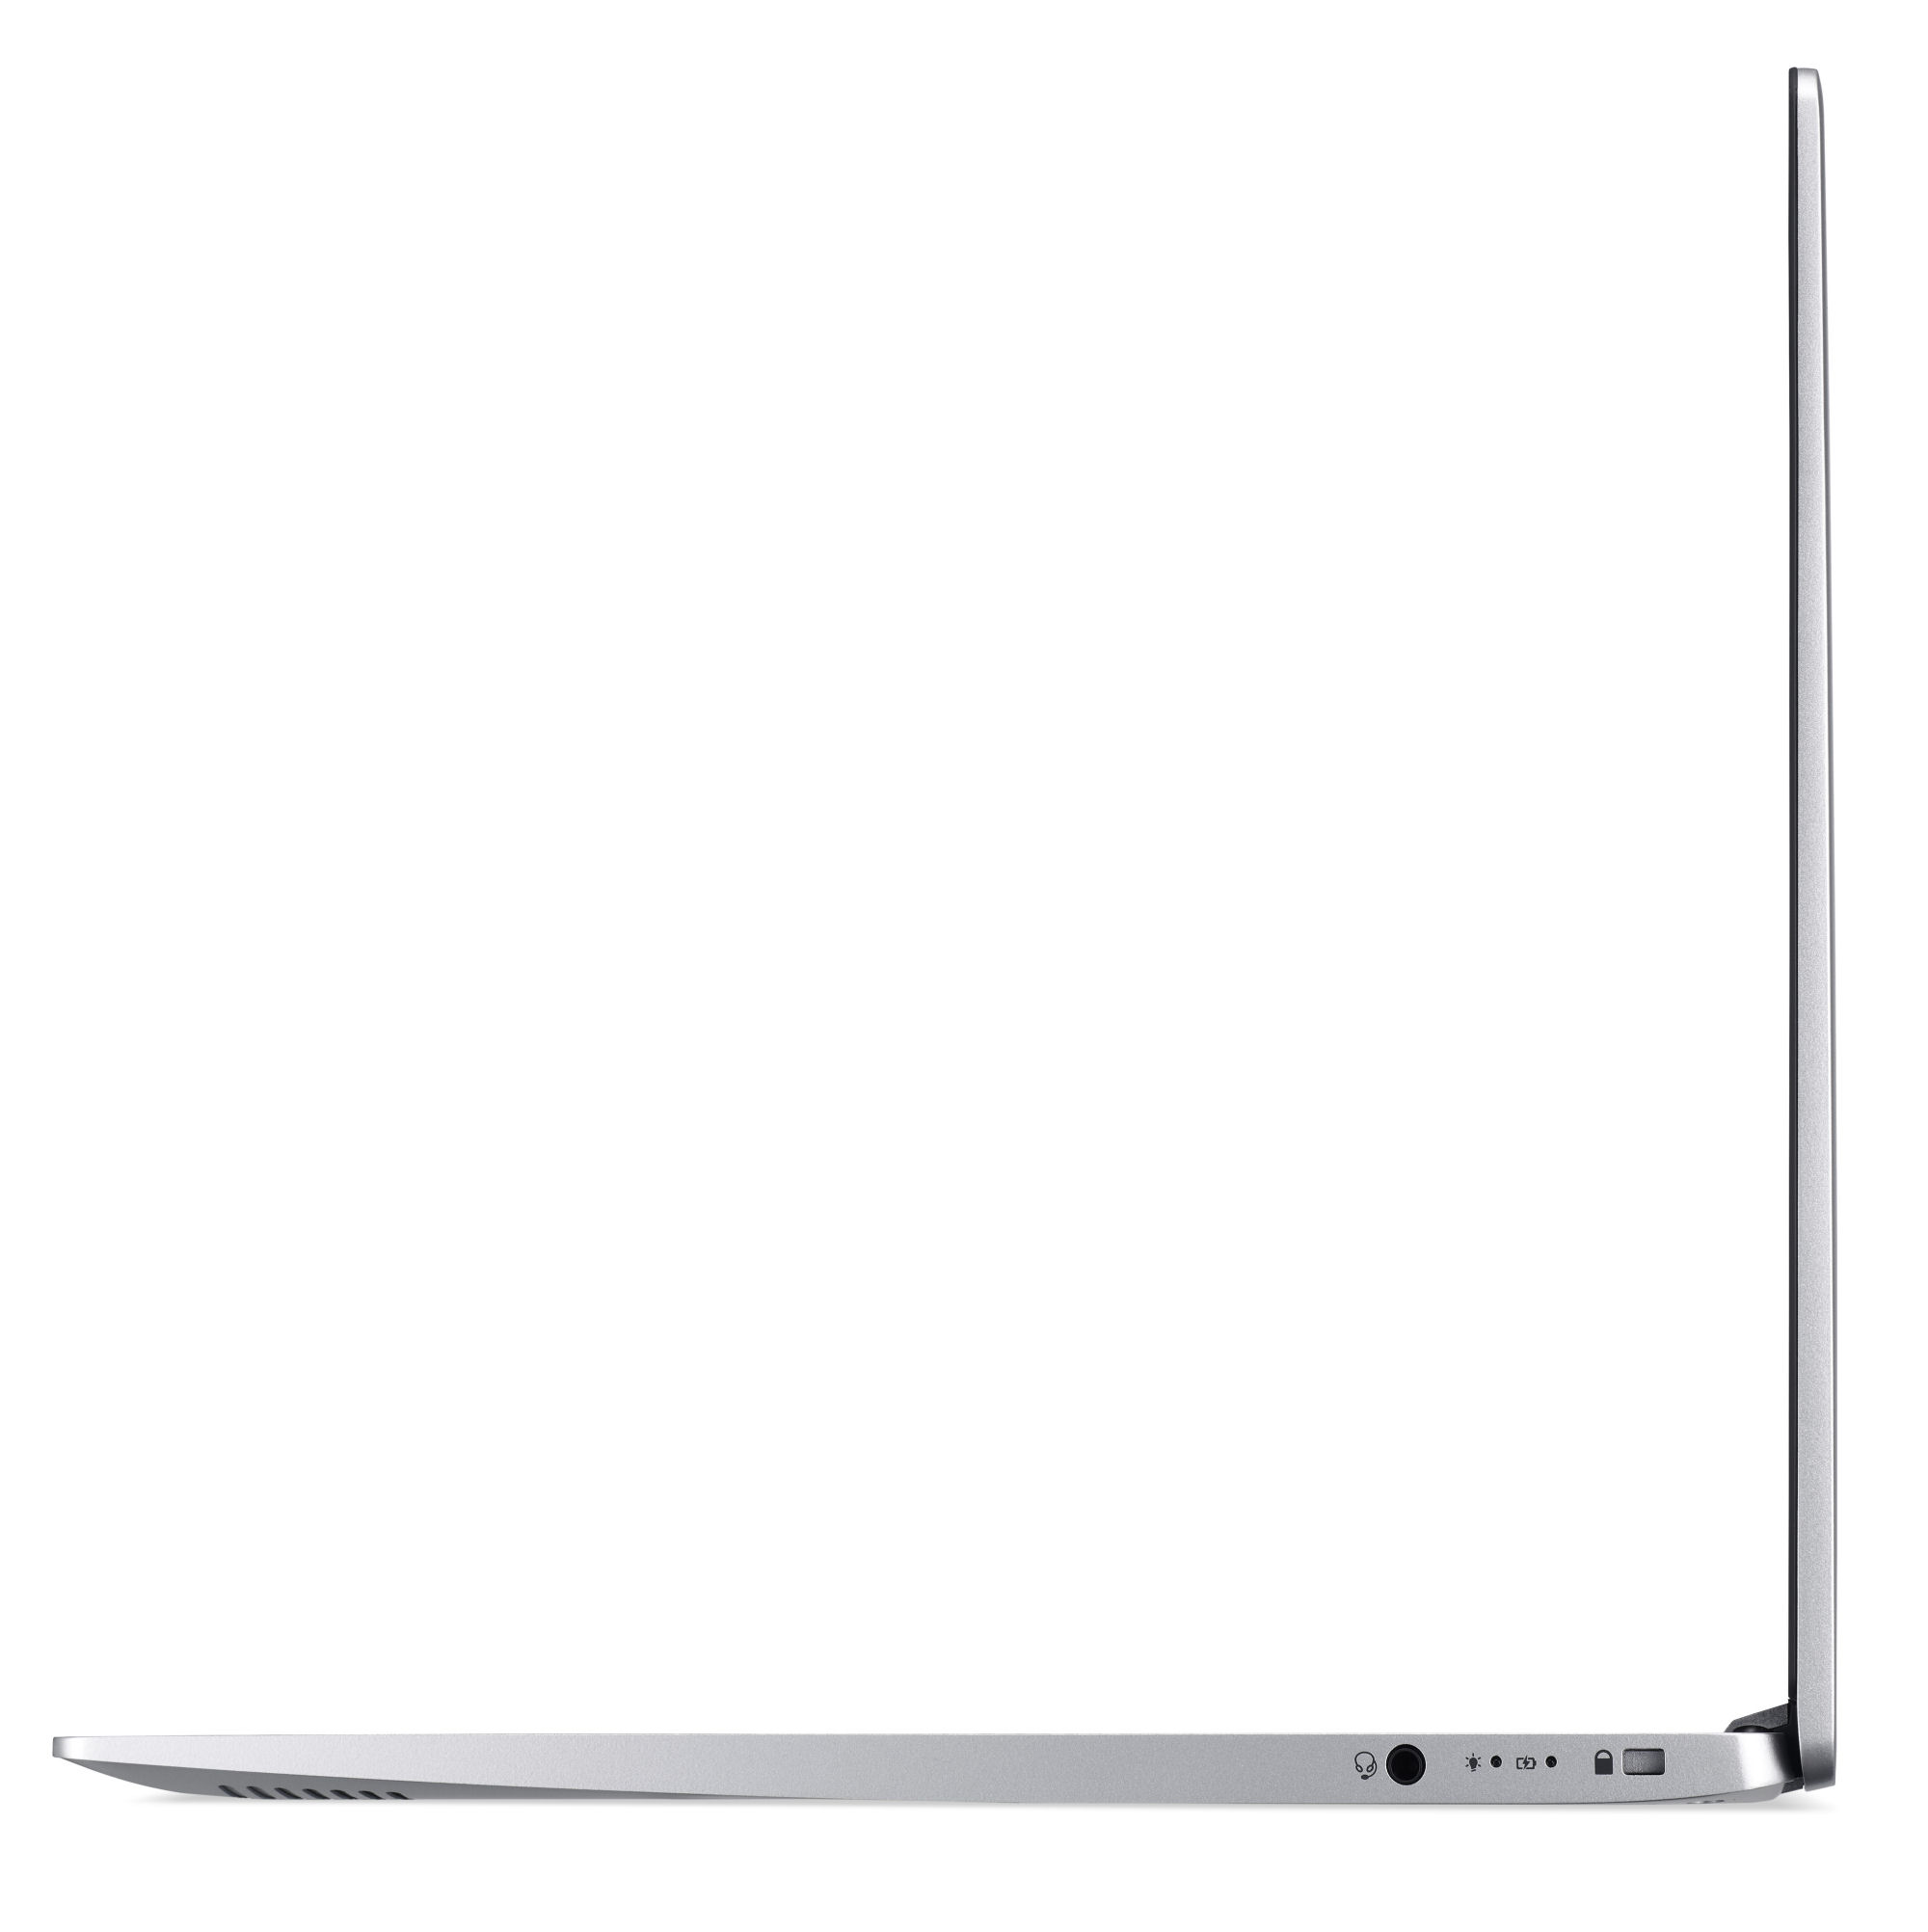
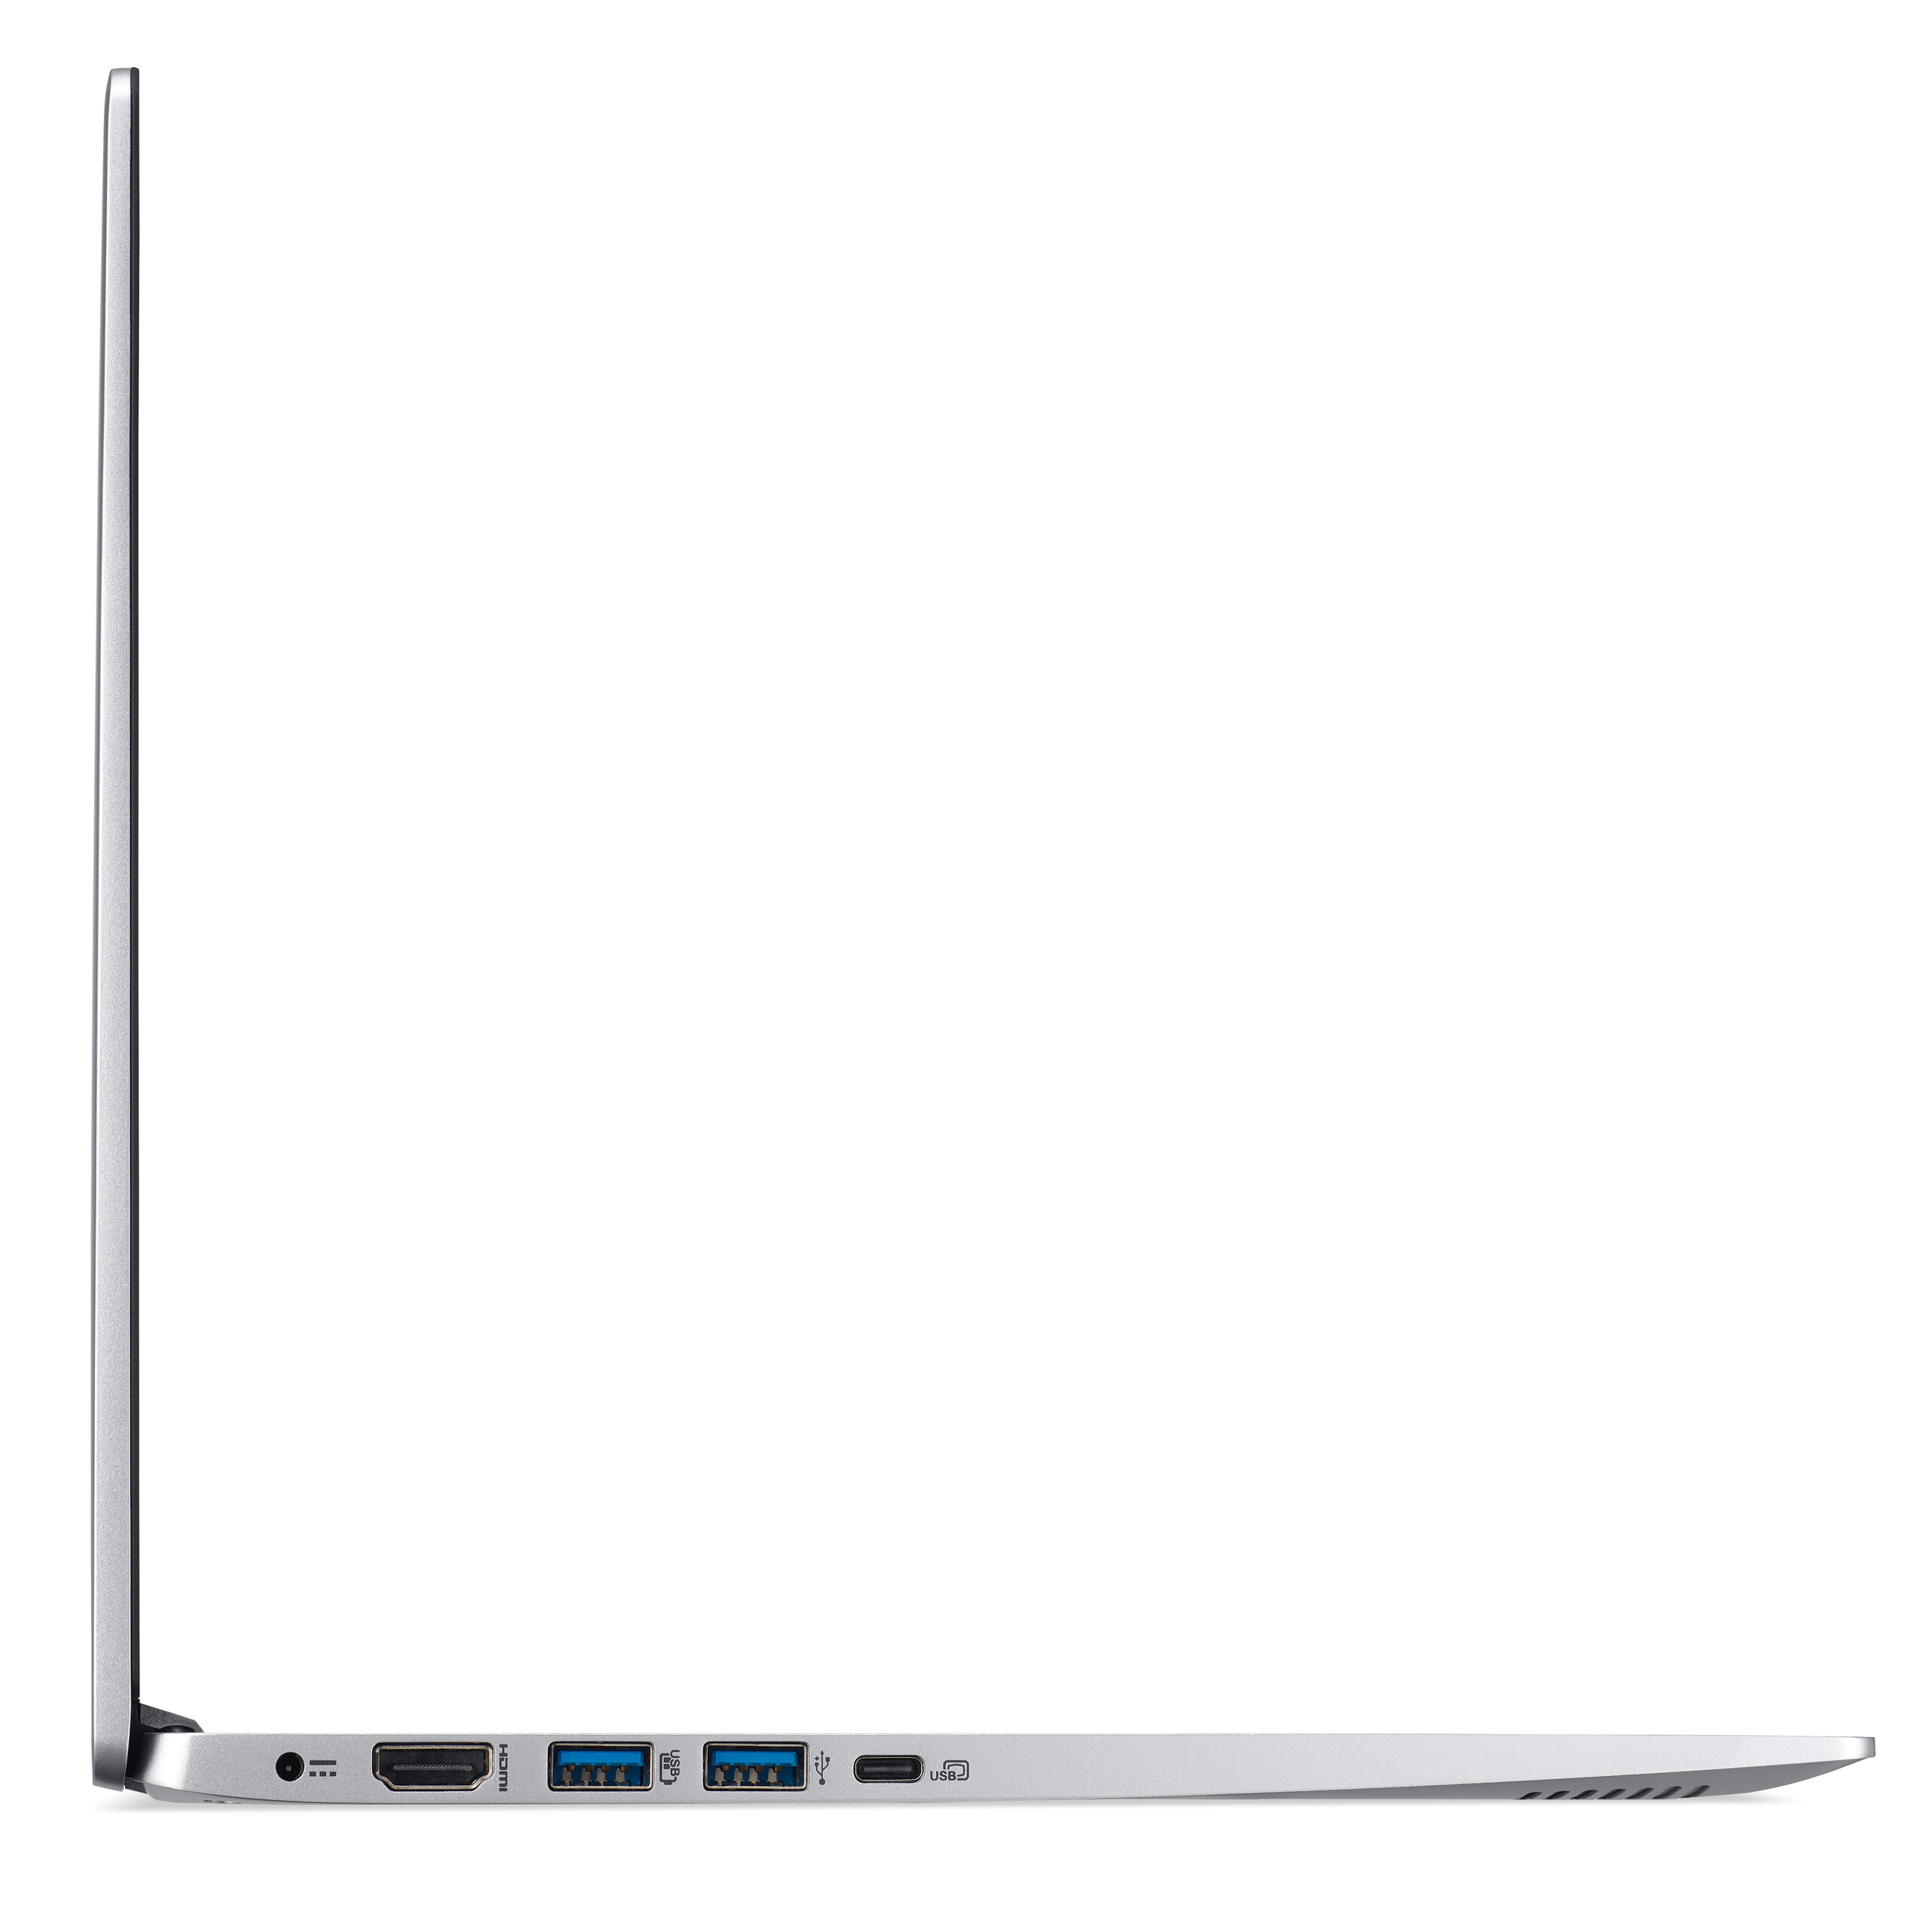
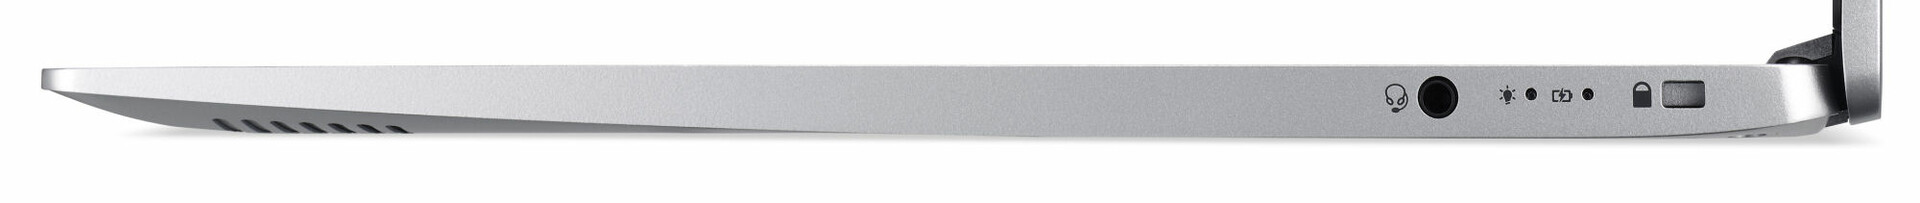
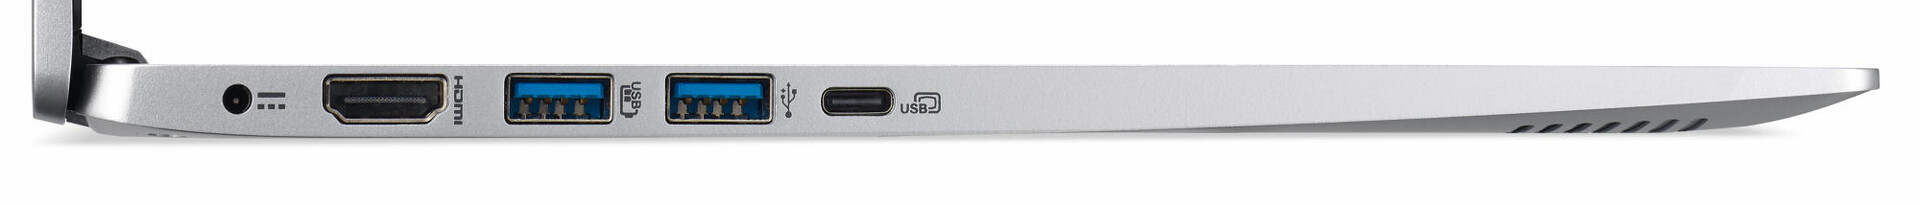
Acer Swift 5 SF515-51T tävlar med LG Gram 15Z980. Acer är definitivt vinnaren när det kommer till vikt - men Gram har betydligt längre batteritid och ett bättre portutbud. Dessa två faktorer kan för många intresserade köpare tippa balansen till förmån för LG:s enhet. Om Acer lyckas hålla vikten nere på framtida versioner av Swift 5 samtidigt som de förbättrar batteritiden och portutbudet kan det bli klurigare för Gram.
Acer Swift 5 SF515-51T-76B6
- 02/11/2019 v6 (old)
Sascha Mölck
Price comparison
