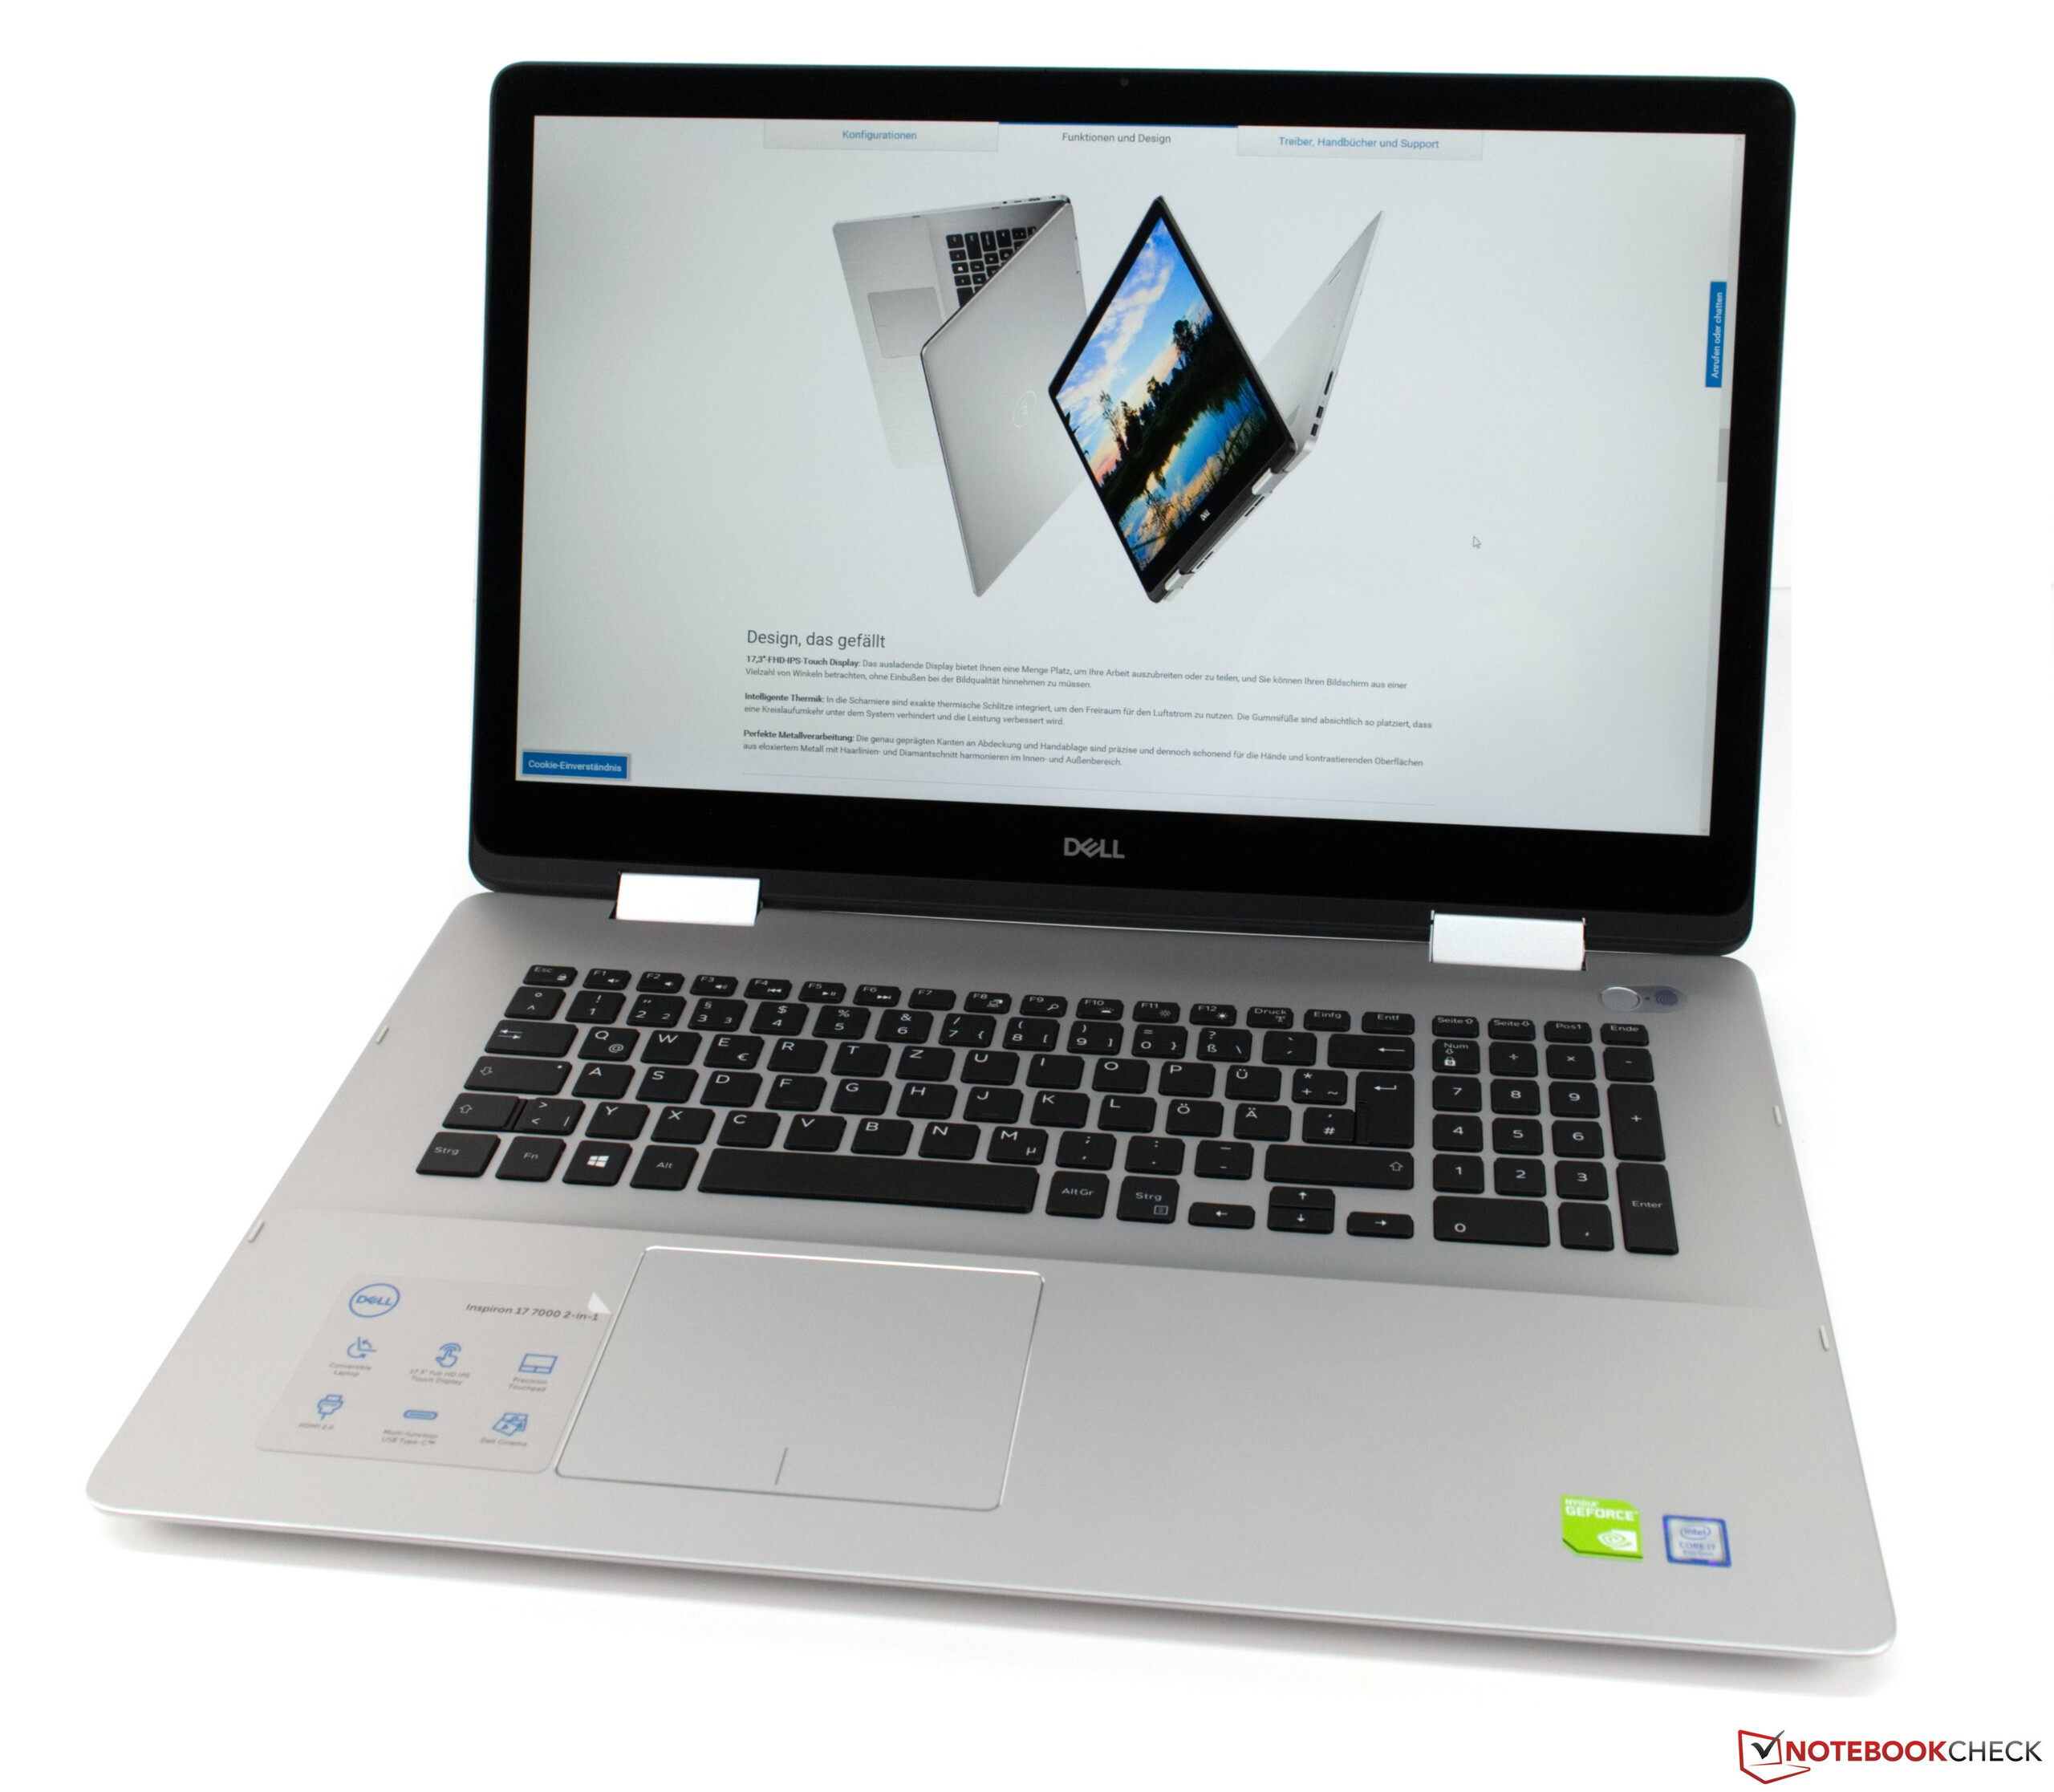
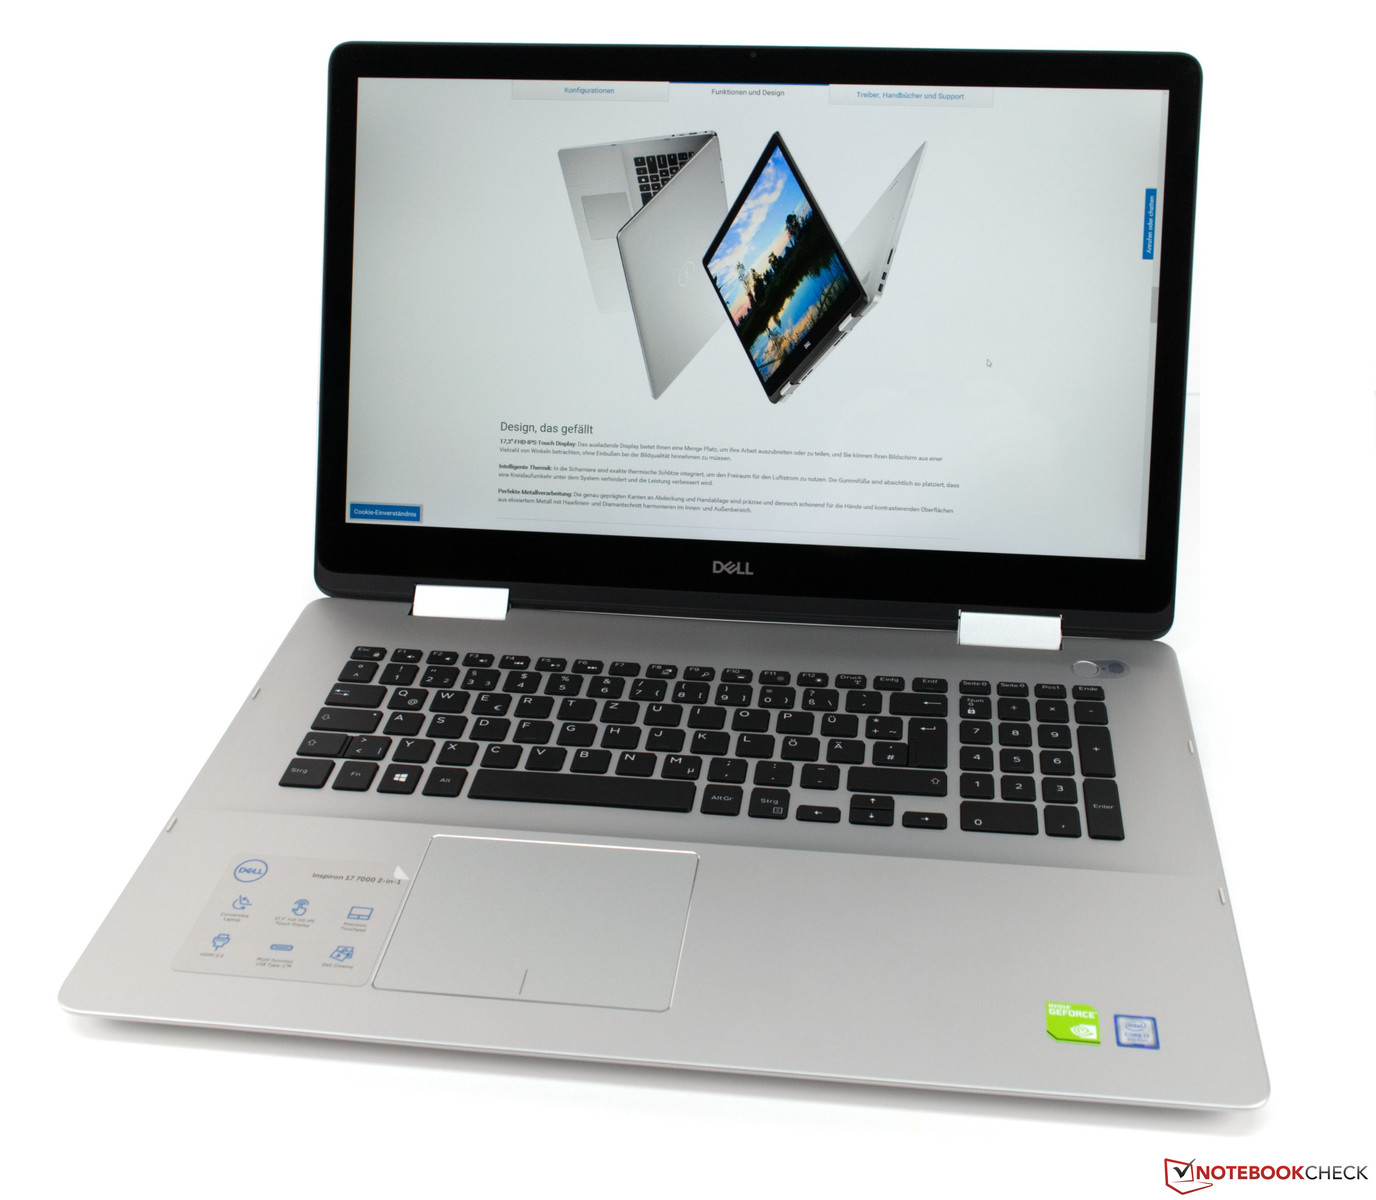
Test: Dell Inspiron 17-7786 (i7-8565U, 16 GB, 17 tum Touch, MX 150) Omvandlingsbar (Sammanfattning)
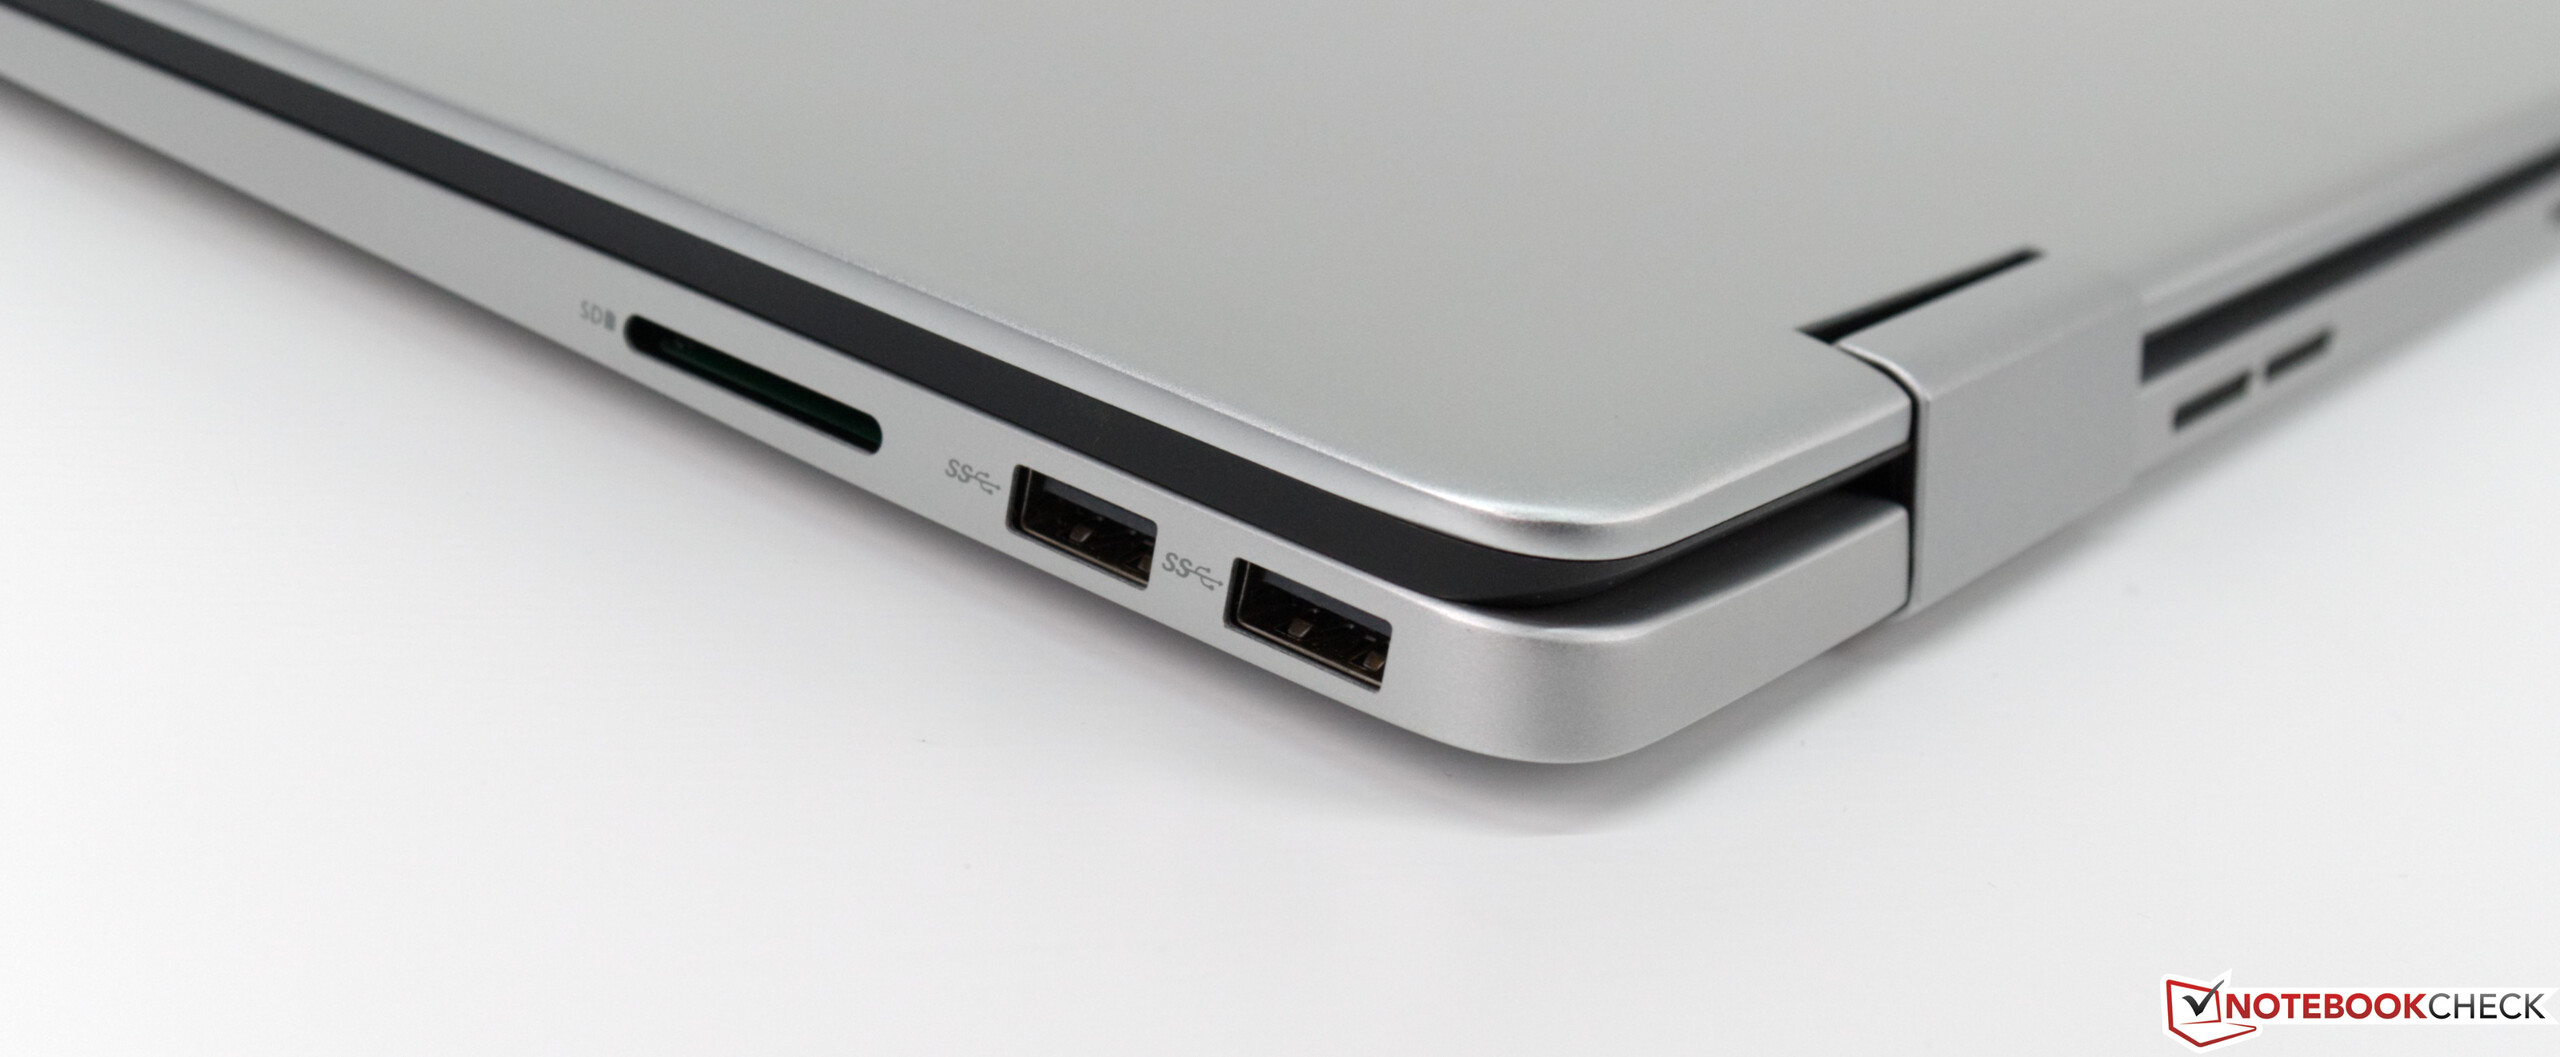
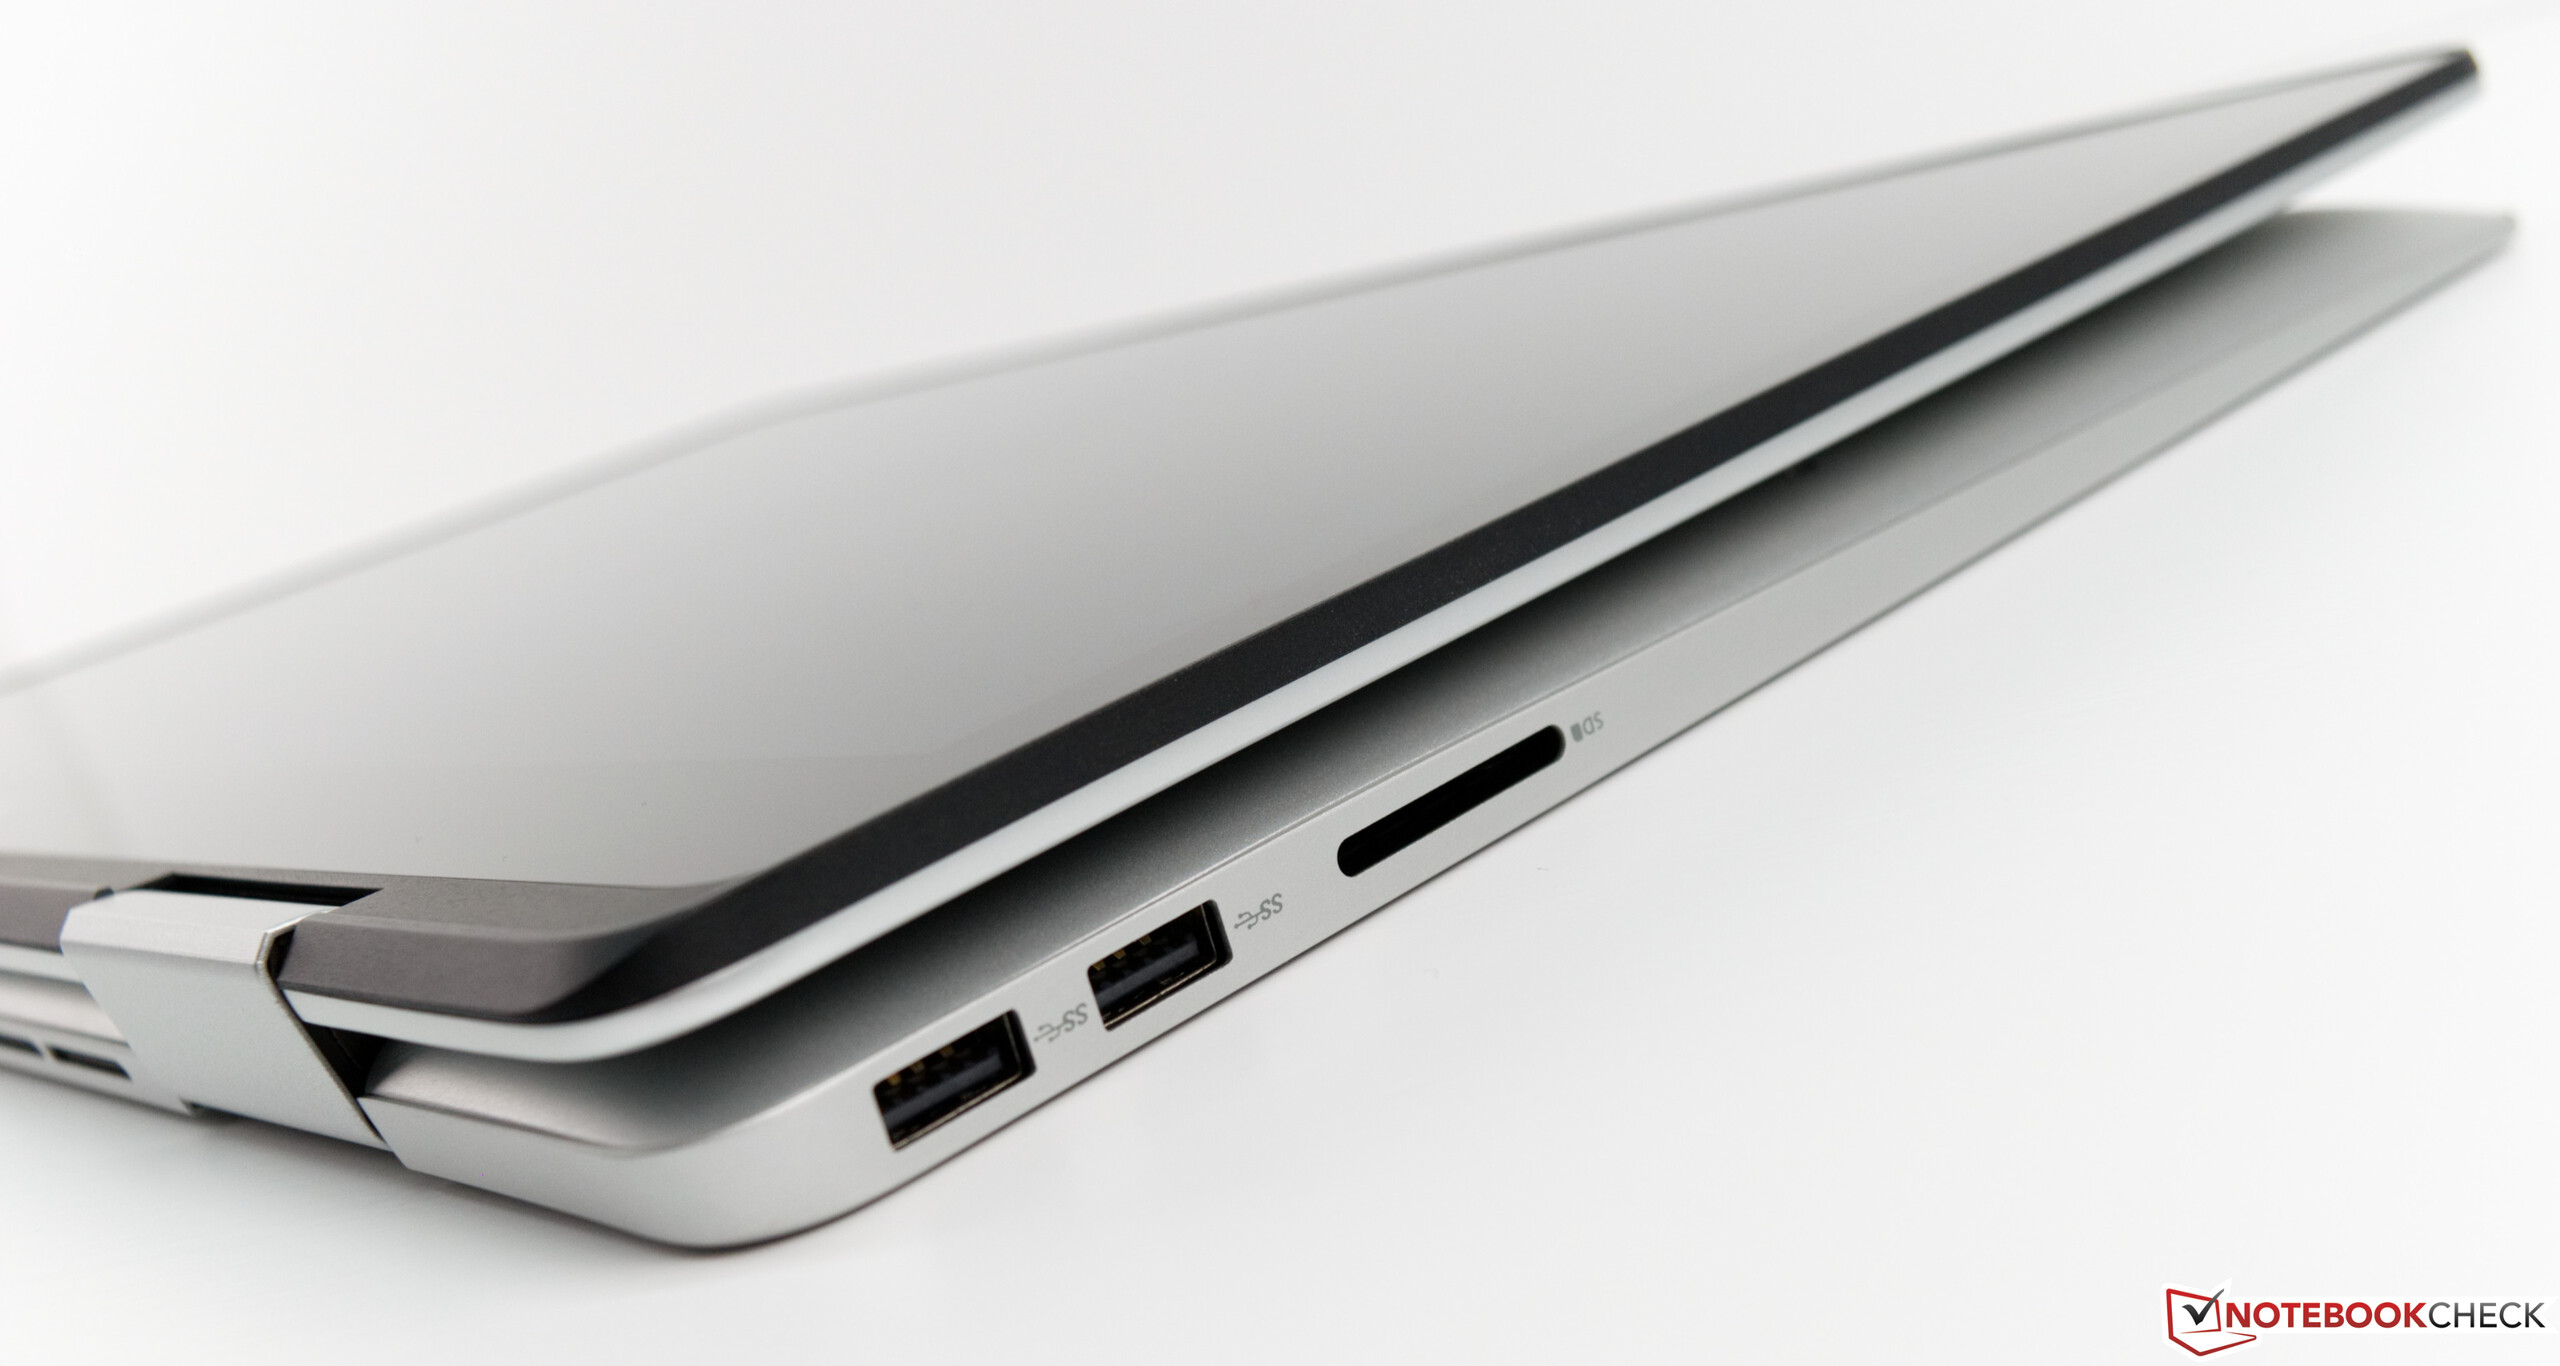
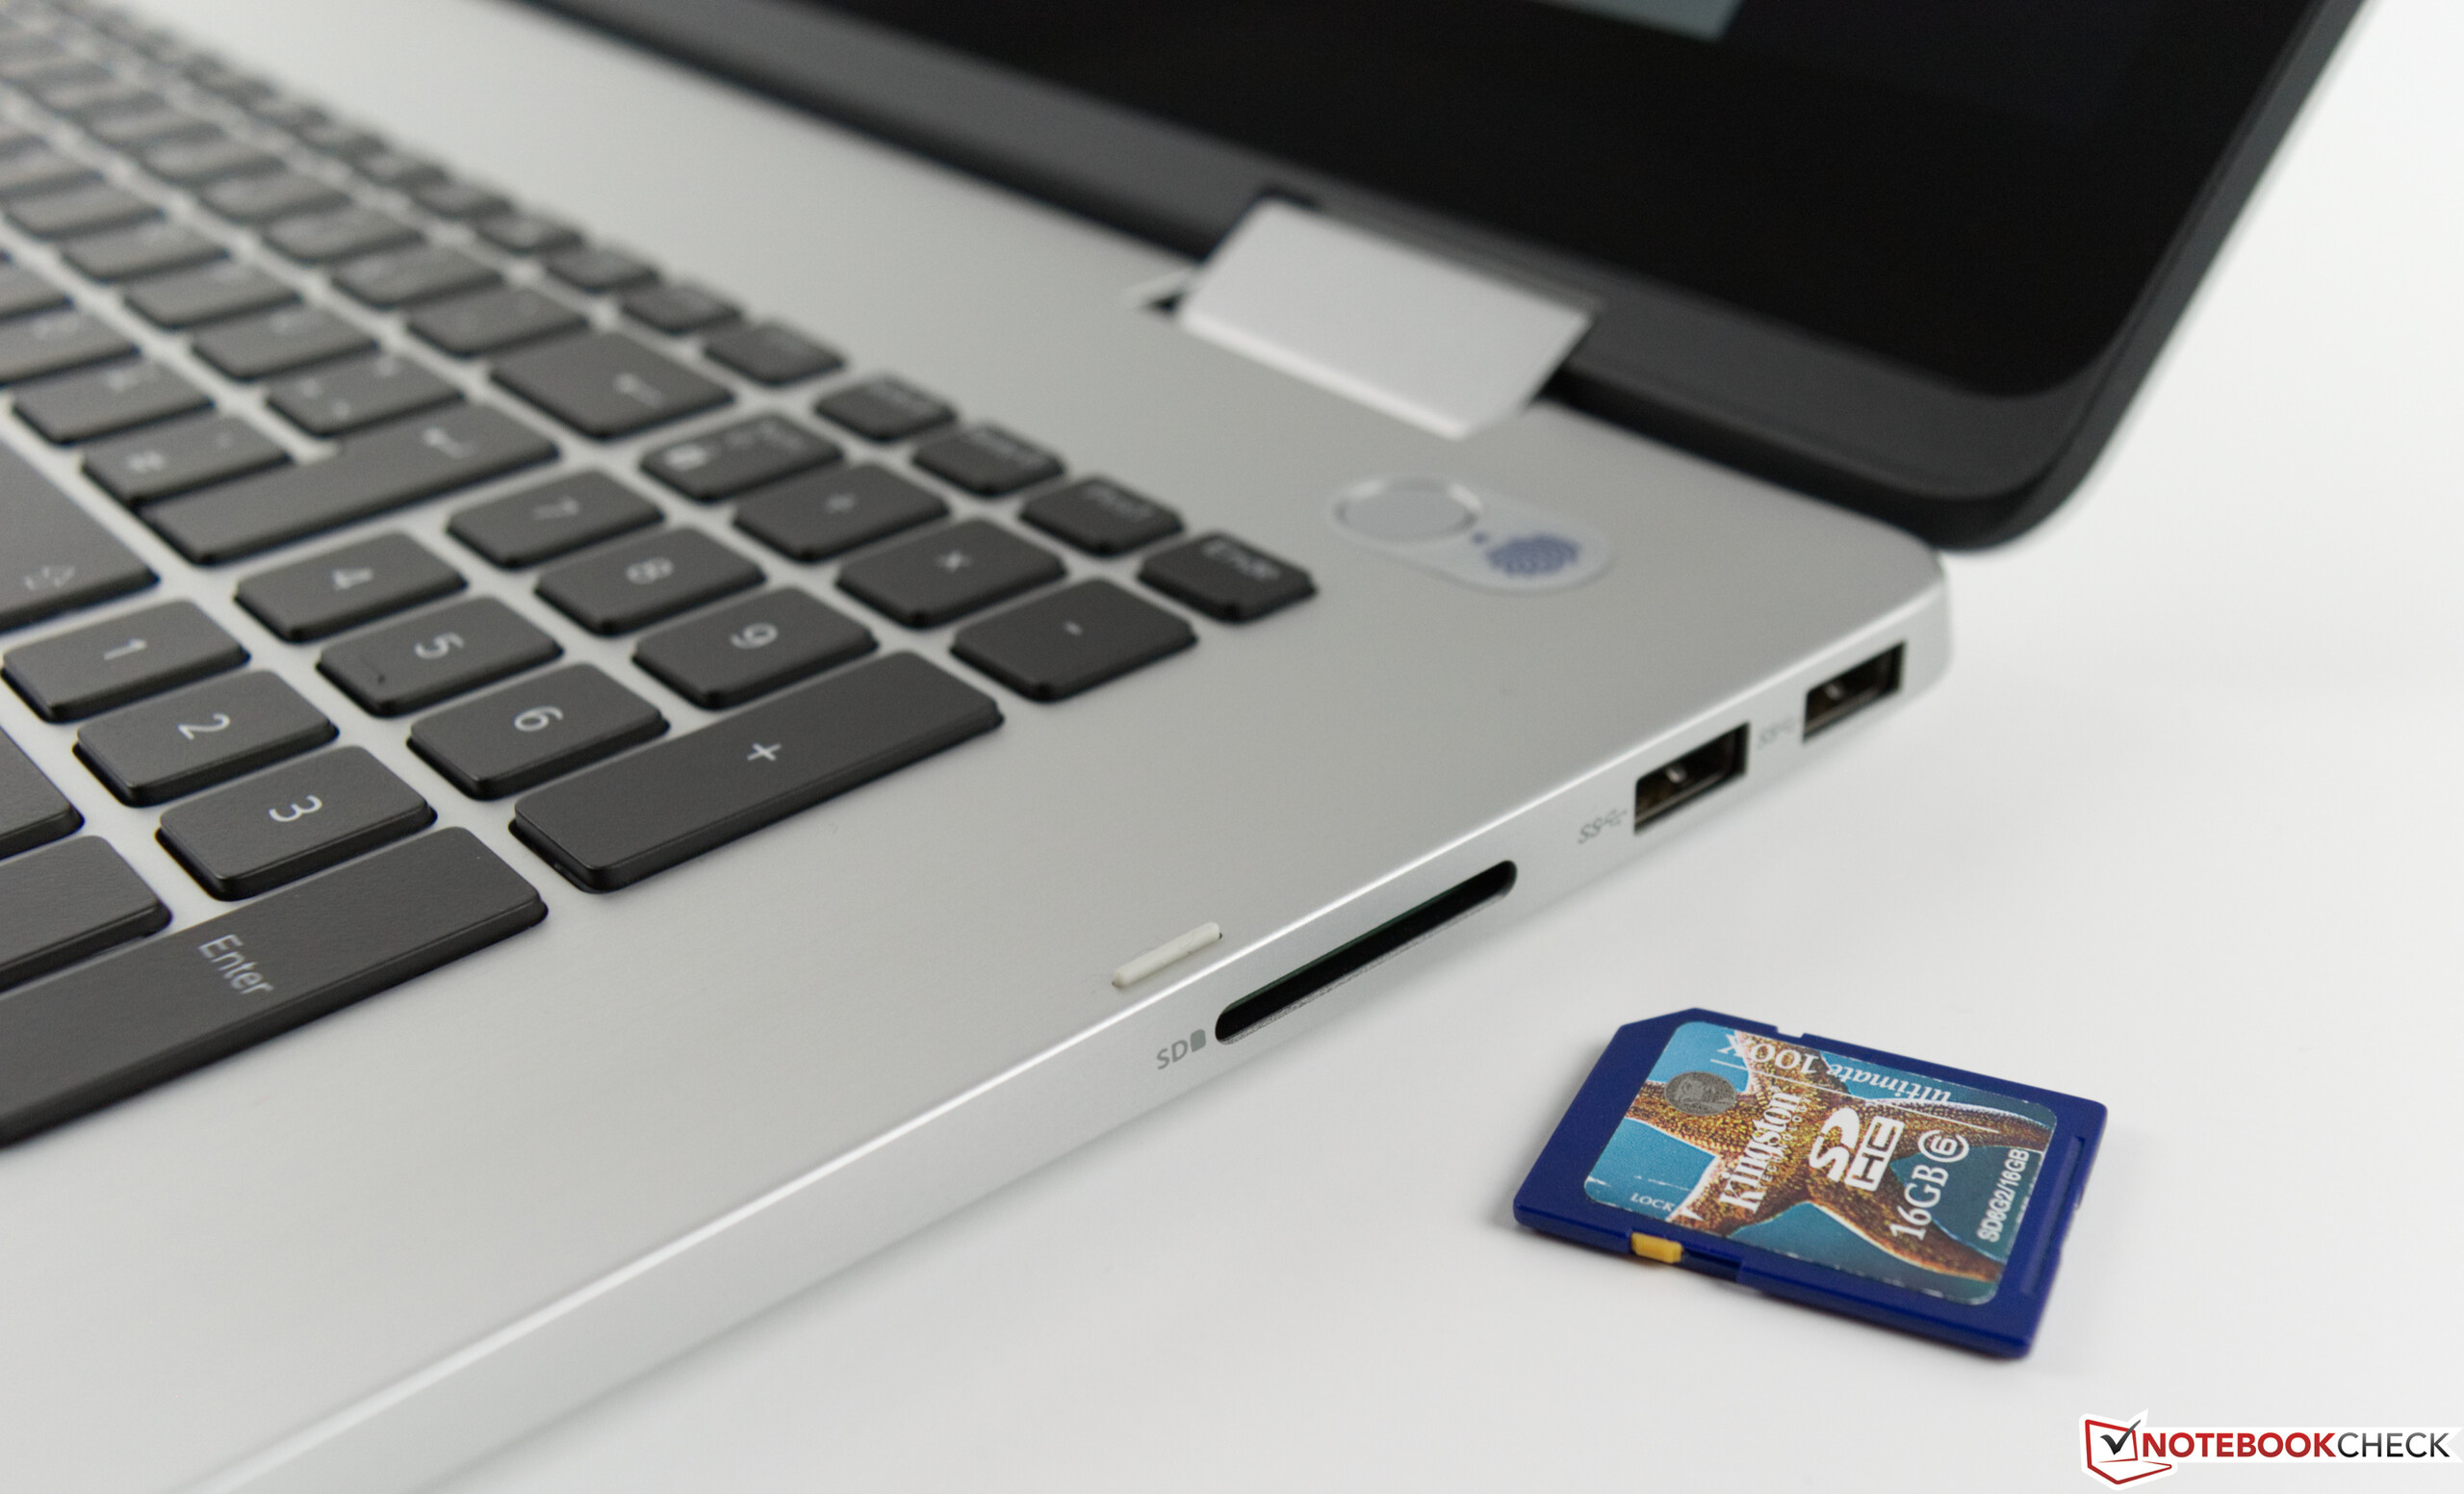
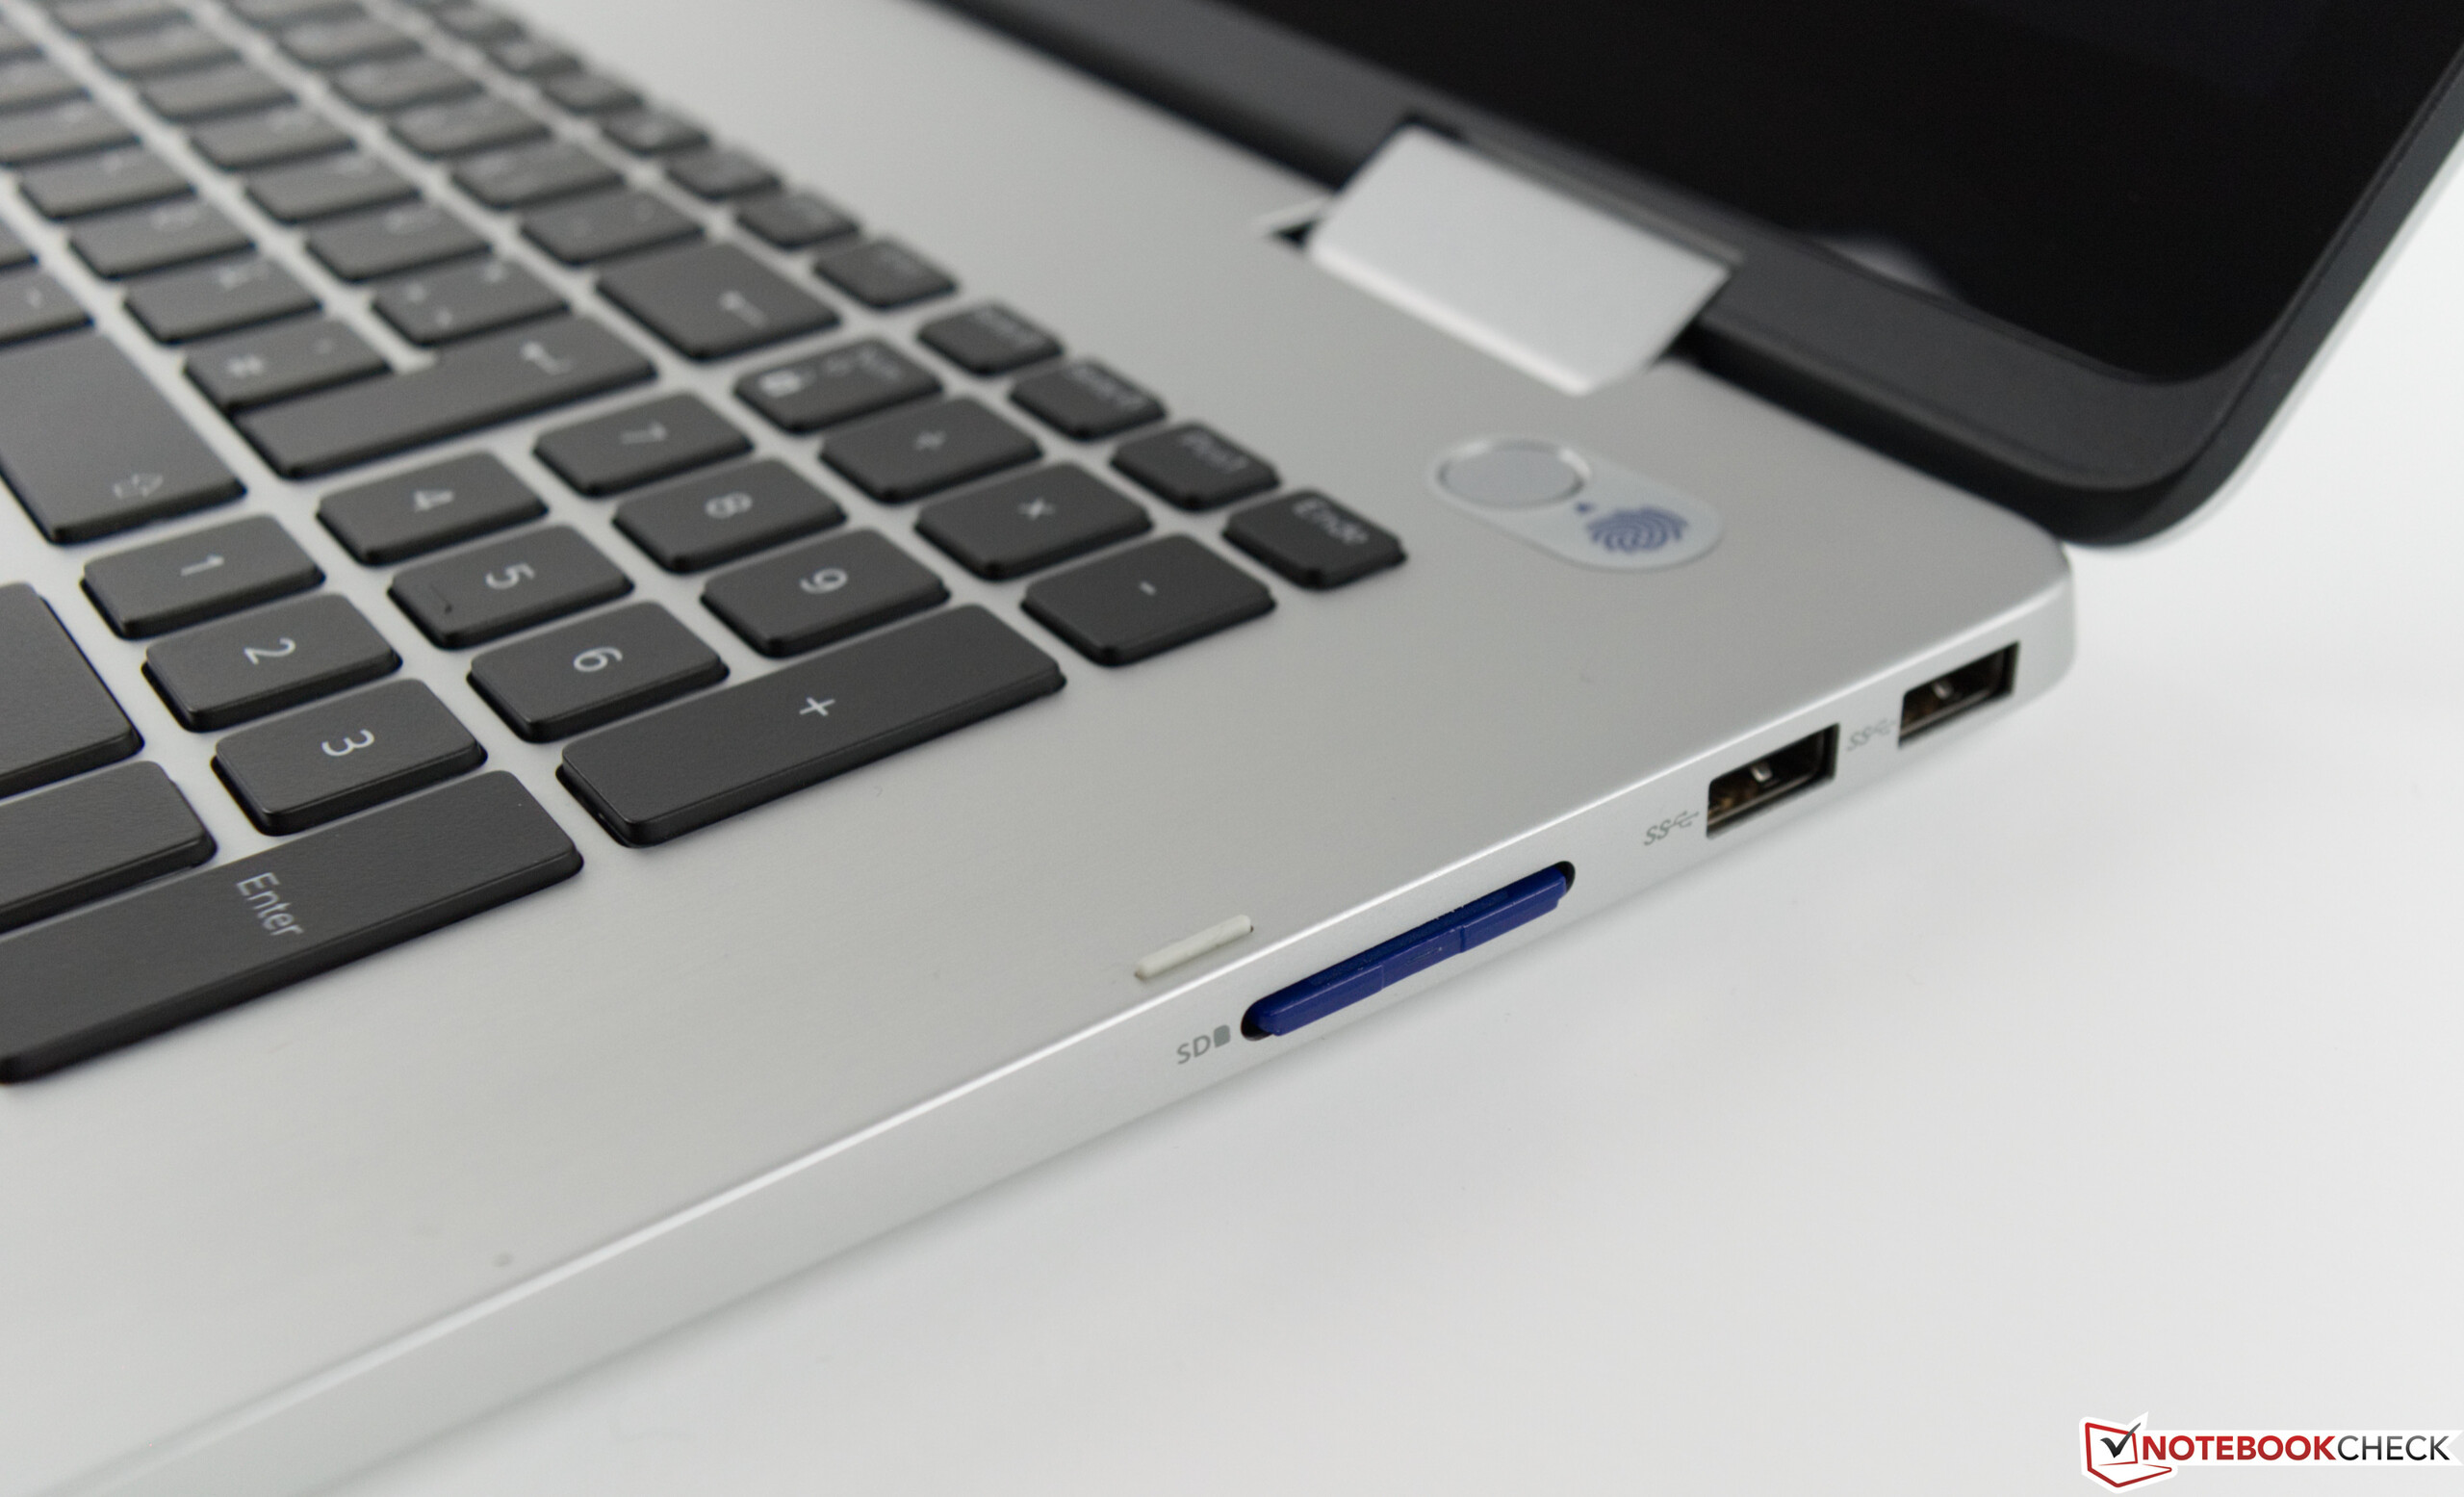
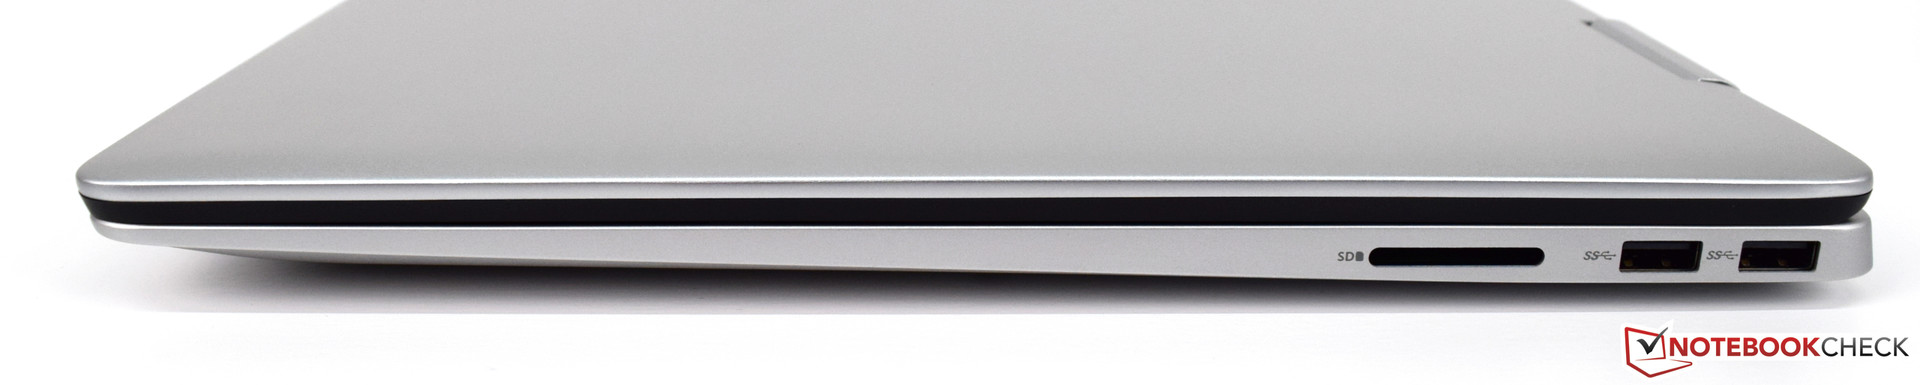
| SD Card Reader | |
| average JPG Copy Test (av. of 3 runs) | |
| Genomsnitt av klass Multimedia (23 - 531, n=43, senaste 2 åren) | |
| Acer Aspire 5 A517-51G-80L (Toshiba Exceria Pro SDXC 64 GB UHS-II) | |
| HP Envy 17-ae143ng (Toshiba Exceria Pro SDXC 64 GB UHS-II) | |
| Asus VivoBook Pro 17 N705UD-EH76 (Toshiba Exceria Pro SDXC 64 GB UHS-II) | |
| Dell Inspiron 17-7773-0043 (Toshiba Exceria Pro SDXC 64 GB UHS-II) | |
| Dell Inspiron 17-7786 (Toshiba Exceria Pro SDXC 64 GB UHS-II) | |
| Dell Inspiron 17 7778 | |
| maximum AS SSD Seq Read Test (1GB) | |
| Genomsnitt av klass Multimedia (27.9 - 1455, n=42, senaste 2 åren) | |
| Acer Aspire 5 A517-51G-80L (Toshiba Exceria Pro SDXC 64 GB UHS-II) | |
| HP Envy 17-ae143ng (Toshiba Exceria Pro SDXC 64 GB UHS-II) | |
| Asus VivoBook Pro 17 N705UD-EH76 (Toshiba Exceria Pro SDXC 64 GB UHS-II) | |
| Dell Inspiron 17-7786 (Toshiba Exceria Pro SDXC 64 GB UHS-II) | |
| Dell Inspiron 17-7773-0043 (Toshiba Exceria Pro SDXC 64 GB UHS-II) | |
| Dell Inspiron 17 7778 | |
| Networking | |
| iperf3 transmit AX12 | |
| HP Envy 17-ae143ng | |
| Dell Inspiron 17-7786 | |
| Asus VivoBook Pro 17 N705UD-EH76 | |
| Dell Inspiron 17-7773-0043 | |
| Acer Aspire 5 A517-51G-80L | |
| iperf3 receive AX12 | |
| Asus VivoBook Pro 17 N705UD-EH76 | |
| Dell Inspiron 17-7786 | |
| HP Envy 17-ae143ng | |
| Acer Aspire 5 A517-51G-80L | |
| Dell Inspiron 17-7773-0043 | |
| |||||||||||||||||||||||||
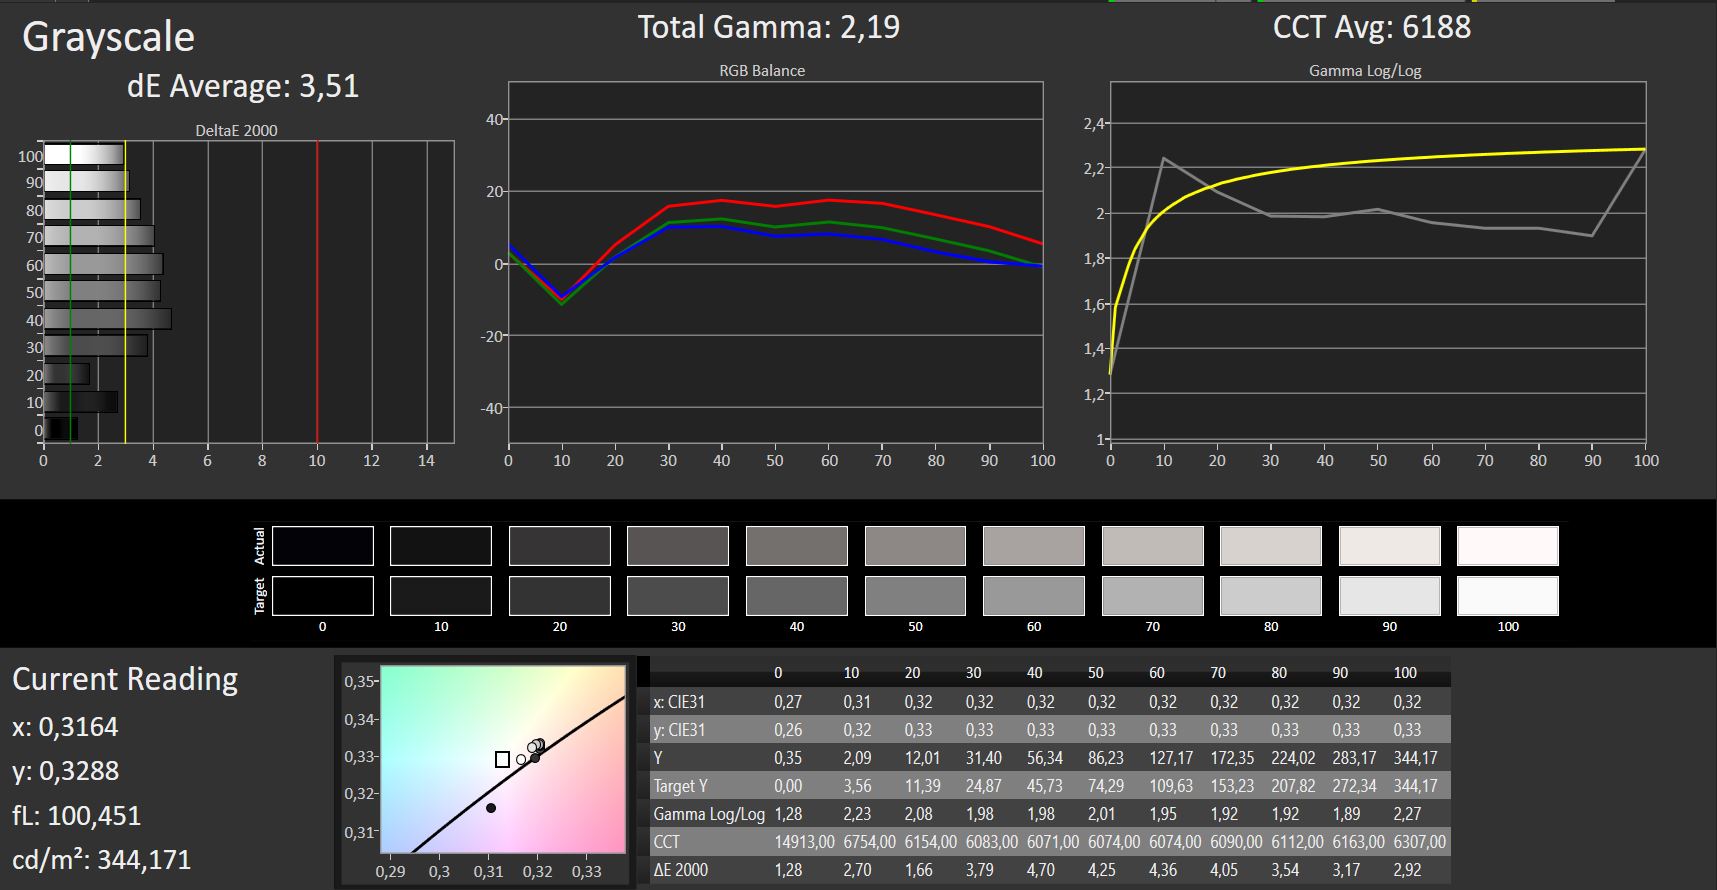
Distribution av ljusstyrkan: 82 %
Mitt på batteriet: 320 cd/m²
Kontrast: 927:1 (Svärta: 0.37 cd/m²)
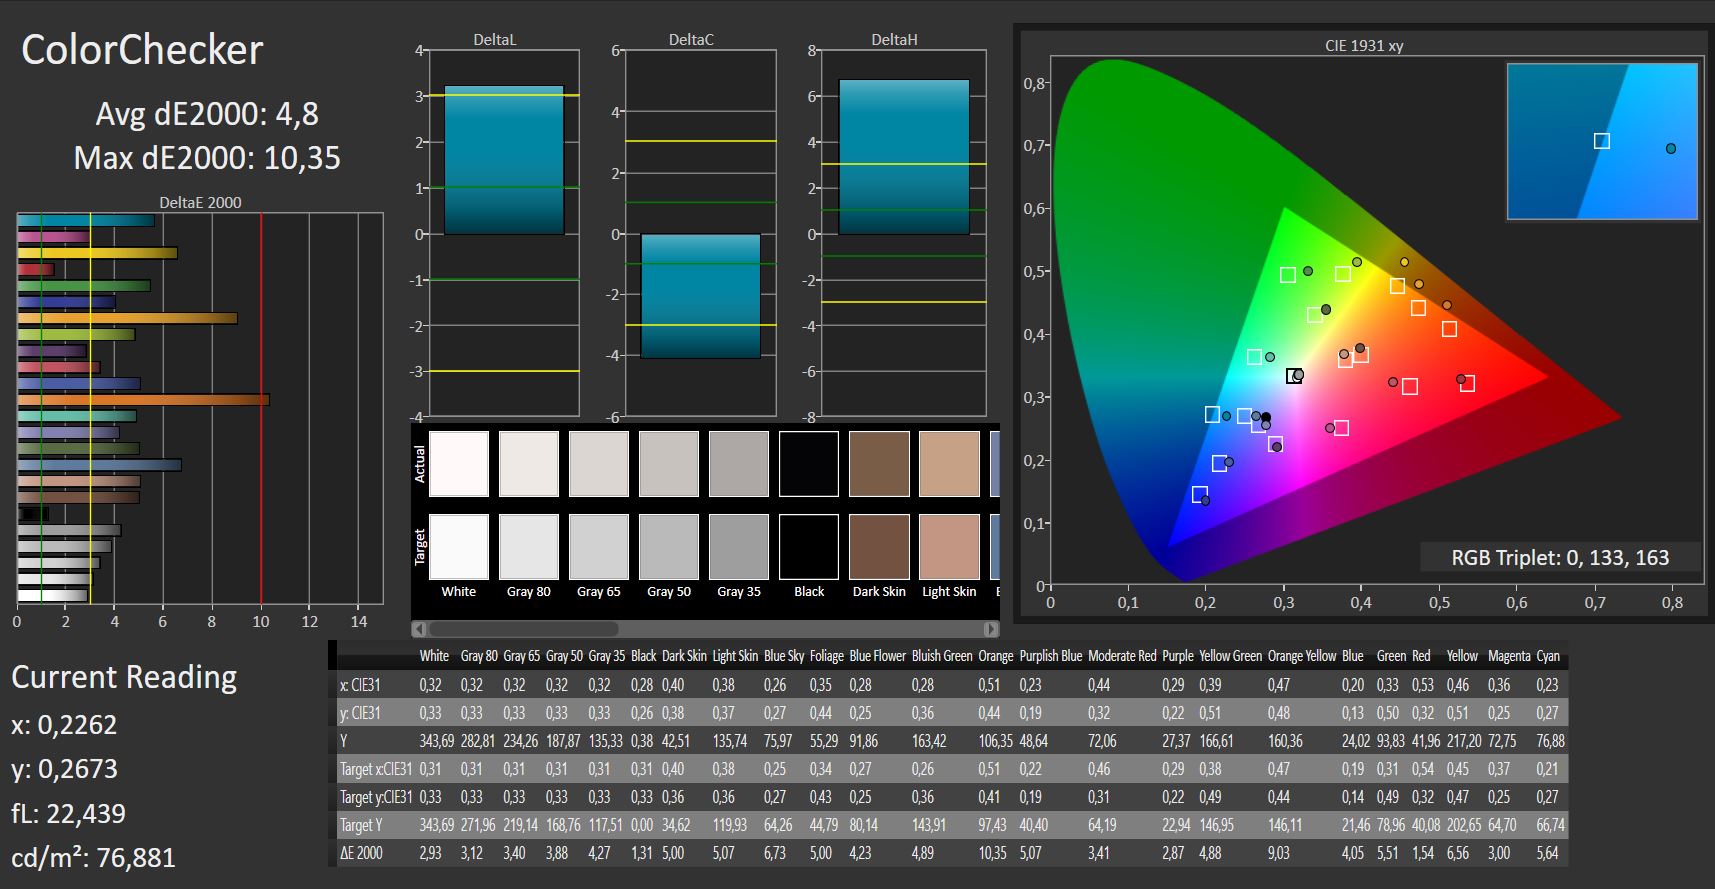
ΔE ColorChecker Calman: 4.8 | ∀{0.5-29.43 Ø4.73}
ΔE Greyscale Calman: 3.51 | ∀{0.09-98 Ø4.97}
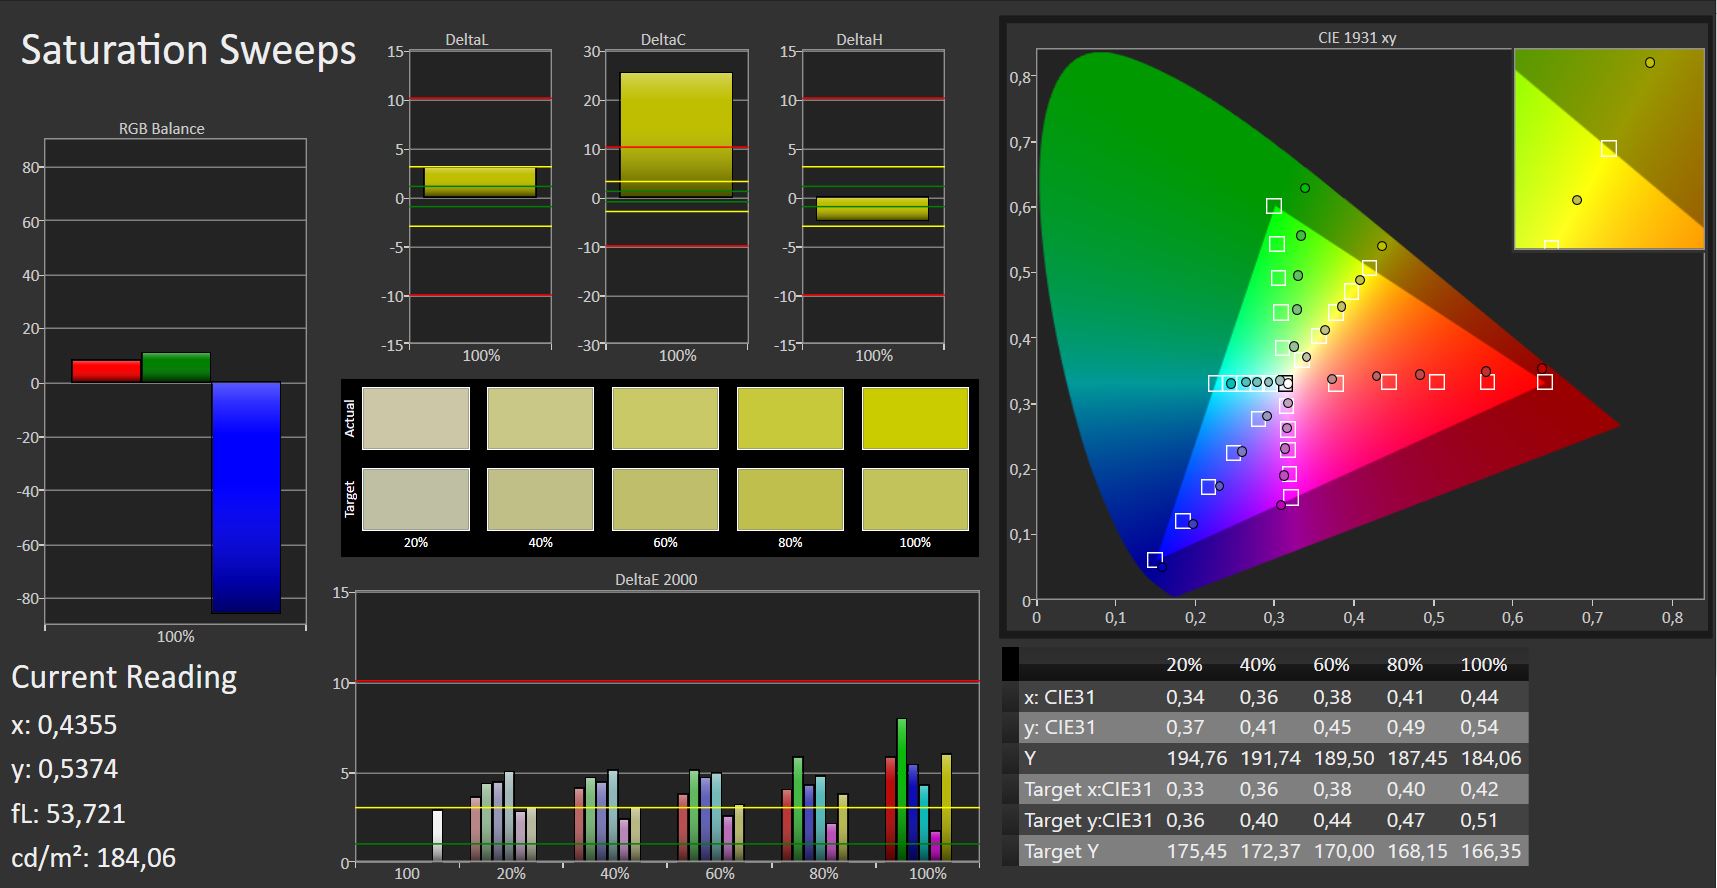
81% sRGB (Argyll 1.6.3 3D)
54% AdobeRGB 1998 (Argyll 1.6.3 3D)
59.7% AdobeRGB 1998 (Argyll 3D)
81.6% sRGB (Argyll 3D)
64.8% Display P3 (Argyll 3D)
Gamma: 2.19
CCT: 6188 K
| Dell Inspiron 17-7786 LG Philips, 173W4F, IPS, 1920x1080, 17.3" | Dell Inspiron 17-7773-0043 Chi Mei CMN1738, IPS, 1920x1080, 17.3" | Dell Inspiron 17 7778 LG Philips LGD 0513 / 173WF4, IPS, 1920x1080, 17.3" | HP Envy 17-ae143ng AU Optronics B173HW01 V0, IPS, 1920x1080, 17.3" | Acer Aspire 5 A517-51G-80L LG Display, LP173WF4-SPF5, aSi TFT, IPS, 1920x1080, 17.3" | Asus VivoBook Pro 17 N705UD-EH76 LP173WF4-SPF5, IPS, 1920x1080, 17.3" | |
|---|---|---|---|---|---|---|
| Display | 10% | 5% | 5% | 3% | 6% | |
| Display P3 Coverage (%) | 64.8 | 67.4 4% | 67.4 4% | 63.9 -1% | 66.3 2% | 67.9 5% |
| sRGB Coverage (%) | 81.6 | 91.9 13% | 86.3 6% | 88 8% | 84.2 3% | 86.8 6% |
| AdobeRGB 1998 Coverage (%) | 59.7 | 67.2 13% | 63.1 6% | 64.3 8% | 61.6 3% | 63.5 6% |
| Response Times | -5% | 12% | 18% | -12% | 17% | |
| Response Time Grey 50% / Grey 80% * (ms) | 38 ? | 40 ? -5% | 36 ? 5% | 33 ? 13% | 41 ? -8% | 30.8 ? 19% |
| Response Time Black / White * (ms) | 27 ? | 28 ? -4% | 22 ? 19% | 21 ? 22% | 31 ? -15% | 23.2 ? 14% |
| PWM Frequency (Hz) | 1000 ? | 122000 ? | 119000 ? | |||
| Screen | 5% | -13% | 3% | 16% | 0% | |
| Brightness middle (cd/m²) | 343 | 323 -6% | 327 -5% | 352 3% | 397 16% | 376.2 10% |
| Brightness (cd/m²) | 313 | 290 -7% | 314 0% | 330 5% | 364 16% | 355 13% |
| Brightness Distribution (%) | 82 | 77 -6% | 87 6% | 88 7% | 84 2% | 89 9% |
| Black Level * (cd/m²) | 0.37 | 0.21 43% | 0.3 19% | 0.31 16% | 0.29 22% | 0.42 -14% |
| Contrast (:1) | 927 | 1538 66% | 1090 18% | 1135 22% | 1369 48% | 896 -3% |
| Colorchecker dE 2000 * | 4.8 | 4.88 -2% | 6.75 -41% | 4.34 10% | 3.88 19% | 4.21 12% |
| Colorchecker dE 2000 max. * | 10.35 | 8.86 14% | 11.82 -14% | 8.69 16% | 8.22 21% | 8.31 20% |
| Greyscale dE 2000 * | 3.51 | 6.21 -77% | 7.91 -125% | 5.66 -61% | 3.1 12% | 5.5 -57% |
| Gamma | 2.19 100% | 2.36 93% | 2.31 95% | 2.29 96% | 2.59 85% | 2.335 94% |
| CCT | 6188 105% | 6620 98% | 7642 85% | 6326 103% | 6570 99% | 7056 92% |
| Color Space (Percent of AdobeRGB 1998) (%) | 54 | 60 11% | 57 6% | 57 6% | 55 2% | 57 6% |
| Color Space (Percent of sRGB) (%) | 81 | 92 14% | 86 6% | 88 9% | 84 4% | 87 7% |
| Colorchecker dE 2000 calibrated * | 3.95 | |||||
| Totalt genomsnitt (program/inställningar) | 3% /
5% | 1% /
-6% | 9% /
6% | 2% /
10% | 8% /
4% |
* ... mindre är bättre
Visa svarstider
| ↔ Svarstid svart till vitt | ||
|---|---|---|
| 27 ms ... stiga ↗ och falla ↘ kombinerat | ↗ 16 ms stiga | 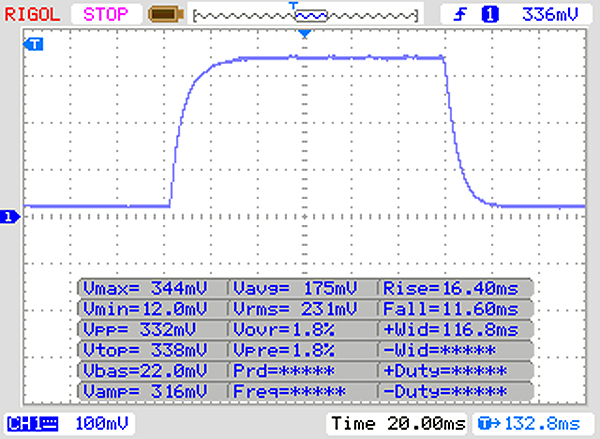 |
| ↘ 11 ms hösten | ||
| Skärmen visar relativt långsamma svarsfrekvenser i våra tester och kan vara för långsam för spelare. I jämförelse sträcker sig alla testade enheter från 0.1 (minst) till 240 (maximalt) ms. » 67 % av alla enheter är bättre. Detta innebär att den uppmätta svarstiden är sämre än genomsnittet av alla testade enheter (19.9 ms). | ||
| ↔ Svarstid 50 % grått till 80 % grått | ||
| 38 ms ... stiga ↗ och falla ↘ kombinerat | ↗ 19 ms stiga | 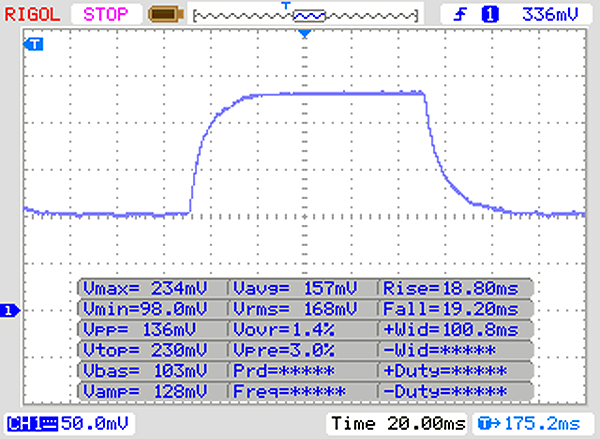 |
| ↘ 19 ms hösten | ||
| Skärmen visar långsamma svarsfrekvenser i våra tester och kommer att vara otillfredsställande för spelare. I jämförelse sträcker sig alla testade enheter från 0.165 (minst) till 636 (maximalt) ms. » 55 % av alla enheter är bättre. Detta innebär att den uppmätta svarstiden är sämre än genomsnittet av alla testade enheter (31.1 ms). | ||
Skärmflimmer / PWM (Puls-Width Modulation)
| Skärmflimmer / PWM upptäcktes inte |  | ||
Som jämförelse: 52 % av alla testade enheter använder inte PWM för att dämpa skärmen. Om PWM upptäcktes mättes ett medelvärde av 7798 (minst: 5 - maximum: 343500) Hz. | |||
| Blender - v2.79 BMW27 CPU | |
| Dell Inspiron 17-7786 | |
| Genomsnitt Intel Core i7-8565U (687 - 1175, n=22) | |
| Genomsnitt av klass Multimedia (100 - 557, n=65, senaste 2 åren) | |
| HWBOT x265 Benchmark v2.2 - 4k Preset | |
| Genomsnitt av klass Multimedia (5.26 - 36.1, n=63, senaste 2 åren) | |
| Dell Inspiron 17-7786 | |
| Genomsnitt Intel Core i7-8565U (3.24 - 5.5, n=22) | |
* ... mindre är bättre
| PCMark 8 Home Score Accelerated v2 | 4092 poäng | |
| PCMark 8 Creative Score Accelerated v2 | 5840 poäng | |
| PCMark 8 Work Score Accelerated v2 | 5254 poäng | |
| PCMark 10 Score | 4175 poäng | |
Hjälp | ||
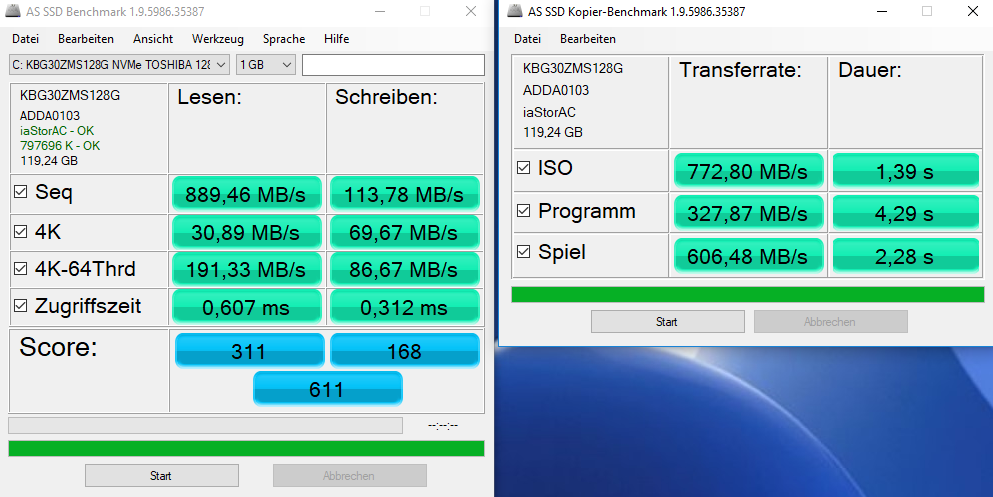
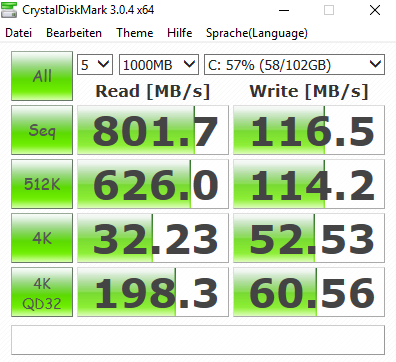
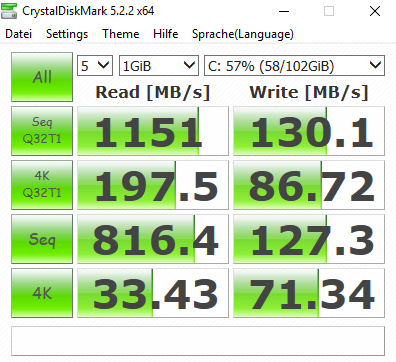
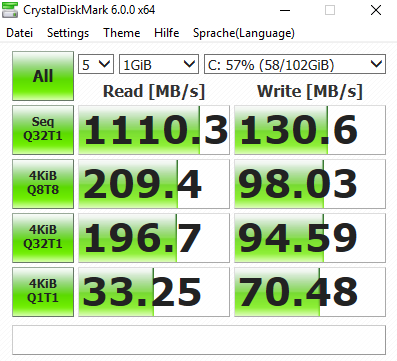
Benchmarks of the SSD
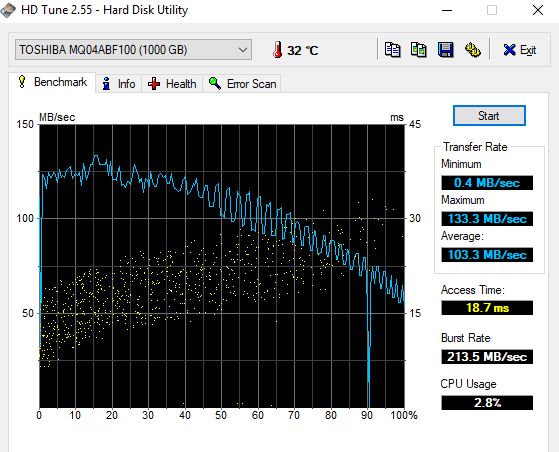
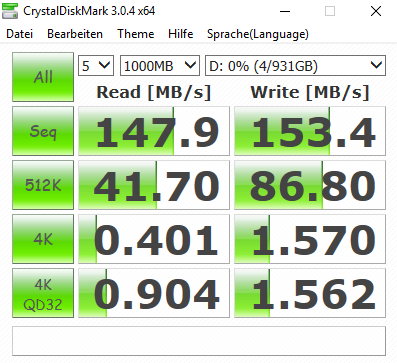
Benchmarks of the HDD
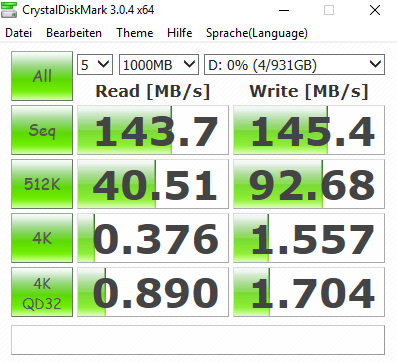
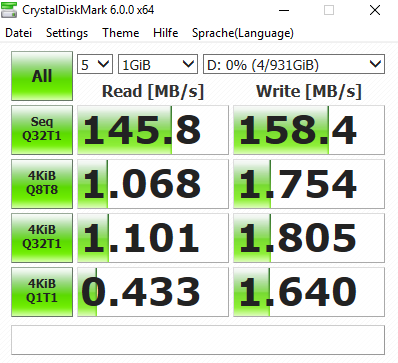
| Dell Inspiron 17-7786 KBG30ZMS128G | Dell Inspiron 17-7773-0043 SanDisk X400 M.2 2280 128GB | Dell Inspiron 17 7778 Liteonit CV3-CE512 | HP Envy 17-ae143ng Liteonit CV3-8D128 | Acer Aspire 5 A517-51G-80L Micron 1100 MTFDDAV256TBN | Asus VivoBook Pro 17 N705UD-EH76 Samsung PM961 NVMe MZVLW512HMJP | |
|---|---|---|---|---|---|---|
| CrystalDiskMark 5.2 / 6 | 52% | 78% | 61% | 344% | ||
| Write 4K (MB/s) | 71.3 | 56.4 -21% | 66.2 -7% | 84.2 18% | 151.3 112% | |
| Read 4K (MB/s) | 33.43 | 28.72 -14% | 33.83 1% | 28.39 -15% | 46.62 39% | |
| Write Seq (MB/s) | 127.3 | 356.3 180% | 449.4 253% | 398.2 213% | 1020 701% | |
| Read Seq (MB/s) | 816 | 490.3 -40% | 468.6 -43% | 472.1 -42% | 935 15% | |
| Write 4K Q32T1 (MB/s) | 94.6 | 276.7 192% | 209.6 122% | 181.6 92% | 452.3 378% | |
| Read 4K Q32T1 (MB/s) | 196.7 | 279.7 42% | 290.8 48% | 247.7 26% | 559 184% | |
| Write Seq Q32T1 (MB/s) | 130.6 | 298.5 129% | 525 302% | 454.3 248% | 1614 1136% | |
| Read Seq Q32T1 (MB/s) | 1110 | 522 -53% | 508 -54% | 533 -52% | 3220 190% | |
| Write 4K Q8T8 (MB/s) | 98 | |||||
| Read 4K Q8T8 (MB/s) | 209.4 | |||||
| AS SSD | 18% | 69% | 23% | 41% | 328% | |
| Seq Read (MB/s) | 889 | 482.2 -46% | 489.8 -45% | 488.5 -45% | 494.2 -44% | 2339 163% |
| Seq Write (MB/s) | 113.8 | 330 190% | 445.8 292% | 476.7 319% | 404.2 255% | 1409 1138% |
| 4K Read (MB/s) | 30.89 | 27.84 -10% | 24.93 -19% | 29.7 -4% | 25.78 -17% | 49.78 61% |
| 4K Write (MB/s) | 69.7 | 54.4 -22% | 55.6 -20% | 54.1 -22% | 71.4 2% | 122.1 75% |
| 4K-64 Read (MB/s) | 191.3 | 355 86% | 282 47% | 258.7 35% | 234.6 23% | 1329 595% |
| 4K-64 Write (MB/s) | 86.7 | 98 13% | 247.1 185% | 116.9 35% | 259.1 199% | 828 855% |
| Access Time Read * (ms) | 0.607 | 0.218 64% | 0.106 83% | 0.161 73% | 0.081 87% | 0.056 91% |
| Access Time Write * (ms) | 0.312 | 0.081 74% | 0.081 74% | 0.069 78% | 0.057 82% | 0.03 90% |
| Score Read (Points) | 311 | 431 39% | 356 14% | 337 8% | 310 0% | 1612 418% |
| Score Write (Points) | 168 | 185 10% | 347 107% | 219 30% | 371 121% | 1091 549% |
| Score Total (Points) | 611 | 838 37% | 891 46% | 739 21% | 844 38% | 3488 471% |
| Copy ISO MB/s (MB/s) | 773 | 410.1 -47% | 255.9 -67% | 300.4 -61% | 1733 124% | |
| Copy Program MB/s (MB/s) | 327.9 | 127.6 -61% | 109.2 -67% | 157.4 -52% | 305.8 -7% | |
| Copy Game MB/s (MB/s) | 606 | 165.5 -73% | 129 -79% | 221.7 -63% | 405.5 -33% | |
| Totalt genomsnitt (program/inställningar) | 35% /
30% | 69% /
69% | 51% /
43% | 51% /
48% | 336% /
334% |
* ... mindre är bättre

| 3DMark 11 - 1280x720 Performance GPU | |
| Genomsnitt av klass Multimedia (3765 - 60002, n=62, senaste 2 åren) | |
| Asus VivoBook Pro 17 N705UD-EH76 | |
| Dell Inspiron 17-7786 | |
| HP Envy 17-ae143ng | |
| Acer Aspire 5 A517-51G-80L | |
| Dell Inspiron 17-7773-0043 | |
| Genomsnitt NVIDIA GeForce MX150 (2796 - 4905, n=47) | |
| Dell Inspiron 17 7778 | |
| 3DMark | |
| 1280x720 Cloud Gate Standard Graphics | |
| Genomsnitt av klass Multimedia (16765 - 143501, n=34, senaste 2 åren) | |
| Asus VivoBook Pro 17 N705UD-EH76 | |
| Dell Inspiron 17-7786 | |
| HP Envy 17-ae143ng | |
| Dell Inspiron 17-7773-0043 | |
| Genomsnitt NVIDIA GeForce MX150 (16227 - 22183, n=43) | |
| Acer Aspire 5 A517-51G-80L | |
| Dell Inspiron 17 7778 | |
| 1920x1080 Fire Strike Graphics | |
| Genomsnitt av klass Multimedia (2328 - 48907, n=66, senaste 2 åren) | |
| Asus VivoBook Pro 17 N705UD-EH76 | |
| HP Envy 17-ae143ng | |
| Dell Inspiron 17-7786 | |
| Acer Aspire 5 A517-51G-80L | |
| Dell Inspiron 17-7773-0043 | |
| Genomsnitt NVIDIA GeForce MX150 (2323 - 3739, n=44) | |
| Dell Inspiron 17 7778 | |
| 2560x1440 Time Spy Graphics | |
| Genomsnitt av klass Multimedia (696 - 19403, n=67, senaste 2 åren) | |
| HP Envy 17-ae143ng | |
| Dell Inspiron 17-7786 | |
| Genomsnitt NVIDIA GeForce MX150 (830 - 1147, n=16) | |
| 3DMark 06 Standard Score | 22583 poäng | |
| 3DMark 11 Performance | 4866 poäng | |
| 3DMark Ice Storm Standard Score | 65934 poäng | |
| 3DMark Cloud Gate Standard Score | 15737 poäng | |
| 3DMark Fire Strike Score | 3253 poäng | |
| 3DMark Fire Strike Extreme Score | 1646 poäng | |
| 3DMark Time Spy Score | 1141 poäng | |
Hjälp | ||
| låg | med. | hög | ultra | |
|---|---|---|---|---|
| BioShock Infinite (2013) | 179.4 | 109.6 | 92.9 | 34.6 |
| Dota 2 Reborn (2015) | 98.4 | 82.9 | 67.1 | 61.3 |
| Rise of the Tomb Raider (2016) | 58.9 | 41.9 | 23 | 19 |
| X-Plane 11.11 (2018) | 47.97 | 40.93 | 36.74 |
Ljudnivå
| Låg belastning |
| 30.7 / 30.7 / 30.7 dB(A) |
| Hårddisk |
| 31.1 dB(A) |
| Hög belastning |
| 33.4 / 38.7 dB(A) |
 | ||
30 dB tyst 40 dB(A) hörbar 50 dB(A) högt ljud |
||
min: | ||
| Dell Inspiron 17-7786 GeForce MX150, i7-8565U, KBG30ZMS128G | Dell Inspiron 17-7773-0043 GeForce MX150, i5-8550U, SanDisk X400 M.2 2280 128GB | Dell Inspiron 17 7778 GeForce 940MX, 6500U, Liteonit CV3-CE512 | HP Envy 17-ae143ng GeForce MX150, i5-8250U, Liteonit CV3-8D128 | Acer Aspire 5 A517-51G-80L GeForce MX150, i5-8550U, Micron 1100 MTFDDAV256TBN | Asus VivoBook Pro 17 N705UD-EH76 GeForce GTX 1050 Mobile, i5-8550U, Samsung PM961 NVMe MZVLW512HMJP | |
|---|---|---|---|---|---|---|
| Noise | -5% | -10% | -156% | 3% | 1% | |
| av / miljö * (dB) | 30.3 | 30.3 -0% | 32.1 -6% | 304 -903% | 29.4 3% | 28.3 7% |
| Idle Minimum * (dB) | 30.7 | 30.6 -0% | 32.1 -5% | 31.9 -4% | 30.1 2% | 28.3 8% |
| Idle Average * (dB) | 30.7 | 30.6 -0% | 32.1 -5% | 31.9 -4% | 30.1 2% | 29 6% |
| Idle Maximum * (dB) | 30.7 | 32.2 -5% | 34 -11% | 31.9 -4% | 29.7 3% | 29 6% |
| Load Average * (dB) | 33.4 | 40.5 -21% | 40.3 -21% | 39.4 -18% | 34.4 -3% | 36.7 -10% |
| Load Maximum * (dB) | 38.7 | 39.5 -2% | 42.6 -10% | 39.7 -3% | 34.4 11% | 42.8 -11% |
| Witcher 3 ultra * (dB) | 44.7 |
* ... mindre är bättre
(±) Den maximala temperaturen på ovansidan är 42.1 °C / 108 F, jämfört med genomsnittet av 36.8 °C / 98 F , allt från 21 till 71 °C för klassen Multimedia.
(±) Botten värms upp till maximalt 43 °C / 109 F, jämfört med genomsnittet av 39.1 °C / 102 F
(+) Vid tomgångsbruk är medeltemperaturen för ovansidan 23.1 °C / 74 F, jämfört med enhetsgenomsnittet på 31.3 °C / ### class_avg_f### F.
(+) Handledsstöden och pekplattan är kallare än hudtemperaturen med maximalt 29.4 °C / 84.9 F och är därför svala att ta på.
(±) Medeltemperaturen för handledsstödsområdet på liknande enheter var 28.7 °C / 83.7 F (-0.7 °C / -1.2 F).
| Dell Inspiron 17-7786 GeForce MX150, i7-8565U, KBG30ZMS128G | Dell Inspiron 17-7773-0043 GeForce MX150, i5-8550U, SanDisk X400 M.2 2280 128GB | Dell Inspiron 17 7778 GeForce 940MX, 6500U, Liteonit CV3-CE512 | HP Envy 17-ae143ng GeForce MX150, i5-8250U, Liteonit CV3-8D128 | Acer Aspire 5 A517-51G-80L GeForce MX150, i5-8550U, Micron 1100 MTFDDAV256TBN | Asus VivoBook Pro 17 N705UD-EH76 GeForce GTX 1050 Mobile, i5-8550U, Samsung PM961 NVMe MZVLW512HMJP | |
|---|---|---|---|---|---|---|
| Heat | -13% | -18% | 1% | 3% | -29% | |
| Maximum Upper Side * (°C) | 42.1 | 42.7 -1% | 44.7 -6% | 36 14% | 40.4 4% | 46 -9% |
| Maximum Bottom * (°C) | 43 | 47.2 -10% | 45.5 -6% | 37.6 13% | 37 14% | 56.2 -31% |
| Idle Upper Side * (°C) | 24 | 28.4 -18% | 31 -29% | 26.2 -9% | 25.3 -5% | 28.6 -19% |
| Idle Bottom * (°C) | 24.2 | 29.7 -23% | 31.4 -30% | 27.8 -15% | 24.7 -2% | 37.6 -55% |
* ... mindre är bättre
Dell Inspiron 17-7786 ljudanalys
(-) | inte särskilt höga högtalare (68.8 dB)
Bas 100 - 315 Hz
(-) | nästan ingen bas - i genomsnitt 15.5% lägre än medianen
(+) | basen är linjär (6.4% delta till föregående frekvens)
Mellan 400 - 2000 Hz
(+) | balanserad mellan - endast 2.9% från medianen
(+) | mids är linjära (3.7% delta till föregående frekvens)
Högsta 2 - 16 kHz
(+) | balanserade toppar - endast 3.4% från medianen
(+) | toppar är linjära (4.1% delta till föregående frekvens)
Totalt 100 - 16 000 Hz
(±) | linjäriteten för det totala ljudet är genomsnittlig (16.6% skillnad mot median)
Jämfört med samma klass
» 44% av alla testade enheter i den här klassen var bättre, 7% liknande, 49% sämre
» Den bästa hade ett delta på 5%, genomsnittet var 17%, sämst var 45%
Jämfört med alla testade enheter
» 29% av alla testade enheter var bättre, 6% liknande, 66% sämre
» Den bästa hade ett delta på 4%, genomsnittet var 24%, sämst var 134%
Asus VivoBook Pro 17 N705UD-EH76 ljudanalys
(±) | högtalarljudstyrkan är genomsnittlig men bra (79.2 dB)
Bas 100 - 315 Hz
(±) | reducerad bas - i genomsnitt 8.8% lägre än medianen
(±) | linjäriteten för basen är genomsnittlig (14.1% delta till föregående frekvens)
Mellan 400 - 2000 Hz
(+) | balanserad mellan - endast 1.8% från medianen
(+) | mids är linjära (4.1% delta till föregående frekvens)
Högsta 2 - 16 kHz
(+) | balanserade toppar - endast 1.6% från medianen
(+) | toppar är linjära (3% delta till föregående frekvens)
Totalt 100 - 16 000 Hz
(+) | det totala ljudet är linjärt (11.7% skillnad mot median)
Jämfört med samma klass
» 19% av alla testade enheter i den här klassen var bättre, 3% liknande, 77% sämre
» Den bästa hade ett delta på 5%, genomsnittet var 17%, sämst var 45%
Jämfört med alla testade enheter
» 8% av alla testade enheter var bättre, 3% liknande, 89% sämre
» Den bästa hade ett delta på 4%, genomsnittet var 24%, sämst var 134%
| Av/Standby | |
| Låg belastning | |
| Hög belastning |
|
Förklaring:
min: | |
| Dell Inspiron 17-7786 i7-8565U, GeForce MX150, KBG30ZMS128G, IPS, 1920x1080, 17.3" | Dell Inspiron 17-7773-0043 i5-8550U, GeForce MX150, SanDisk X400 M.2 2280 128GB, IPS, 1920x1080, 17.3" | Dell Inspiron 17 7778 6500U, GeForce 940MX, Liteonit CV3-CE512, IPS, 1920x1080, 17.3" | HP Envy 17-ae143ng i5-8250U, GeForce MX150, Liteonit CV3-8D128, IPS, 1920x1080, 17.3" | Acer Aspire 5 A517-51G-80L i5-8550U, GeForce MX150, Micron 1100 MTFDDAV256TBN, aSi TFT, IPS, 1920x1080, 17.3" | Asus VivoBook Pro 17 N705UD-EH76 i5-8550U, GeForce GTX 1050 Mobile, Samsung PM961 NVMe MZVLW512HMJP, IPS, 1920x1080, 17.3" | Genomsnitt NVIDIA GeForce MX150 | Genomsnitt av klass Multimedia | |
|---|---|---|---|---|---|---|---|---|
| Power Consumption | -11% | -2% | -5% | 2% | -24% | 7% | -26% | |
| Idle Minimum * (Watt) | 4.2 | 5.5 -31% | 5.6 -33% | 4.8 -14% | 4.1 2% | 5.06 -20% | 4.48 ? -7% | 5.71 ? -36% |
| Idle Average * (Watt) | 9.4 | 11.6 -23% | 11.2 -19% | 8.3 12% | 9.3 1% | 10.3 -10% | 7.88 ? 16% | 10.1 ? -7% |
| Idle Maximum * (Watt) | 12.9 | 12.4 4% | 11.9 8% | 10.3 20% | 9.8 24% | 10.7 17% | 9.76 ? 24% | 12.4 ? 4% |
| Load Average * (Watt) | 56 | 65 -16% | 46 18% | 61 -9% | 64 -14% | 83 -48% | 54.7 ? 2% | 65 ? -16% |
| Load Maximum * (Watt) | 63.4 | 56 12% | 53 16% | 86 -36% | 66.4 -5% | 99.9 -58% | 63.5 ? -0% | 112.2 ? -77% |
| Witcher 3 ultra * (Watt) | 92.4 |
* ... mindre är bättre
| Dell Inspiron 17-7786 i7-8565U, GeForce MX150, 56 Wh | Dell Inspiron 17-7773-0043 i5-8550U, GeForce MX150, 56 Wh | Dell Inspiron 17 7778 6500U, GeForce 940MX, 56 Wh | HP Envy 17-ae143ng i5-8250U, GeForce MX150, 55.8 Wh | Acer Aspire 5 A517-51G-80L i5-8550U, GeForce MX150, 48 Wh | Asus VivoBook Pro 17 N705UD-EH76 i5-8550U, GeForce GTX 1050 Mobile, 42 Wh | Genomsnitt av klass Multimedia | |
|---|---|---|---|---|---|---|---|
| Batteridrifttid | -19% | -18% | -10% | -36% | -58% | 41% | |
| Reader / Idle (h) | 16.6 | 14.7 -11% | 13.5 -19% | 9.3 -44% | 25.2 ? 52% | ||
| H.264 (h) | 7.7 | 6.2 -19% | 5.4 -30% | 16.4 ? 113% | |||
| WiFi v1.3 (h) | 9 | 6.8 -24% | 8.3 -8% | 8.1 -10% | 6.3 -30% | 4.4 -51% | 12 ? 33% |
| Load (h) | 2.5 | 2 -20% | 1.8 -28% | 1.5 -40% | 0.9 -64% | 1.675 ? -33% |
För
Emot
Läs den fullständiga versionen av den här recensionen på engelska här.
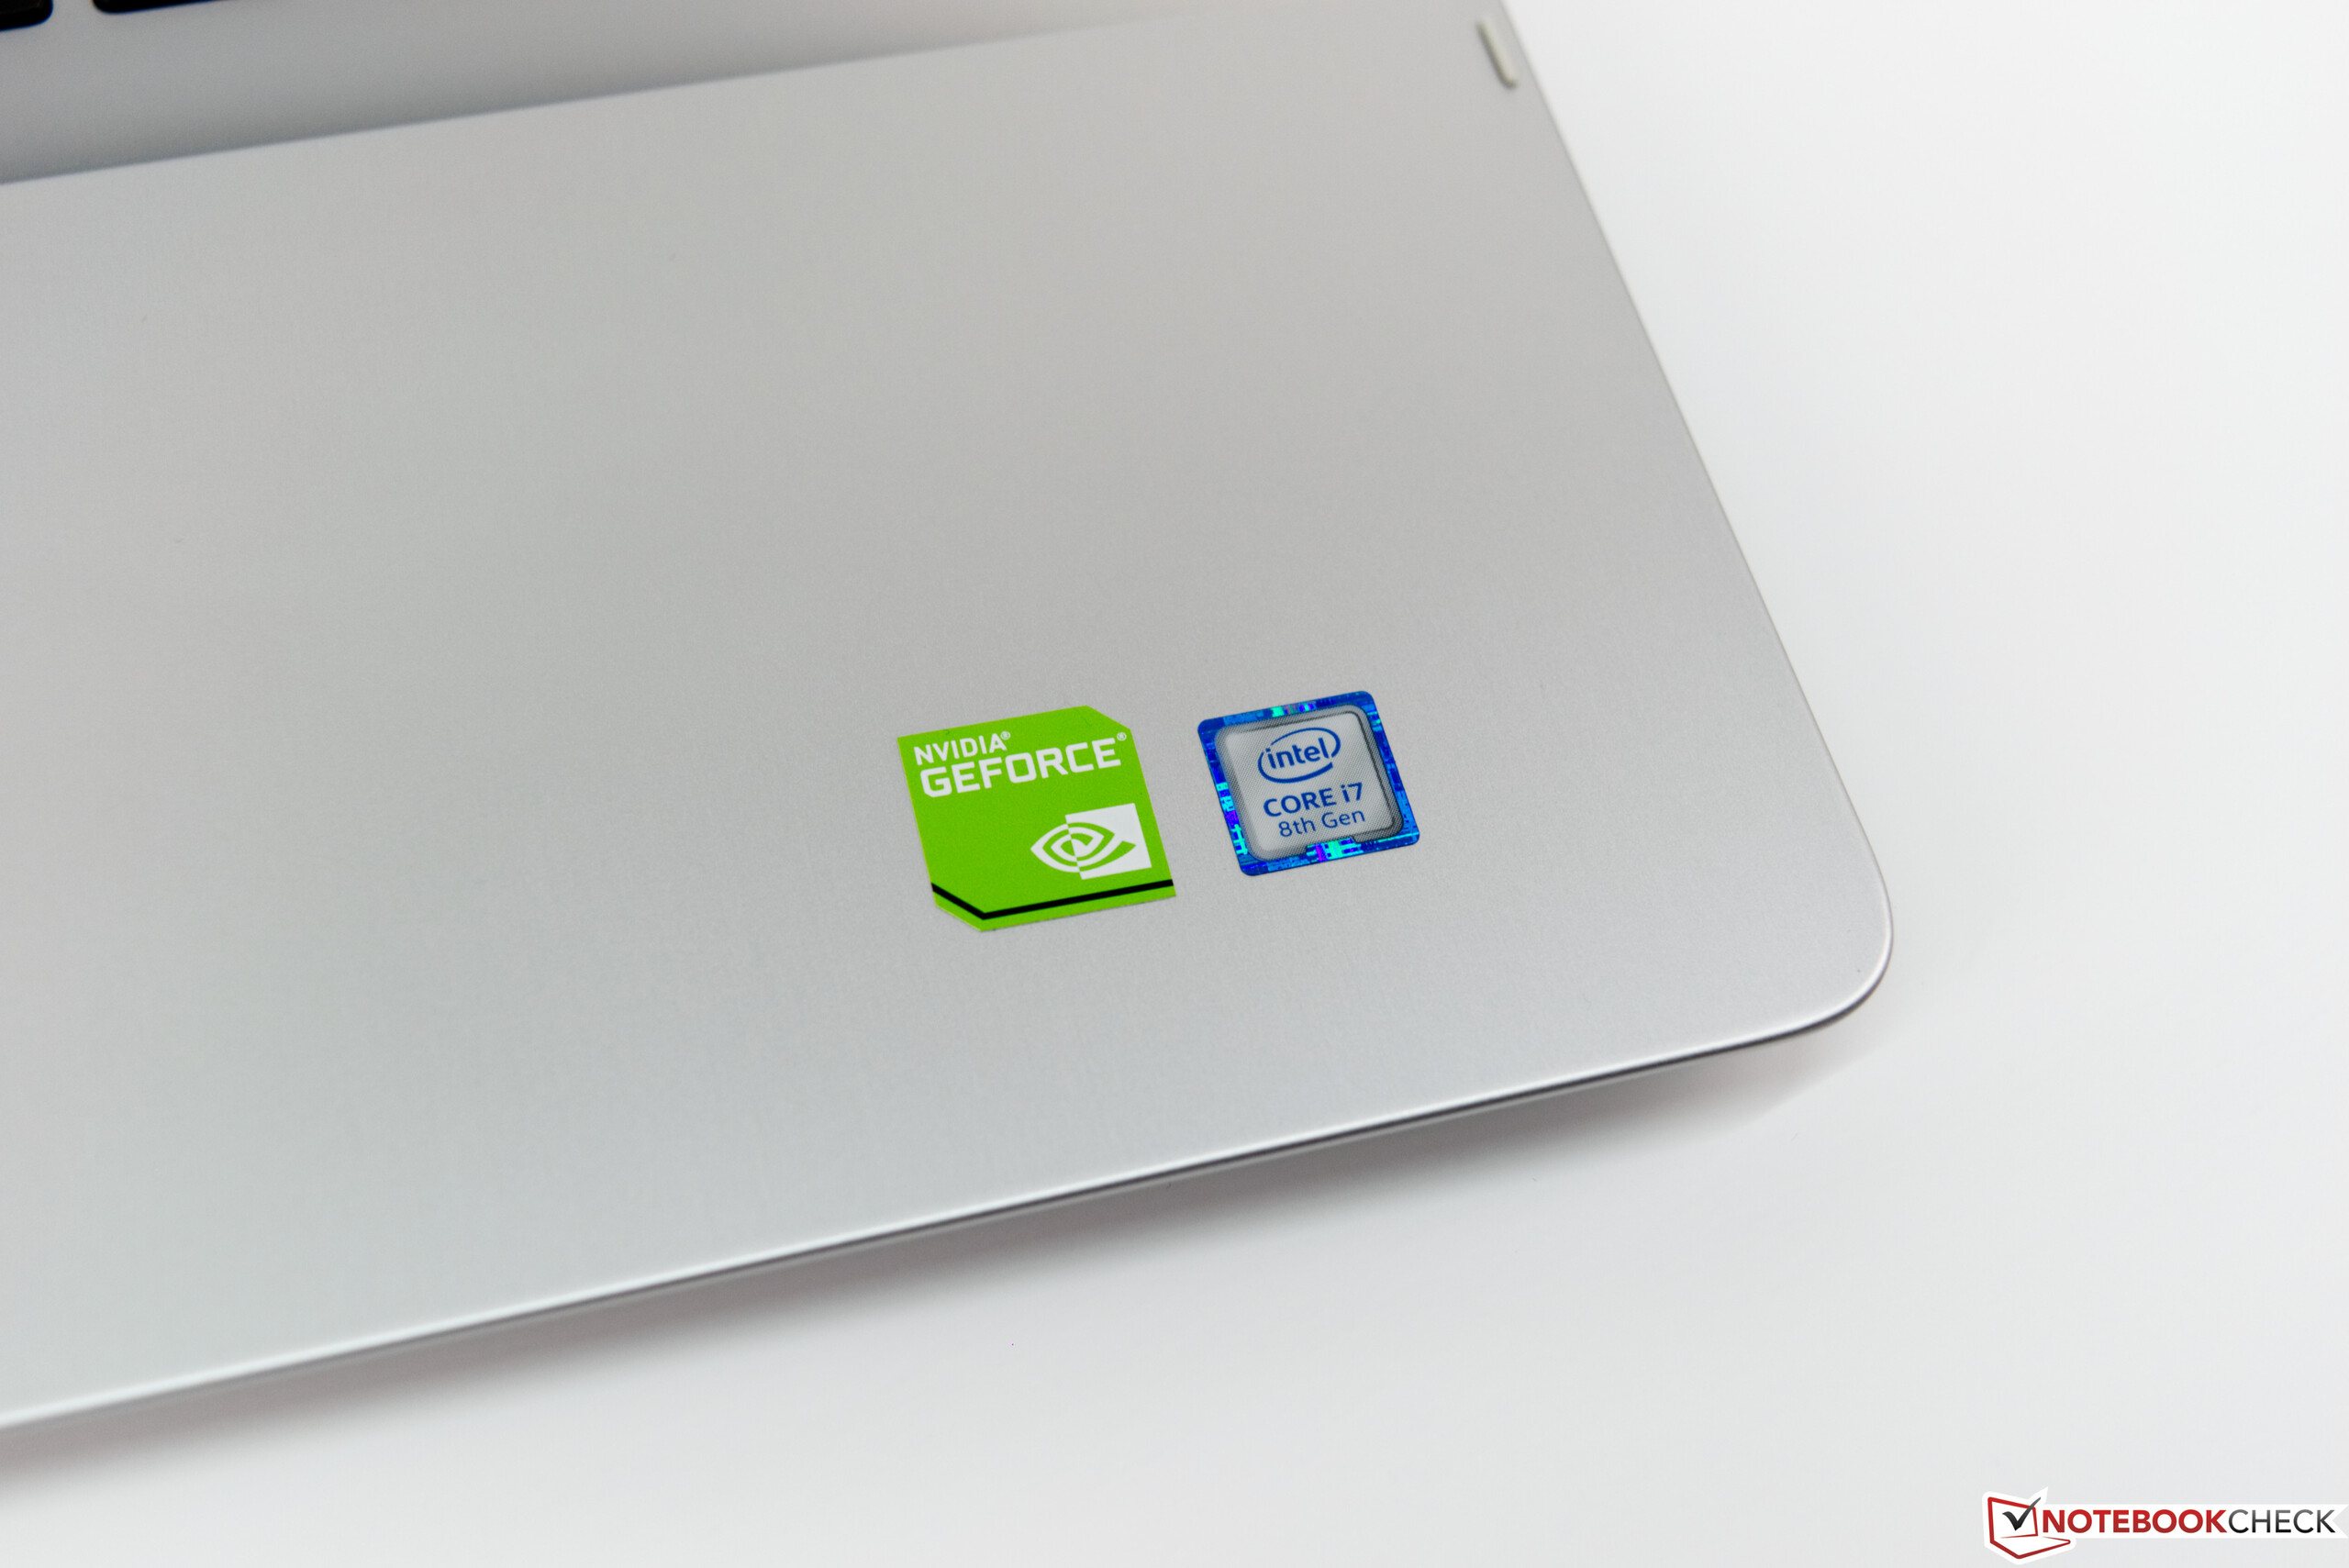
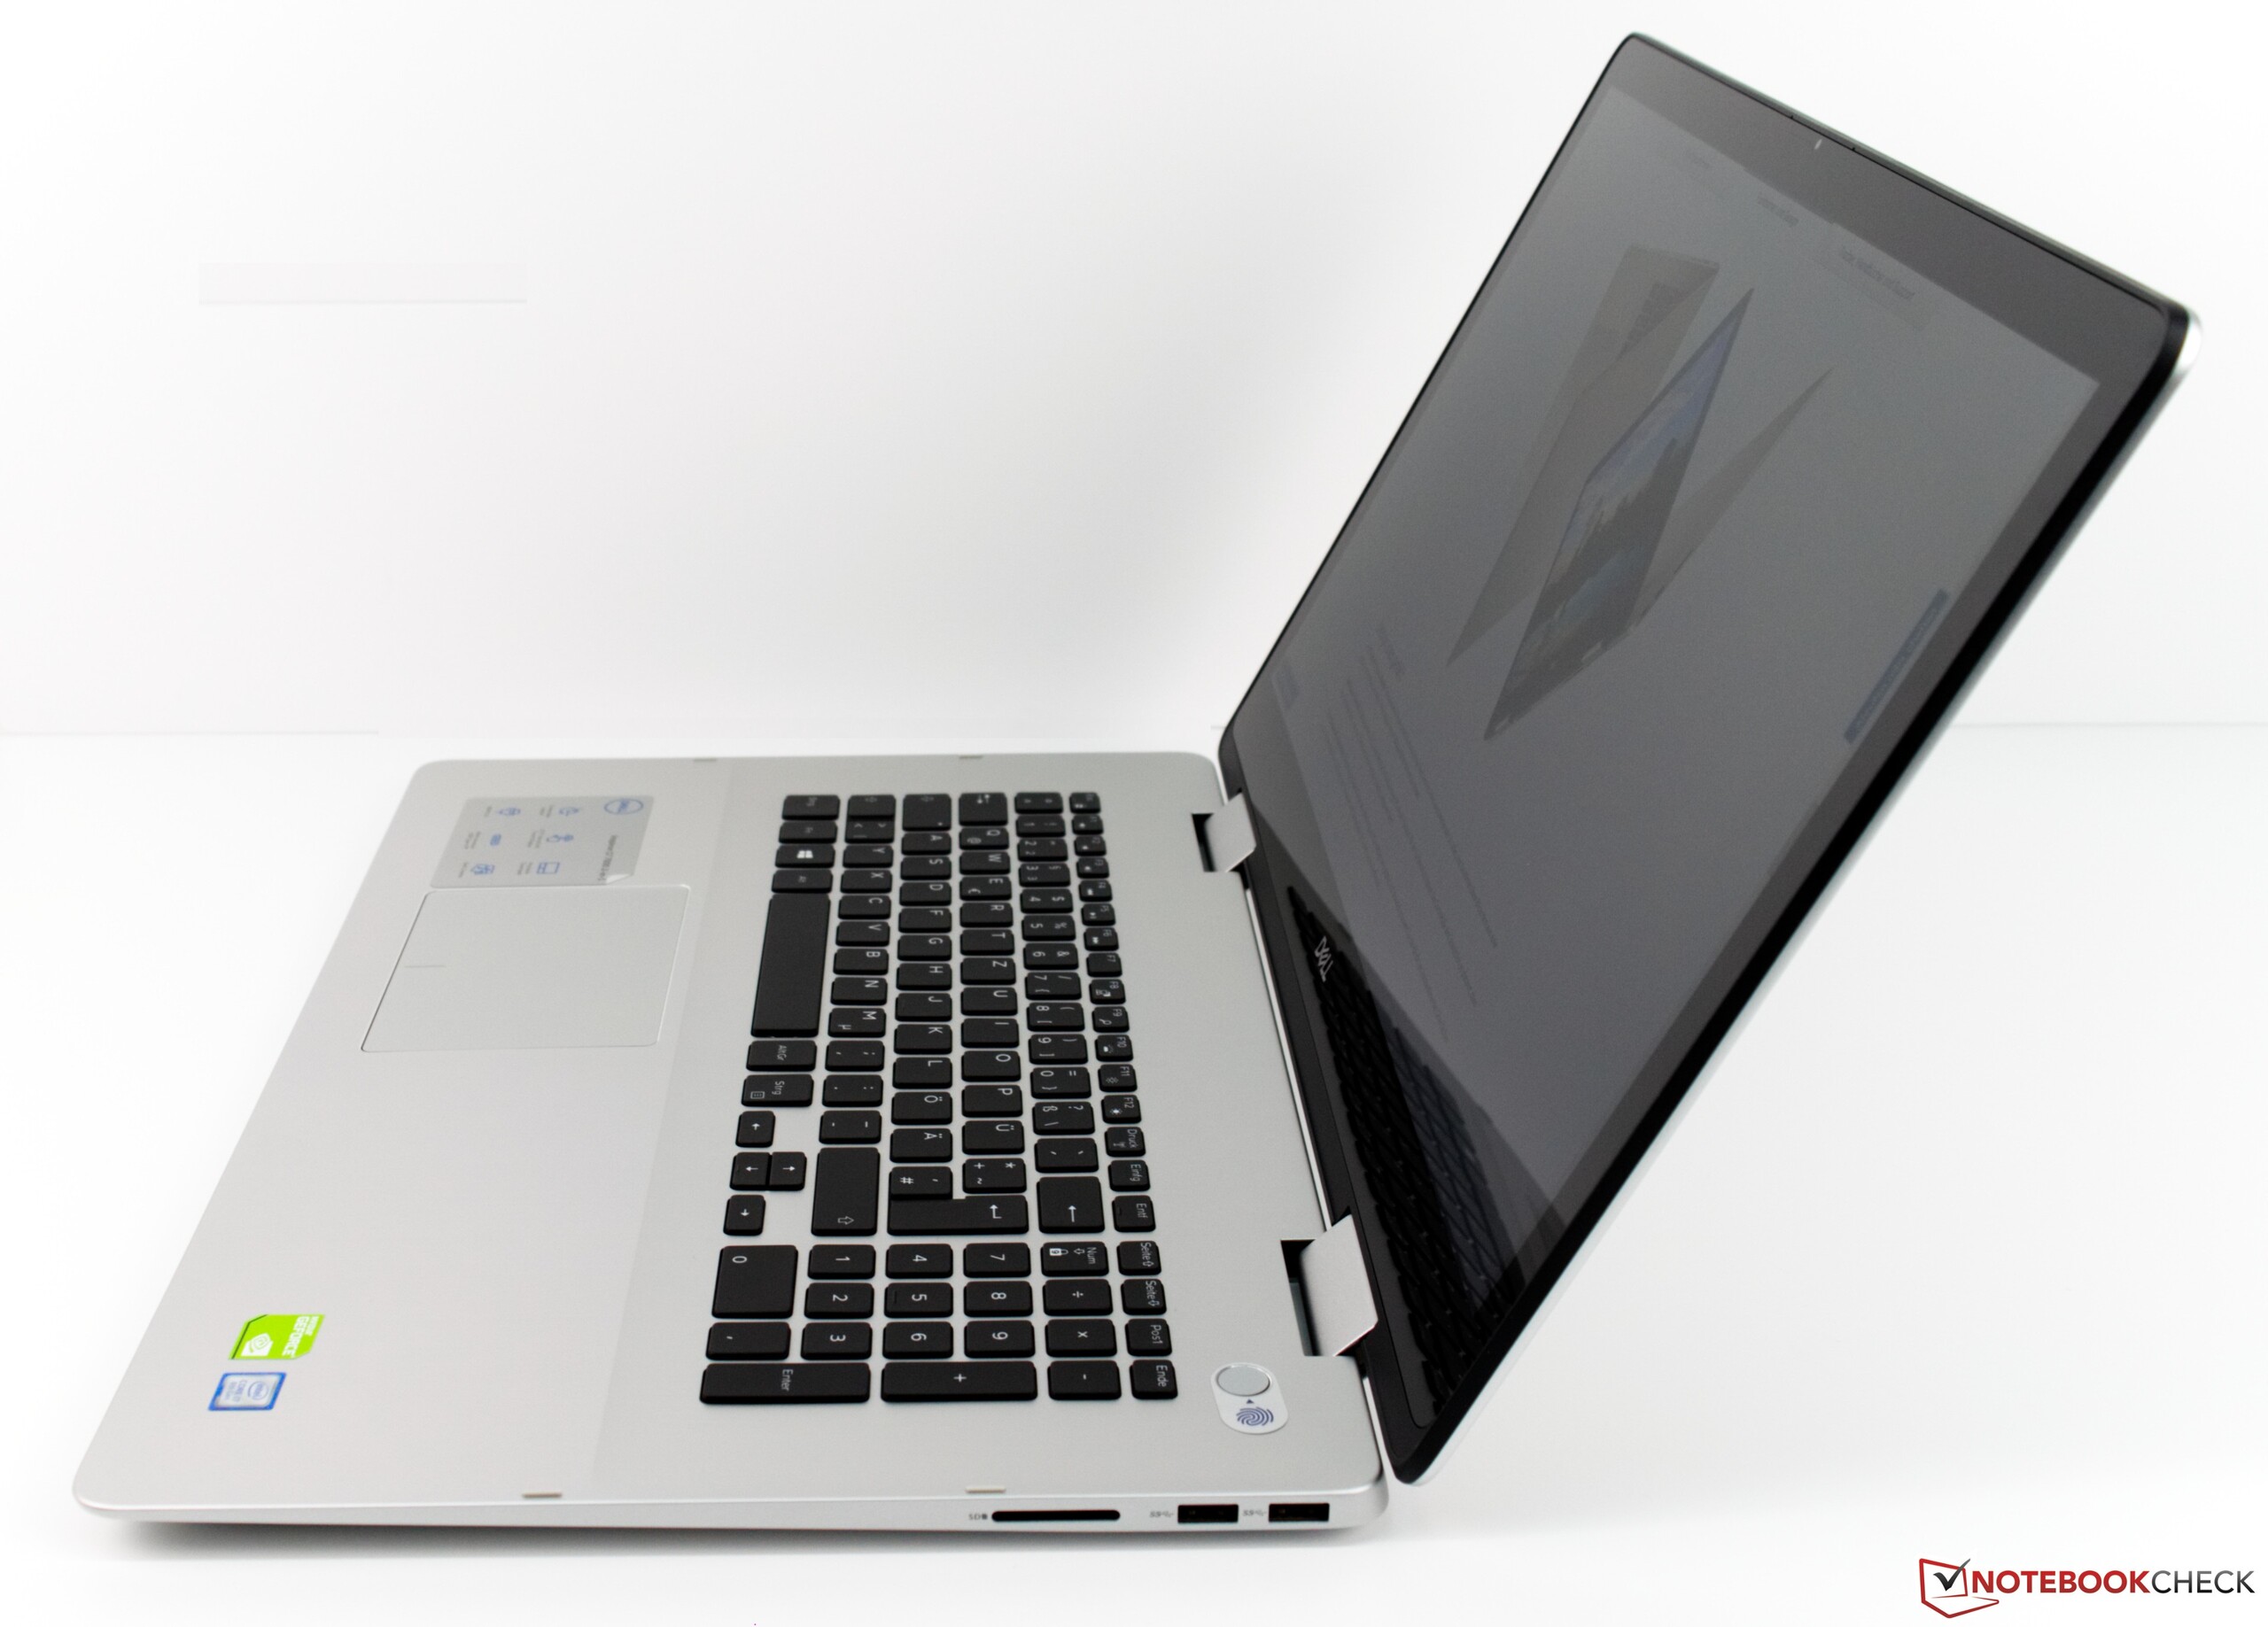
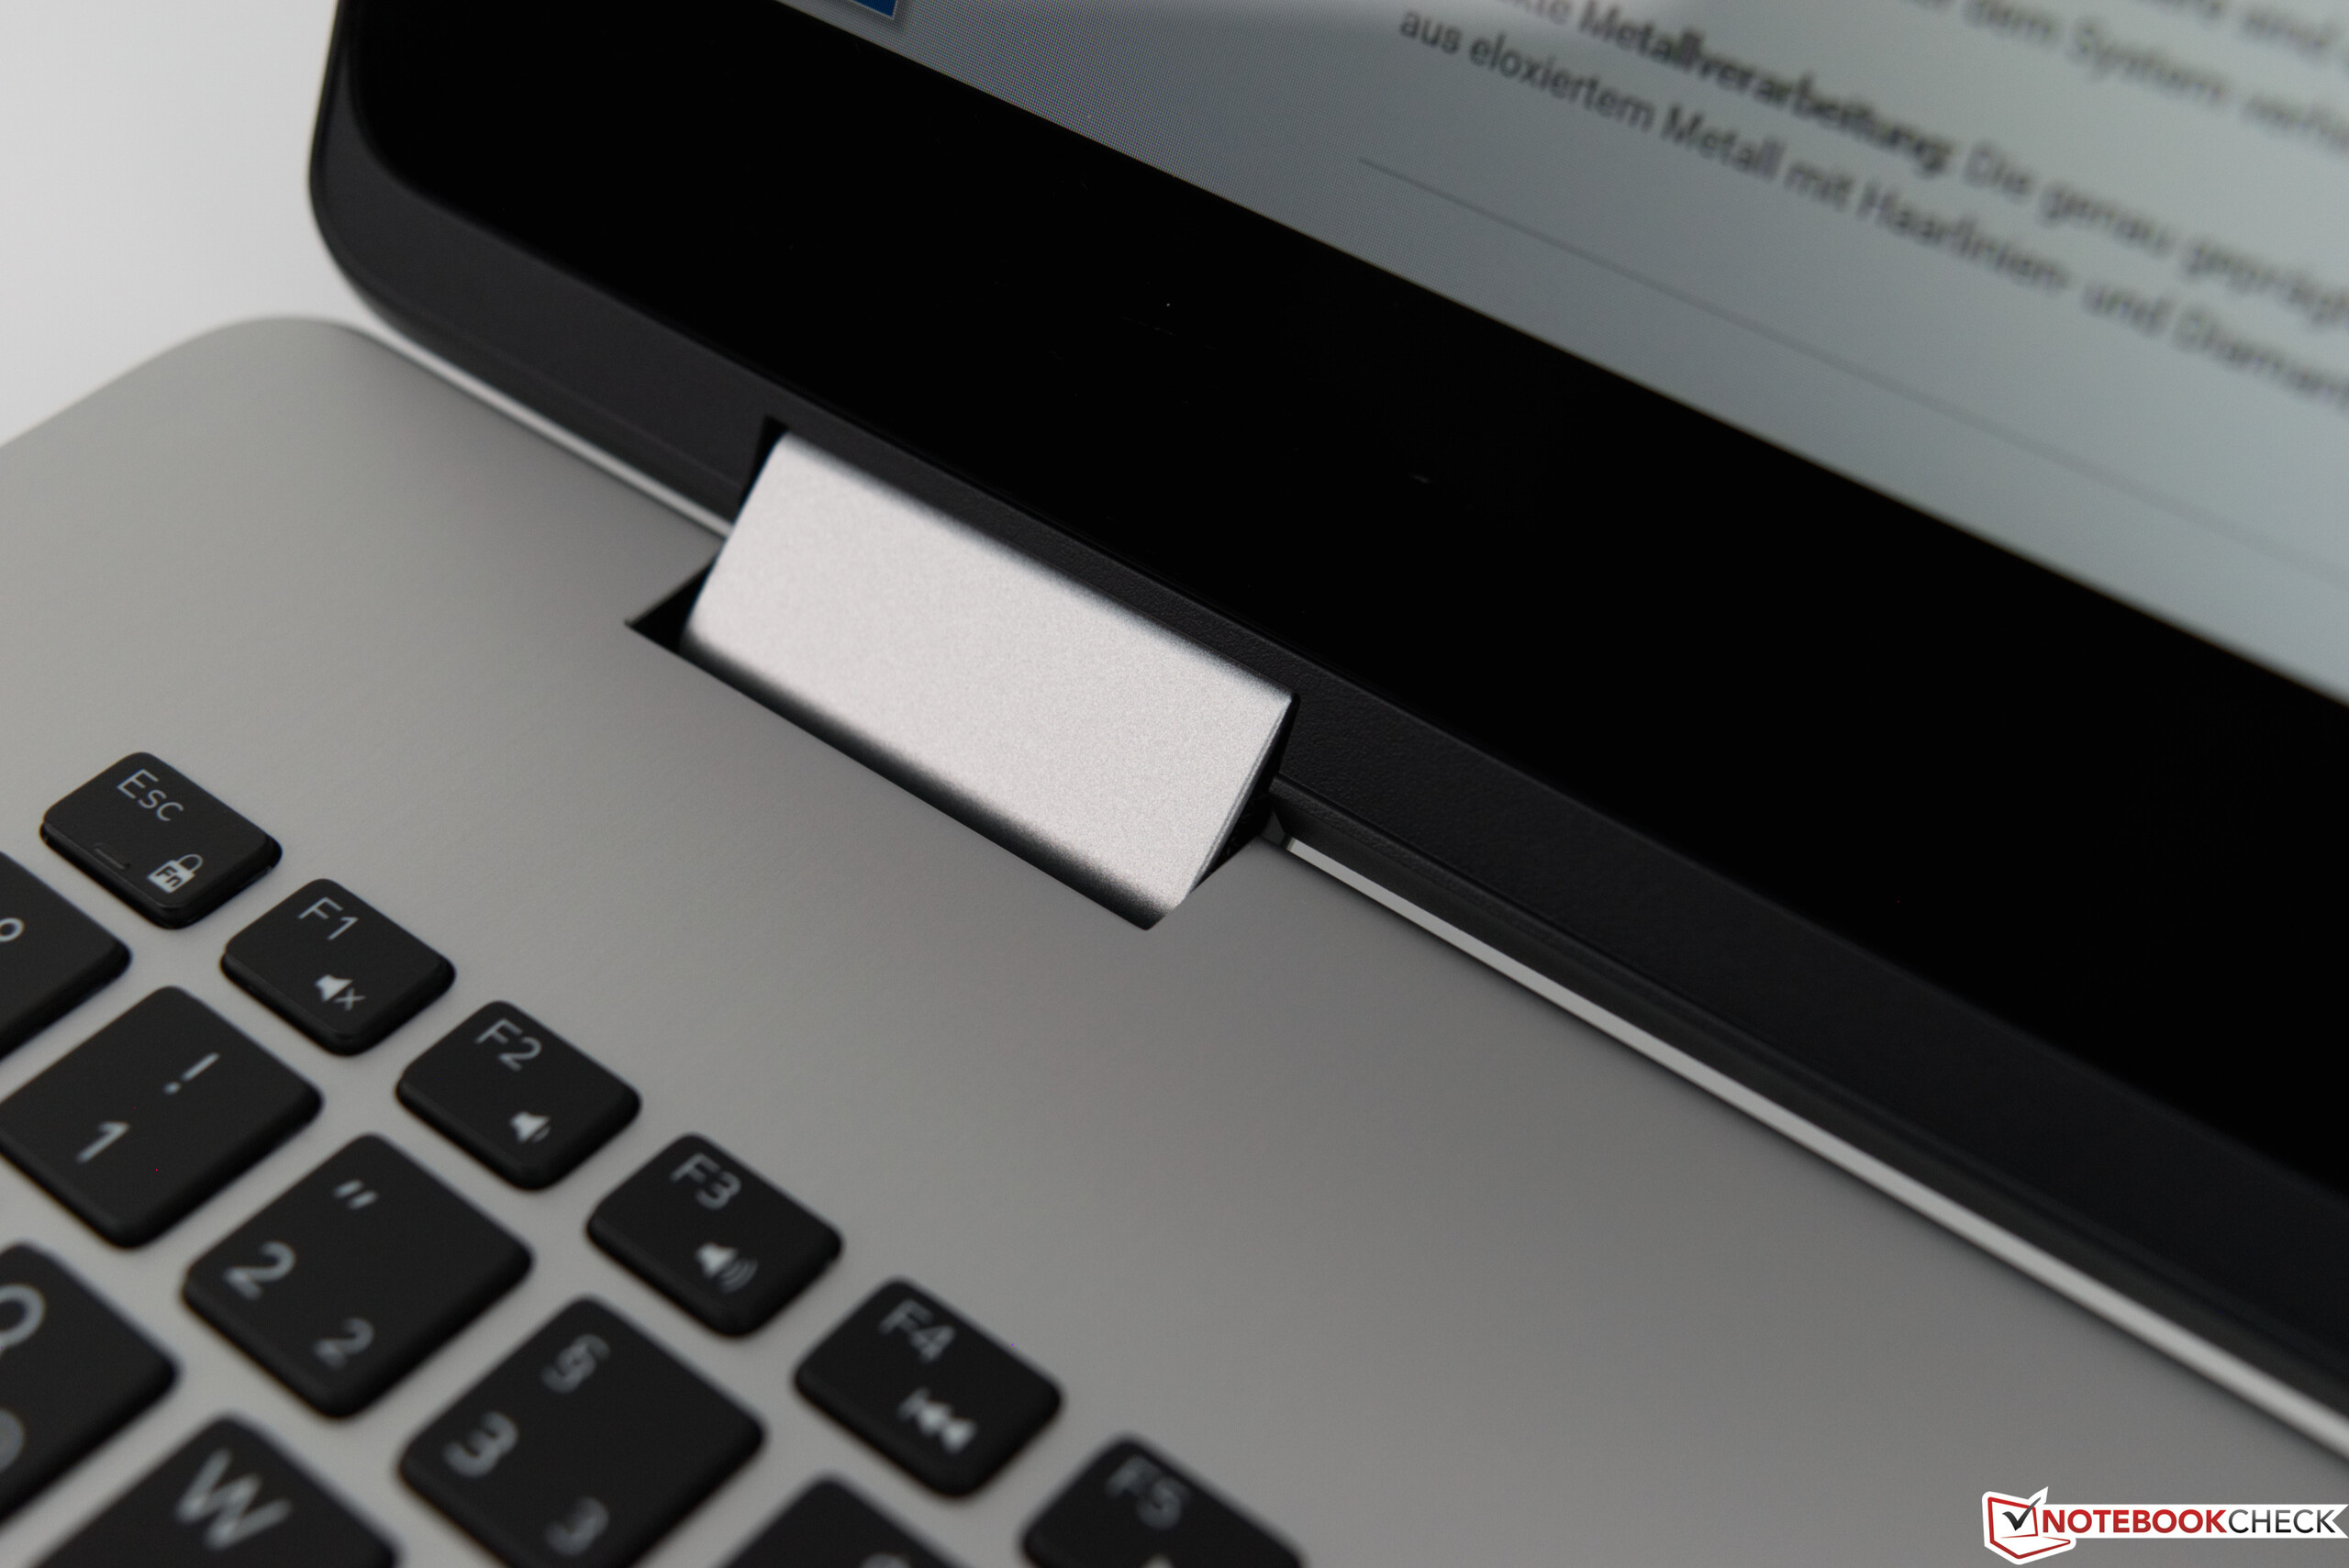
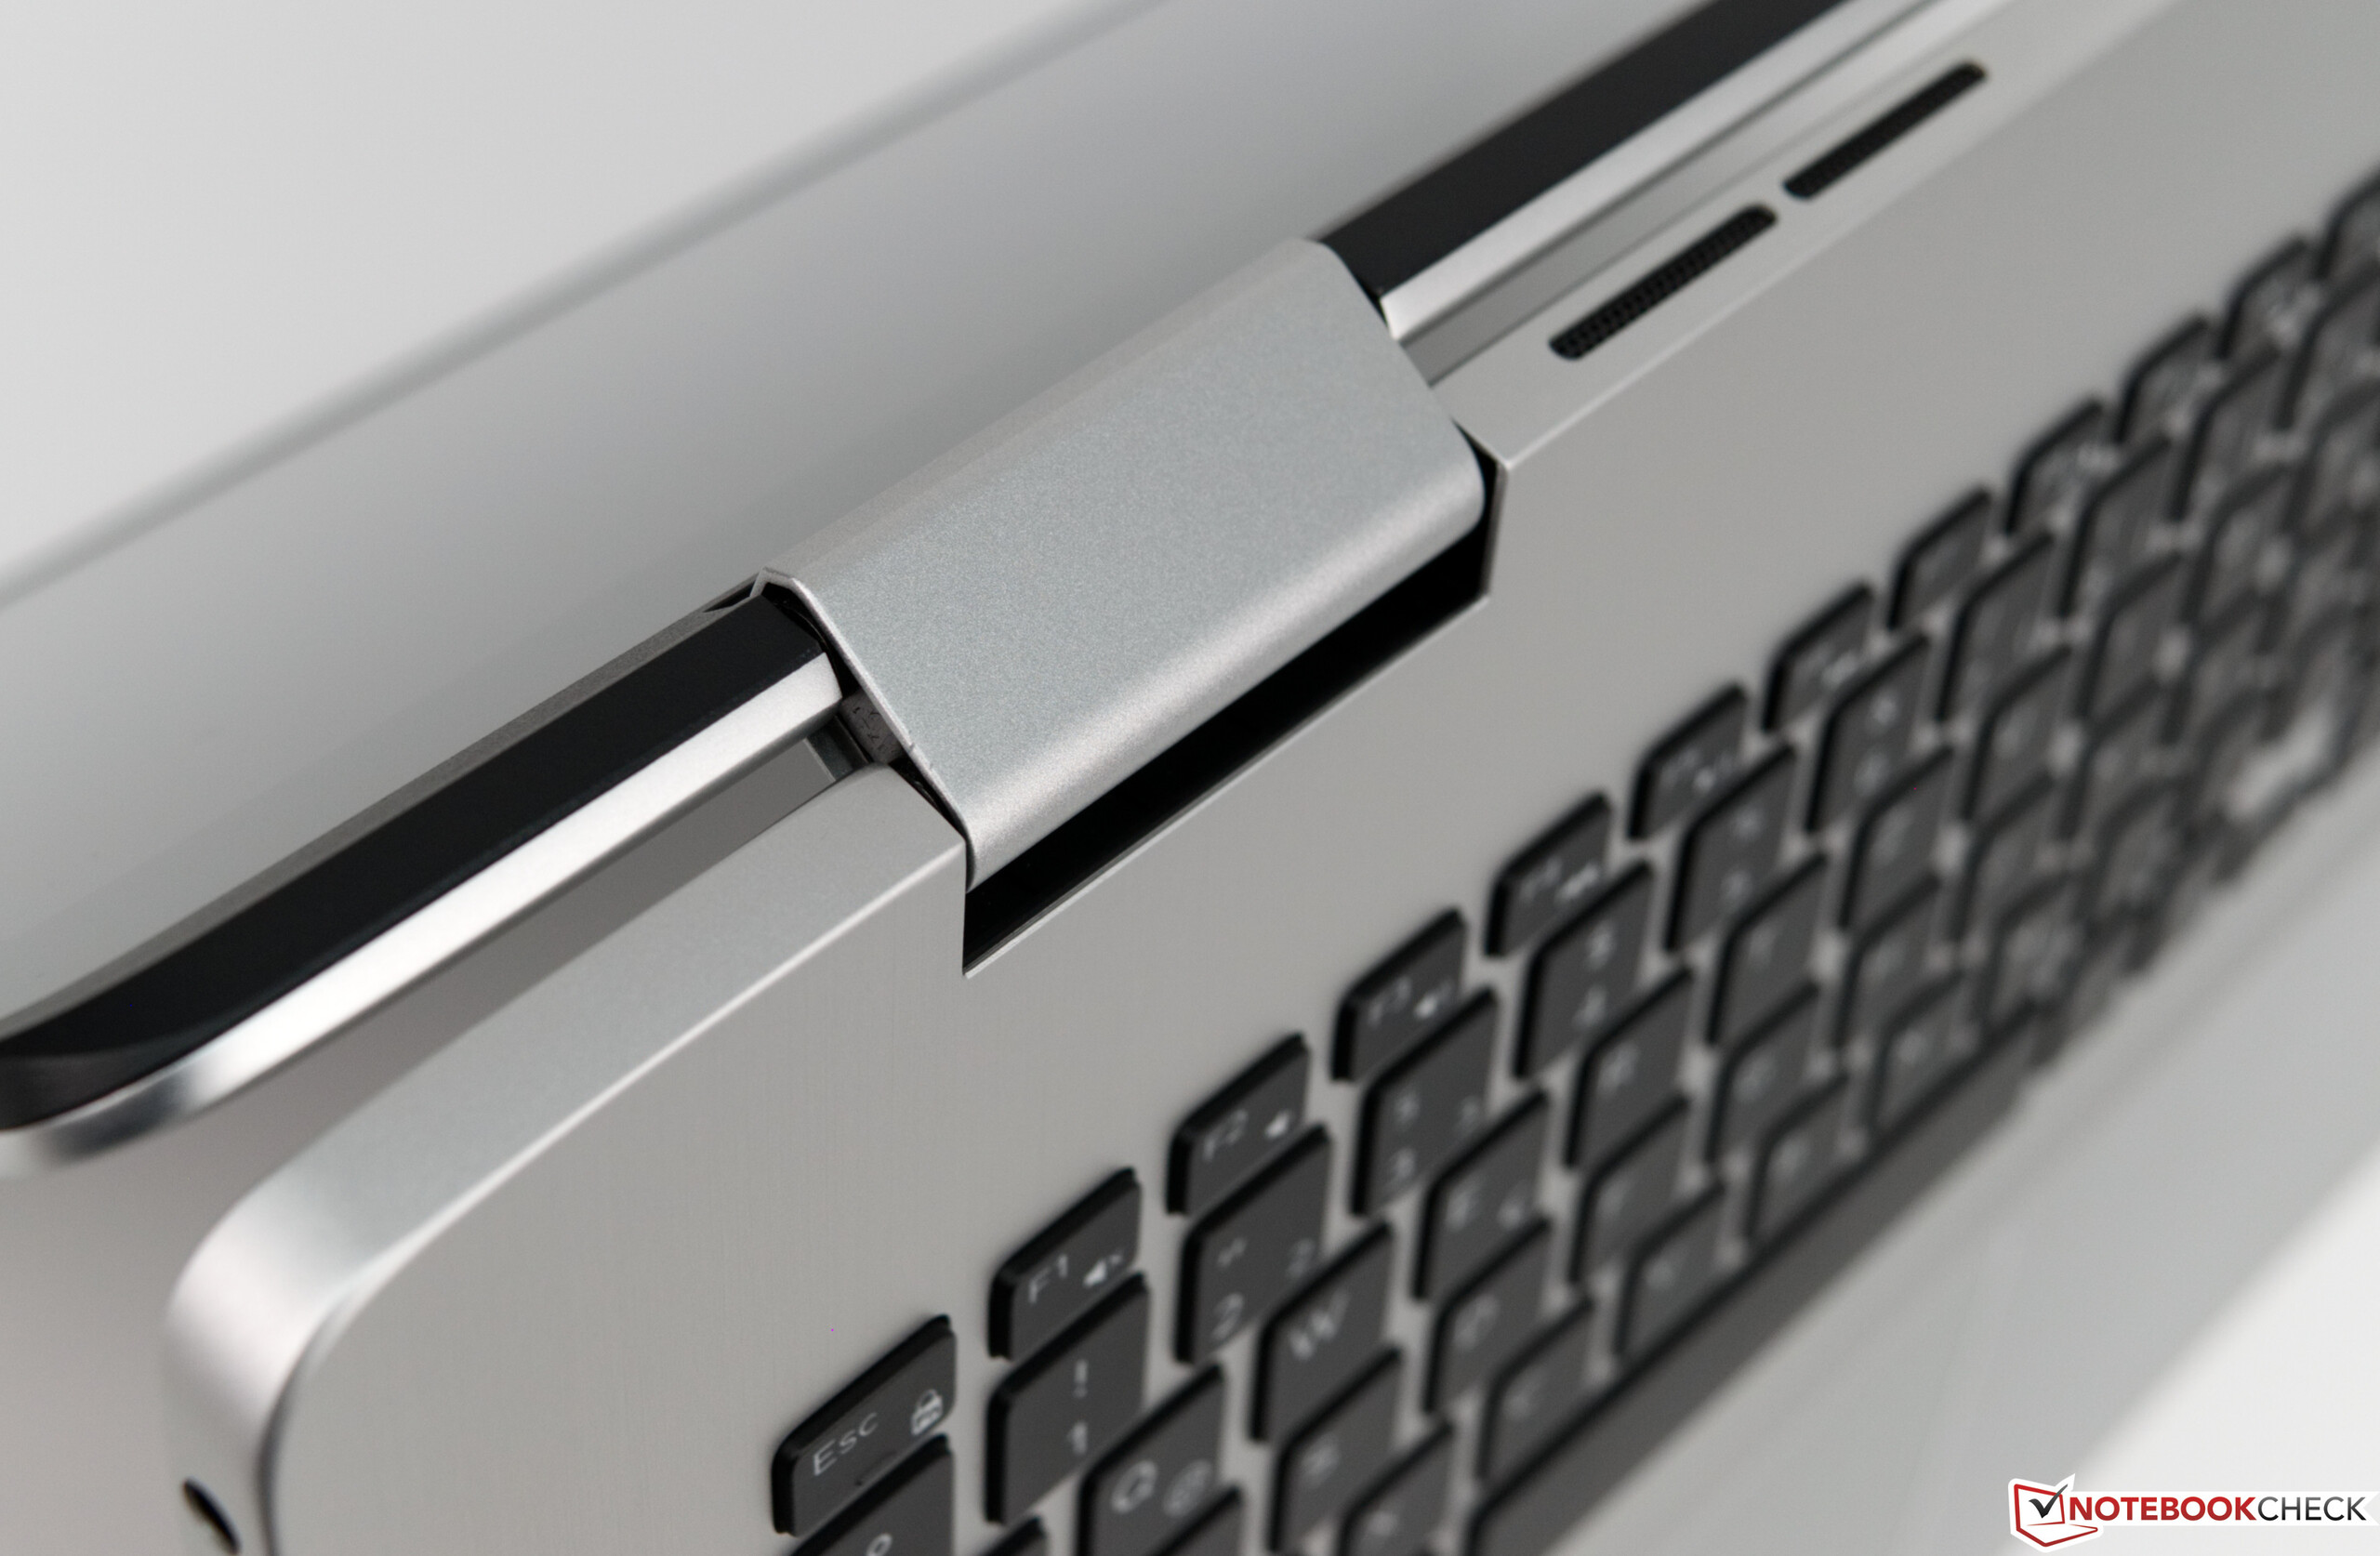
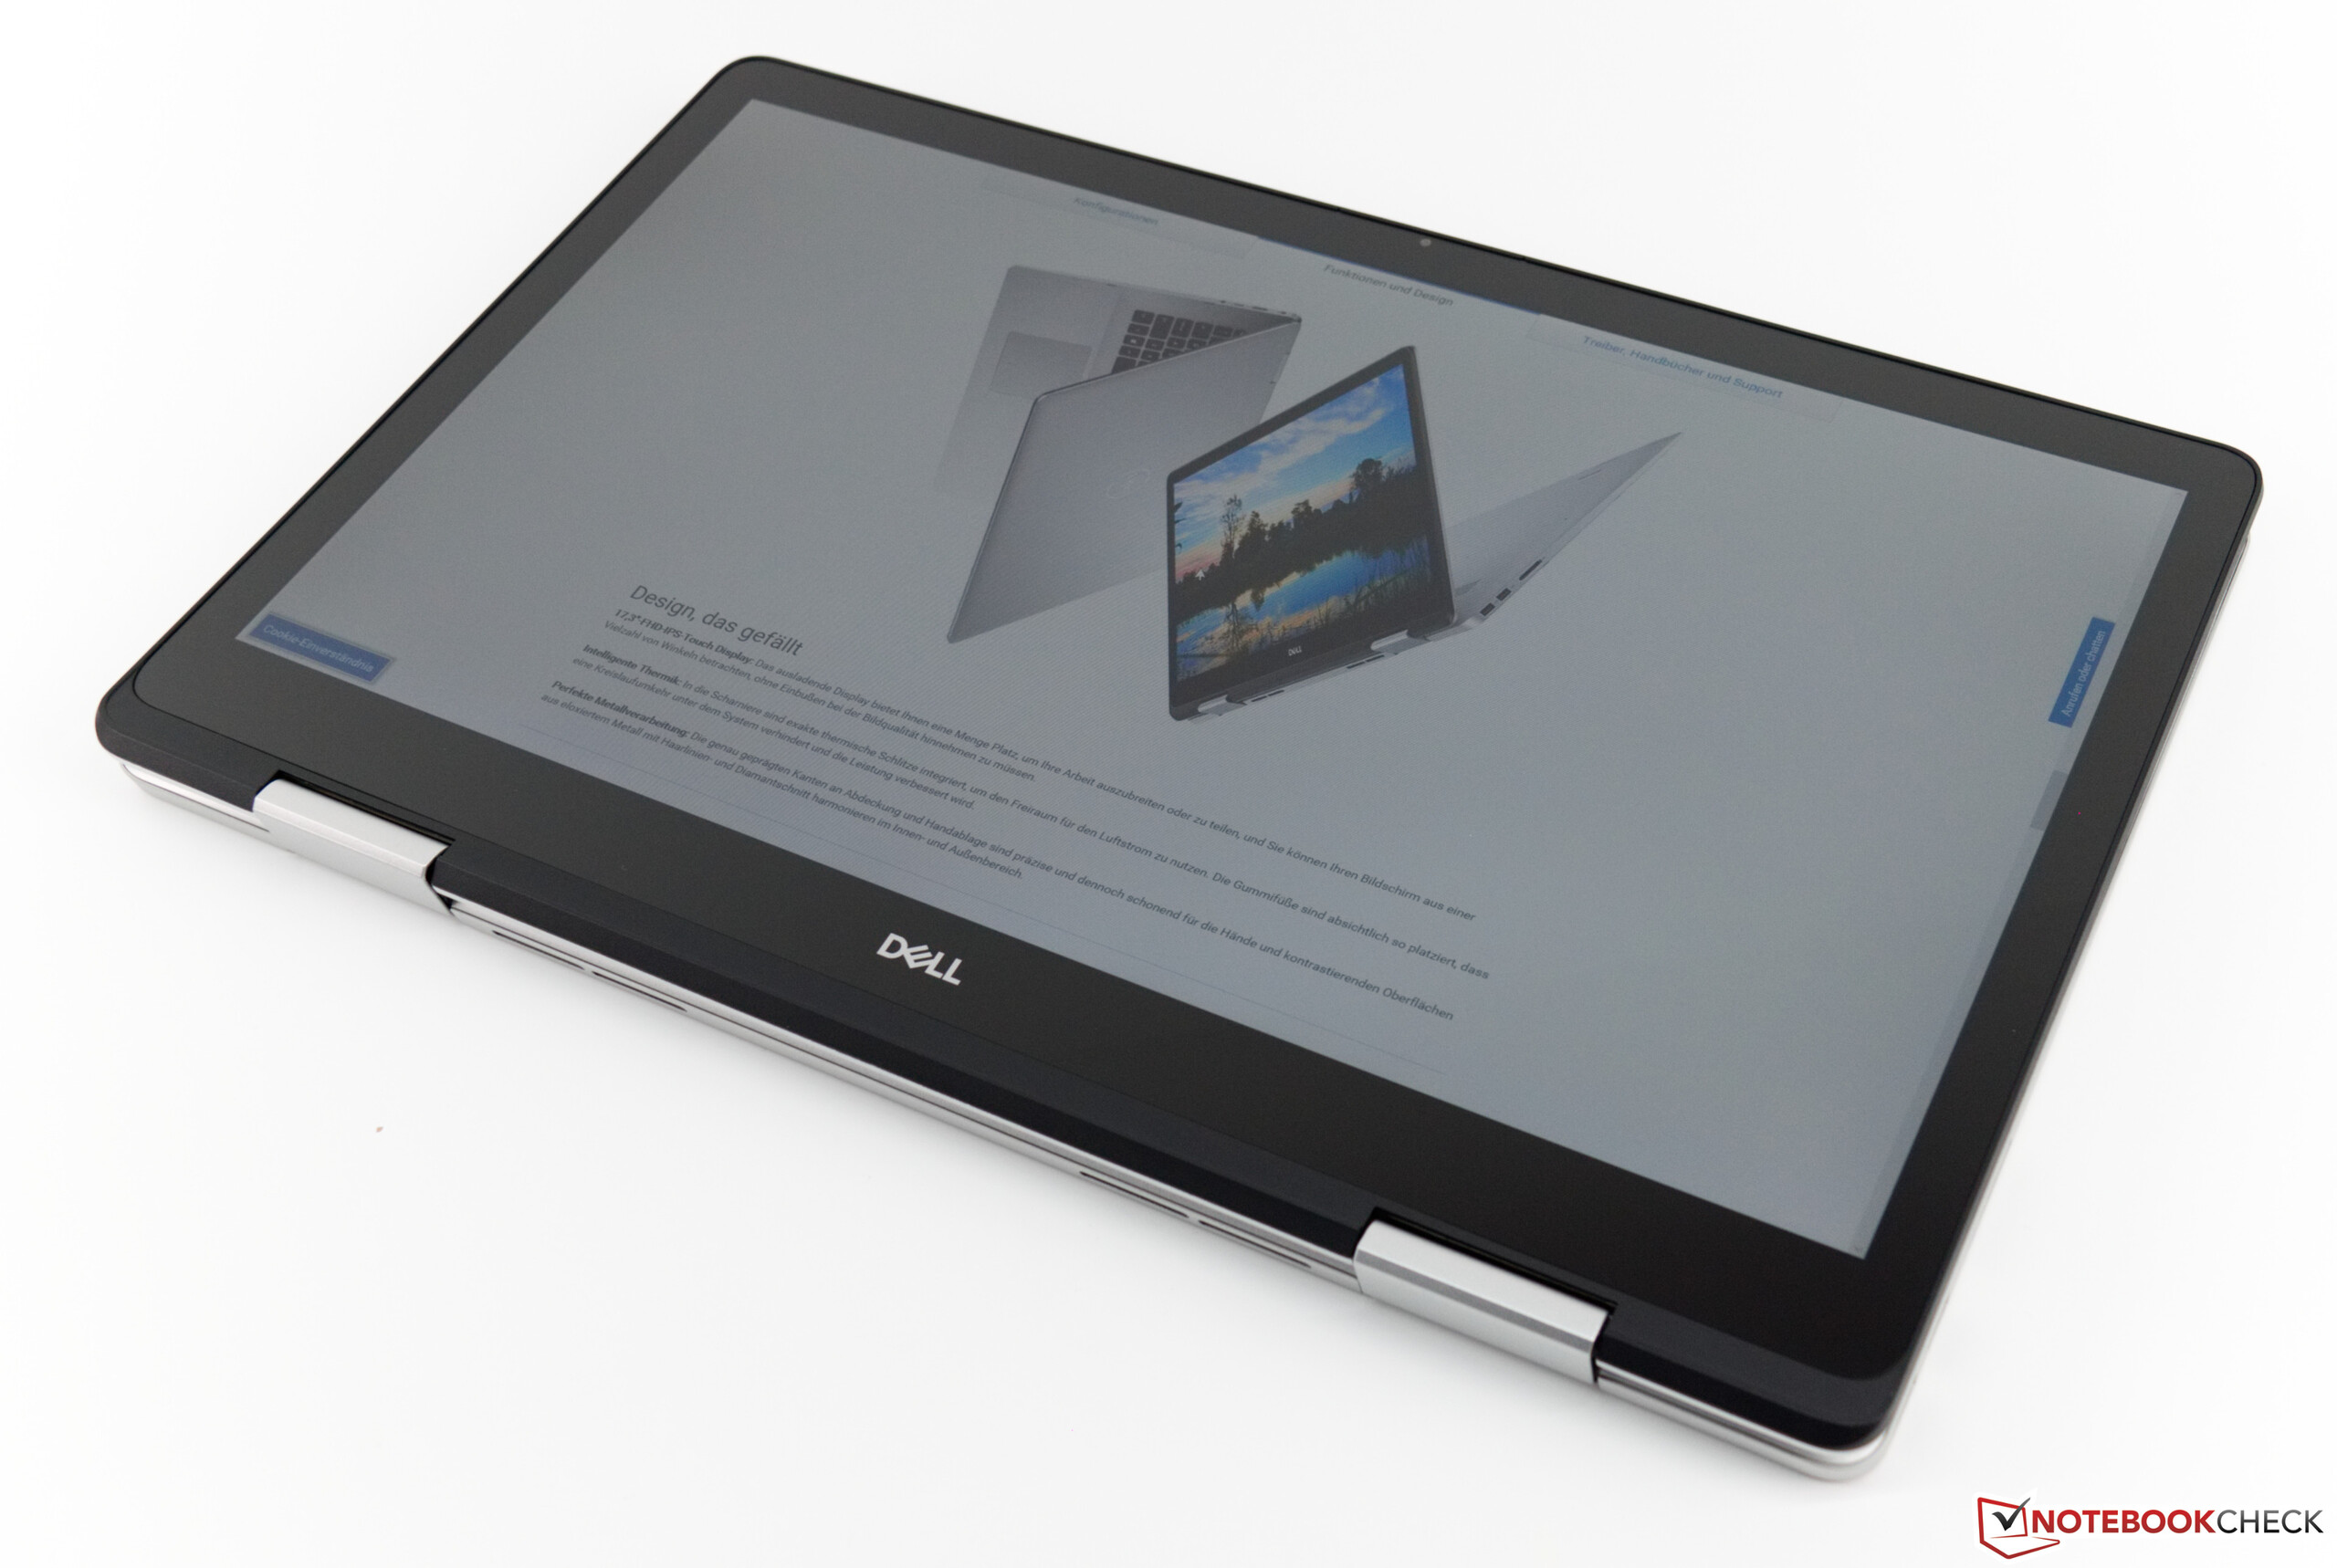
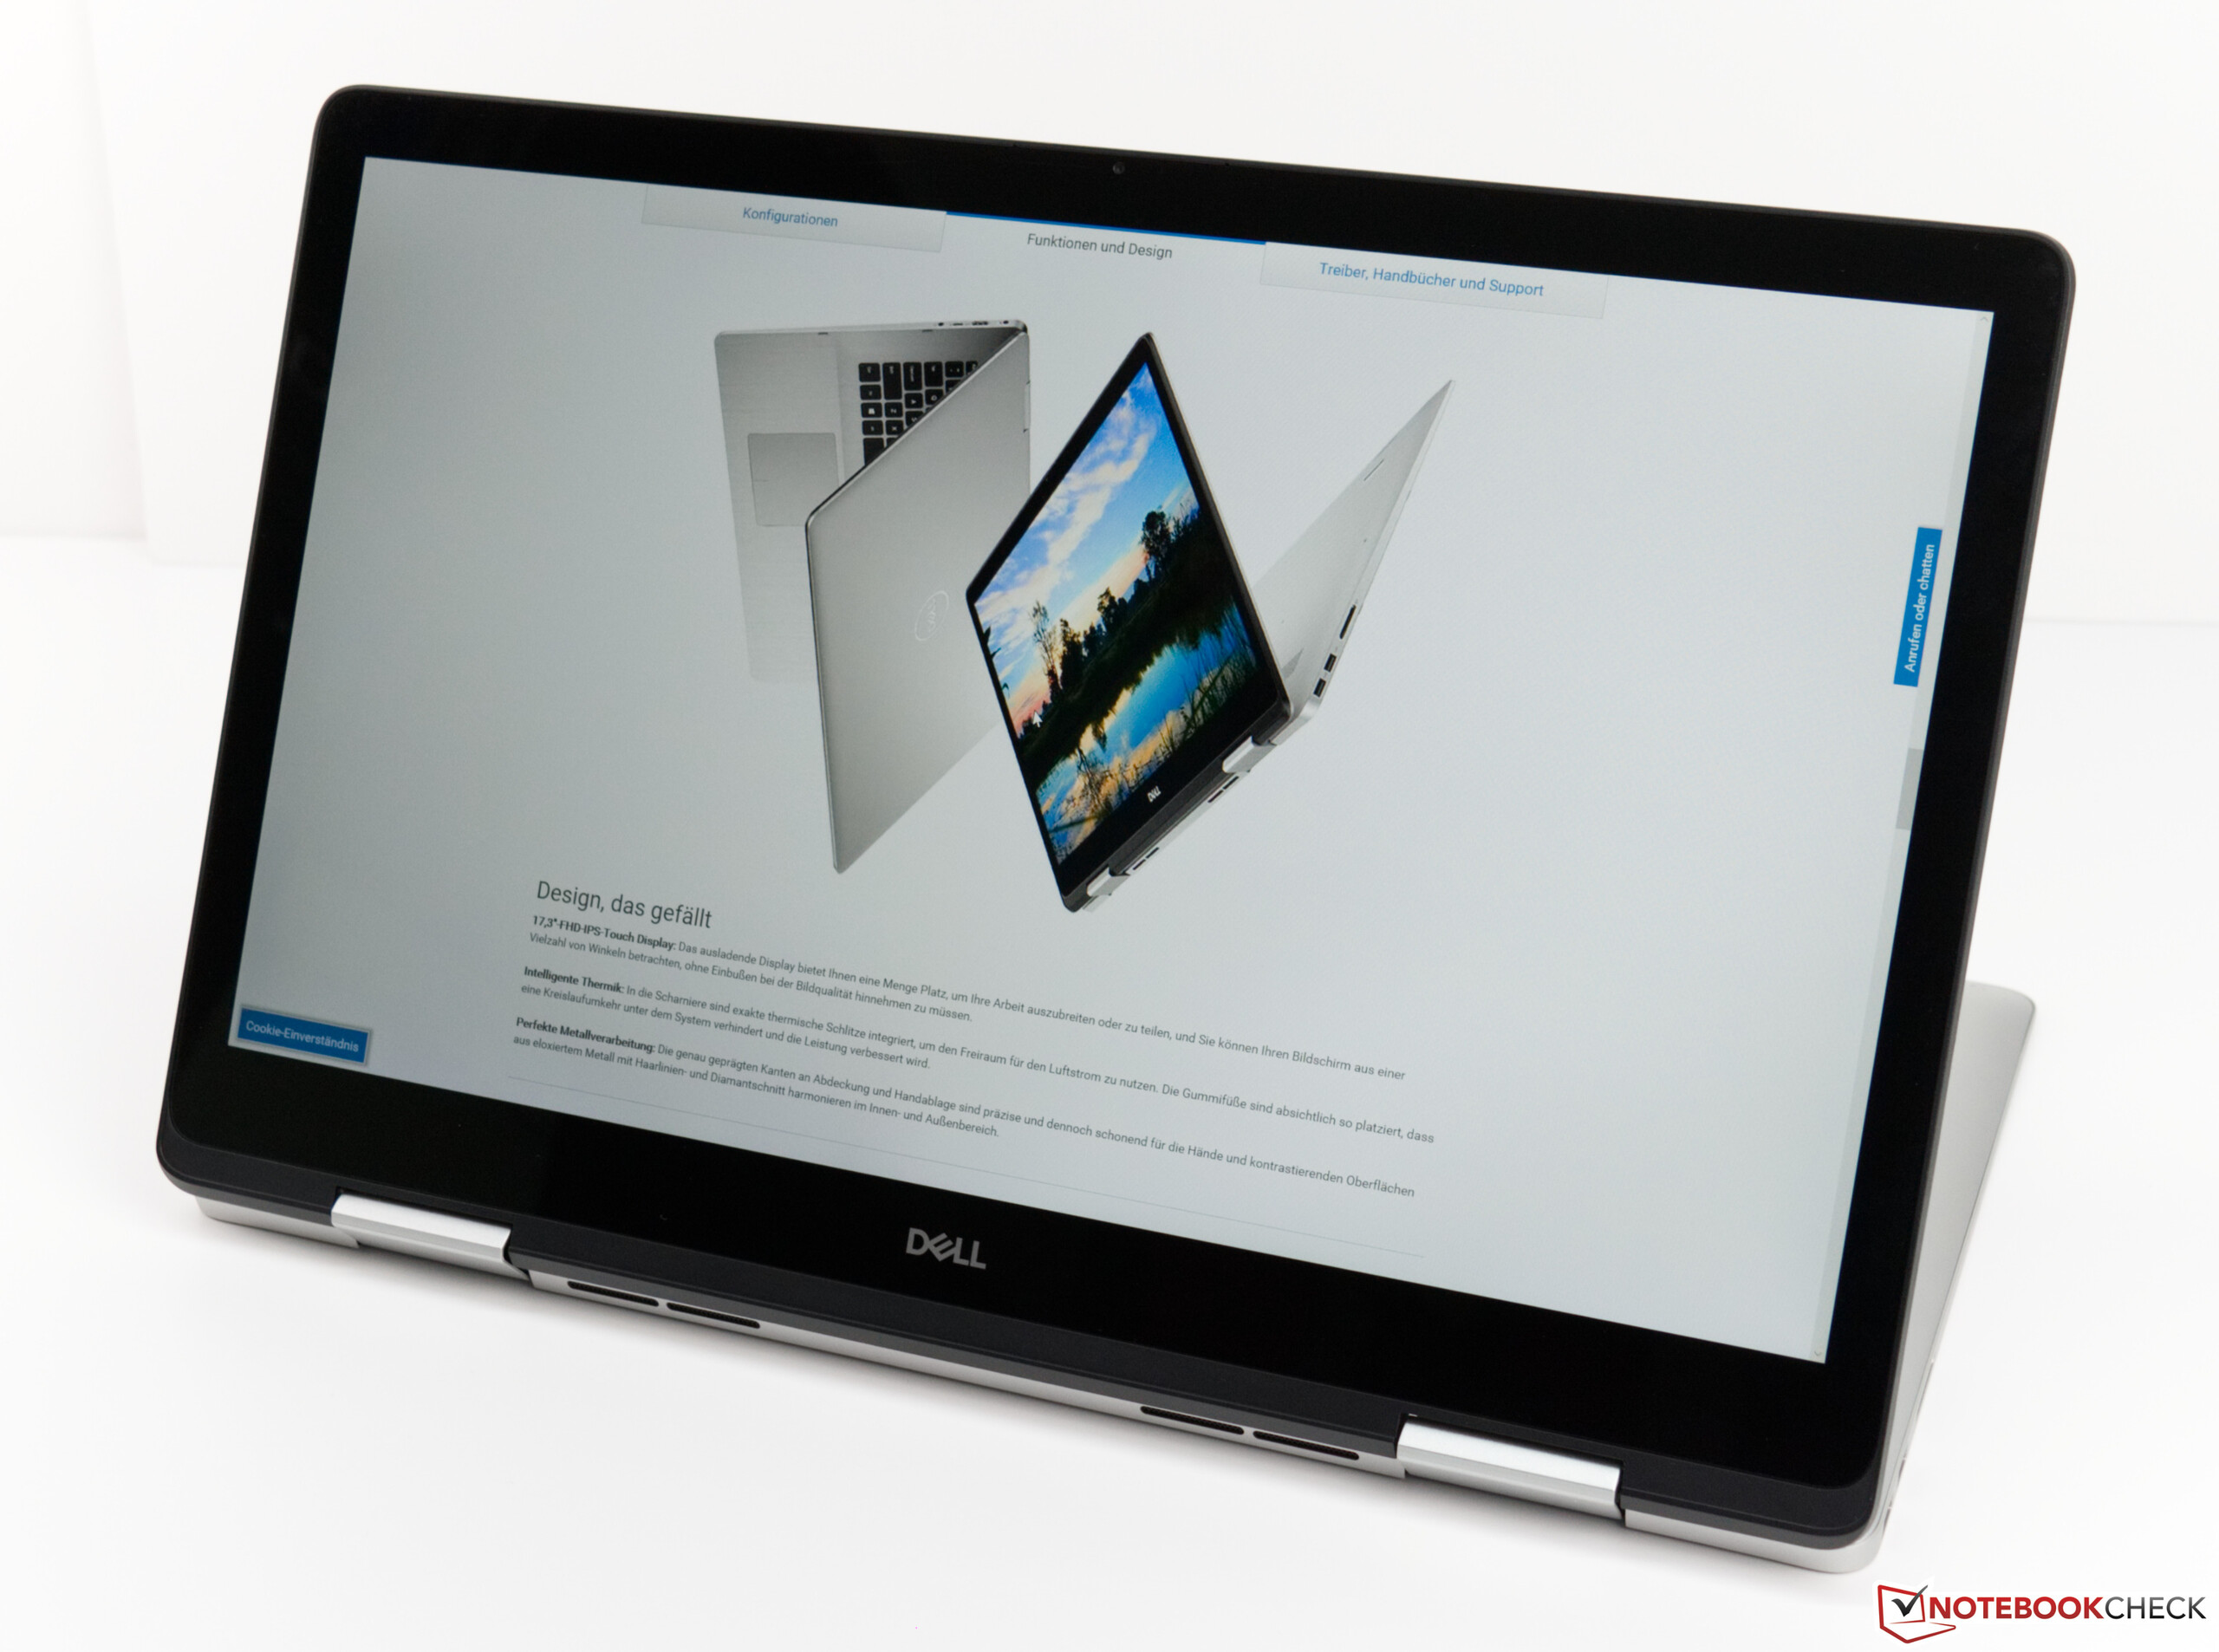
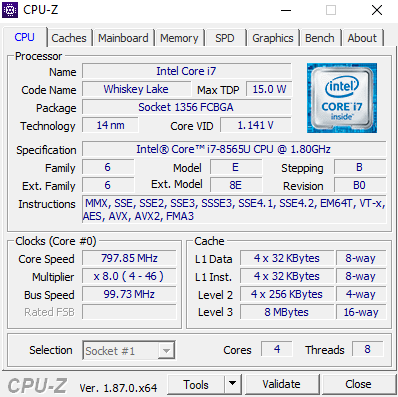
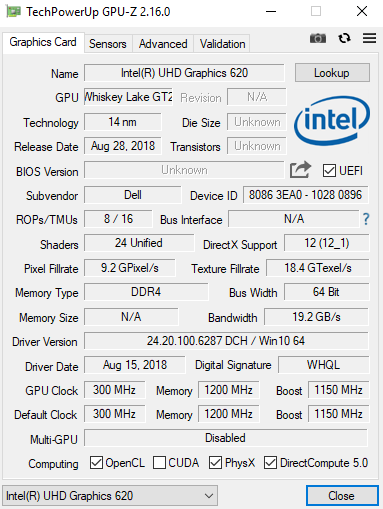
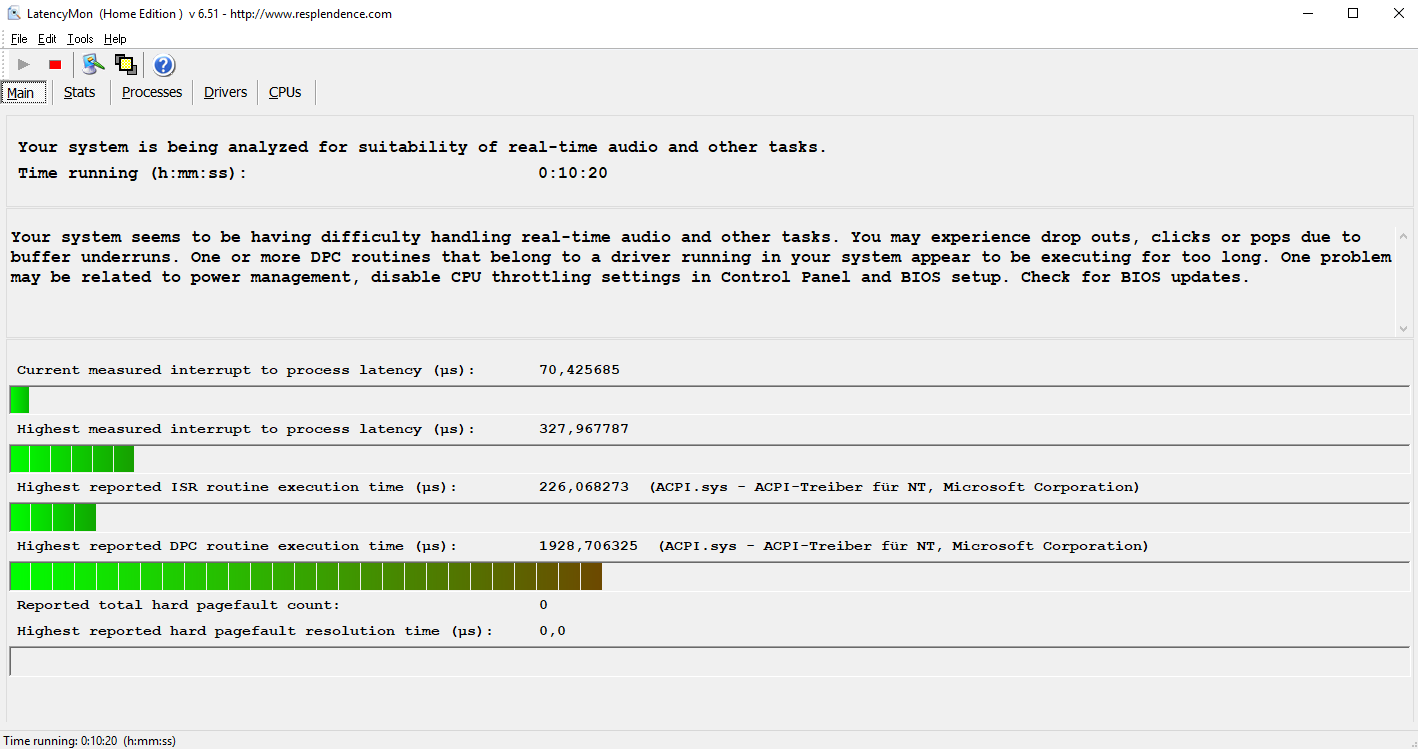
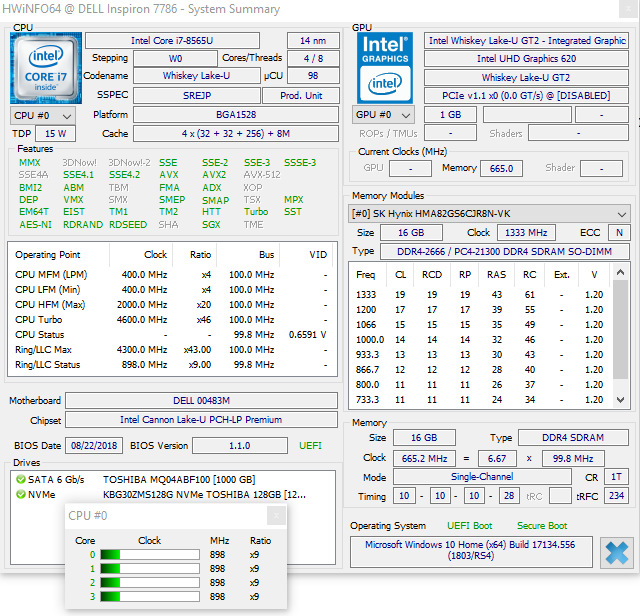
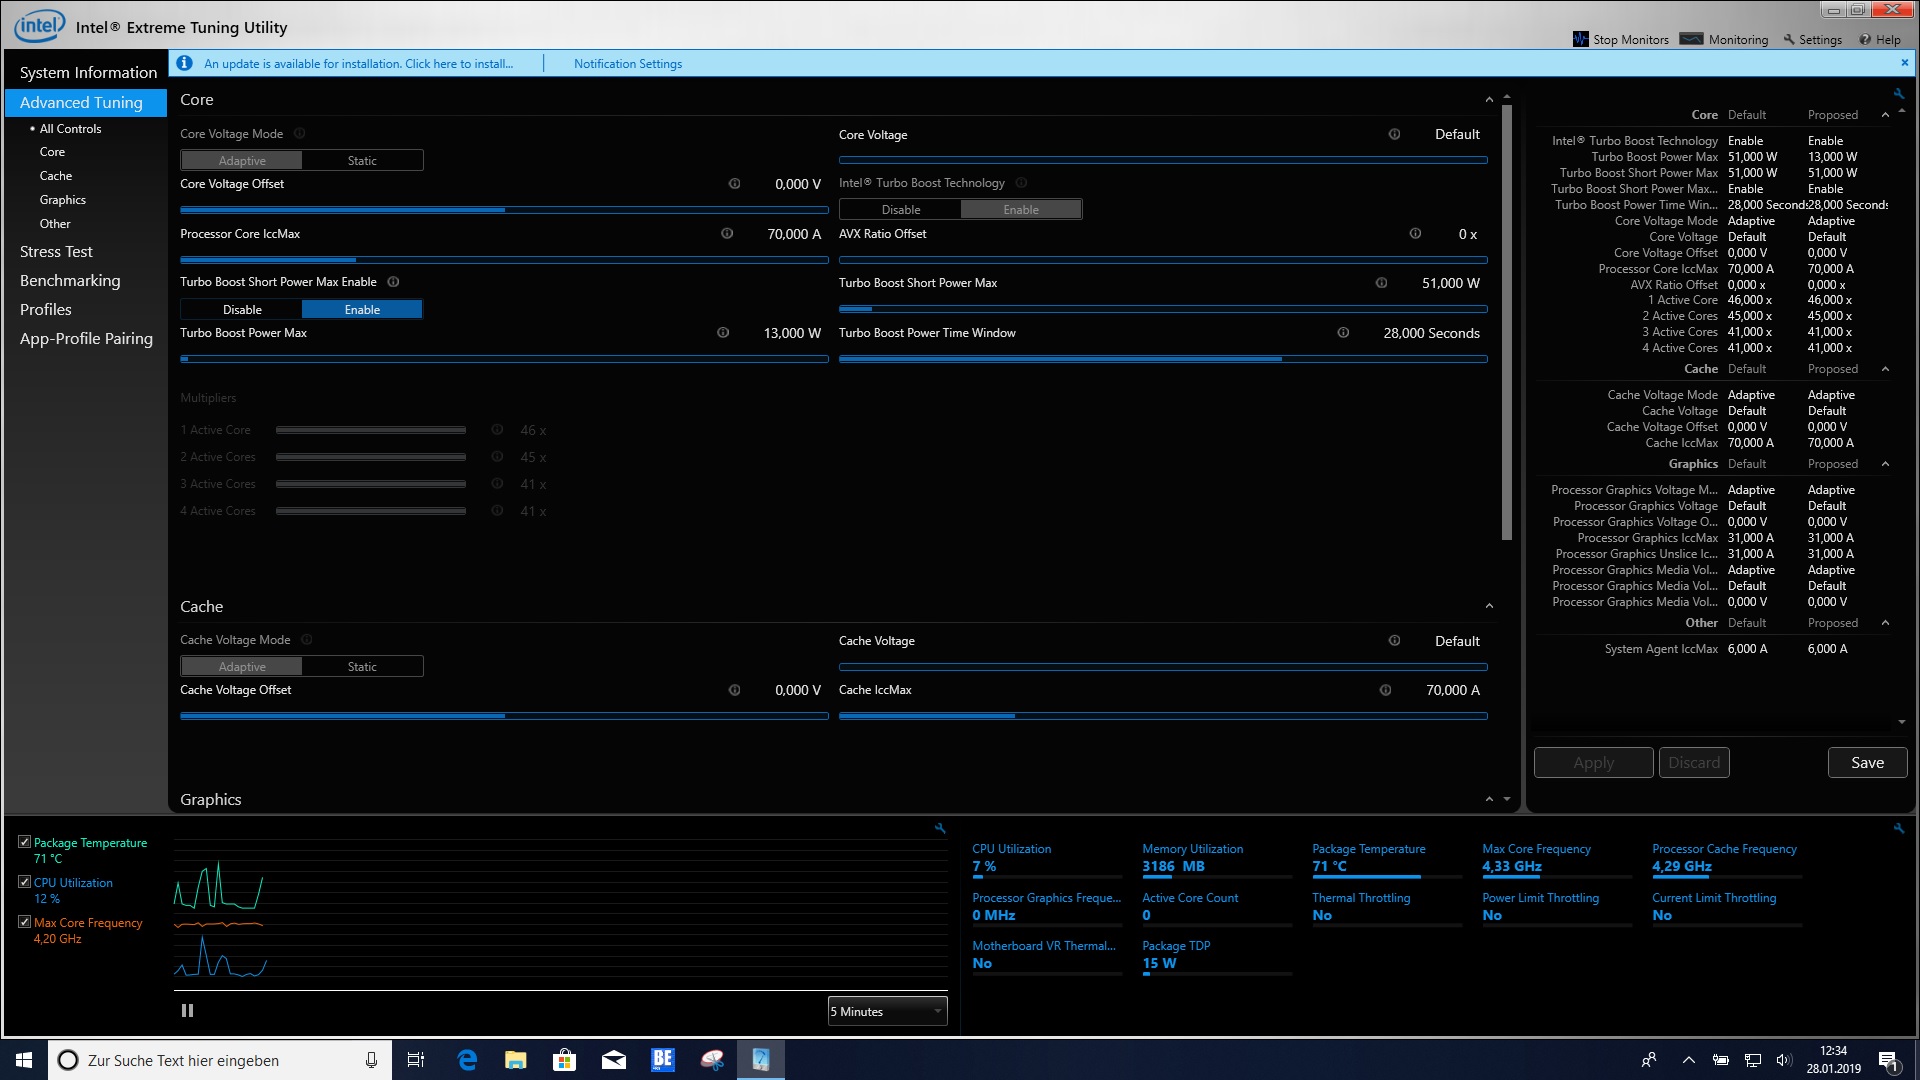
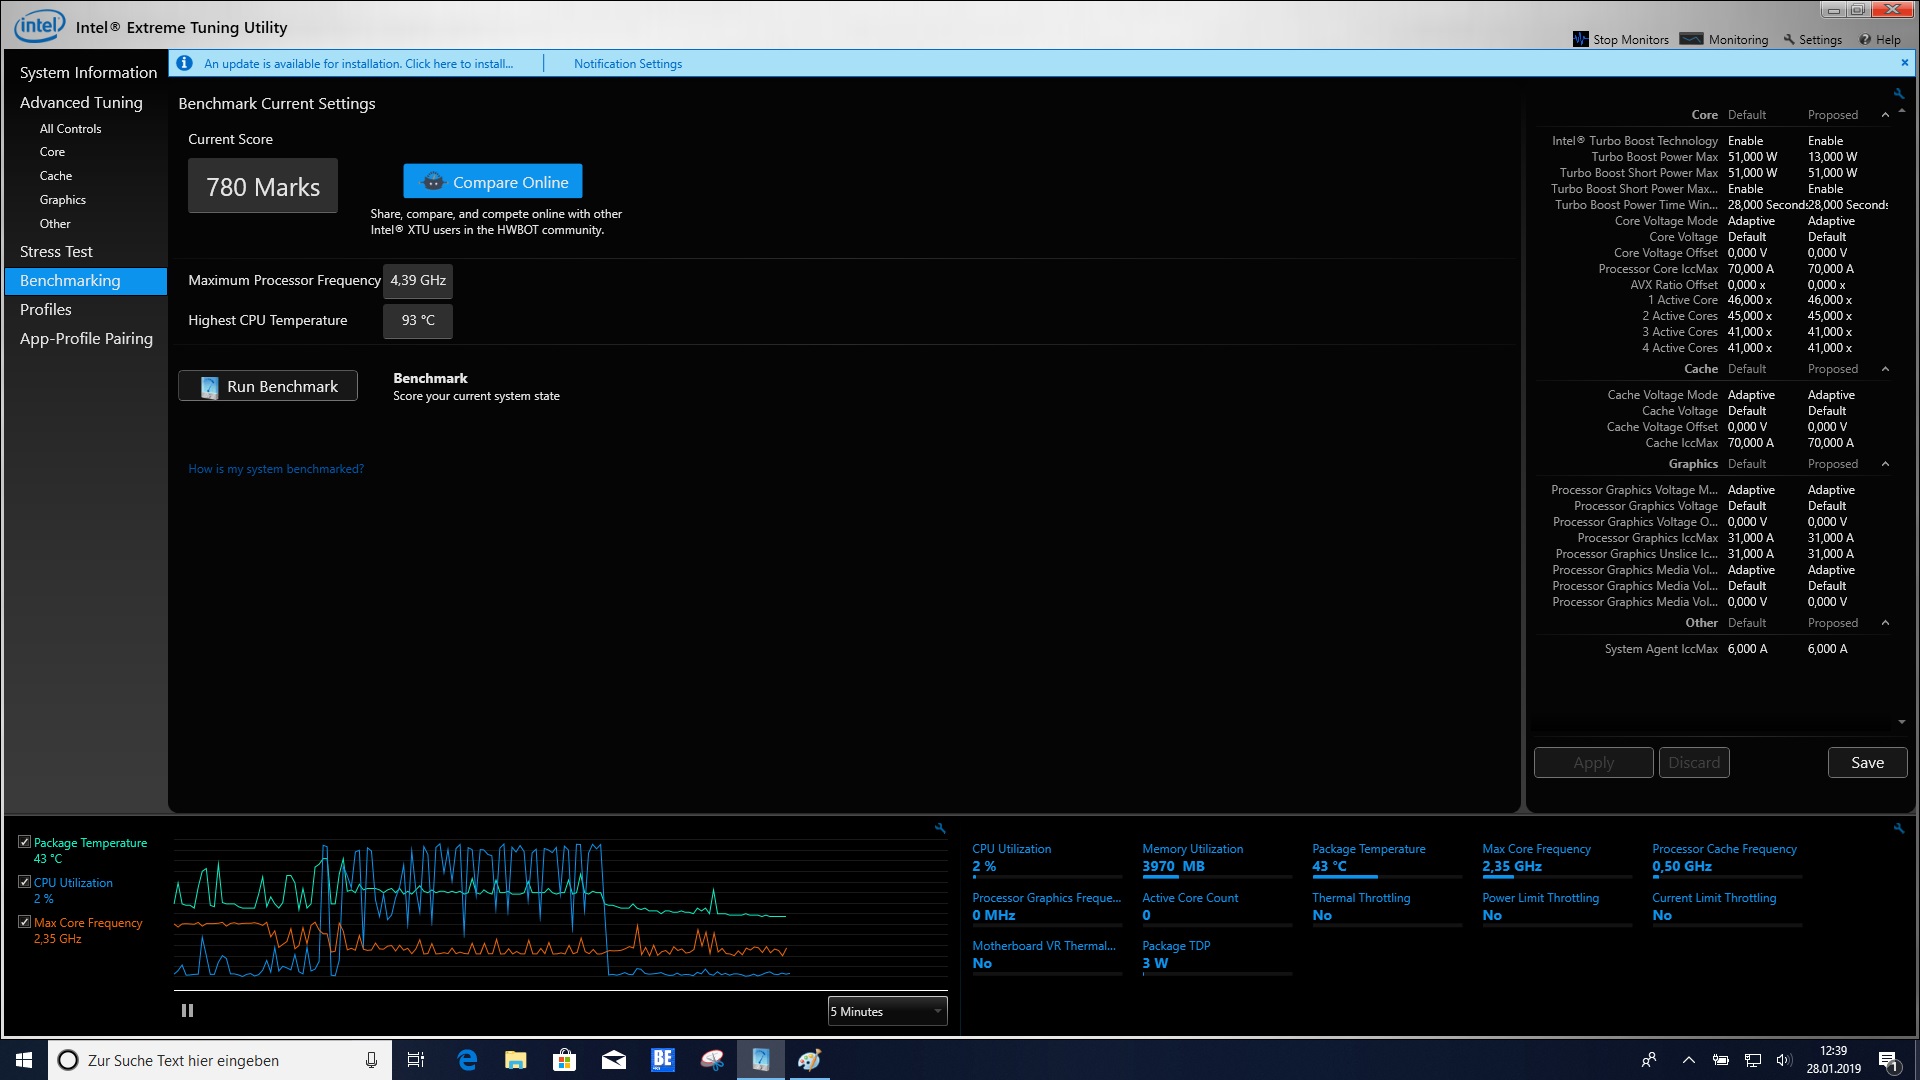
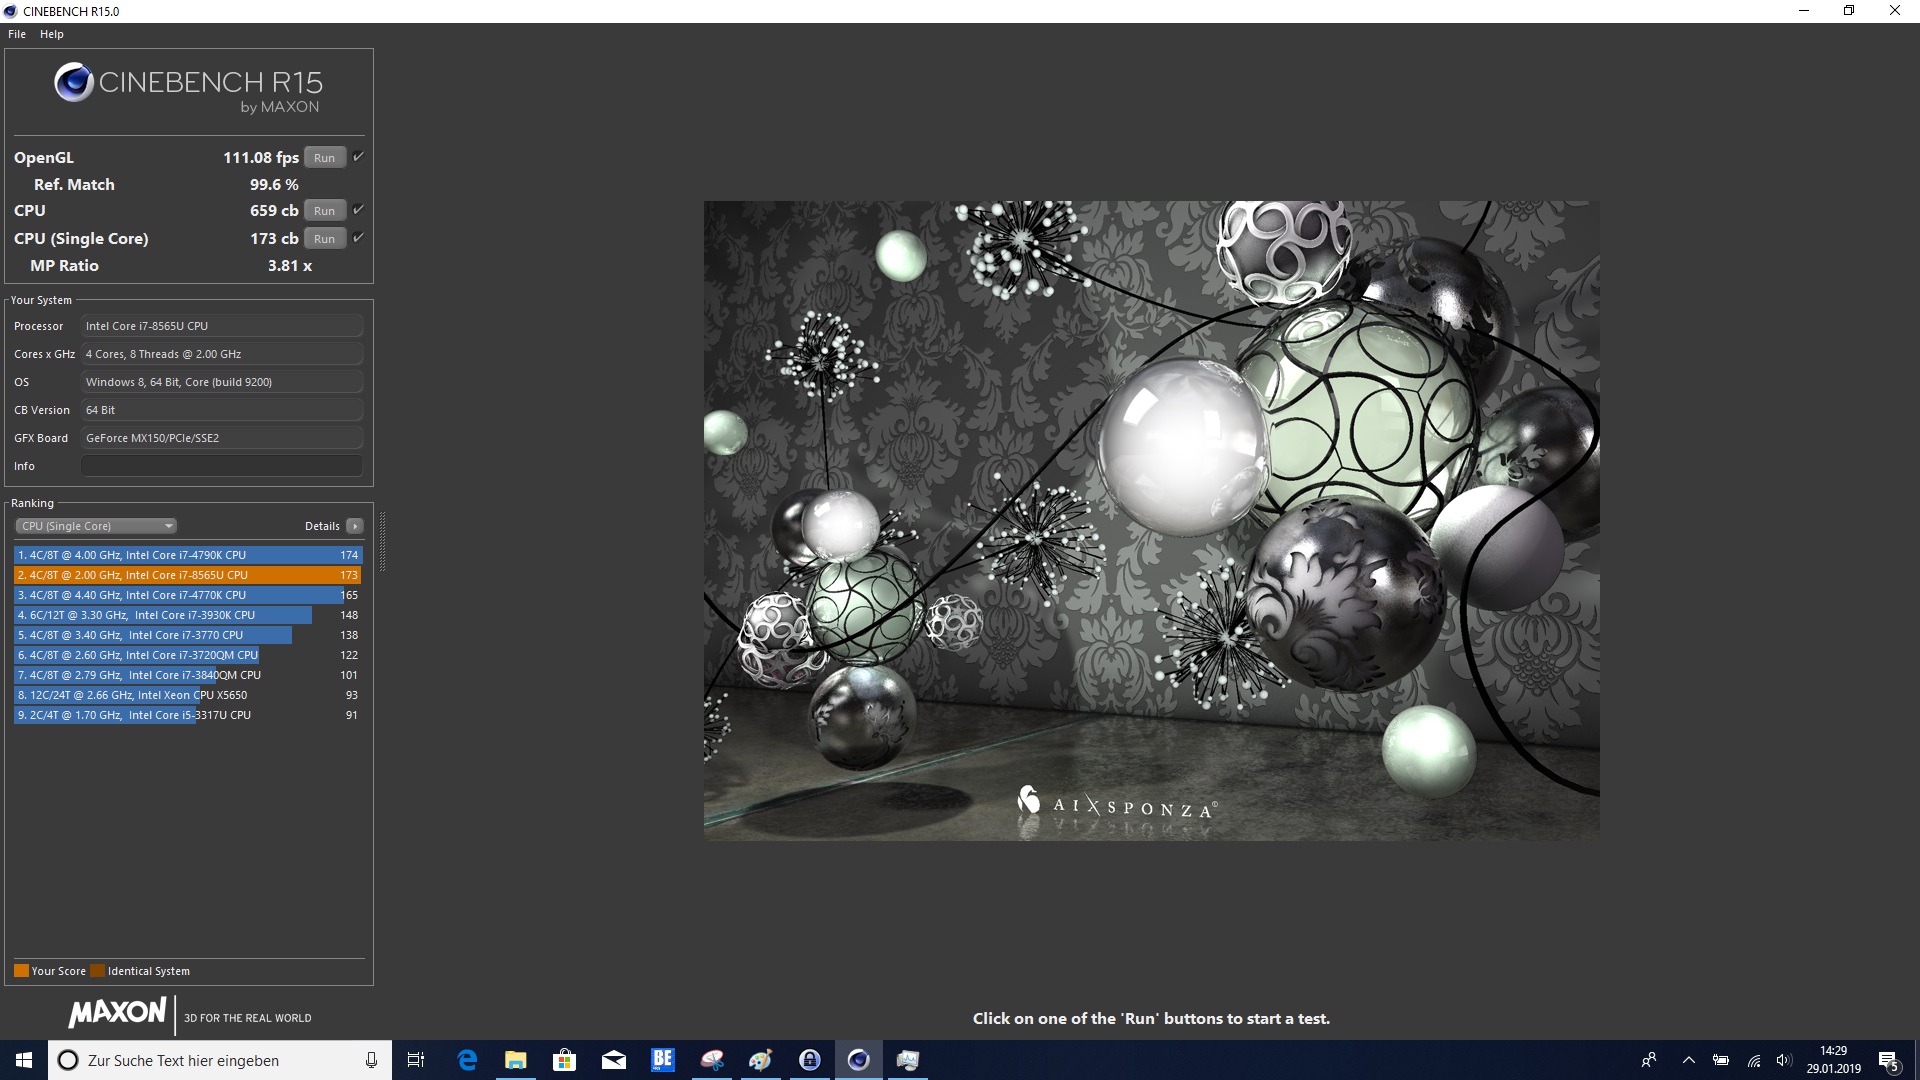
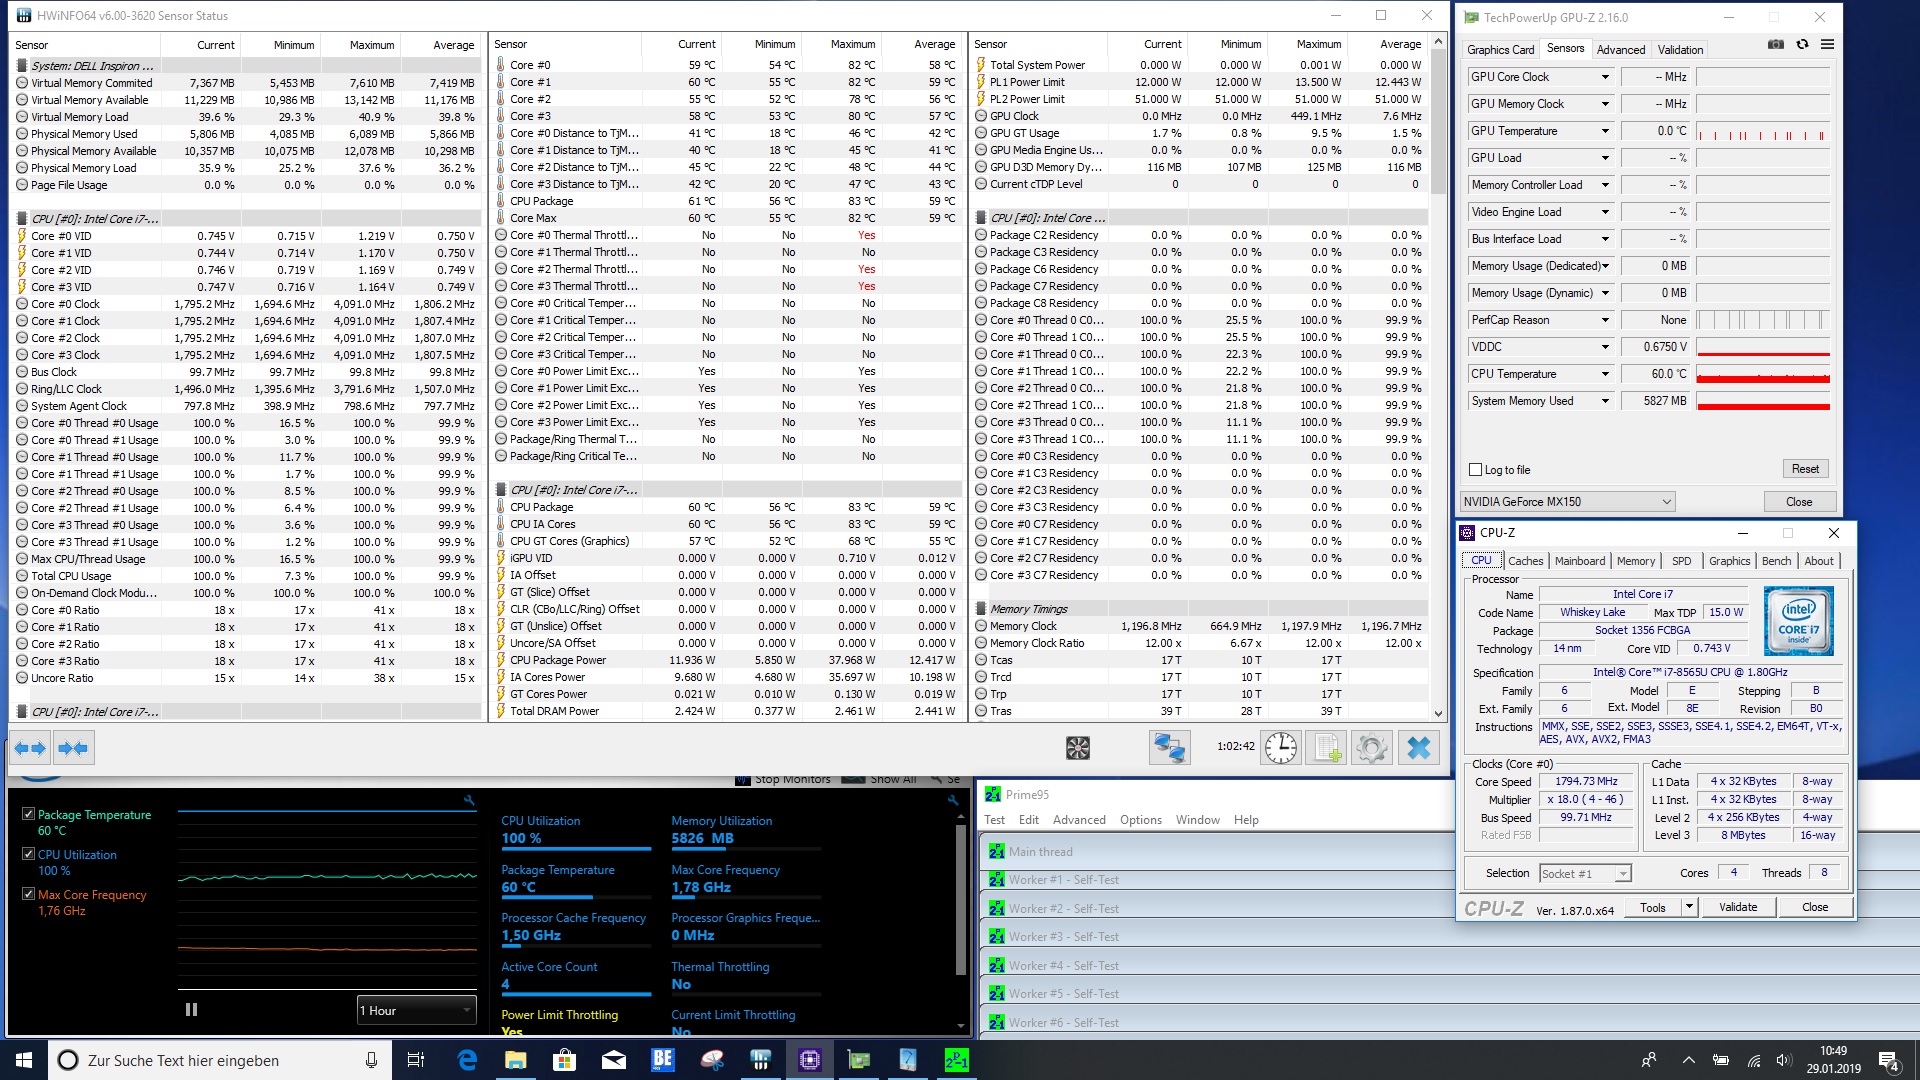
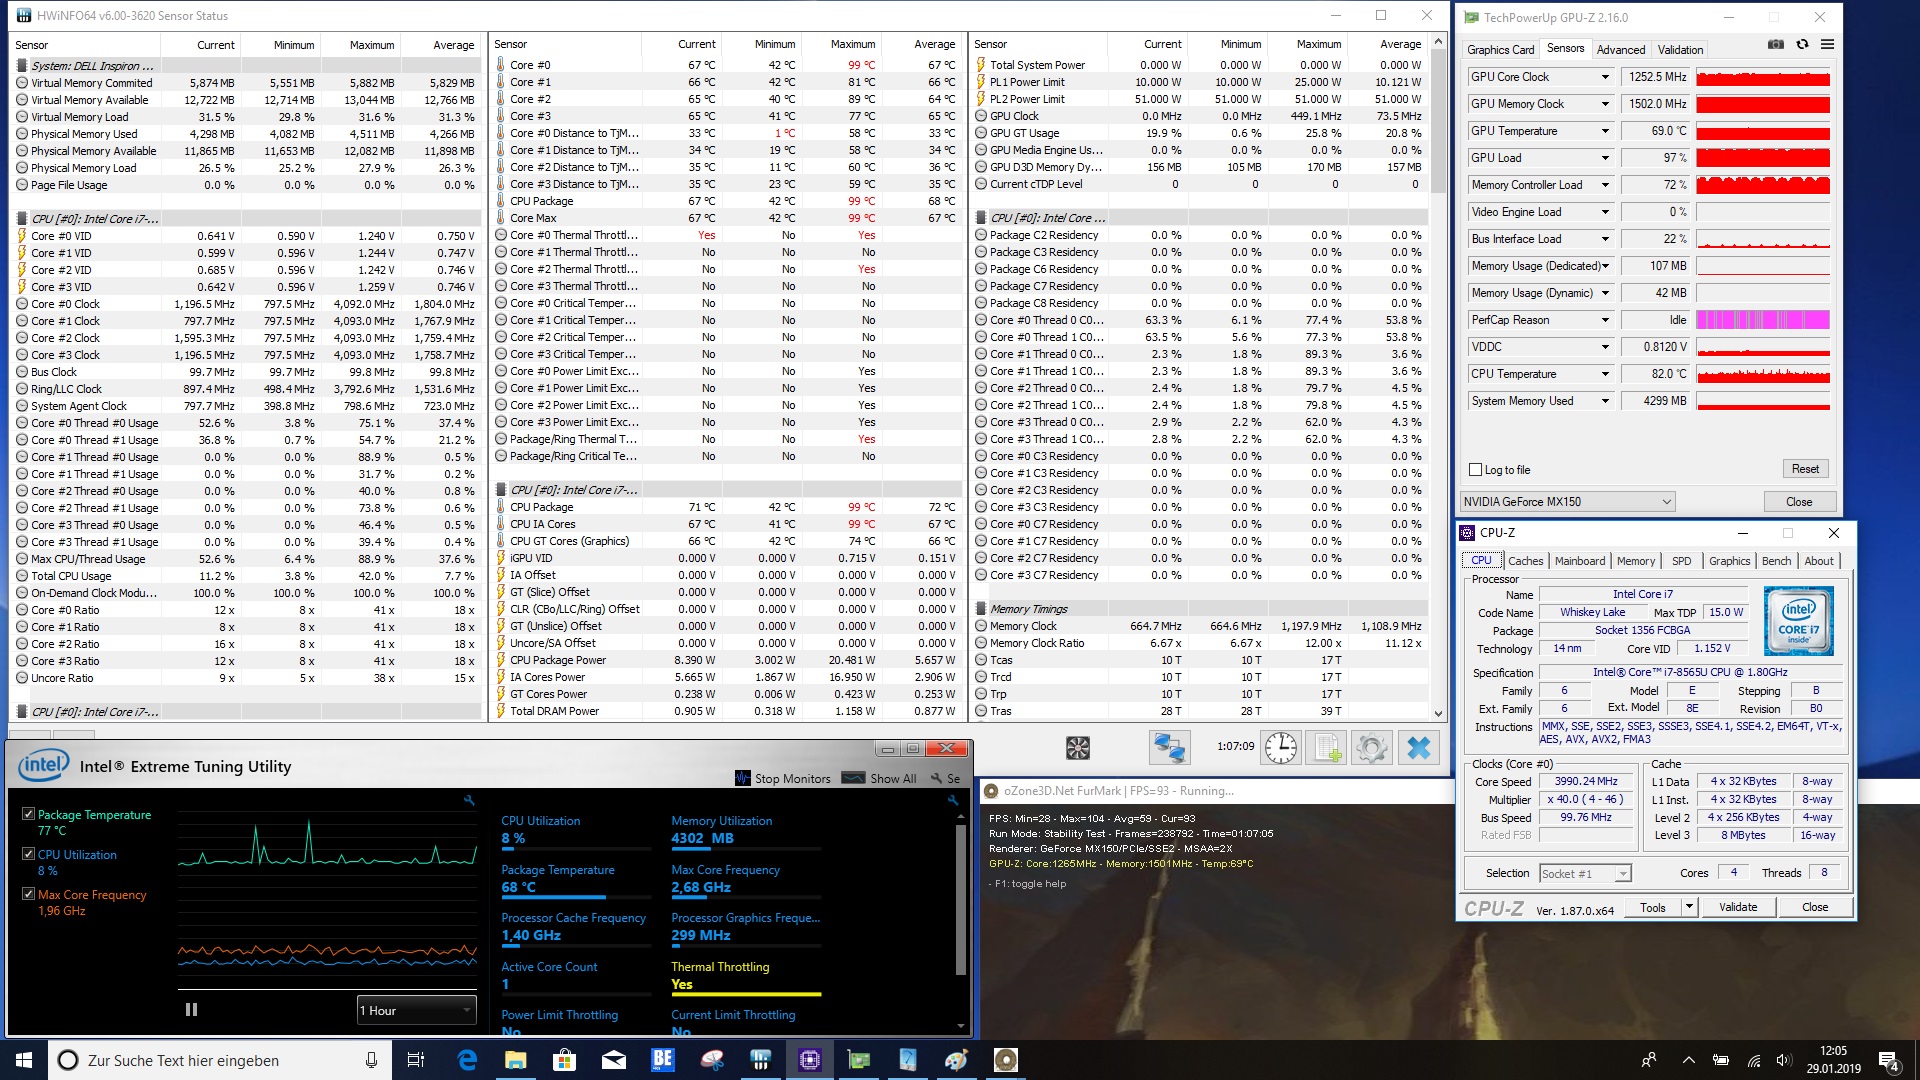
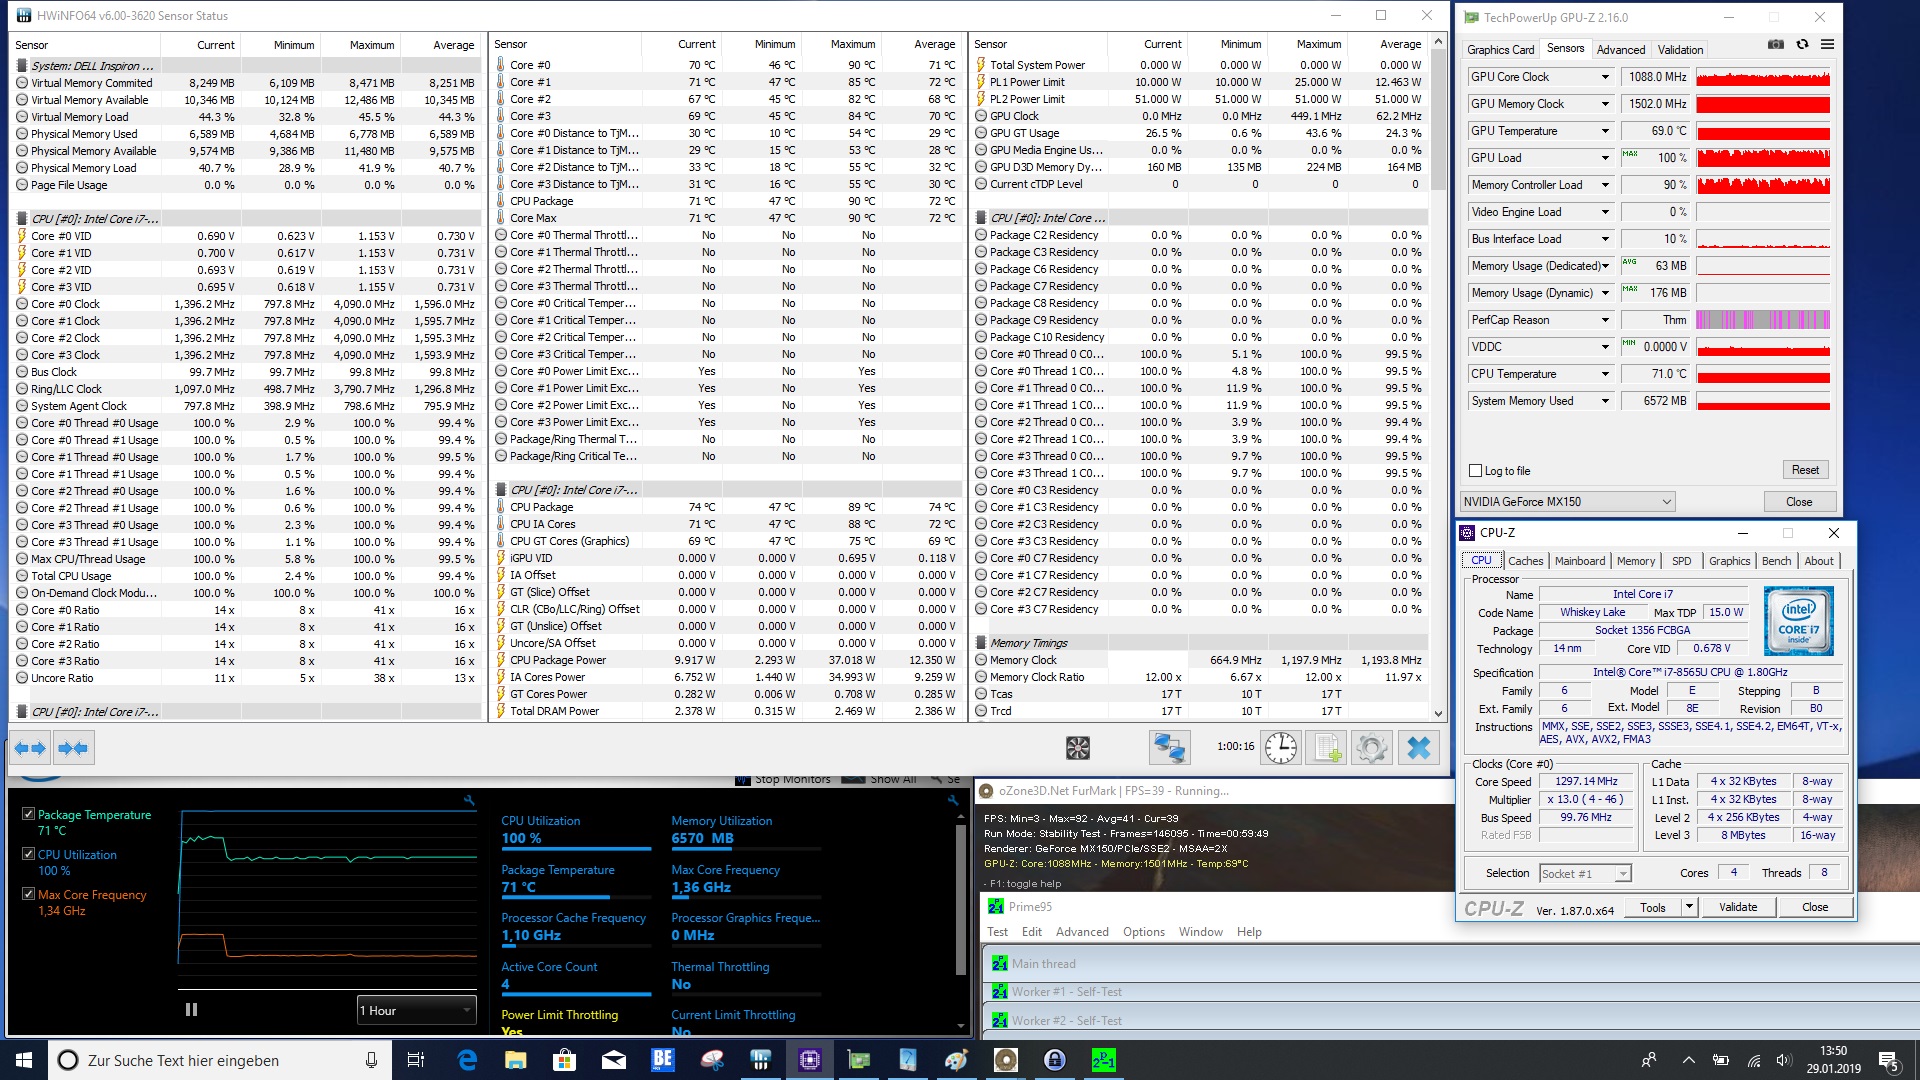
I egenskap av omvandlingsbar modell på 17 tum är Dell Inspiron 17-7786 fortfarande utan rivaler, om vi ignorerar dess direkta föregångare. Dell följer upp föregångaren Dell Inspiron 17-7773 med denna gigantiska omvandlingsbara dator. Vid en första anblick ser denna 2-i-1 inte särskilt annorlunda ut då de visuella förändringarna bara syns om man tittar ordentligt. Det går att argumentera för om dessa förändringar var förnuftiga eller inte. Men viktigare förändringar har skett under huven där Kaby Lake-processorn har bytts ut mot nya Intel Core i7-8565U (Whiskey Lake) som har betydligt högre Boost-klockfrekvens och bör således leverera mer prestanda. Under testet kunde den tyvärr inte upprätthålla dessa längre perioder och i Cinebench R15-multiloopen besegrades vår testenhet faktiskt av sin föregångare. Men totalt sett var vi nöjda med den här enhetens processor.
Tyvärr erbjuder Dell bara enheten med den här kombinationen av CPU/GPU. Det är inte tydligt varför den inte finns med en i5-processor baserad på Whiskey Lake. Köparen har bara valet när det kommer till lagringslösningen. Vi rekommenderar kombinationen av SSD och HDD, så som vår testenhet är konfigurerad. Tillsammans med 16 GB RAM och en tryckkänslig skärm på 17 tum får man lägga ut 13.280 kronor.
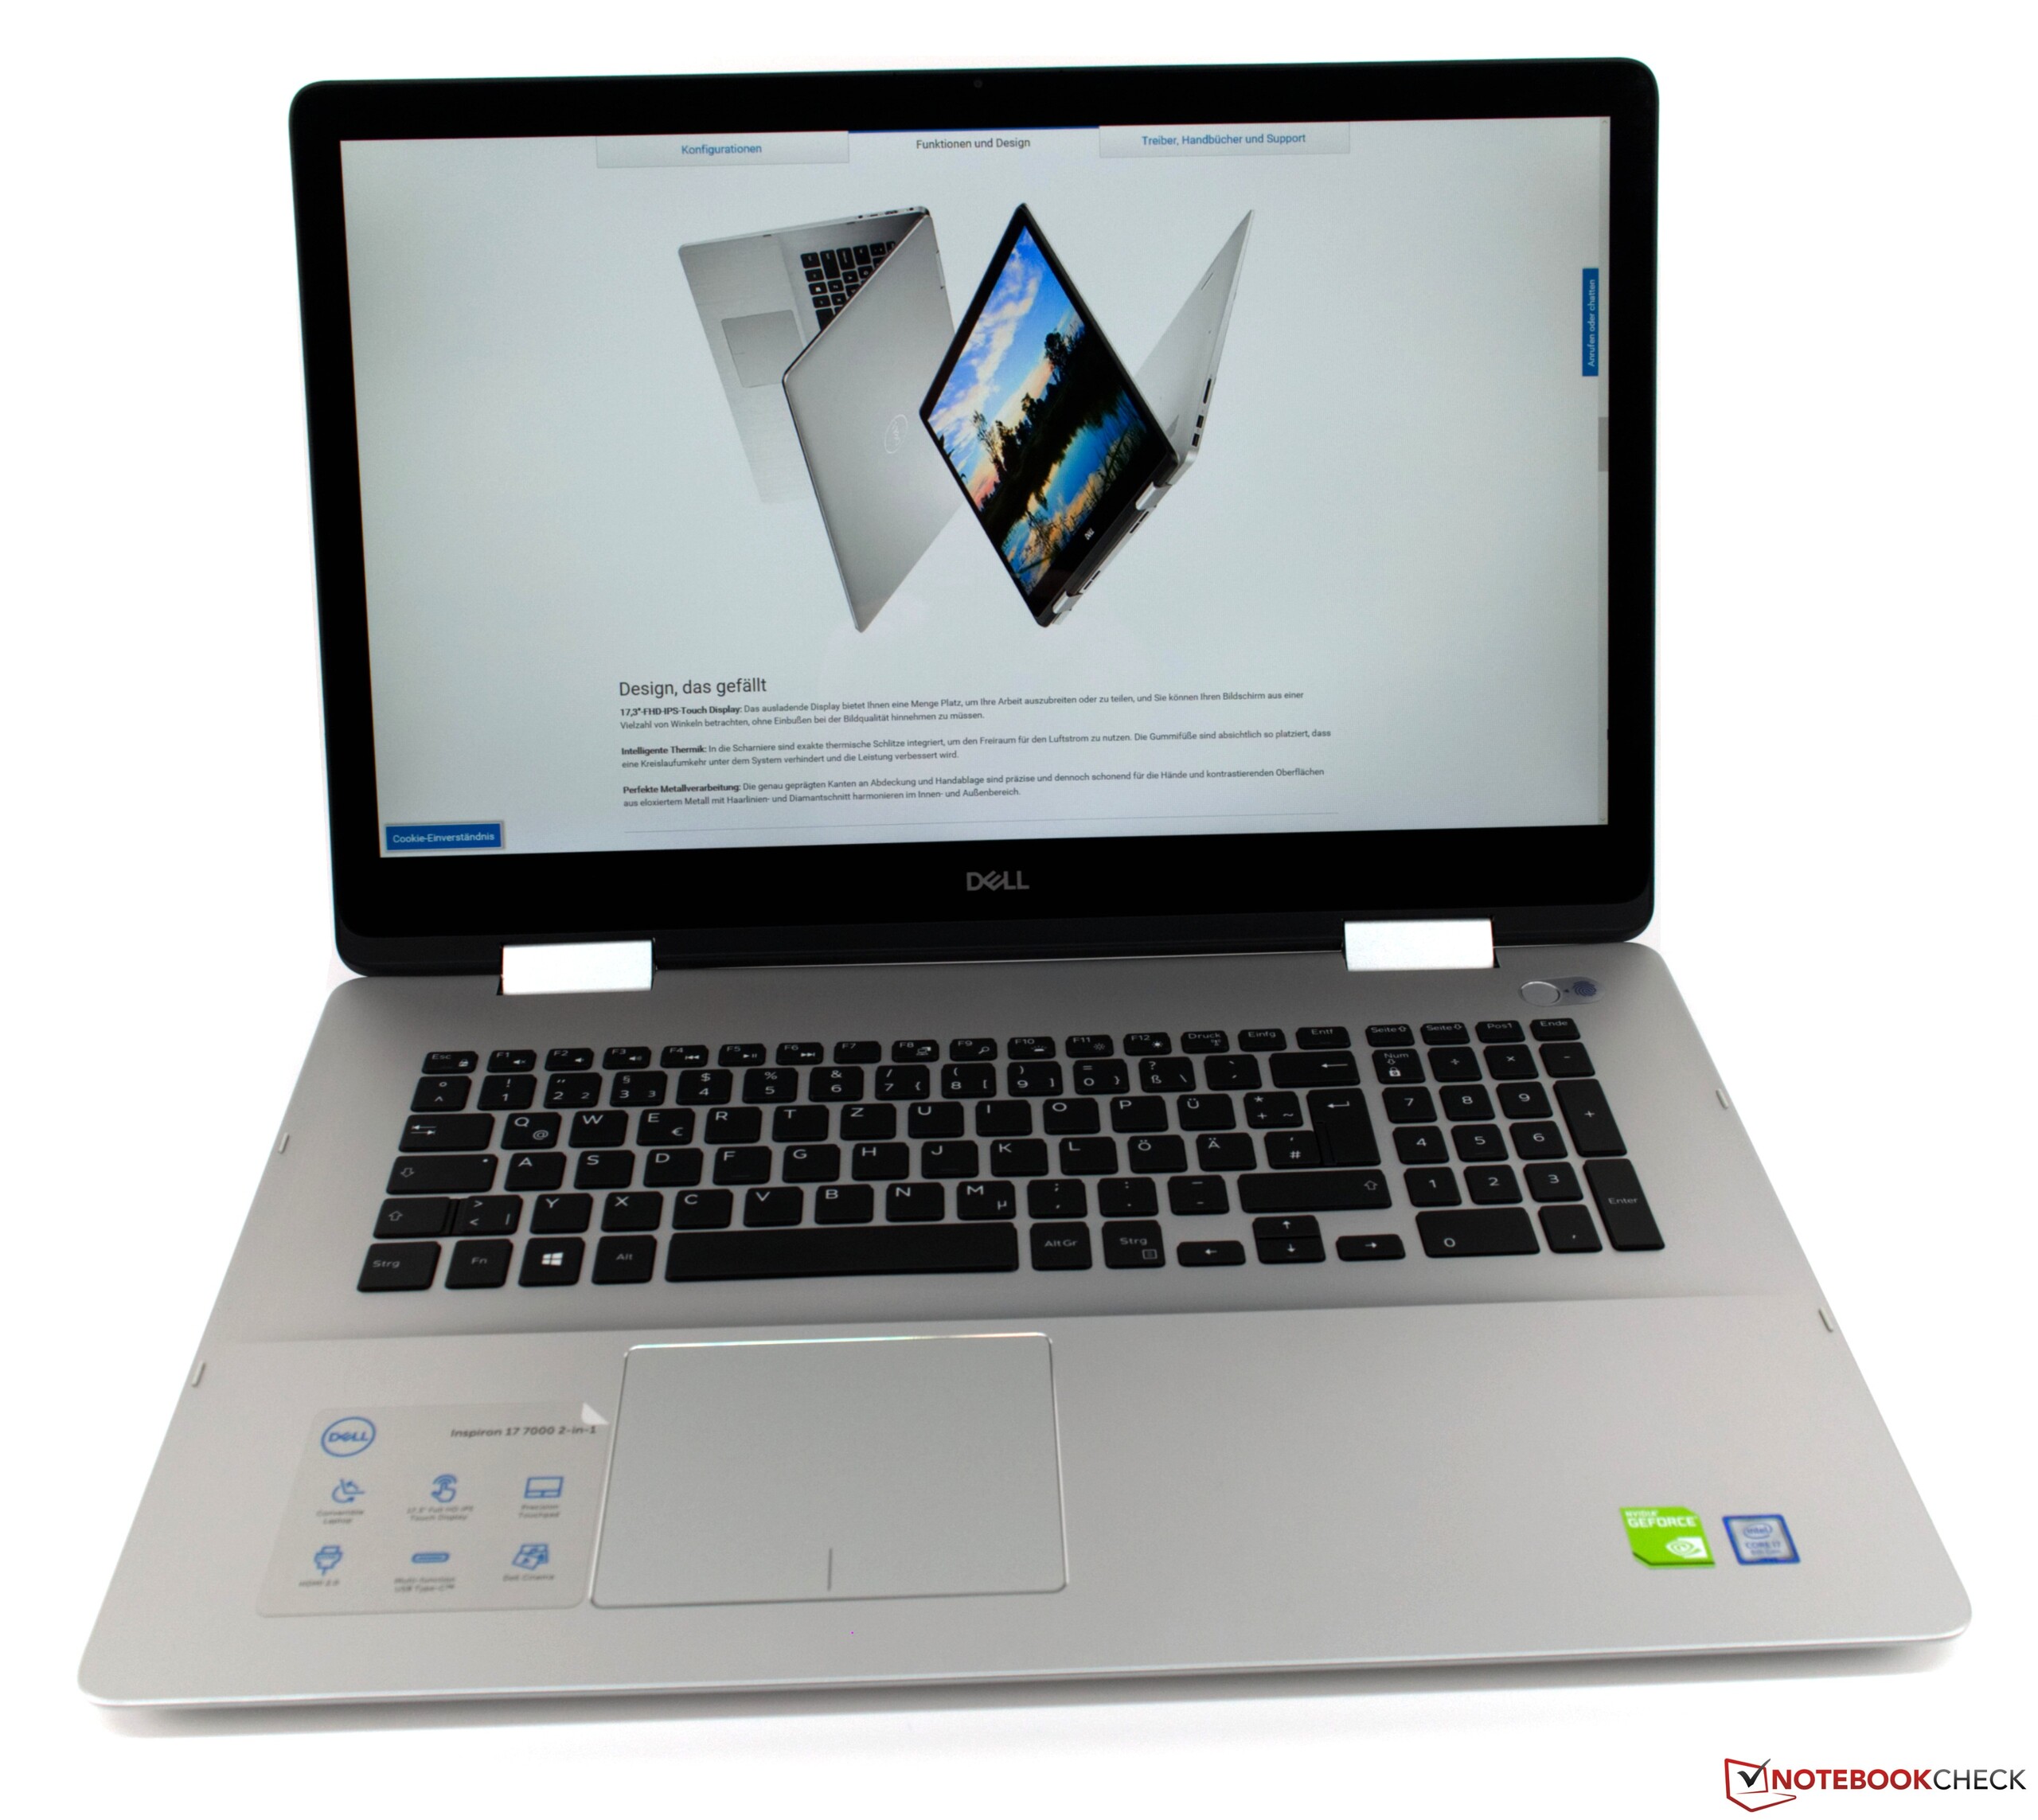
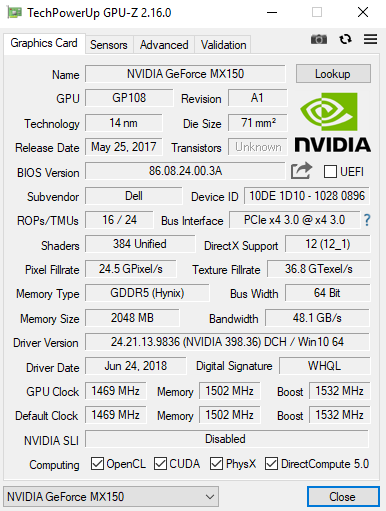
Den som inte kan bestämma sig mellan en omvandlingsbar eller en multimediaenhet bör istället skaffa Dell Inspiron 17-7786. Denna laptop på 17 tum kombinerar båda enhetsklasserna och den dedikerade GPU:n klarar dessutom av en del spel.
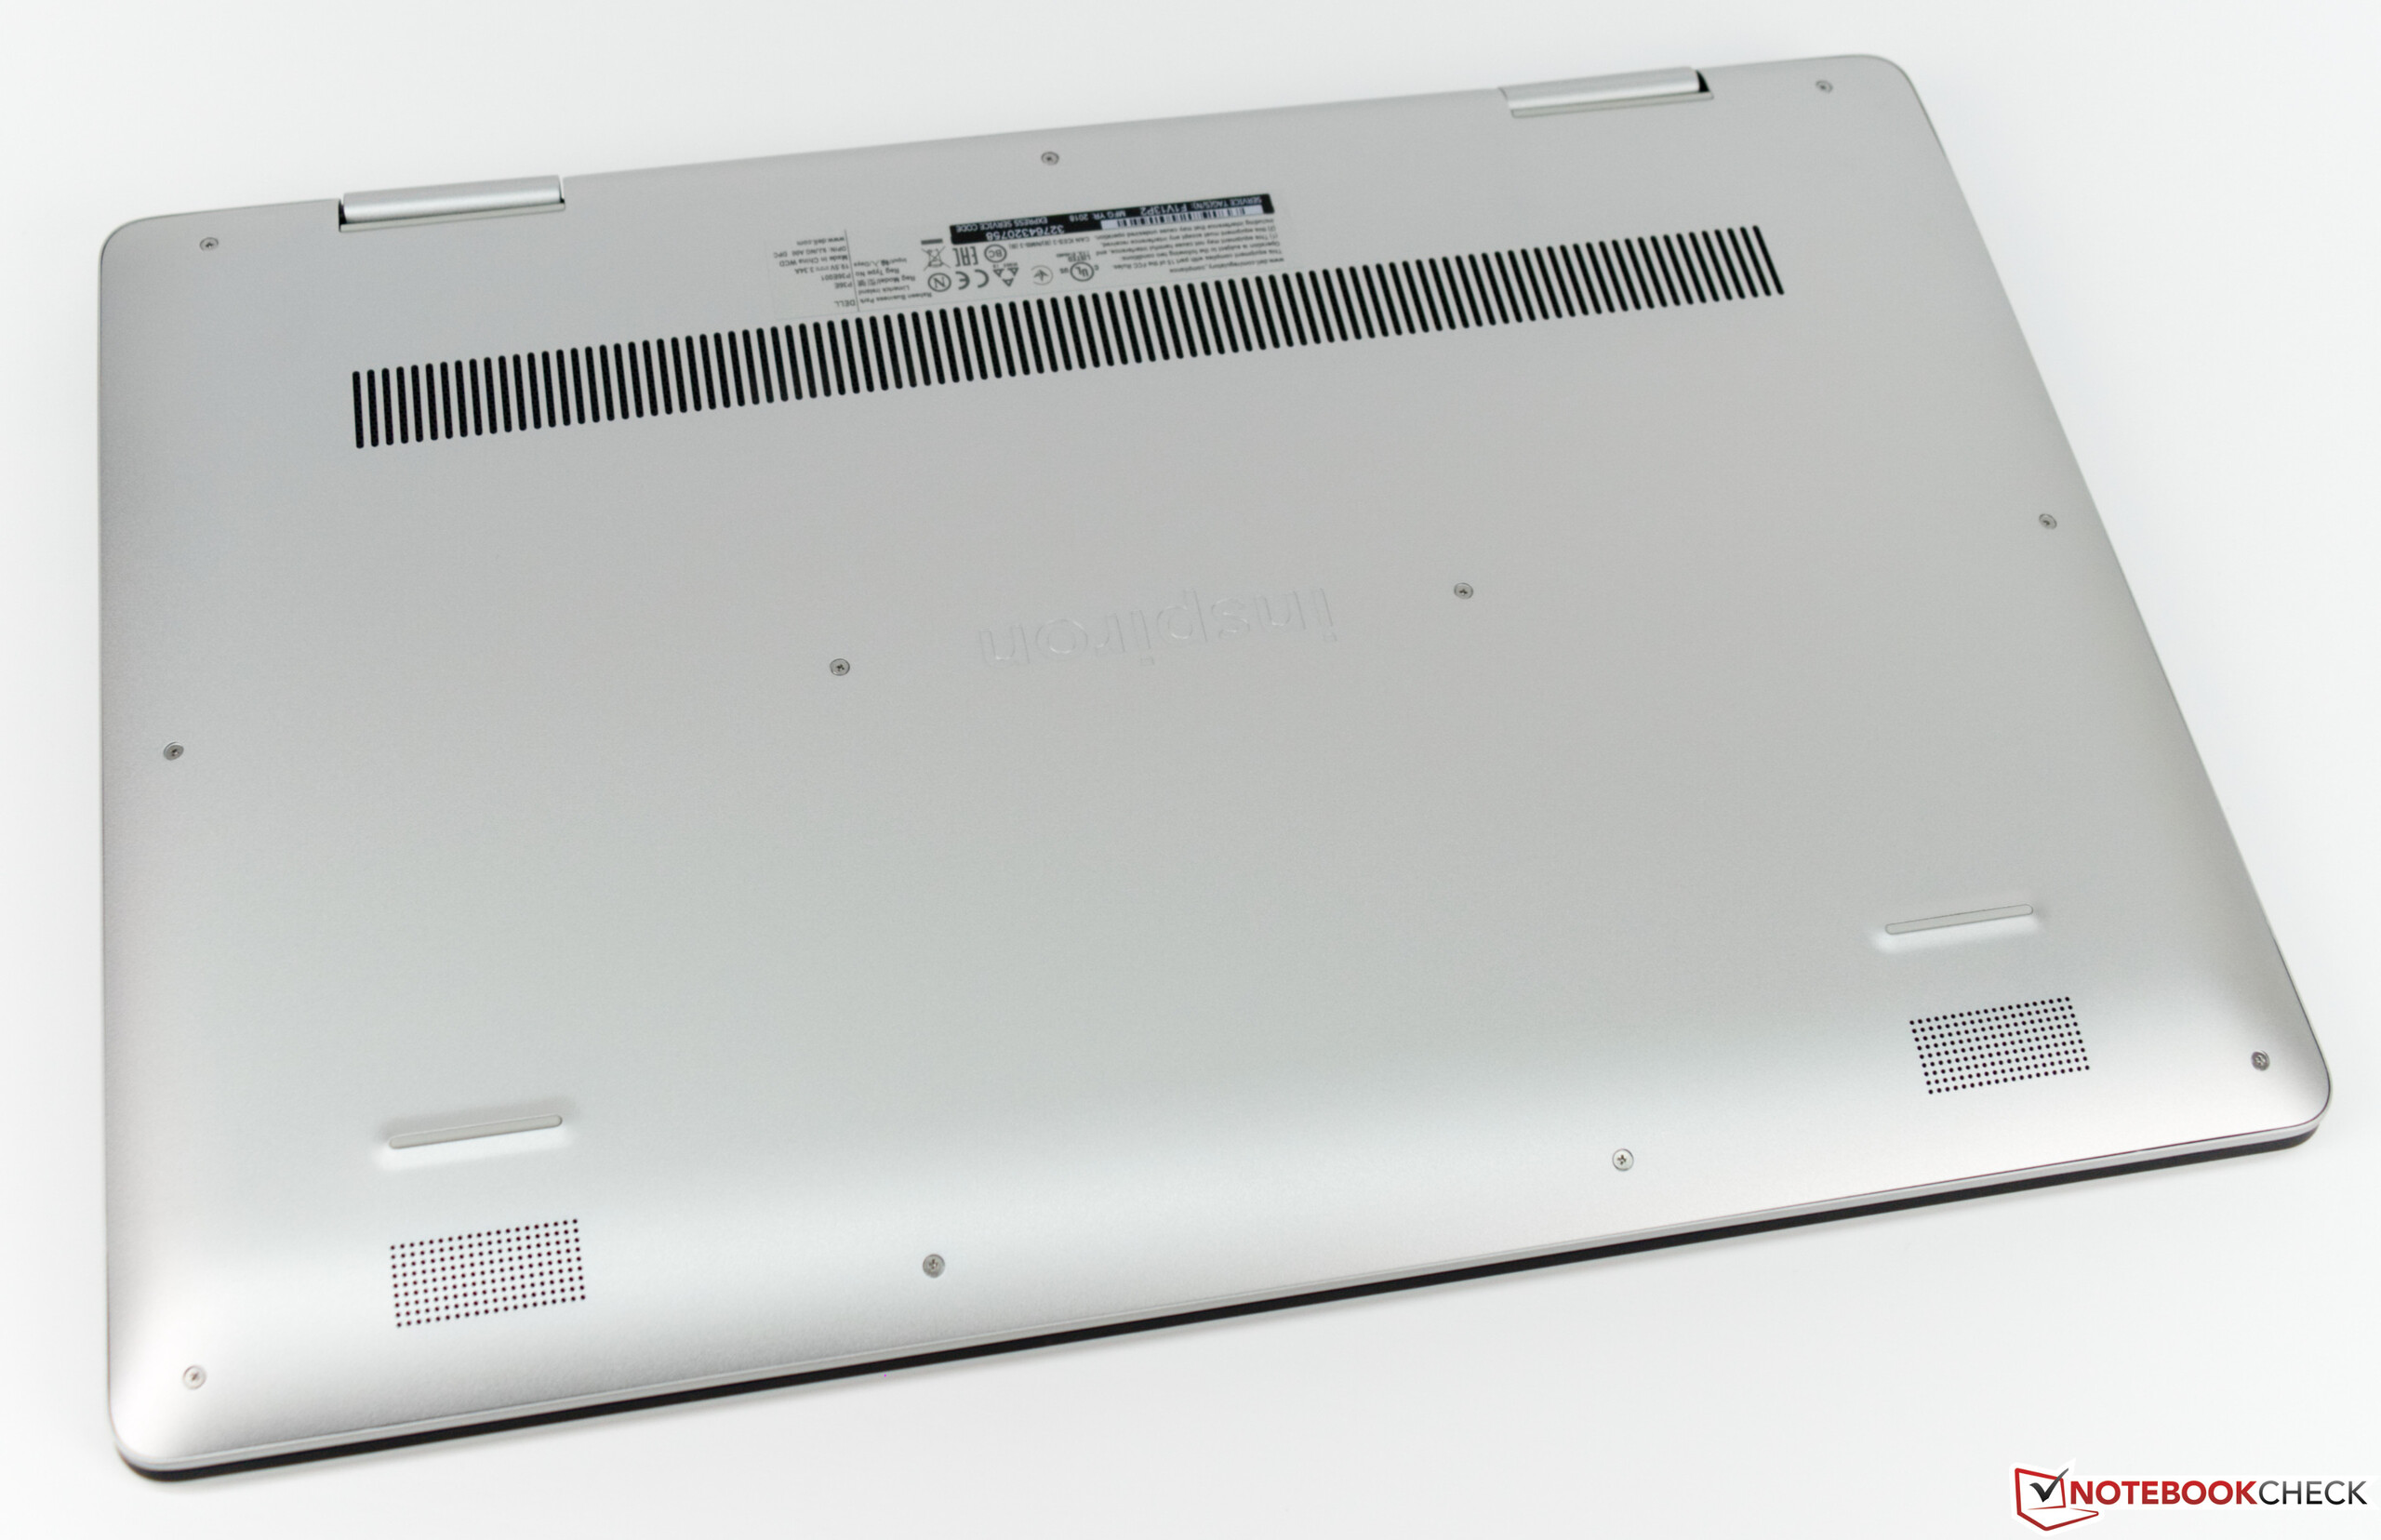
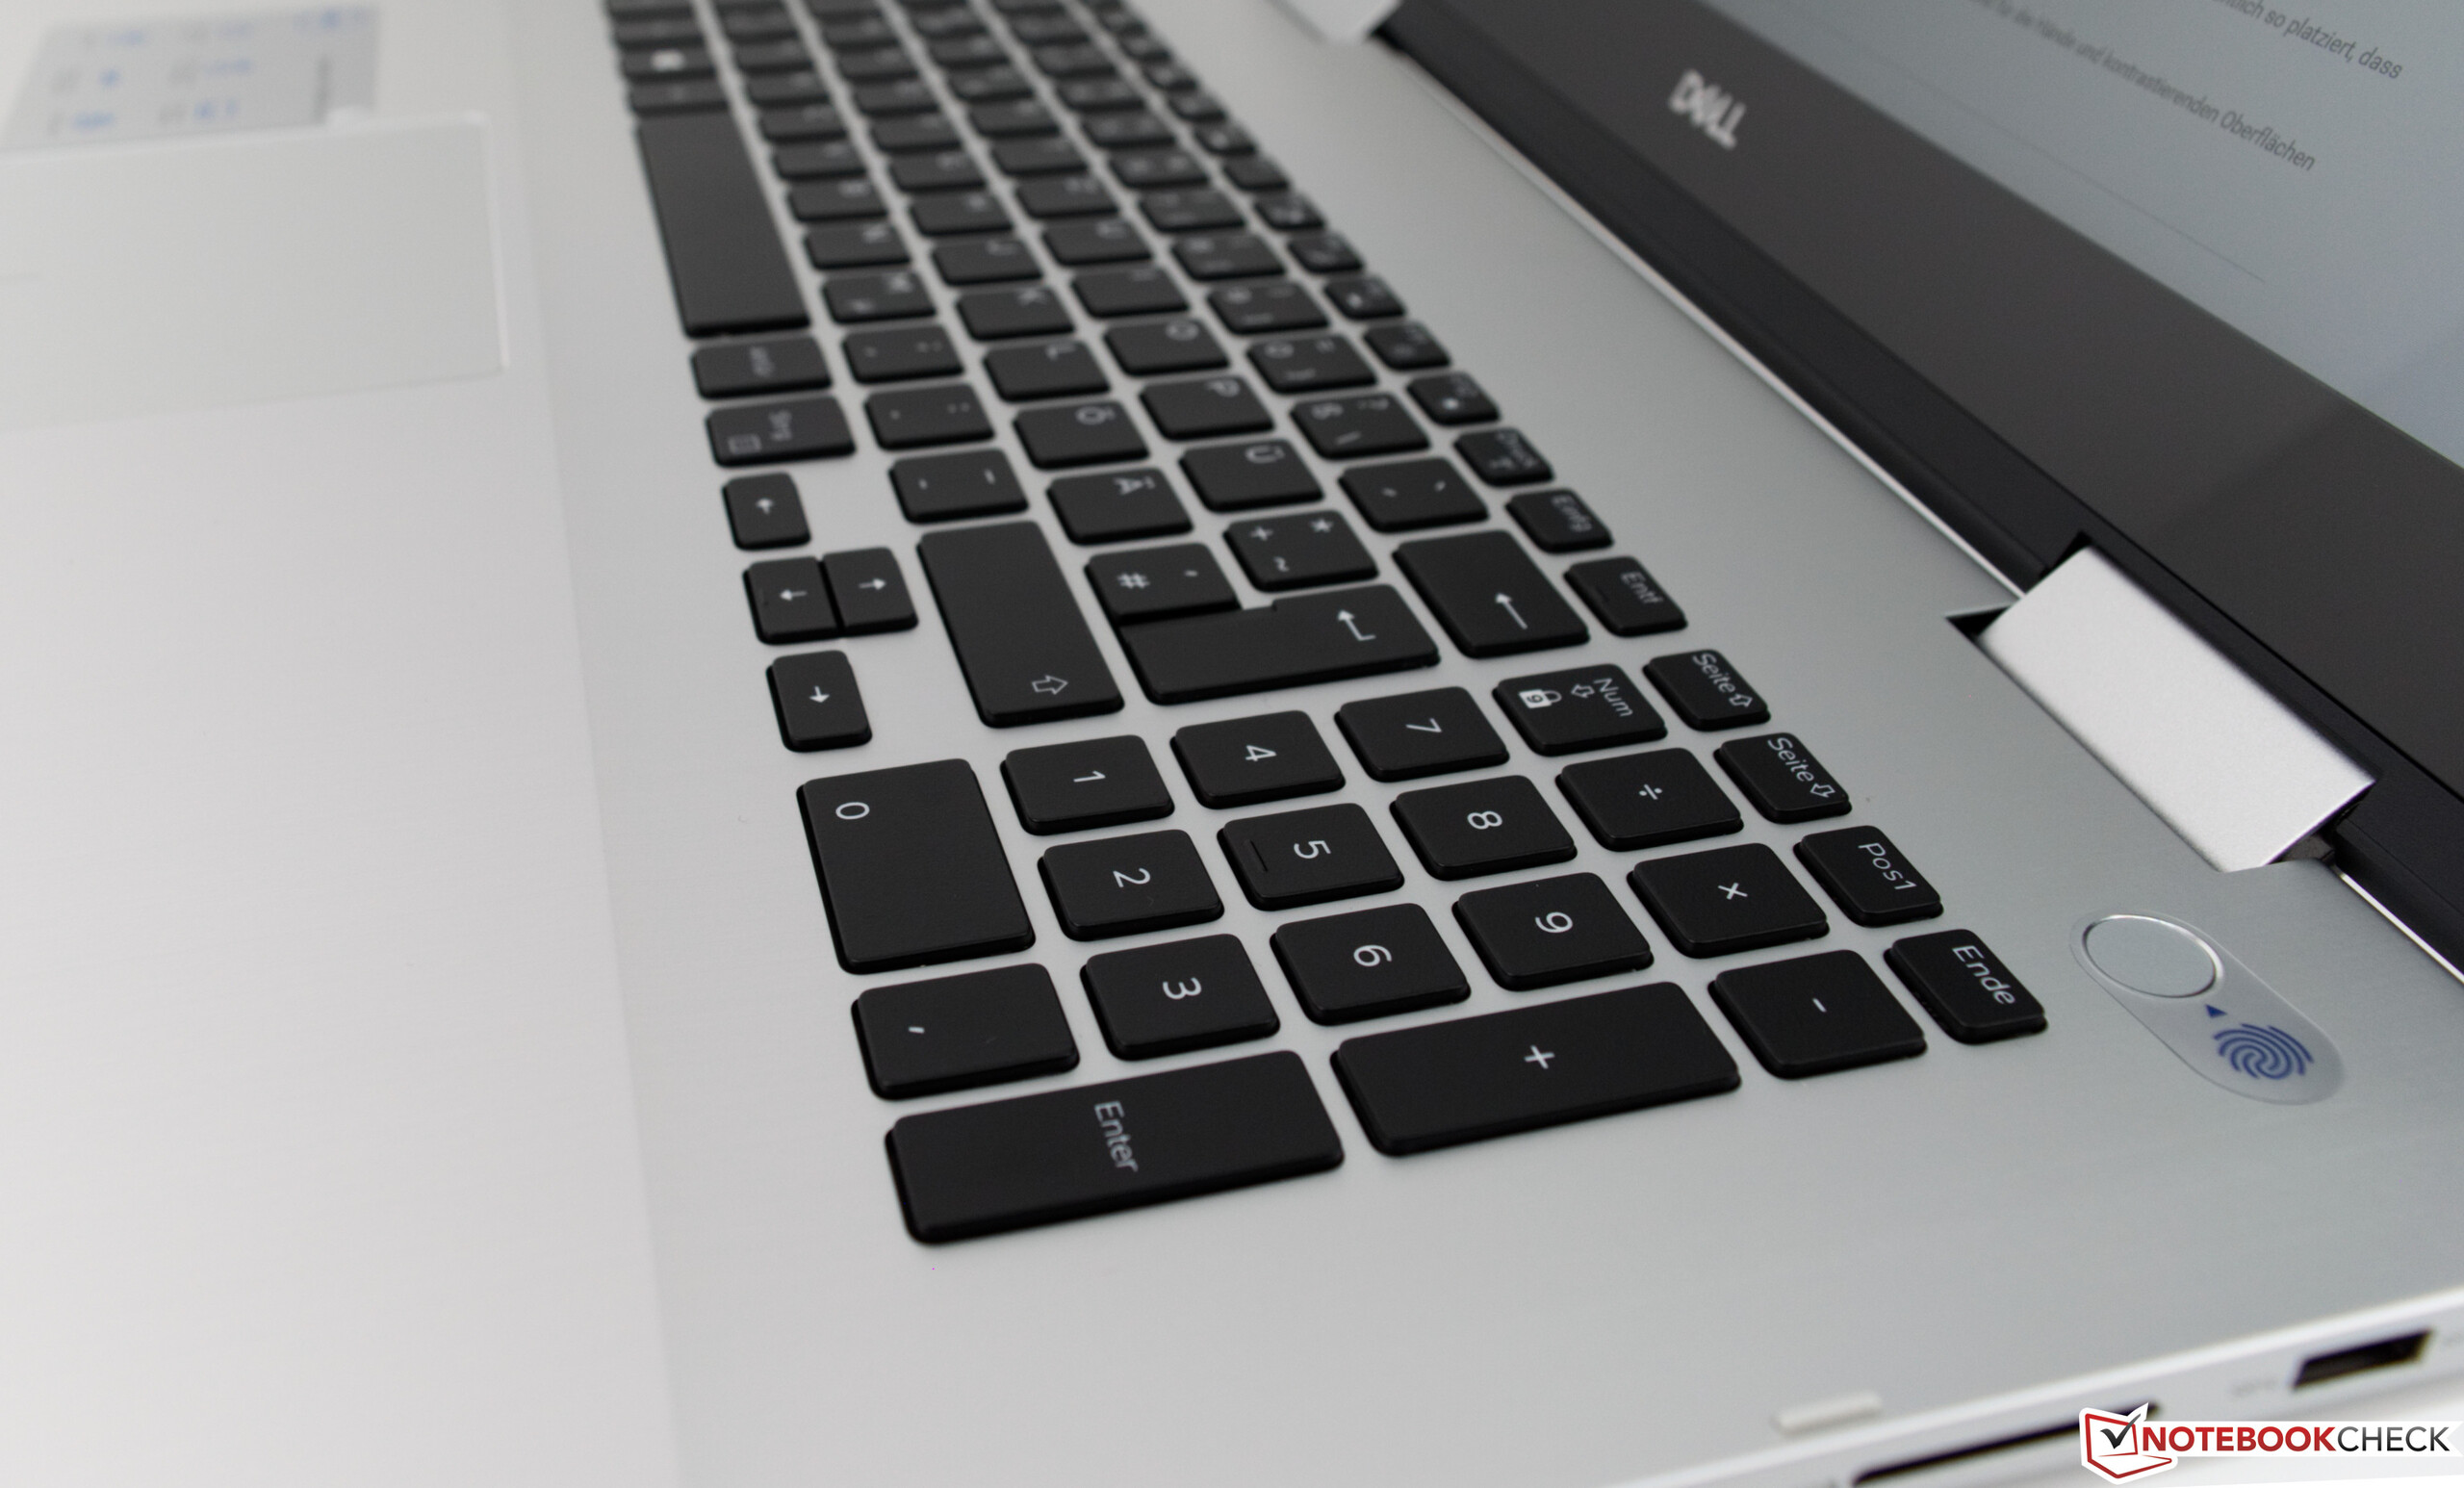
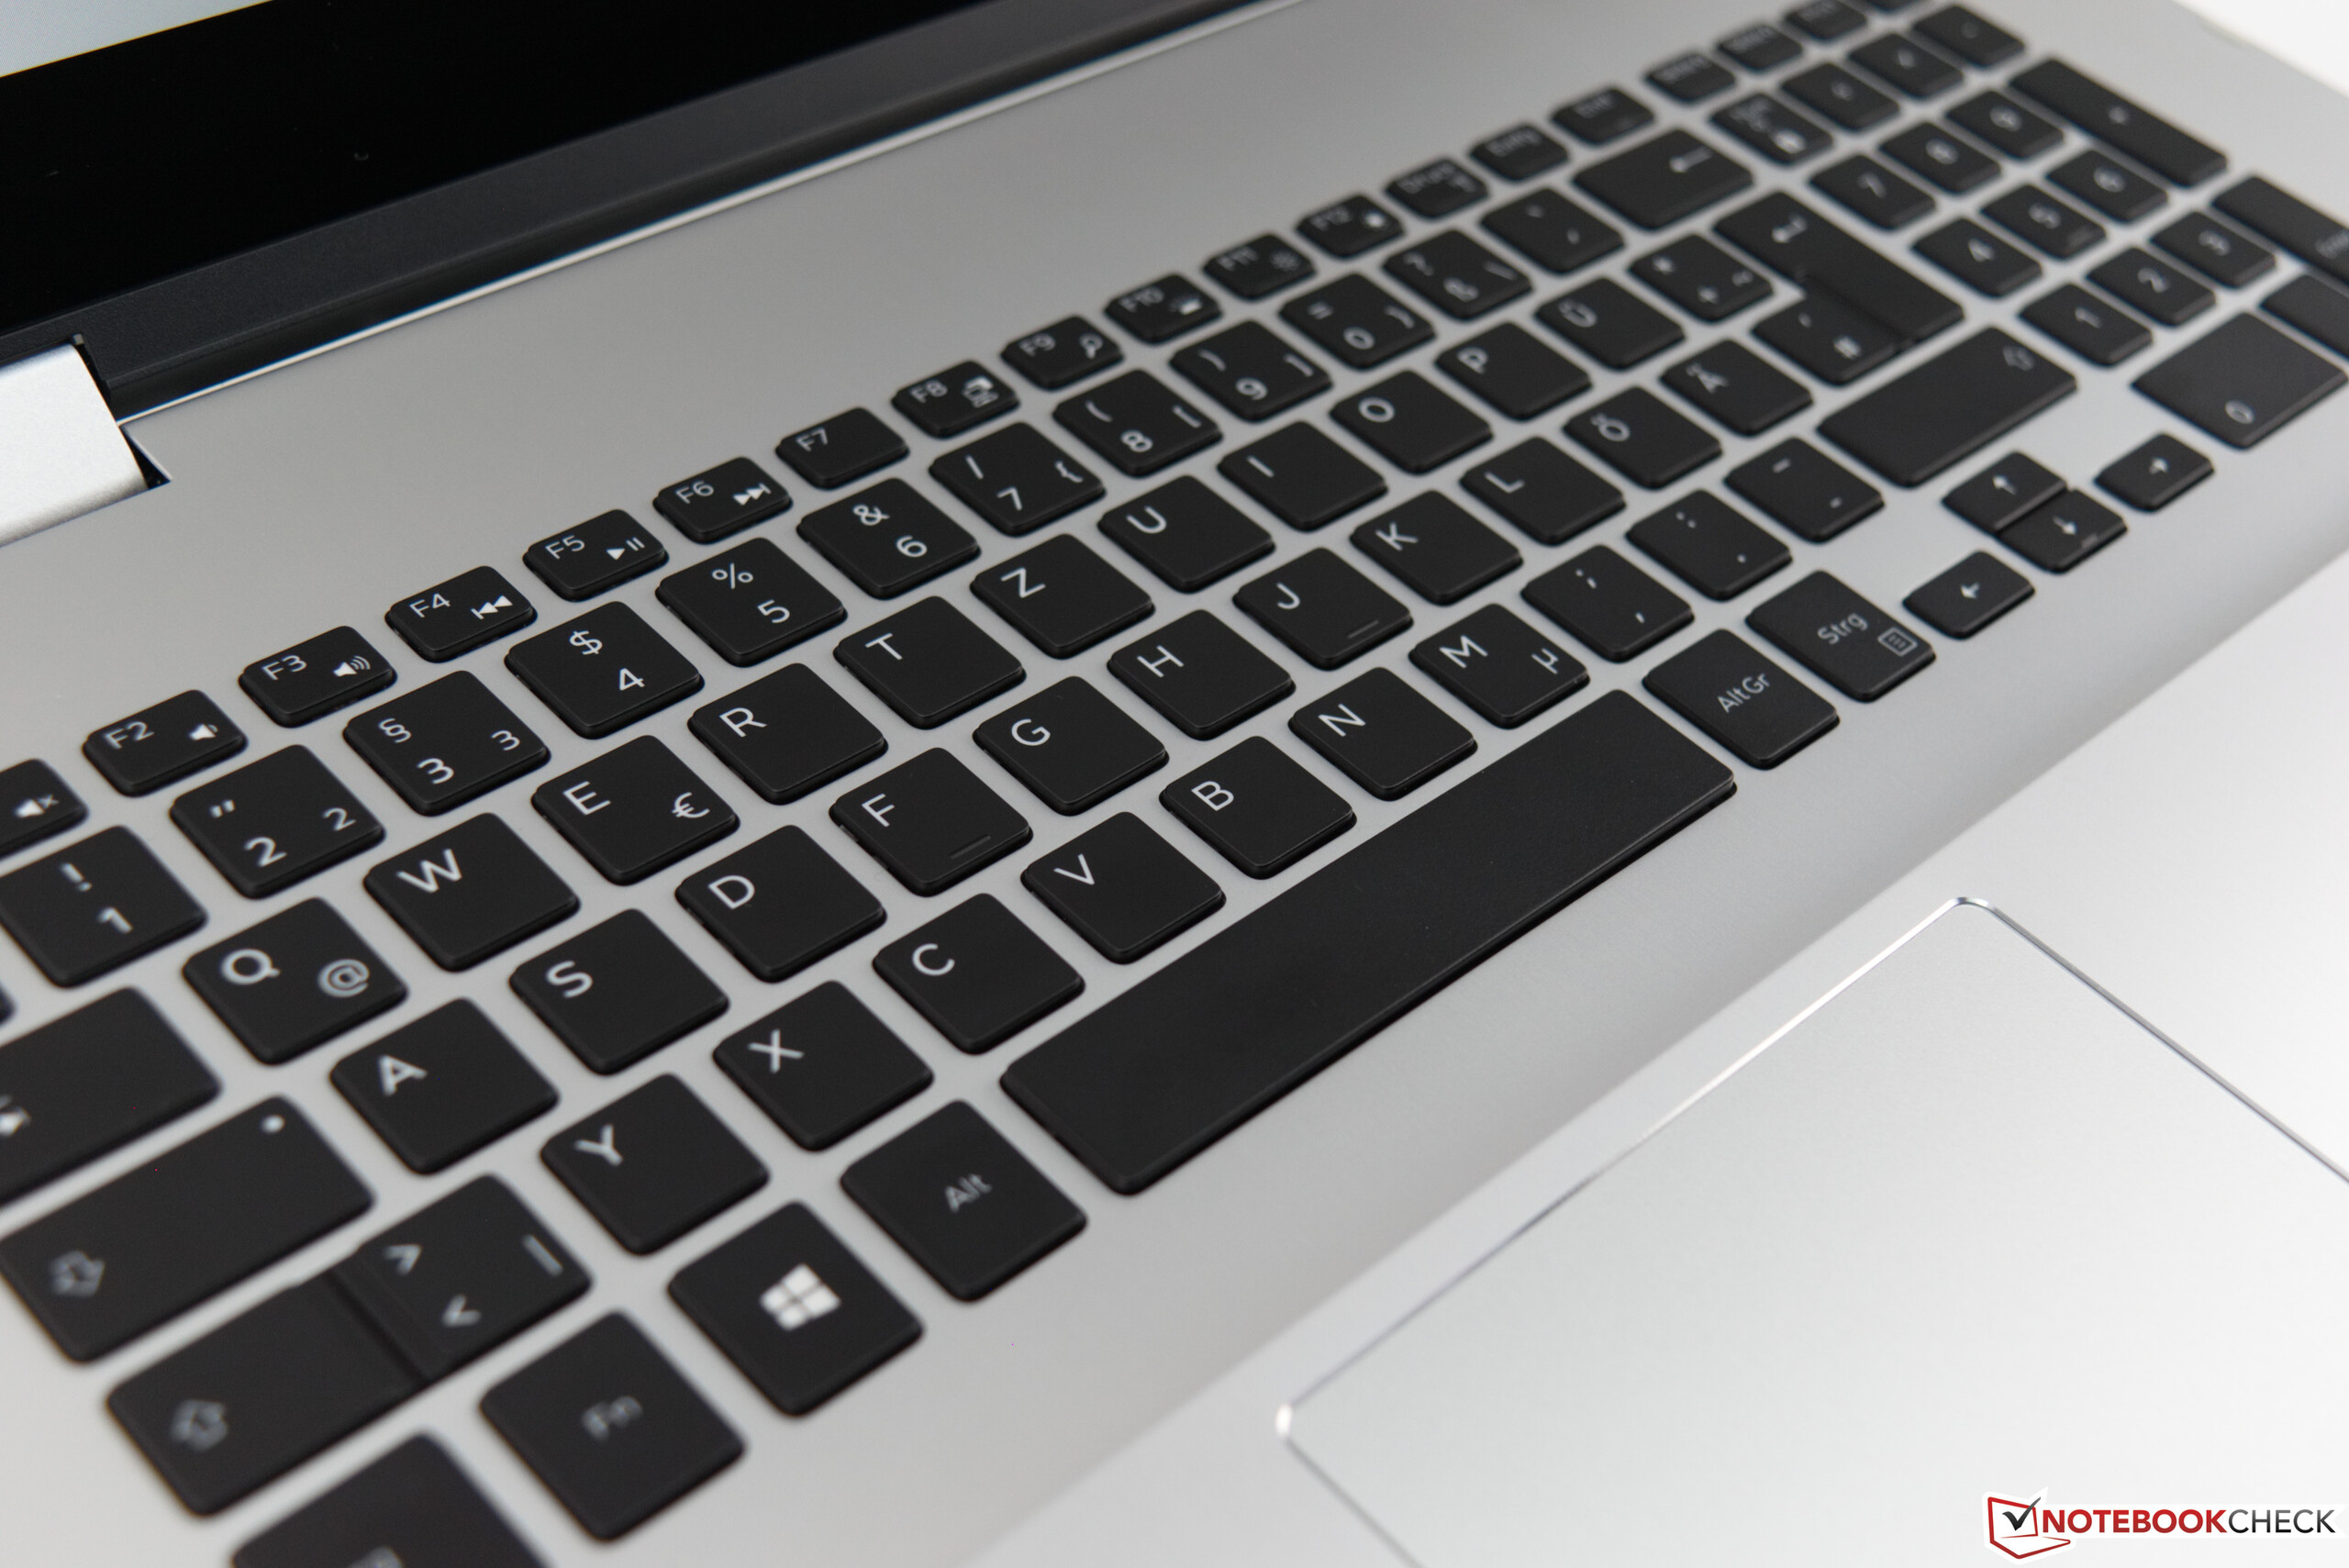
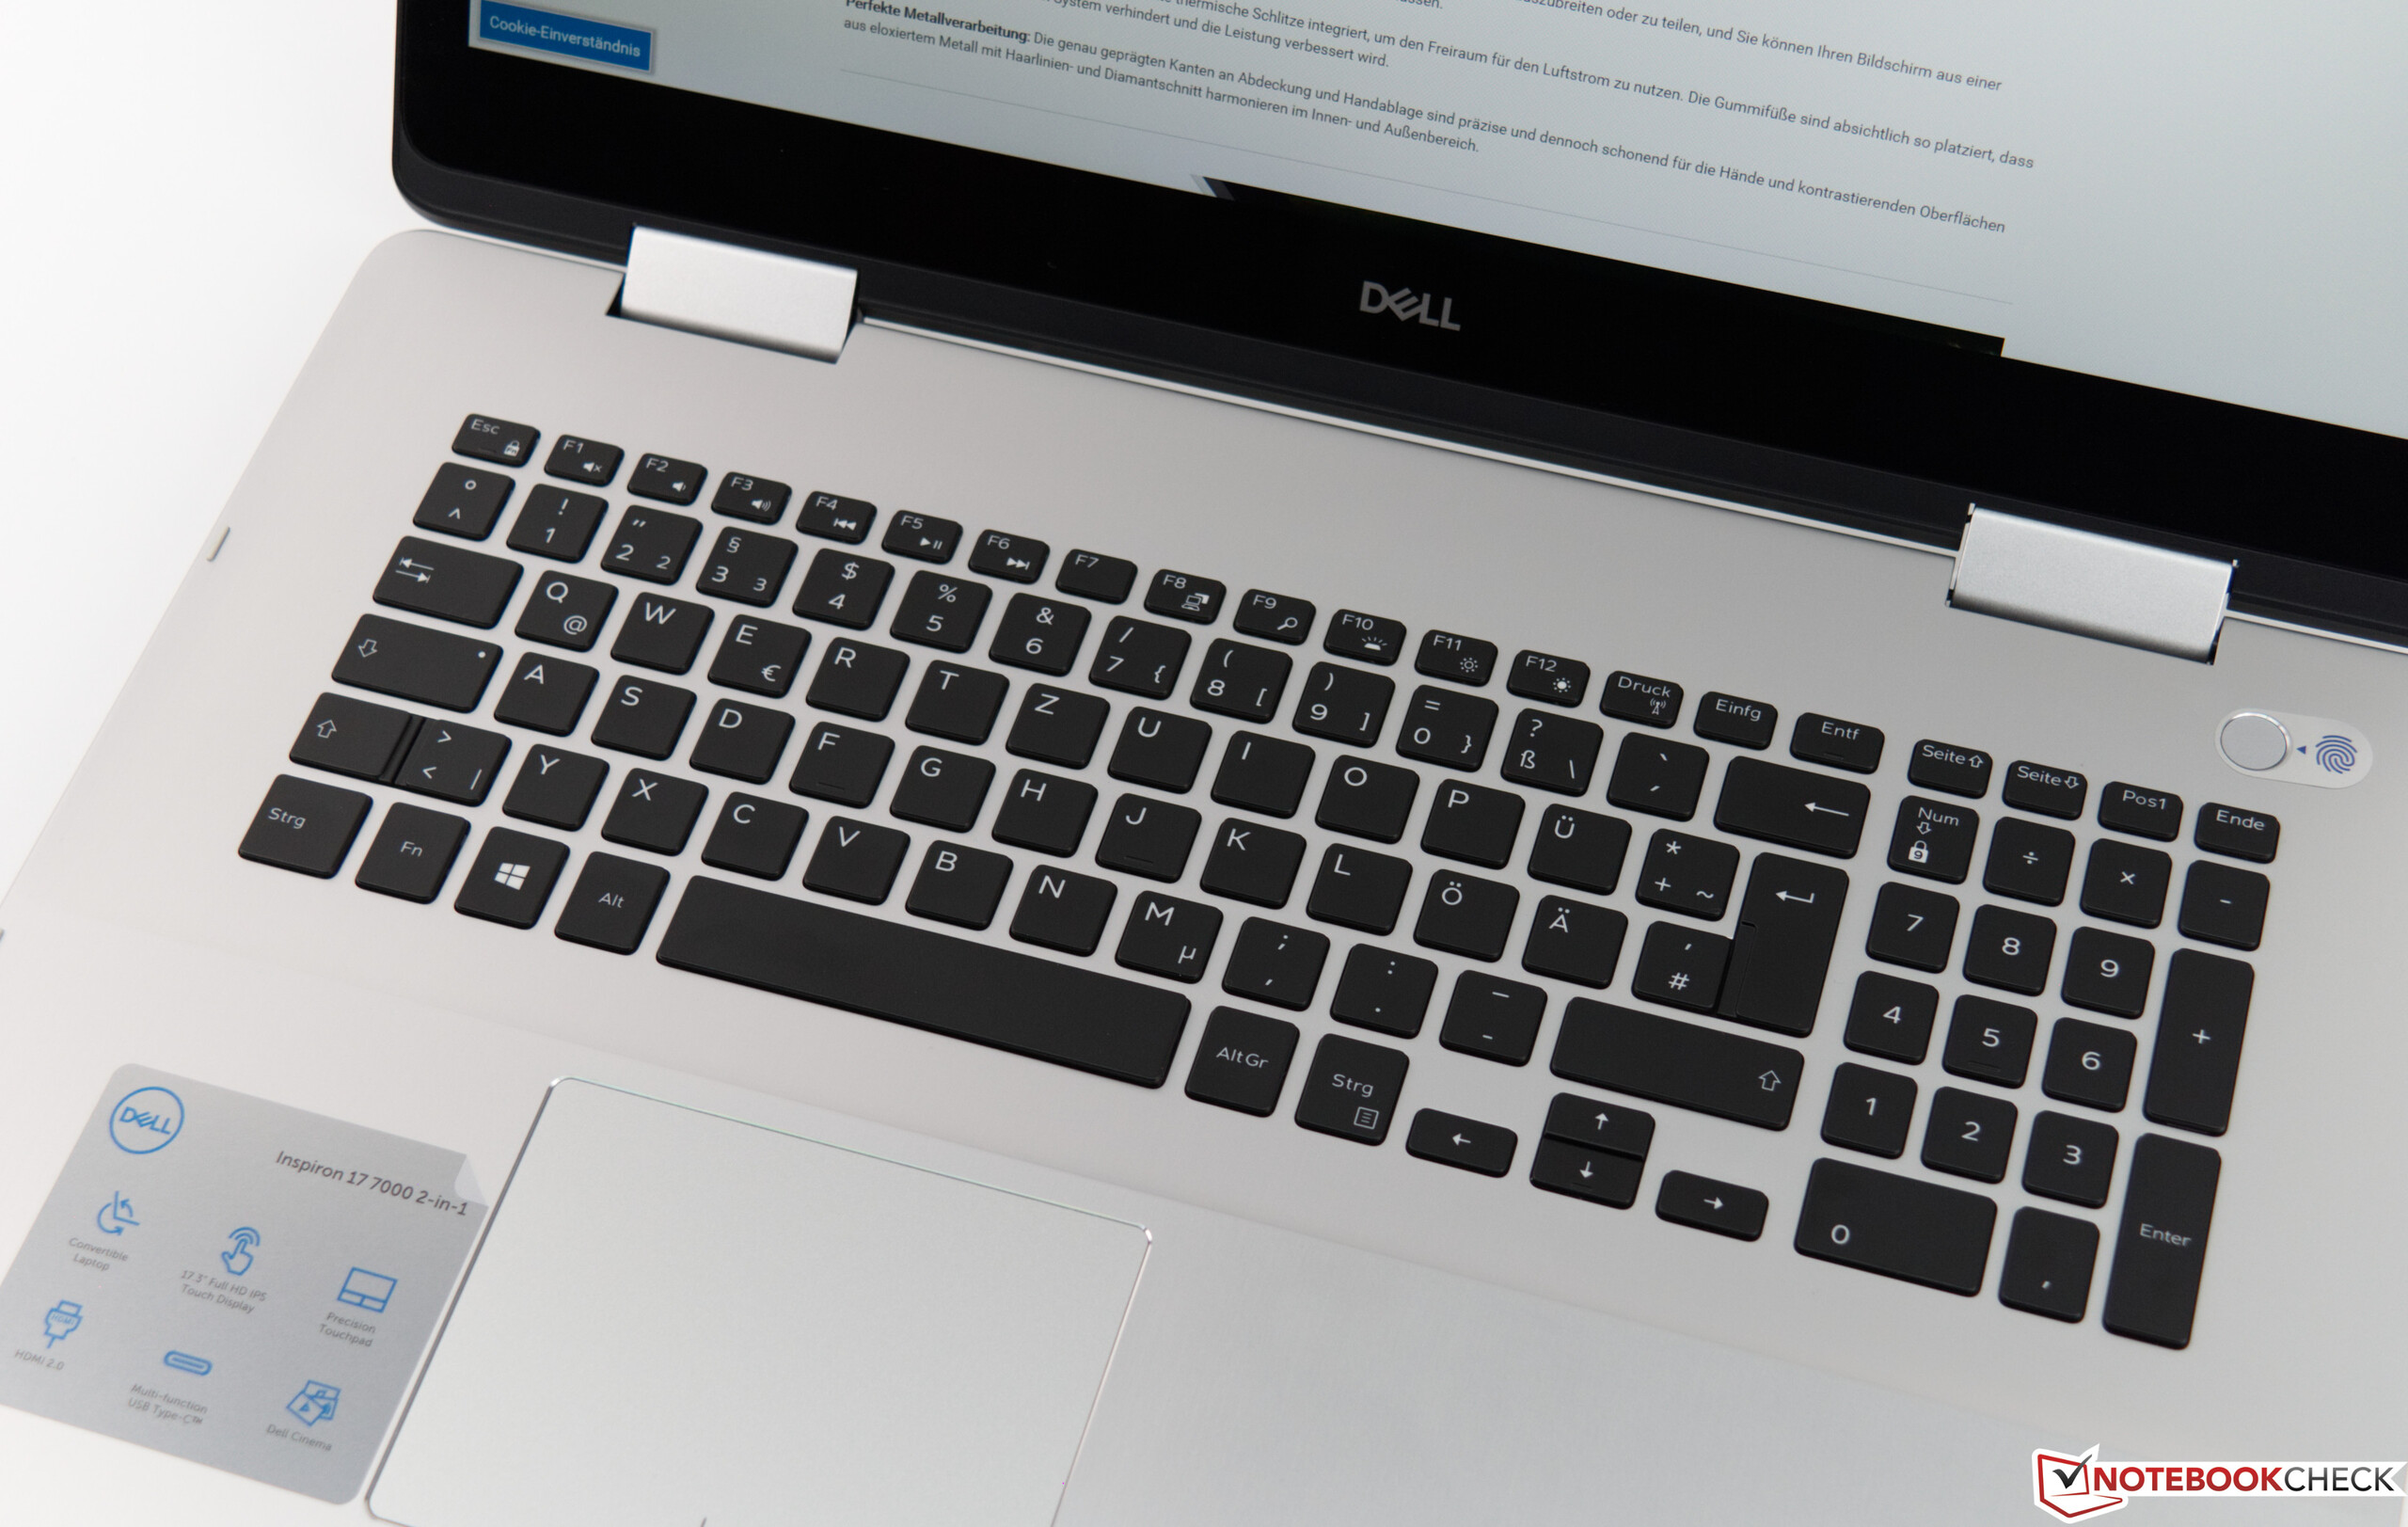
Dell Inspiron 17-7786 lyckades övertyga oss med riktigt bra materialval och en robust bas. Inmatningsenheterna är bra och användbara även om en del mindre detaljer förhindrade en bättre utvärdering. Skrivupplevelsen är bättre än på föregångaren och tangenternas höjd har justerats.
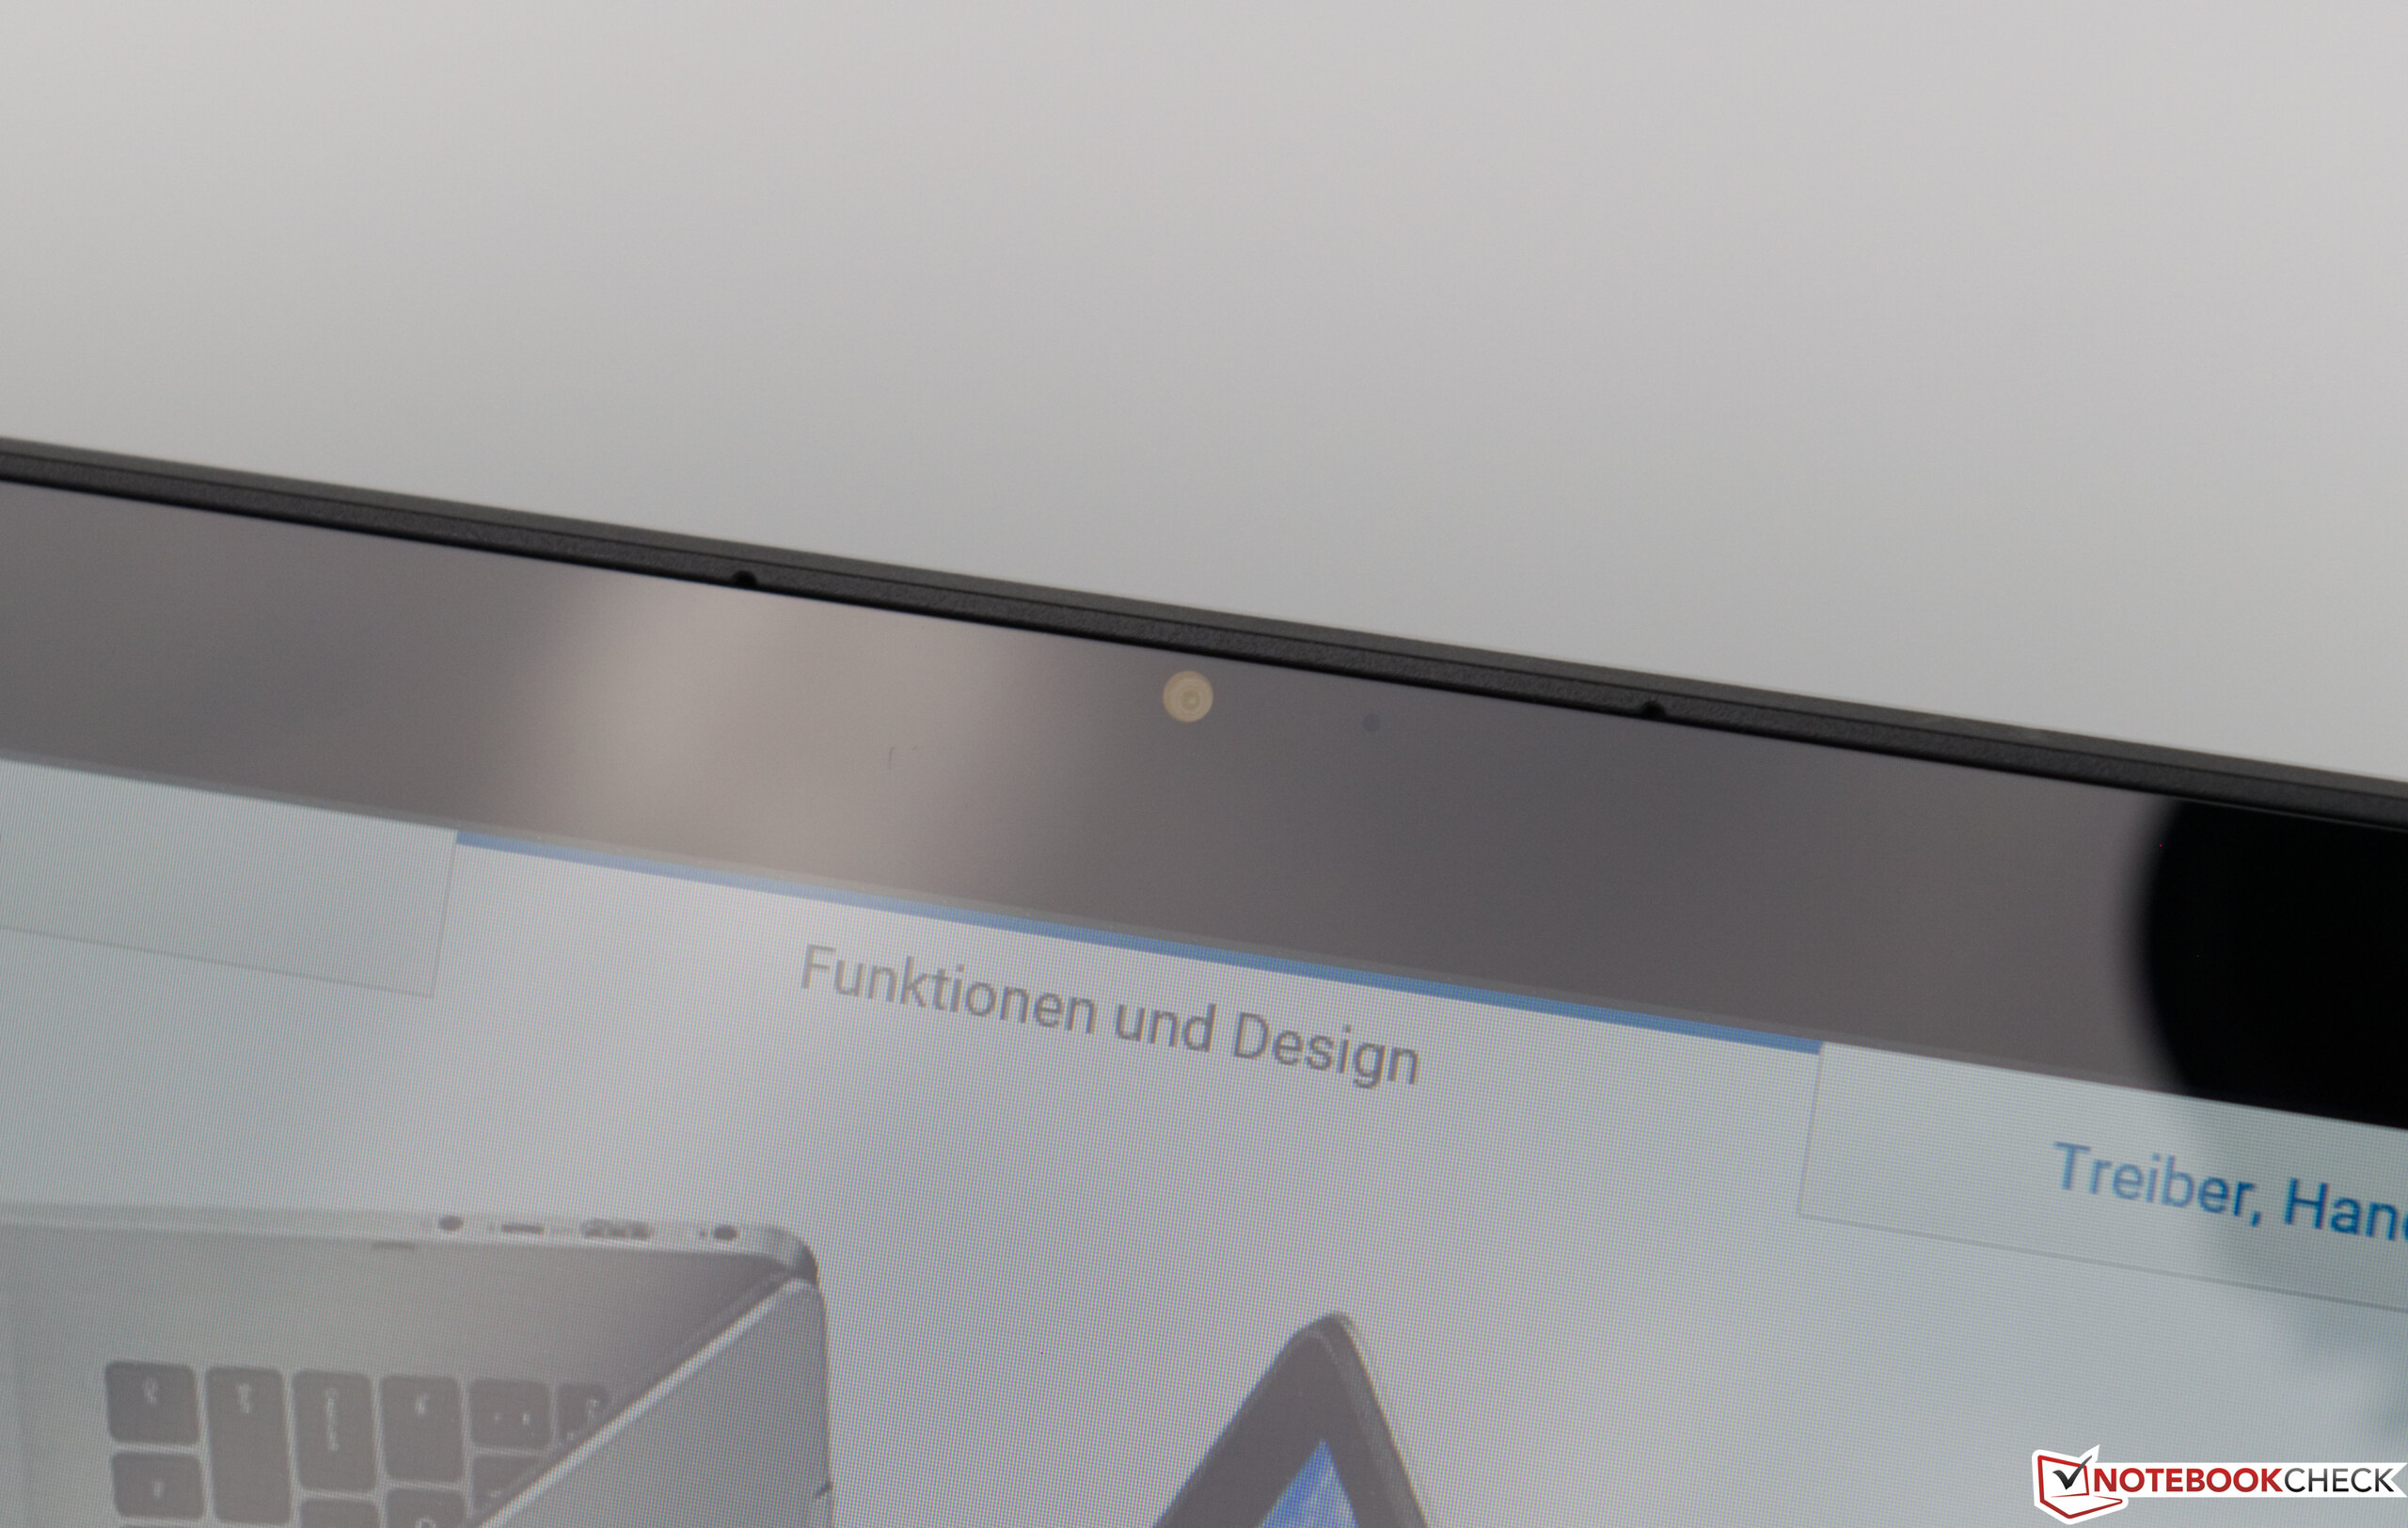
Jämfört med föregångaren är skärmen en aning mer ljusstark och mer responsiv, men i fråga om färgrymdstäckning kan den nya enheten inte riktigt hålla jämna steg med Inspiron 17-7773. På grund av den kraftigt reflekterande ytan räcker inte den förbättrade ljusstyrkan för att göra någon ordentlig skillnad när enheten används utomhus.
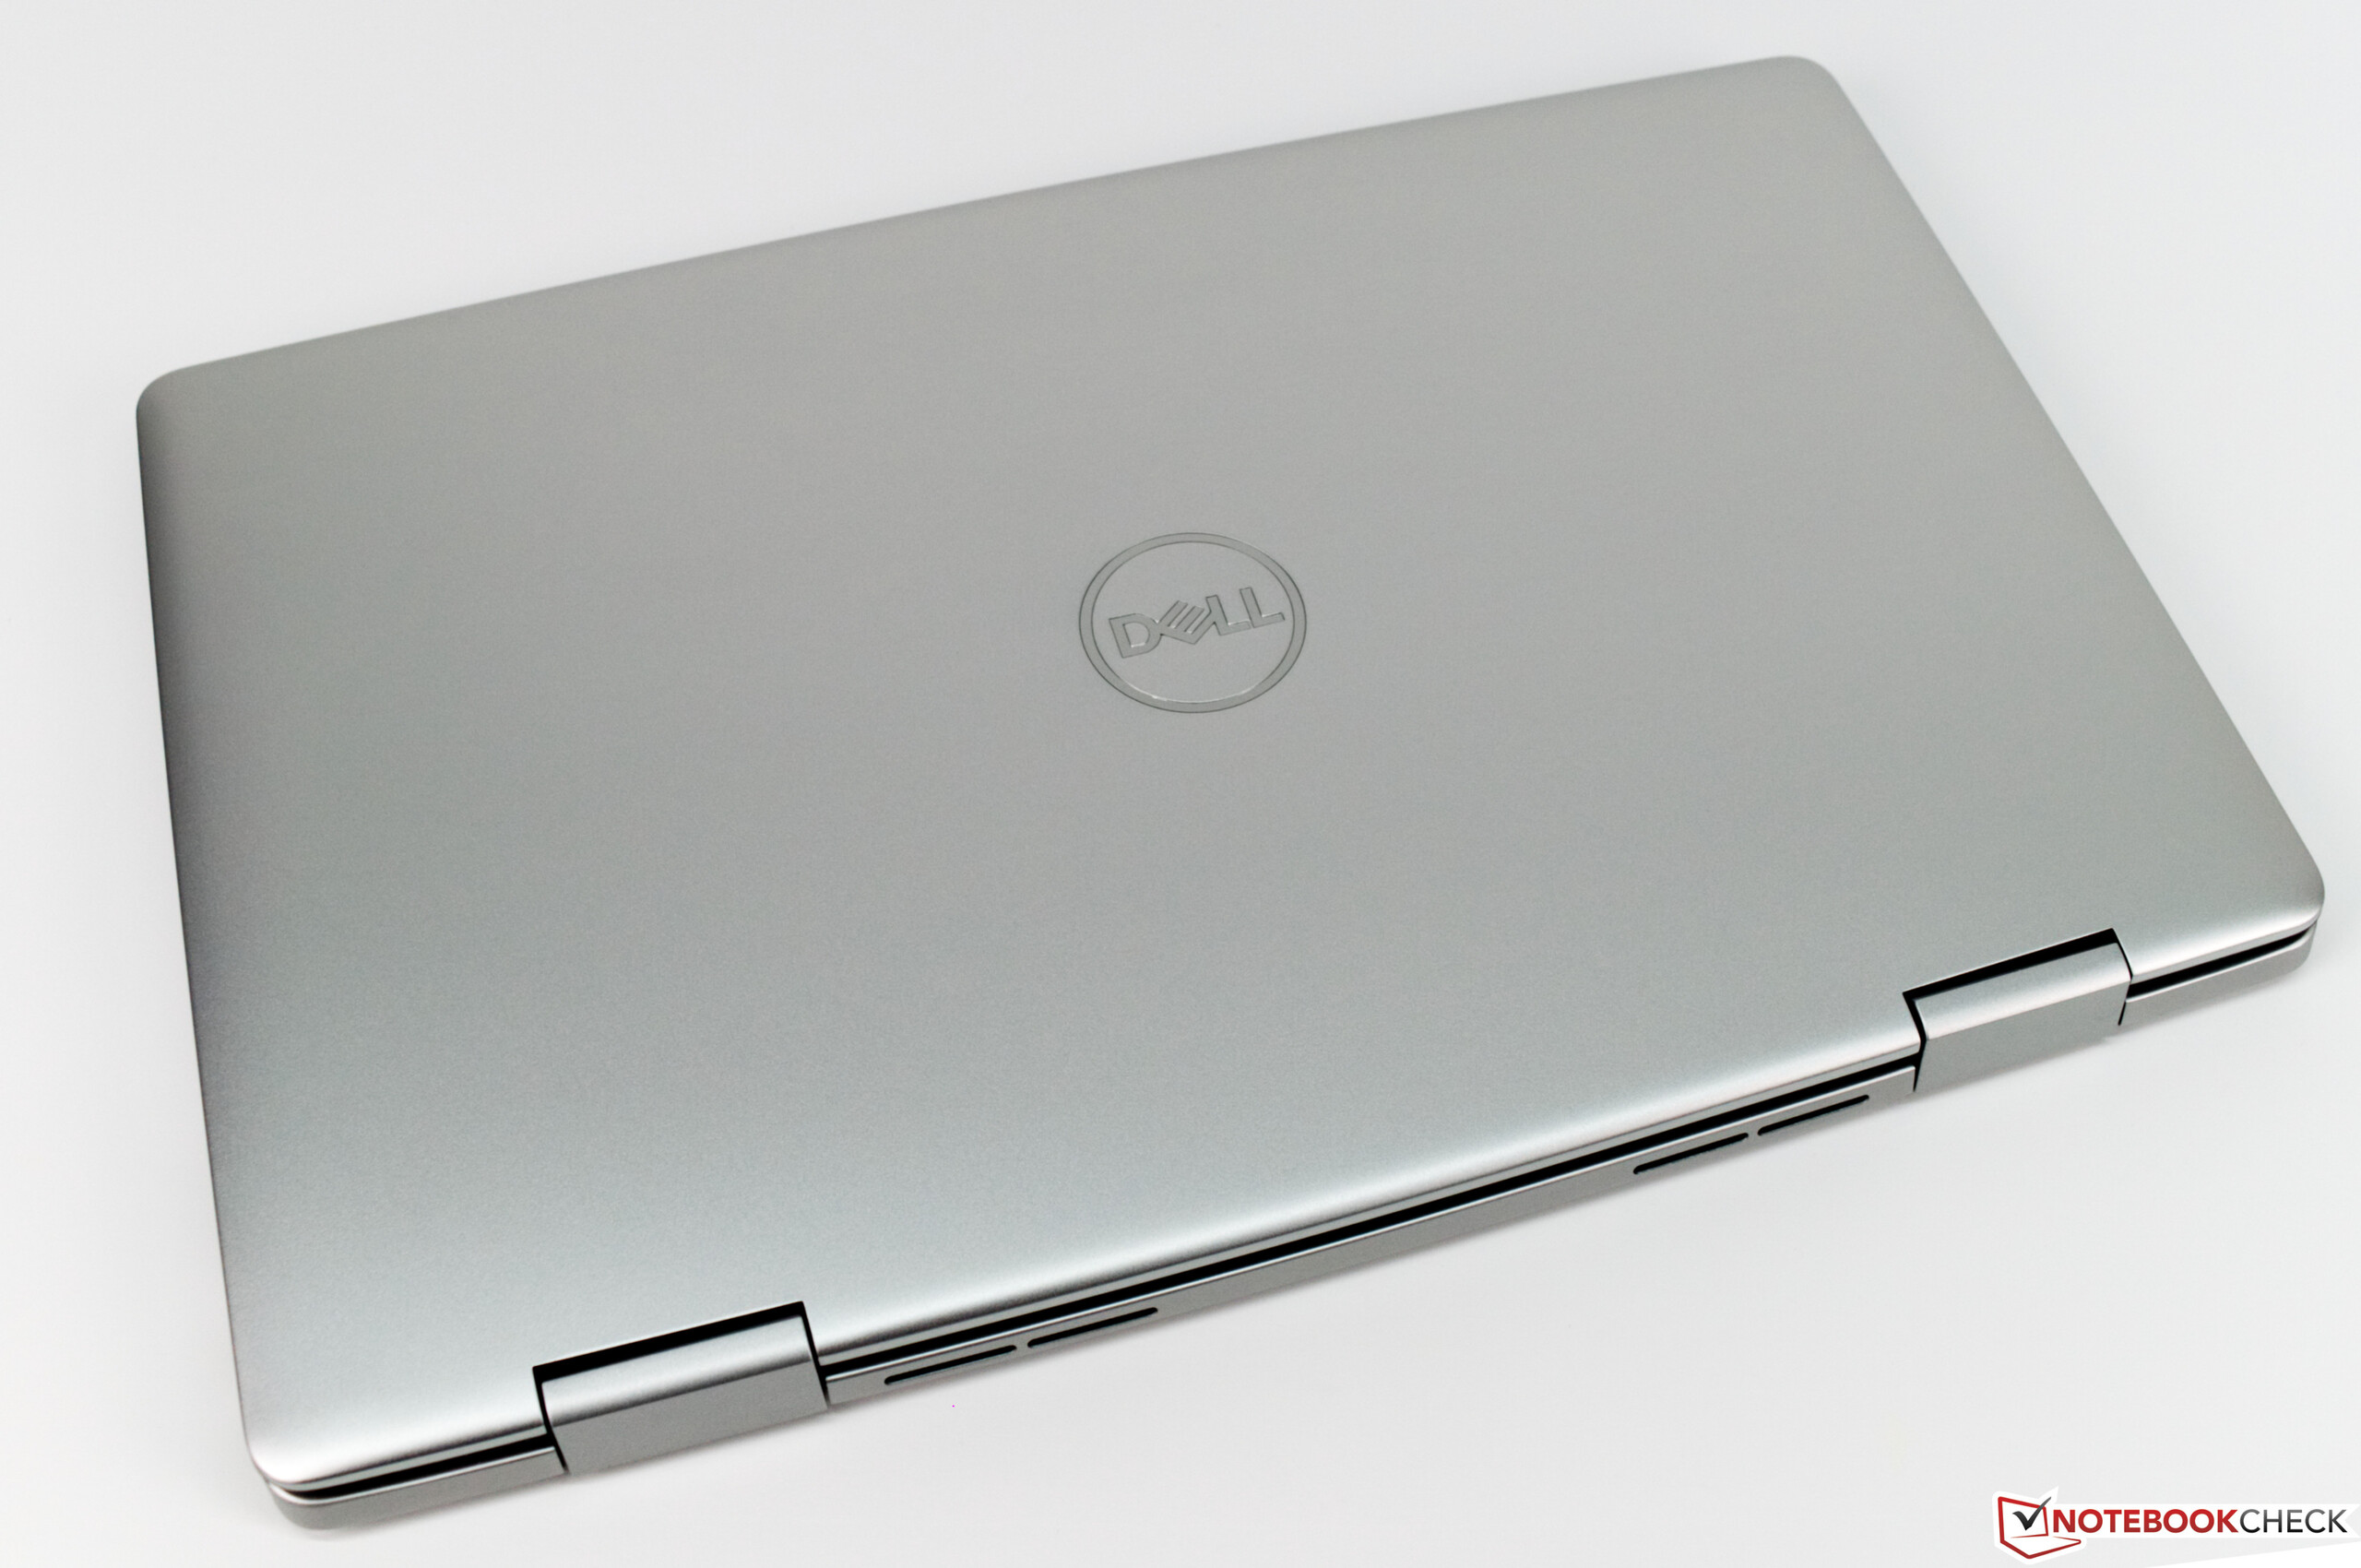
Totalt sett är Dell Inspiron 17-7786 en framgångsrik uppgradering med kraftigt förbättrad energiförbrukning och betydligt längre batteritid.
Dell Inspiron 17-7786
- 01/31/2019 v6 (old)
Sebastian Bade
Price comparison
