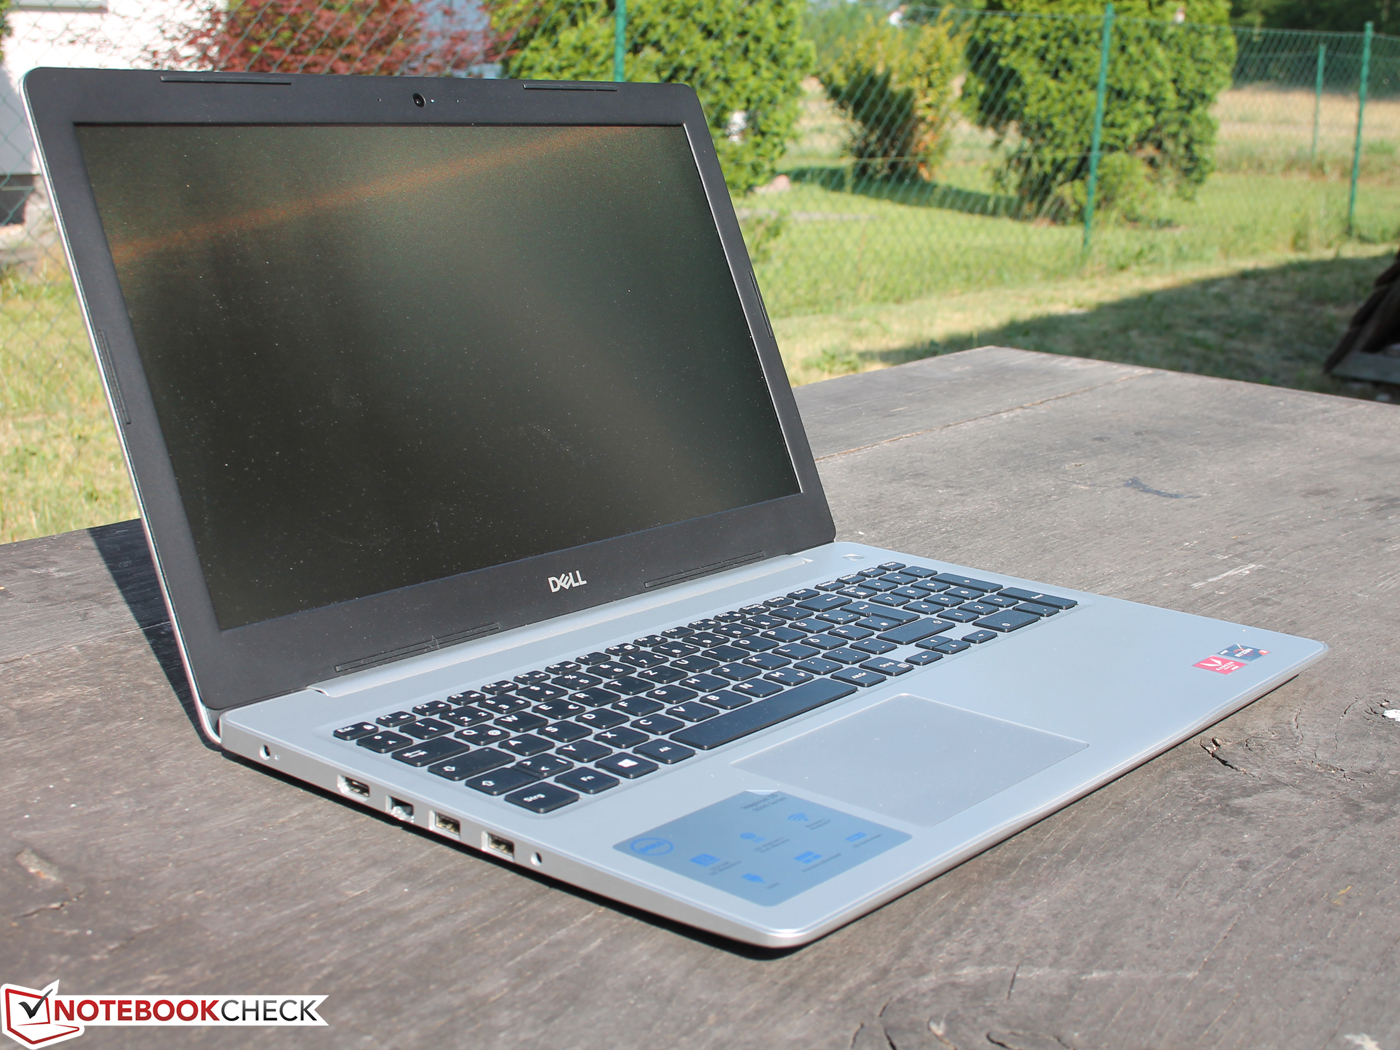
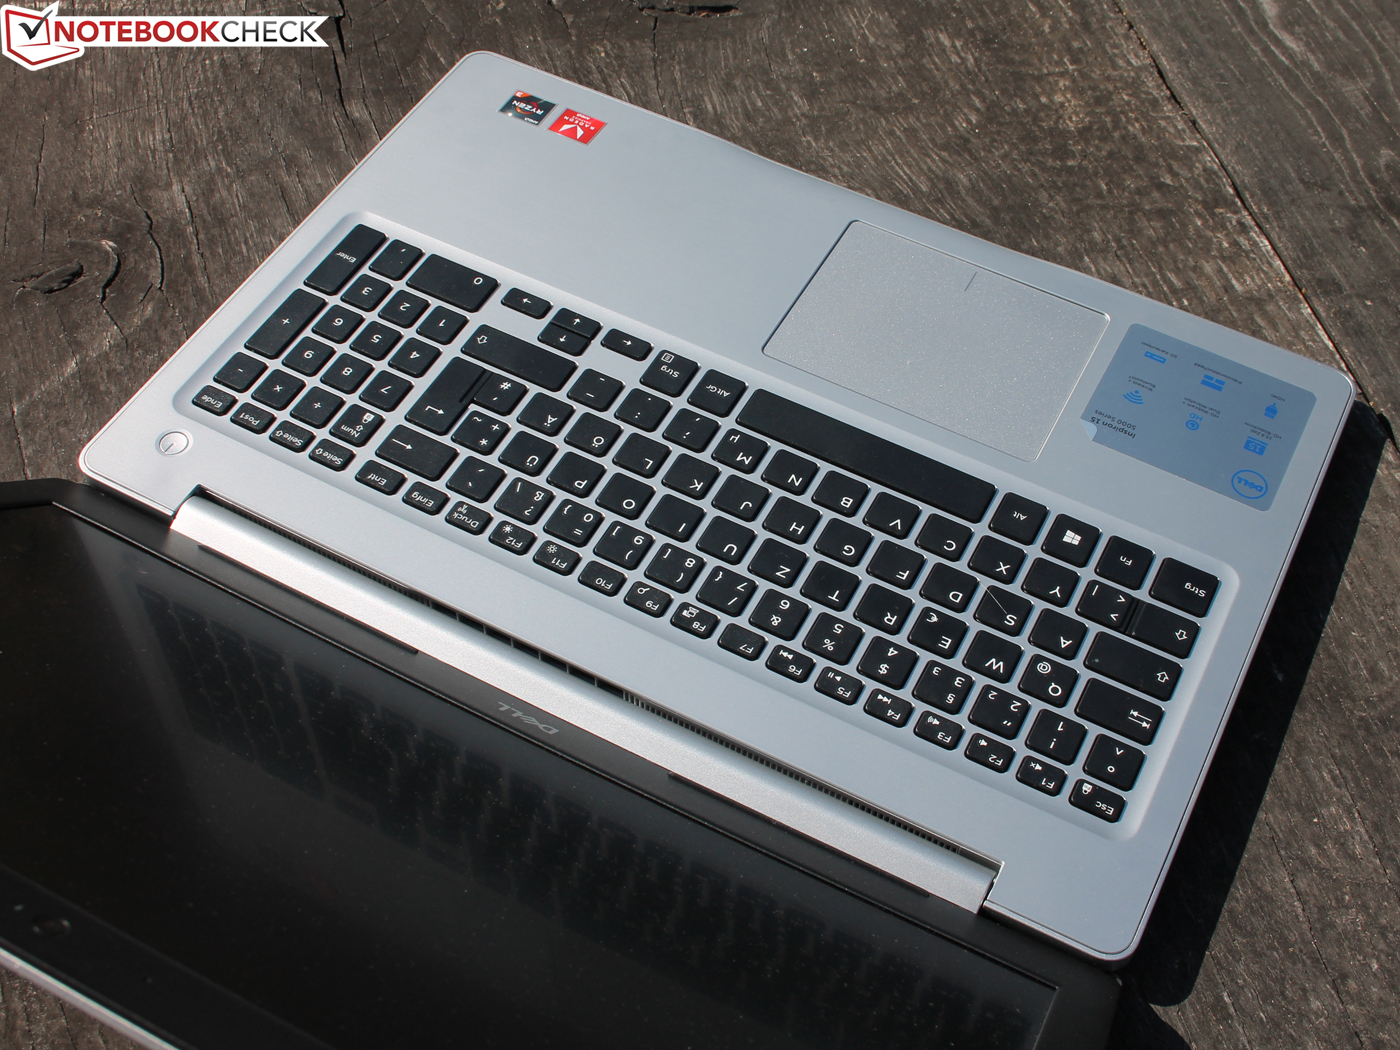
Test: Dell Inspiron 15 5575 (Ryzen 3 2200U, Vega 3) Laptop (Sammanfattning)
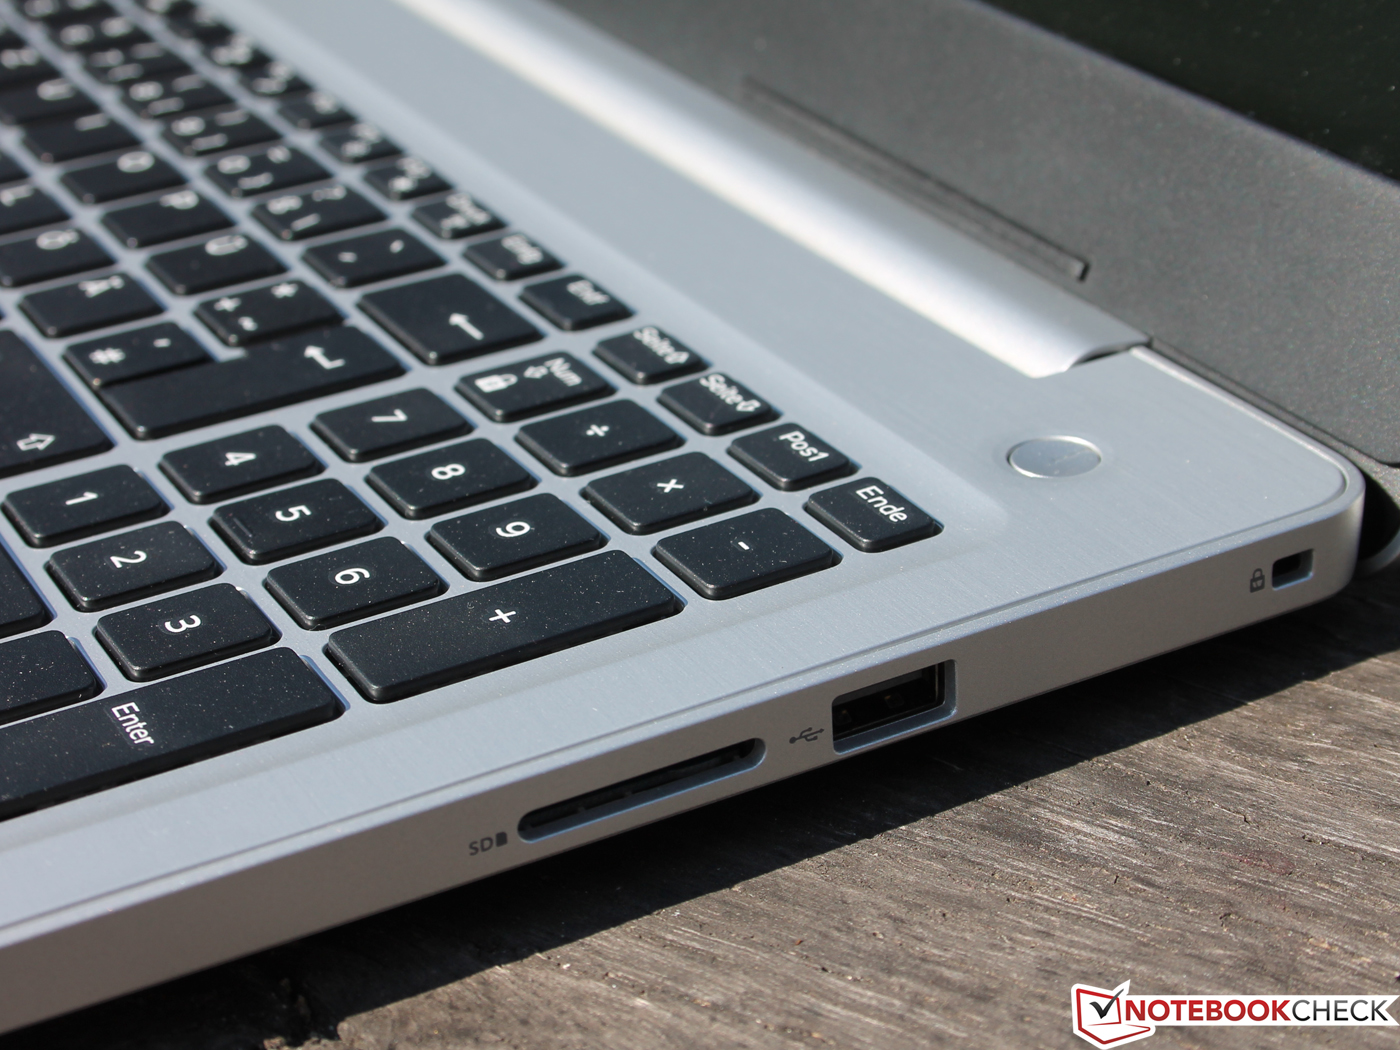
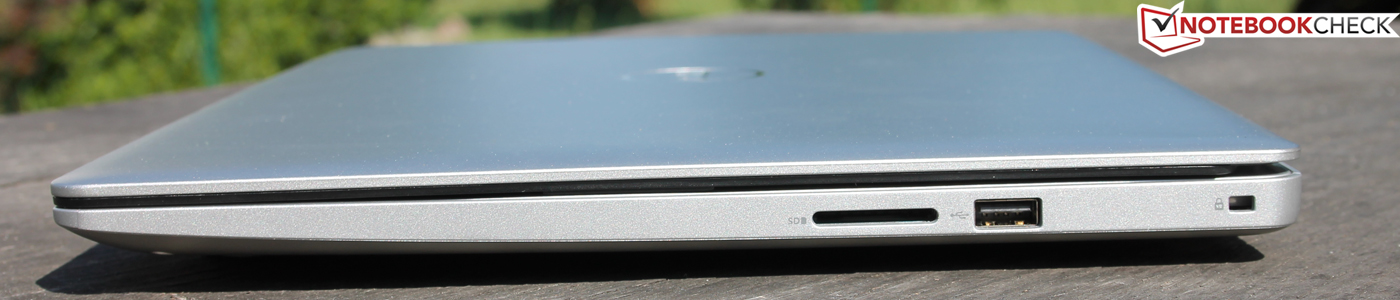
| SD Card Reader | |
| average JPG Copy Test (av. of 3 runs) | |
| Acer Aspire 3 A315-51-30YA (Toshiba Exceria Pro SDXC 64 GB UHS-II) | |
| Acer Aspire 3 A315-41-R7BM (Toshiba Exceria Pro SDXC 64 GB UHS-II) | |
| Genomsnitt av klass Office (19.8 - 198.5, n=22, senaste 2 åren) | |
| Dell Inspiron 15 5575-98MH4 (Toshiba Exceria Pro SDXC 64 GB UHS-II) | |
| Asus X510UA-BR305T (Toshiba Exceria Pro SDXC 64 GB UHS-II) | |
| Acer Extensa 2540-580K (Toshiba Exceria Pro SDXC 64 GB UHS-II) | |
| HP 250 G6 2UB93ES (Toshiba Exceria Pro SDXC 64 GB UHS-II) | |
| Dell Inspiron 15 5000 5567-1753 (Toshiba Exceria Pro SDXC 64 GB UHS-II) | |
| Lenovo V330-15IKB (Toshiba Exceria Pro SDXC 64 GB UHS-II) | |
| maximum AS SSD Seq Read Test (1GB) | |
| Acer Aspire 3 A315-41-R7BM (Toshiba Exceria Pro SDXC 64 GB UHS-II) | |
| Genomsnitt av klass Office (27.4 - 249, n=21, senaste 2 åren) | |
| Asus X510UA-BR305T (Toshiba Exceria Pro SDXC 64 GB UHS-II) | |
| Dell Inspiron 15 5575-98MH4 (Toshiba Exceria Pro SDXC 64 GB UHS-II) | |
| HP 250 G6 2UB93ES (Toshiba Exceria Pro SDXC 64 GB UHS-II) | |
| Dell Inspiron 15 5000 5567-1753 (Toshiba Exceria Pro SDXC 64 GB UHS-II) | |
| Acer Extensa 2540-580K (Toshiba Exceria Pro SDXC 64 GB UHS-II) | |
| Lenovo V330-15IKB (Toshiba Exceria Pro SDXC 64 GB UHS-II) | |
| Networking | |
| iperf3 transmit AX12 | |
| Asus X510UA-BR305T | |
| HP 250 G6 2UB93ES | |
| Acer Aspire 3 A315-51-30YA | |
| Acer Aspire 3 A315-41-R7BM | |
| Acer Extensa 2540-580K | |
| Dell Inspiron 15 5575-98MH4 | |
| Dell Inspiron 15 5000 5567-1753 | |
| Lenovo V330-15IKB | |
| iperf3 receive AX12 | |
| Asus X510UA-BR305T | |
| Dell Inspiron 15 5000 5567-1753 | |
| Acer Aspire 3 A315-51-30YA | |
| Acer Aspire 3 A315-41-R7BM | |
| Dell Inspiron 15 5575-98MH4 | |
| Lenovo V330-15IKB | |
| Acer Extensa 2540-580K | |
| HP 250 G6 2UB93ES | |
| |||||||||||||||||||||||||
Distribution av ljusstyrkan: 78 %
Mitt på batteriet: 202 cd/m²
Kontrast: 458:1 (Svärta: 0.43 cd/m²)
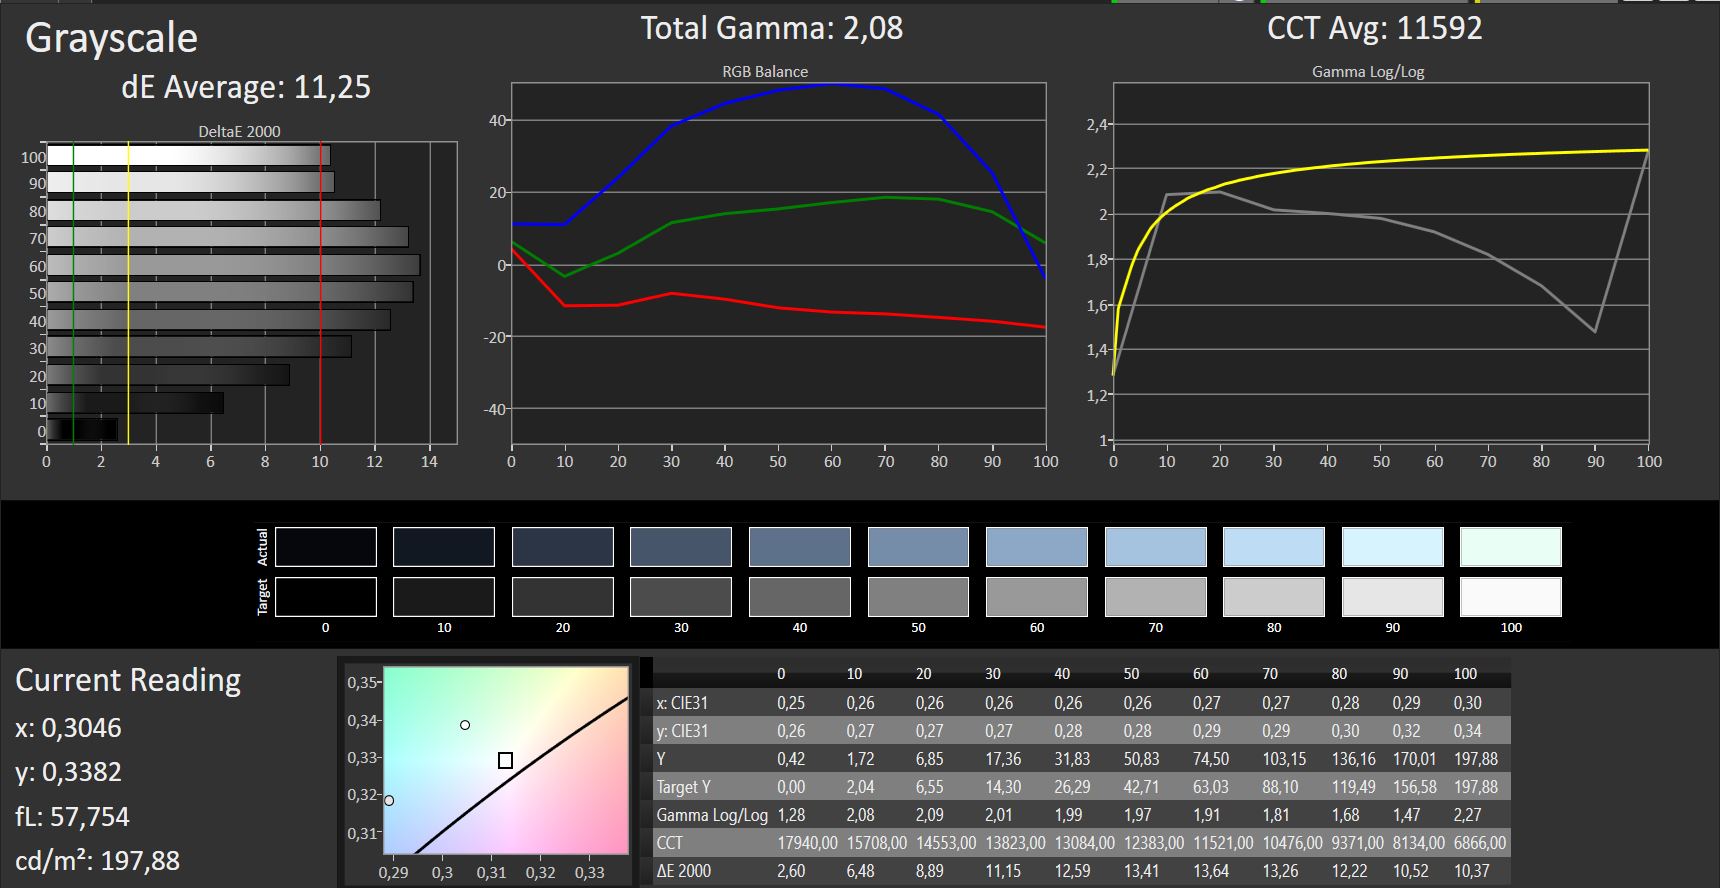
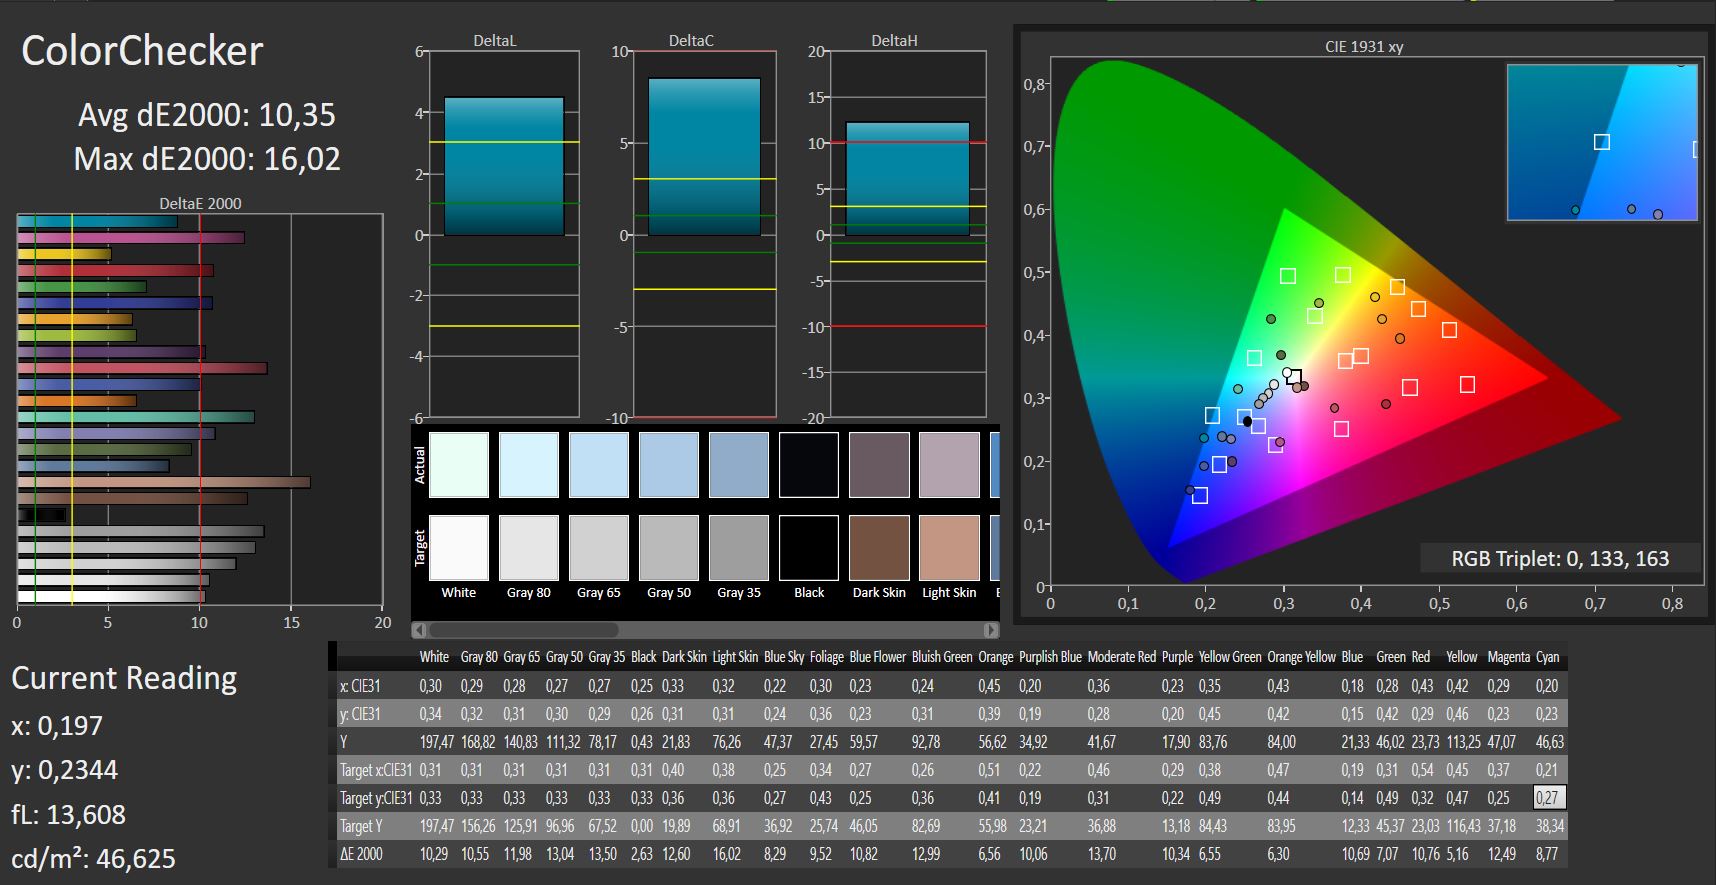
ΔE ColorChecker Calman: 10.35 | ∀{0.5-29.43 Ø4.71}
ΔE Greyscale Calman: 11.25 | ∀{0.09-98 Ø4.96}
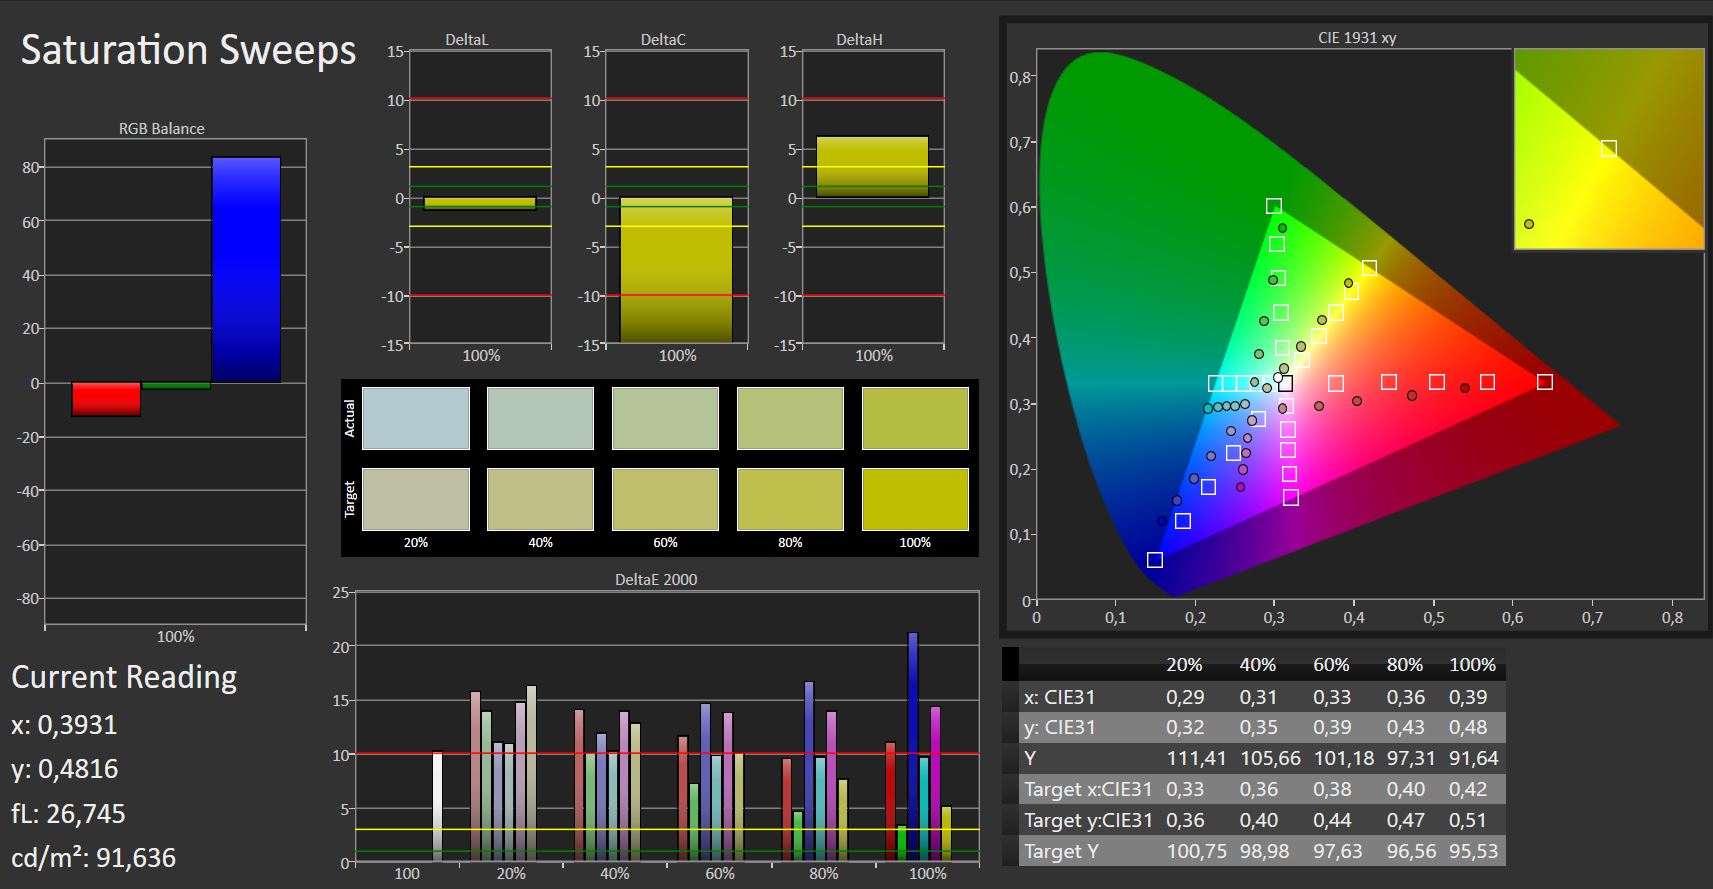
60% sRGB (Argyll 1.6.3 3D)
38% AdobeRGB 1998 (Argyll 1.6.3 3D)
41.37% AdobeRGB 1998 (Argyll 3D)
59.8% sRGB (Argyll 3D)
40.02% Display P3 (Argyll 3D)
Gamma: 2.08
CCT: 11592 K
| Dell Inspiron 15 5575-98MH4 Innolux JMC9X 156BGA, , 1366x768, 15.6" | Acer Aspire 3 A315-41-R7BM Chi Mei CMN15D5, , 1920x1080, 15.6" | Lenovo V330-15IKB Chi Mei N156HGA-EAB, , 1920x1080, 15.6" | Asus X510UA-BR305T Chi Mei N156BGA-EA3, , 1366x768, 15.6" | HP 250 G6 2UB93ES BOE BOE0687, , 1920x1080, 15.6" | Dell Inspiron 15 5000 5567-1753 BOE NT15N41, , 1920x1080, 15.6" | |
|---|---|---|---|---|---|---|
| Display | 0% | -2% | -2% | -9% | ||
| Display P3 Coverage (%) | 40.02 | 40.09 0% | 39.32 -2% | 39.11 -2% | 36.24 -9% | |
| sRGB Coverage (%) | 59.8 | 59.7 0% | 58.8 -2% | 58.8 -2% | 54.6 -9% | |
| AdobeRGB 1998 Coverage (%) | 41.37 | 41.47 0% | 40.65 -2% | 40.41 -2% | 37.44 -9% | |
| Response Times | 27% | 6% | 22% | 31% | 28% | |
| Response Time Grey 50% / Grey 80% * (ms) | 50 ? | 44 ? 12% | 40 ? 20% | 49 ? 2% | 42 ? 16% | 43 ? 14% |
| Response Time Black / White * (ms) | 24 ? | 14 ? 42% | 26 ? -8% | 14 ? 42% | 13 ? 46% | 14 ? 42% |
| PWM Frequency (Hz) | 250 ? | 25000 ? | 25000 | 25000 ? | 2500 ? | |
| Screen | 3% | -3% | 17% | -4% | -11% | |
| Brightness middle (cd/m²) | 197 | 234 19% | 230 17% | 226 15% | 184 -7% | 145 -26% |
| Brightness (cd/m²) | 195 | 211 8% | 200 3% | 215 10% | 178 -9% | 144 -26% |
| Brightness Distribution (%) | 78 | 83 6% | 77 -1% | 90 15% | 80 3% | 90 15% |
| Black Level * (cd/m²) | 0.43 | 0.43 -0% | 0.45 -5% | 0.51 -19% | 0.38 12% | 0.49 -14% |
| Contrast (:1) | 458 | 544 19% | 511 12% | 443 -3% | 484 6% | 296 -35% |
| Colorchecker dE 2000 * | 10.35 | 11.27 -9% | 11.84 -14% | 6.21 40% | 11.29 -9% | 9.27 10% |
| Colorchecker dE 2000 max. * | 16.02 | 18.03 -13% | 20.47 -28% | 8.9 44% | 19.48 -22% | 16.9 -5% |
| Greyscale dE 2000 * | 11.25 | 11.54 -3% | 12.22 -9% | 7.06 37% | 12.43 -10% | 12.28 -9% |
| Gamma | 2.08 106% | 2.09 105% | 2.12 104% | 2.35 94% | 2.34 94% | 2.03 108% |
| CCT | 11592 56% | 11607 56% | 13073 50% | 8321 78% | 13823 47% | 10732 61% |
| Color Space (Percent of AdobeRGB 1998) (%) | 38 | 38 0% | 38 0% | 37 -3% | 35 -8% | |
| Color Space (Percent of sRGB) (%) | 60 | 60 0% | 59 -2% | 59 -2% | 55 -8% | |
| Totalt genomsnitt (program/inställningar) | 10% /
5% | 0% /
-1% | 20% /
18% | 8% /
1% | 3% /
-5% |
* ... mindre är bättre
Visa svarstider
| ↔ Svarstid svart till vitt | ||
|---|---|---|
| 24 ms ... stiga ↗ och falla ↘ kombinerat | ↗ 20 ms stiga | 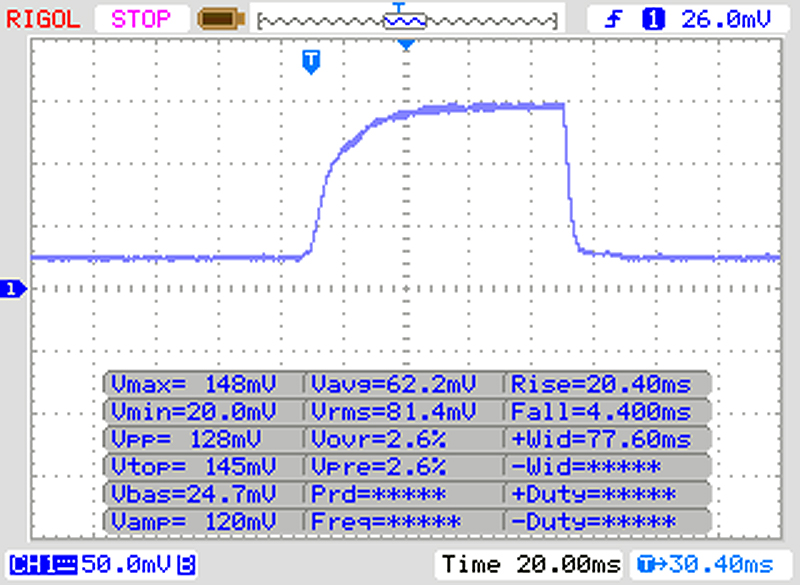 |
| ↘ 4 ms hösten | ||
| Skärmen visar bra svarsfrekvens i våra tester, men kan vara för långsam för konkurrenskraftiga spelare. I jämförelse sträcker sig alla testade enheter från 0.1 (minst) till 240 (maximalt) ms. » 54 % av alla enheter är bättre. Detta innebär att den uppmätta svarstiden är sämre än genomsnittet av alla testade enheter (19.8 ms). | ||
| ↔ Svarstid 50 % grått till 80 % grått | ||
| 50 ms ... stiga ↗ och falla ↘ kombinerat | ↗ 28 ms stiga | 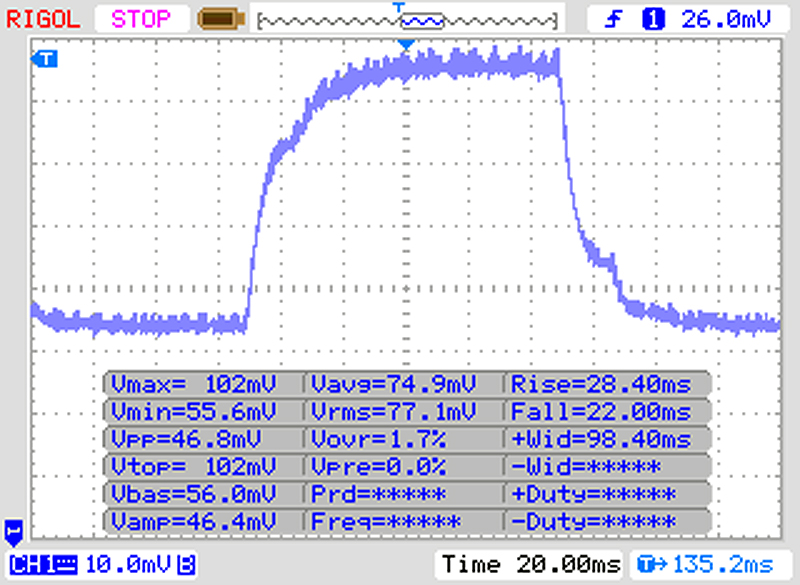 |
| ↘ 22 ms hösten | ||
| Skärmen visar långsamma svarsfrekvenser i våra tester och kommer att vara otillfredsställande för spelare. I jämförelse sträcker sig alla testade enheter från 0.165 (minst) till 636 (maximalt) ms. » 86 % av alla enheter är bättre. Detta innebär att den uppmätta svarstiden är sämre än genomsnittet av alla testade enheter (30.9 ms). | ||
Skärmflimmer / PWM (Puls-Width Modulation)
| Skärmflimmer / PWM upptäckt | 250 Hz | ≤ 20 % ljusstyrka inställning | 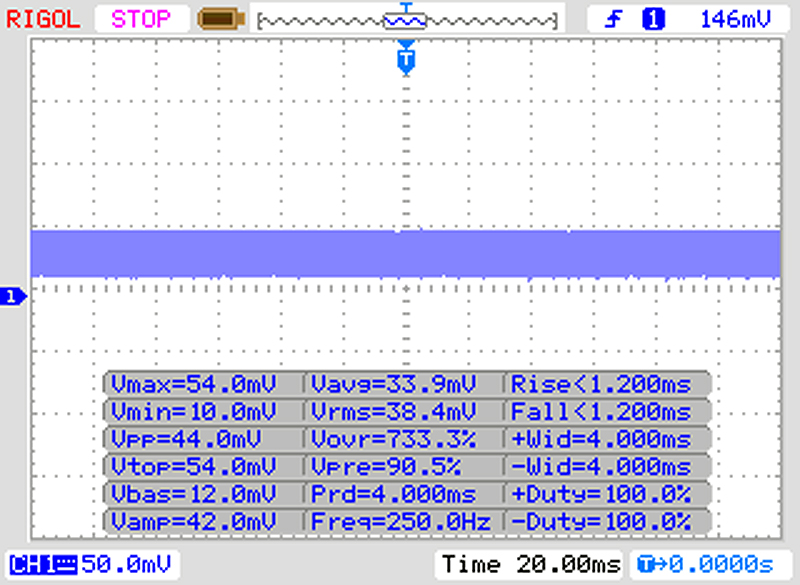 |
Displayens bakgrundsbelysning flimrar vid 250 Hz (i värsta fall, t.ex. med PWM) Flimrande upptäckt vid en ljusstyrkeinställning på 20 % och lägre. Det ska inte finnas något flimmer eller PWM över denna ljusstyrkeinställning. Frekvensen för 250 Hz är relativt låg, så känsliga användare kommer sannolikt att märka flimmer och uppleva ansträngda ögon vid den angivna ljusstyrkeinställningen och nedan. Som jämförelse: 52 % av alla testade enheter använder inte PWM för att dämpa skärmen. Om PWM upptäcktes mättes ett medelvärde av 7744 (minst: 5 - maximum: 343500) Hz. | |||
| Cinebench R15 | |
| CPU Single 64Bit | |
| Genomsnitt av klass Office (99.5 - 316, n=77, senaste 2 åren) | |
| Acer Aspire 3 A315-51-30YA | |
| Acer Extensa 2540-580K | |
| Acer Aspire 3 A315-41-R7BM | |
| Genomsnitt AMD Ryzen 3 2200U (105 - 128, n=4) | |
| Lenovo V330-15IKB | |
| Dell Inspiron 15 5575-98MH4 | |
| Asus X510UA-BR305T | |
| HP 250 G6 2UB93ES | |
| Lenovo ThinkPad A275 | |
| CPU Multi 64Bit | |
| Genomsnitt av klass Office (250 - 3380, n=77, senaste 2 åren) | |
| Acer Aspire 3 A315-51-30YA | |
| Acer Extensa 2540-580K | |
| Acer Aspire 3 A315-41-R7BM | |
| Genomsnitt AMD Ryzen 3 2200U (275 - 348, n=4) | |
| Dell Inspiron 15 5575-98MH4 | |
| Lenovo V330-15IKB | |
| Asus X510UA-BR305T | |
| Lenovo ThinkPad A275 | |
| HP 250 G6 2UB93ES | |
| PCMark 8 - Home Score Accelerated v2 | |
| Genomsnitt av klass Office (n=1senaste 2 åren) | |
| Acer Extensa 2540-580K | |
| Acer Aspire 3 A315-41-R7BM | |
| Lenovo V330-15IKB | |
| Asus X510UA-BR305T | |
| Acer Aspire 3 A315-51-30YA | |
| Dell Inspiron 15 5575-98MH4 | |
| Genomsnitt AMD Ryzen 3 2200U, AMD Radeon RX Vega 3 (2342 - 3457, n=4) | |
| Lenovo ThinkPad A275 | |
| HP 250 G6 2UB93ES | |
| PCMark 10 - Score | |
| Genomsnitt av klass Office (2601 - 9298, n=68, senaste 2 åren) | |
| Acer Aspire 3 A315-51-30YA | |
| Acer Extensa 2540-580K | |
| Acer Aspire 3 A315-41-R7BM | |
| Lenovo V330-15IKB | |
| Genomsnitt AMD Ryzen 3 2200U, AMD Radeon RX Vega 3 (2305 - 3064, n=4) | |
| Dell Inspiron 15 5575-98MH4 | |
| HP 250 G6 2UB93ES | |
| Lenovo ThinkPad A275 | |
| PCMark 8 Home Score Accelerated v2 | 3185 poäng | |
| PCMark 8 Creative Score Accelerated v2 | 3184 poäng | |
| PCMark 10 Score | 2534 poäng | |
Hjälp | ||
| Dell Inspiron 15 5575-98MH4 Seagate Mobile HDD 1TB ST1000LM035 | Acer Aspire 3 A315-41-R7BM SK Hynix HFS256G39TND-N210A | Acer Aspire 3 A315-51-30YA Kingston RBUSNS8180S3128GI1 | Lenovo V330-15IKB Samsung PM961 MZVLW256HEHP | Asus X510UA-BR305T Seagate Mobile HDD 1TB ST1000LM035 | HP 250 G6 2UB93ES Samsung SSD PM871a MZNLN256HMHQ | Genomsnitt Seagate Mobile HDD 1TB ST1000LM035 | |
|---|---|---|---|---|---|---|---|
| CrystalDiskMark 3.0 | 11928% | 13725% | 19464% | 24% | 18668% | 34% | |
| Read Seq (MB/s) | 137.2 | 512 273% | 428.6 212% | 1303 850% | 89.4 -35% | 488 256% | 90.9 ? -34% |
| Write Seq (MB/s) | 126.7 | 257.2 103% | 281.8 122% | 1279 909% | 84.2 -34% | 455 259% | 88.5 ? -30% |
| Read 512 (MB/s) | 41.77 | 368.5 782% | 295.6 608% | 815 1851% | 29.55 -29% | 426.4 921% | 31.5 ? -25% |
| Write 512 (MB/s) | 95.9 | 259.1 170% | 142.8 49% | 826 761% | 61.7 -36% | 390.7 307% | 77.3 ? -19% |
| Read 4k (MB/s) | 0.418 | 24.92 5862% | 34.88 8244% | 50.1 11886% | 0.326 -22% | 37.68 8914% | 0.4174 ? 0% |
| Write 4k (MB/s) | 0.123 | 46.59 37778% | 73.5 59656% | 100.7 81770% | 0.438 256% | 76.9 62420% | 0.525 ? 327% |
| Read 4k QD32 (MB/s) | 1.267 | 195.7 15346% | 211.6 16601% | 252.2 19805% | 1.047 -17% | 286.5 22512% | 0.993 ? -22% |
| Write 4k QD32 (MB/s) | 0.47 | 165.5 35113% | 114.7 24304% | 178.5 37879% | 0.967 106% | 253.1 53751% | 0.803 ? 71% |

| 3DMark | |
| 1280x720 Cloud Gate Standard Graphics | |
| Genomsnitt av klass Office (11640 - 118515, n=38, senaste 2 åren) | |
| Acer Aspire 3 A315-41-R7BM | |
| Acer Extensa 2540-580K | |
| Lenovo V330-15IKB | |
| Genomsnitt AMD Radeon RX Vega 3 (5005 - 12278, n=16) | |
| Dell Inspiron 15 5575-98MH4 | |
| Acer Aspire 3 A315-51-30YA | |
| HP 250 G6 2UB93ES | |
| Lenovo ThinkPad A275 | |
| 1920x1080 Fire Strike Graphics | |
| Genomsnitt av klass Office (736 - 21871, n=75, senaste 2 åren) | |
| Acer Aspire 3 A315-41-R7BM | |
| Genomsnitt AMD Radeon RX Vega 3 (726 - 1522, n=16) | |
| Acer Extensa 2540-580K | |
| Lenovo V330-15IKB | |
| Dell Inspiron 15 5575-98MH4 | |
| Acer Aspire 3 A315-51-30YA | |
| HP 250 G6 2UB93ES | |
| 3DMark 06 Standard Score | 8642 poäng | |
| 3DMark Vantage P Result | 5035 poäng | |
| 3DMark 11 Performance | 5190 poäng | |
| 3DMark Cloud Gate Standard Score | 5521 poäng | |
| 3DMark Fire Strike Score | 897 poäng | |
Hjälp | ||
| F1 2017 - 1280x720 Ultra Low Preset | |
| Acer Spin 5 SP513-52N-566U | |
| Acer Aspire 3 A315-41-R7BM | |
| Genomsnitt AMD Radeon RX Vega 3 (20 - 30, n=2) | |
| Dell Inspiron 15 5575-98MH4 | |
| BioShock Infinite - 1366x768 Medium Preset | |
| Acer Aspire 3 A315-41-R7BM | |
| Genomsnitt AMD Radeon RX Vega 3 (21.4 - 48.1, n=6) | |
| Dell XPS 13 i5-8250U | |
| Acer Spin 5 SP513-52N-566U | |
| Dell Inspiron 15 5575-98MH4 | |
| Acer Extensa 2540-580K | |
| Lenovo V330-15IKB | |
| Lenovo ThinkPad A275 | |
| Asus X510UA-BR305T | |
| HP 250 G6 2UB93ES | |
| Acer Aspire 3 A315-51-30YA | |
| Rise of the Tomb Raider - 1024x768 Lowest Preset | |
| Acer Aspire 3 A315-41-R7BM | |
| Dell XPS 13 i5-8250U | |
| Genomsnitt AMD Radeon RX Vega 3 (21 - 25.6, n=2) | |
| Lenovo ThinkPad A275 | |
| Acer Spin 5 SP513-52N-566U | |
| Dell Inspiron 15 5575-98MH4 | |
| Acer Extensa 2540-580K | |
| Farming Simulator 17 - 1366x768 Medium Preset | |
| Acer Aspire 3 A315-41-R7BM | |
| Acer Spin 5 SP513-52N-566U | |
| Genomsnitt AMD Radeon RX Vega 3 (44 - 72.3, n=3) | |
| Dell Inspiron 15 5575-98MH4 | |
| Dell XPS 13 i5-8250U | |
| Dirt Rally - 1366x768 Medium Preset | |
| Acer Aspire 3 A315-41-R7BM | |
| Genomsnitt AMD Radeon RX Vega 3 (22.5 - 33.5, n=2) | |
| Dell Inspiron 15 5575-98MH4 | |
| Resident Evil 7 - 1280x720 Very Low / Off AA:FX | |
| Dell Inspiron 15 5575-98MH4 | |
| Genomsnitt AMD Radeon RX Vega 3 (41.6 - 46.5, n=2) | |
| Acer Aspire 3 A315-41-R7BM | |
| låg | med. | hög | ultra | |
|---|---|---|---|---|
| BioShock Infinite (2013) | 59.5 | 30.8 | 28.5 | |
| Dirt Rally (2015) | 80.1 | 22.5 | ||
| Rise of the Tomb Raider (2016) | 21 | 10.6 | ||
| Farming Simulator 17 (2016) | 73.8 | 44 | ||
| Resident Evil 7 (2017) | 46.5 | |||
| F1 2017 (2017) | 20 |
Ljudnivå
| Låg belastning |
| 31.4 / 31.4 / 31.6 dB(A) |
| Hårddisk |
| 31.6 dB(A) |
| Hög belastning |
| 31.9 / 40.9 dB(A) |
 | ||
30 dB tyst 40 dB(A) hörbar 50 dB(A) högt ljud |
||
min: | ||
(±) Den maximala temperaturen på ovansidan är 45 °C / 113 F, jämfört med genomsnittet av 34.3 °C / 94 F , allt från 21.2 till 62.5 °C för klassen Office.
(±) Botten värms upp till maximalt 41.2 °C / 106 F, jämfört med genomsnittet av 36.8 °C / 98 F
(+) Vid tomgångsbruk är medeltemperaturen för ovansidan 27.1 °C / 81 F, jämfört med enhetsgenomsnittet på 29.5 °C / ### class_avg_f### F.
(+) Handledsstöden och pekplattan är kallare än hudtemperaturen med maximalt 28.1 °C / 82.6 F och är därför svala att ta på.
(±) Medeltemperaturen för handledsstödsområdet på liknande enheter var 27.6 °C / 81.7 F (-0.5 °C / -0.9 F).
Dell Inspiron 15 5575-98MH4 ljudanalys
(±) | högtalarljudstyrkan är genomsnittlig men bra (72.7 dB)
Bas 100 - 315 Hz
(-) | nästan ingen bas - i genomsnitt 23.1% lägre än medianen
(±) | linjäriteten för basen är genomsnittlig (13.1% delta till föregående frekvens)
Mellan 400 - 2000 Hz
(+) | balanserad mellan - endast 3.3% från medianen
(+) | mids är linjära (4.7% delta till föregående frekvens)
Högsta 2 - 16 kHz
(+) | balanserade toppar - endast 2.2% från medianen
(+) | toppar är linjära (6.5% delta till föregående frekvens)
Totalt 100 - 16 000 Hz
(±) | linjäriteten för det totala ljudet är genomsnittlig (19.1% skillnad mot median)
Jämfört med samma klass
» 38% av alla testade enheter i den här klassen var bättre, 7% liknande, 55% sämre
» Den bästa hade ett delta på 7%, genomsnittet var 21%, sämst var 53%
Jämfört med alla testade enheter
» 46% av alla testade enheter var bättre, 7% liknande, 47% sämre
» Den bästa hade ett delta på 4%, genomsnittet var 23%, sämst var 134%
Acer Aspire 3 A315-41-R7BM ljudanalys
(-) | inte särskilt höga högtalare (67.8 dB)
Bas 100 - 315 Hz
(-) | nästan ingen bas - i genomsnitt 25.3% lägre än medianen
(±) | linjäriteten för basen är genomsnittlig (12.5% delta till föregående frekvens)
Mellan 400 - 2000 Hz
(+) | balanserad mellan - endast 3% från medianen
(±) | linjäriteten för mids är genomsnittlig (10.1% delta till föregående frekvens)
Högsta 2 - 16 kHz
(+) | balanserade toppar - endast 1.8% från medianen
(+) | toppar är linjära (5.5% delta till föregående frekvens)
Totalt 100 - 16 000 Hz
(±) | linjäriteten för det totala ljudet är genomsnittlig (22.7% skillnad mot median)
Jämfört med samma klass
» 62% av alla testade enheter i den här klassen var bättre, 8% liknande, 30% sämre
» Den bästa hade ett delta på 7%, genomsnittet var 21%, sämst var 53%
Jämfört med alla testade enheter
» 67% av alla testade enheter var bättre, 6% liknande, 27% sämre
» Den bästa hade ett delta på 4%, genomsnittet var 23%, sämst var 134%
| Av/Standby | |
| Låg belastning | |
| Hög belastning |
|
Förklaring:
min: | |
| Dell Inspiron 15 5575-98MH4 R3 2200U, Vega 3, Seagate Mobile HDD 1TB ST1000LM035, TN LED, 1366x768, 15.6" | Acer Aspire 3 A315-41-R7BM R3 2200U, Vega 3, SK Hynix HFS256G39TND-N210A, TN LED, 1920x1080, 15.6" | Acer Aspire 3 A315-51-30YA i3-8130U, UHD Graphics 620, Kingston RBUSNS8180S3128GI1, TN LED, 1920x1080, 15.6" | Lenovo V330-15IKB i3-7130U, UHD Graphics 620, Samsung PM961 MZVLW256HEHP, TN LED, 1920x1080, 15.6" | Asus X510UA-BR305T i3-7100U, HD Graphics 620, Seagate Mobile HDD 1TB ST1000LM035, TN LED, 1366x768, 15.6" | Genomsnitt AMD Radeon RX Vega 3 | Genomsnitt av klass Office | |
|---|---|---|---|---|---|---|---|
| Power Consumption | -8% | 5% | 22% | 8% | 15% | -11% | |
| Idle Minimum * (Watt) | 5 | 5.6 -12% | 5.4 -8% | 3.2 36% | 5.2 -4% | 4.51 ? 10% | 4.25 ? 15% |
| Idle Average * (Watt) | 8.4 | 8.5 -1% | 8.2 2% | 6.7 20% | 8.1 4% | 7.11 ? 15% | 7.3 ? 13% |
| Idle Maximum * (Watt) | 9.2 | 8.4 9% | 8.4 9% | 7.1 23% | 8.6 7% | 7.94 ? 14% | 8.57 ? 7% |
| Load Average * (Watt) | 30 | 41 -37% | 32.2 -7% | 29.6 1% | 30.8 -3% | 27.1 ? 10% | 43.8 ? -46% |
| Load Maximum * (Watt) | 44.7 | 44.2 1% | 32.6 27% | 31.5 30% | 28 37% | 33.1 ? 26% | 64.5 ? -44% |
| Witcher 3 ultra * (Watt) | 32 |
* ... mindre är bättre
| Dell Inspiron 15 5575-98MH4 R3 2200U, Vega 3, 42 Wh | Acer Aspire 3 A315-41-R7BM R3 2200U, Vega 3, 37 Wh | Acer Aspire 3 A315-51-30YA i3-8130U, UHD Graphics 620, 37 Wh | Lenovo V330-15IKB i3-7130U, UHD Graphics 620, 30 Wh | Asus X510UA-BR305T i3-7100U, HD Graphics 620, 42 Wh | HP 250 G6 2UB93ES 6006U, HD Graphics 520, 41.6 Wh | Genomsnitt av klass Office | |
|---|---|---|---|---|---|---|---|
| Batteridrifttid | 13% | 12% | 10% | 69% | 62% | 129% | |
| Reader / Idle (h) | 9.5 | 8.9 -6% | 22.2 ? 134% | ||||
| WiFi v1.3 (h) | 4.2 | 5.7 36% | 4.7 12% | 4.6 10% | 7.1 69% | 6.8 62% | 13.2 ? 214% |
| Load (h) | 1.3 | 1.4 8% | 1.808 ? 39% | ||||
| H.264 (h) | 4.9 | 15.4 ? |
För
Emot
Läs den fullständiga versionen av den här recensionen på engelska här.
Även Dell har nu öppnat dörren till Ryzen APU:erna. Acer har redan visat oss hur man skapar en bra allt-i-allo för kontoret som kan stå sig mot aktuella Intel-chip och som med Ryzen 3 dessutom har övertrumfat dessa i visst spelande. Dell har tyvärr valt att en annan väg som, tror vi, har resulterat i en misslyckad implementering av Ryzen 3. APU:n stryps så kraftigt att vi inte ens kan komma nära dess turbo-klockfrekvenser. På grund av det så besviker prestandatester för processor, program och spel - och den klickande hårddisken är droppen som får bägaren att rinna över. Dell har inte gjort AMD Ryzen en tjänst med den här datorn - till skillnad från vad Acer gjort med Aspire 3 A315-41.
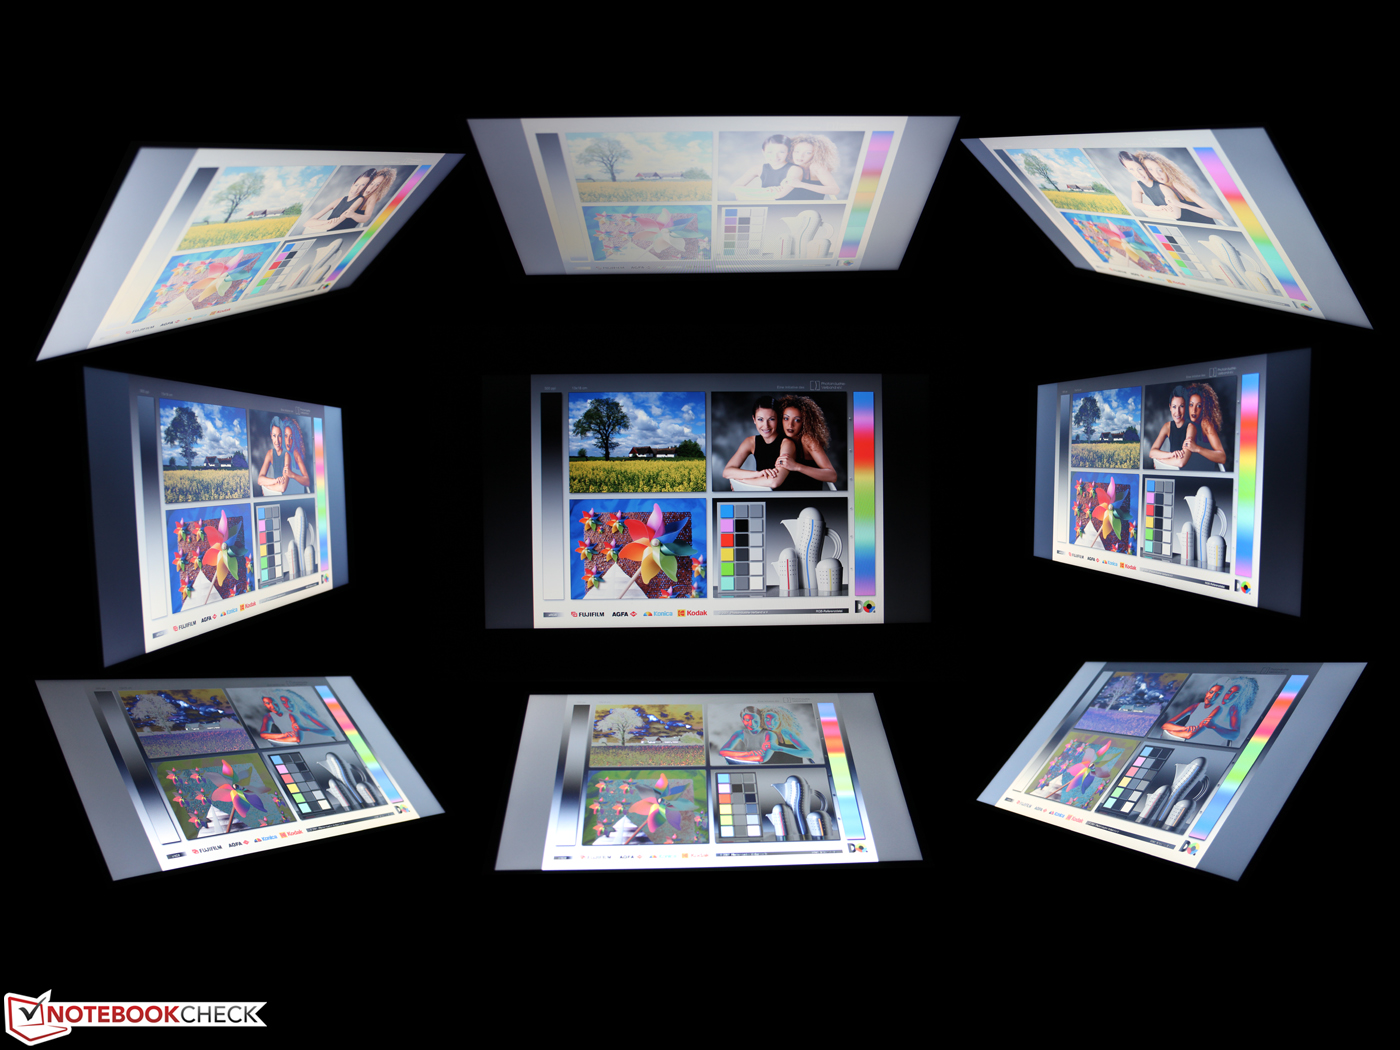
Ovanpå allt det har enheten en dålig HD-panel med låg ljusstyrka, PWM-flimmer, en blå ton, låg kontrast och smala betraktningsvinklar (TN) - den här skärmen lyckas ta hem varenda minuspoäng som finns. Den matta ytan är den enda fördelen med denna panel.
Vi kan inte rekommendera denna enhet för 4.700 kronor. Istället föreslår vi att ta en titt på dess konkurrenter, i synnerhet Aspire 3 A315-41, som har en FullHD-skärm, bättre lagringsenhet och Windows 10 för 5.000 kronor och uppåt. Även om Acer-modellen också har en mörk skärm med smala betraktningsvinklar så kan den utnyttja Ryzen 3 mycket bättre i applikationer och spel och har dessutom bättre batteritid.
Dell Inspiron 15 5575-98MH4
- 05/30/2018 v6 (old)
Sebastian Bade
Price comparison
