Test: Acer Aspire 5 A515-52G (i5-8265U, MX150, SSD, FHD) Laptop (Sammanfattning)
| SD Card Reader | |
| average JPG Copy Test (av. of 3 runs) | |
| Genomsnitt av klass Multimedia (23 - 531, n=43, senaste 2 åren) | |
| Lenovo IdeaPad 720-15IKB (Toshiba Exceria Pro SDXC 64 GB UHS-II) | |
| Acer Aspire 5 A515-51G-509A (Toshiba Exceria Pro M510 microSD) | |
| Acer Aspire 5 A515-52G-53PU (Toshiba Exceria Pro SDXC 64 GB UHS-II) | |
| Acer Aspire 5 A515-51G-51RL (Toshiba Exceria Pro SDXC 64 GB UHS-II) | |
| HP Pavilion 15-cw0003ng (Toshiba Exceria Pro SDXC 64 GB UHS-II) | |
| Asus VivoBook 15 X542UF-DM143T (Toshiba Exceria Pro SDXC 64 GB UHS-II) | |
| Dell G3 15 3579 (Toshiba Exceria Pro SDXC 64 GB UHS-II) | |
| maximum AS SSD Seq Read Test (1GB) | |
| Genomsnitt av klass Multimedia (27.9 - 1455, n=42, senaste 2 åren) | |
| Lenovo IdeaPad 720-15IKB (Toshiba Exceria Pro SDXC 64 GB UHS-II) | |
| Acer Aspire 5 A515-51G-509A (Toshiba Exceria Pro M510 microSD) | |
| Acer Aspire 5 A515-51G-51RL (Toshiba Exceria Pro SDXC 64 GB UHS-II) | |
| Acer Aspire 5 A515-52G-53PU (Toshiba Exceria Pro SDXC 64 GB UHS-II) | |
| HP Pavilion 15-cw0003ng (Toshiba Exceria Pro SDXC 64 GB UHS-II) | |
| Asus VivoBook 15 X542UF-DM143T (Toshiba Exceria Pro SDXC 64 GB UHS-II) | |
| Dell G3 15 3579 (Toshiba Exceria Pro SDXC 64 GB UHS-II) | |
| Networking | |
| iperf3 transmit AX12 | |
| Acer Aspire 5 A515-52G-53PU | |
| Acer Aspire 5 A515-51G-509A | |
| Dell G3 15 3579 | |
| Acer Aspire 5 A515-51G-51RL | |
| Asus VivoBook 15 X542UF-DM143T | |
| HP Pavilion 15-cw0003ng | |
| Lenovo IdeaPad 720-15IKB | |
| iperf3 receive AX12 | |
| Acer Aspire 5 A515-52G-53PU | |
| Asus VivoBook 15 X542UF-DM143T | |
| Dell G3 15 3579 | |
| Acer Aspire 5 A515-51G-51RL | |
| Acer Aspire 5 A515-51G-509A | |
| HP Pavilion 15-cw0003ng | |
| Lenovo IdeaPad 720-15IKB | |
| |||||||||||||||||||||||||
Distribution av ljusstyrkan: 81 %
Mitt på batteriet: 292 cd/m²
Kontrast: 987:1 (Svärta: 0.3 cd/m²)
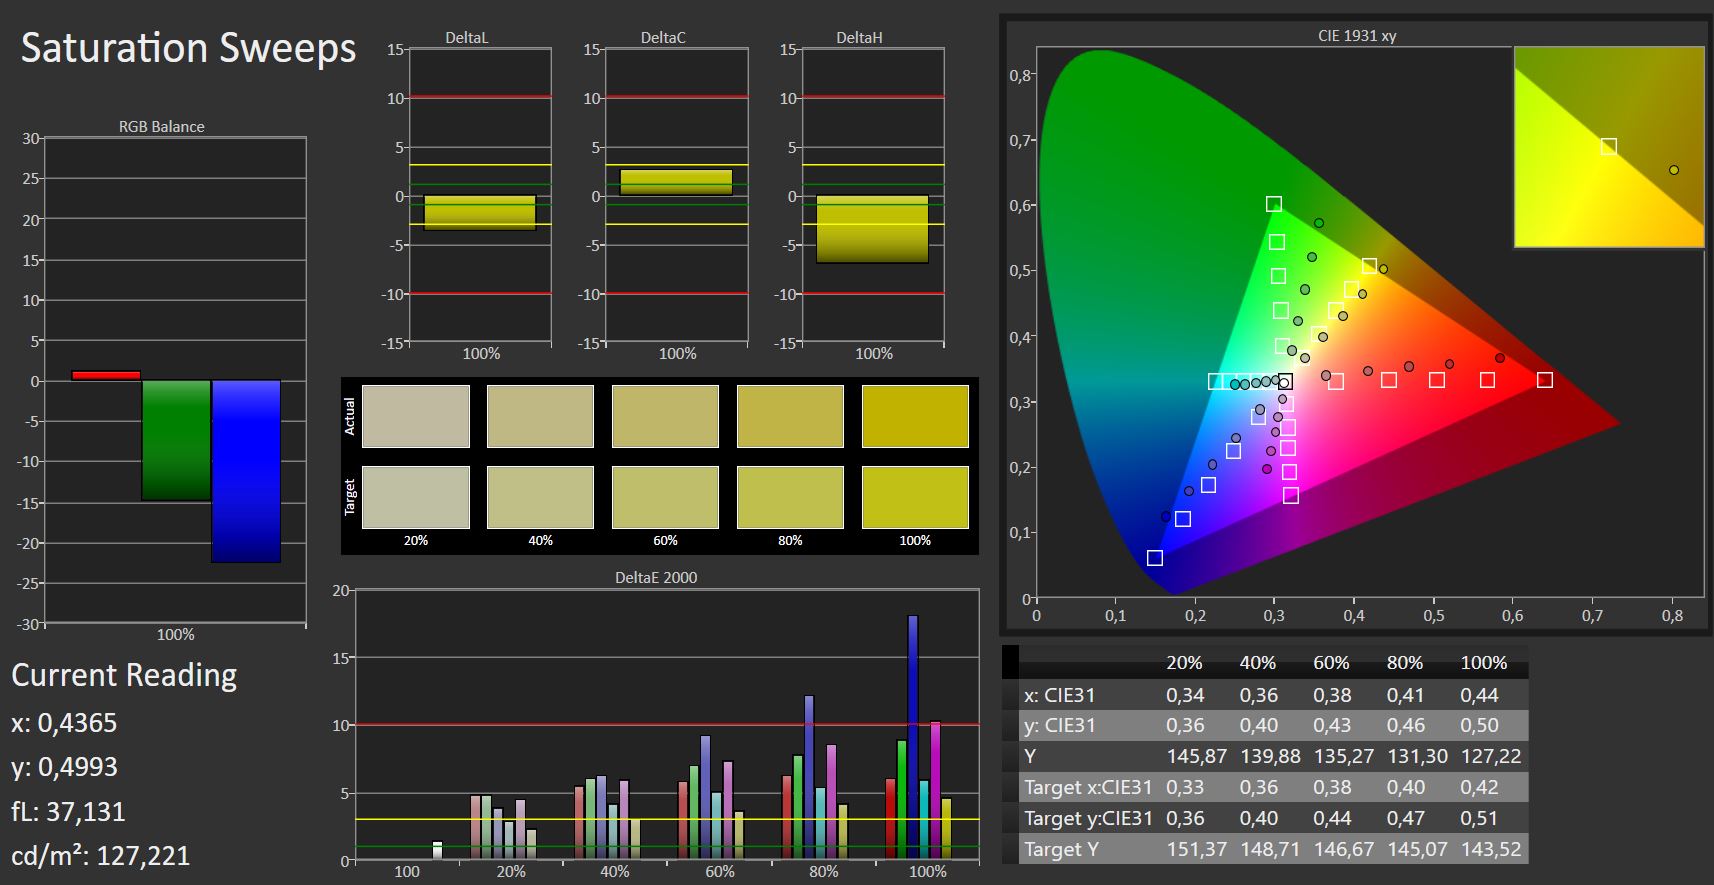
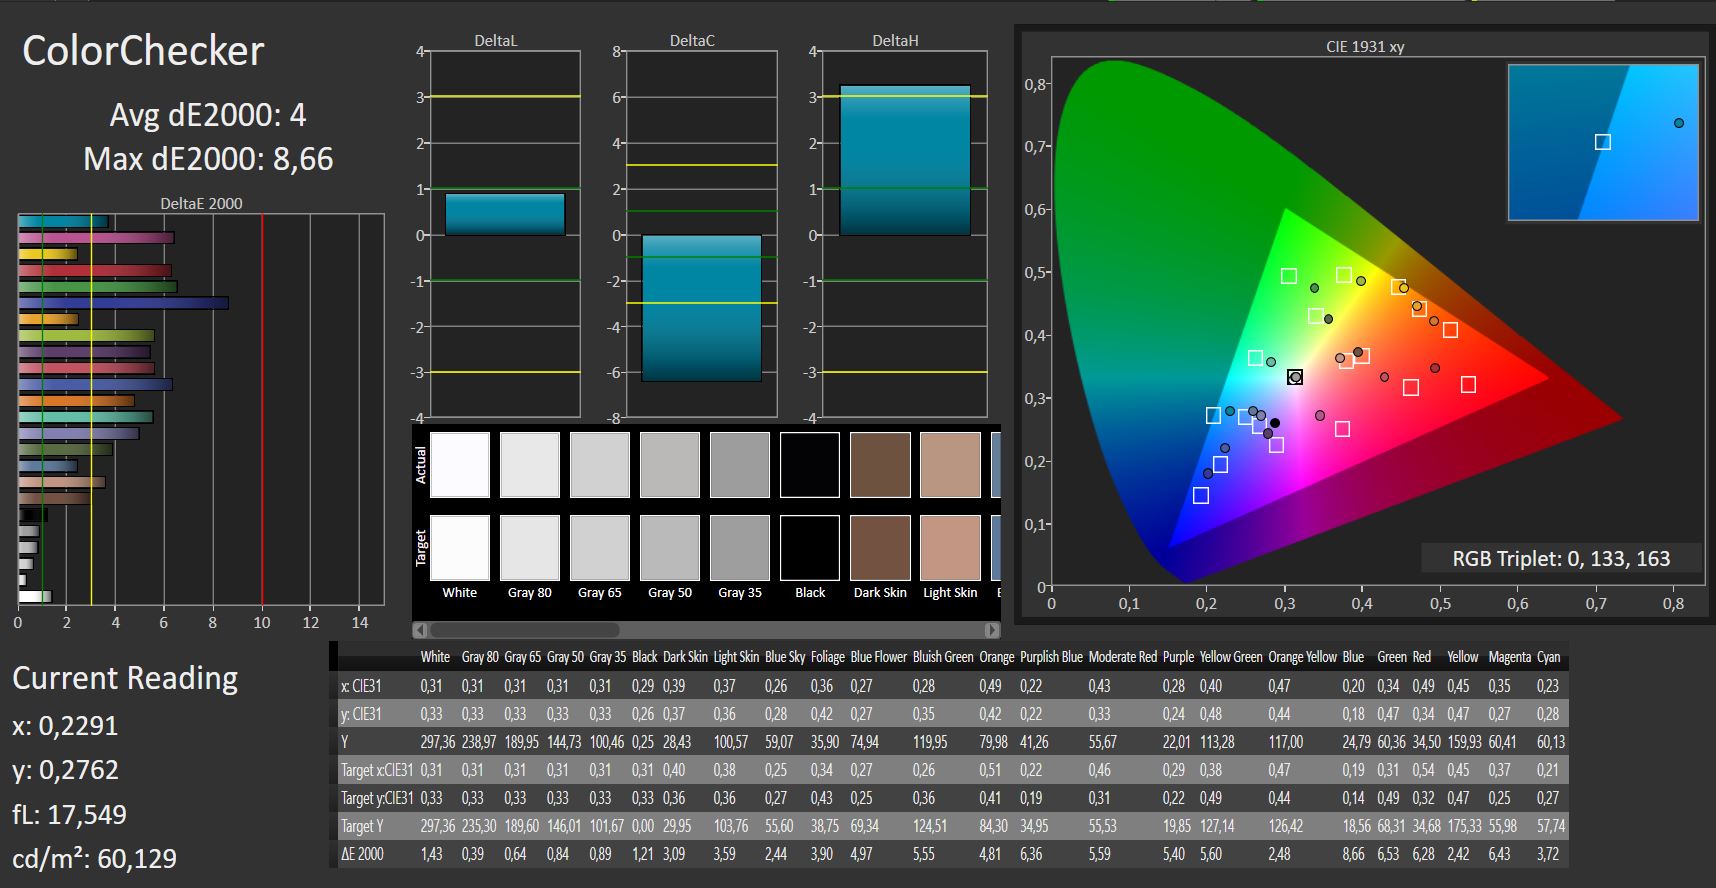
ΔE ColorChecker Calman: 4.01 | ∀{0.5-29.43 Ø4.73}
calibrated: 4
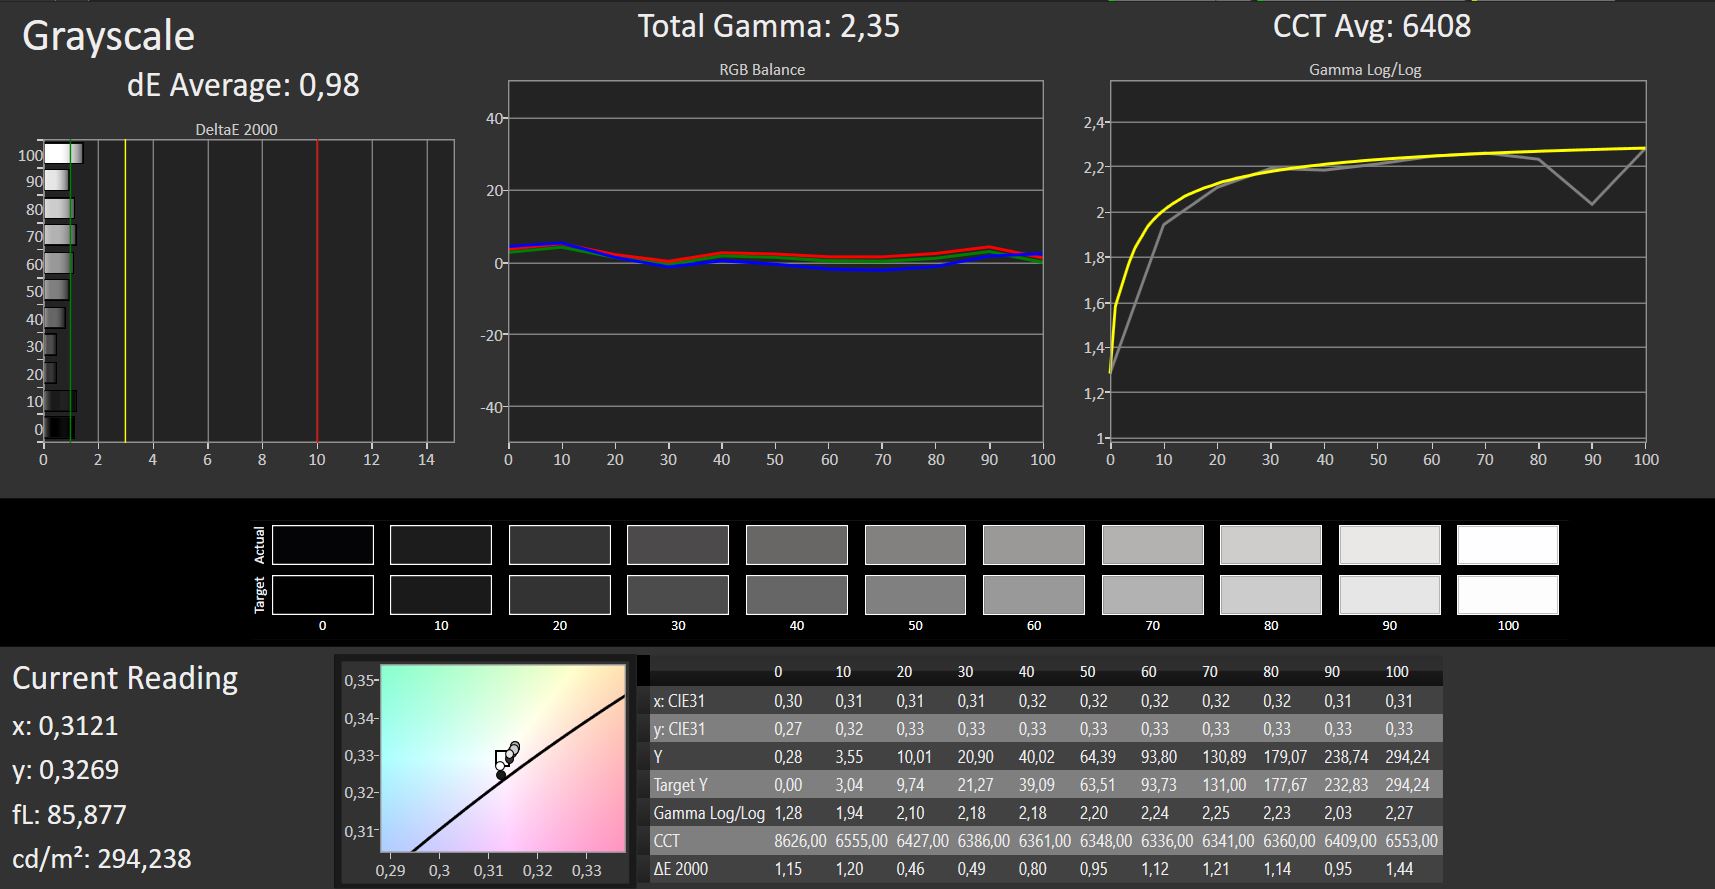
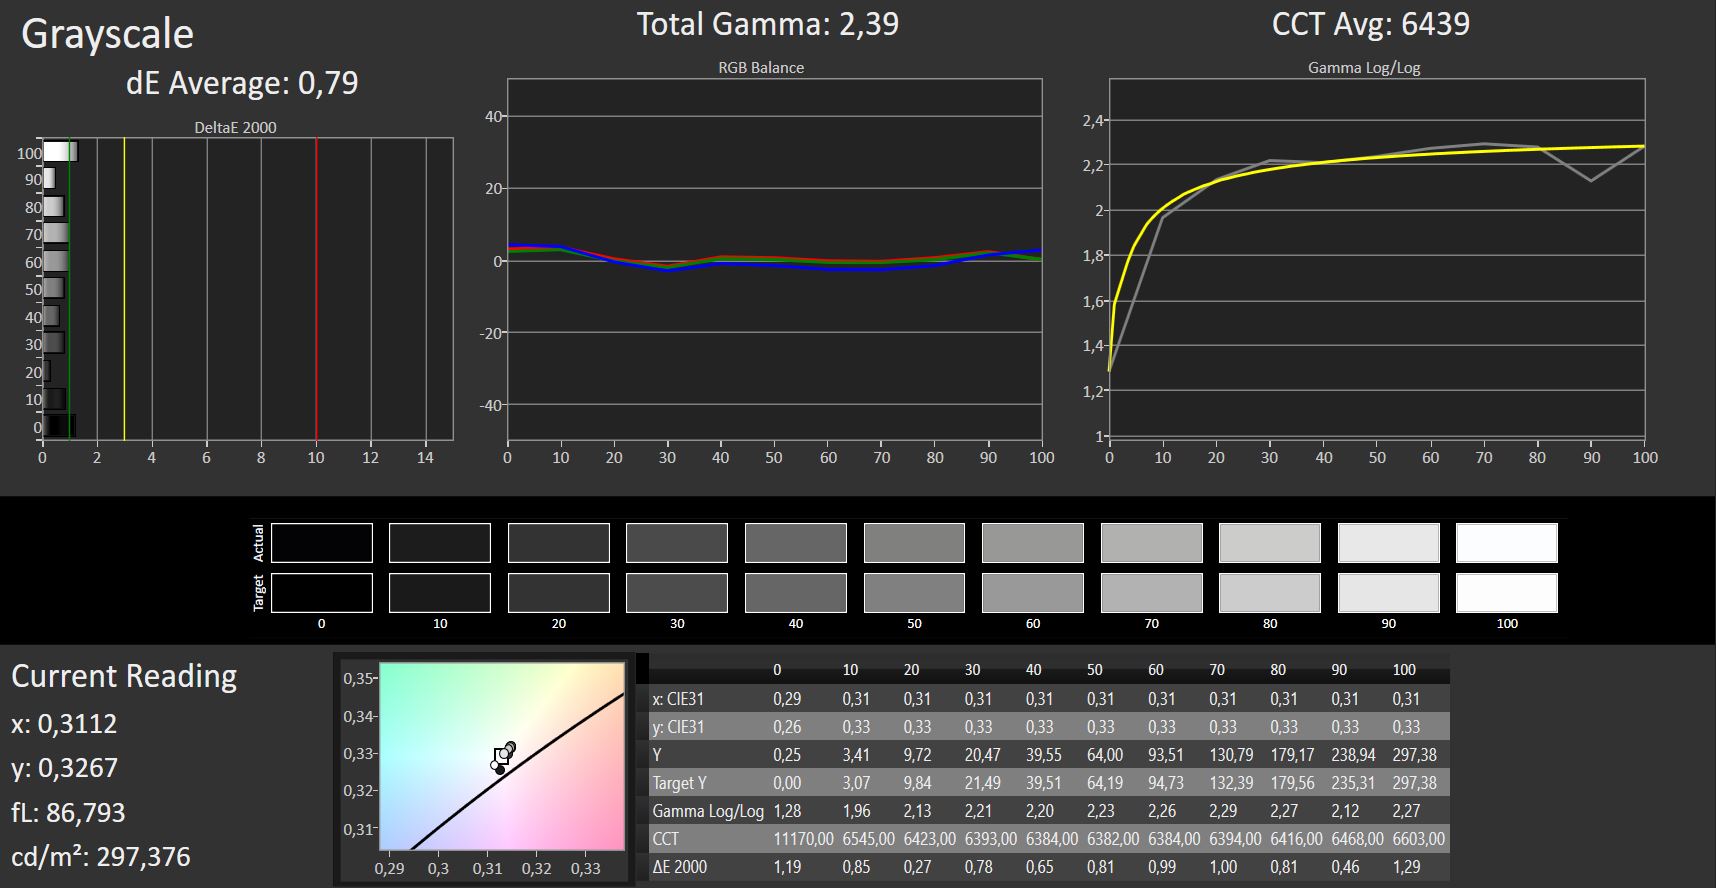
ΔE Greyscale Calman: 0.98 | ∀{0.09-98 Ø4.97}
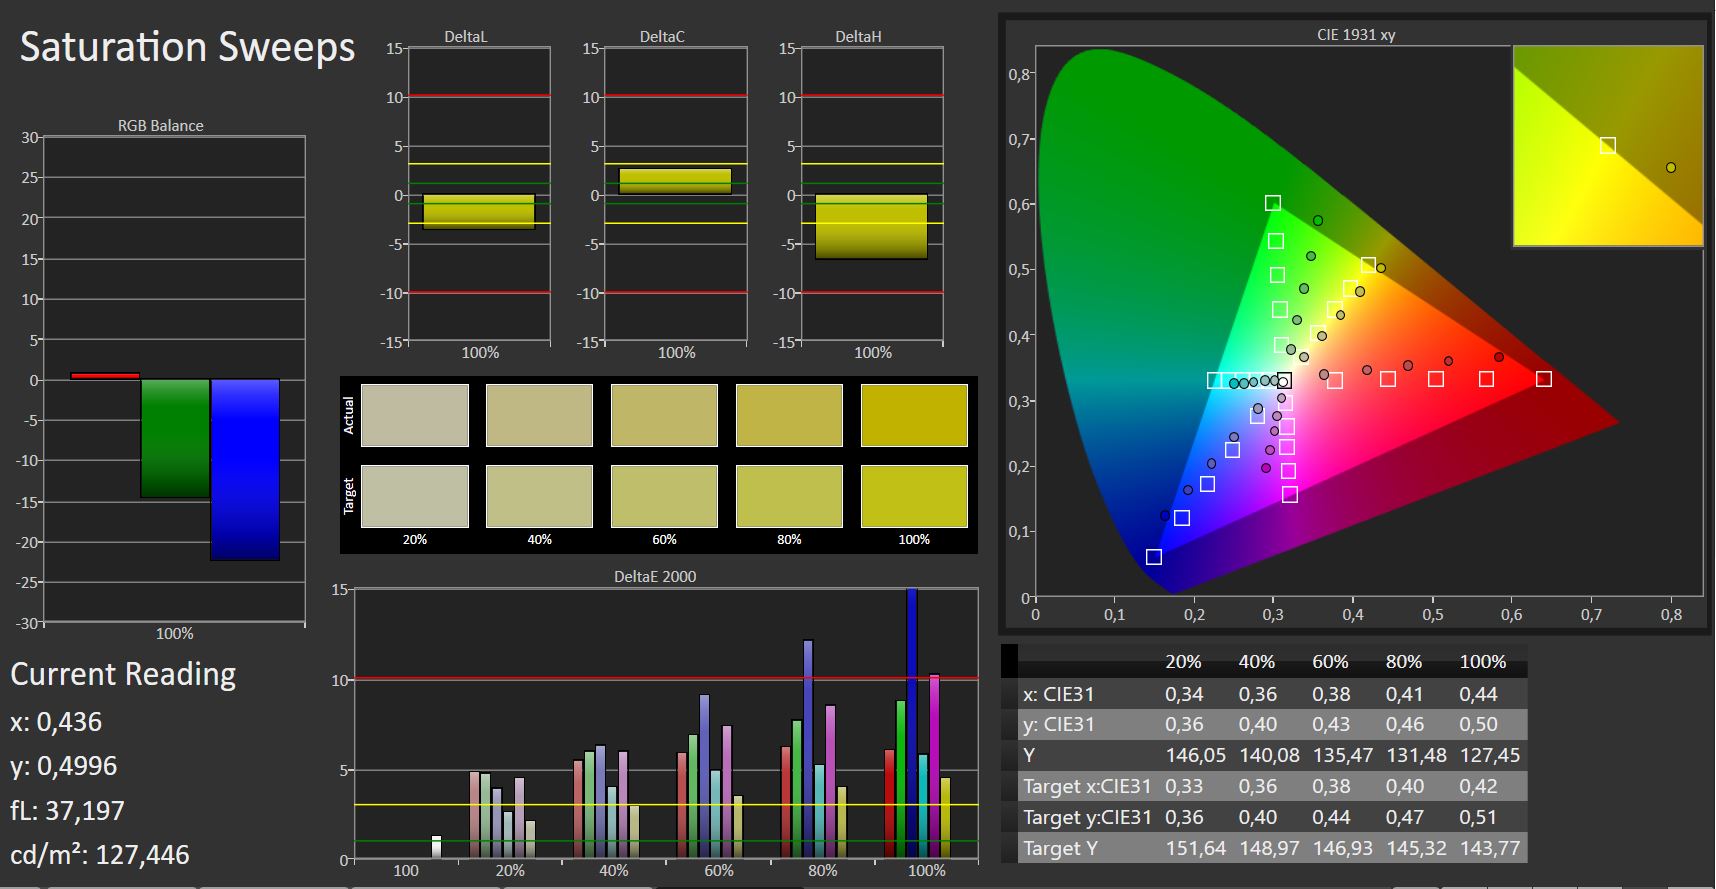
58% sRGB (Argyll 1.6.3 3D)
38% AdobeRGB 1998 (Argyll 1.6.3 3D)
41.17% AdobeRGB 1998 (Argyll 3D)
58.7% sRGB (Argyll 3D)
39.85% Display P3 (Argyll 3D)
Gamma: 2.35
CCT: 6408 K
| Acer Aspire 5 A515-52G-53PU IPS, 1920x1080, 15.6" | Acer Aspire 5 A515-51G-509A TN, 1920x1080, 15.6" | Acer Aspire 5 A515-51G-51RL IPS, 1920x1080, 15.6" | HP Pavilion 15-cw0003ng IPS, 1920x1080, 15.6" | Lenovo IdeaPad 720-15IKB IPS, 1920x1080, 15.6" | Asus VivoBook 15 X542UF-DM143T TN LED, 1920x1080, 15.6" | Dell G3 15 3579 IPS, 1920x1080, 15.6" | |
|---|---|---|---|---|---|---|---|
| Display | -3% | -7% | -2% | -5% | -2% | ||
| Display P3 Coverage (%) | 39.85 | 38.3 -4% | 36.7 -8% | 38.62 -3% | 37.47 -6% | 38.48 -3% | |
| sRGB Coverage (%) | 58.7 | 57.6 -2% | 55 -6% | 58.1 -1% | 56.4 -4% | 57.9 -1% | |
| AdobeRGB 1998 Coverage (%) | 41.17 | 39.57 -4% | 37.91 -8% | 39.91 -3% | 38.71 -6% | 39.75 -3% | |
| Response Times | 33% | 18% | 19% | 17% | 28% | 31% | |
| Response Time Grey 50% / Grey 80% * (ms) | 45 ? | 43.3 ? 4% | 41 ? 9% | 40 ? 11% | 42 ? 7% | 41 ? 9% | 32.4 ? 28% |
| Response Time Black / White * (ms) | 35 ? | 13.8 ? 61% | 26 ? 26% | 26 ? 26% | 26 ? 26% | 19 ? 46% | 23.2 ? 34% |
| PWM Frequency (Hz) | 20000 ? | 25970 ? | 7000 ? | ||||
| Screen | -189% | -21% | -43% | -48% | -31% | -47% | |
| Brightness middle (cd/m²) | 296 | 246 -17% | 235 -21% | 186 -37% | 270 -9% | 230 -22% | 208.2 -30% |
| Brightness (cd/m²) | 268 | 225 -16% | 236 -12% | 180 -33% | 250 -7% | 221 -18% | 203 -24% |
| Brightness Distribution (%) | 81 | 81 0% | 80 -1% | 88 9% | 87 7% | 91 12% | 81 0% |
| Black Level * (cd/m²) | 0.3 | 0.51 -70% | 0.17 43% | 0.15 50% | 0.25 17% | 0.45 -50% | 0.34 -13% |
| Contrast (:1) | 987 | 482 -51% | 1382 40% | 1240 26% | 1080 9% | 511 -48% | 612 -38% |
| Colorchecker dE 2000 * | 4.01 | 11 -174% | 4.69 -17% | 5.94 -48% | 4.79 -19% | 3.6 10% | 4.65 -16% |
| Colorchecker dE 2000 max. * | 8.7 | 32.4 -272% | 7.9 9% | 10.81 -24% | 8.83 -1% | 5.59 36% | 15.99 -84% |
| Colorchecker dE 2000 calibrated * | 4 | 4.6 -15% | 6.07 -52% | 3.84 4% | |||
| Greyscale dE 2000 * | 0.98 | 11.6 -1084% | 3.34 -241% | 4.44 -353% | 5.66 -478% | 3.13 -219% | 4.1 -318% |
| Gamma | 2.35 94% | 1.91 115% | 2.63 84% | 2.81 78% | 2.64 83% | 2.45 90% | 2.3 96% |
| CCT | 6408 101% | 11807 55% | 6801 96% | 6272 104% | 7179 91% | 7244 90% | 7352 88% |
| Color Space (Percent of AdobeRGB 1998) (%) | 38 | 36 -5% | 35 -8% | 37 -3% | 36 -5% | 36.7 -3% | |
| Color Space (Percent of sRGB) (%) | 58 | 57 -2% | 55 -5% | 59 2% | 56 -3% | 57.9 0% | |
| Totalt genomsnitt (program/inställningar) | -78% /
-149% | -2% /
-12% | -10% /
-29% | -11% /
-30% | -3% /
-18% | -6% /
-29% |
* ... mindre är bättre
Skärmflimmer / PWM (Puls-Width Modulation)
| Skärmflimmer / PWM upptäckt | 20000 Hz | ≤ 90 % ljusstyrka inställning | 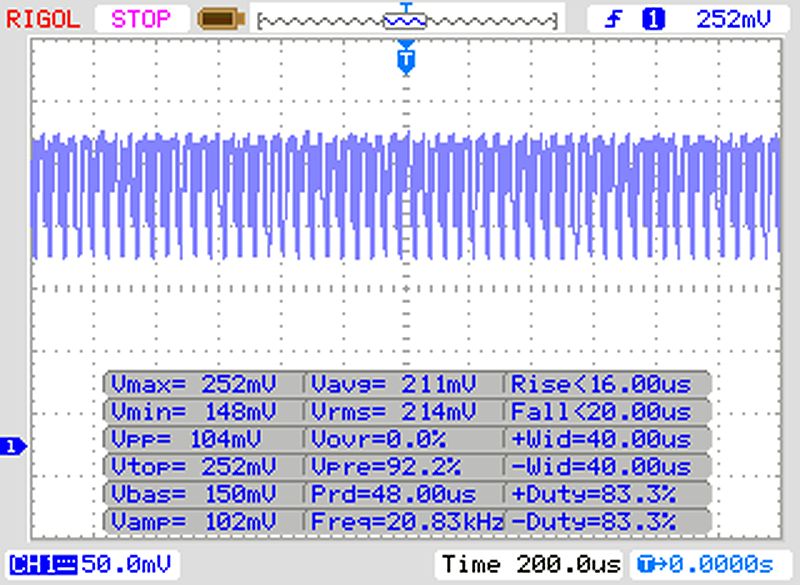 |
Displayens bakgrundsbelysning flimrar vid 20000 Hz (i värsta fall, t.ex. med PWM) Flimrande upptäckt vid en ljusstyrkeinställning på 90 % och lägre. Det ska inte finnas något flimmer eller PWM över denna ljusstyrkeinställning. Frekvensen för 20000 Hz är ganska hög, så de flesta användare som är känsliga för PWM bör inte märka något flimmer. Som jämförelse: 52 % av alla testade enheter använder inte PWM för att dämpa skärmen. Om PWM upptäcktes mättes ett medelvärde av 7794 (minst: 5 - maximum: 343500) Hz. | |||

Visa svarstider
| ↔ Svarstid svart till vitt | ||
|---|---|---|
| 35 ms ... stiga ↗ och falla ↘ kombinerat | ↗ 19 ms stiga | 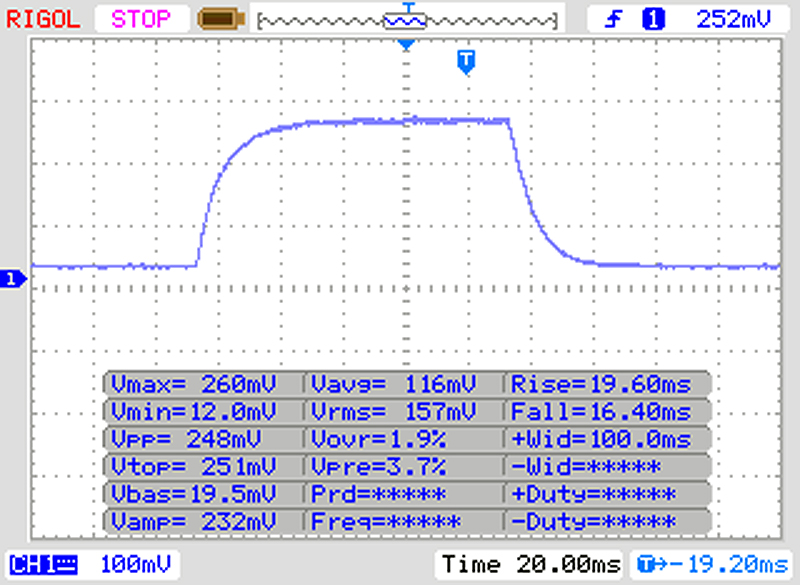 |
| ↘ 16 ms hösten | ||
| Skärmen visar långsamma svarsfrekvenser i våra tester och kommer att vara otillfredsställande för spelare. I jämförelse sträcker sig alla testade enheter från 0.1 (minst) till 240 (maximalt) ms. » 92 % av alla enheter är bättre. Detta innebär att den uppmätta svarstiden är sämre än genomsnittet av alla testade enheter (19.9 ms). | ||
| ↔ Svarstid 50 % grått till 80 % grått | ||
| 45 ms ... stiga ↗ och falla ↘ kombinerat | ↗ 24 ms stiga | 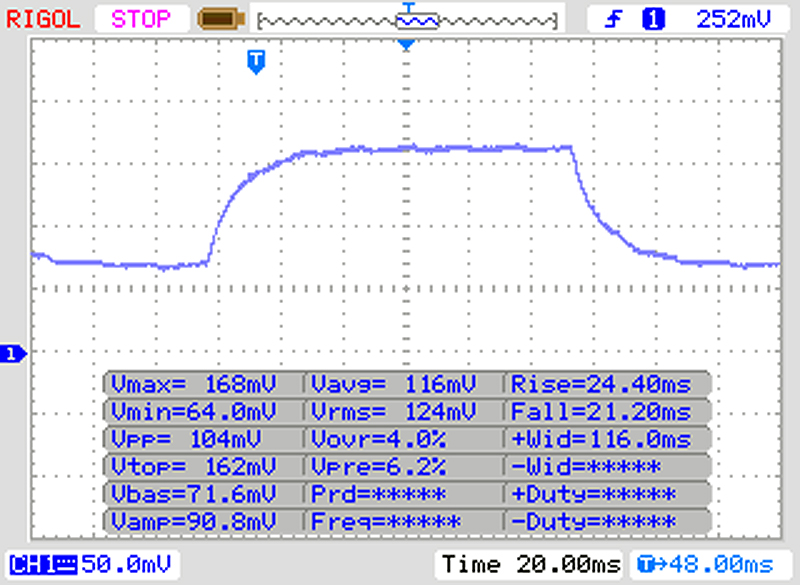 |
| ↘ 21 ms hösten | ||
| Skärmen visar långsamma svarsfrekvenser i våra tester och kommer att vara otillfredsställande för spelare. I jämförelse sträcker sig alla testade enheter från 0.165 (minst) till 636 (maximalt) ms. » 77 % av alla enheter är bättre. Detta innebär att den uppmätta svarstiden är sämre än genomsnittet av alla testade enheter (31.1 ms). | ||
| Cinebench R15 | |
| CPU Single 64Bit | |
| Genomsnitt av klass Multimedia (184.8 - 326, n=66, senaste 2 åren) | |
| Dell G3 15 3579 | |
| Acer Aspire 5 A515-52G-53PU | |
| Genomsnitt Intel Core i5-8265U (111 - 164, n=35) | |
| Asus VivoBook 15 X542UF-DM143T | |
| Acer Aspire 5 A515-51G-509A | |
| Acer Aspire 5 A515-51G-51RL | |
| Lenovo IdeaPad 720-15IKB | |
| HP Pavilion 15-cw0003ng | |
| CPU Multi 64Bit | |
| Genomsnitt av klass Multimedia (856 - 5224, n=68, senaste 2 åren) | |
| Dell G3 15 3579 | |
| Asus VivoBook 15 X542UF-DM143T | |
| HP Pavilion 15-cw0003ng | |
| Genomsnitt Intel Core i5-8265U (457 - 750, n=38) | |
| Acer Aspire 5 A515-52G-53PU | |
| Acer Aspire 5 A515-51G-509A | |
| Lenovo IdeaPad 720-15IKB | |
| Acer Aspire 5 A515-51G-51RL | |
| Cinebench R11.5 | |
| CPU Single 64Bit | |
| Genomsnitt av klass Multimedia (2.62 - 3.82, n=8, senaste 2 åren) | |
| Acer Aspire 5 A515-52G-53PU | |
| Genomsnitt Intel Core i5-8265U (1.73 - 1.88, n=6) | |
| Acer Aspire 5 A515-51G-509A | |
| Acer Aspire 5 A515-51G-51RL | |
| CPU Multi 64Bit | |
| Genomsnitt av klass Multimedia (17.5 - 43.3, n=8, senaste 2 åren) | |
| Genomsnitt Intel Core i5-8265U (5.22 - 7.22, n=6) | |
| Acer Aspire 5 A515-51G-509A | |
| Acer Aspire 5 A515-52G-53PU | |
| Acer Aspire 5 A515-51G-51RL | |
| Cinebench R10 | |
| Rendering Multiple CPUs 32Bit | |
| Genomsnitt av klass Multimedia (17722 - 84729, n=8, senaste 2 åren) | |
| Asus VivoBook 15 X542UF-DM143T | |
| Acer Aspire 5 A515-51G-509A | |
| Genomsnitt Intel Core i5-8265U (16318 - 22962, n=9) | |
| Acer Aspire 5 A515-52G-53PU | |
| Acer Aspire 5 A515-51G-51RL | |
| Shading 32Bit | |
| Genomsnitt av klass Multimedia (8886 - 22668, n=6, senaste 2 åren) | |
| Genomsnitt Intel Core i5-8265U (4095 - 8949, n=10) | |
| Acer Aspire 5 A515-52G-53PU | |
| Asus VivoBook 15 X542UF-DM143T | |
| Acer Aspire 5 A515-51G-509A | |
| Acer Aspire 5 A515-51G-51RL | |
| Geekbench 3 | |
| 32 Bit Multi-Core Score | |
| Acer Aspire 5 A515-52G-53PU | |
| Genomsnitt Intel Core i5-8265U (12198 - 14499, n=6) | |
| Asus VivoBook 15 X542UF-DM143T | |
| Acer Aspire 5 A515-51G-51RL | |
| 32 Bit Single-Core Score | |
| Acer Aspire 5 A515-52G-53PU | |
| Genomsnitt Intel Core i5-8265U (3470 - 3842, n=6) | |
| Asus VivoBook 15 X542UF-DM143T | |
| Acer Aspire 5 A515-51G-51RL | |
| Geekbench 4.0 | |
| 64 Bit Multi-Core Score | |
| Genomsnitt av klass Multimedia (n=1senaste 2 åren) | |
| Acer Aspire 5 A515-52G-53PU | |
| Genomsnitt Intel Core i5-8265U (13168 - 14390, n=3) | |
| Asus VivoBook 15 X542UF-DM143T | |
| Acer Aspire 5 A515-51G-51RL | |
| 64 Bit Single-Core Score | |
| Genomsnitt av klass Multimedia (n=1senaste 2 åren) | |
| Acer Aspire 5 A515-52G-53PU | |
| Genomsnitt Intel Core i5-8265U (4229 - 4605, n=3) | |
| Asus VivoBook 15 X542UF-DM143T | |
| Acer Aspire 5 A515-51G-51RL | |
| Geekbench 4.4 | |
| 64 Bit Multi-Core Score | |
| Genomsnitt av klass Multimedia (n=1senaste 2 åren) | |
| Acer Aspire 5 A515-52G-53PU | |
| Genomsnitt Intel Core i5-8265U (7144 - 16249, n=19) | |
| Asus VivoBook 15 X542UF-DM143T | |
| Acer Aspire 5 A515-51G-51RL | |
| 64 Bit Single-Core Score | |
| Genomsnitt av klass Multimedia (n=1senaste 2 åren) | |
| Acer Aspire 5 A515-52G-53PU | |
| Genomsnitt Intel Core i5-8265U (2106 - 4830, n=19) | |
| Asus VivoBook 15 X542UF-DM143T | |
| Acer Aspire 5 A515-51G-51RL | |
| Mozilla Kraken 1.1 - Total | |
| Lenovo IdeaPad 720-15IKB | |
| HP Pavilion 15-cw0003ng | |
| Acer Aspire 5 A515-51G-509A | |
| Acer Aspire 5 A515-51G-51RL (Edge 40) | |
| Acer Aspire 5 A515-52G-53PU (Edge 42) | |
| Dell G3 15 3579 (Edge 42.17134.1.0) | |
| Genomsnitt Intel Core i5-8265U (851 - 1245, n=25) | |
| Genomsnitt av klass Multimedia (228 - 835, n=74, senaste 2 åren) | |
| Octane V2 - Total Score | |
| Genomsnitt av klass Multimedia (64079 - 153175, n=35, senaste 2 åren) | |
| Acer Aspire 5 A515-52G-53PU (Edge 42) | |
| Dell G3 15 3579 (Edge 42.17134.1.0) | |
| Genomsnitt Intel Core i5-8265U (12842 - 35563, n=23) | |
| Acer Aspire 5 A515-51G-51RL (Edge 40) | |
| Lenovo IdeaPad 720-15IKB | |
| JetStream 1.1 - 1.1 Total | |
| Genomsnitt av klass Multimedia (482 - 711, n=2, senaste 2 åren) | |
| Acer Aspire 5 A515-52G-53PU (Edge 42) | |
| Dell G3 15 3579 (Edge 42.17134.1.0) | |
| Asus VivoBook 15 X542UF-DM143T (Edge 41) | |
| Genomsnitt Intel Core i5-8265U (193.7 - 244, n=19) | |
| Acer Aspire 5 A515-51G-509A | |
| Acer Aspire 5 A515-51G-51RL (Edge 40) | |
| HP Pavilion 15-cw0003ng | |
| Lenovo IdeaPad 720-15IKB | |
* ... mindre är bättre
| PCMark 7 Score | 6028 poäng | |
| PCMark 8 Home Score Accelerated v2 | 3725 poäng | |
| PCMark 8 Creative Score Accelerated v2 | 4506 poäng | |
| PCMark 8 Work Score Accelerated v2 | 4924 poäng | |
| PCMark 10 Score | 3960 poäng | |
Hjälp | ||
| PCMark 8 | |
| Home Score Accelerated v2 | |
| Genomsnitt av klass Multimedia (n=1senaste 2 åren) | |
| Lenovo IdeaPad 720-15IKB | |
| Dell G3 15 3579 | |
| Acer Aspire 5 A515-51G-509A | |
| Acer Aspire 5 A515-52G-53PU | |
| Genomsnitt Intel Core i5-8265U, NVIDIA GeForce MX150 (n=1) | |
| Asus VivoBook 15 X542UF-DM143T | |
| Acer Aspire 5 A515-51G-51RL | |
| HP Pavilion 15-cw0003ng | |
| Work Score Accelerated v2 | |
| Acer Aspire 5 A515-52G-53PU | |
| Genomsnitt Intel Core i5-8265U, NVIDIA GeForce MX150 (n=1) | |
| Dell G3 15 3579 | |
| Lenovo IdeaPad 720-15IKB | |
| Asus VivoBook 15 X542UF-DM143T | |
| Acer Aspire 5 A515-51G-509A | |
| Acer Aspire 5 A515-51G-51RL | |
| HP Pavilion 15-cw0003ng | |

| Acer Aspire 5 A515-52G-53PU Micron 1100 MTFDDAV256TBN | Acer Aspire 5 A515-51G-509A SK Hynix HFS256G39TND-N210A | Acer Aspire 5 A515-51G-51RL Kingston RBUSNS8180DS3128GH | HP Pavilion 15-cw0003ng Intel SSD 600p SSDPEKKW512G7 | Lenovo IdeaPad 720-15IKB Samsung PM961 MZVLW256HEHP | Asus VivoBook 15 X542UF-DM143T Micron 1100 MTFDDAV256TBN | Genomsnitt Micron 1100 MTFDDAV256TBN | |
|---|---|---|---|---|---|---|---|
| CrystalDiskMark 3.0 | 8% | -18% | 19% | 135% | 7% | -0% | |
| Read Seq (MB/s) | 452.9 | 499.5 10% | 407.5 -10% | 1040 130% | 1713 278% | 468.5 3% | 465 ? 3% |
| Write Seq (MB/s) | 414.2 | 265.8 -36% | 283.5 -32% | 179.9 -57% | 1129 173% | 378.4 -9% | 379 ? -8% |
| Read 512 (MB/s) | 298.3 | 314.3 5% | 282.4 -5% | 641 115% | 926 210% | 342.5 15% | 315 ? 6% |
| Write 512 (MB/s) | 312.3 | 266.3 -15% | 72.7 -77% | 300.3 -4% | 721 131% | 368.7 18% | 315 ? 1% |
| Read 4k (MB/s) | 19.13 | 29.24 53% | 26.81 40% | 19.99 4% | 55.5 190% | 26.93 41% | 24.6 ? 29% |
| Write 4k (MB/s) | 84.8 | 78.4 -8% | 73.7 -13% | 72 -15% | 124.5 47% | 88.1 4% | 80.8 ? -5% |
| Read 4k QD32 (MB/s) | 247.4 | 402.5 63% | 294.8 19% | 264.5 7% | 374.2 51% | 247.8 0% | 227 ? -8% |
| Write 4k QD32 (MB/s) | 290 | 264.9 -9% | 89.6 -69% | 206.1 -29% | 290.4 0% | 246.5 -15% | 233 ? -20% |
| 3DMark 06 Standard Score | 22890 poäng | |
| 3DMark 11 Performance | 4749 poäng | |
| 3DMark Ice Storm Standard Score | 69823 poäng | |
| 3DMark Cloud Gate Standard Score | 12652 poäng | |
| 3DMark Fire Strike Score | 3230 poäng | |
| 3DMark Fire Strike Extreme Score | 1620 poäng | |
| 3DMark Time Spy Score | 1166 poäng | |
Hjälp | ||
| 3DMark 11 - 1280x720 Performance GPU | |
| Genomsnitt av klass Multimedia (3765 - 60002, n=62, senaste 2 åren) | |
| Lenovo IdeaPad 720-15IKB | |
| Dell G3 15 3579 | |
| Acer Aspire 5 A515-51G-51RL | |
| Acer Aspire 5 A515-52G-53PU | |
| Genomsnitt NVIDIA GeForce MX150 (2796 - 4905, n=47) | |
| Acer Aspire 5 A515-51G-509A | |
| Asus VivoBook 15 X542UF-DM143T | |
| HP Pavilion 15-cw0003ng | |
| 3DMark | |
| 1280x720 Cloud Gate Standard Graphics | |
| Genomsnitt av klass Multimedia (16765 - 143501, n=34, senaste 2 åren) | |
| Dell G3 15 3579 | |
| Lenovo IdeaPad 720-15IKB | |
| Acer Aspire 5 A515-52G-53PU | |
| Genomsnitt NVIDIA GeForce MX150 (16227 - 22183, n=43) | |
| Acer Aspire 5 A515-51G-51RL | |
| Acer Aspire 5 A515-51G-509A | |
| Asus VivoBook 15 X542UF-DM143T | |
| HP Pavilion 15-cw0003ng | |
| 1920x1080 Fire Strike Graphics | |
| Genomsnitt av klass Multimedia (2328 - 48907, n=66, senaste 2 åren) | |
| Dell G3 15 3579 | |
| Lenovo IdeaPad 720-15IKB | |
| Acer Aspire 5 A515-52G-53PU | |
| Acer Aspire 5 A515-51G-51RL | |
| Genomsnitt NVIDIA GeForce MX150 (2323 - 3739, n=44) | |
| Acer Aspire 5 A515-51G-509A | |
| Asus VivoBook 15 X542UF-DM143T | |
| HP Pavilion 15-cw0003ng | |
| låg | med. | hög | ultra | |
|---|---|---|---|---|
| Tomb Raider (2013) | 244.7 | 132.8 | 85.9 | 39.8 |
| BioShock Infinite (2013) | 183.9 | 105.9 | 89.8 | 33.7 |
| The Witcher 3 (2015) | 58.8 | 35.2 | 19.3 | 10.7 |
| Fortnite (2018) | 130.1 | 52.5 | 36.7 | 22.7 |
| Far Cry 5 (2018) | 45 | 18 | 16 | 15 |
| The Crew 2 (2018) | 56.8 | 24.2 | 21.4 | 18 |
| Monster Hunter World (2018) | 53.4 | 19.6 | 17.5 | 12.8 |
| F1 2018 (2018) | 65 | 35 | 26 | 15 |
| Shadow of the Tomb Raider (2018) | 45 | 18 | 15 | 10 |
| FIFA 19 (2018) | 141.5 | 114.3 | 108.2 | 97.2 |
| Forza Horizon 4 (2018) | 57 | 25 | 21 | 14 |
| Assassin´s Creed Odyssey (2018) | 41 | 17 | 12 | 6 |
| Call of Duty Black Ops 4 (2018) | 60.3 | 19.3 | 19.2 | 15.4 |
| BioShock Infinite - 1366x768 High Preset | |
| Dell G3 15 3579 | |
| Lenovo IdeaPad 720-15IKB | |
| Acer Aspire 5 A515-52G-53PU | |
| Genomsnitt NVIDIA GeForce MX150 (59.7 - 98, n=33) | |
| Acer Aspire 5 A515-51G-51RL | |
| Asus VivoBook 15 X542UF-DM143T | |
| The Witcher 3 - 1024x768 Low Graphics & Postprocessing | |
| Genomsnitt av klass Multimedia (68 - 380, n=10, senaste 2 åren) | |
| Dell G3 15 3579 | |
| Lenovo IdeaPad 720-15IKB | |
| Acer Aspire 5 A515-51G-51RL | |
| Acer Aspire 5 A515-52G-53PU | |
| Genomsnitt NVIDIA GeForce MX150 (42.6 - 72, n=24) | |
| Asus VivoBook 15 X542UF-DM143T | |
| Far Cry 5 - 1280x720 Low Preset AA:T | |
| Genomsnitt av klass Multimedia (37 - 182, n=23, senaste 2 åren) | |
| Lenovo IdeaPad 720-15IKB | |
| Acer Aspire 5 A515-52G-53PU | |
| Genomsnitt NVIDIA GeForce MX150 (31 - 46, n=7) | |
| Asus VivoBook 15 X542UF-DM143T | |
| HP Pavilion 15-cw0003ng | |
| Fortnite - 1920x1080 Medium Preset | |
| Lenovo IdeaPad 720-15IKB | |
| Genomsnitt NVIDIA GeForce MX150 (33.7 - 86.7, n=5) | |
| Acer Aspire 5 A515-52G-53PU | |
| Asus VivoBook 15 X542UF-DM143T | |
Ljudnivå
| Låg belastning |
| 30.5 / 30.5 / 30.9 dB(A) |
| Hög belastning |
| 41.2 / 41.9 dB(A) |
 | ||
30 dB tyst 40 dB(A) hörbar 50 dB(A) högt ljud |
||
min: | ||
| Acer Aspire 5 A515-52G-53PU i5-8265U, GeForce MX150 | Acer Aspire 5 A515-51G-509A i5-8250U, GeForce MX130 | Acer Aspire 5 A515-51G-51RL i5-7200U, GeForce MX150 | HP Pavilion 15-cw0003ng R5 2500U, Vega 8 | Lenovo IdeaPad 720-15IKB i5-7200U, Radeon RX 560 (Laptop) | Asus VivoBook 15 X542UF-DM143T i5-8250U, GeForce MX130 | Dell G3 15 3579 i5-8300H, GeForce GTX 1050 Mobile | Genomsnitt NVIDIA GeForce MX150 | Genomsnitt av klass Multimedia | |
|---|---|---|---|---|---|---|---|---|---|
| Noise | -4% | 1% | 4% | 3% | 2% | 1% | -1% | 12% | |
| av / miljö * (dB) | 30.5 | 31.1 -2% | 30.1 1% | 30.5 -0% | 30.3 1% | 30 2% | 28 8% | 35.9 ? -18% | 24.2 ? 21% |
| Idle Minimum * (dB) | 30.5 | 31.4 -3% | 30.1 1% | 31.4 -3% | 30.3 1% | 30.9 -1% | 29.8 2% | 29.8 ? 2% | 24.4 ? 20% |
| Idle Average * (dB) | 30.5 | 31.9 -5% | 30.2 1% | 31.4 -3% | 30.3 1% | 30.9 -1% | 29.8 2% | 29.9 ? 2% | 24.8 ? 19% |
| Idle Maximum * (dB) | 30.9 | 32.2 -4% | 30.5 1% | 31.6 -2% | 30.3 2% | 30.9 -0% | 30 3% | 30.5 ? 1% | 26.5 ? 14% |
| Load Average * (dB) | 41.2 | 41 -0% | 41.1 -0% | 33.5 19% | 39.2 5% | 39 5% | 38.6 6% | 38.5 ? 7% | 37.6 ? 9% |
| Load Maximum * (dB) | 41.9 | 46.4 -11% | 41.2 2% | 35.9 14% | 39.2 6% | 38 9% | 49.4 -18% | 41.3 ? 1% | 45.9 ? -10% |
| Witcher 3 ultra * (dB) | 41.3 | 40.4 | 41.6 | 46.9 |
* ... mindre är bättre
(-) Den maximala temperaturen på ovansidan är 52.9 °C / 127 F, jämfört med genomsnittet av 36.8 °C / 98 F , allt från 21 till 71 °C för klassen Multimedia.
(-) Botten värms upp till maximalt 51.5 °C / 125 F, jämfört med genomsnittet av 39.1 °C / 102 F
(+) Vid tomgångsbruk är medeltemperaturen för ovansidan 25.6 °C / 78 F, jämfört med enhetsgenomsnittet på 31.3 °C / ### class_avg_f### F.
(+) Handledsstöden och pekplattan är kallare än hudtemperaturen med maximalt 24.3 °C / 75.7 F och är därför svala att ta på.
(+) Medeltemperaturen för handledsstödsområdet på liknande enheter var 28.7 °C / 83.7 F (+4.4 °C / 8 F).
| Acer Aspire 5 A515-52G-53PU i5-8265U, GeForce MX150 | Acer Aspire 5 A515-51G-509A i5-8250U, GeForce MX130 | Acer Aspire 5 A515-51G-51RL i5-7200U, GeForce MX150 | HP Pavilion 15-cw0003ng R5 2500U, Vega 8 | Lenovo IdeaPad 720-15IKB i5-7200U, Radeon RX 560 (Laptop) | Asus VivoBook 15 X542UF-DM143T i5-8250U, GeForce MX130 | Dell G3 15 3579 i5-8300H, GeForce GTX 1050 Mobile | Genomsnitt NVIDIA GeForce MX150 | Genomsnitt av klass Multimedia | |
|---|---|---|---|---|---|---|---|---|---|
| Heat | 10% | 6% | 24% | 24% | 15% | -12% | 10% | 12% | |
| Maximum Upper Side * (°C) | 52.9 | 41 22% | 41.3 22% | 37.3 29% | 41.2 22% | 40.2 24% | 47 11% | 44.6 ? 16% | 41.5 ? 22% |
| Maximum Bottom * (°C) | 51.5 | 49 5% | 48.7 5% | 37.3 28% | 36.4 29% | 46.6 10% | 61.2 -19% | 45.6 ? 11% | 44.1 ? 14% |
| Idle Upper Side * (°C) | 28.4 | 26 8% | 28.7 -1% | 23.7 17% | 22 23% | 25.1 12% | 34 -20% | 26.8 ? 6% | 27.1 ? 5% |
| Idle Bottom * (°C) | 29.7 | 28 6% | 30.8 -4% | 23.9 20% | 23.6 21% | 25.8 13% | 35.8 -21% | 27.3 ? 8% | 28 ? 6% |
* ... mindre är bättre
Acer Aspire 5 A515-52G-53PU ljudanalys
(-) | inte särskilt höga högtalare (67 dB)
Bas 100 - 315 Hz
(-) | nästan ingen bas - i genomsnitt 23.9% lägre än medianen
(±) | linjäriteten för basen är genomsnittlig (11.2% delta till föregående frekvens)
Mellan 400 - 2000 Hz
(+) | balanserad mellan - endast 2.6% från medianen
(±) | linjäriteten för mids är genomsnittlig (8.6% delta till föregående frekvens)
Högsta 2 - 16 kHz
(+) | balanserade toppar - endast 1.8% från medianen
(+) | toppar är linjära (3.8% delta till föregående frekvens)
Totalt 100 - 16 000 Hz
(±) | linjäriteten för det totala ljudet är genomsnittlig (21.9% skillnad mot median)
Jämfört med samma klass
» 78% av alla testade enheter i den här klassen var bättre, 4% liknande, 18% sämre
» Den bästa hade ett delta på 5%, genomsnittet var 17%, sämst var 45%
Jämfört med alla testade enheter
» 63% av alla testade enheter var bättre, 7% liknande, 31% sämre
» Den bästa hade ett delta på 4%, genomsnittet var 24%, sämst var 134%
Apple MacBook 12 (Early 2016) 1.1 GHz ljudanalys
(+) | högtalare kan spela relativt högt (83.6 dB)
Bas 100 - 315 Hz
(±) | reducerad bas - i genomsnitt 11.3% lägre än medianen
(±) | linjäriteten för basen är genomsnittlig (14.2% delta till föregående frekvens)
Mellan 400 - 2000 Hz
(+) | balanserad mellan - endast 2.4% från medianen
(+) | mids är linjära (5.5% delta till föregående frekvens)
Högsta 2 - 16 kHz
(+) | balanserade toppar - endast 2% från medianen
(+) | toppar är linjära (4.5% delta till föregående frekvens)
Totalt 100 - 16 000 Hz
(+) | det totala ljudet är linjärt (10.2% skillnad mot median)
Jämfört med samma klass
» 7% av alla testade enheter i den här klassen var bättre, 2% liknande, 91% sämre
» Den bästa hade ett delta på 5%, genomsnittet var 18%, sämst var 53%
Jämfört med alla testade enheter
» 5% av alla testade enheter var bättre, 1% liknande, 94% sämre
» Den bästa hade ett delta på 4%, genomsnittet var 24%, sämst var 134%
| Av/Standby | |
| Låg belastning | |
| Hög belastning |
|
Förklaring:
min: | |
| Acer Aspire 5 A515-52G-53PU i5-8265U, GeForce MX150 | Acer Aspire 5 A515-51G-509A i5-8250U, GeForce MX130 | Acer Aspire 5 A515-51G-51RL i5-7200U, GeForce MX150 | HP Pavilion 15-cw0003ng R5 2500U, Vega 8 | Lenovo IdeaPad 720-15IKB i5-7200U, Radeon RX 560 (Laptop) | Asus VivoBook 15 X542UF-DM143T i5-8250U, GeForce MX130 | Dell G3 15 3579 i5-8300H, GeForce GTX 1050 Mobile | Genomsnitt NVIDIA GeForce MX150 | Genomsnitt av klass Multimedia | |
|---|---|---|---|---|---|---|---|---|---|
| Power Consumption | -6% | 14% | 9% | -52% | 0% | -71% | -7% | -44% | |
| Idle Minimum * (Watt) | 3.8 | 5.1 -34% | 2.9 24% | 4.5 -18% | 9.9 -161% | 4.75 -25% | 7.9 -108% | 4.48 ? -18% | 5.71 ? -50% |
| Idle Average * (Watt) | 6.3 | 7.6 -21% | 5.9 6% | 7.3 -16% | 9.5 -51% | 6.9 -10% | 9.6 -52% | 7.88 ? -25% | 10.1 ? -60% |
| Idle Maximum * (Watt) | 9.6 | 8.2 15% | 6.4 33% | 9.4 2% | 10.7 -11% | 7 27% | 13 -35% | 9.76 ? -2% | 12.4 ? -29% |
| Load Average * (Watt) | 59.5 | 49.4 17% | 54 9% | 34 43% | 62 -4% | 53 11% | 93 -56% | 54.7 ? 8% | 65 ? -9% |
| Load Maximum * (Watt) | 64.4 | 68 -6% | 66 -2% | 41.9 35% | 86.7 -35% | 65.3 -1% | 132.7 -106% | 63.5 ? 1% | 112.2 ? -74% |
| Witcher 3 ultra * (Watt) | 42.1 | 51 | 84 | 100.6 |
* ... mindre är bättre
| Acer Aspire 5 A515-52G-53PU i5-8265U, GeForce MX150, 48 Wh | Acer Aspire 5 A515-51G-509A i5-8250U, GeForce MX130, 48 Wh | Acer Aspire 5 A515-51G-51RL i5-7200U, GeForce MX150, 48 Wh | HP Pavilion 15-cw0003ng R5 2500U, Vega 8, 41 Wh | Lenovo IdeaPad 720-15IKB i5-7200U, Radeon RX 560 (Laptop), 40 Wh | Asus VivoBook 15 X542UF-DM143T i5-8250U, GeForce MX130, 38 Wh | Dell G3 15 3579 i5-8300H, GeForce GTX 1050 Mobile, 56 Wh | Genomsnitt av klass Multimedia | |
|---|---|---|---|---|---|---|---|---|
| Batteridrifttid | 18% | 32% | -23% | -2% | -9% | 8% | 71% | |
| Reader / Idle (h) | 14.1 | 14.5 3% | 20.9 48% | 8.4 -40% | 16.1 14% | 25.2 ? 79% | ||
| H.264 (h) | 6.7 | 8.8 31% | 8.2 22% | 3.8 -43% | 9.2 37% | 16.4 ? 145% | ||
| WiFi v1.3 (h) | 7.5 | 5.8 -23% | 8.6 15% | 5 -33% | 7.1 -5% | 6.8 -9% | 6.5 -13% | 12 ? 60% |
| Load (h) | 1.7 | 2.7 59% | 2.4 41% | 2.1 24% | 0.8 -53% | 2.2 29% | 1.675 ? -1% |
För
Emot
Läs den fullständiga versionen av den här recensionen på engelska här.
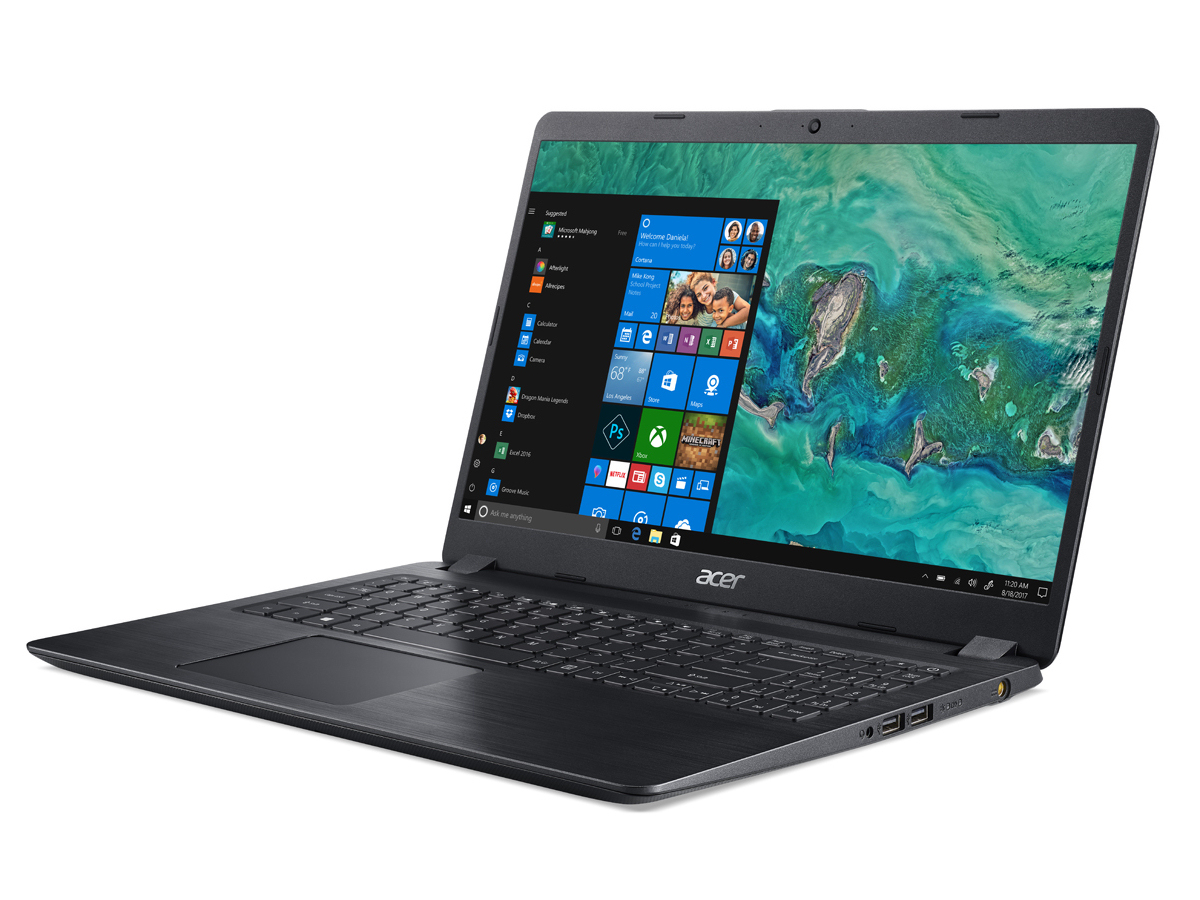
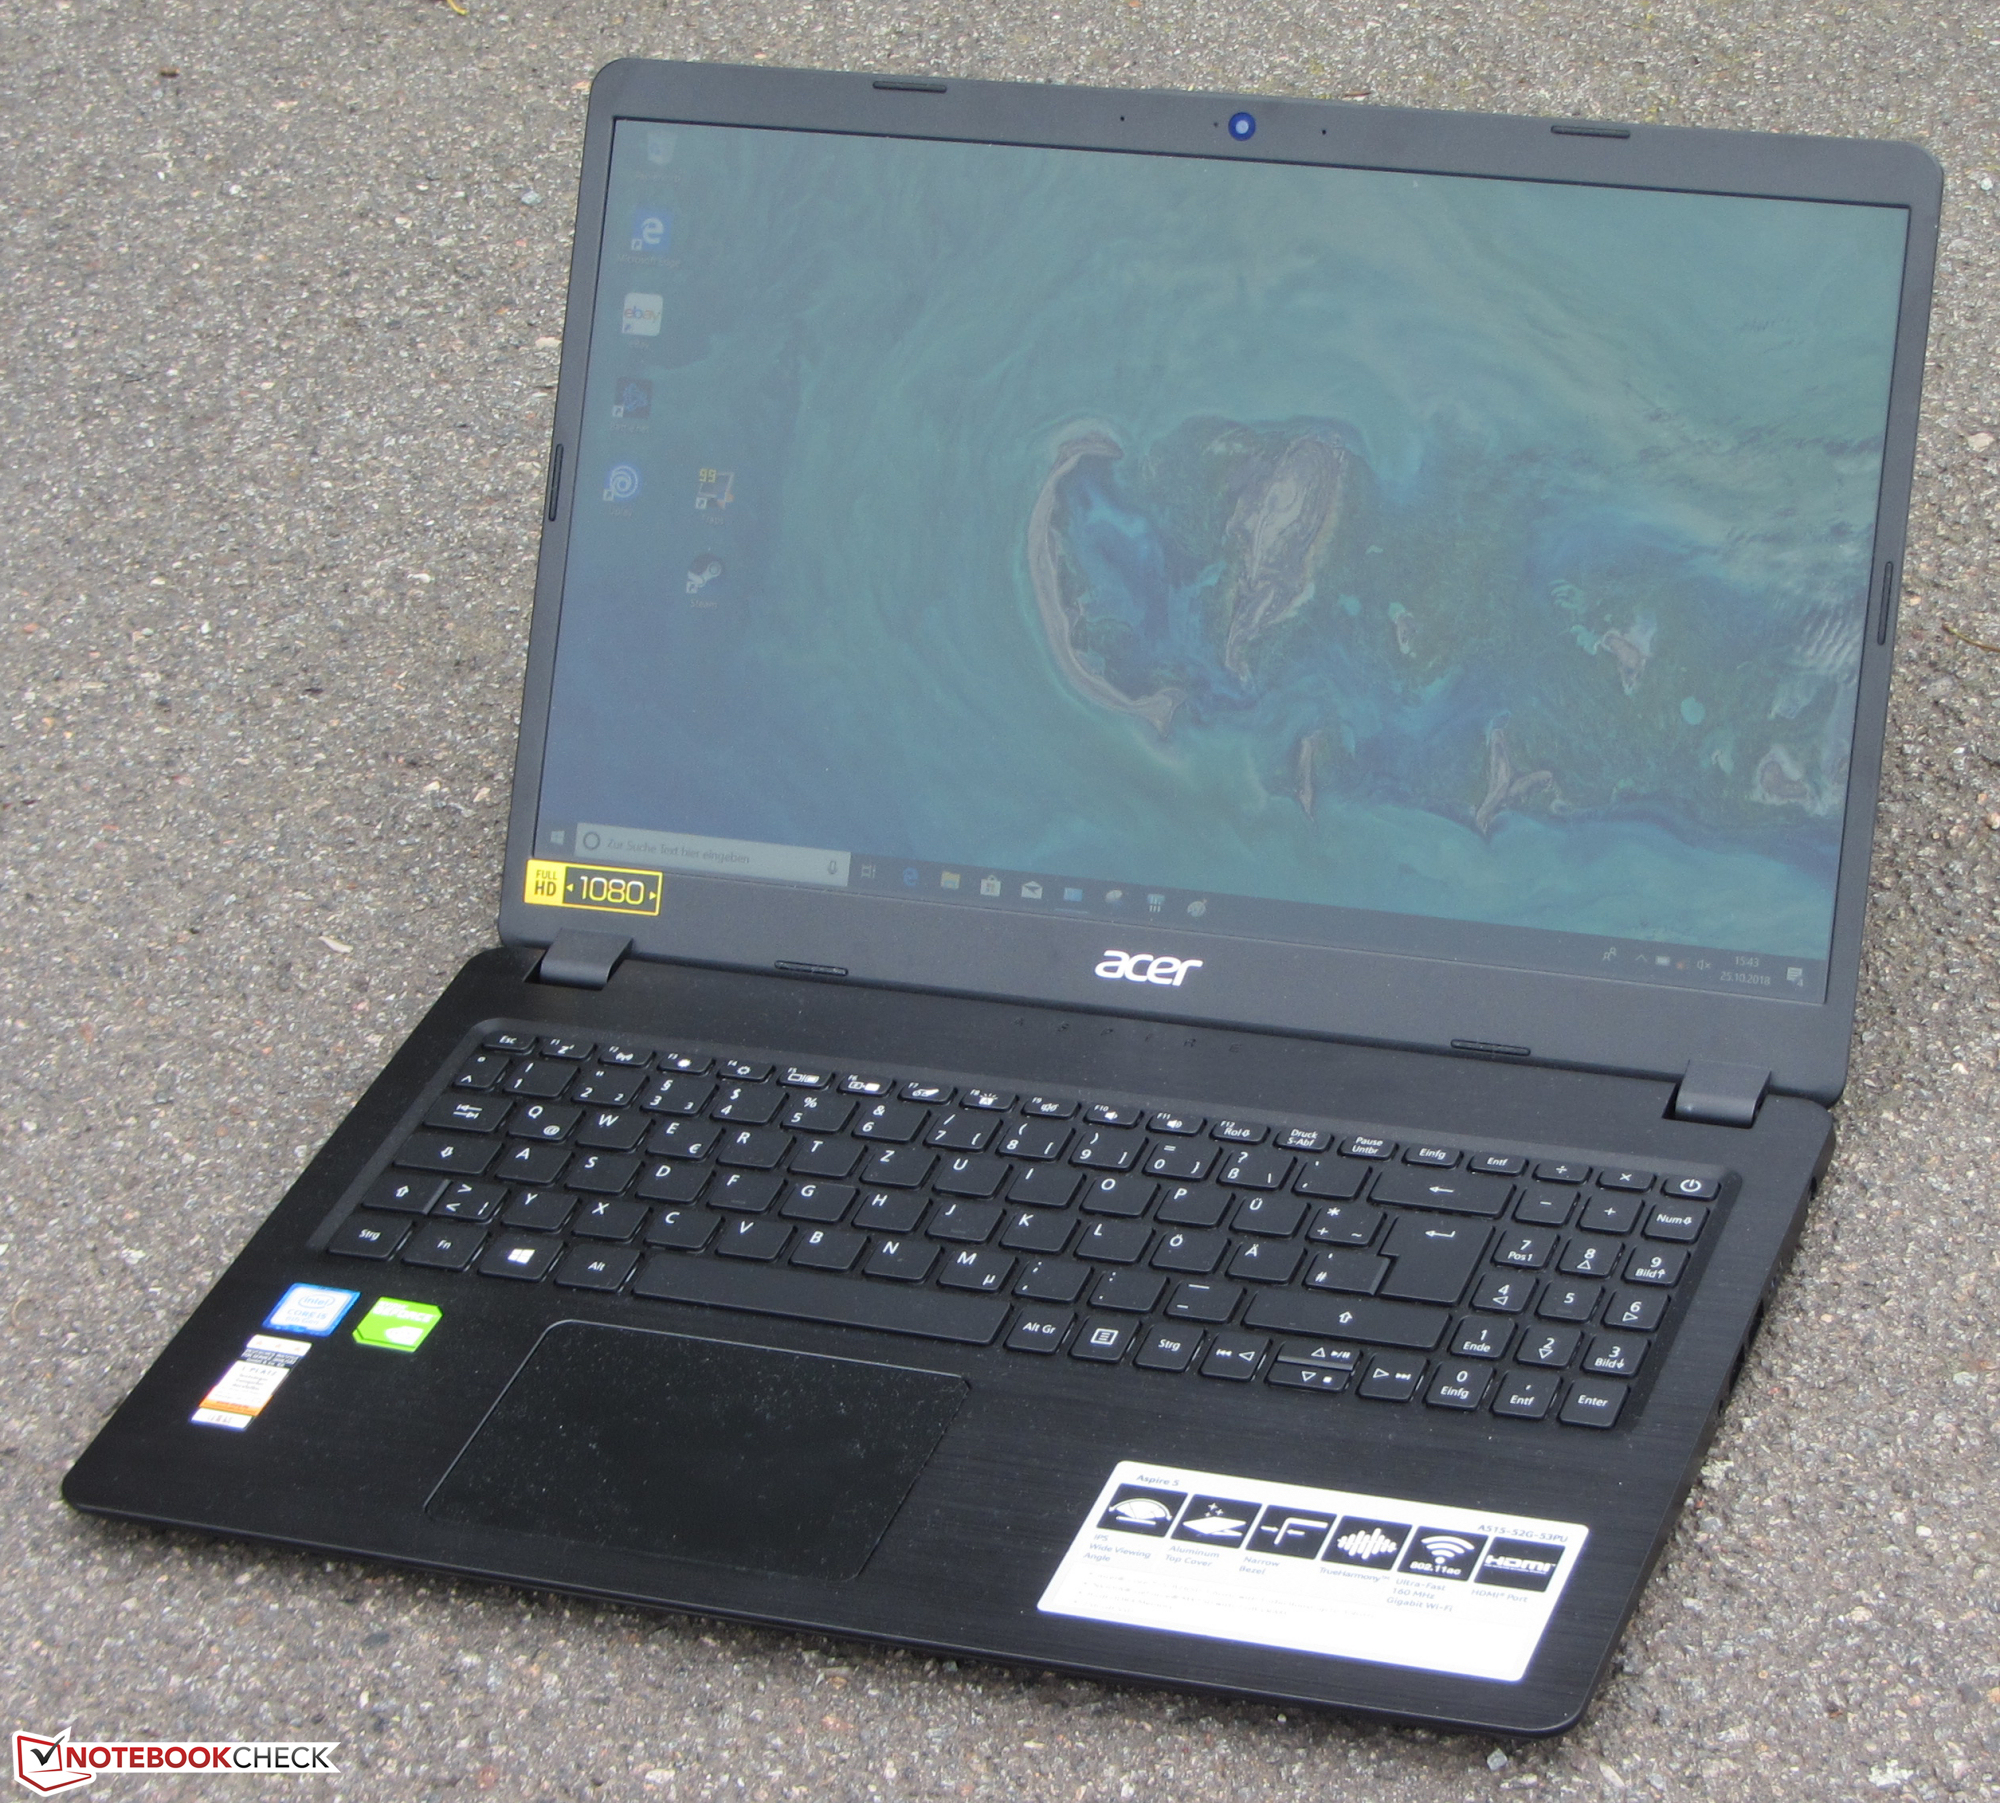
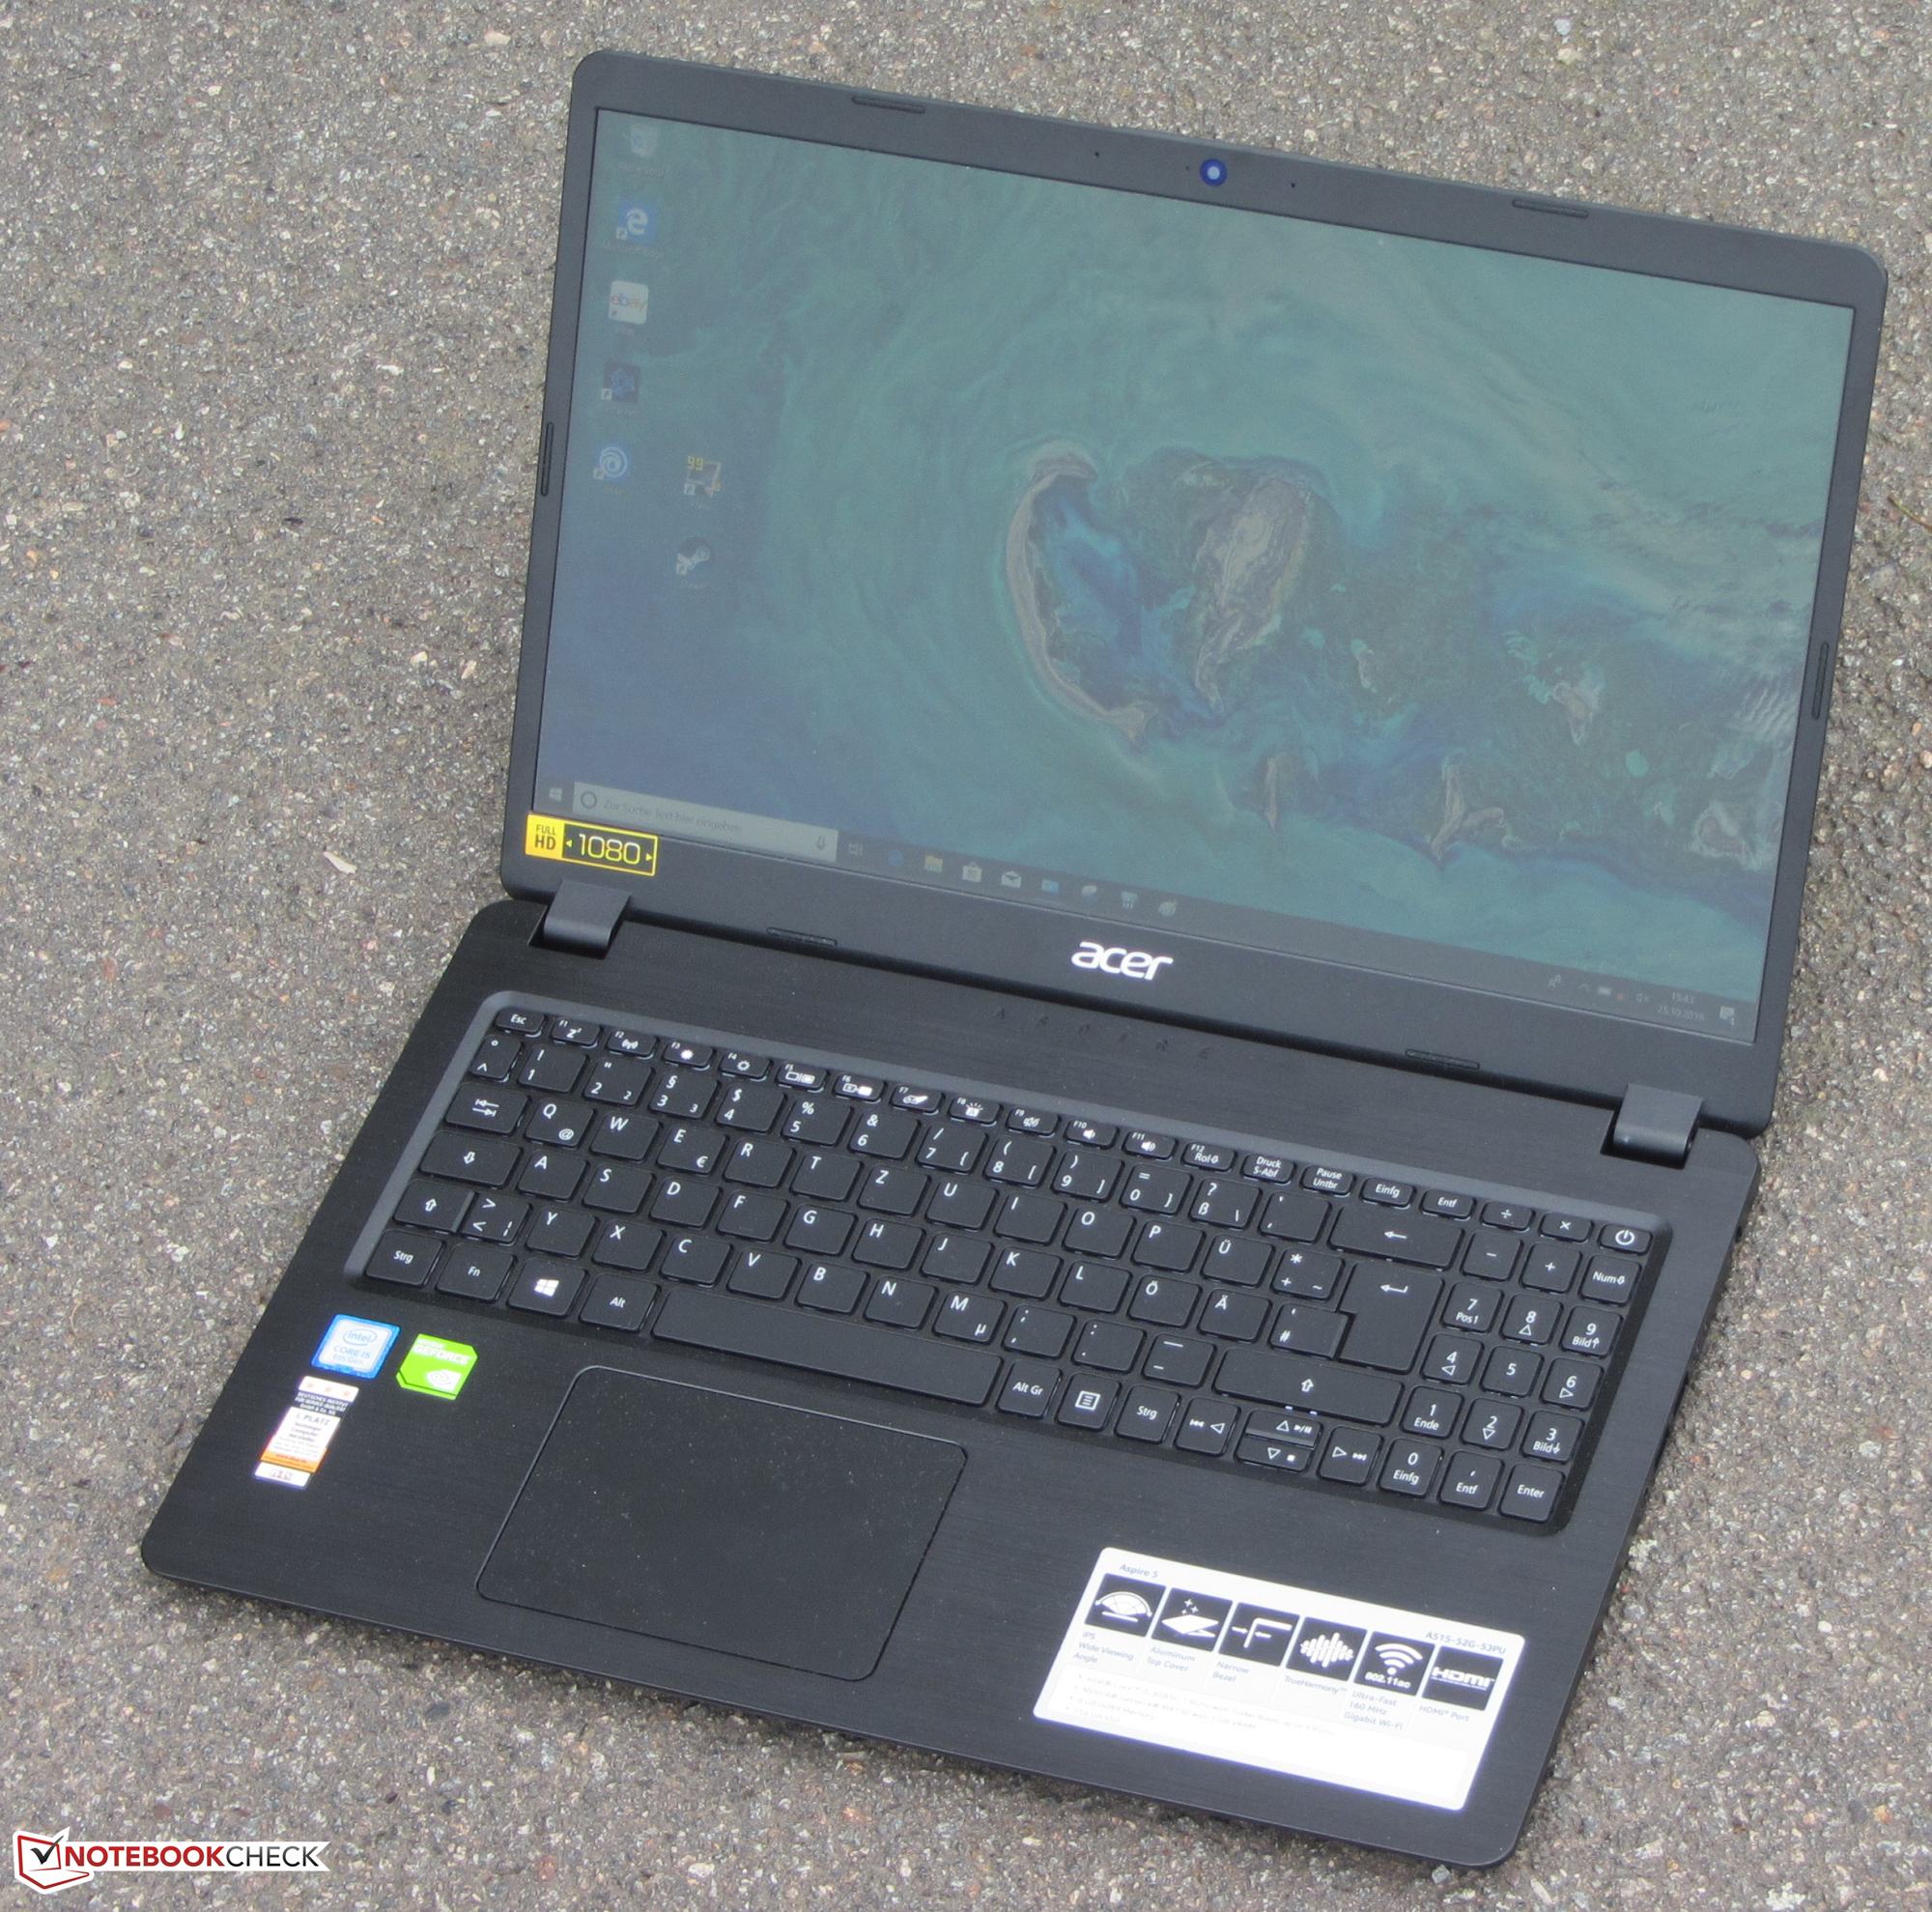
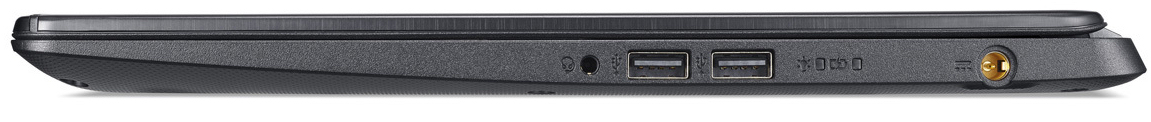
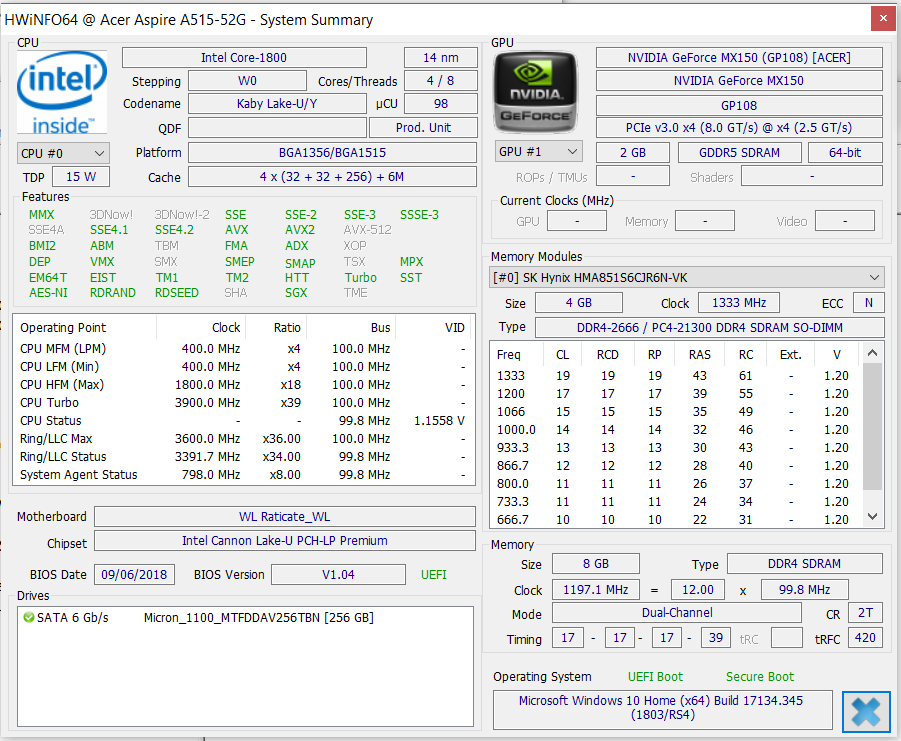
Aspire 5 A515-52G är en allt-i-allo för multimedia på 15 tum från Acer. Föregångarens redan tunna hölje har blivit ännu tunnare och kompaktare samtidigt som vikten minskat.
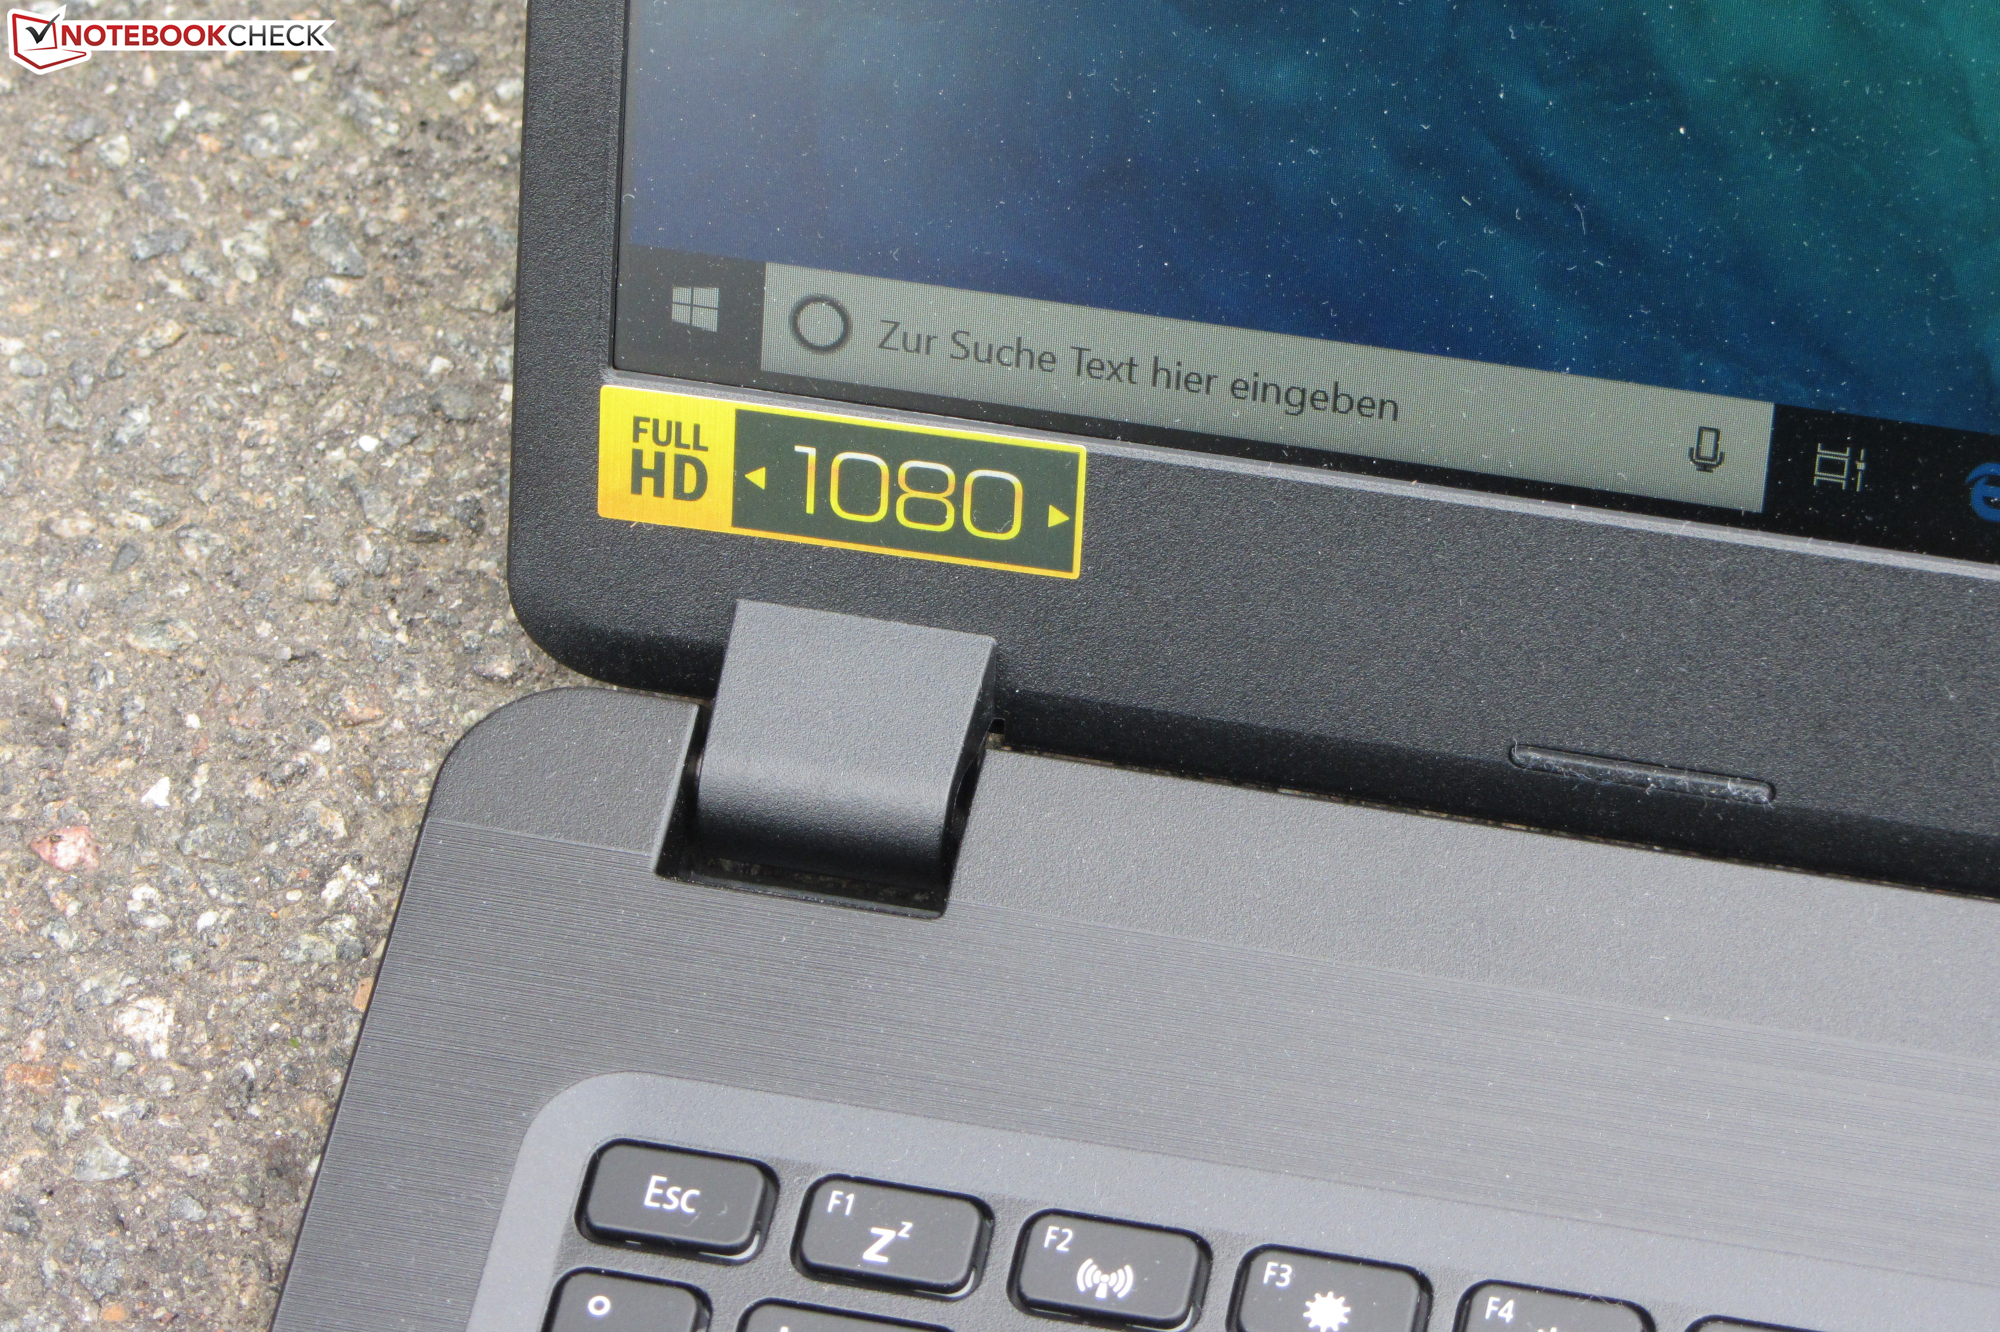
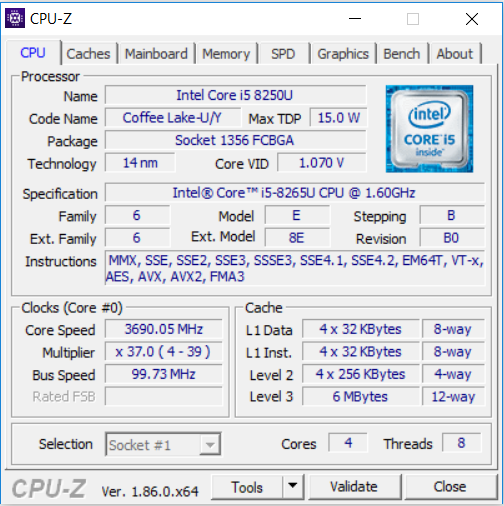
Enheten drivs av en splitter ny Core i5-processor från Whiskey Lake-generationen. Den har tillräckligt med prestanda för alla vanliga användarscenarier. Att prestandan har ökat jämfört med dess föregångare (Core i5-8250U) beror bara på högre hastighet. Prestandan per MHz har inte förändrats. Kombinerad med GeForce MX150 GPU:n kan denna processor rita upp alla moderna spel på den matta Full HD-skärmen.
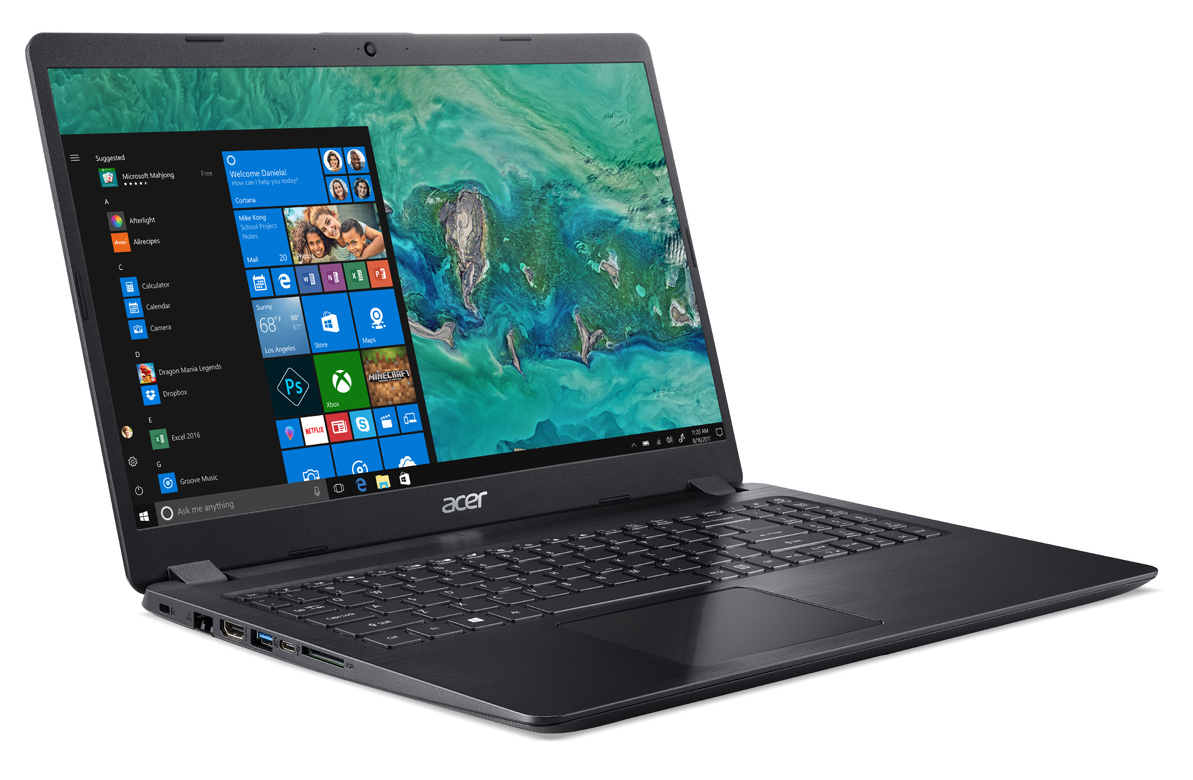
Acer har med sin Aspire 5 A515-52G skapat en allt-i-allo som även lämpar sig för spel och knappt har några märkbara svagheter.
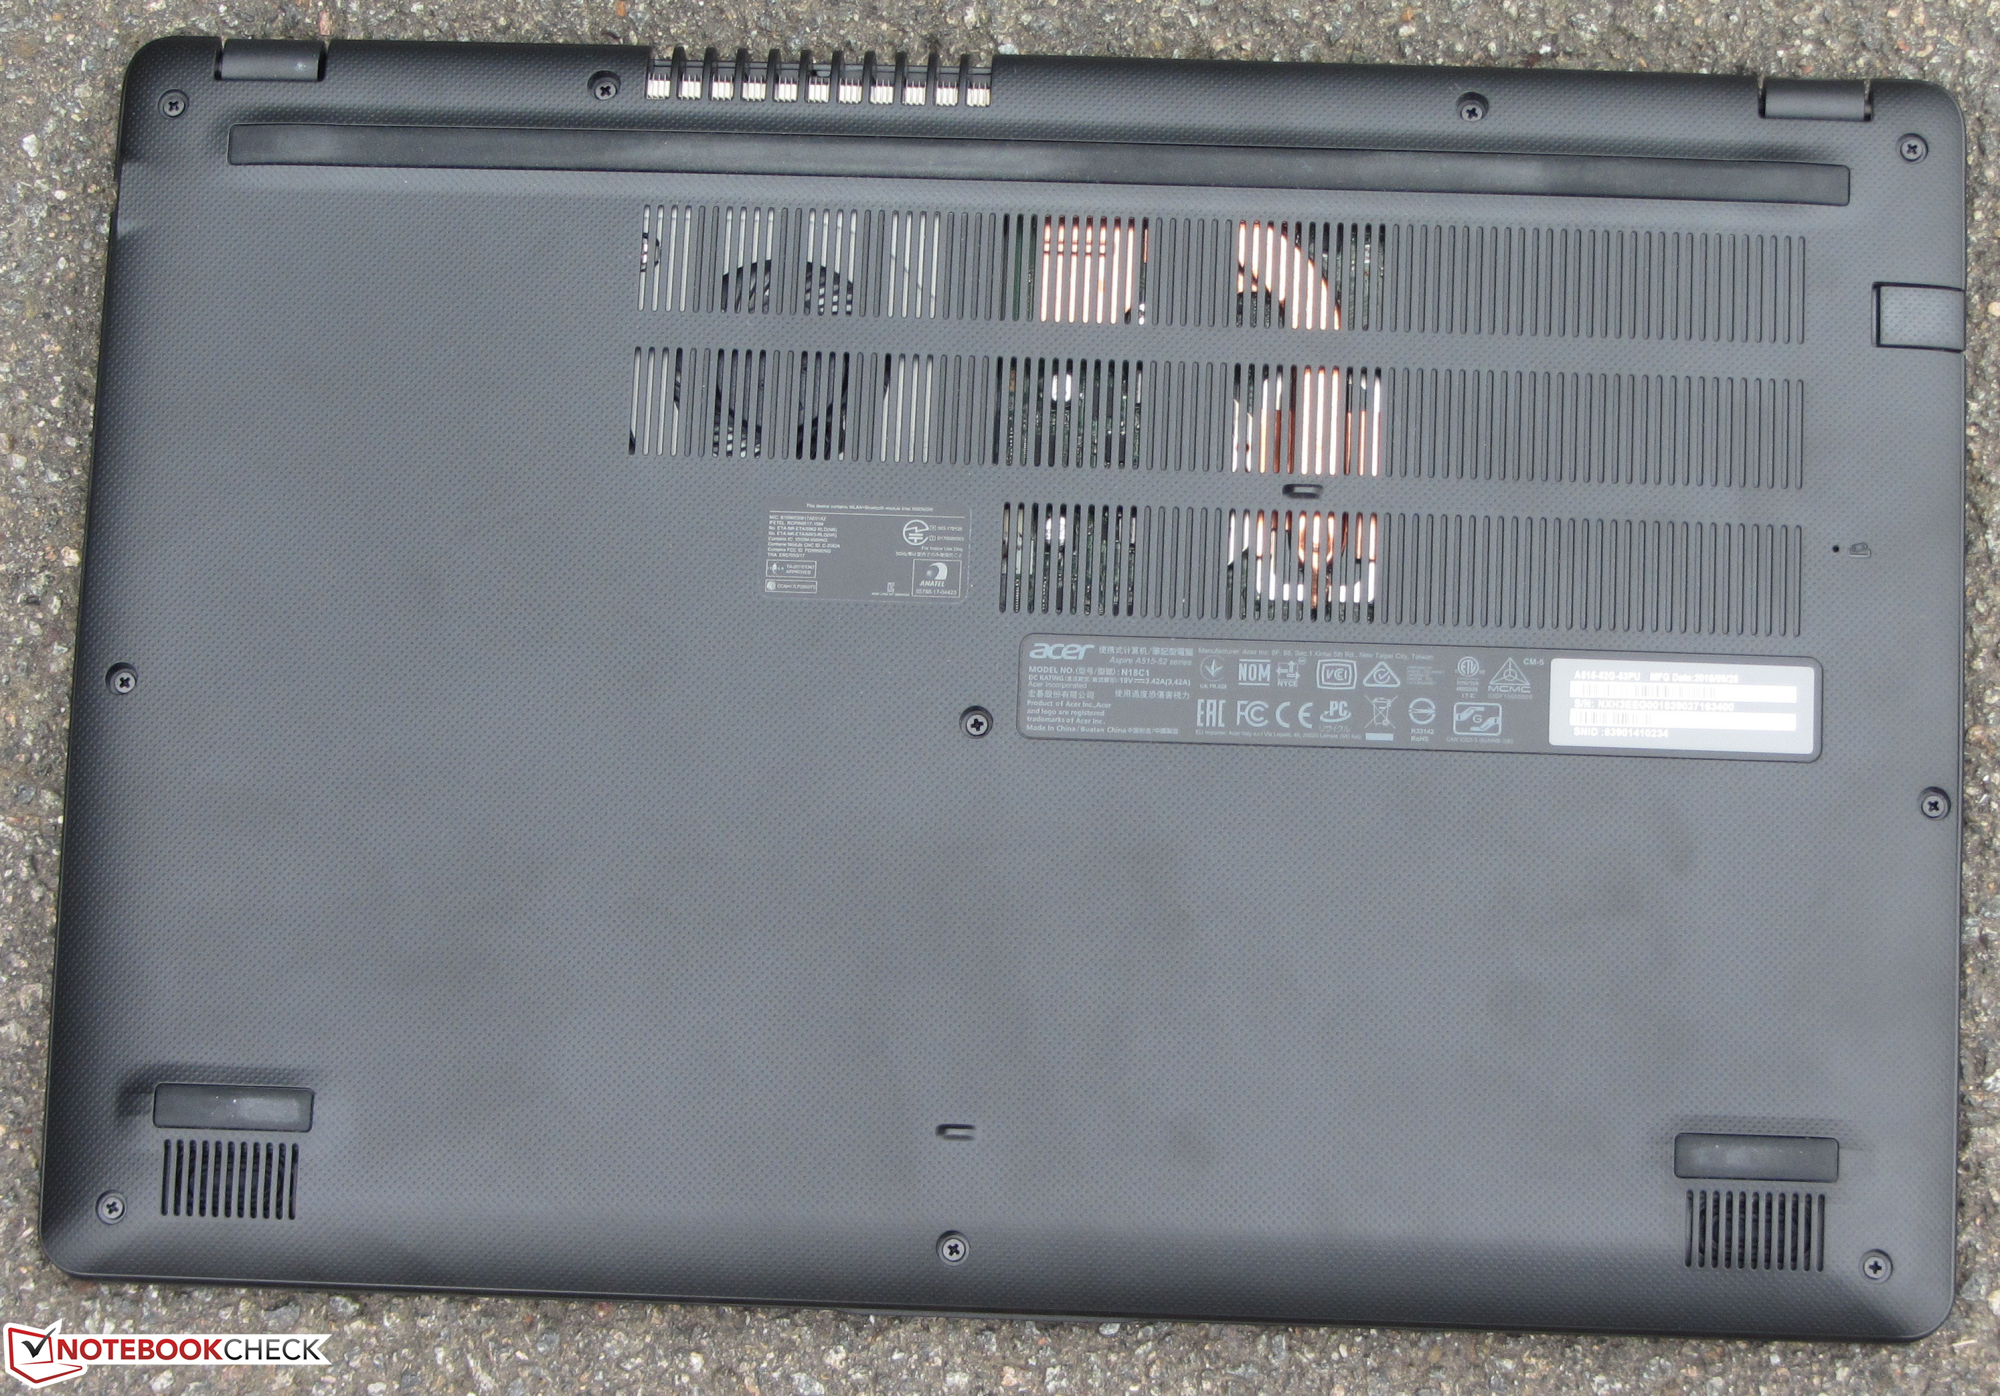
En SSD-enhet gör att systemet flyter på smidigt. Det går att öppna enheten och byta ut den existerande SATA III SSD-enheten med en snabbare NVMe-modell. Det finns också en ledig plats för en hårddisk på 2.5 tum. Men du behöver extra hårdvara för att installera en sådan.
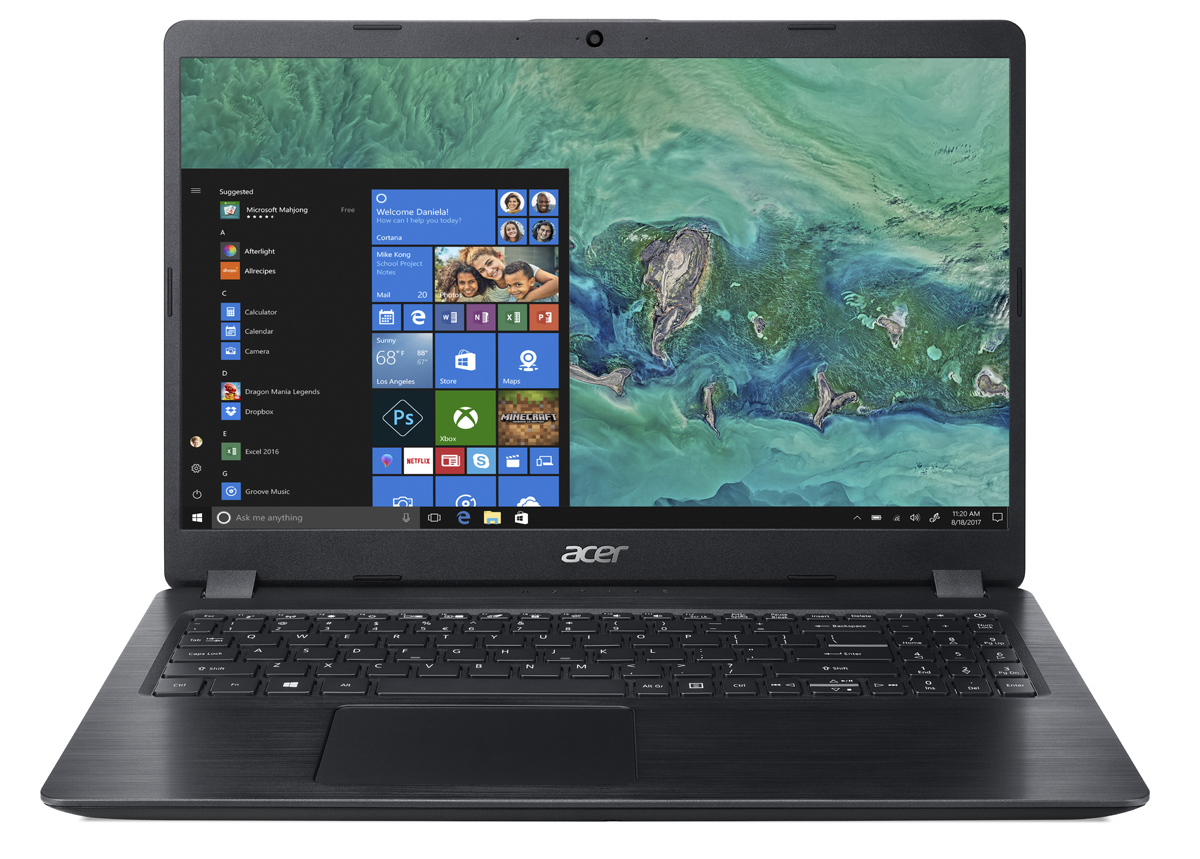
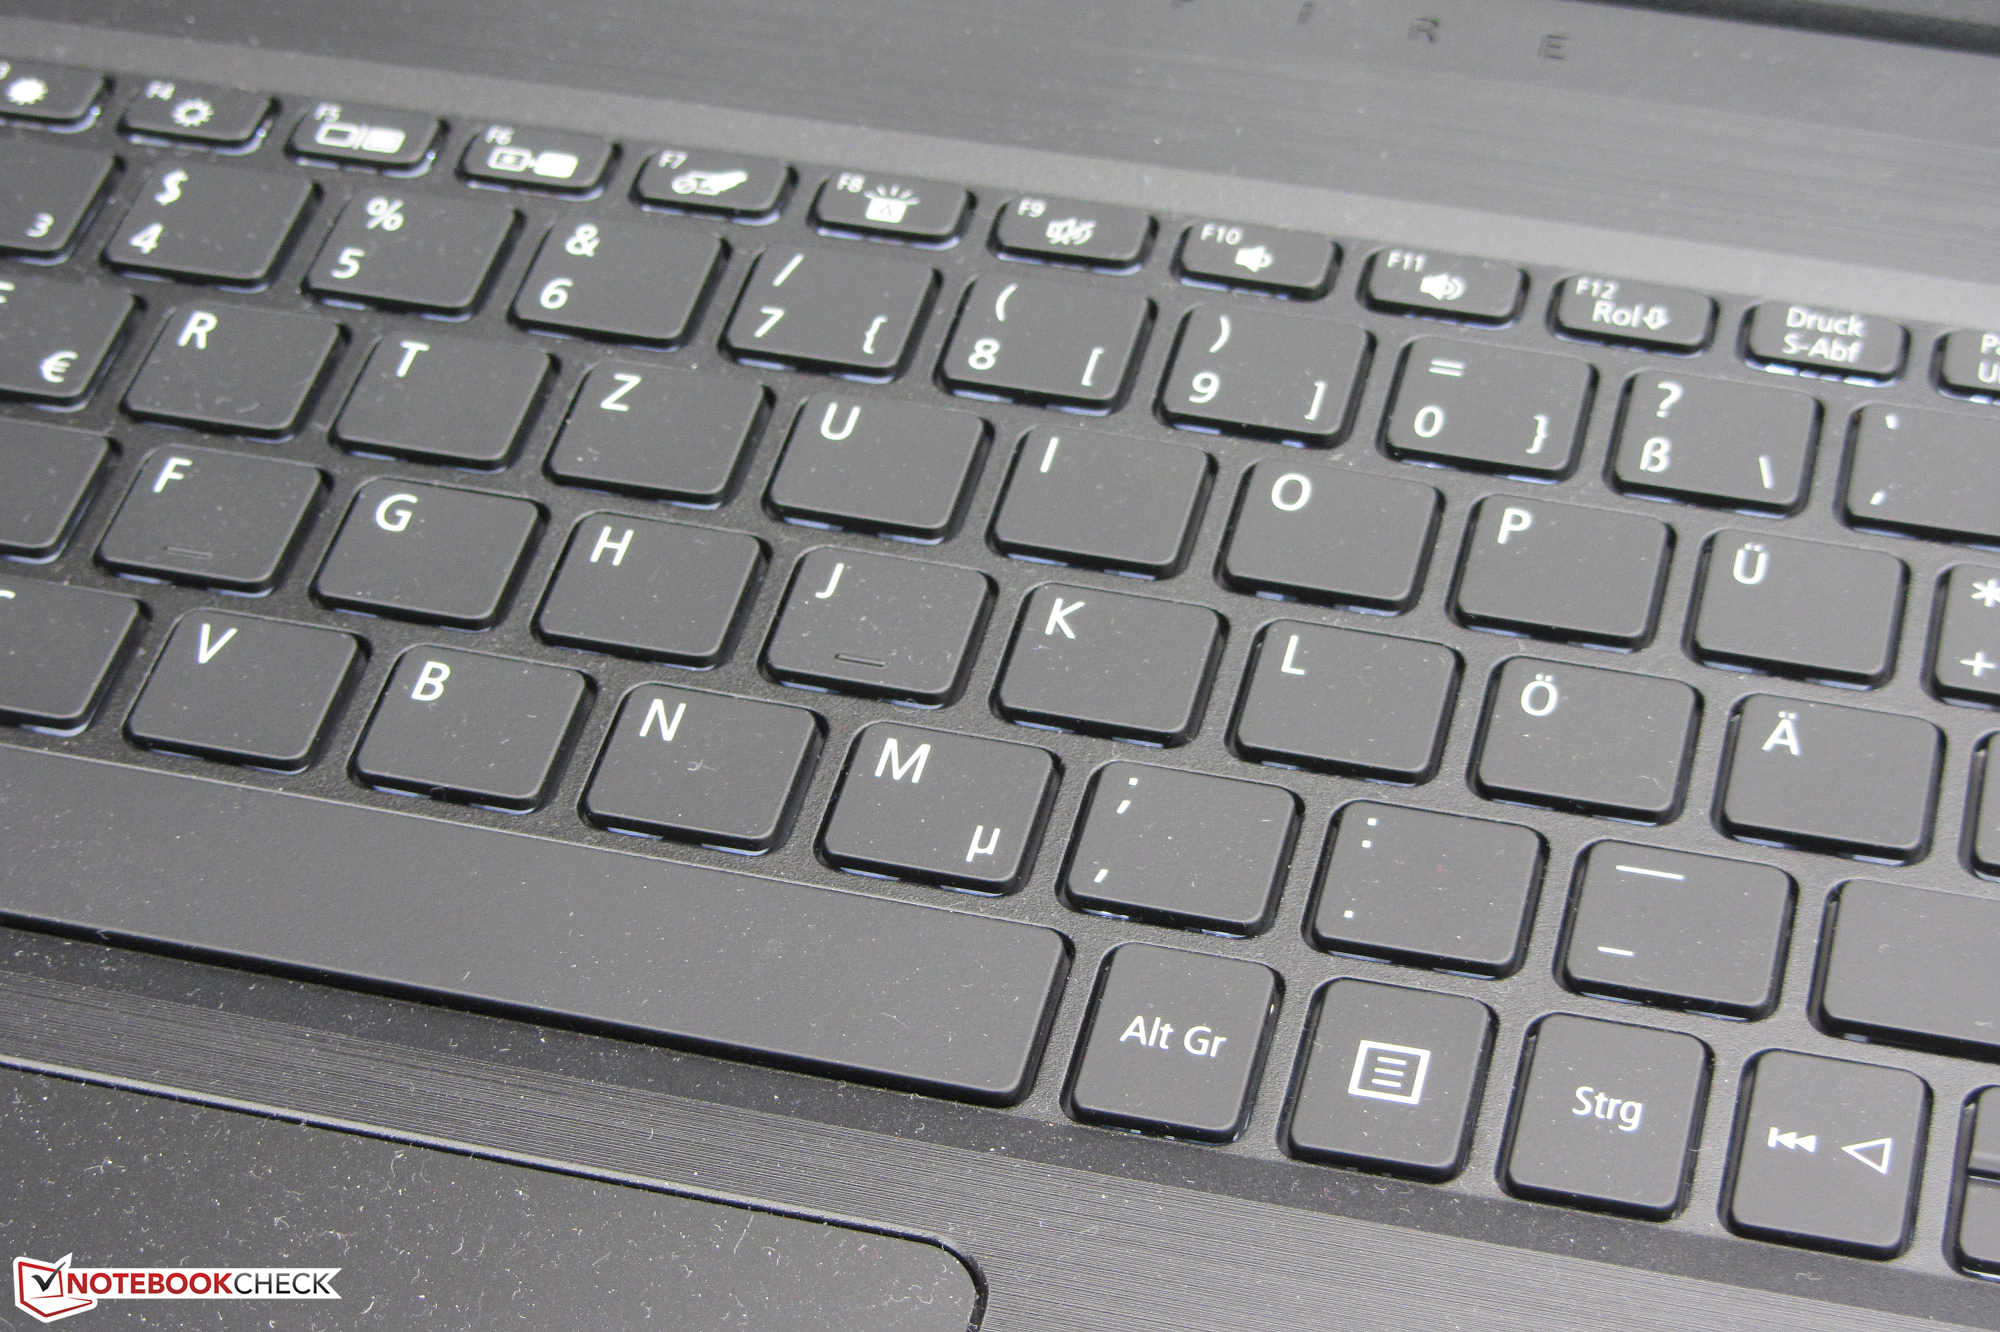
Aspire har ett skapligt tangentbord med bakgrundsbelysning (en ljusstyrkenivå) och bra batteritid. Den har en matt IPS-skärm med stabila betraktningsvinklar, ett kontrastförhållande som går från skapligt till bra och har tillfredsställande färgåtergivning. Skärmens ljusstyrka kunde varit bättre för sitt prisskikt.
Totalt sett är vi riktigt nöjda med Aspire 5. Men enheten saknar en unik köpanledning. Den som inte behöver en CPU från den senaste generationen och nöjer sig med upp till 12 GB RAM kan vilja ta en titt på den tidigare modellen, Acer Aspire 5 A515-51G. Vår testenhet har spelprestanda som är jämförbar med den tidigare modellen. Detta skulle spara en del pengar då A515-51G med en konfiguration som liknar dagens testenhet går att få tag på för 5.800 kronor.
Acer Aspire 5 A515-52G-53PU
- 11/01/2018 v6 (old)
Sascha Mölck
Price comparison
