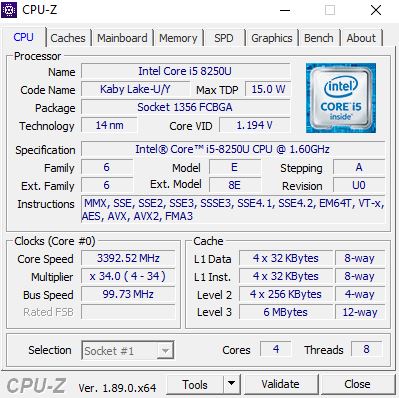
Test: Dell Latitude 3390 (Core i5-8250U, Full HD, 256 GB SSD) Omvandlingsbar (Sammanfattning)
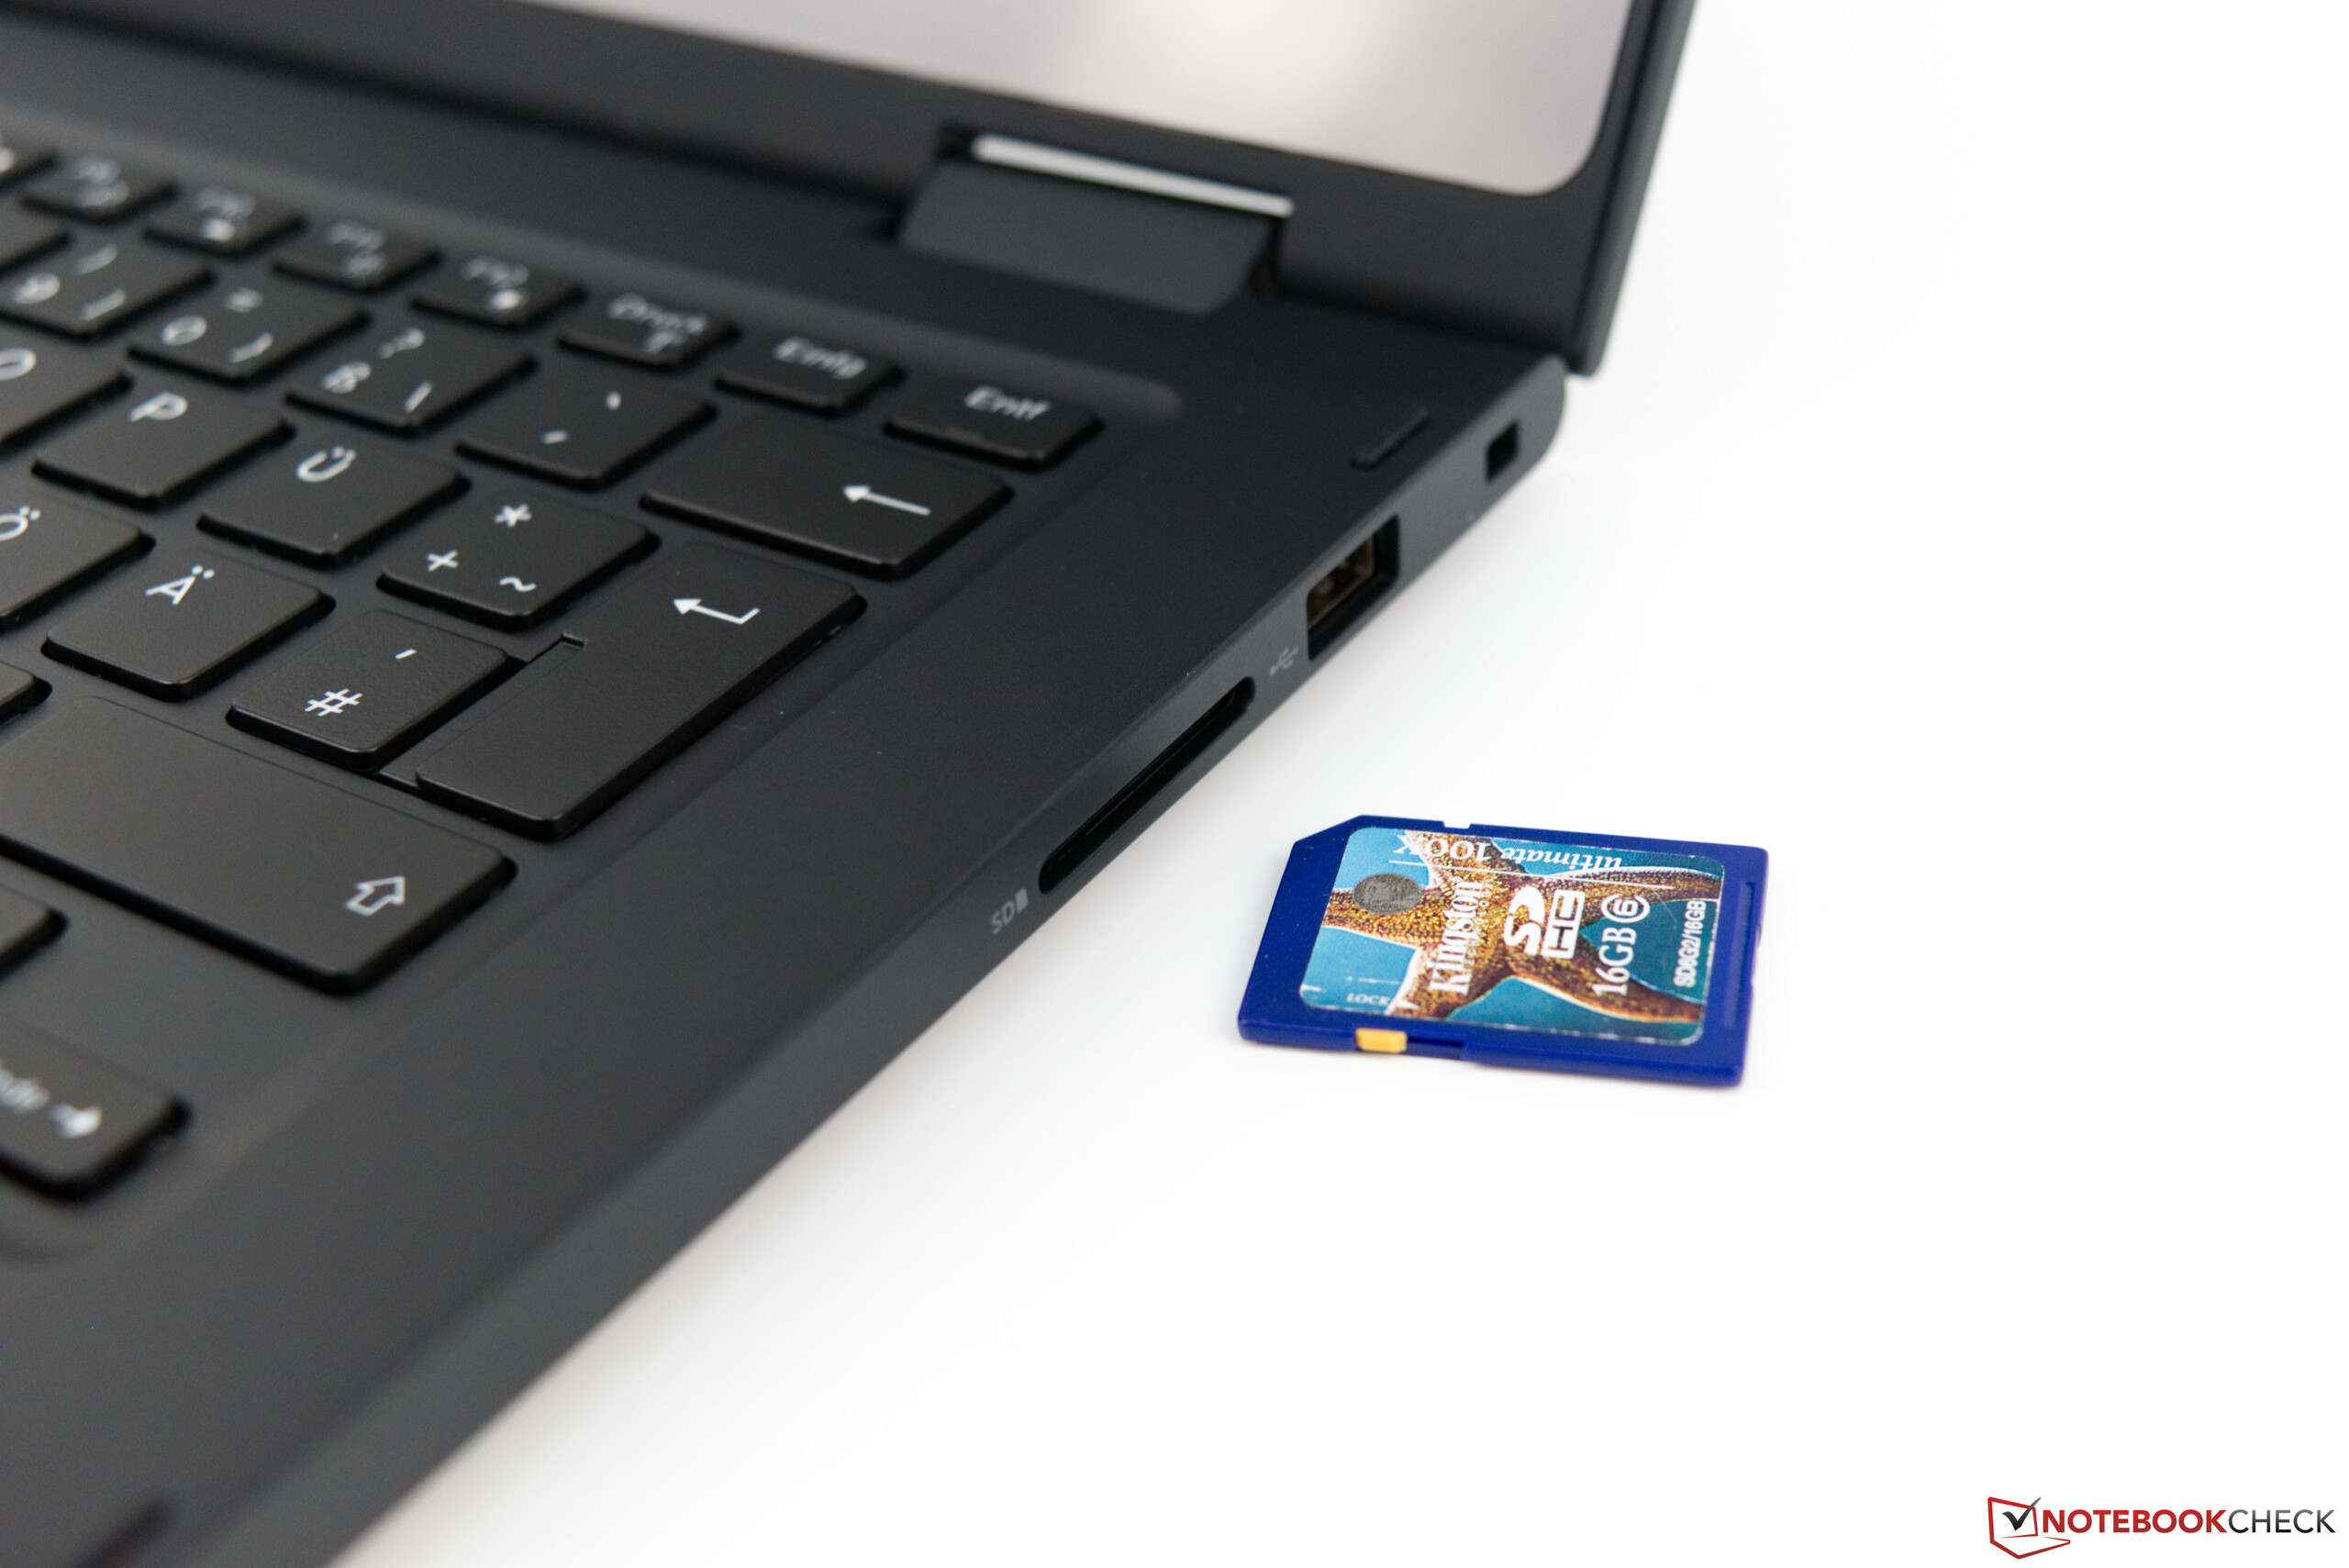
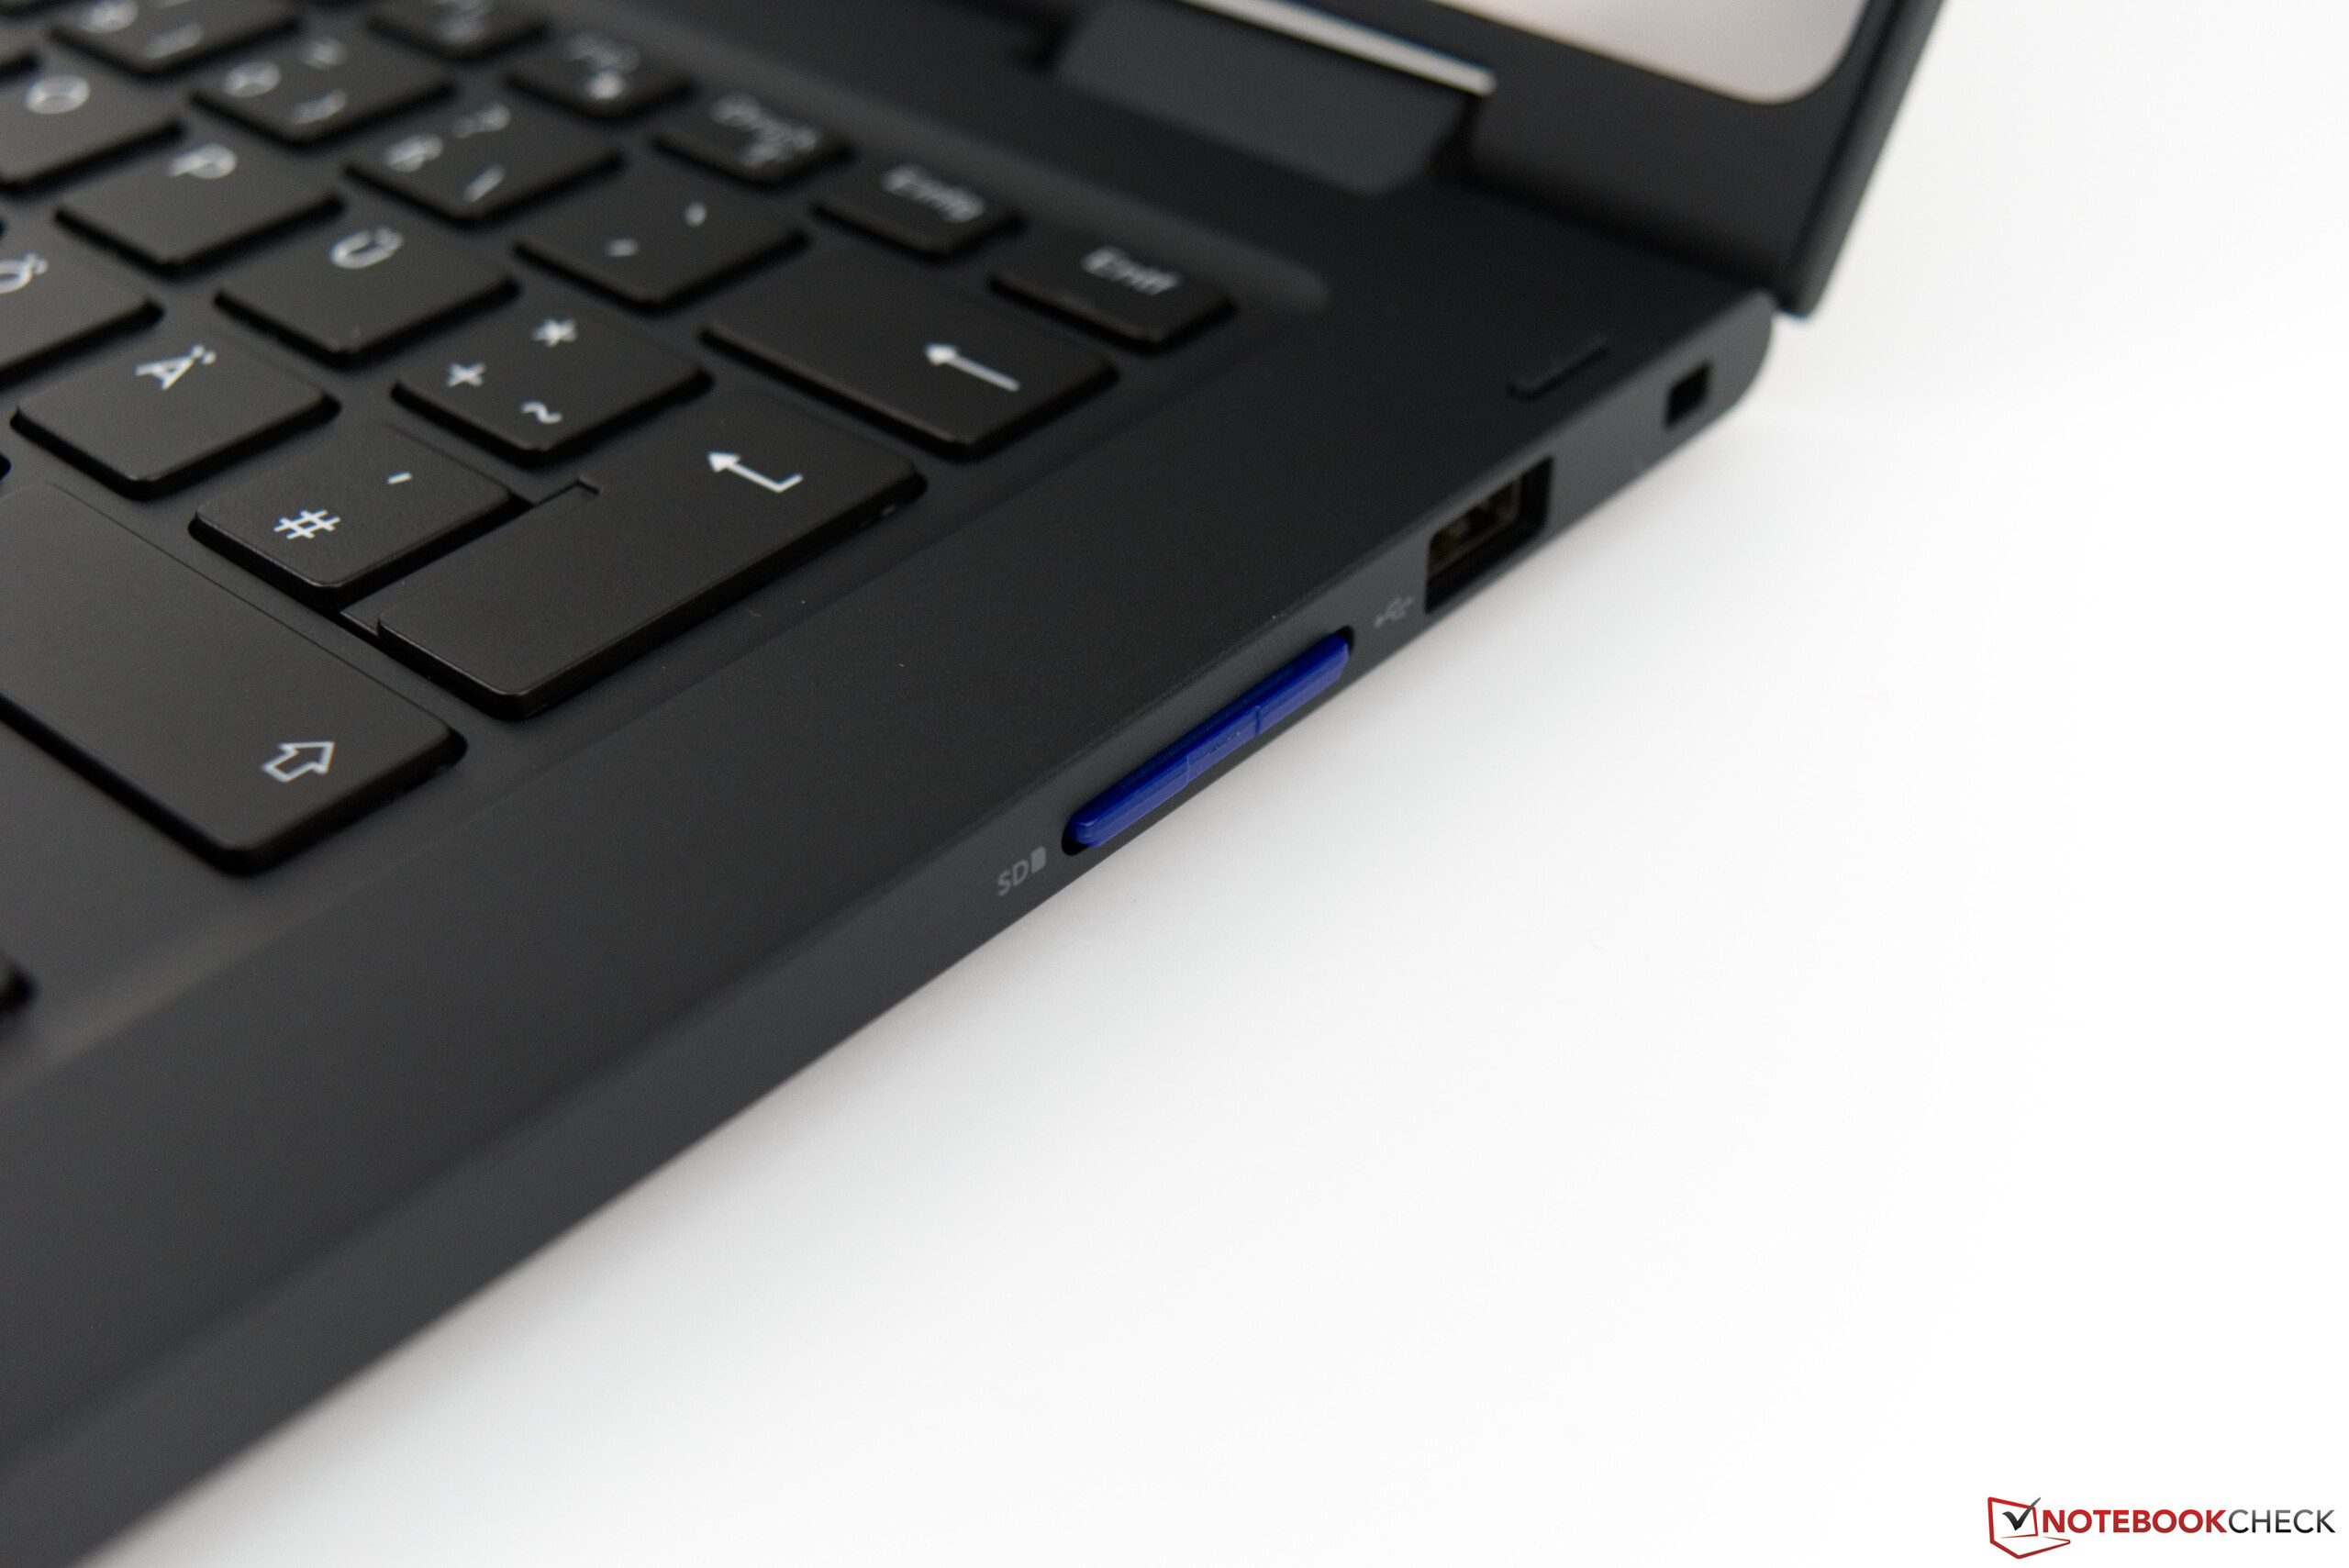
| SD Card Reader | |
| average JPG Copy Test (av. of 3 runs) | |
| HP ProBook x360 440 G1 (Toshiba Exceria Pro M501 microSDXC 64GB) | |
| Lenovo ThinkPad L390 Yoga-20NT000XGE (Toshiba Exceria Pro M501 UHS-II) | |
| Genomsnitt av klass Convertible (28.1 - 197, n=23, senaste 2 åren) | |
| Asus ZenBook Flip 14 UX461UA (Toshiba Exceria Pro M501 microSDXC 64GB) | |
| Dell Latitude 13 3390 (Toshiba Exceria Pro SDXC 64 GB UHS-II) | |
| maximum AS SSD Seq Read Test (1GB) | |
| Genomsnitt av klass Convertible (28.9 - 254, n=22, senaste 2 åren) | |
| Lenovo ThinkPad L390 Yoga-20NT000XGE (Toshiba Exceria Pro M501 UHS-II) | |
| HP ProBook x360 440 G1 (Toshiba Exceria Pro M501 microSDXC 64GB) | |
| Asus ZenBook Flip 14 UX461UA (Toshiba Exceria Pro M501 microSDXC 64GB) | |
| Dell Latitude 13 3390 (Toshiba Exceria Pro SDXC 64 GB UHS-II) | |
| Networking | |
| iperf3 transmit AX12 | |
| Lenovo ThinkPad L390 Yoga-20NT000XGE | |
| Asus ZenBook Flip 14 UX461UA | |
| Lenovo Yoga C930-13IKB | |
| HP ProBook x360 440 G1 | |
| Dell Latitude 13 3390 | |
| iperf3 receive AX12 | |
| Lenovo ThinkPad L390 Yoga-20NT000XGE | |
| Lenovo Yoga C930-13IKB | |
| HP ProBook x360 440 G1 | |
| Asus ZenBook Flip 14 UX461UA | |
| Dell Latitude 13 3390 | |
| |||||||||||||||||||||||||
Distribution av ljusstyrkan: 82 %
Mitt på batteriet: 276 cd/m²
Kontrast: 952:1 (Svärta: 0.29 cd/m²)
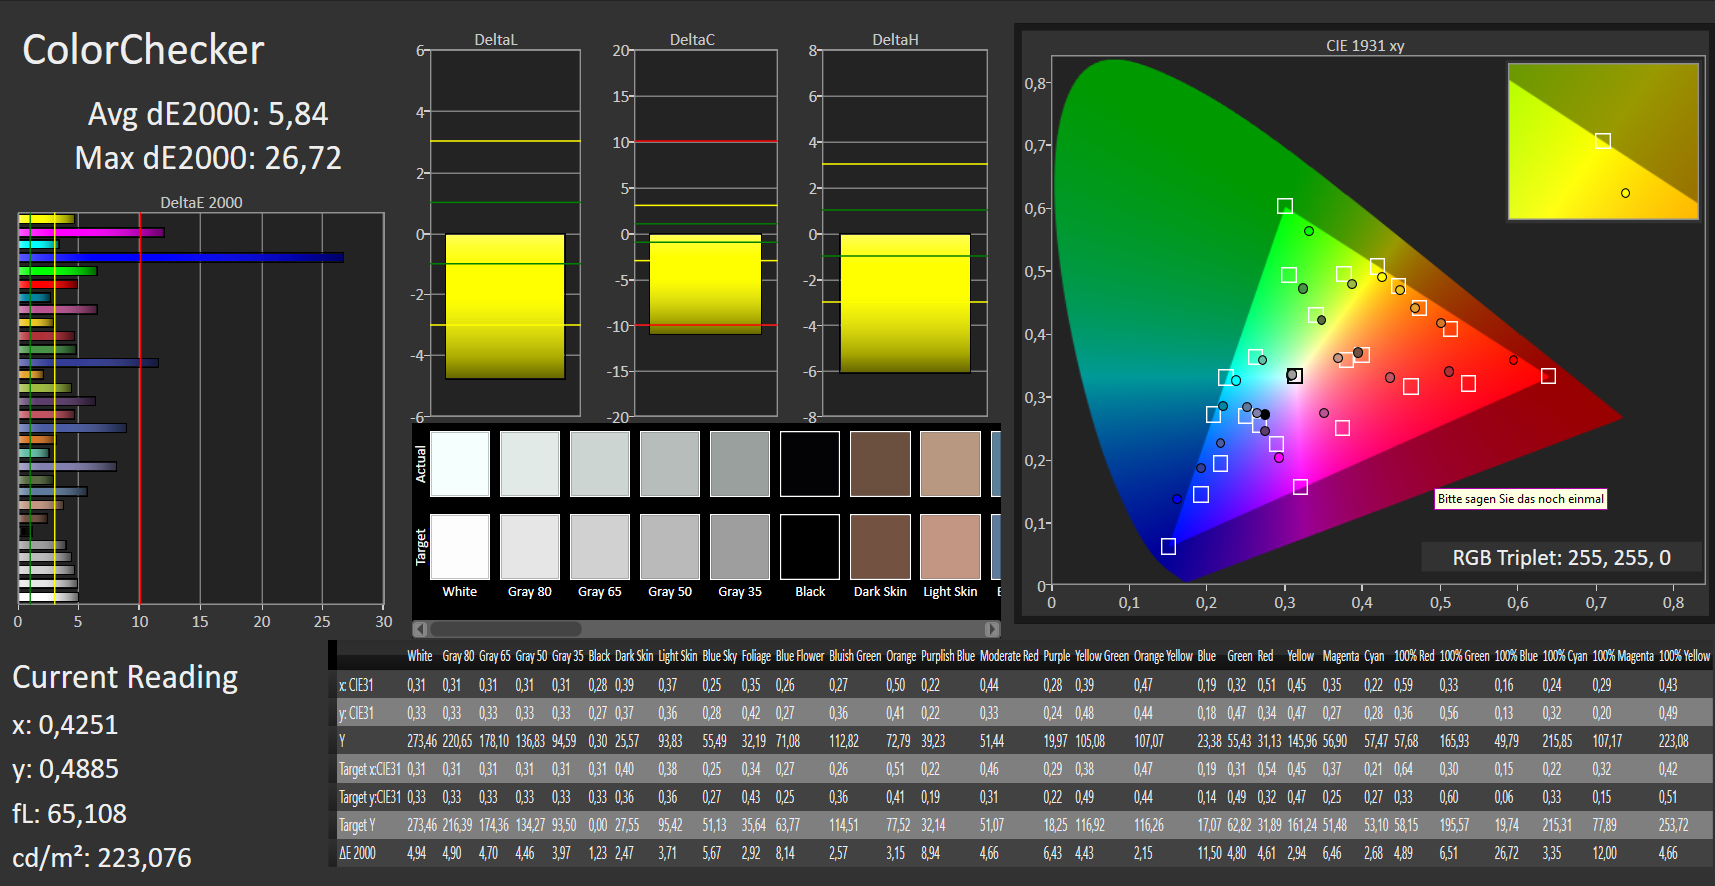
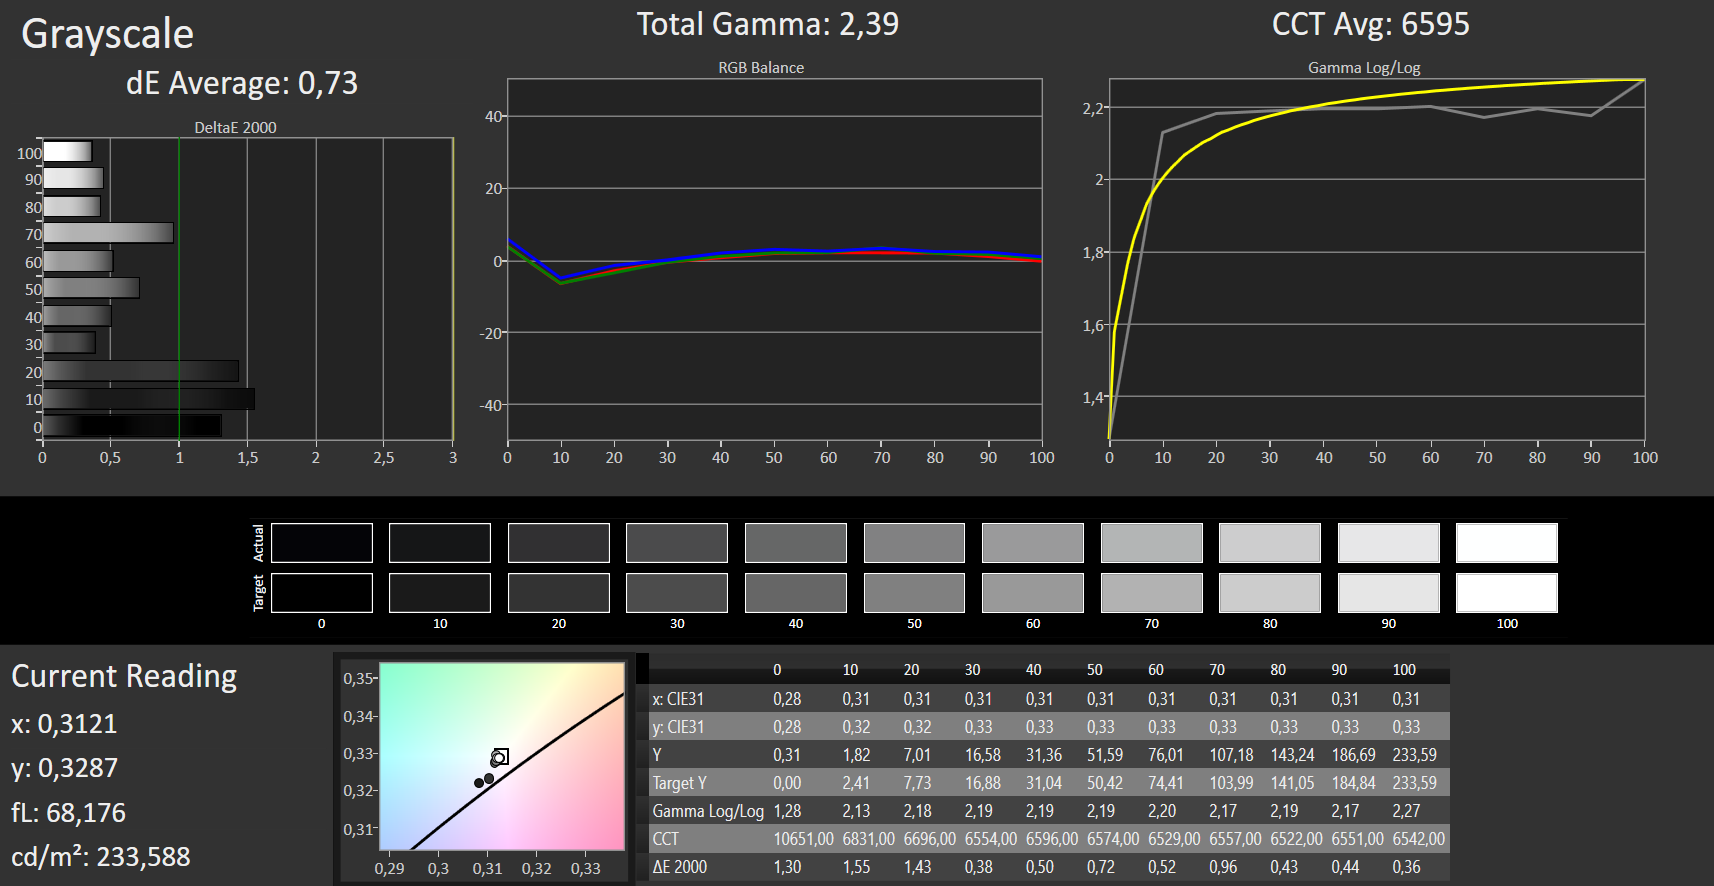
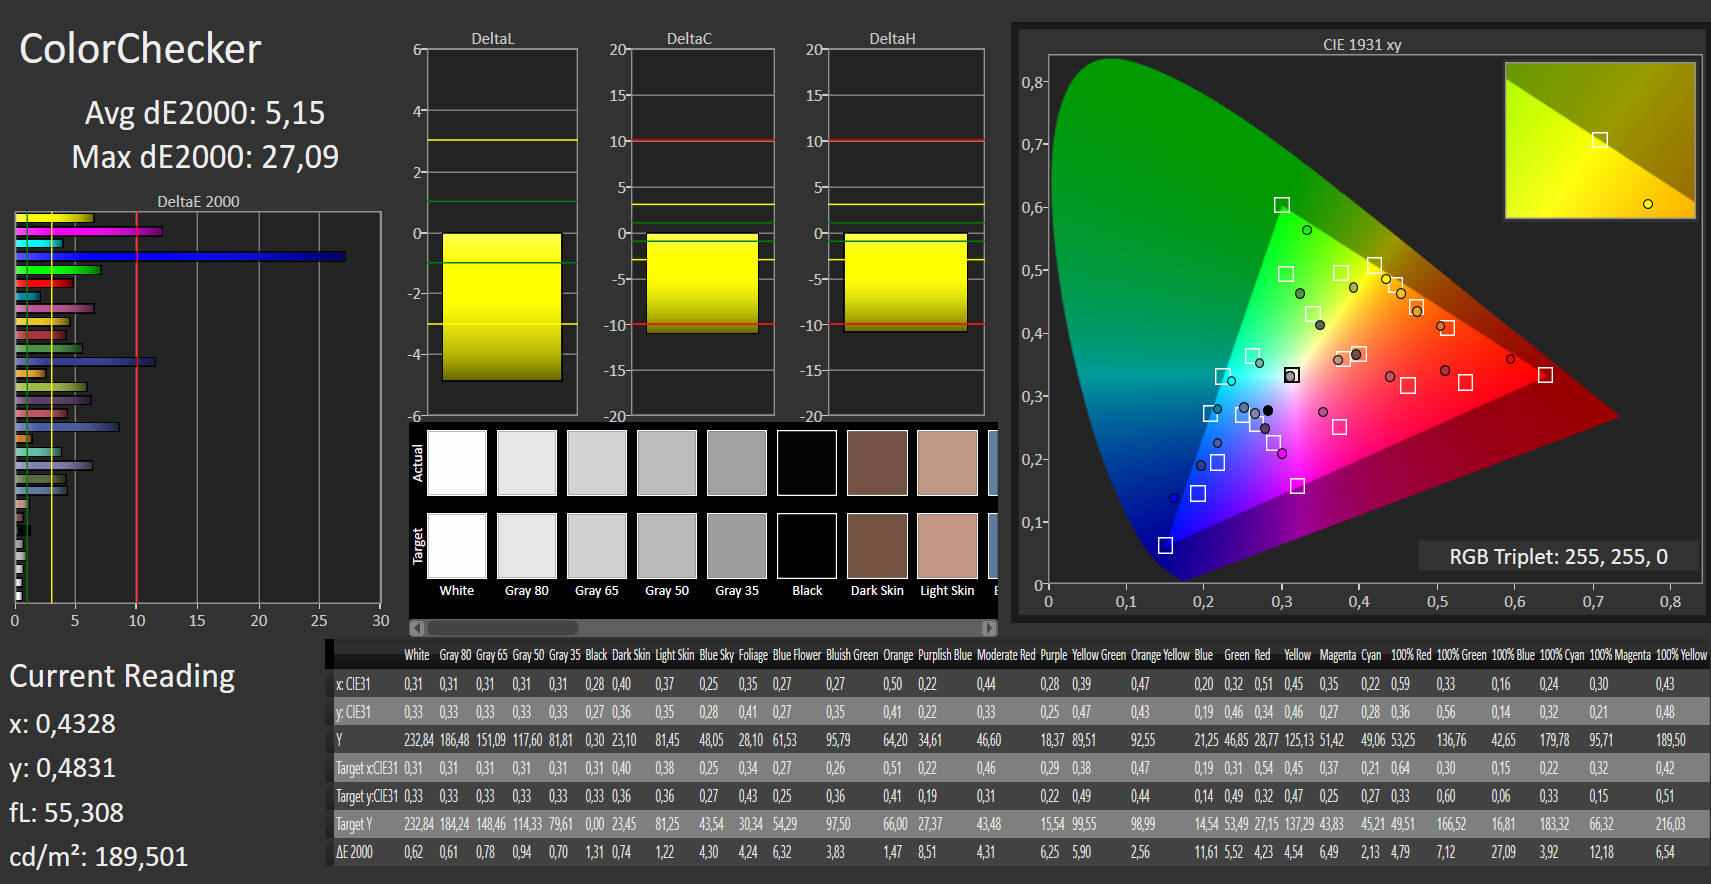
ΔE ColorChecker Calman: 5.84 | ∀{0.5-29.43 Ø4.73}
calibrated: 5.15
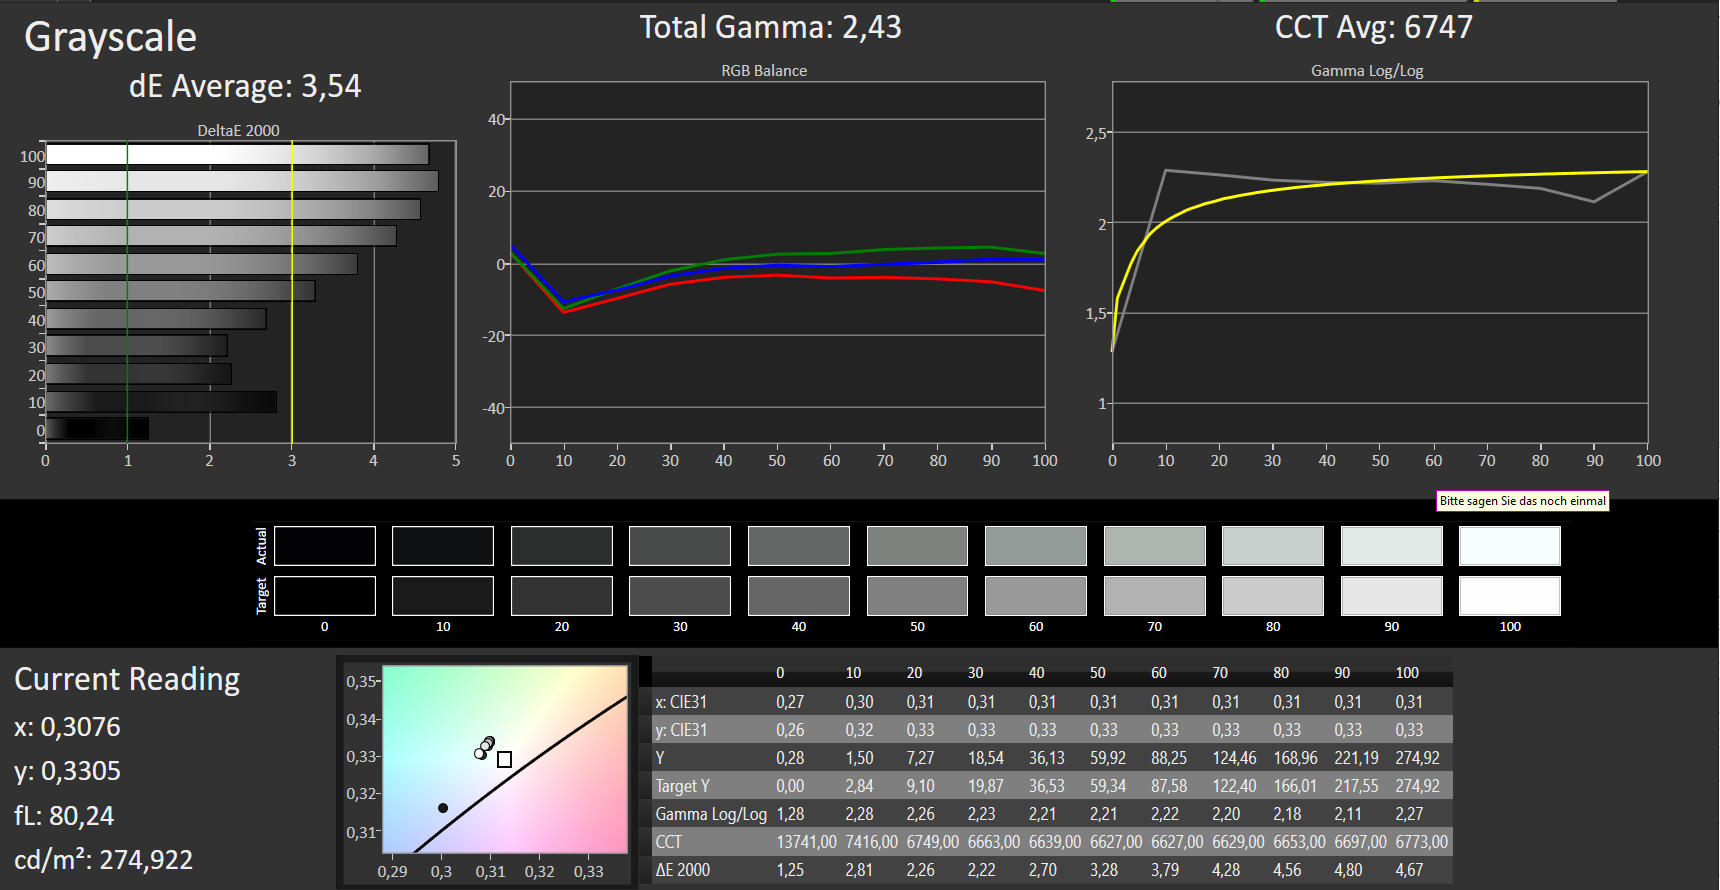
ΔE Greyscale Calman: 3.54 | ∀{0.09-98 Ø4.97}
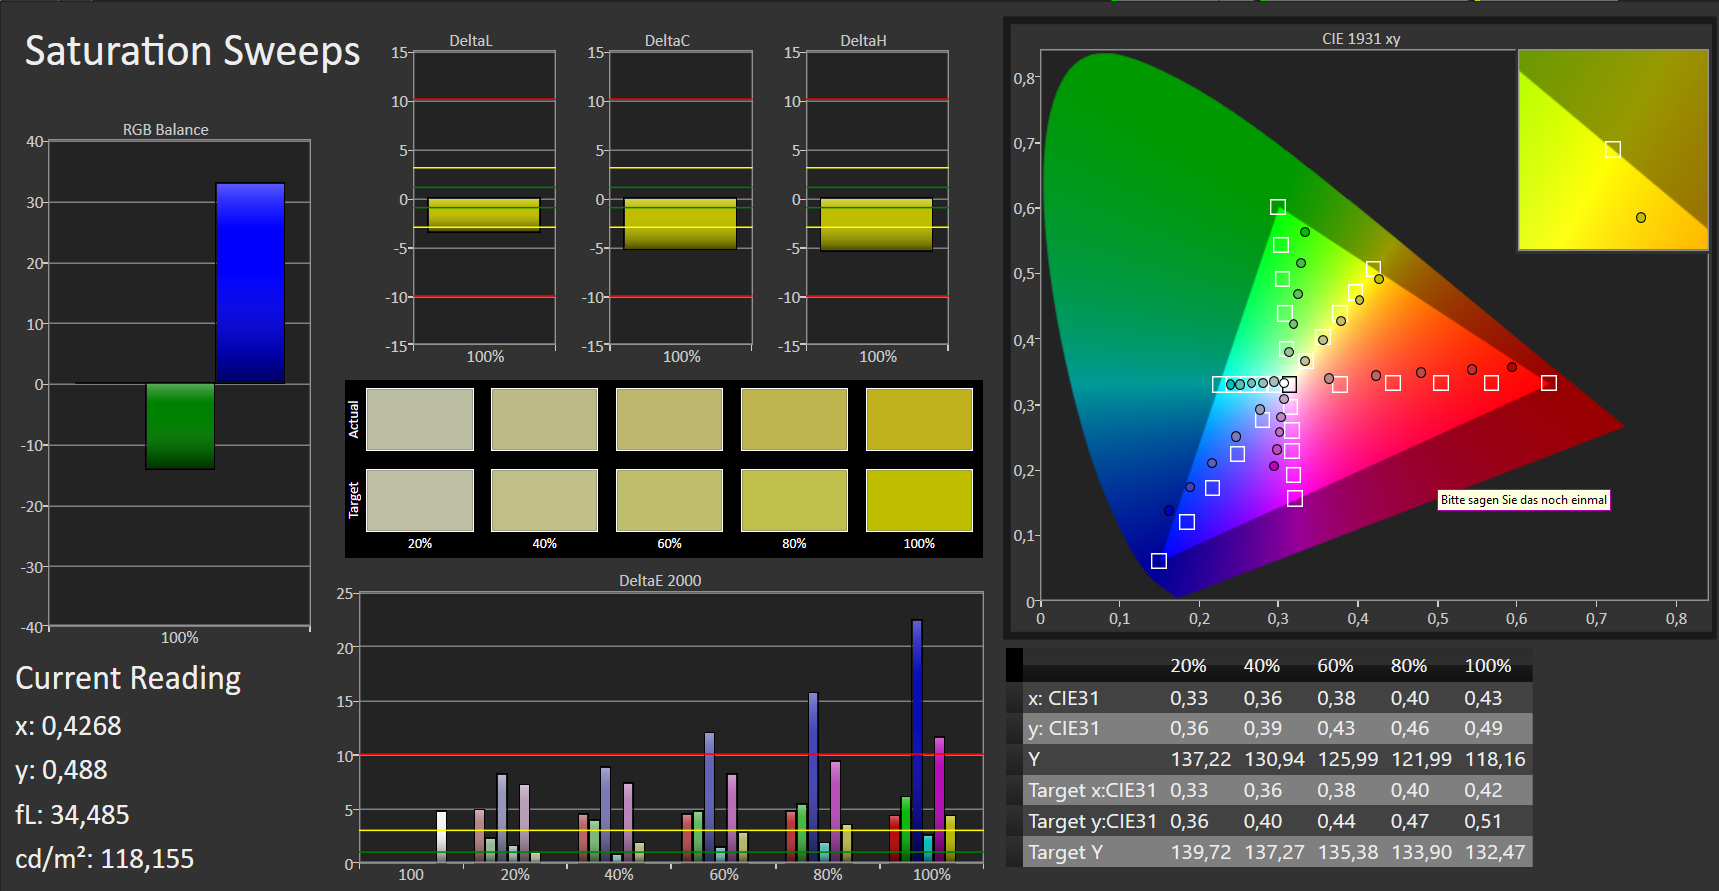
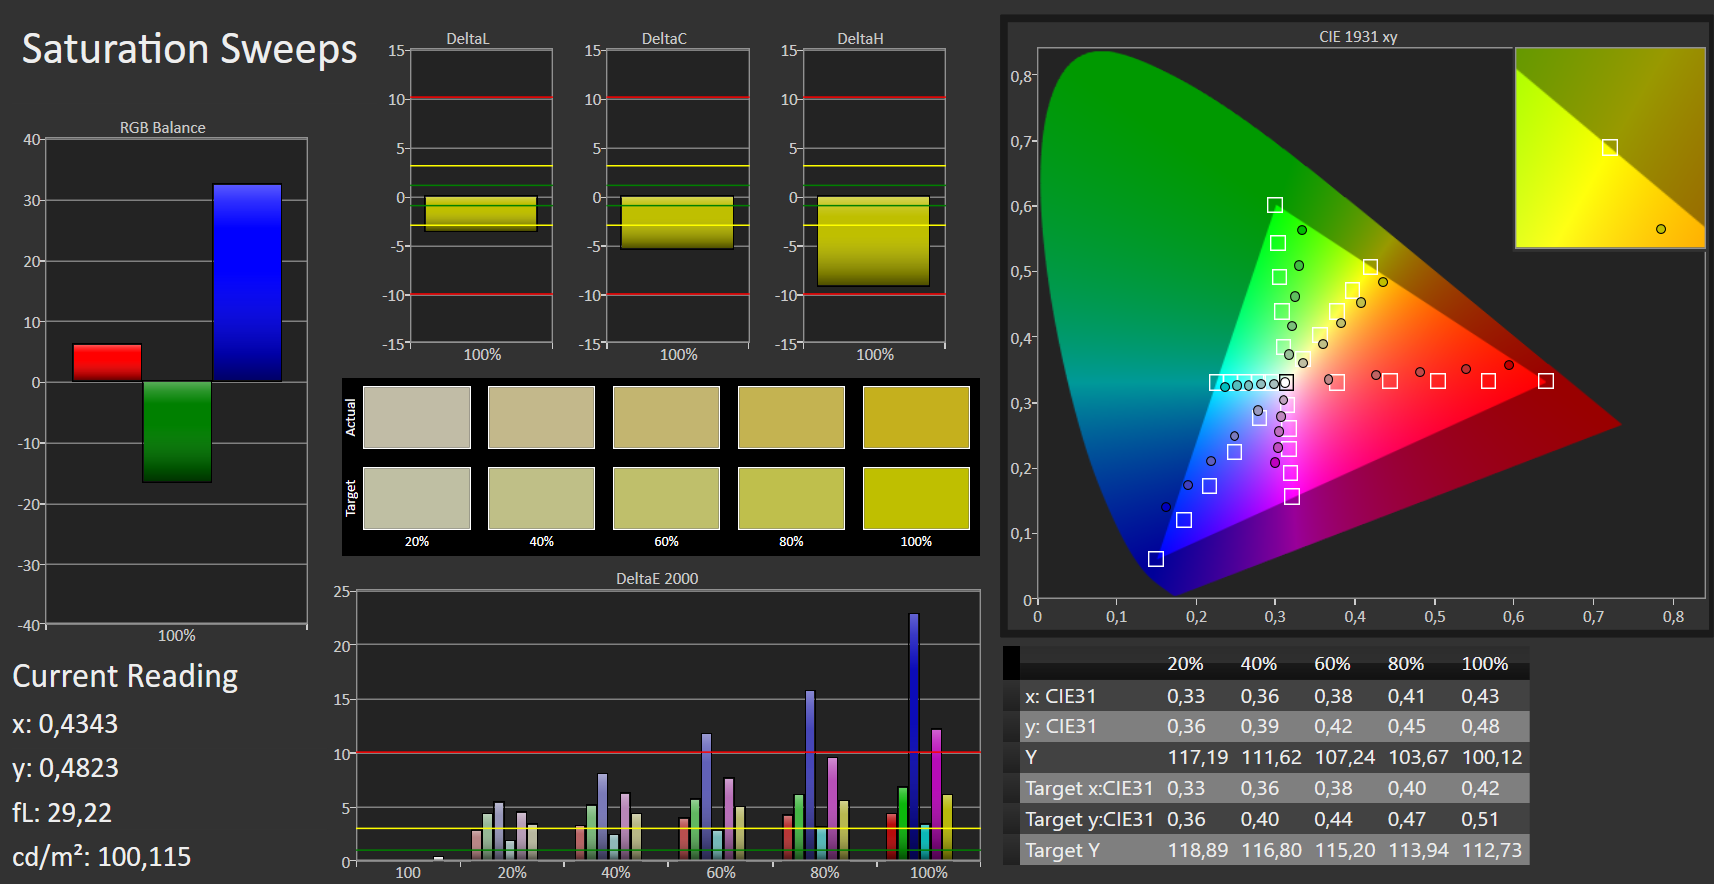
61% sRGB (Argyll 1.6.3 3D)
39% AdobeRGB 1998 (Argyll 1.6.3 3D)
42.29% AdobeRGB 1998 (Argyll 3D)
61.3% sRGB (Argyll 3D)
40.9% Display P3 (Argyll 3D)
Gamma: 2.43
CCT: 6747 K
| Dell Latitude 13 3390 BOE06A7, NV13FHM, IPS, 1920x1080, 13.3" | Lenovo ThinkPad L390 Yoga-20NT000XGE LEN4094, NV133FHM-N5A, IPS LED, 1920x1080, 13.3" | Lenovo Yoga C930-13IKB B139HAN03_0, IPS, 1920x1080, 13.9" | Asus ZenBook Flip 14 UX461UA BOE NV140FHM-N62, IPS, 1920x1080, 14" | HP ProBook x360 440 G1 Chi MEi, CMN14E0, IPS, 1920x1080, 14" | |
|---|---|---|---|---|---|
| Display | 58% | 56% | 47% | 60% | |
| Display P3 Coverage (%) | 40.9 | 69.2 69% | 64.3 57% | 64.4 57% | 65.8 61% |
| sRGB Coverage (%) | 61.3 | 90.6 48% | 94.6 54% | 84.6 38% | 98.2 60% |
| AdobeRGB 1998 Coverage (%) | 42.29 | 66.3 57% | 66.2 57% | 61.8 46% | 67.8 60% |
| Response Times | -19% | 9% | -4% | 28% | |
| Response Time Grey 50% / Grey 80% * (ms) | 42 ? | 51.2 ? -22% | 40.8 ? 3% | 44 ? -5% | 34 ? 19% |
| Response Time Black / White * (ms) | 32 ? | 36.8 ? -15% | 27.6 ? 14% | 33 ? -3% | 20 ? 37% |
| PWM Frequency (Hz) | 208 ? | 1000 ? | 200 ? | 26000 ? | |
| Screen | 17% | 8% | 5% | 50% | |
| Brightness middle (cd/m²) | 276 | 313 13% | 316 14% | 302 9% | 408 48% |
| Brightness (cd/m²) | 274 | 295 8% | 291 6% | 288 5% | 375 37% |
| Brightness Distribution (%) | 82 | 90 10% | 83 1% | 90 10% | 87 6% |
| Black Level * (cd/m²) | 0.29 | 0.22 24% | 0.36 -24% | 0.57 -97% | 0.34 -17% |
| Contrast (:1) | 952 | 1423 49% | 878 -8% | 530 -44% | 1200 26% |
| Colorchecker dE 2000 * | 5.84 | 6.2 -6% | 5.9 -1% | 5.17 11% | 1.2 79% |
| Colorchecker dE 2000 max. * | 26.72 | 10.7 60% | 12.9 52% | 7.68 71% | 2.44 91% |
| Colorchecker dE 2000 calibrated * | 5.15 | 2.5 51% | 1.3 75% | 0.67 87% | |
| Greyscale dE 2000 * | 3.54 | 8 -126% | 8.6 -143% | 3.26 8% | 0.98 72% |
| Gamma | 2.43 91% | 2.38 92% | 2.1 105% | 2.45 90% | 2.32 95% |
| CCT | 6747 96% | 7100 92% | 6854 95% | 7142 91% | 6485 100% |
| Color Space (Percent of AdobeRGB 1998) (%) | 39 | 59.1 52% | 60.7 56% | 55 41% | 62 59% |
| Color Space (Percent of sRGB) (%) | 61 | 90.6 49% | 94.5 55% | 85 39% | 98 61% |
| Totalt genomsnitt (program/inställningar) | 19% /
20% | 24% /
17% | 16% /
12% | 46% /
49% |
* ... mindre är bättre
Visa svarstider
| ↔ Svarstid svart till vitt | ||
|---|---|---|
| 32 ms ... stiga ↗ och falla ↘ kombinerat | ↗ 18 ms stiga | 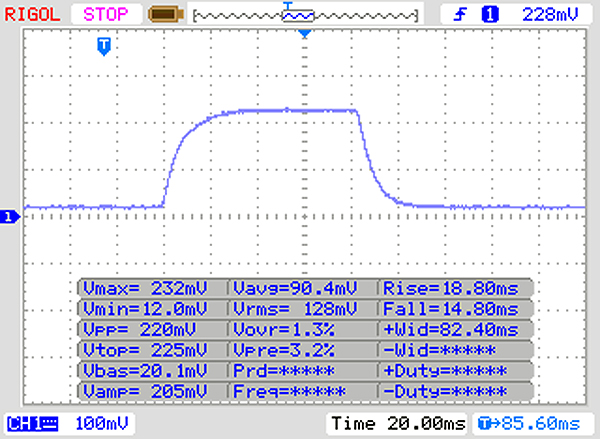 |
| ↘ 14 ms hösten | ||
| Skärmen visar långsamma svarsfrekvenser i våra tester och kommer att vara otillfredsställande för spelare. I jämförelse sträcker sig alla testade enheter från 0.1 (minst) till 240 (maximalt) ms. » 86 % av alla enheter är bättre. Detta innebär att den uppmätta svarstiden är sämre än genomsnittet av alla testade enheter (19.9 ms). | ||
| ↔ Svarstid 50 % grått till 80 % grått | ||
| 42 ms ... stiga ↗ och falla ↘ kombinerat | ↗ 22 ms stiga | 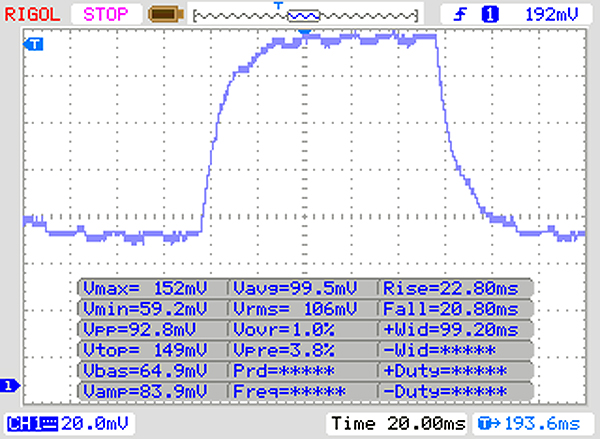 |
| ↘ 20 ms hösten | ||
| Skärmen visar långsamma svarsfrekvenser i våra tester och kommer att vara otillfredsställande för spelare. I jämförelse sträcker sig alla testade enheter från 0.165 (minst) till 636 (maximalt) ms. » 67 % av alla enheter är bättre. Detta innebär att den uppmätta svarstiden är sämre än genomsnittet av alla testade enheter (31.1 ms). | ||
Skärmflimmer / PWM (Puls-Width Modulation)
| Skärmflimmer / PWM upptäckt | 208 Hz | ≤ 90 % ljusstyrka inställning | 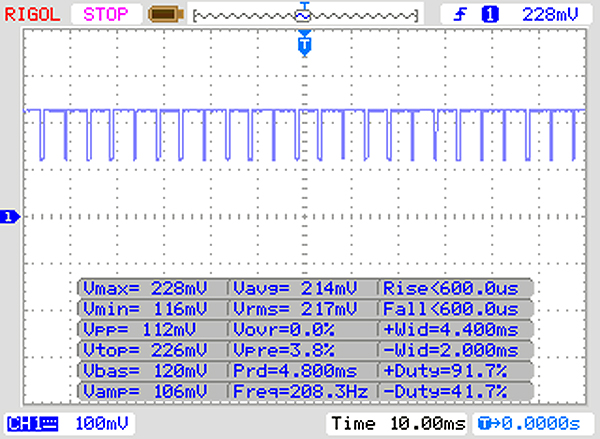 |
Displayens bakgrundsbelysning flimrar vid 208 Hz (i värsta fall, t.ex. med PWM) Flimrande upptäckt vid en ljusstyrkeinställning på 90 % och lägre. Det ska inte finnas något flimmer eller PWM över denna ljusstyrkeinställning. Frekvensen för 208 Hz är relativt låg, så känsliga användare kommer sannolikt att märka flimmer och uppleva ansträngda ögon vid den angivna ljusstyrkeinställningen och nedan. Som jämförelse: 52 % av alla testade enheter använder inte PWM för att dämpa skärmen. Om PWM upptäcktes mättes ett medelvärde av 7798 (minst: 5 - maximum: 343500) Hz. | |||
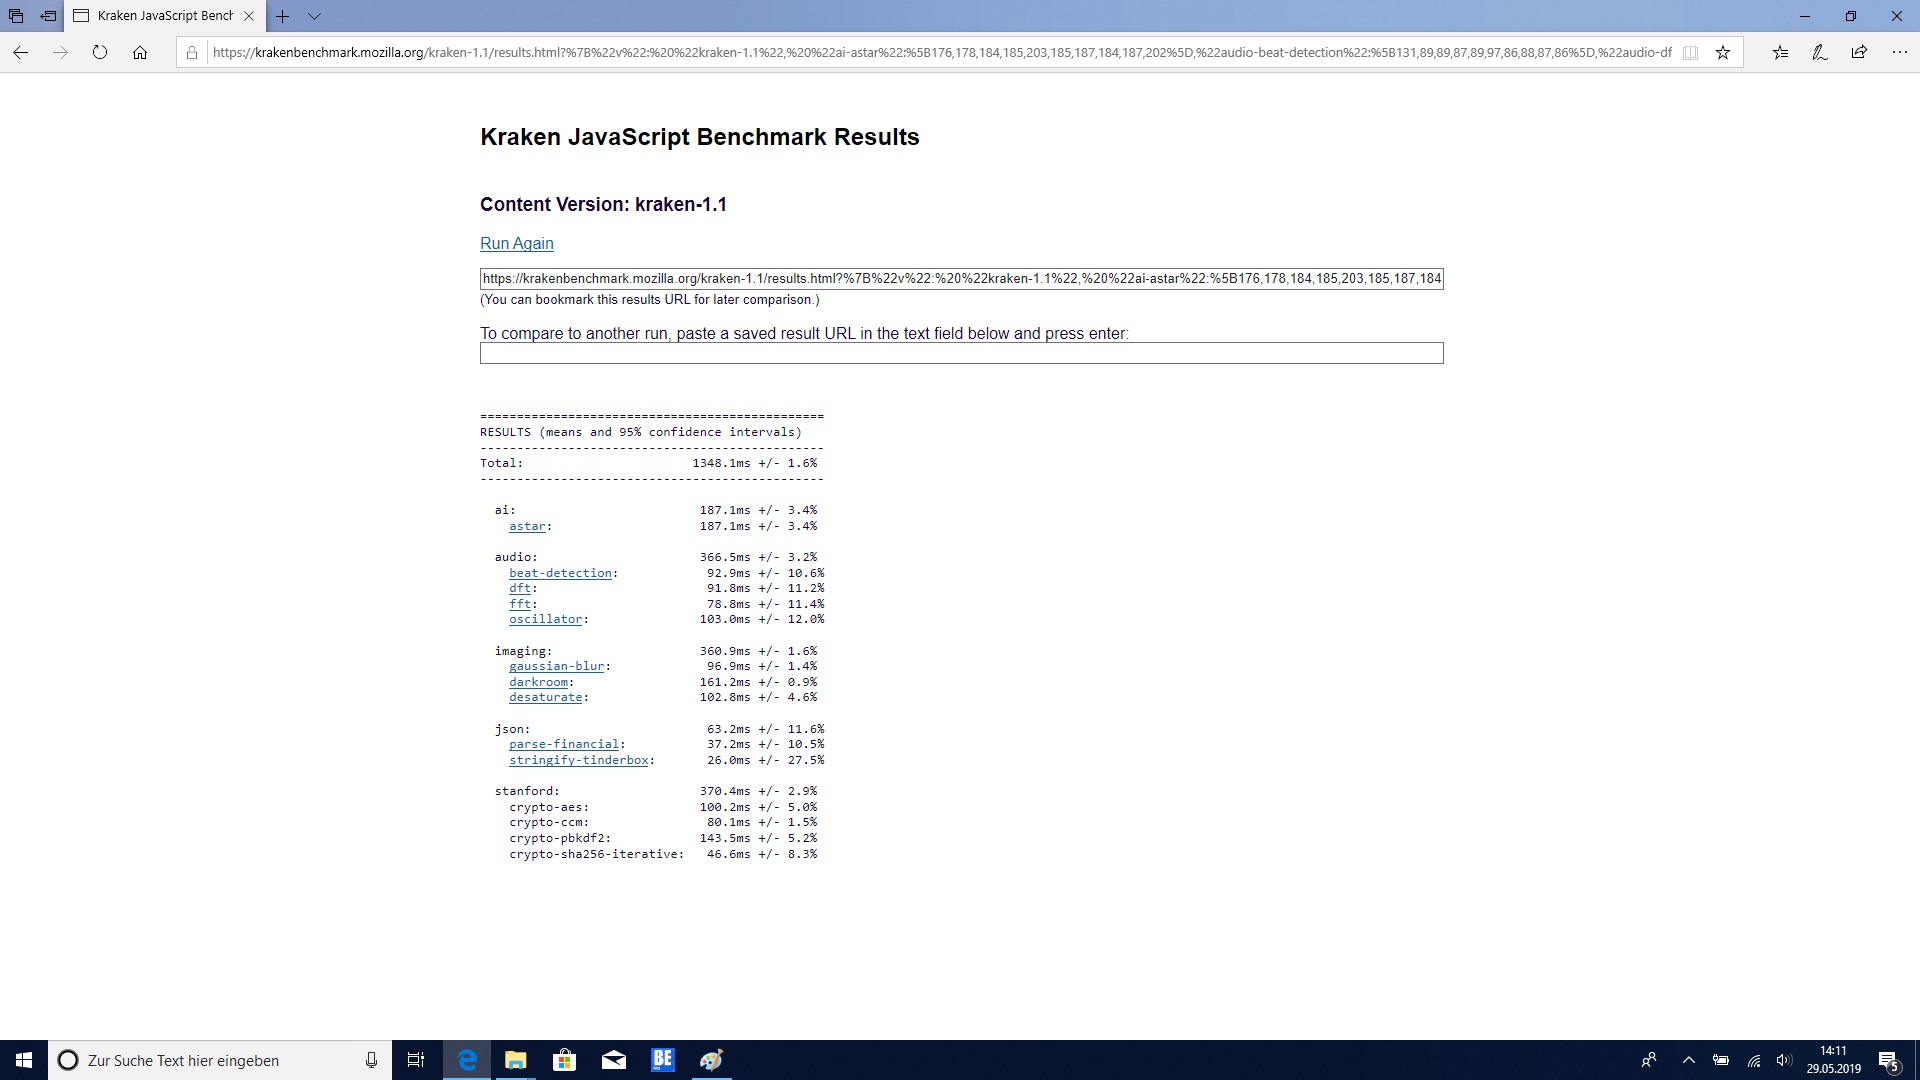
| Mozilla Kraken 1.1 - Total | |
| Dell Latitude 13 3390 | |
| HP ProBook x360 440 G1 | |
| Lenovo Yoga C930-13IKB | |
| Asus ZenBook Flip 14 UX461UA | |
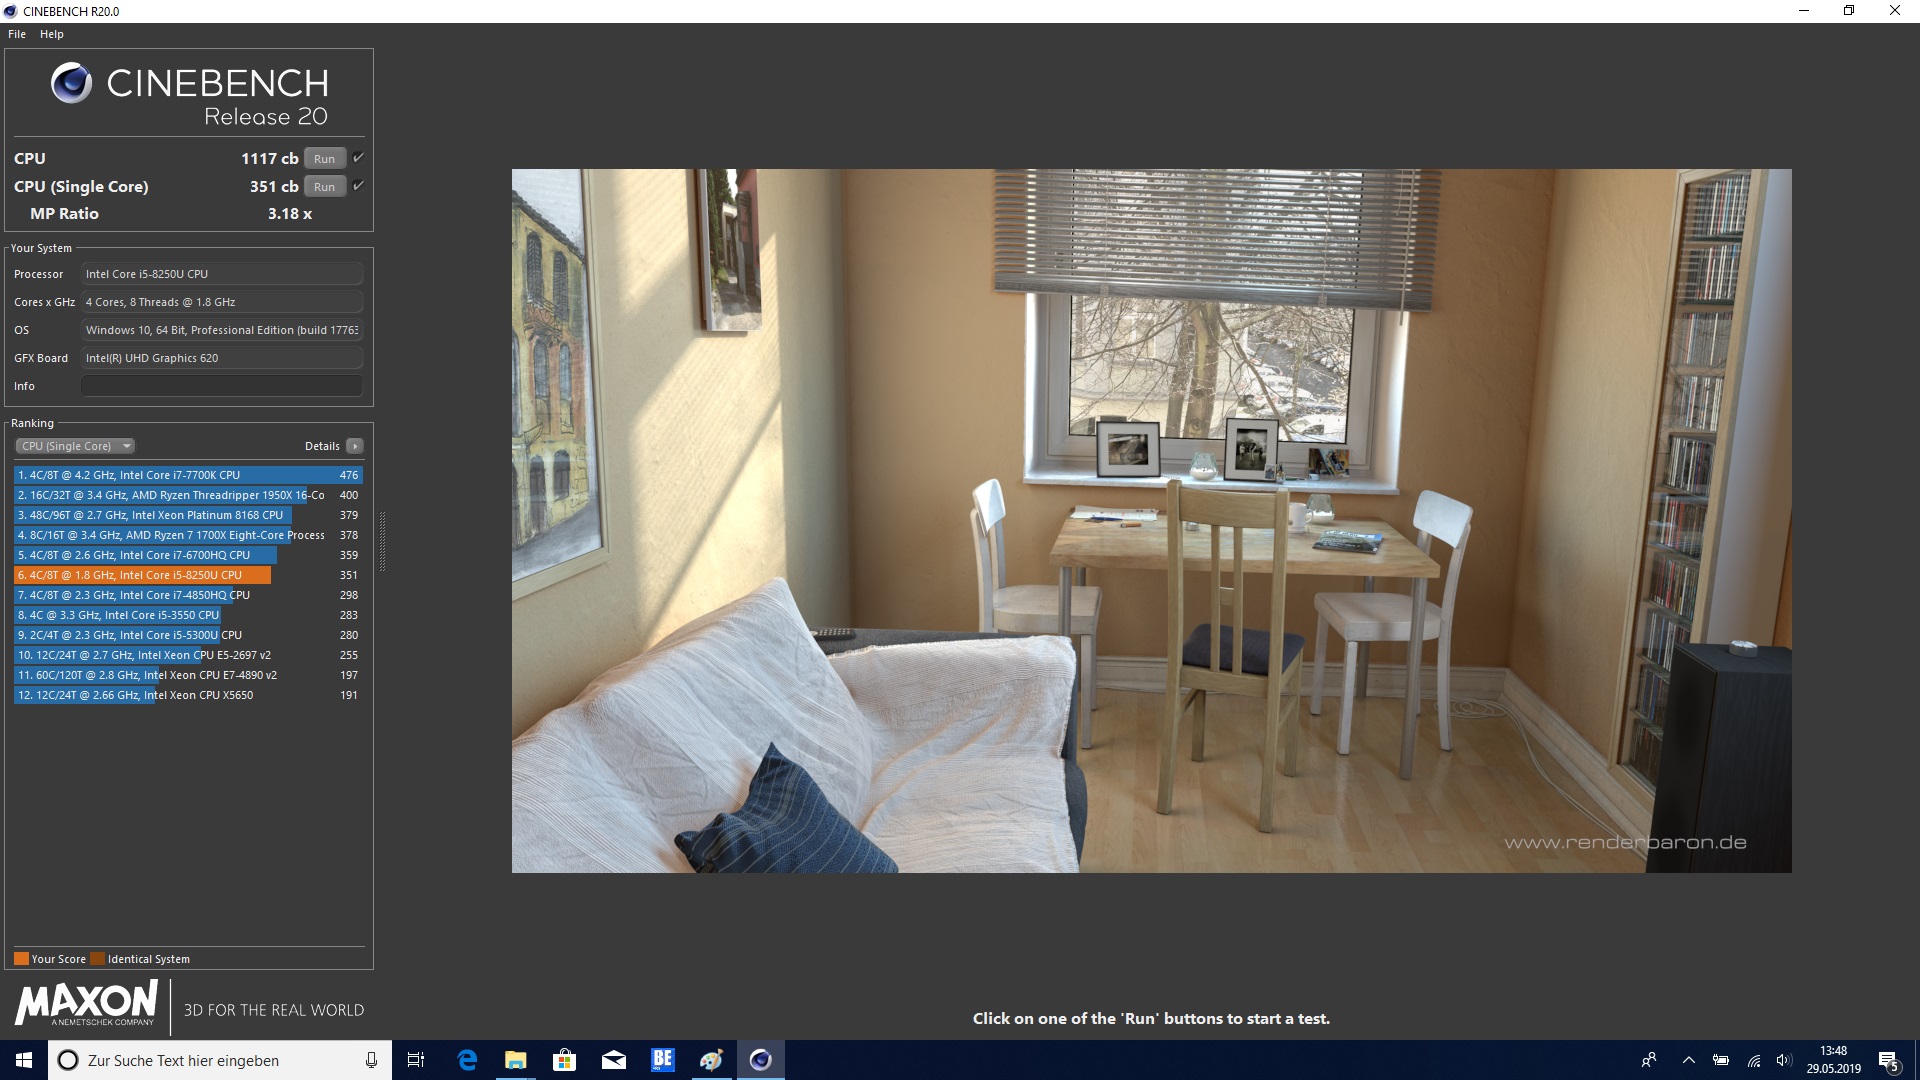
| Genomsnitt Intel Core i5-8250U (986 - 1532, n=59) | |
| Lenovo ThinkPad L390 Yoga-20NT000XGE | |
| Genomsnitt av klass Convertible (386 - 1089, n=52, senaste 2 åren) | |
| HWBOT x265 Benchmark v2.2 - 4k Preset | |
| Genomsnitt av klass Convertible (3.43 - 36.2, n=48, senaste 2 åren) | |
| Lenovo ThinkPad L390 Yoga-20NT000XGE | |
| Genomsnitt Intel Core i5-8250U (3.02 - 4.78, n=8) | |
| Dell Latitude 13 3390 | |
| Blender - v2.79 BMW27 CPU | |
| Genomsnitt Intel Core i5-8250U (813 - 1209, n=8) | |
| Dell Latitude 13 3390 | |
| Lenovo ThinkPad L390 Yoga-20NT000XGE | |
| Genomsnitt av klass Convertible (105 - 1051, n=48, senaste 2 åren) | |
* ... mindre är bättre
| PCMark 8 | |
| Home Score Accelerated v2 | |
| Genomsnitt av klass Convertible (n=1senaste 2 åren) | |
| HP ProBook x360 440 G1 | |
| Dell Latitude 13 3390 | |
| Lenovo ThinkPad L390 Yoga-20NT000XGE | |
| Lenovo Yoga C930-13IKB | |
| Asus ZenBook Flip 14 UX461UA | |
| Genomsnitt Intel Core i5-8250U, Intel UHD Graphics 620 (2986 - 4458, n=69) | |
| Work Score Accelerated v2 | |
| Genomsnitt av klass Convertible (n=1senaste 2 åren) | |
| HP ProBook x360 440 G1 | |
| Lenovo Yoga C930-13IKB | |
| Lenovo ThinkPad L390 Yoga-20NT000XGE | |
| Dell Latitude 13 3390 | |
| Asus ZenBook Flip 14 UX461UA | |
| Genomsnitt Intel Core i5-8250U, Intel UHD Graphics 620 (2699 - 5106, n=58) | |
| PCMark 8 Home Score Accelerated v2 | 3797 poäng | |
| PCMark 8 Work Score Accelerated v2 | 4799 poäng | |
| PCMark 10 Score | 3541 poäng | |
Hjälp | ||
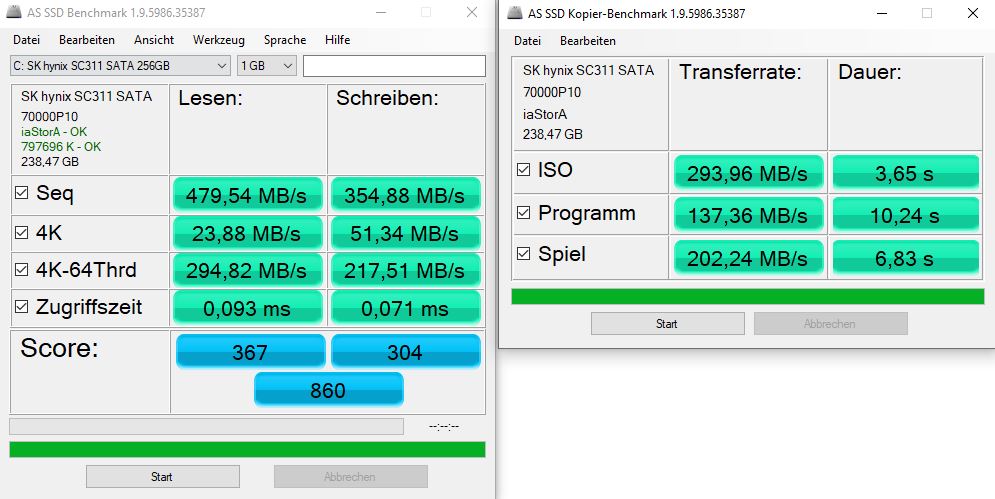
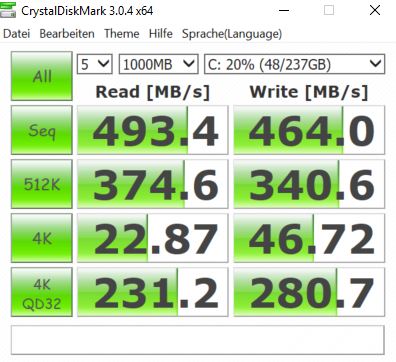
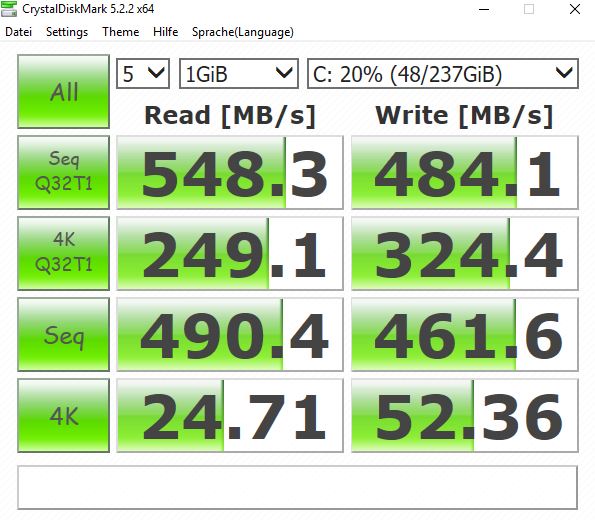
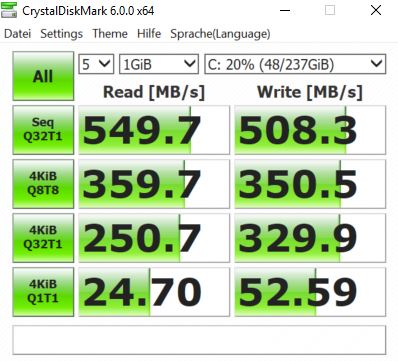
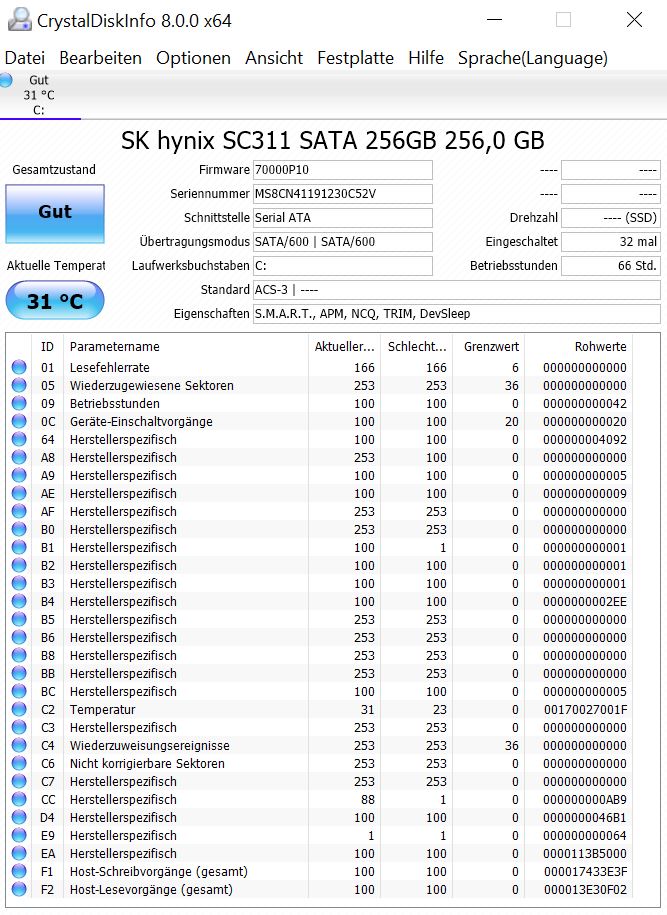
| Dell Latitude 13 3390 SK hynix SC311 SATA | Lenovo ThinkPad L390 Yoga-20NT000XGE Samsung SSD PM981 MZVLB256HAHQ | Lenovo Yoga C930-13IKB SK hynix PC401 HFS256GD9TNG | Asus ZenBook Flip 14 UX461UA SanDisk SD8SN8U256G1002 | HP ProBook x360 440 G1 Toshiba KBG30ZMV256G | Genomsnitt SK hynix SC311 SATA | |
|---|---|---|---|---|---|---|
| AS SSD | 203% | 73% | -4% | 77% | -11% | |
| Seq Read (MB/s) | 479.5 | 1724 260% | 1850 286% | 459.9 -4% | 1255 162% | 499 ? 4% |
| Seq Write (MB/s) | 354.9 | 1123 216% | 661 86% | 388.2 9% | 625 76% | 296 ? -17% |
| 4K Read (MB/s) | 23.88 | 51.8 117% | 38.04 59% | 26.93 13% | 42.09 76% | 23.9 ? 0% |
| 4K Write (MB/s) | 51.3 | 133.8 161% | 95 85% | 50.7 -1% | 96.1 87% | 54.3 ? 6% |
| 4K-64 Read (MB/s) | 294.8 | 745 153% | 434.3 47% | 368.3 25% | 624 112% | 231 ? -22% |
| 4K-64 Write (MB/s) | 217.5 | 1193 449% | 266.3 22% | 146.4 -33% | 298.3 37% | 169.7 ? -22% |
| Access Time Read * (ms) | 0.093 | 0.041 56% | 0.069 26% | 0.123 -32% | 0.122 -31% | 0.133 ? -43% |
| Access Time Write * (ms) | 0.071 | 0.028 61% | 0.056 21% | 0.086 -21% | 0.224 -215% | 0.07075 ? -0% |
| Score Read (Points) | 367 | 969 164% | 657 79% | 441 20% | 791 116% | 305 ? -17% |
| Score Write (Points) | 304 | 1440 374% | 427 40% | 236 -22% | 457 50% | 254 ? -16% |
| Score Total (Points) | 860 | 2889 236% | 1373 60% | 908 6% | 1634 90% | 713 ? -17% |
| Copy ISO MB/s (MB/s) | 294 | 1025 249% | 539 83% | 324.1 10% | 983 234% | 303 ? 3% |
| Copy Program MB/s (MB/s) | 137.4 | 322.1 134% | 209.7 53% | 118.6 -14% | 274.5 100% | 132.6 ? -3% |
| Copy Game MB/s (MB/s) | 202.2 | 637 215% | 340 68% | 186.1 -8% | 572 183% | 195.3 ? -3% |
* ... mindre är bättre

| 3DMark 11 - 1280x720 Performance GPU | |
| Genomsnitt av klass Convertible (1505 - 40732, n=48, senaste 2 åren) | |
| HP ProBook x360 440 G1 | |
| Asus ZenBook Flip 14 UX461UA | |
| Genomsnitt Intel UHD Graphics 620 (1144 - 3432, n=244) | |
| Lenovo Yoga C930-13IKB | |
| Lenovo ThinkPad L390 Yoga-20NT000XGE | |
| Dell Latitude 13 3390 | |
| 3DMark | |
| 1280x720 Cloud Gate Standard Graphics | |
| Genomsnitt av klass Convertible (7885 - 57566, n=32, senaste 2 åren) | |
| HP ProBook x360 440 G1 | |
| Lenovo Yoga C930-13IKB | |
| Genomsnitt Intel UHD Graphics 620 (6205 - 16400, n=225) | |
| Asus ZenBook Flip 14 UX461UA | |
| Dell Latitude 13 3390 | |
| Lenovo ThinkPad L390 Yoga-20NT000XGE | |
| 1920x1080 Fire Strike Graphics | |
| Genomsnitt av klass Convertible (1185 - 27447, n=48, senaste 2 åren) | |
| HP ProBook x360 440 G1 | |
| Lenovo Yoga C930-13IKB | |
| Asus ZenBook Flip 14 UX461UA | |
| Genomsnitt Intel UHD Graphics 620 (557 - 2608, n=213) | |
| Dell Latitude 13 3390 | |
| Lenovo ThinkPad L390 Yoga-20NT000XGE | |
| 2560x1440 Time Spy Graphics | |
| Genomsnitt av klass Convertible (327 - 10434, n=51, senaste 2 åren) | |
| Genomsnitt Intel UHD Graphics 620 (299 - 797, n=88) | |
| Asus ZenBook Flip 14 UX461UA | |
| Lenovo Yoga C930-13IKB | |
| Dell Latitude 13 3390 | |
| 3DMark 11 Performance | 1779 poäng | |
| 3DMark Ice Storm Standard Score | 76683 poäng | |
| 3DMark Cloud Gate Standard Score | 7687 poäng | |
| 3DMark Fire Strike Score | 1016 poäng | |
| 3DMark Fire Strike Extreme Score | 468 poäng | |
| 3DMark Time Spy Score | 379 poäng | |
Hjälp | ||
| låg | med. | hög | ultra | |
|---|---|---|---|---|
| BioShock Infinite (2013) | 48 | 28.4 | 25.8 | 8.9 |
| Battlefield 4 (2013) | 44.7 | 31.4 | 22.1 | 7.3 |
| Dota 2 Reborn (2015) | 62.9 | 40.6 | 17.9 | 16.1 |
| Rise of the Tomb Raider (2016) | 19.2 | 11.6 | 6.2 | |
| X-Plane 11.11 (2018) | 24.1 | 15.4 | 13.9 |
Ljudnivå
| Låg belastning |
| 30.6 / 30.6 / 30.6 dB(A) |
| Hög belastning |
| 33.3 / 33 dB(A) |
 | ||
30 dB tyst 40 dB(A) hörbar 50 dB(A) högt ljud |
||
min: | ||
| Dell Latitude 13 3390 UHD Graphics 620, i5-8250U, SK hynix SC311 SATA | Lenovo ThinkPad L390 Yoga-20NT000XGE UHD Graphics 620, i5-8265U, Samsung SSD PM981 MZVLB256HAHQ | Lenovo Yoga C930-13IKB UHD Graphics 620, i5-8250U, SK hynix PC401 HFS256GD9TNG | Asus ZenBook Flip 14 UX461UA UHD Graphics 620, i5-8250U, SanDisk SD8SN8U256G1002 | HP ProBook x360 440 G1 UHD Graphics 620, i5-8250U, Toshiba KBG30ZMV256G | |
|---|---|---|---|---|---|
| Noise | 5% | 4% | -1% | -4% | |
| av / miljö * (dB) | 30.6 | 29.5 4% | 29.3 4% | 30.4 1% | 30.6 -0% |
| Idle Minimum * (dB) | 30.6 | 29.5 4% | 29.3 4% | 30.4 1% | 30.6 -0% |
| Idle Average * (dB) | 30.6 | 29.5 4% | 29.3 4% | 30.4 1% | 30.6 -0% |
| Idle Maximum * (dB) | 30.6 | 29.5 4% | 29.7 3% | 32 -5% | 32 -5% |
| Load Average * (dB) | 33.3 | 30.6 8% | 31.8 5% | 31.7 5% | 36.7 -10% |
| Load Maximum * (dB) | 33 | 30.6 7% | 32.7 1% | 35.9 -9% | 36.7 -11% |
* ... mindre är bättre
(±) Den maximala temperaturen på ovansidan är 40 °C / 104 F, jämfört med genomsnittet av 35.4 °C / 96 F , allt från 19.6 till 60 °C för klassen Convertible.
(-) Botten värms upp till maximalt 46.1 °C / 115 F, jämfört med genomsnittet av 36.9 °C / 98 F
(+) Vid tomgångsbruk är medeltemperaturen för ovansidan 24.4 °C / 76 F, jämfört med enhetsgenomsnittet på 30.3 °C / ### class_avg_f### F.
(+) Handledsstöden och pekplattan är kallare än hudtemperaturen med maximalt 27.6 °C / 81.7 F och är därför svala att ta på.
(±) Medeltemperaturen för handledsstödsområdet på liknande enheter var 28 °C / 82.4 F (+0.4 °C / 0.7 F).
| Dell Latitude 13 3390 UHD Graphics 620, i5-8250U, SK hynix SC311 SATA | Lenovo ThinkPad L390 Yoga-20NT000XGE UHD Graphics 620, i5-8265U, Samsung SSD PM981 MZVLB256HAHQ | Lenovo Yoga C930-13IKB UHD Graphics 620, i5-8250U, SK hynix PC401 HFS256GD9TNG | Asus ZenBook Flip 14 UX461UA UHD Graphics 620, i5-8250U, SanDisk SD8SN8U256G1002 | HP ProBook x360 440 G1 UHD Graphics 620, i5-8250U, Toshiba KBG30ZMV256G | |
|---|---|---|---|---|---|
| Heat | -5% | 3% | 6% | -2% | |
| Maximum Upper Side * (°C) | 40 | 46.7 -17% | 41.8 -5% | 39 2% | 41.2 -3% |
| Maximum Bottom * (°C) | 46.1 | 50.7 -10% | 40.9 11% | 45.6 1% | 42.4 8% |
| Idle Upper Side * (°C) | 25.7 | 23.8 7% | 25.6 -0% | 23.3 9% | 26.9 -5% |
| Idle Bottom * (°C) | 26 | 25.6 2% | 24.5 6% | 23.1 11% | 28.4 -9% |
* ... mindre är bättre
Dell Latitude 13 3390 ljudanalys
(-) | inte särskilt höga högtalare (66.7 dB)
Bas 100 - 315 Hz
(-) | nästan ingen bas - i genomsnitt 15.6% lägre än medianen
(±) | linjäriteten för basen är genomsnittlig (12.4% delta till föregående frekvens)
Mellan 400 - 2000 Hz
(+) | balanserad mellan - endast 4% från medianen
(±) | linjäriteten för mids är genomsnittlig (7.9% delta till föregående frekvens)
Högsta 2 - 16 kHz
(+) | balanserade toppar - endast 4.4% från medianen
(±) | linjäriteten för toppar är genomsnittlig (7% delta till föregående frekvens)
Totalt 100 - 16 000 Hz
(±) | linjäriteten för det totala ljudet är genomsnittlig (22.6% skillnad mot median)
Jämfört med samma klass
» 68% av alla testade enheter i den här klassen var bättre, 5% liknande, 27% sämre
» Den bästa hade ett delta på 6%, genomsnittet var 20%, sämst var 57%
Jämfört med alla testade enheter
» 67% av alla testade enheter var bättre, 6% liknande, 28% sämre
» Den bästa hade ett delta på 4%, genomsnittet var 24%, sämst var 134%
Lenovo ThinkPad L390 Yoga-20NT000XGE ljudanalys
(±) | högtalarljudstyrkan är genomsnittlig men bra (76.3 dB)
Bas 100 - 315 Hz
(-) | nästan ingen bas - i genomsnitt 17.9% lägre än medianen
(±) | linjäriteten för basen är genomsnittlig (12.9% delta till föregående frekvens)
Mellan 400 - 2000 Hz
(+) | balanserad mellan - endast 2.1% från medianen
(+) | mids är linjära (6.1% delta till föregående frekvens)
Högsta 2 - 16 kHz
(±) | högre toppar - i genomsnitt 7.5% högre än medianen
(±) | linjäriteten för toppar är genomsnittlig (9.1% delta till föregående frekvens)
Totalt 100 - 16 000 Hz
(±) | linjäriteten för det totala ljudet är genomsnittlig (23% skillnad mot median)
Jämfört med samma klass
» 69% av alla testade enheter i den här klassen var bättre, 5% liknande, 26% sämre
» Den bästa hade ett delta på 6%, genomsnittet var 20%, sämst var 57%
Jämfört med alla testade enheter
» 69% av alla testade enheter var bättre, 5% liknande, 26% sämre
» Den bästa hade ett delta på 4%, genomsnittet var 24%, sämst var 134%
| Av/Standby | |
| Låg belastning | |
| Hög belastning |
|
Förklaring:
min: | |
| Dell Latitude 13 3390 i5-8250U, UHD Graphics 620, SK hynix SC311 SATA, IPS, 1920x1080, 13.3" | Lenovo ThinkPad L390 Yoga-20NT000XGE i5-8265U, UHD Graphics 620, Samsung SSD PM981 MZVLB256HAHQ, IPS LED, 1920x1080, 13.3" | Lenovo Yoga C930-13IKB i5-8250U, UHD Graphics 620, SK hynix PC401 HFS256GD9TNG, IPS, 1920x1080, 13.9" | Asus ZenBook Flip 14 UX461UA i5-8250U, UHD Graphics 620, SanDisk SD8SN8U256G1002, IPS, 1920x1080, 14" | HP ProBook x360 440 G1 i5-8250U, UHD Graphics 620, Toshiba KBG30ZMV256G, IPS, 1920x1080, 14" | Genomsnitt Intel UHD Graphics 620 | Genomsnitt av klass Convertible | |
|---|---|---|---|---|---|---|---|
| Power Consumption | -14% | -16% | -1% | -15% | -9% | -27% | |
| Idle Minimum * (Watt) | 3.9 | 4 -3% | 3.3 15% | 3.3 15% | 4.6 -18% | 3.81 ? 2% | 4.29 ? -10% |
| Idle Average * (Watt) | 6.5 | 7.1 -9% | 6.8 -5% | 6.3 3% | 7.5 -15% | 6.94 ? -7% | 7.08 ? -9% |
| Idle Maximum * (Watt) | 8.6 | 10.7 -24% | 9.5 -10% | 11 -28% | 9.6 -12% | 8.75 ? -2% | 8.68 ? -1% |
| Load Average * (Watt) | 25 | 33.8 -35% | 40.8 -63% | 30 -20% | 37 -48% | 35 ? -40% | 44 ? -76% |
| Load Maximum * (Watt) | 48.1 | 48.8 -1% | 57 -19% | 35.4 26% | 38.8 19% | 47.5 ? 1% | 67.3 ? -40% |
* ... mindre är bättre

| Dell Latitude 13 3390 i5-8250U, UHD Graphics 620, 42 Wh | Lenovo ThinkPad L390 Yoga-20NT000XGE i5-8265U, UHD Graphics 620, 45 Wh | Lenovo Yoga C930-13IKB i5-8250U, UHD Graphics 620, 60 Wh | Asus ZenBook Flip 14 UX461UA i5-8250U, UHD Graphics 620, 57 Wh | HP ProBook x360 440 G1 i5-8250U, UHD Graphics 620, 48 Wh | Genomsnitt av klass Convertible | |
|---|---|---|---|---|---|---|
| Batteridrifttid | 3% | 44% | 29% | 32% | 76% | |
| Reader / Idle (h) | 16.7 | 15.8 -5% | 23.9 43% | 18.9 13% | 17.3 4% | 27.7 ? 66% |
| H.264 (h) | 5.9 | 7.4 25% | 10.5 78% | 8.6 46% | 8.3 41% | 15.3 ? 159% |
| WiFi v1.3 (h) | 6.7 | 7.2 7% | 9.2 37% | 9.4 40% | 8.9 33% | 11.9 ? 78% |
| Load (h) | 1.8 | 1.5 -17% | 2.1 17% | 2.1 17% | 2.7 50% | 1.779 ? -1% |
För
Emot
Läs den fullständiga versionen av den här recensionen på engelska här.
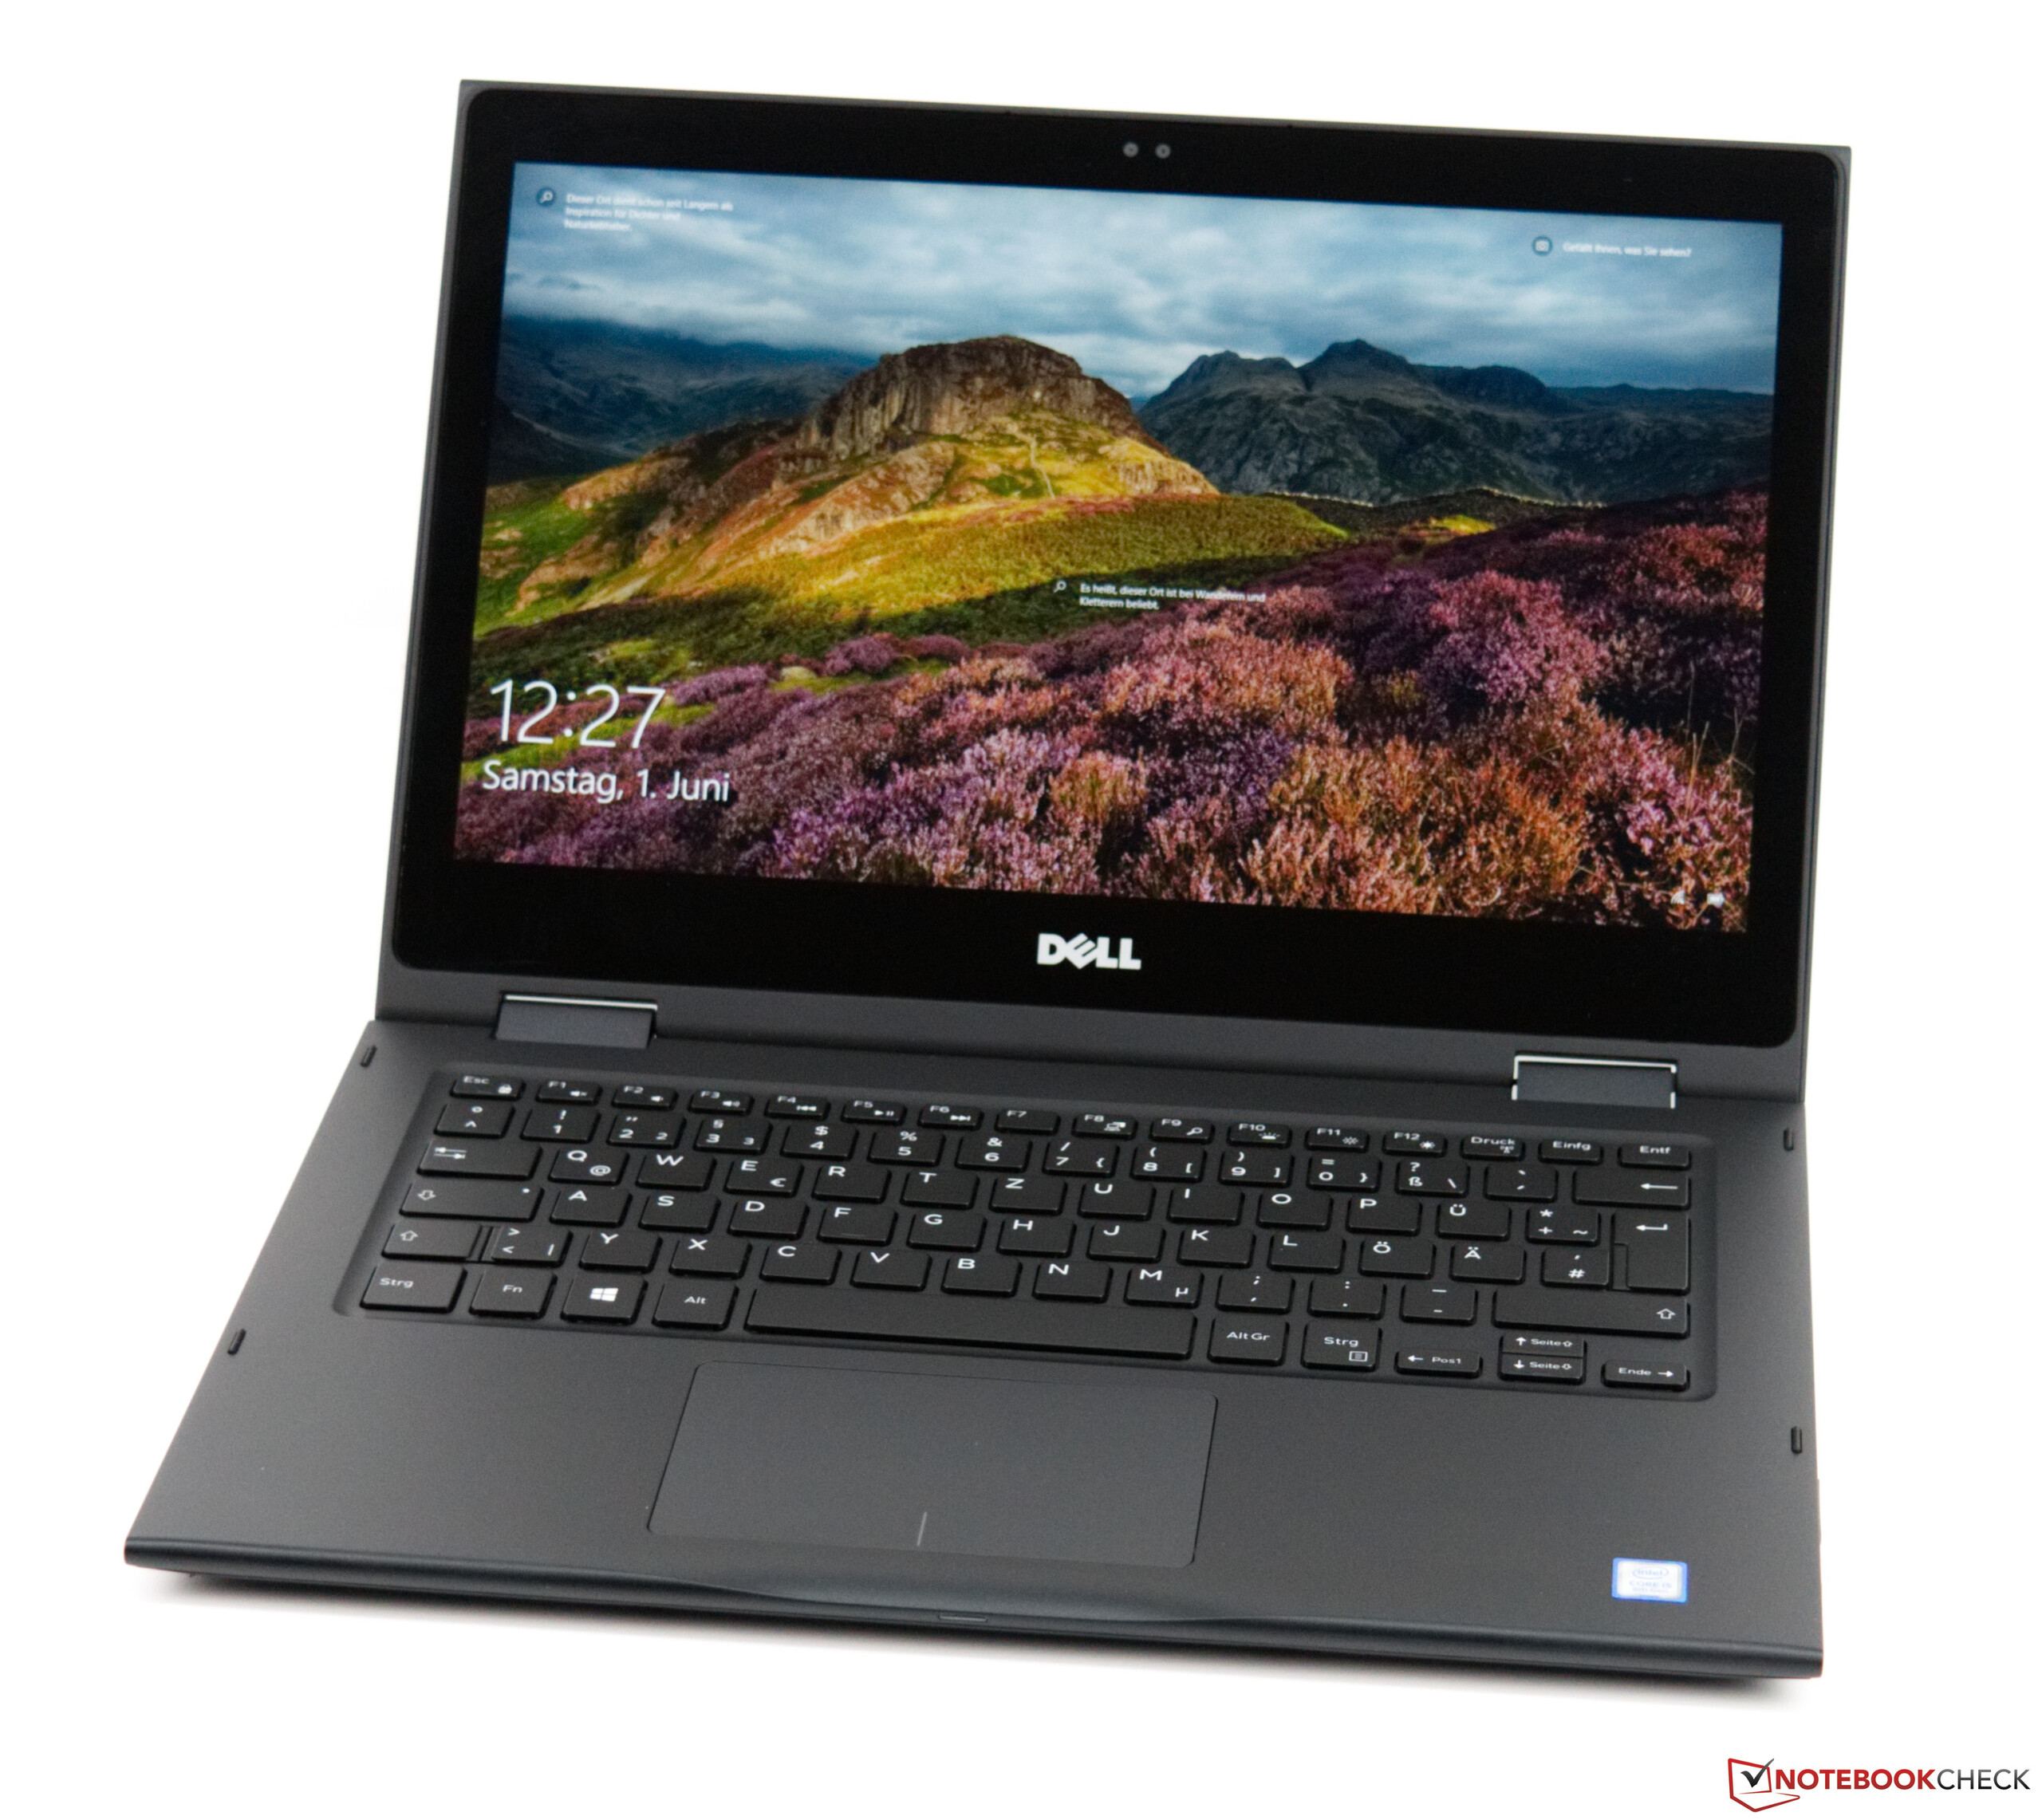
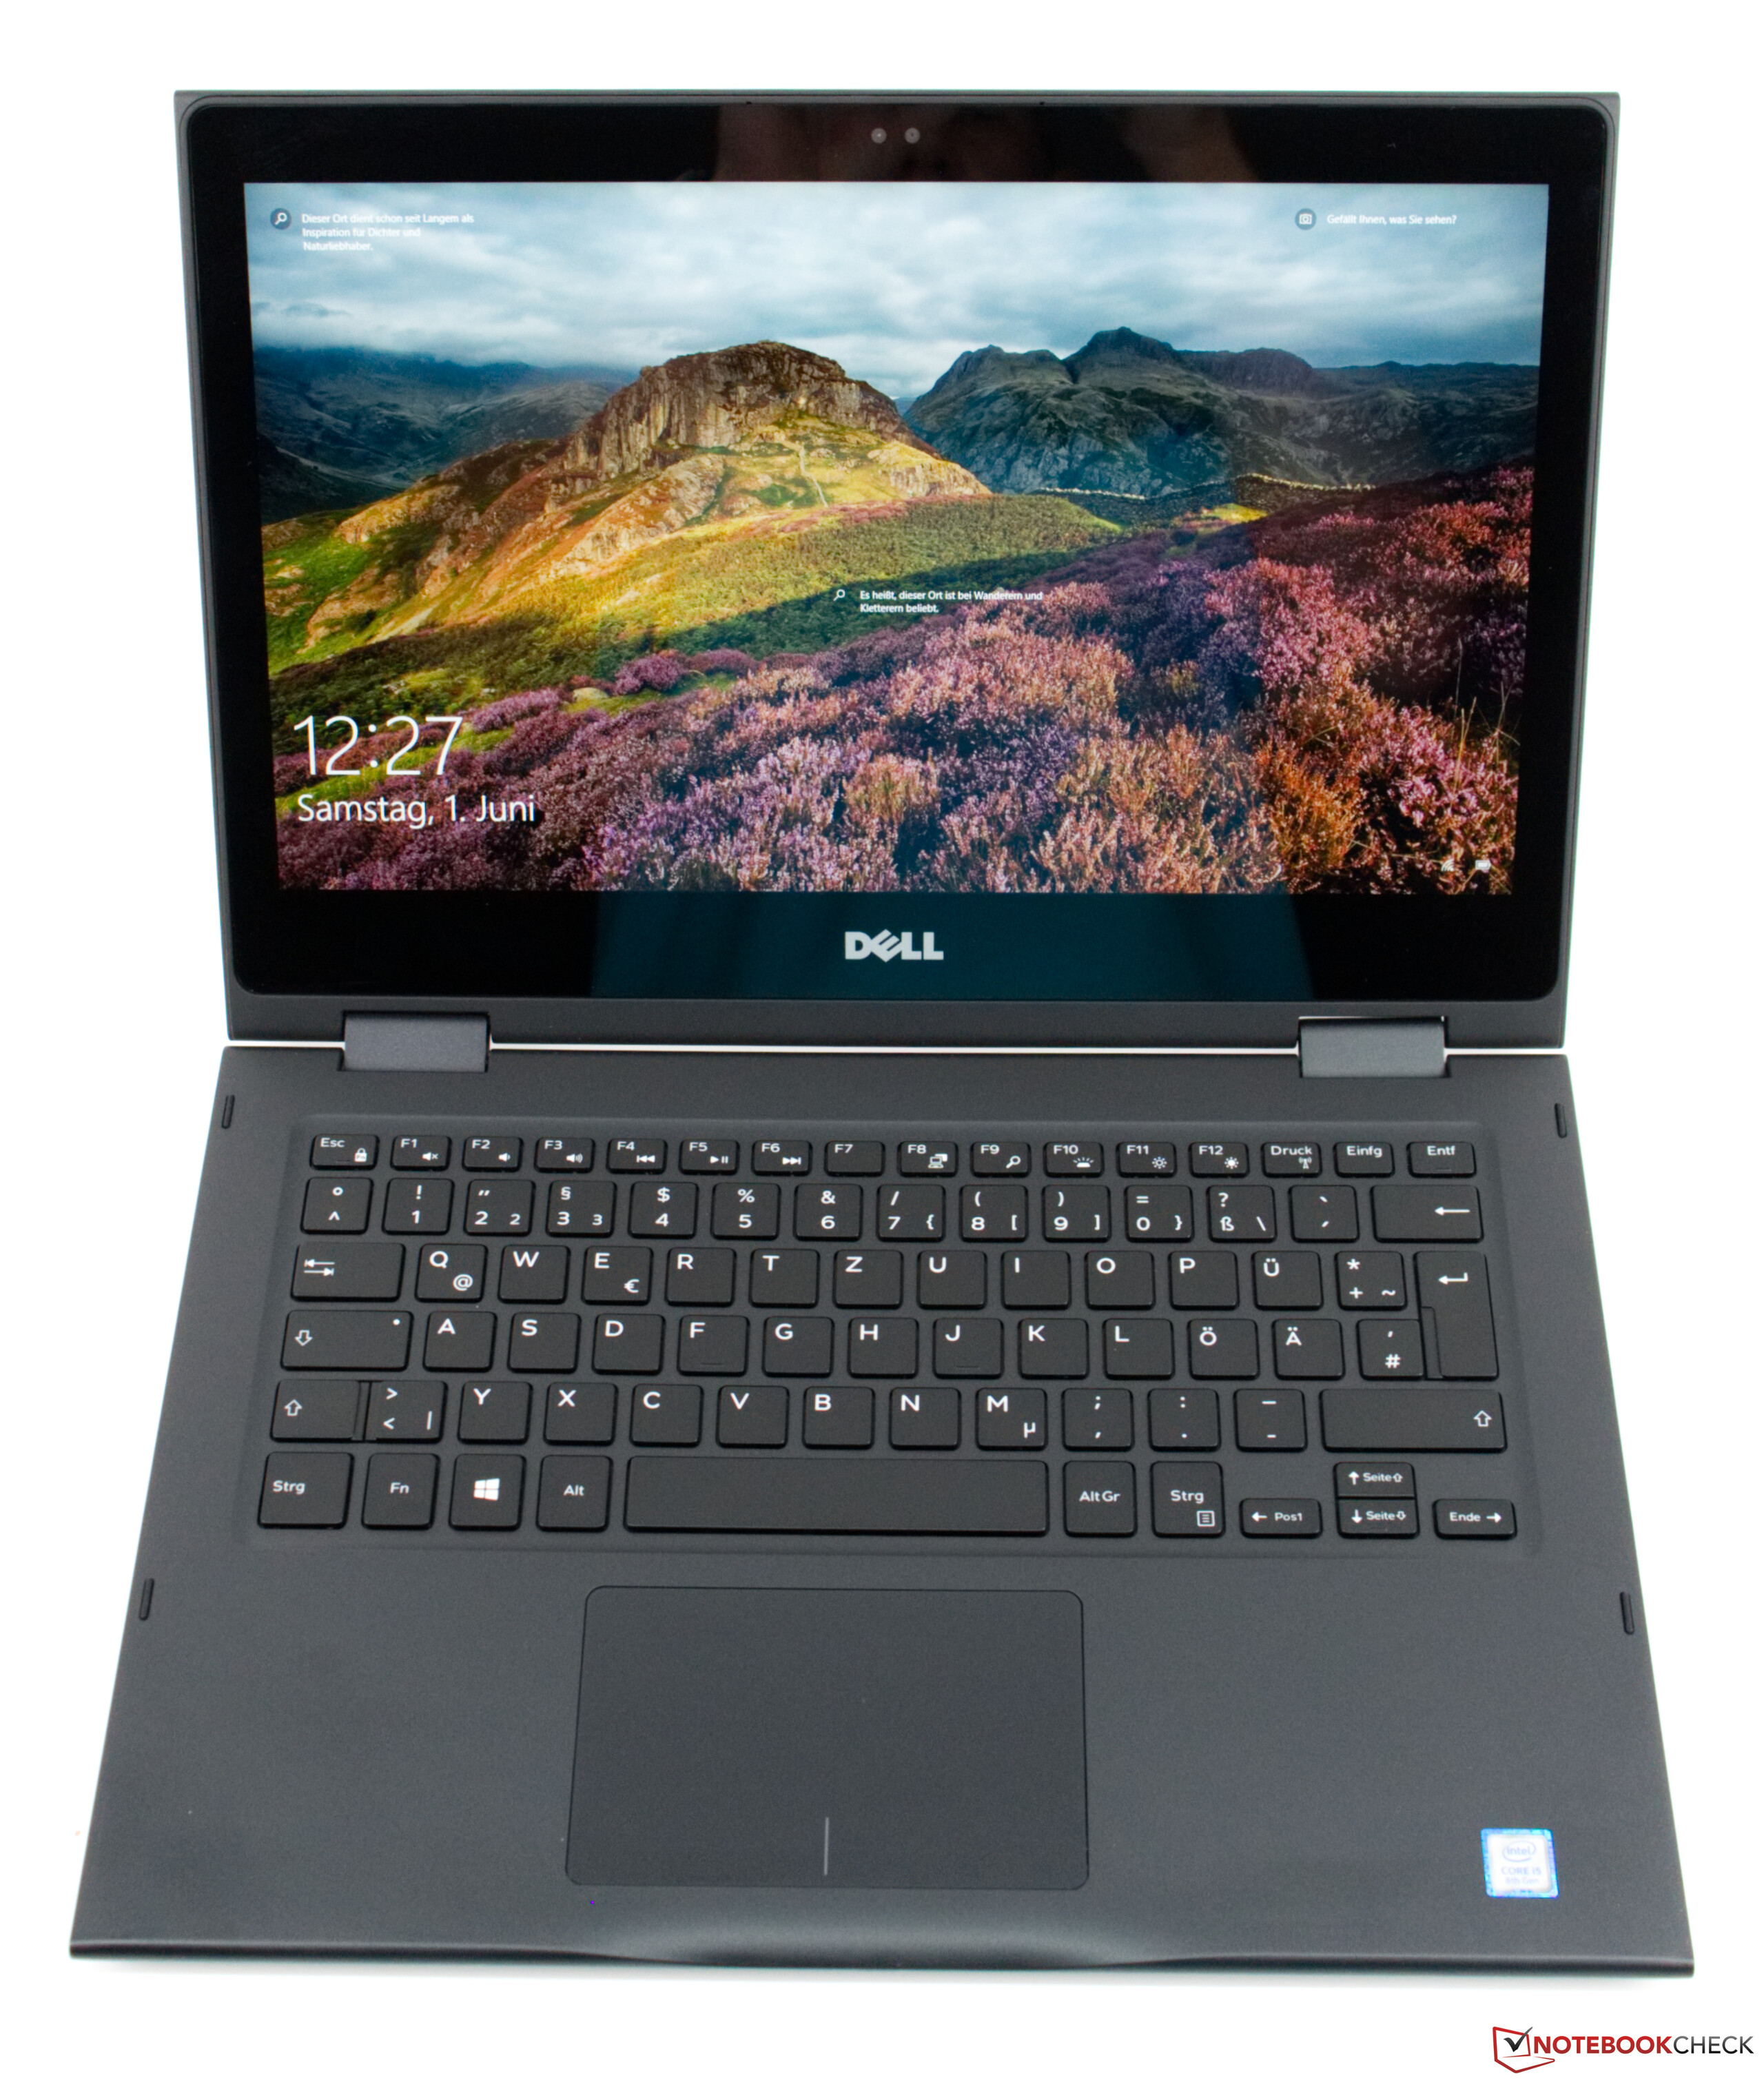
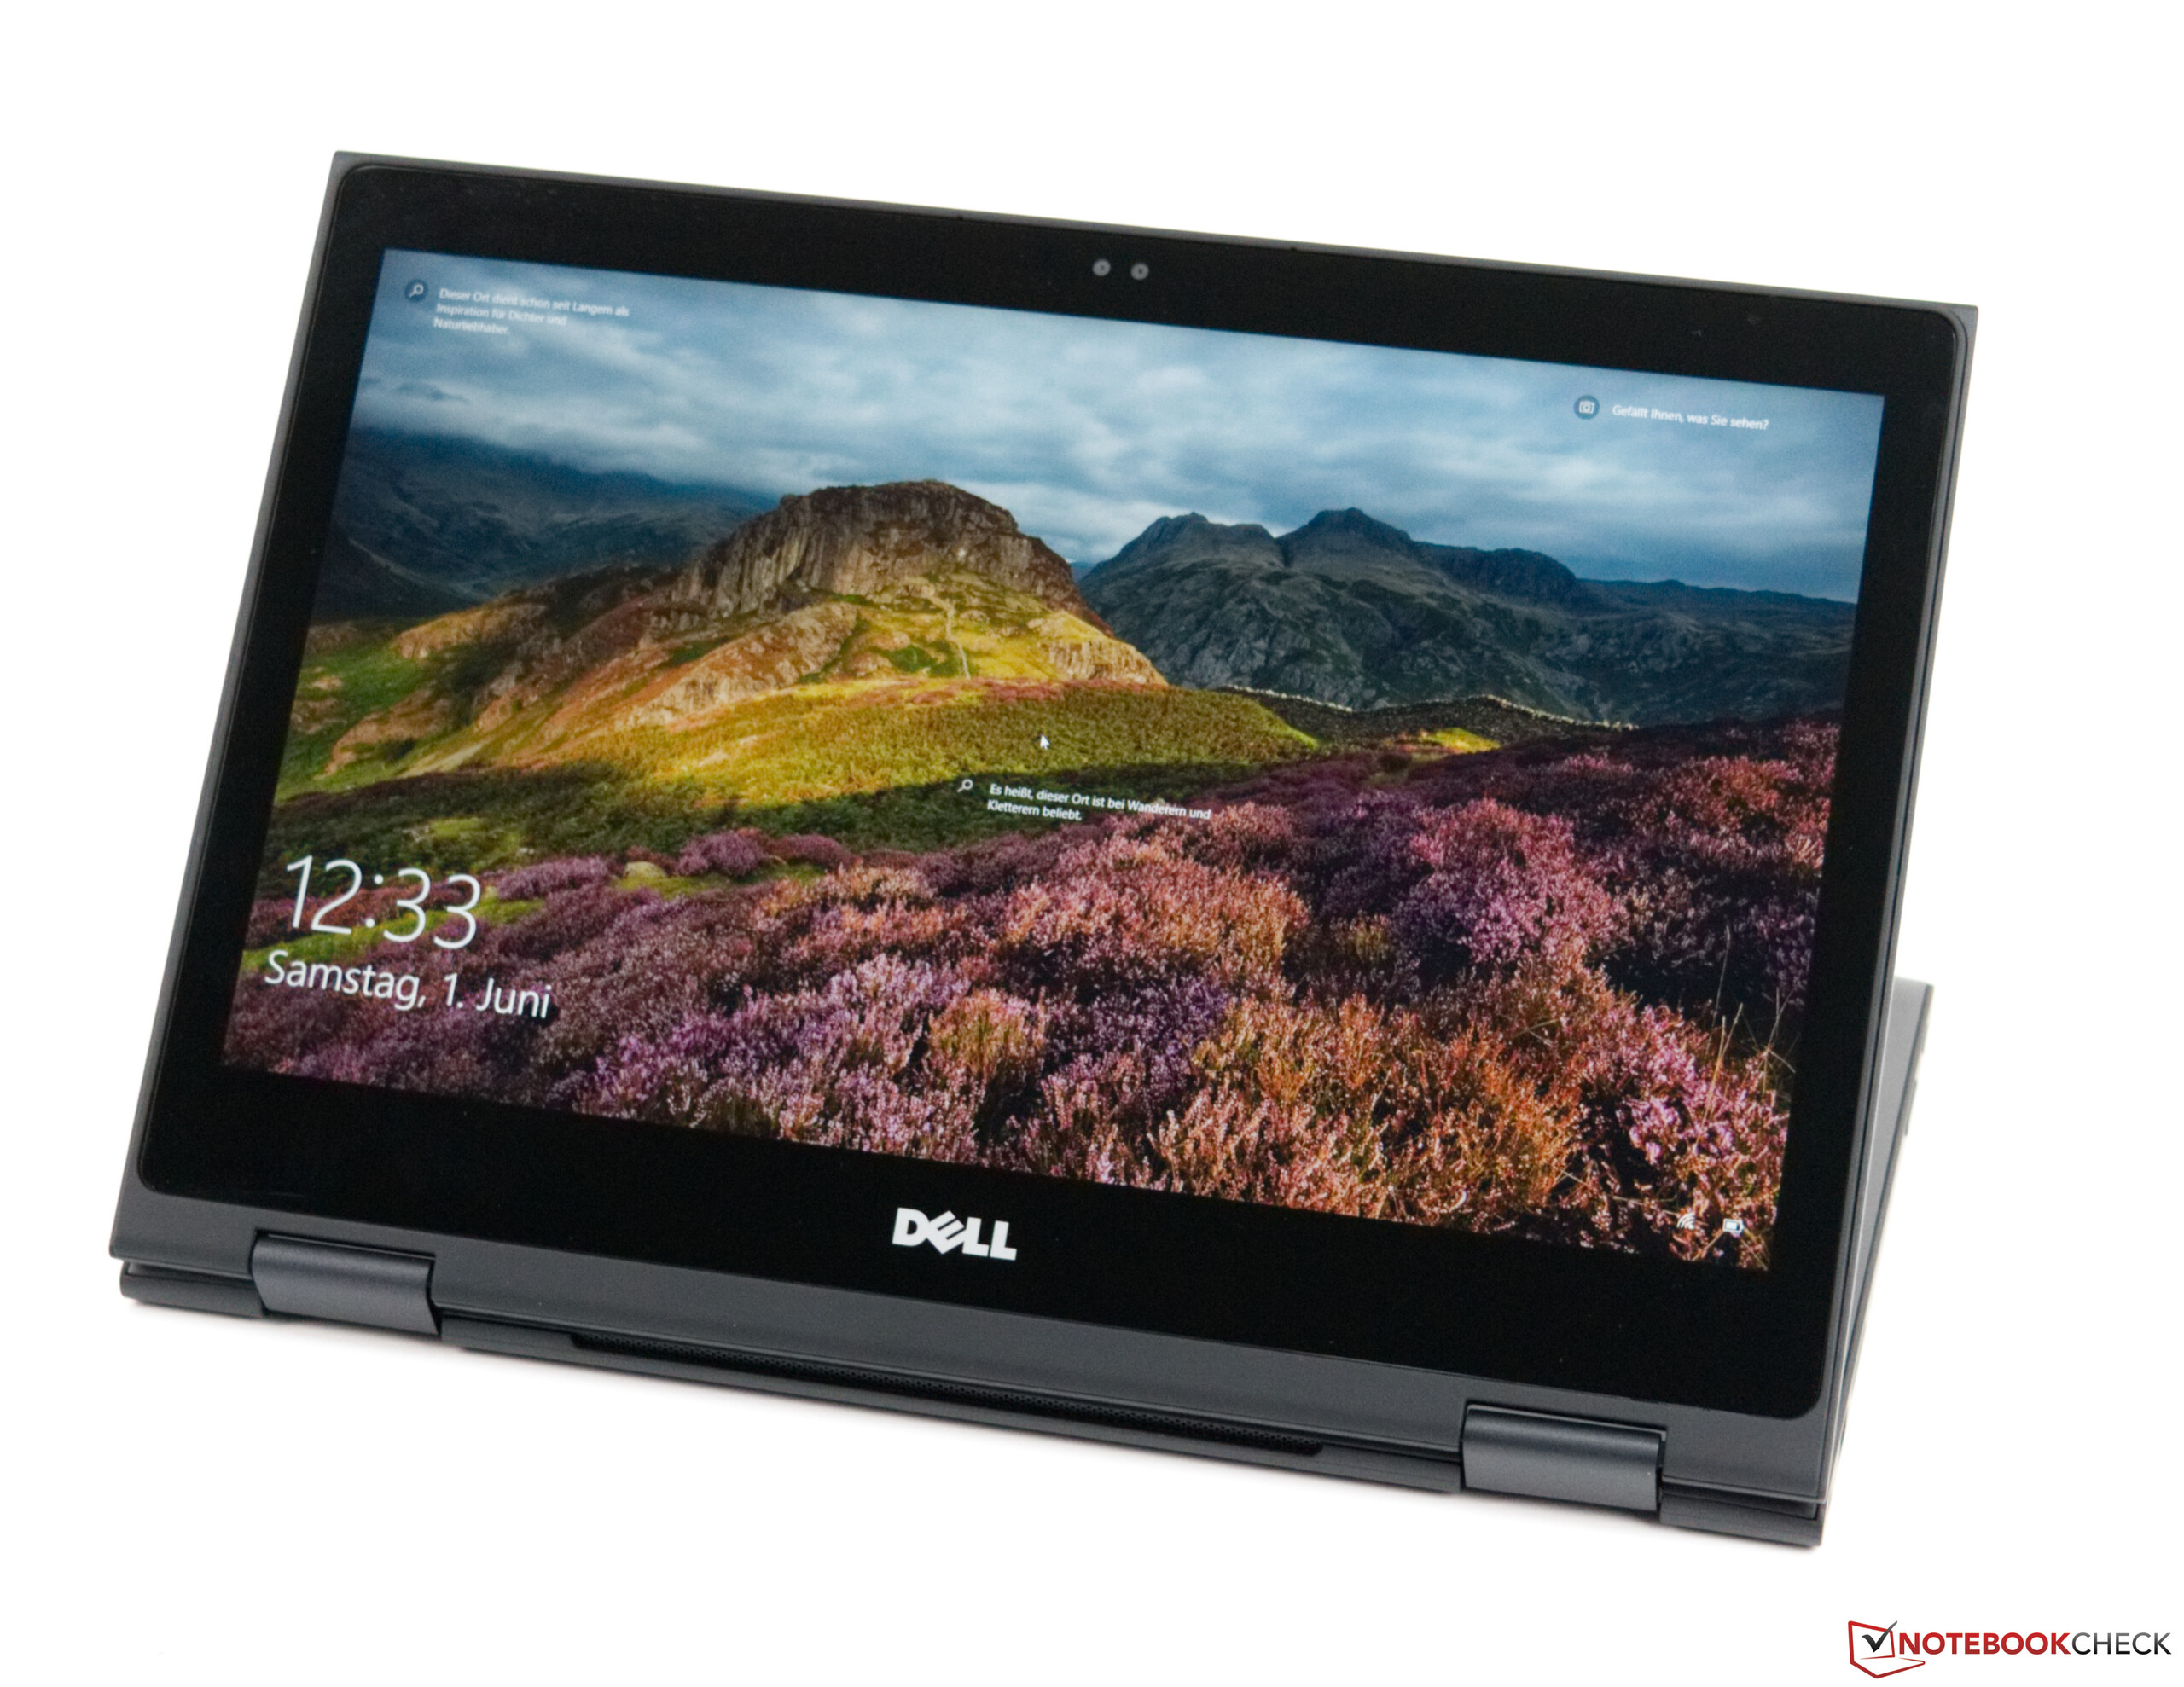
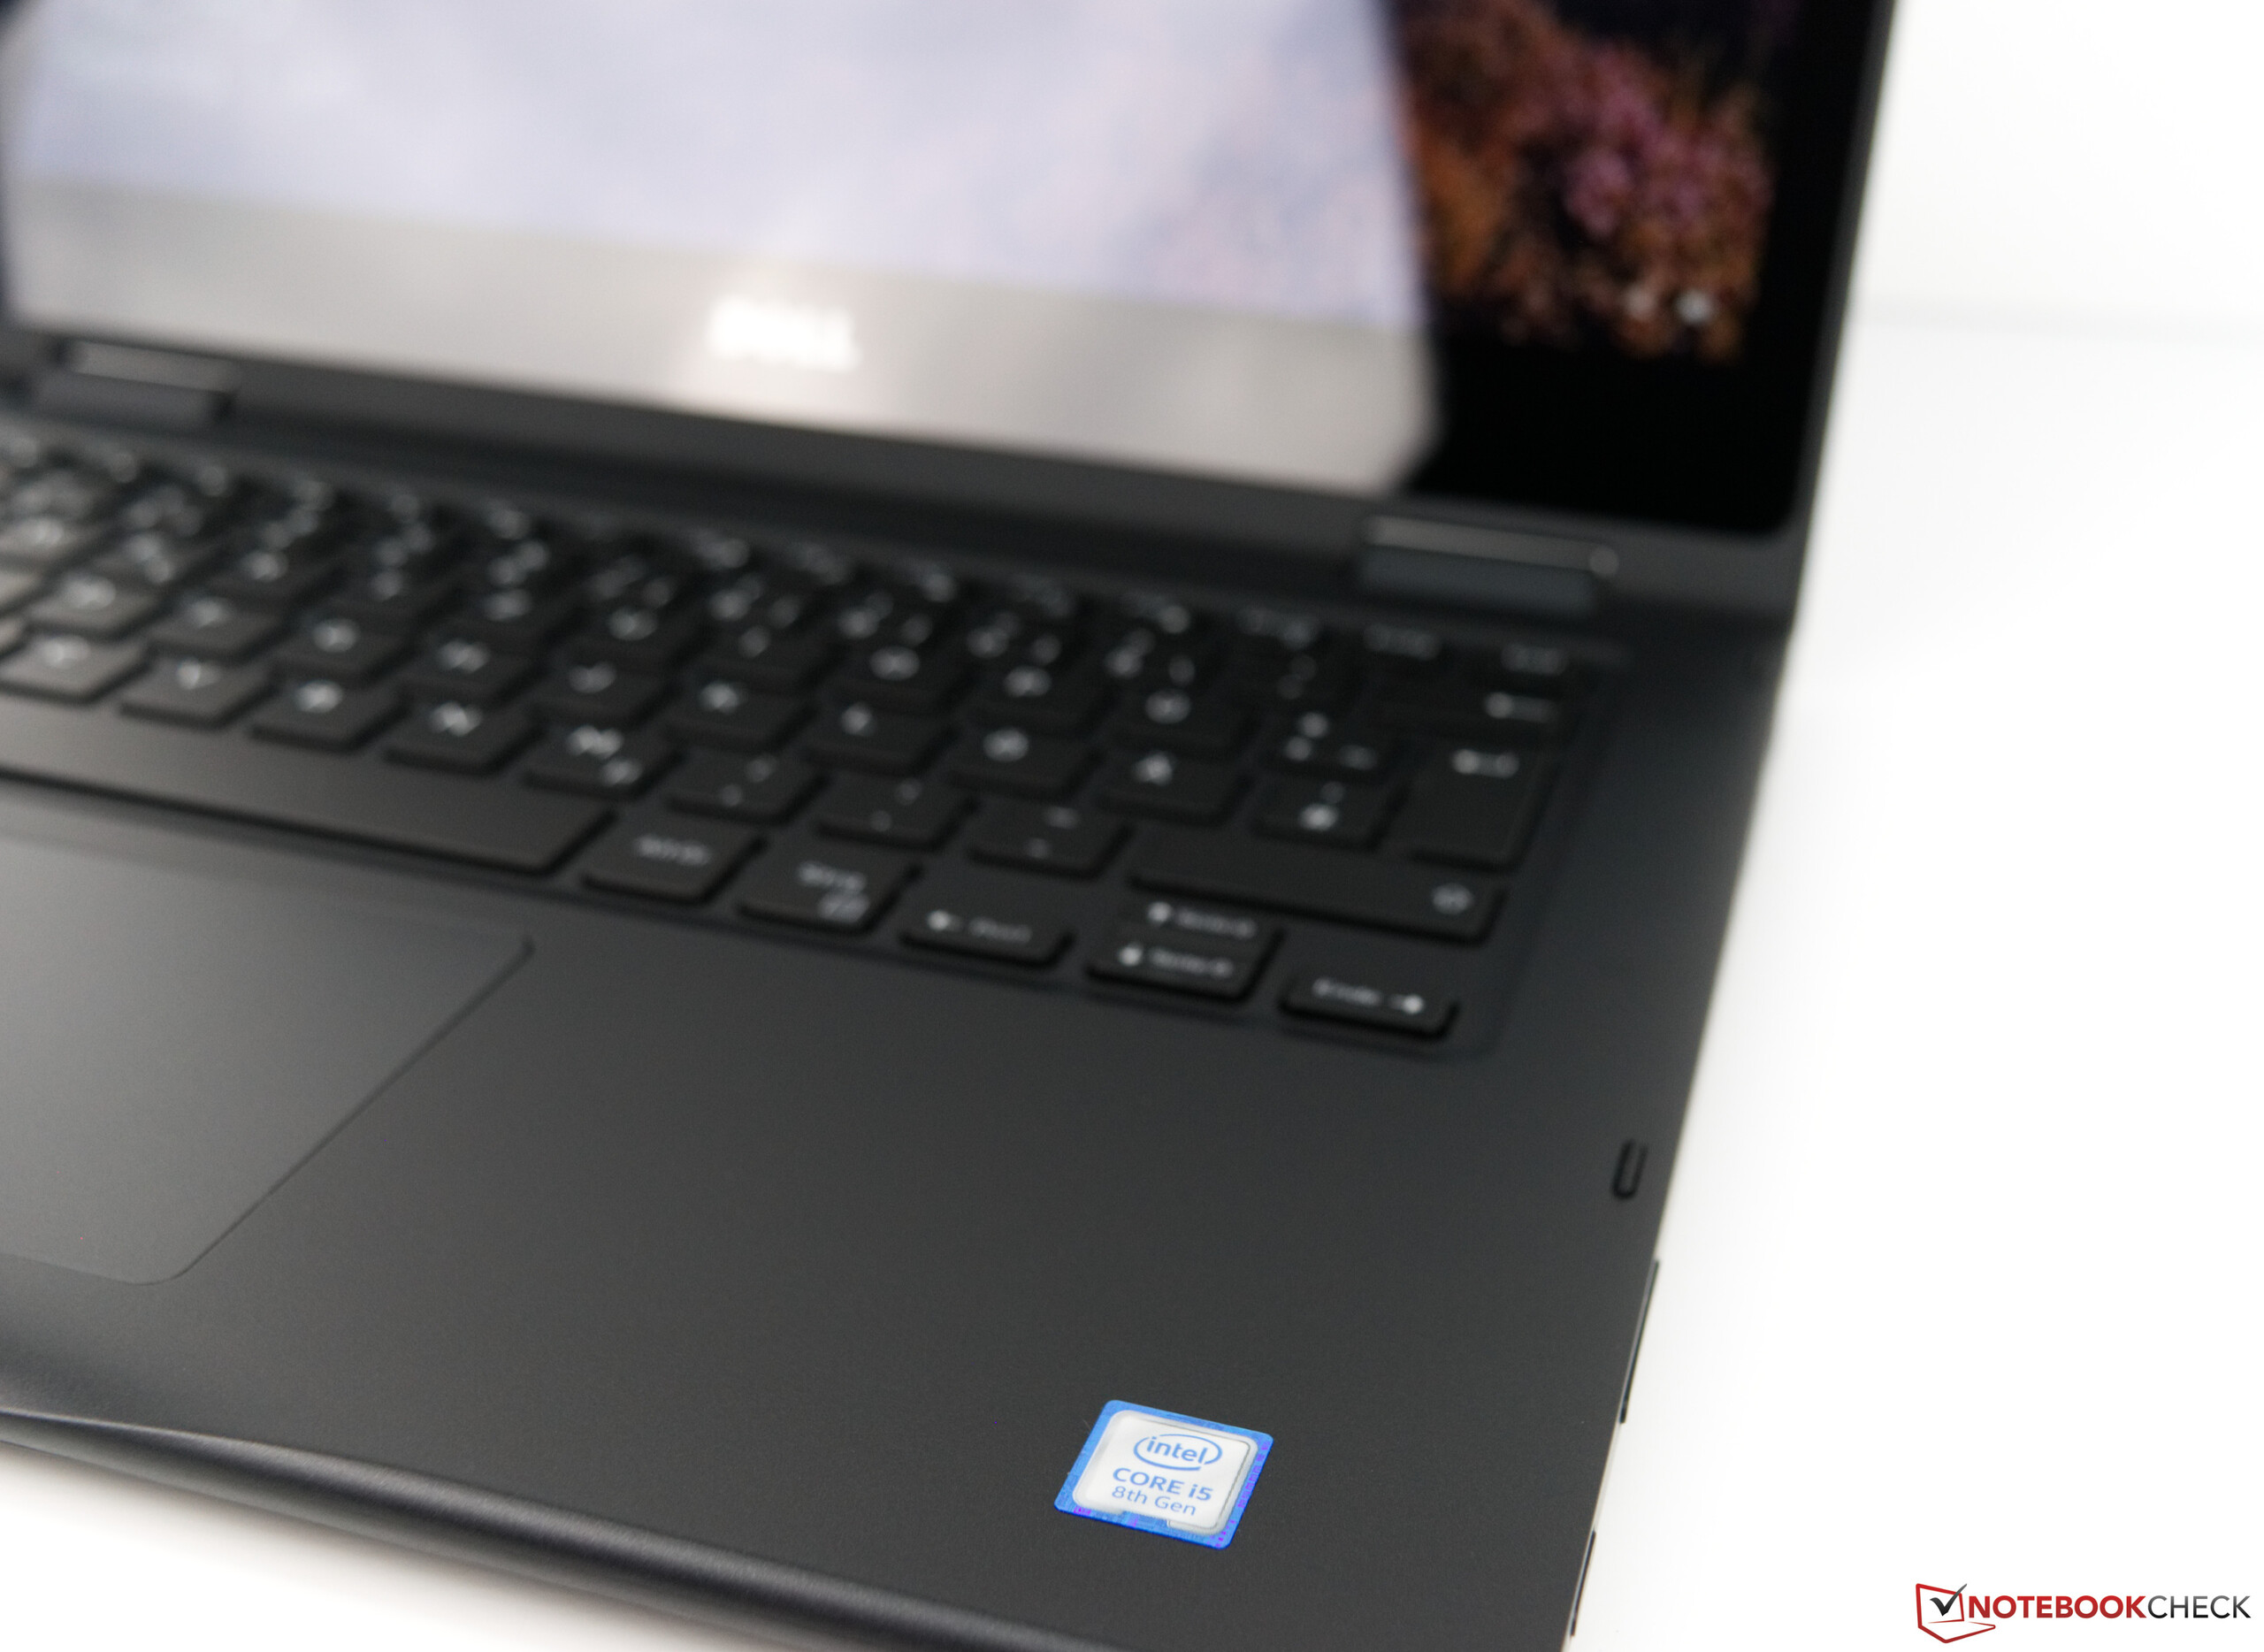
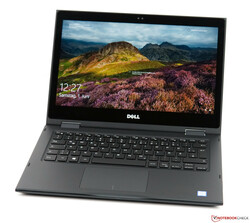
Dell Latitude 3390 är en rimligt prissatt omvandlingsbar dator för företaget på 13.3 tum. Vår recensionsenhet kommer med en Intel Core i5-8250U processor, 8 GB RAM och en SSD-enhet på 256 GB, vilket gör den välutrustad för sitt pris på 9.999 kronor. Kort sagt är den konfiguration av Latitude 3390 som vi testat jämförelsevis billig för en företagsenhet och den är dessutom ett skapligt alternativ även för privata köpare.
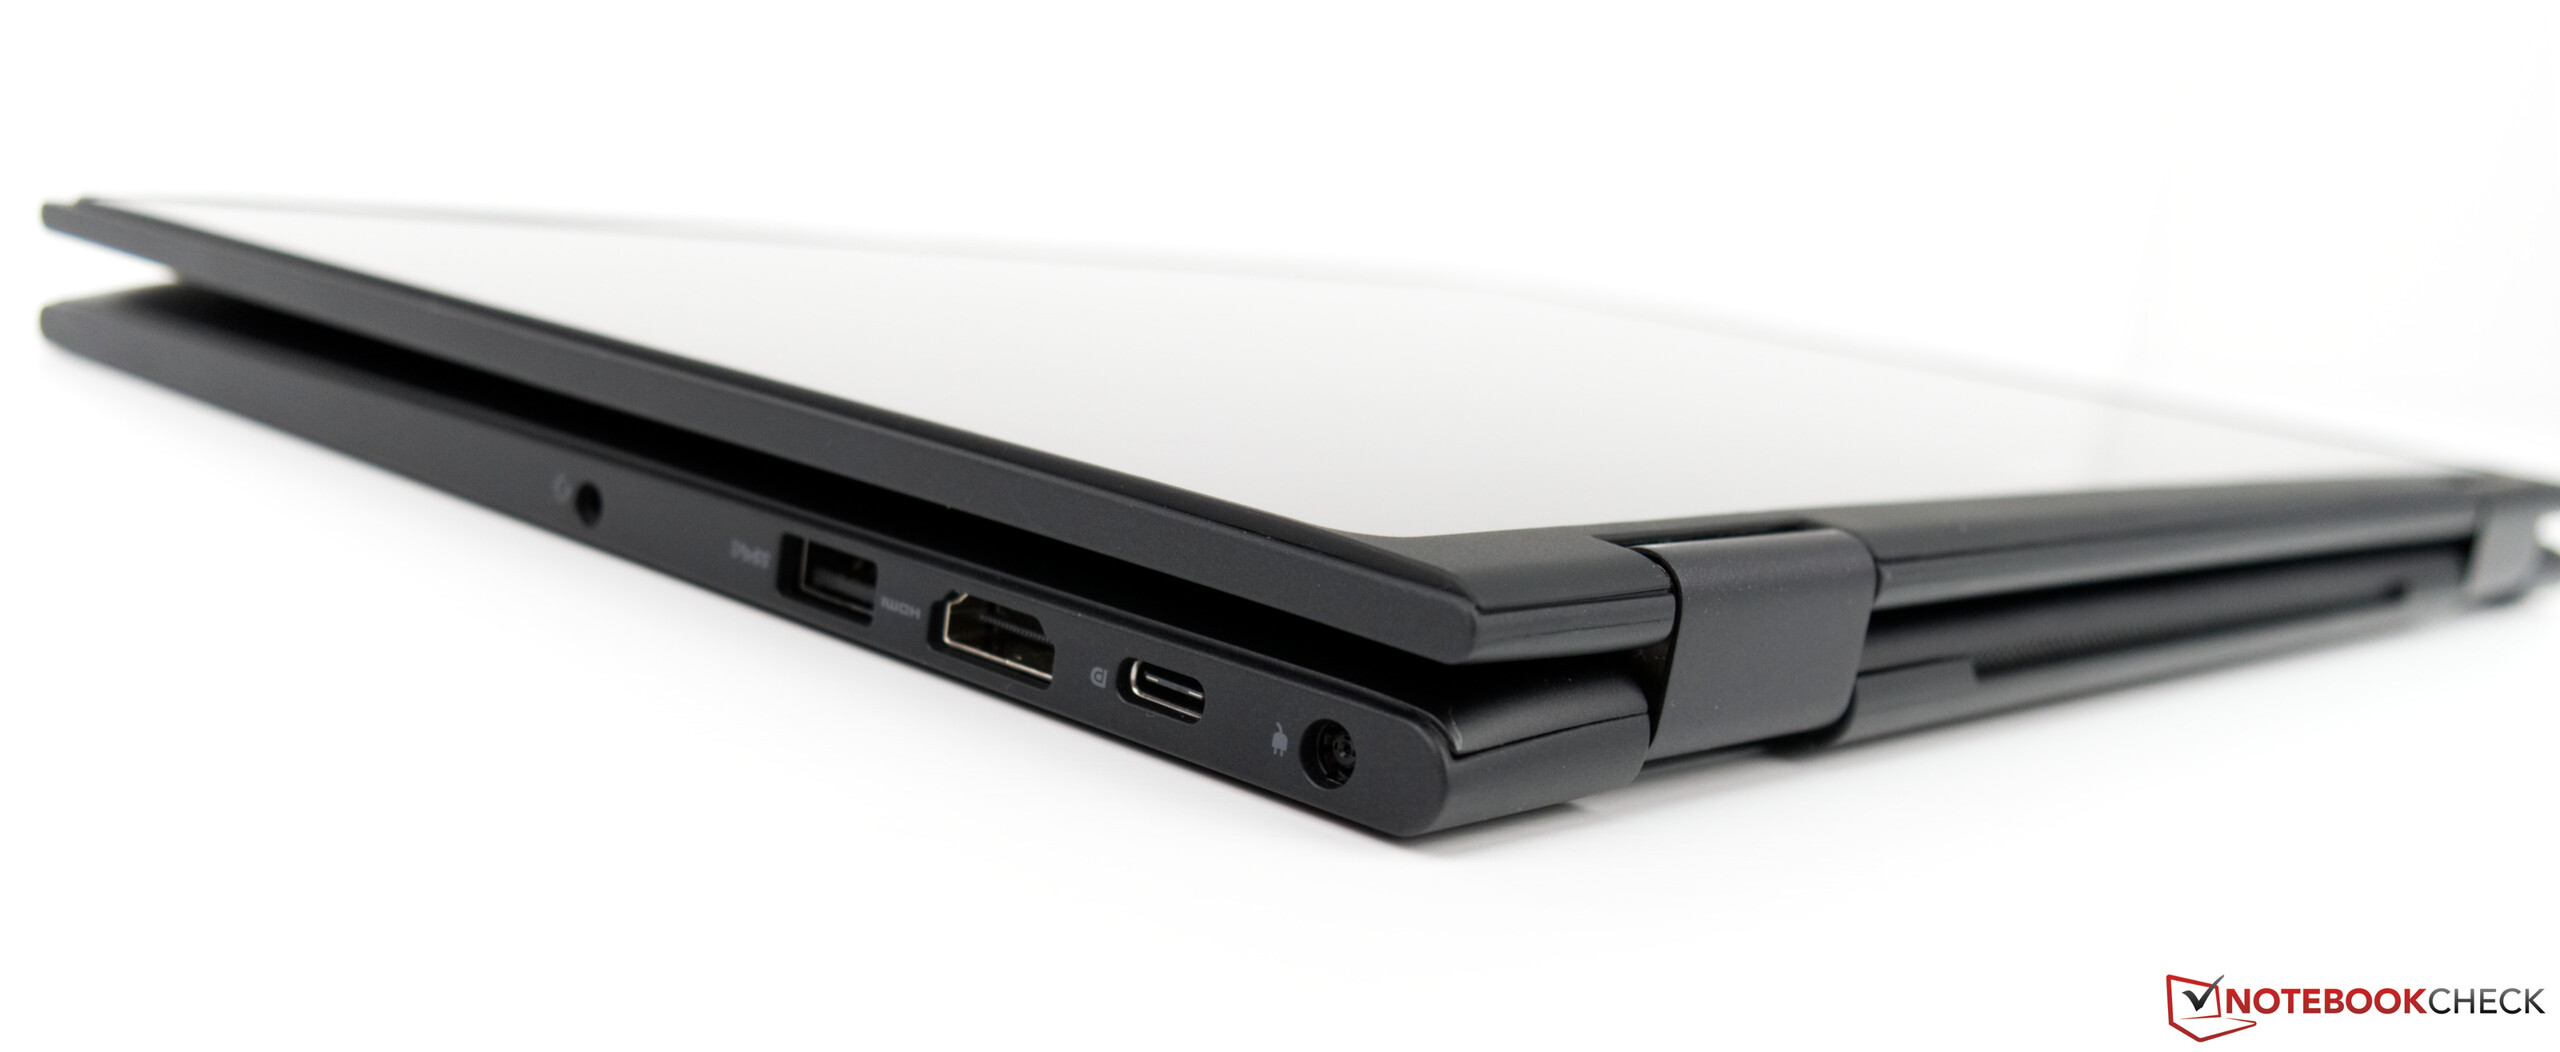
Tyvärr saknar den viktiga företagsfunktioner som möjligheten att välja till LTE-anslutbarhet och säkerhetsfunktioner såsom fingeravtrycksläsare. På grund av det kommer Latitude 3390 nog inte tilltala proffs.
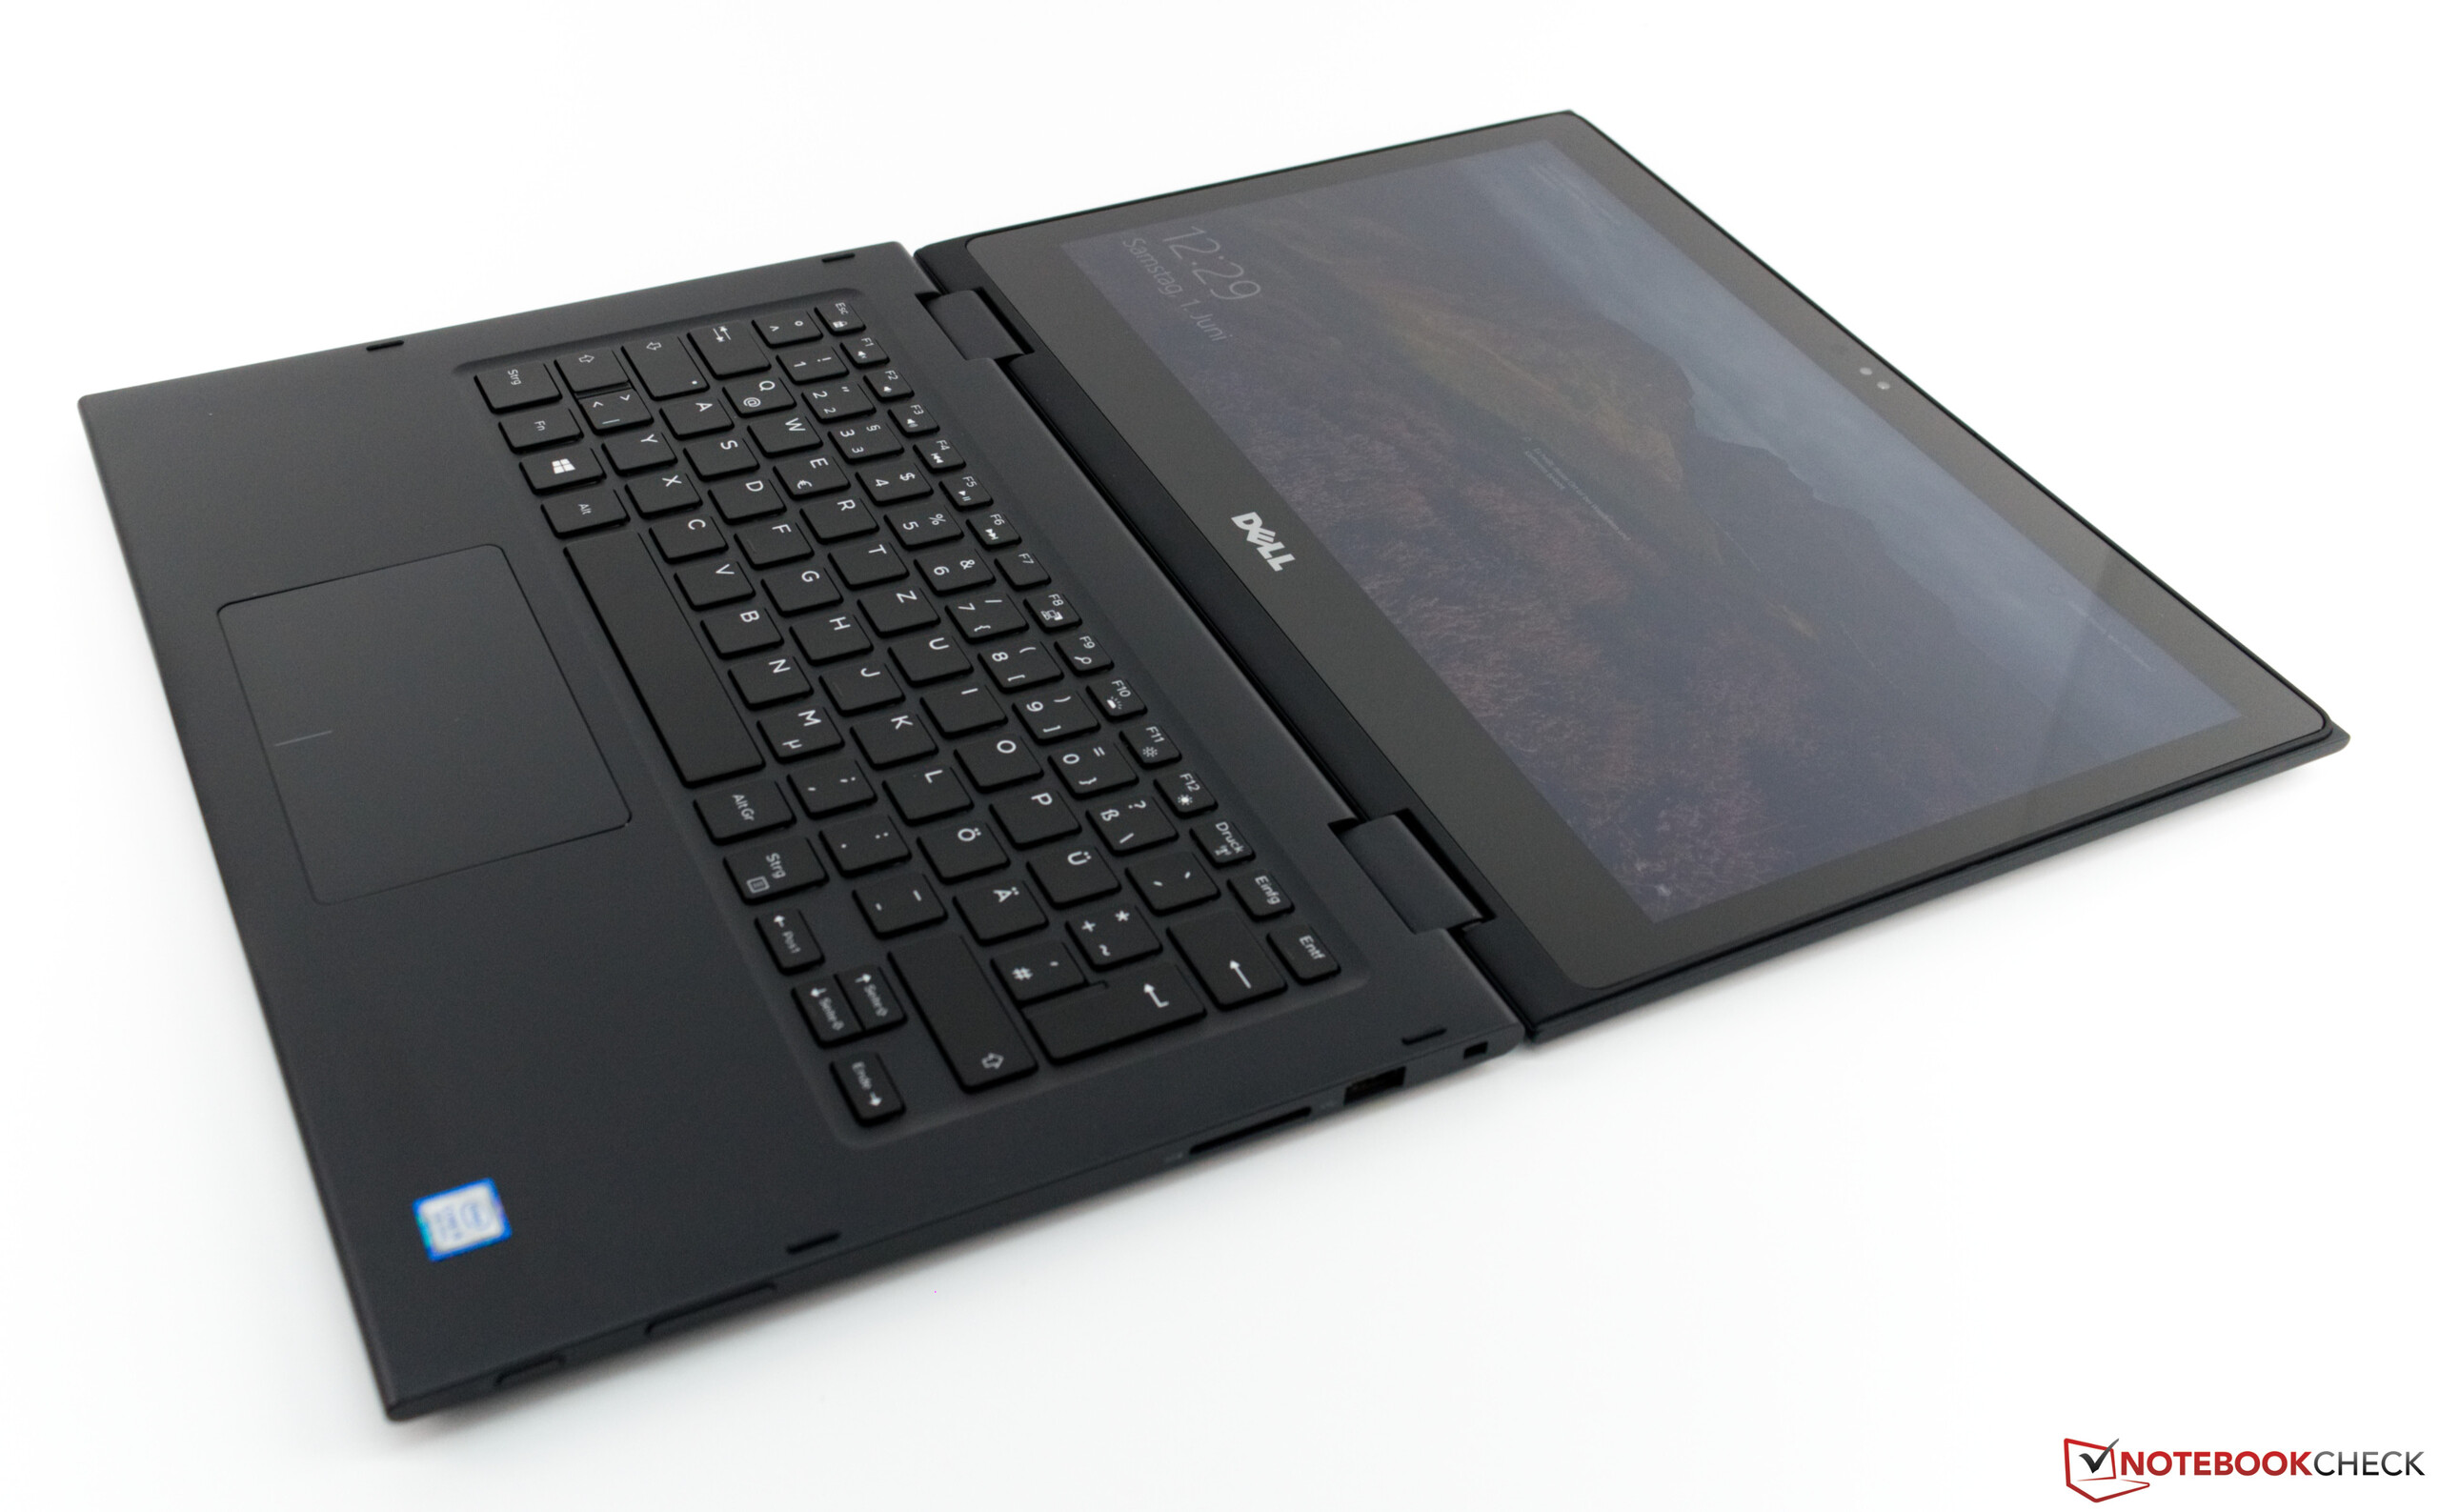
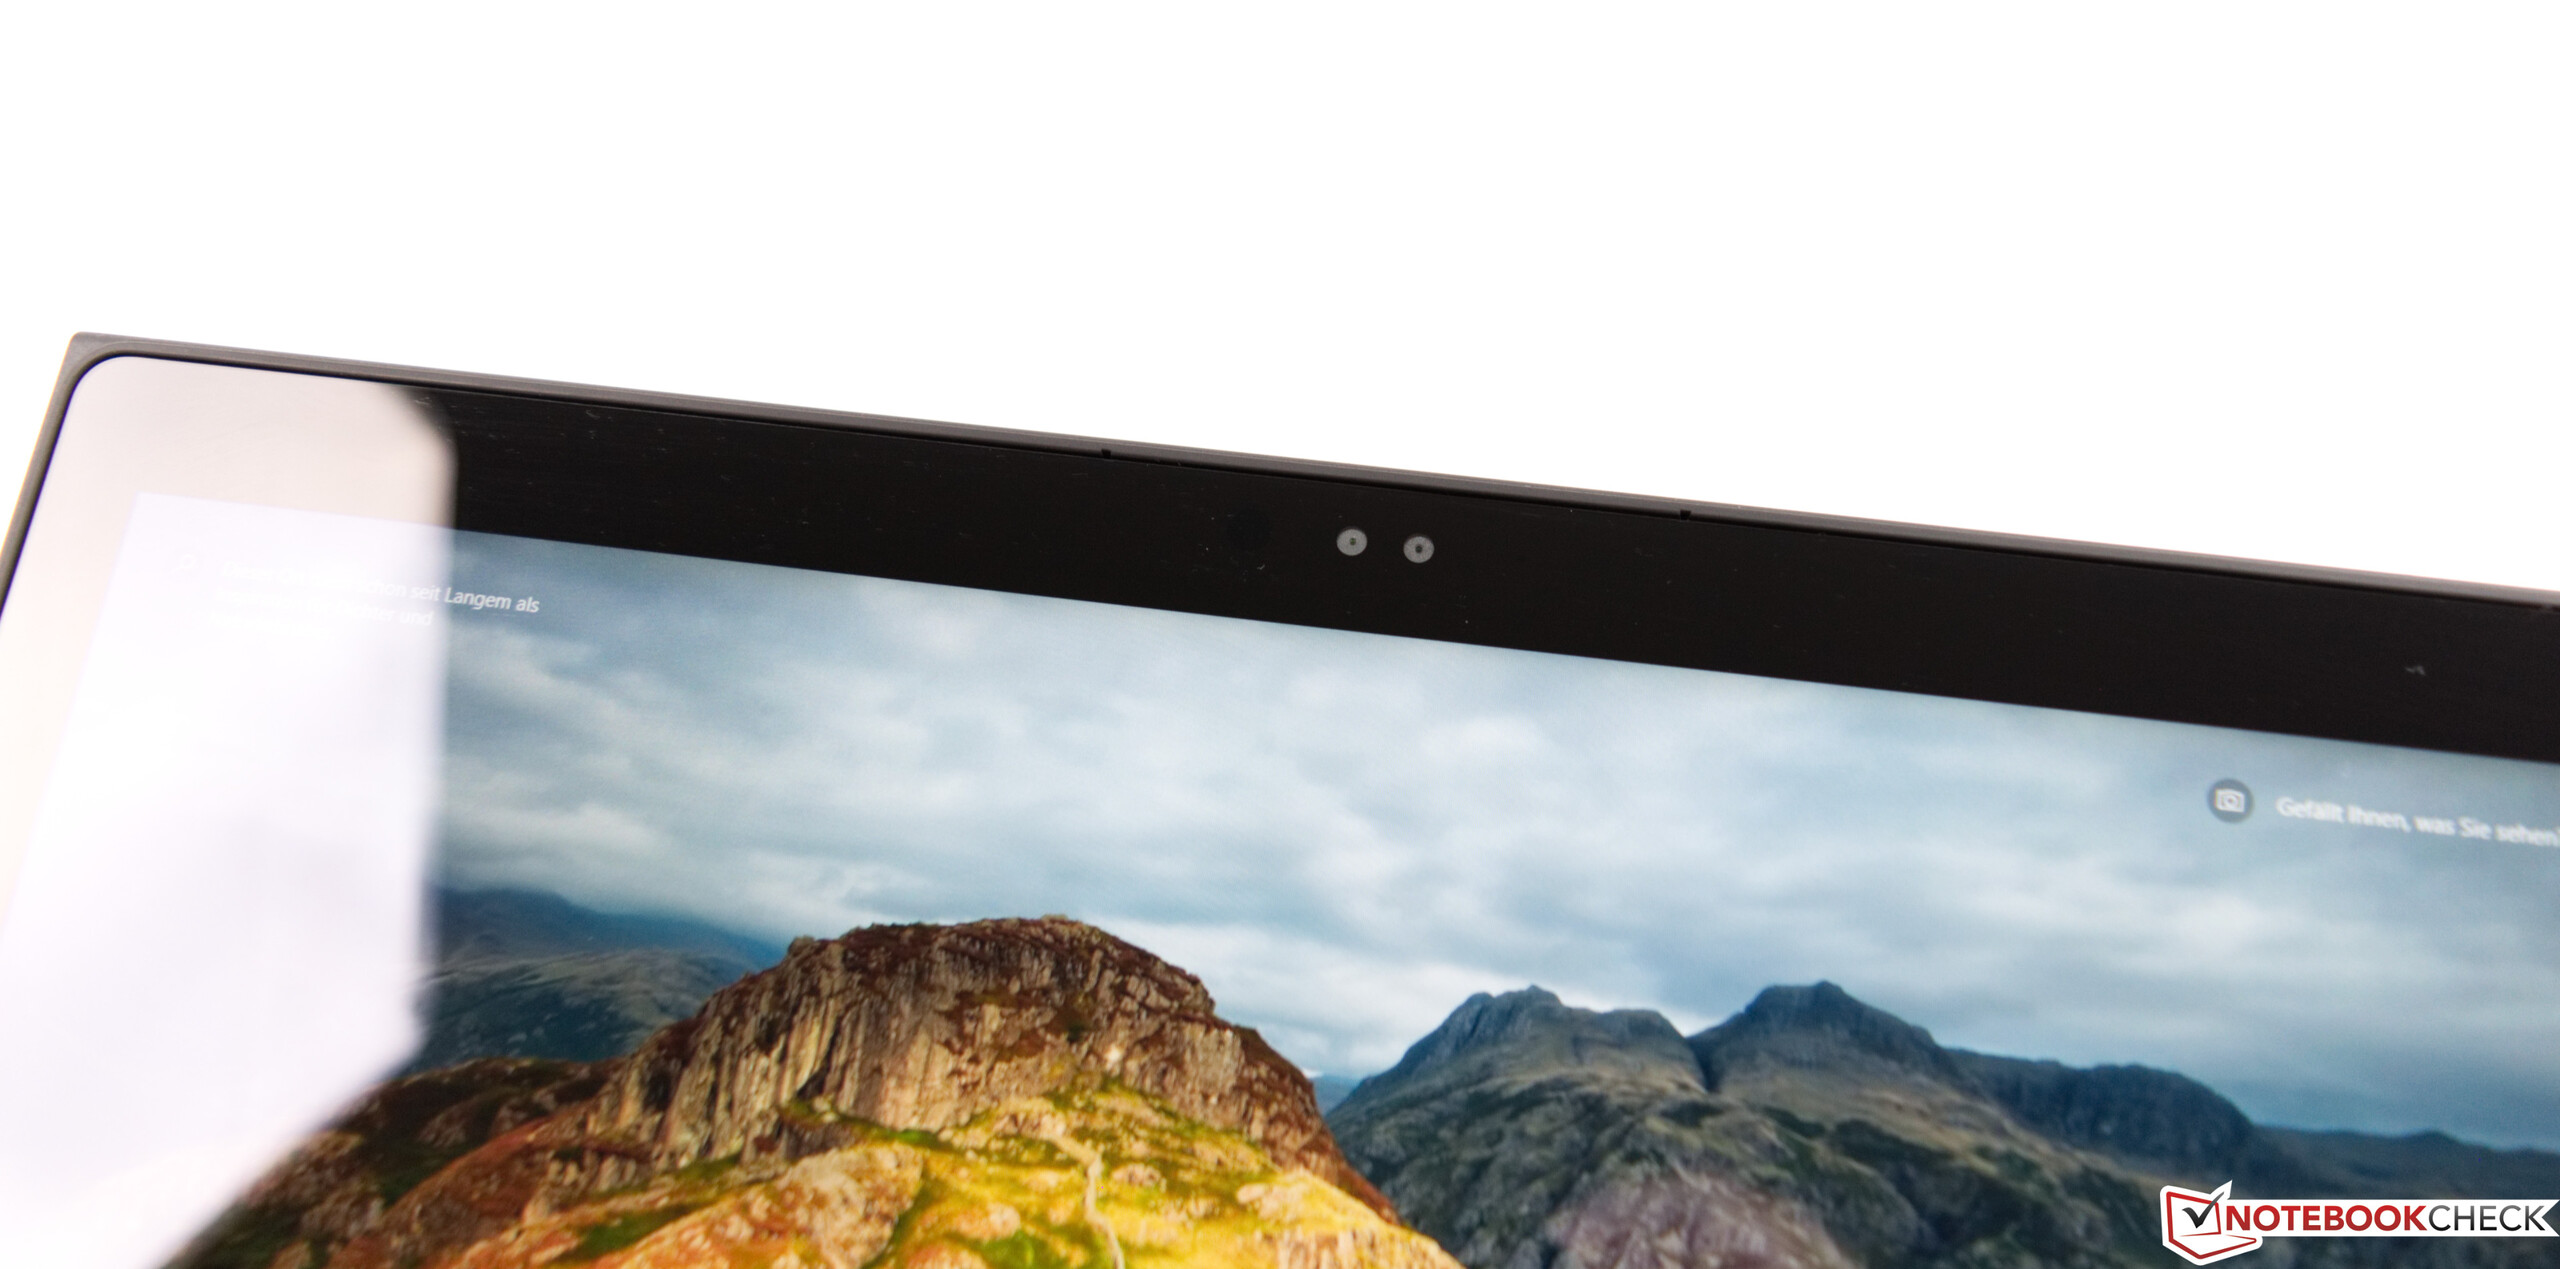
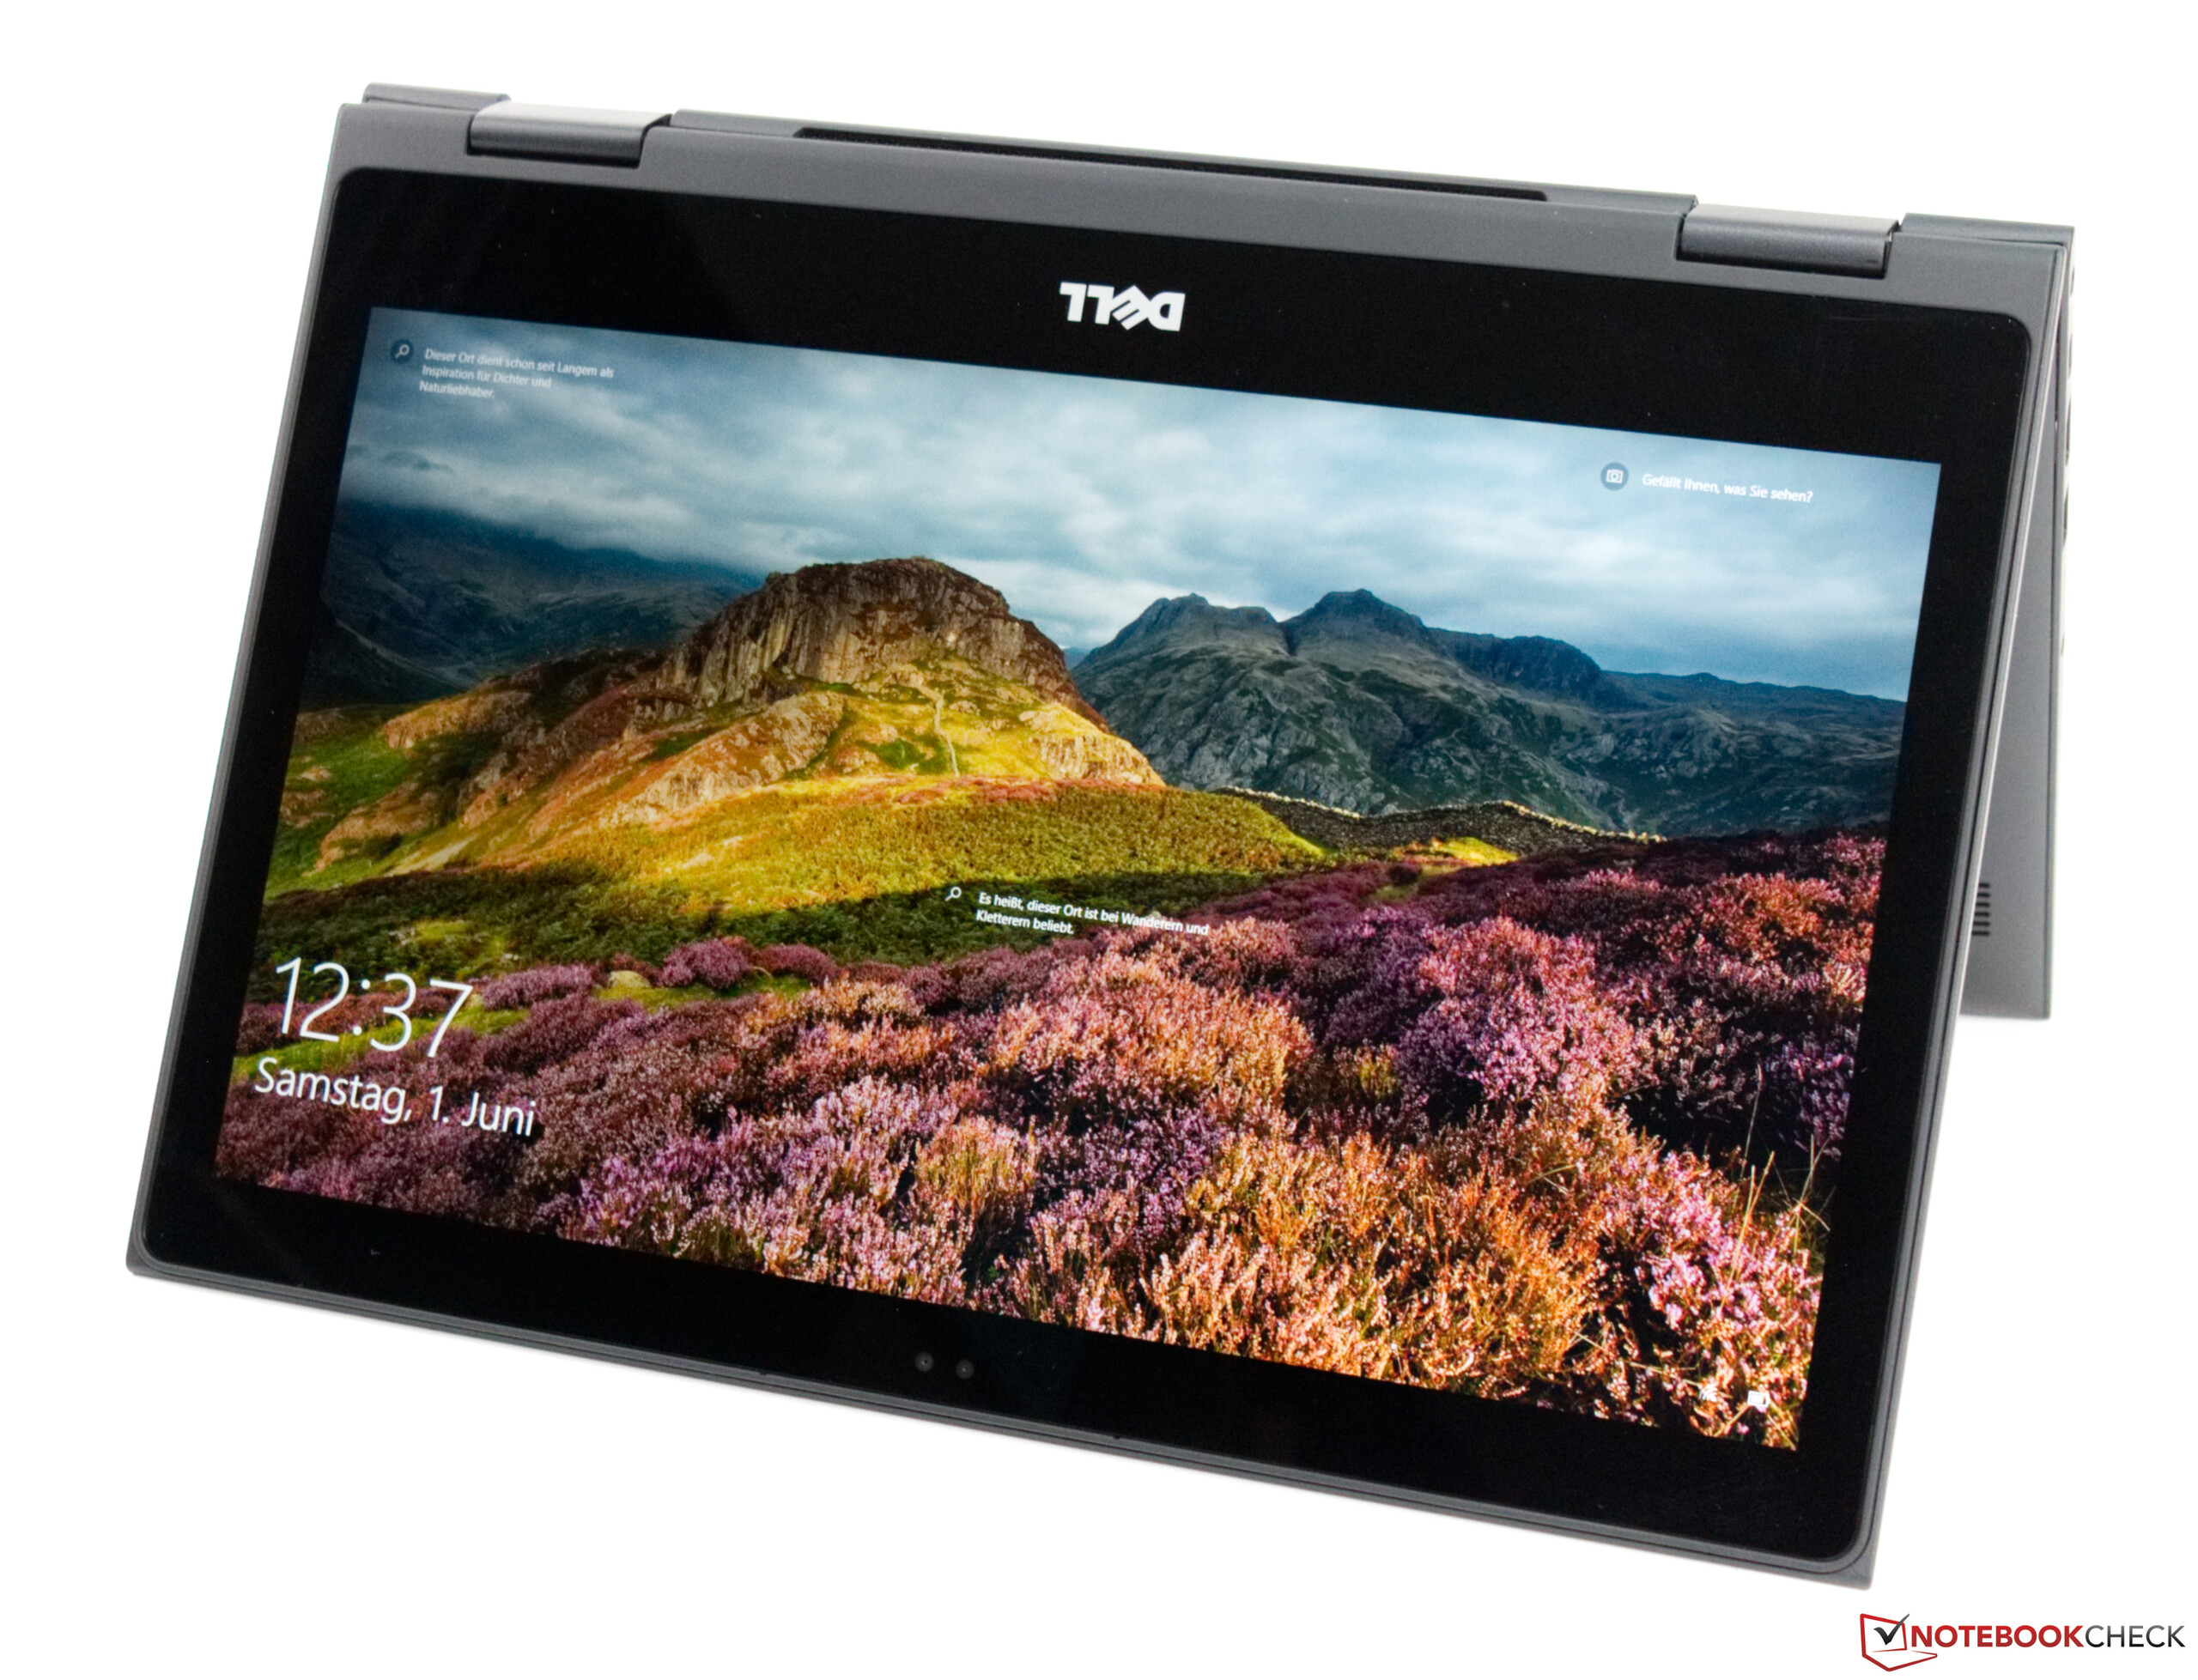
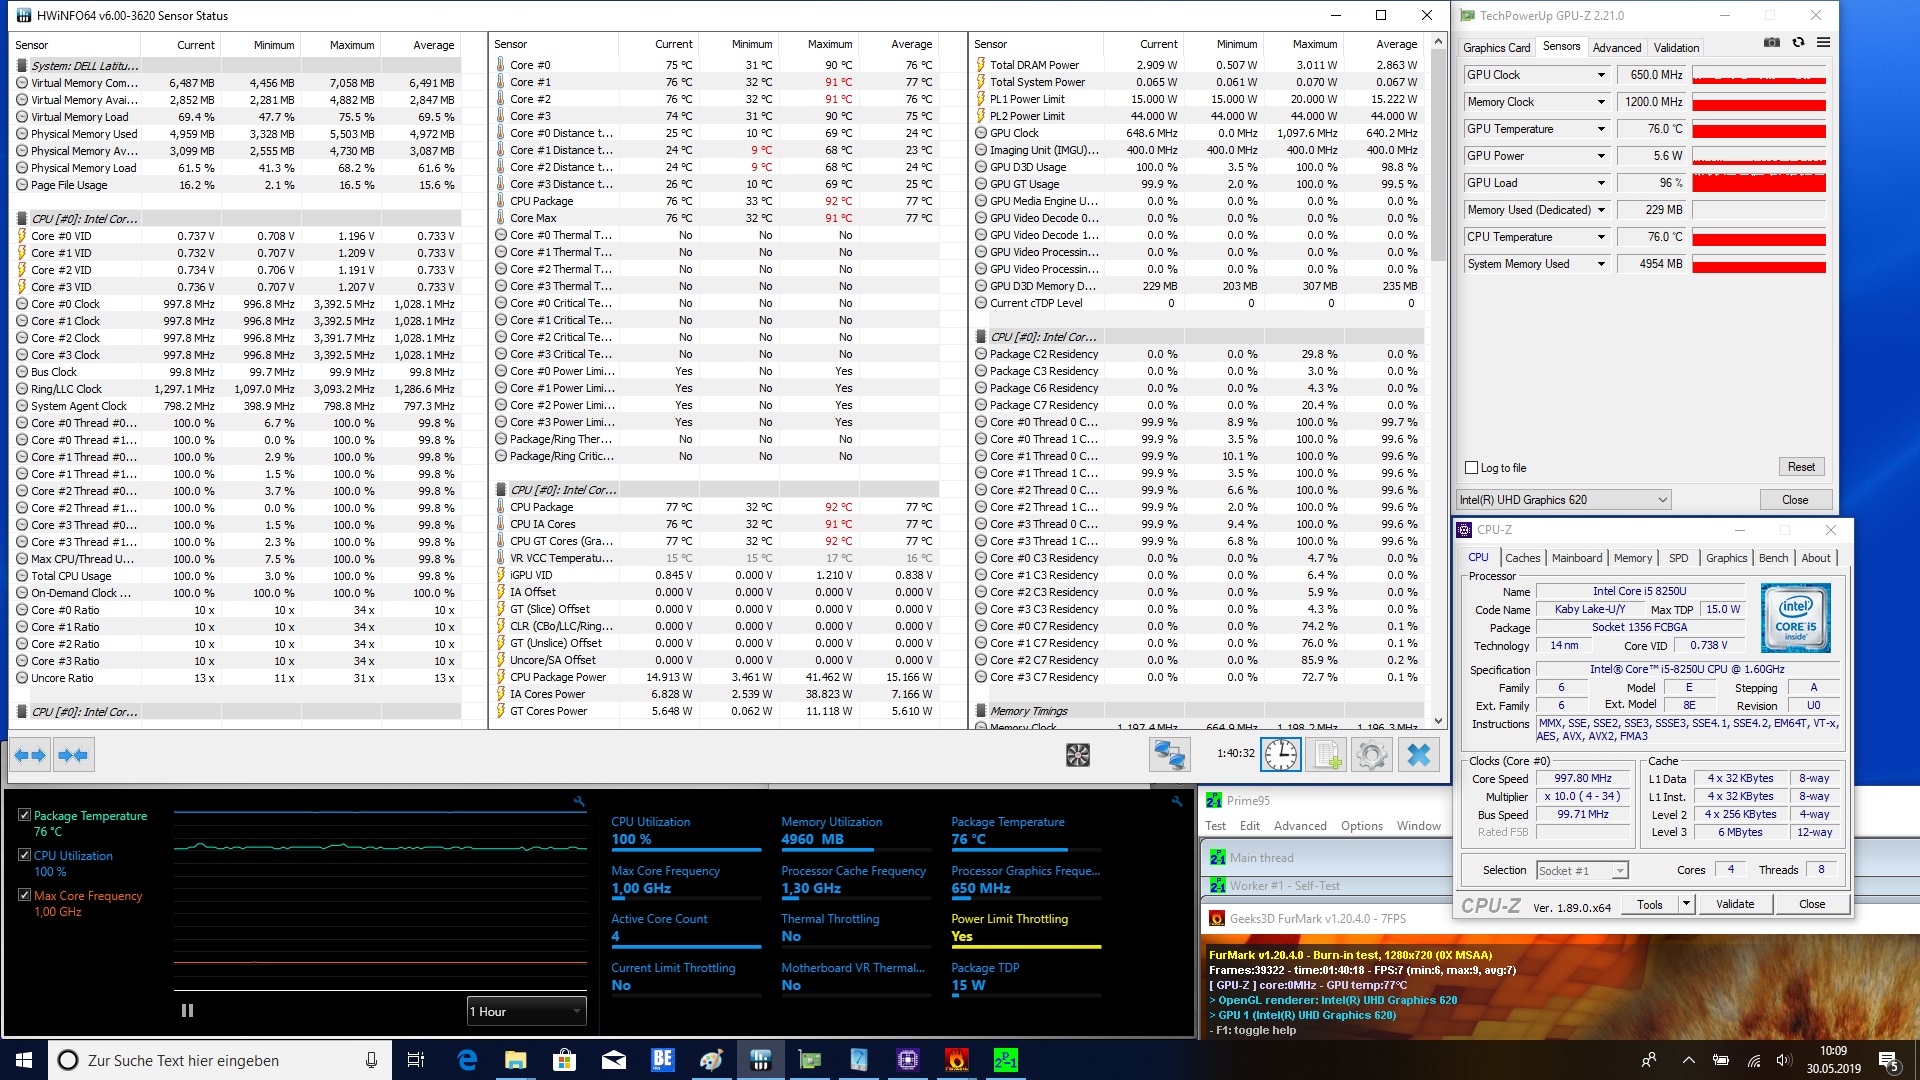
Den fyrkärniga Core i5-8250U processorn är tillräckligt kraftfull för de flesta krävande uppgifter, vilket också gäller datorns 8 GB RAM. Men de är inte framtidssäkrade och ger känslan av att Dell har släppt Latitude 3390 ett år för sent. Designen bidrar också till det intrycket. Den enkla designen kommer nog kännas elegant för en del, men den breda skärminfattningen ser utdaterad ut. Dell kunde lätt ha utrustat Latitude 3390 med en skärm på 14 tum i samma chassi.
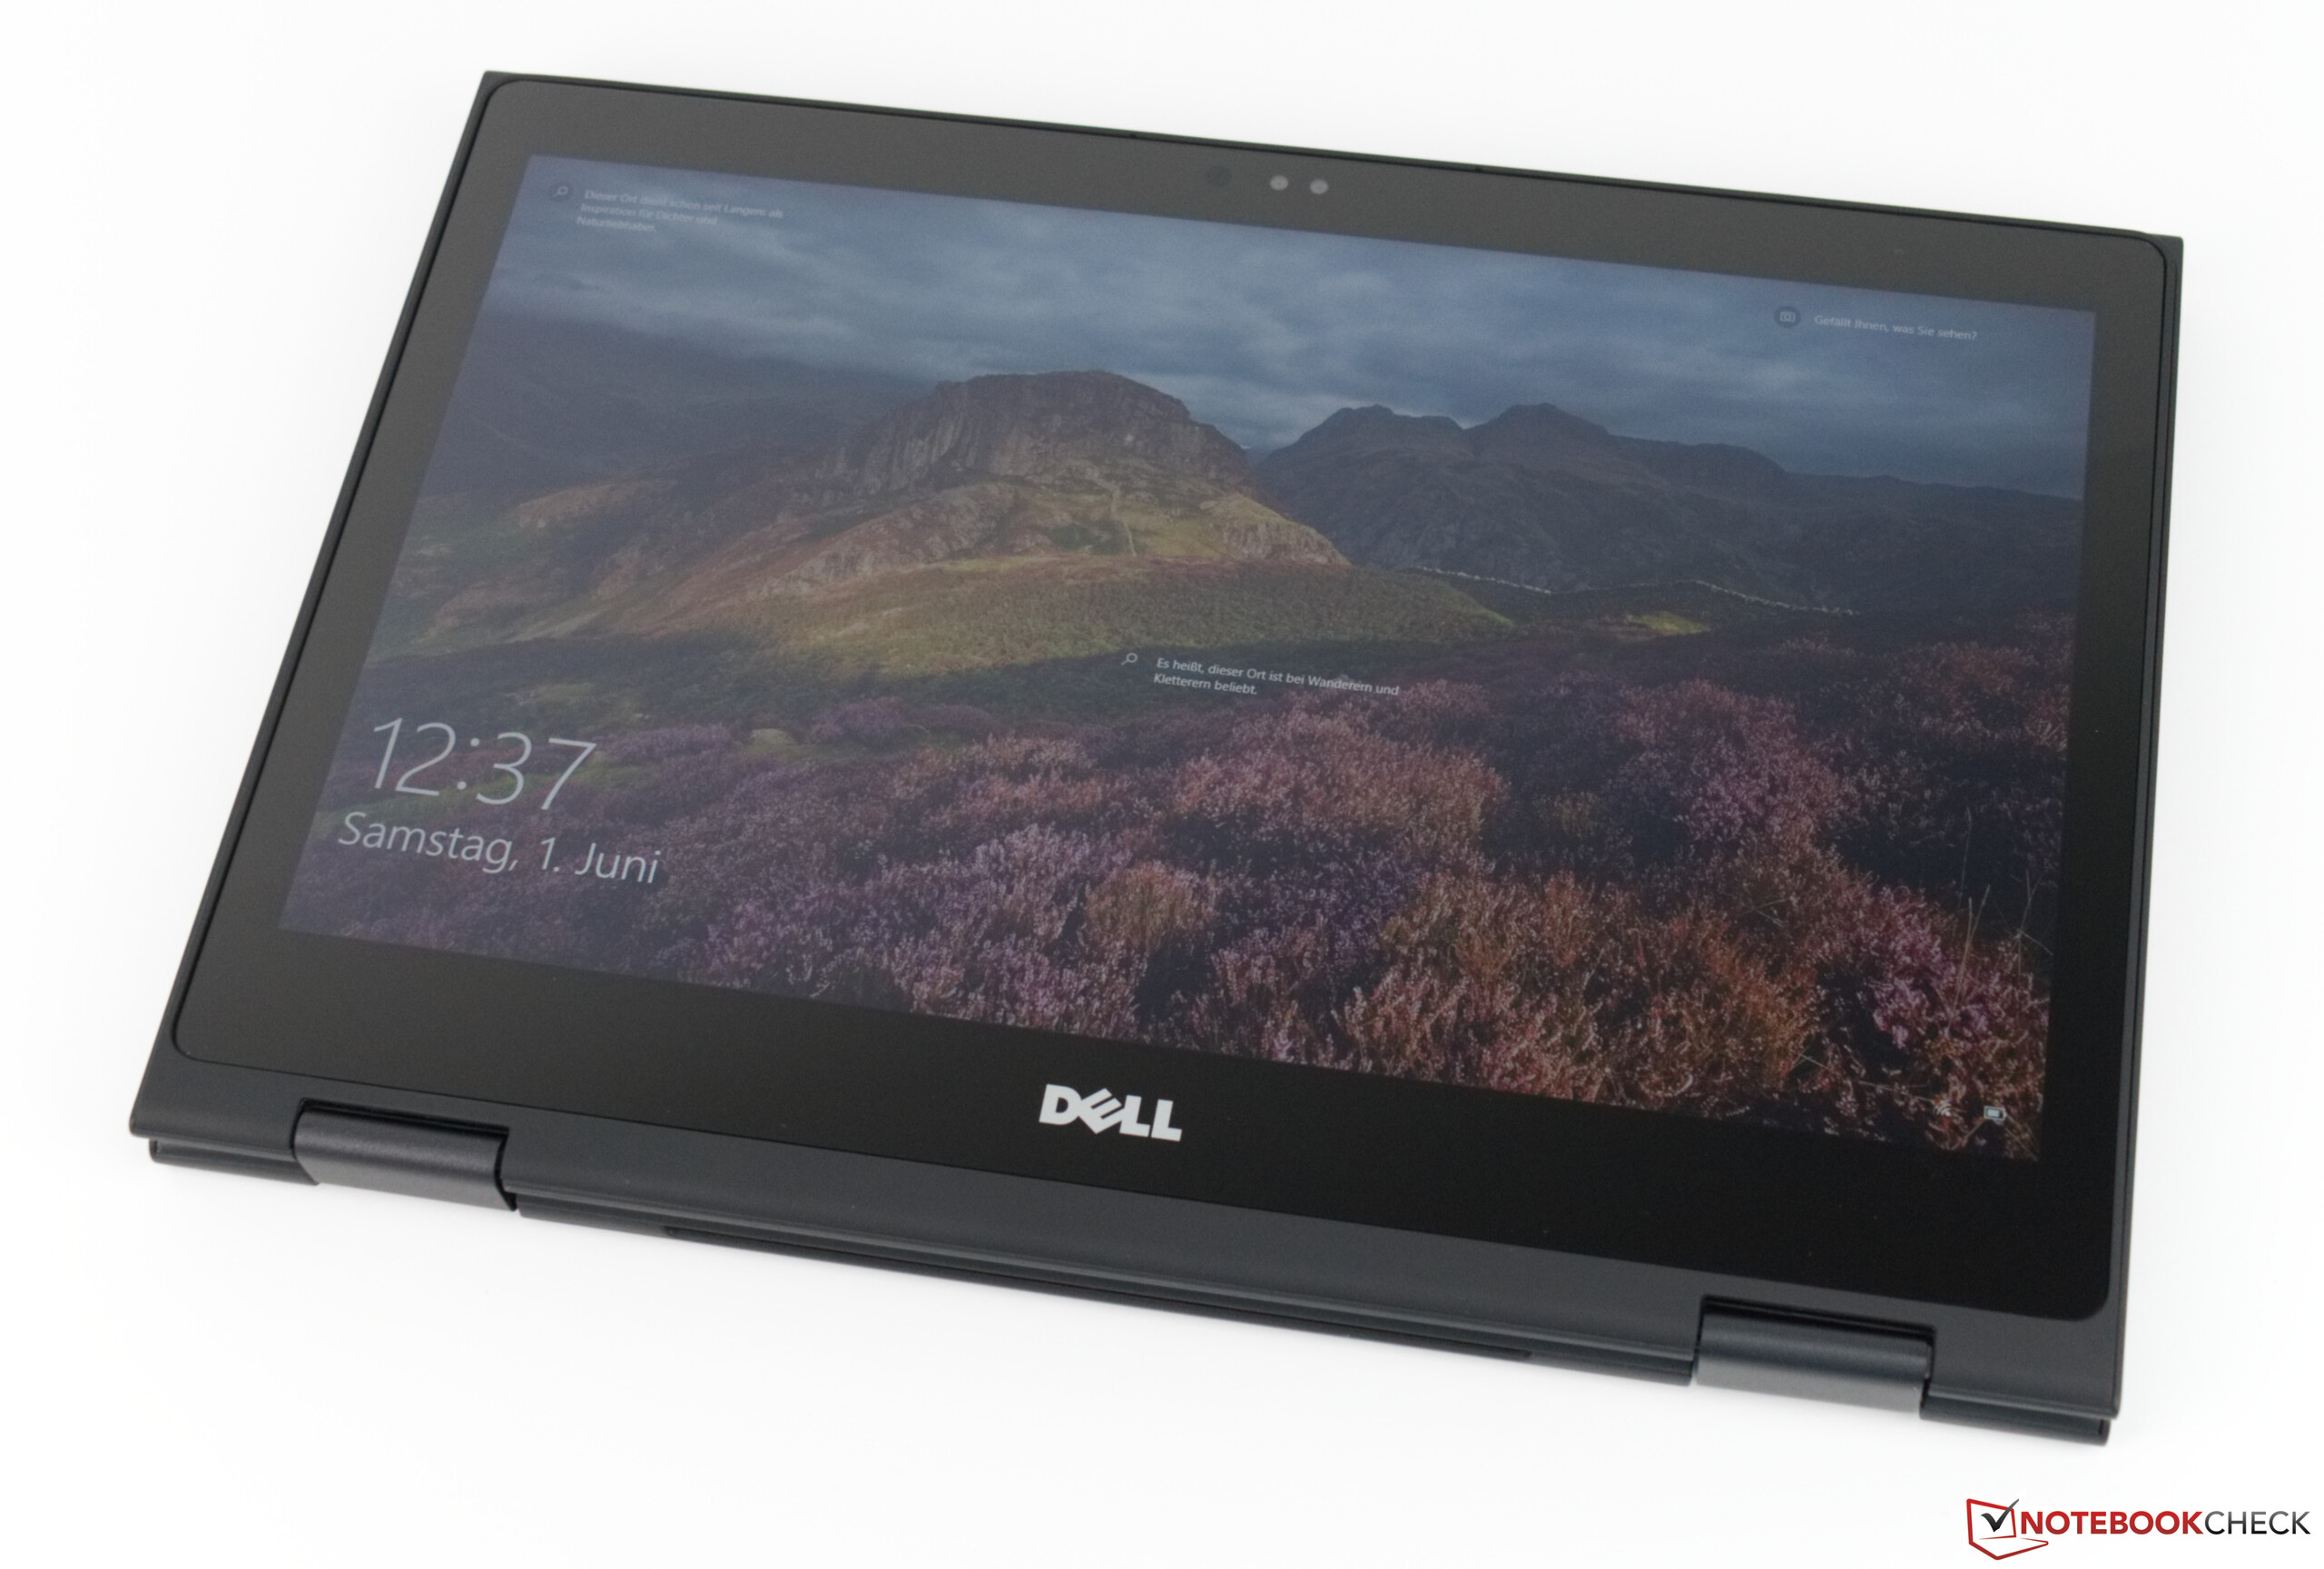
När det ändå diskuteras så är skärmen en av de största bristerna med Latitude 3390. Den är helt enkelt för mörk, vilket gör det krångligt att använda datorn utomhus. På samma sätt är färgrymdstäckningen i vårt tycke för låg för en företagsenhet.
Dell Latitude 3390 lämnar ett tvetydigt intryck. Det finns inget unikt med den och den möter inte de krav som ställs på en omvandlingsbar företagsmaskin.
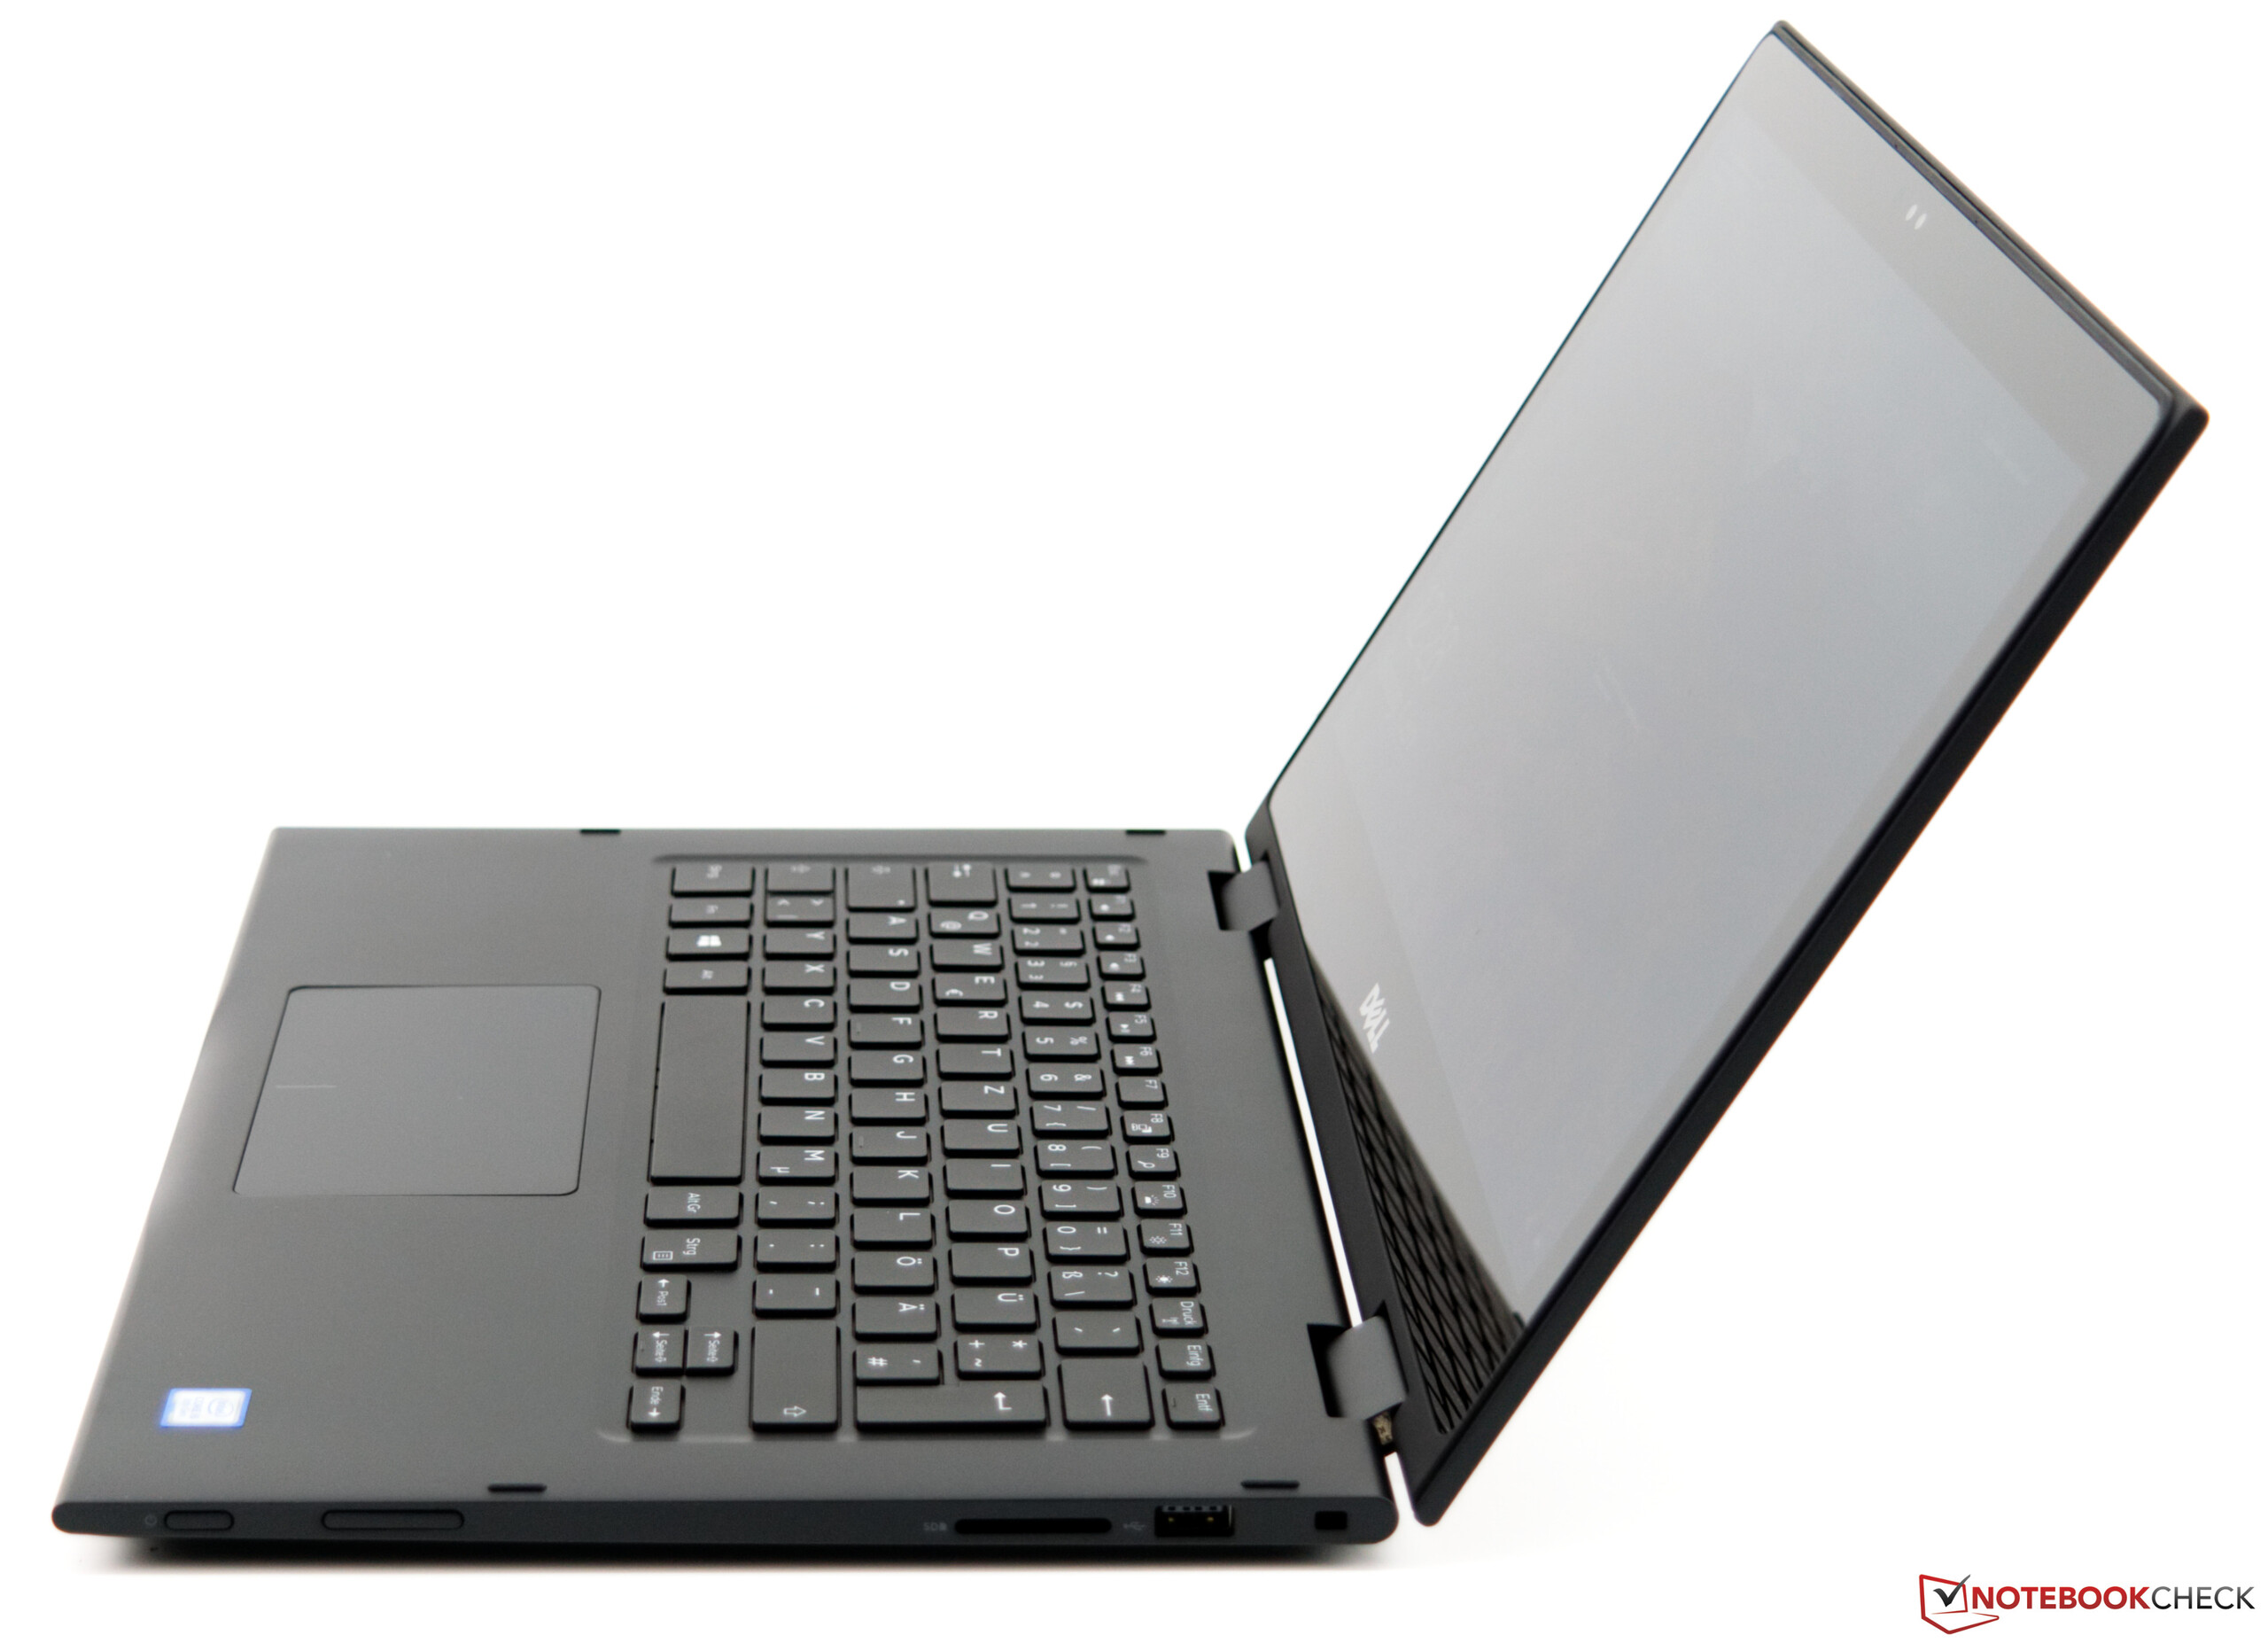
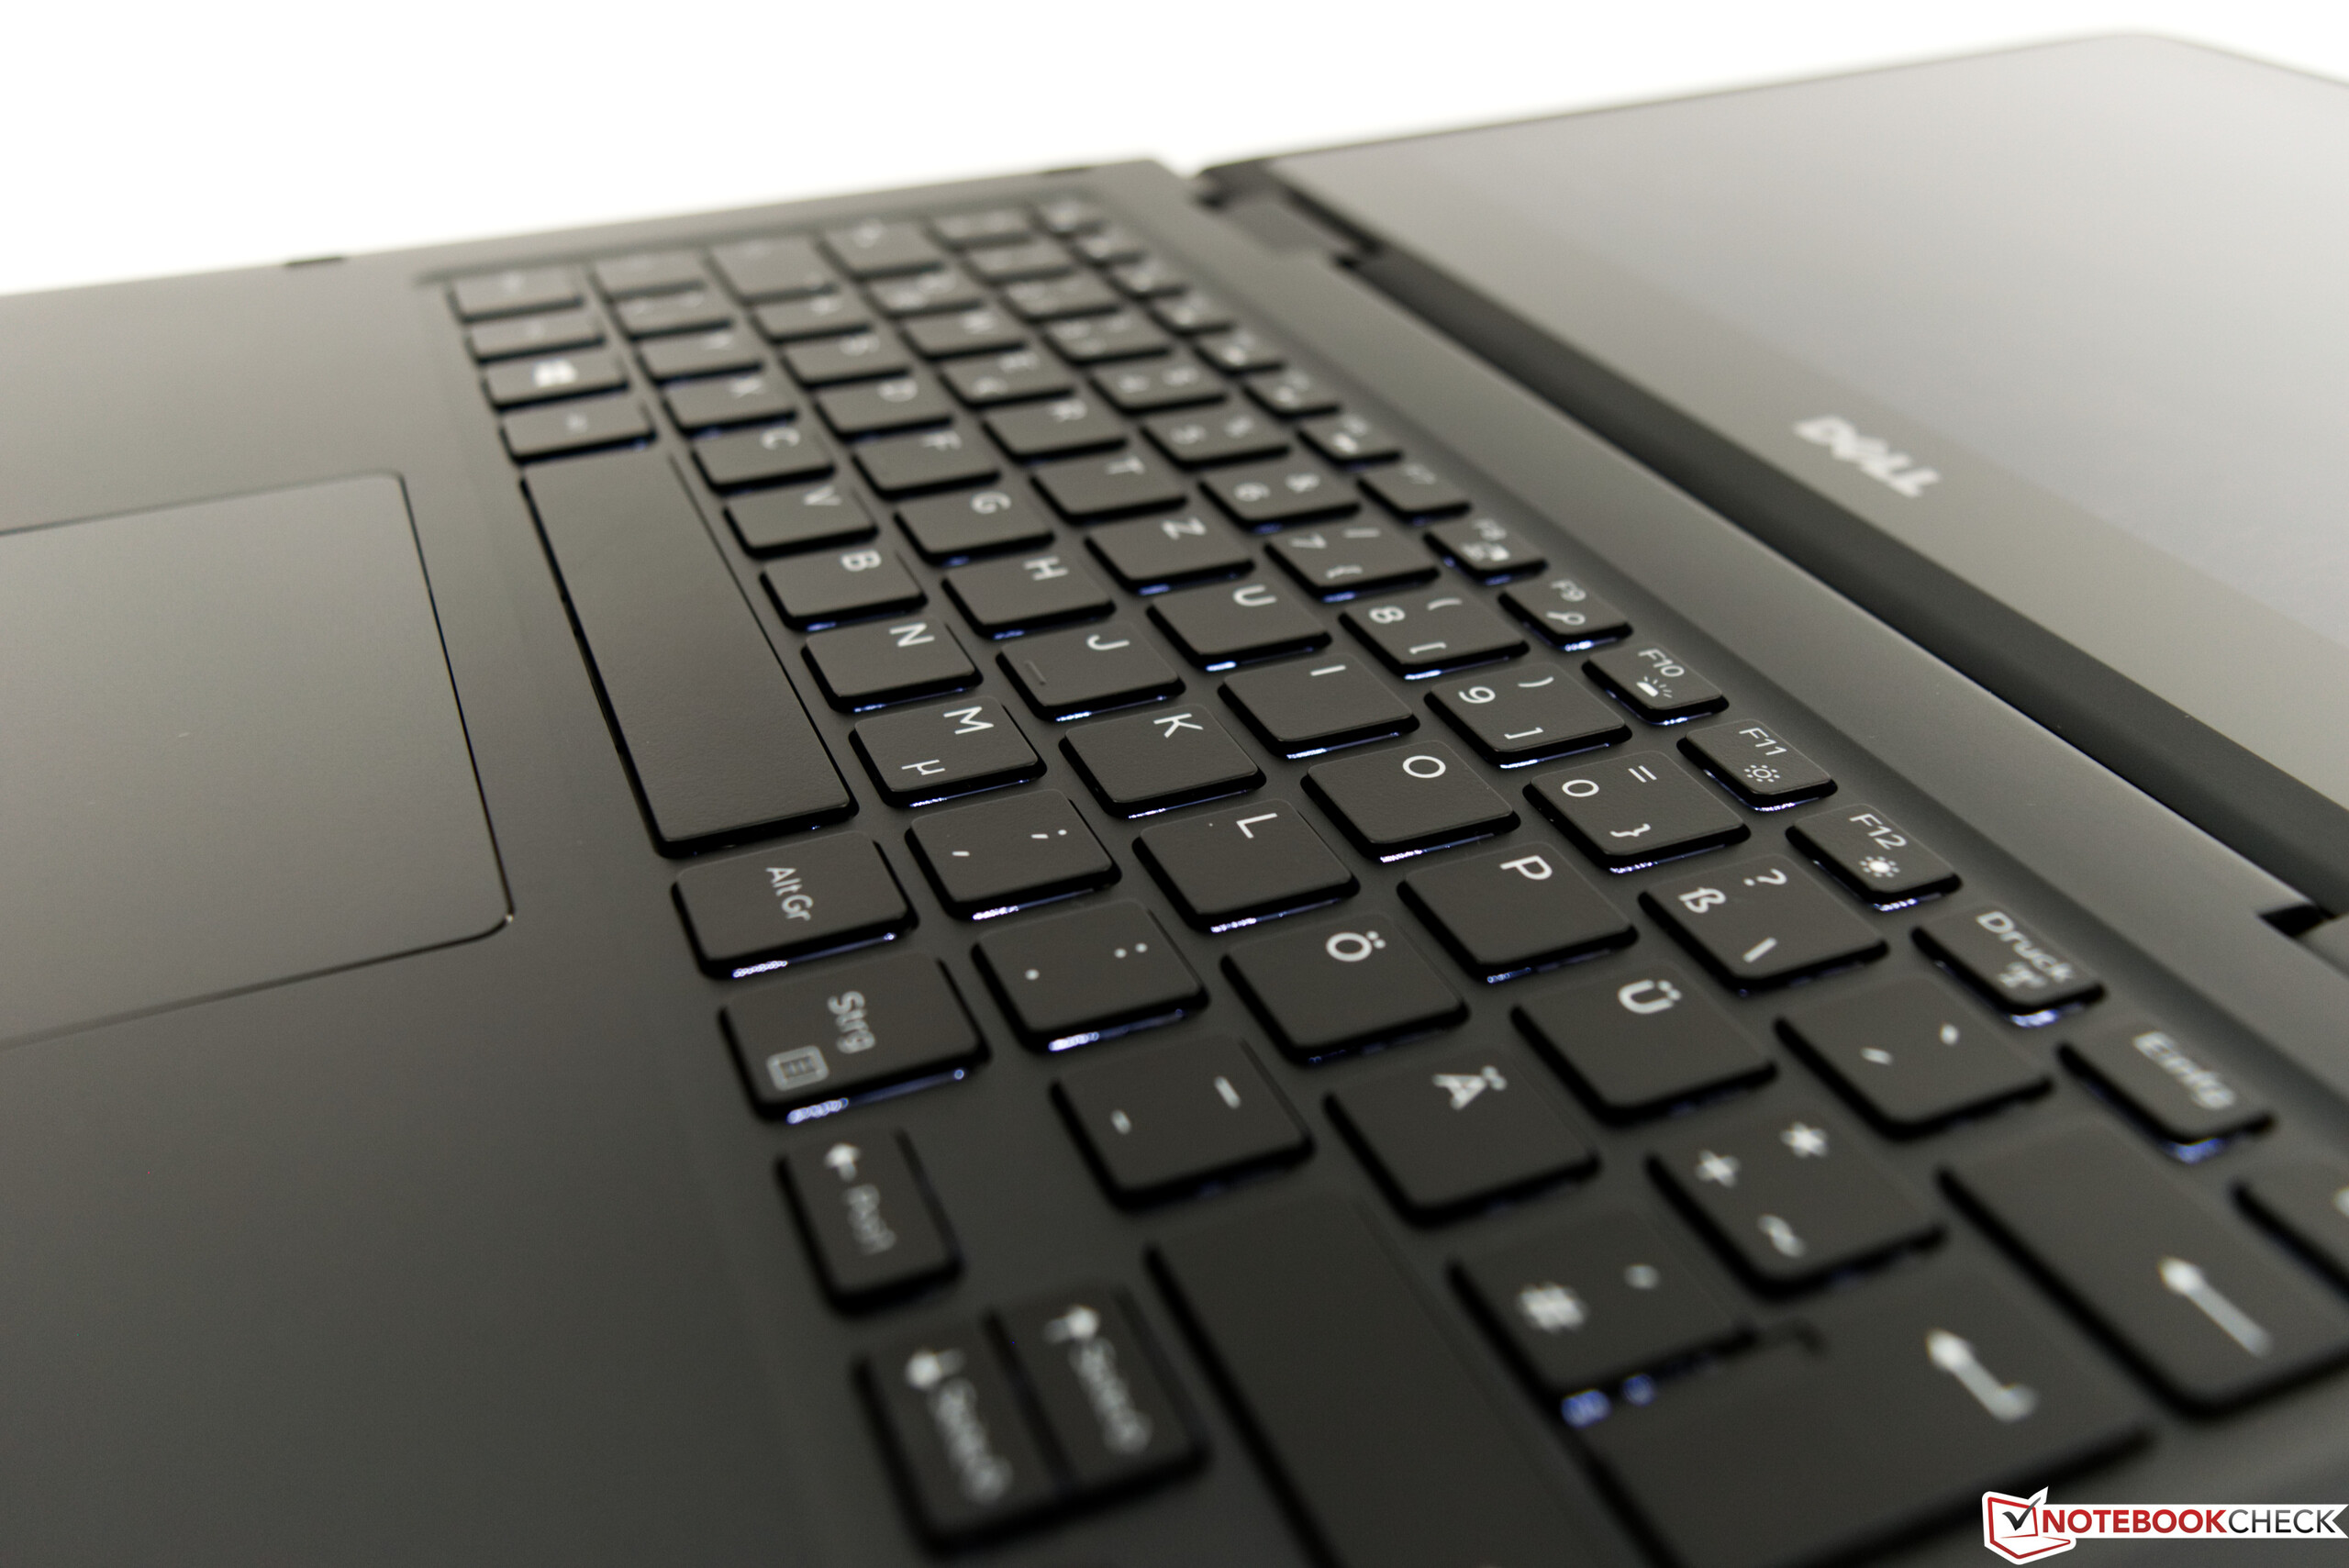
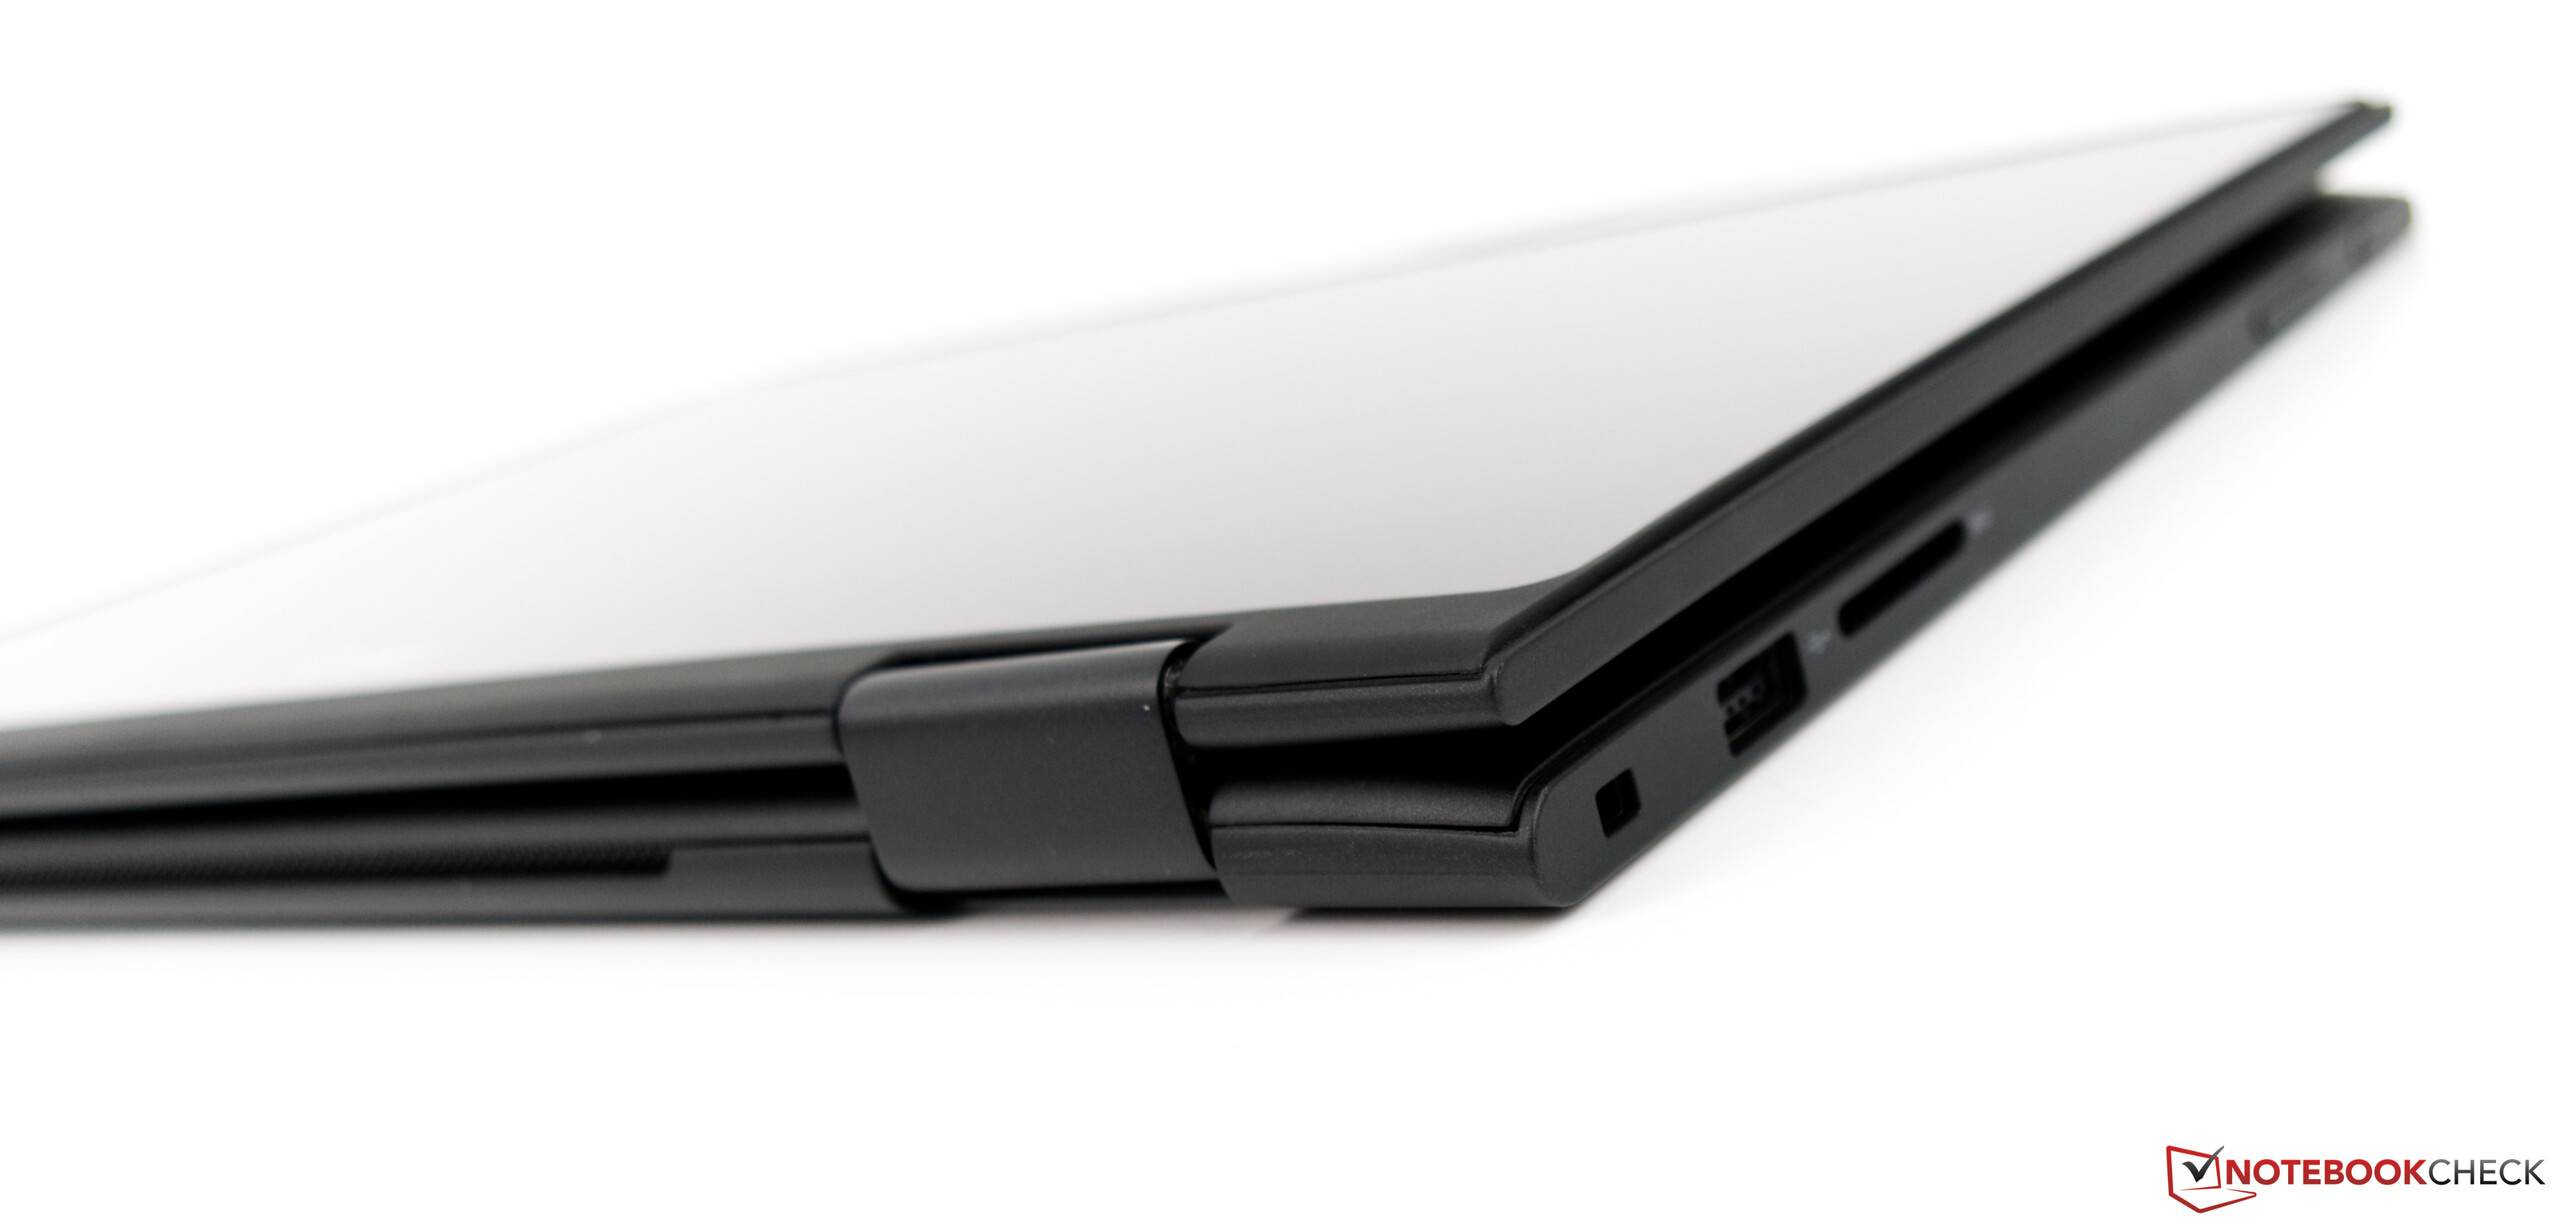
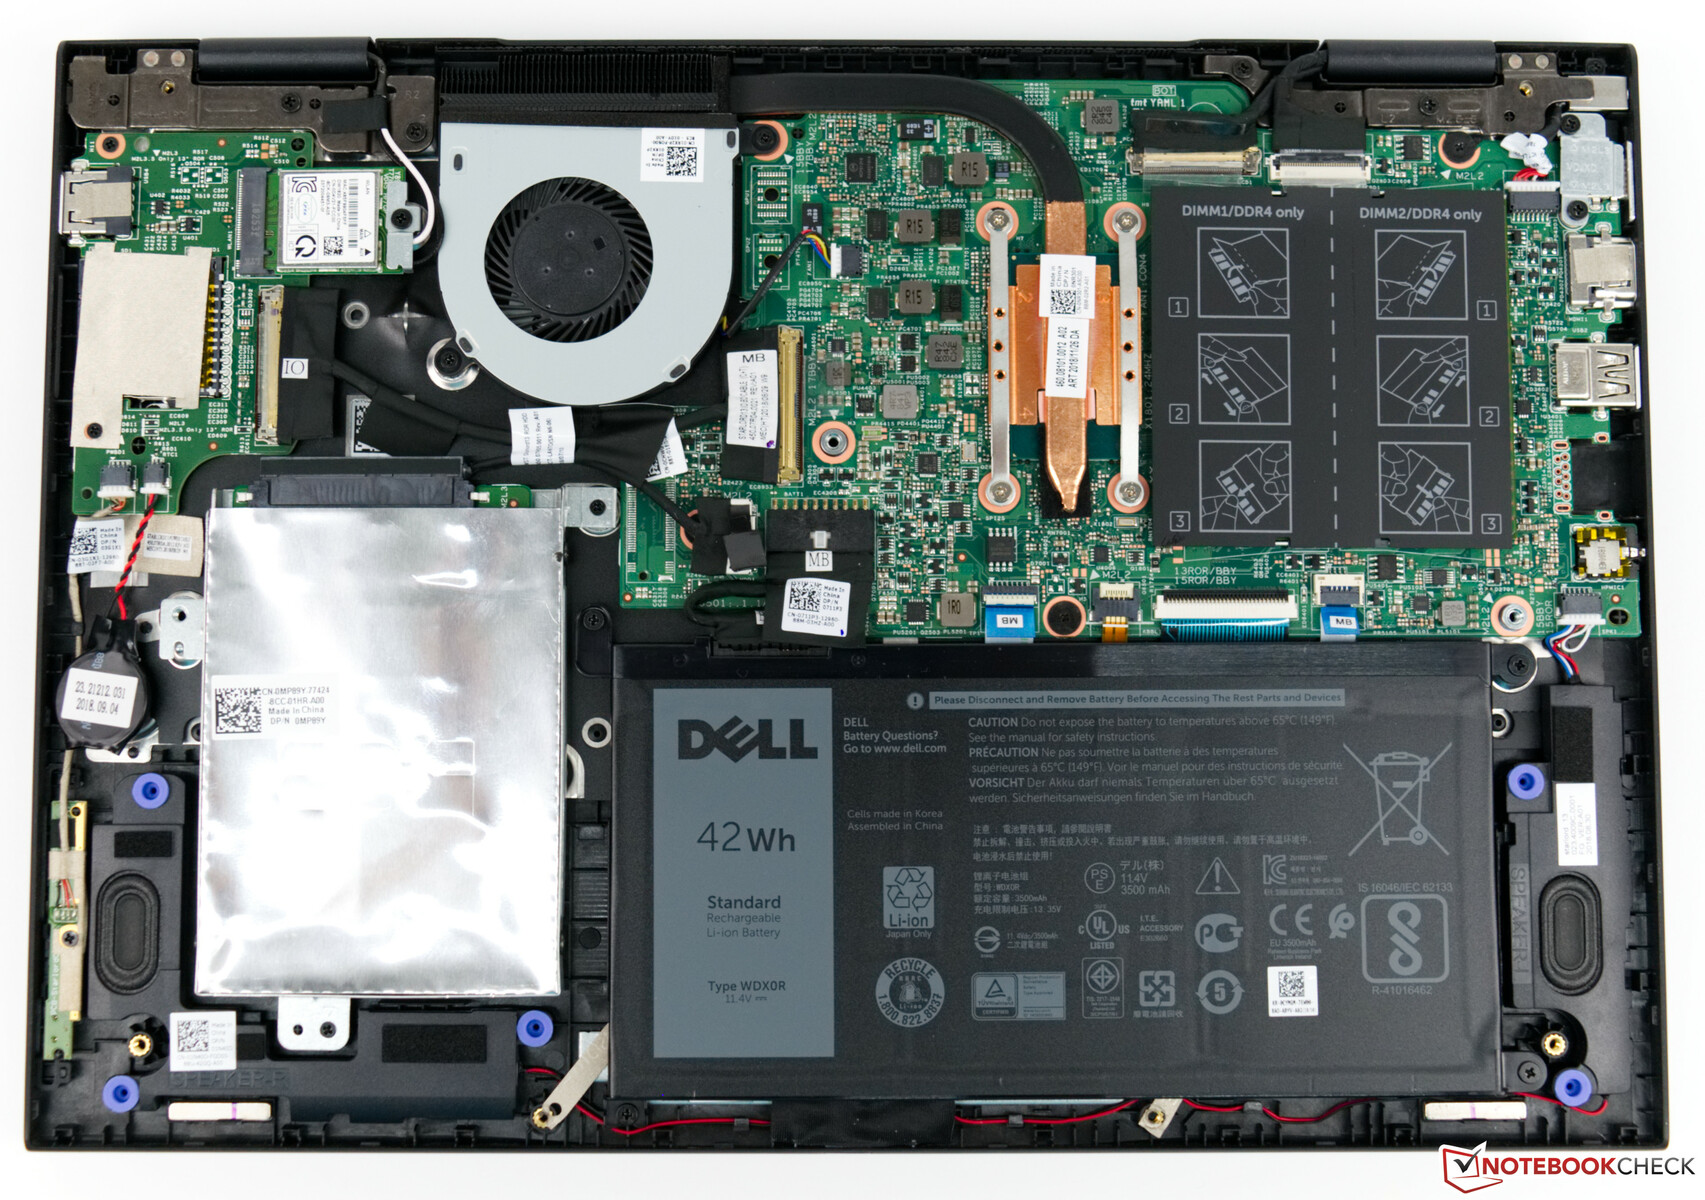
Allt är dock inte dåliga nyheter. Dell har byggt Latitude 3390 av återvunnen kolfiber, vilket gör att vår recensionsenhet känns robust. På samma gång gör det att vikten ligger under 1.6 kg. Den tryckkänsliga skärmen, styrplattan och tangentbordet är alla skapliga, även om det sistnämnda inte är på samma nivå som på ThinkPad-konkurrenterna. Latitude 3390 är dessutom imponerande energieffektiv och har fylliga högtalare, men dessa egenskaper lär glömmas bort så fort man ser skärmen.
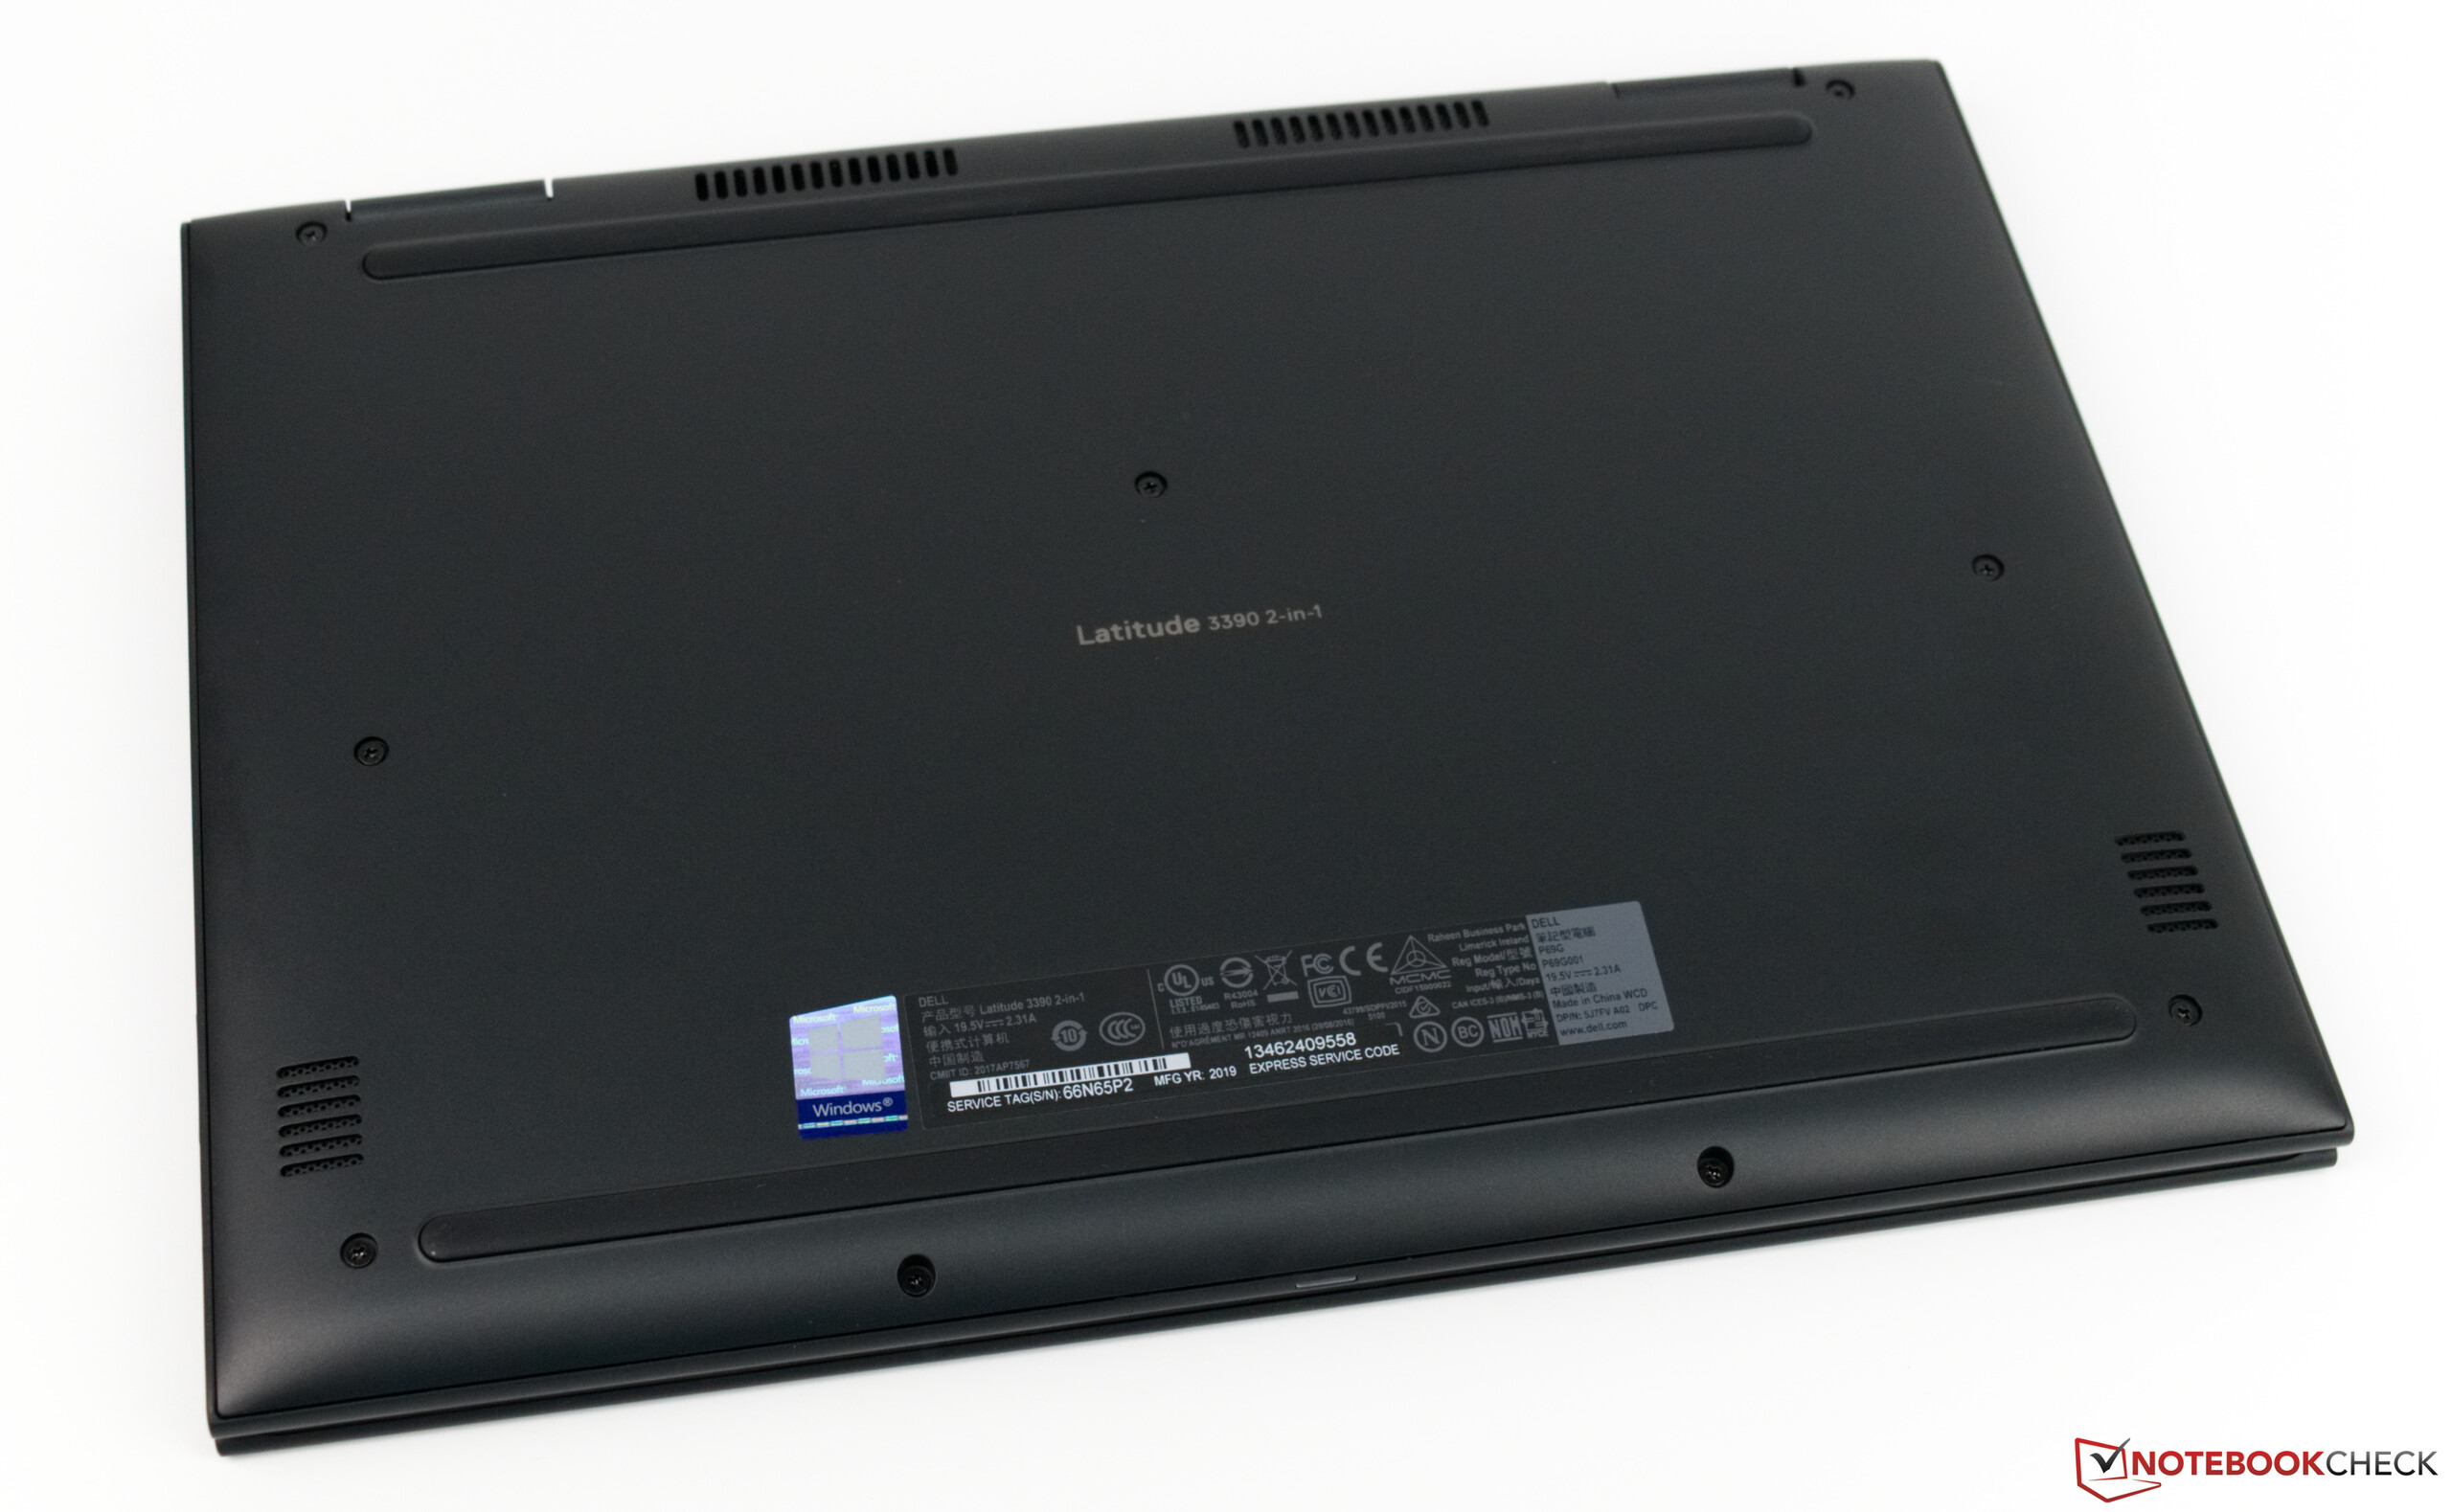
Dell Latitude 13 3390
- 06/11/2019 v6 (old)
Sebastian Bade
Price comparison
