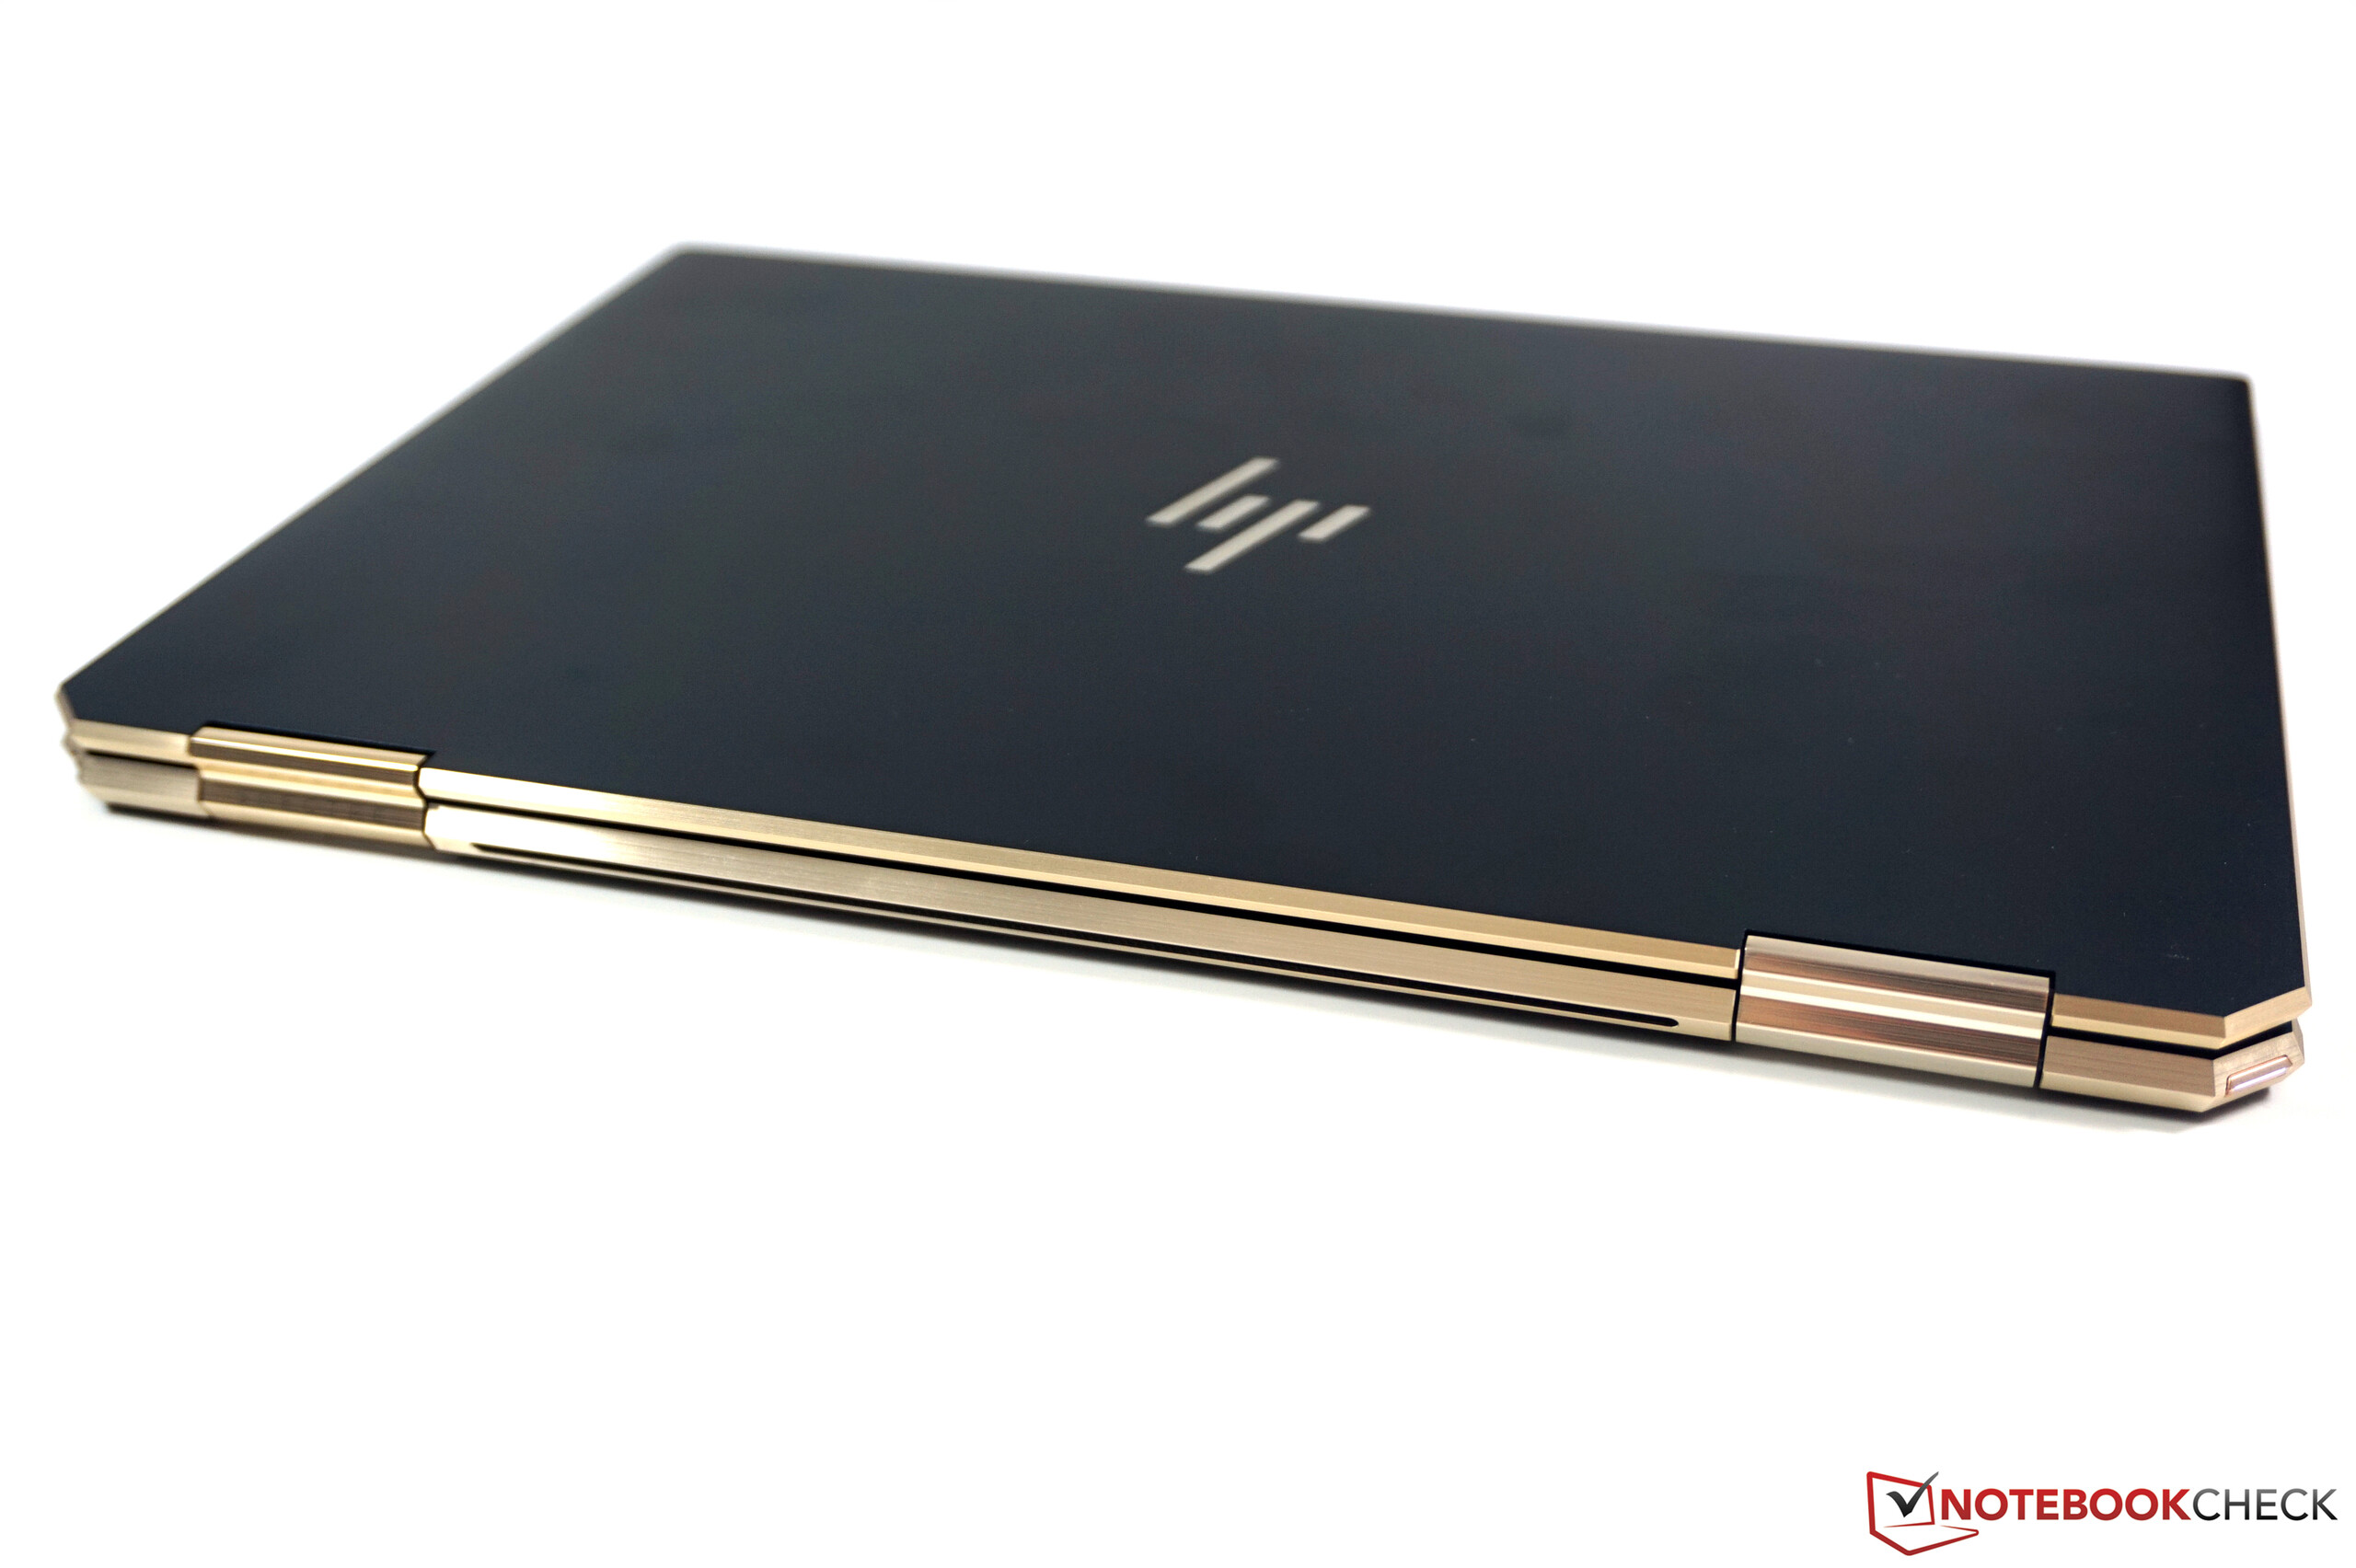
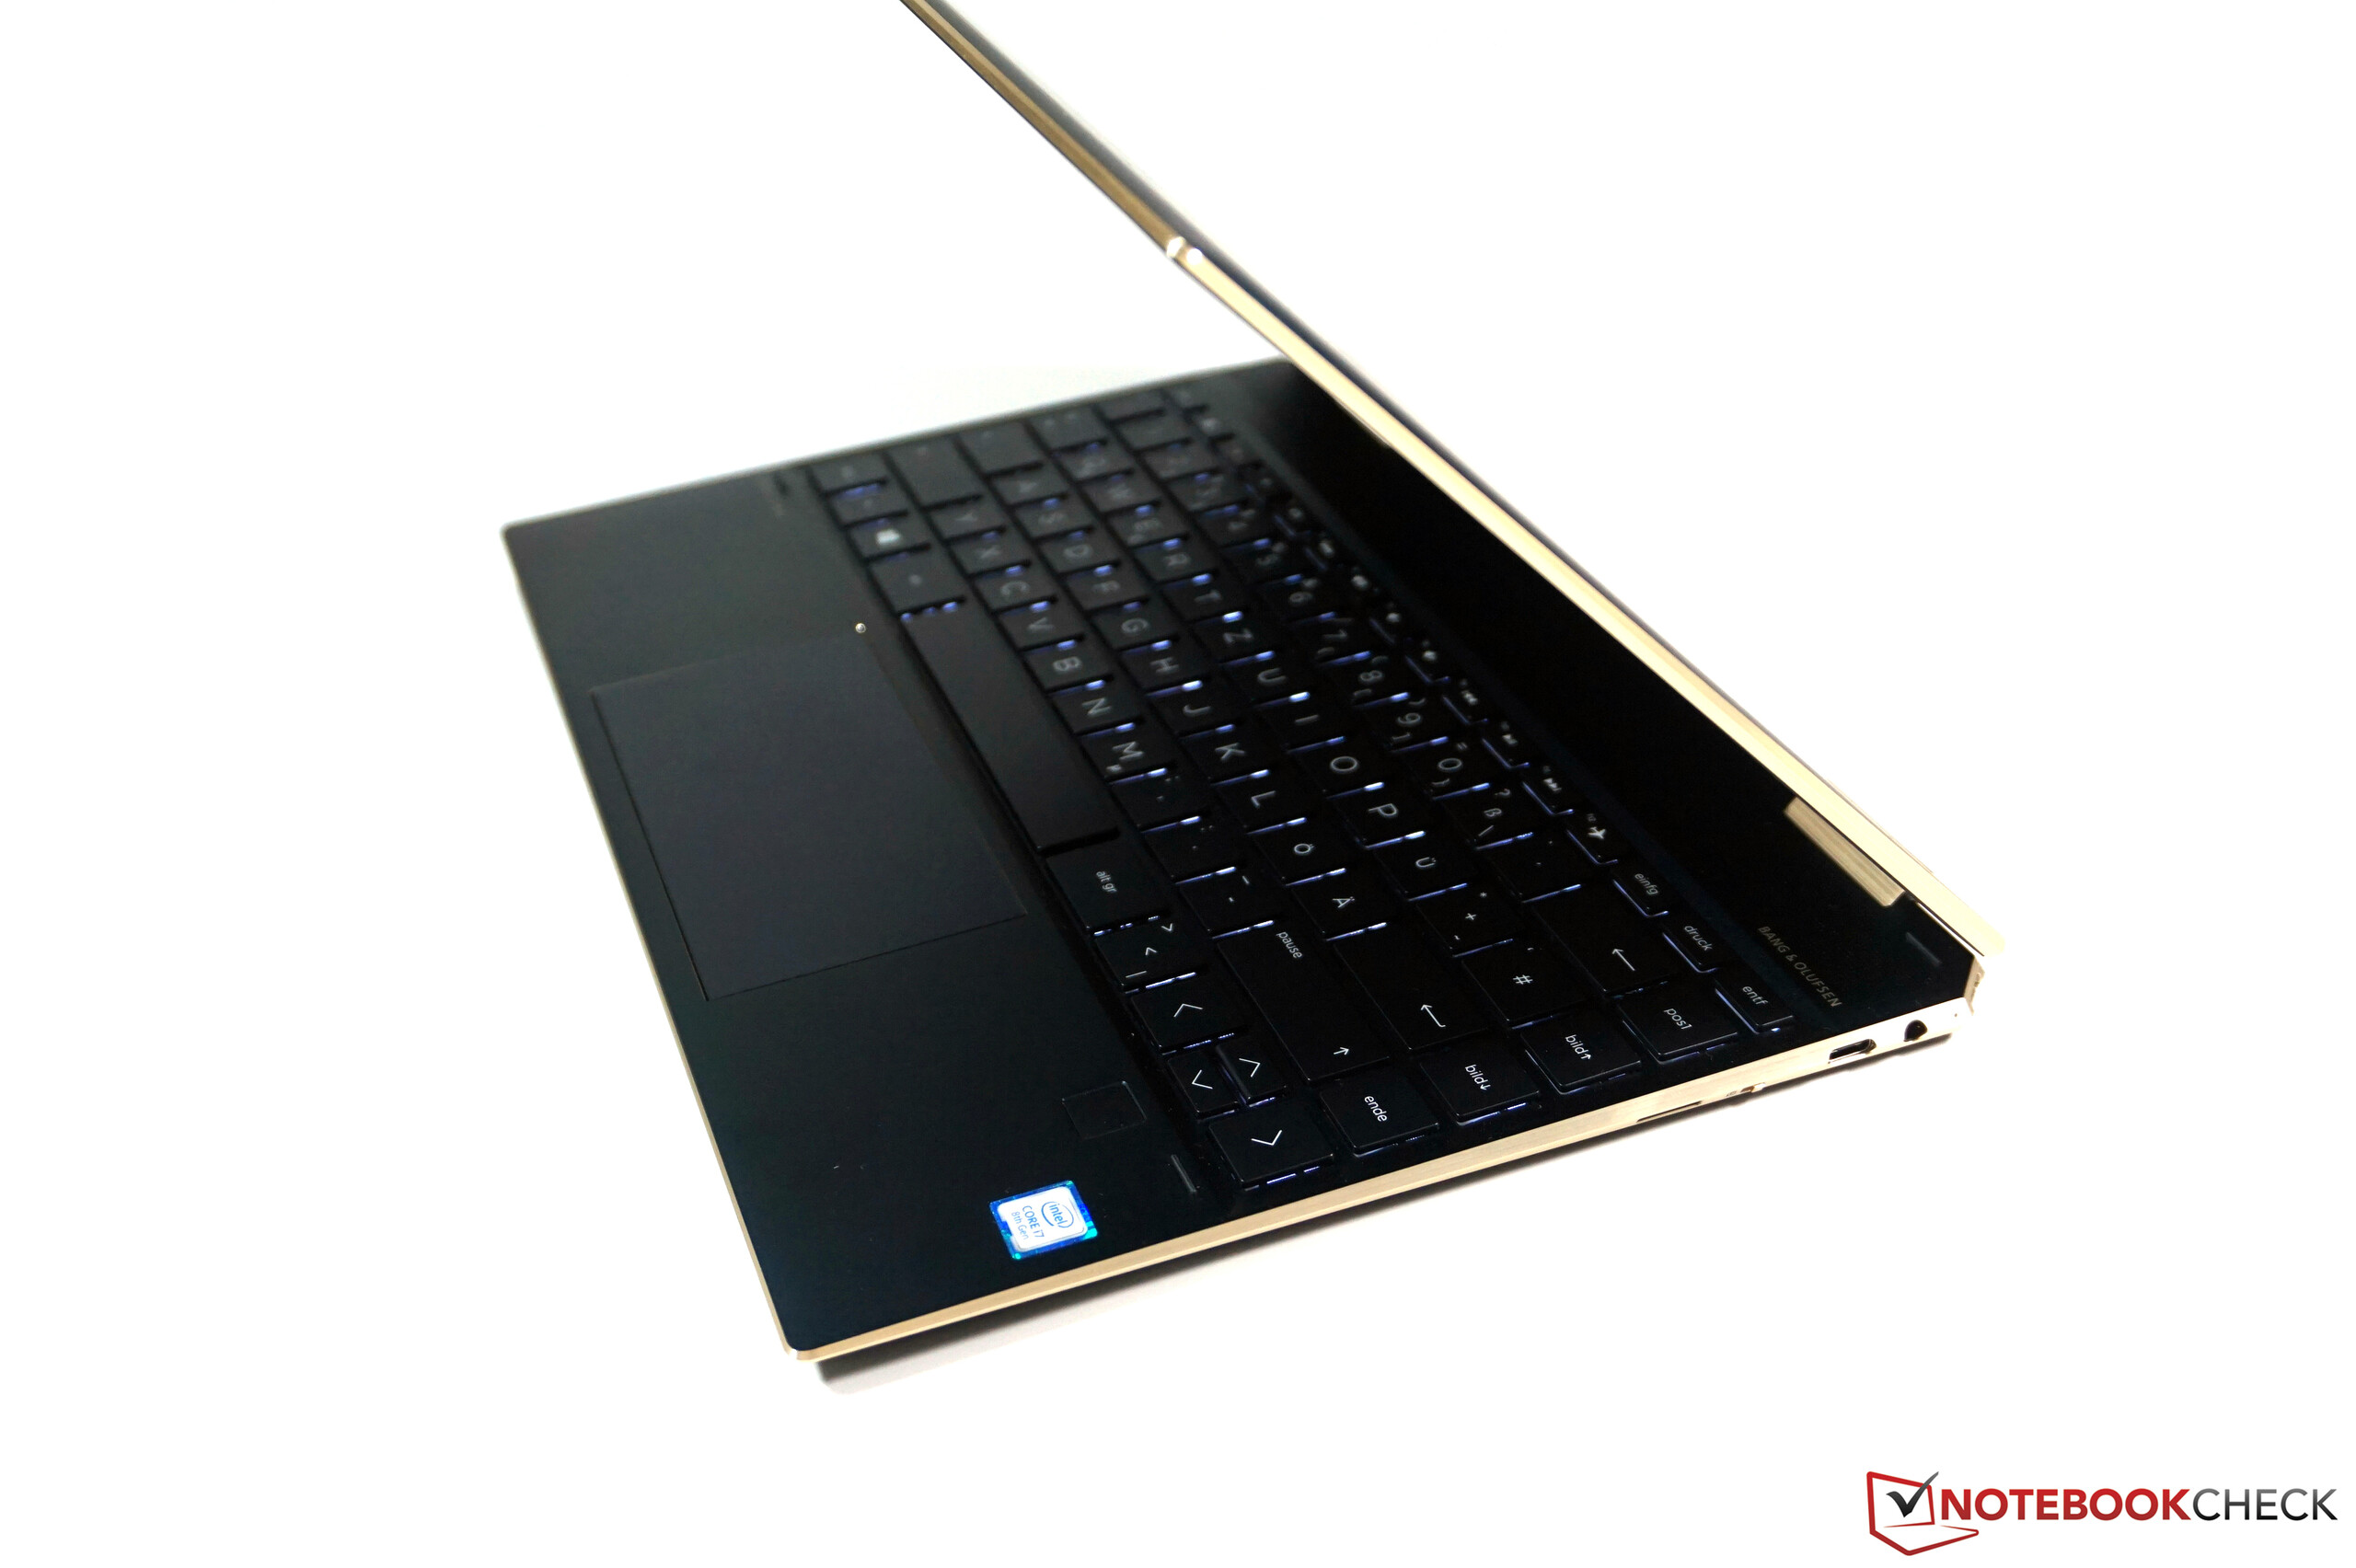
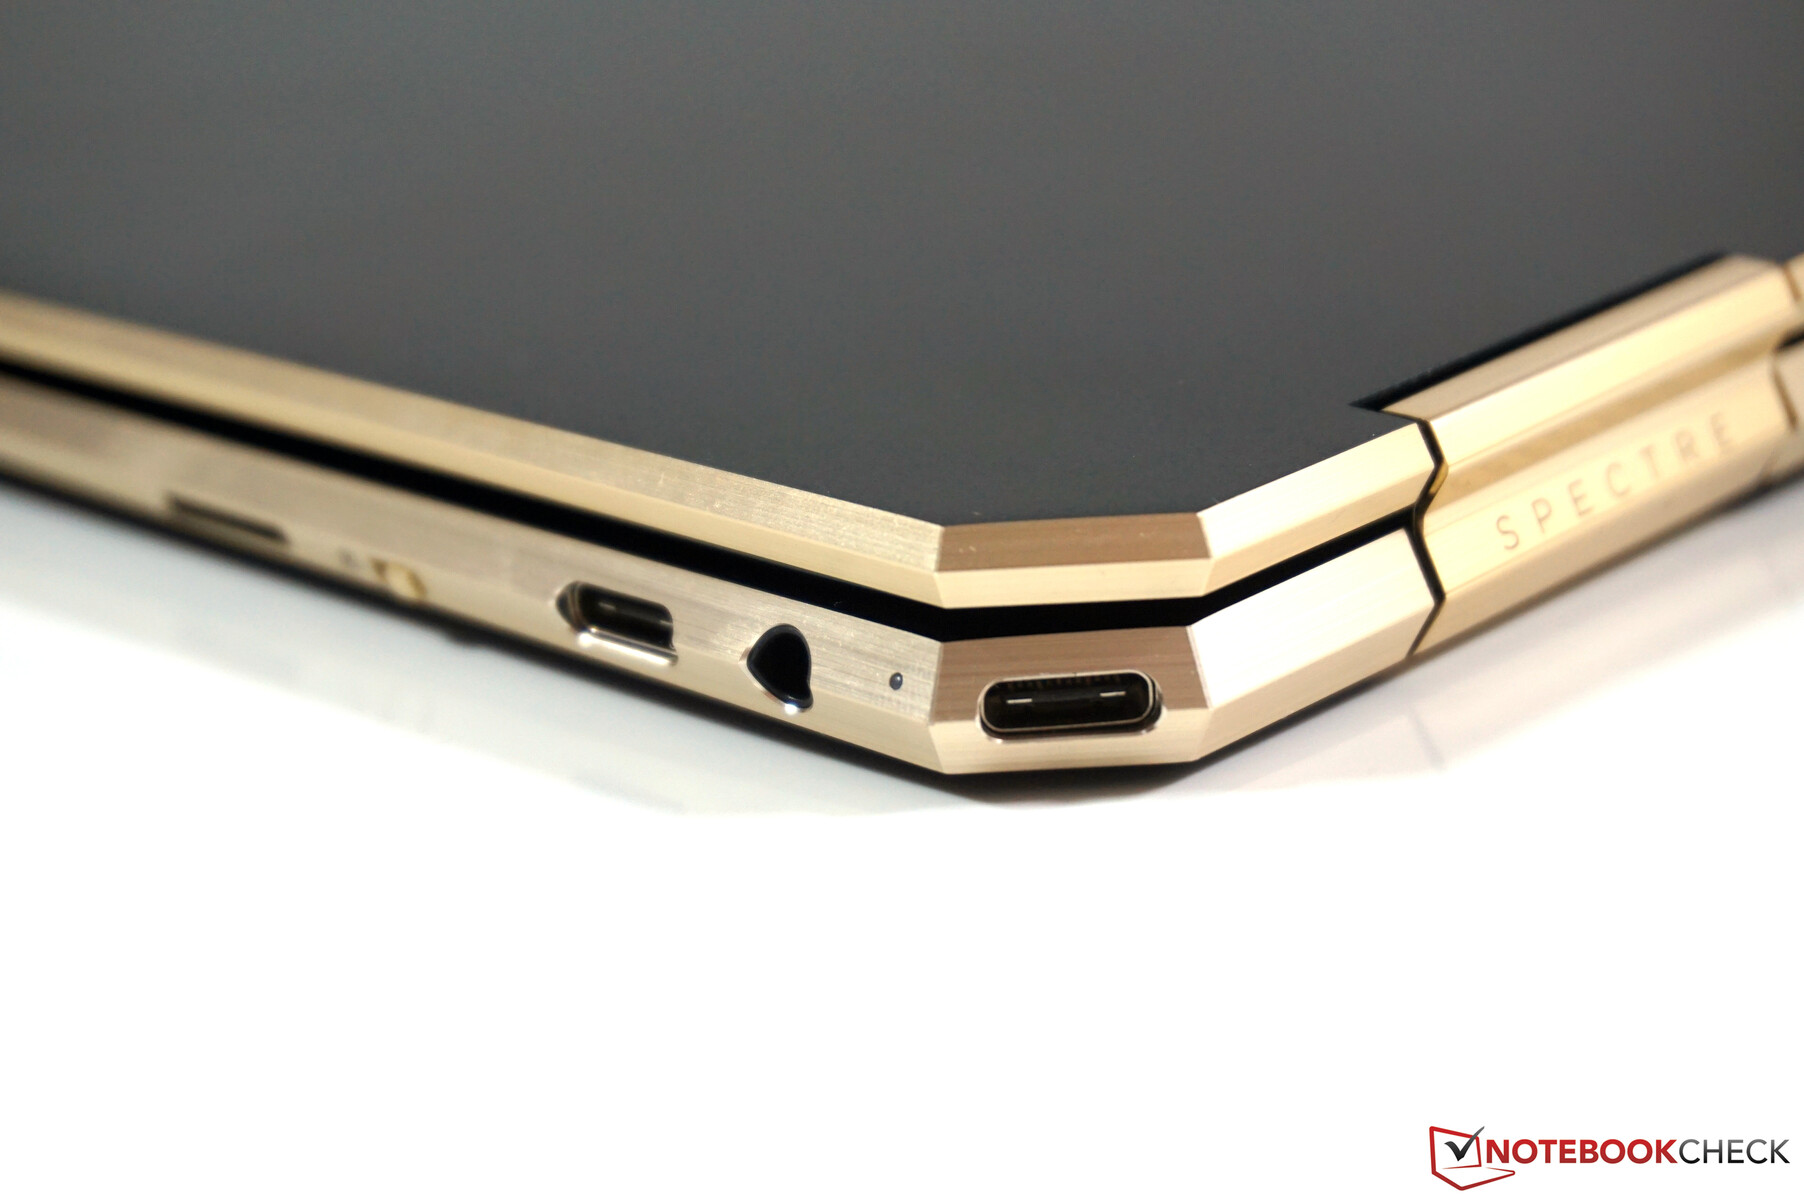
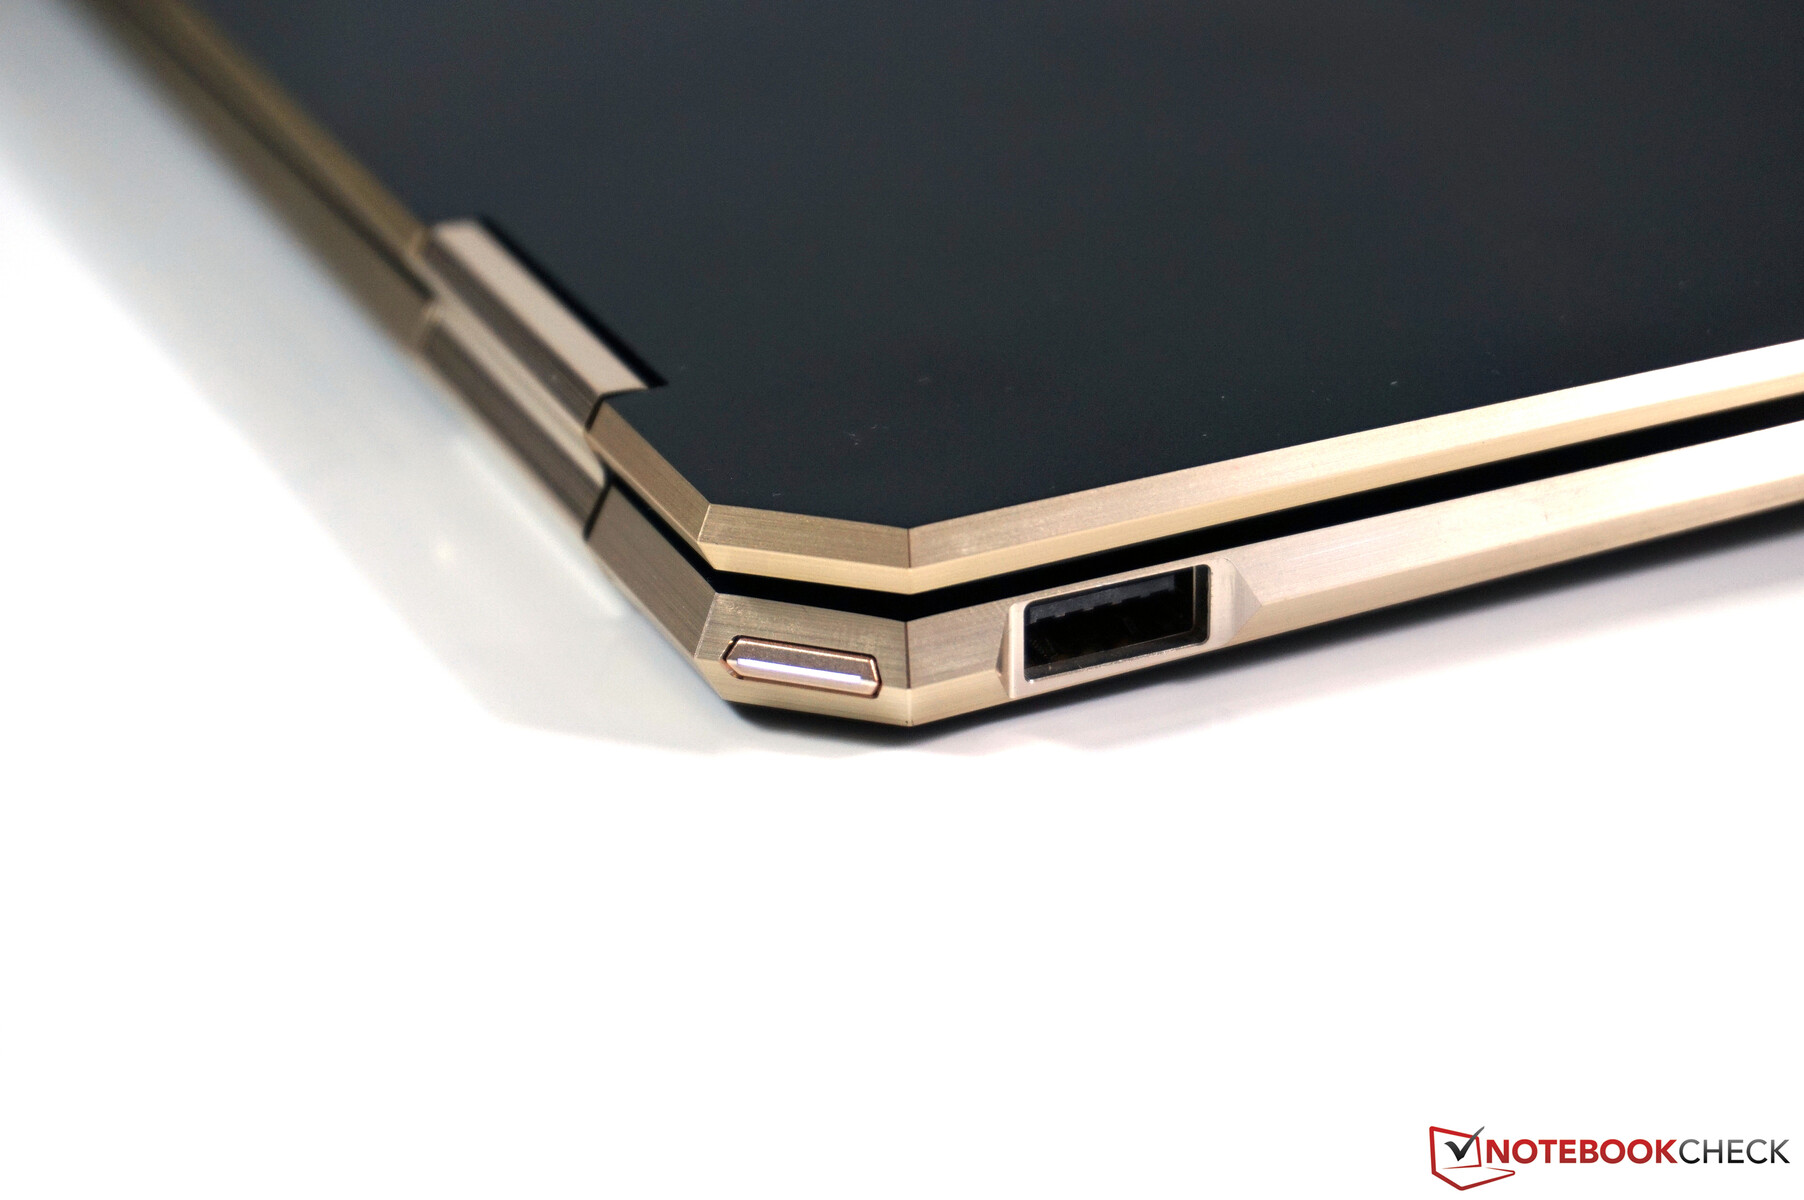
Test: HP Spectre x360 13 - Lyxig omvandlingsbar som kullkastas av sin skärm (Sammanfattning)

| SD Card Reader | |
| average JPG Copy Test (av. of 3 runs) | |
| Dell XPS 13 7390 2-in-1 Core i3 (Toshiba Exceria Pro M501 64 GB UHS-II) | |
| HP Spectre x360 13-ap0312ng (Toshiba Exceria Pro M501 64 GB UHS-II) | |
| HP Spectre x360 13-ae048ng (Toshiba Exceria Pro M501 microSDXC 64GB) | |
| Lenovo ThinkPad X390 Yoga-20NQS05R00 (Toshiba Exceria Pro M501) | |
| Genomsnitt av klass Convertible (29.4 - 186, n=21, senaste 2 åren) | |
| maximum AS SSD Seq Read Test (1GB) | |
| HP Spectre x360 13-ae048ng (Toshiba Exceria Pro M501 microSDXC 64GB) | |
| Dell XPS 13 7390 2-in-1 Core i3 (Toshiba Exceria Pro M501 64 GB UHS-II) | |
| HP Spectre x360 13-ap0312ng (Toshiba Exceria Pro M501 64 GB UHS-II) | |
| Genomsnitt av klass Convertible (67.5 - 254, n=20, senaste 2 åren) | |
| Lenovo ThinkPad X390 Yoga-20NQS05R00 (Toshiba Exceria Pro M501) | |
| |||||||||||||||||||||||||
Distribution av ljusstyrkan: 84 %
Mitt på batteriet: 271 cd/m²
Kontrast: 697:1 (Svärta: 0.39 cd/m²)
ΔE ColorChecker Calman: 4.3 | ∀{0.5-29.43 Ø4.71}
calibrated: 2.4
ΔE Greyscale Calman: 4.4 | ∀{0.09-98 Ø4.96}
89.8% sRGB (Argyll 1.6.3 3D)
58.9% AdobeRGB 1998 (Argyll 1.6.3 3D)
64.1% AdobeRGB 1998 (Argyll 3D)
89.8% sRGB (Argyll 3D)
63% Display P3 (Argyll 3D)
Gamma: 1.97
CCT: 5825 K
| HP Spectre x360 13-ap0312ng M133NVF3, , 1920x1080, 13.3" | Dell XPS 13 7390 2-in-1 Core i3 Sharp LQ134N1, , 1920x1200, 13.4" | Lenovo ThinkPad X390 Yoga-20NQS05R00 LP133WF7-SPA1, , 1920x1080, 13.3" | Lenovo Yoga C930-13IKB B139HAN03_0, , 1920x1080, 13.9" | HP Spectre x360 13-ae048ng Chi Mei (CMN1376), , 1920x1080, 13.3" | |
|---|---|---|---|---|---|
| Display | 9% | 5% | 3% | 10% | |
| Display P3 Coverage (%) | 63 | 68.6 9% | 65.2 3% | 64.3 2% | 68.1 8% |
| sRGB Coverage (%) | 89.8 | 98.2 9% | 97 8% | 94.6 5% | 99.5 11% |
| AdobeRGB 1998 Coverage (%) | 64.1 | 70.4 10% | 67.3 5% | 66.2 3% | 70.2 10% |
| Response Times | -63% | -79% | -39% | -29% | |
| Response Time Grey 50% / Grey 80% * (ms) | 29.2 ? | 46 ? -58% | 59.2 ? -103% | 40.8 ? -40% | 36 ? -23% |
| Response Time Black / White * (ms) | 20 ? | 33.6 ? -68% | 30.8 ? -54% | 27.6 ? -38% | 27 ? -35% |
| PWM Frequency (Hz) | 1000 ? | 2525 ? | 25000 ? | ||
| Screen | 53% | 20% | -7% | 18% | |
| Brightness middle (cd/m²) | 272 | 576.3 112% | 319 17% | 316 16% | 311 14% |
| Brightness (cd/m²) | 298 | 555 86% | 306 3% | 291 -2% | 278 -7% |
| Brightness Distribution (%) | 84 | 88 5% | 90 7% | 83 -1% | 82 -2% |
| Black Level * (cd/m²) | 0.39 | 0.33 15% | 0.15 62% | 0.36 8% | 0.2 49% |
| Contrast (:1) | 697 | 1746 151% | 2127 205% | 878 26% | 1555 123% |
| Colorchecker dE 2000 * | 4.3 | 1.45 66% | 6.1 -42% | 5.9 -37% | 3.98 7% |
| Colorchecker dE 2000 max. * | 9 | 4.12 54% | 9.7 -8% | 12.9 -43% | 8.48 6% |
| Colorchecker dE 2000 calibrated * | 2.4 | 1.19 50% | 1 58% | 1.3 46% | |
| Greyscale dE 2000 * | 4.4 | 3.1 30% | 8.6 -95% | 8.6 -95% | 5.57 -27% |
| Gamma | 1.97 112% | 2.27 97% | 2.62 84% | 2.1 105% | 2.51 88% |
| CCT | 5825 112% | 6931 94% | 6613 98% | 6854 95% | 7810 83% |
| Color Space (Percent of AdobeRGB 1998) (%) | 58.9 | 64.2 9% | 61.9 5% | 60.7 3% | 64 9% |
| Color Space (Percent of sRGB) (%) | 89.8 | 98.5 10% | 96.8 8% | 94.5 5% | 99 10% |
| Totalt genomsnitt (program/inställningar) | -0% /
31% | -18% /
5% | -14% /
-9% | -0% /
10% |
* ... mindre är bättre
Visa svarstider
| ↔ Svarstid svart till vitt | ||
|---|---|---|
| 20 ms ... stiga ↗ och falla ↘ kombinerat | ↗ 10.8 ms stiga | 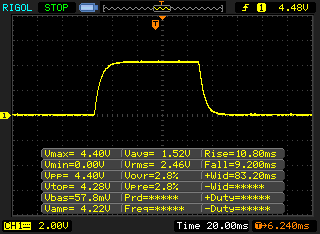 |
| ↘ 9.2 ms hösten | ||
| Skärmen visar bra svarsfrekvens i våra tester, men kan vara för långsam för konkurrenskraftiga spelare. I jämförelse sträcker sig alla testade enheter från 0.1 (minst) till 240 (maximalt) ms. » 44 % av alla enheter är bättre. Det betyder att den uppmätta svarstiden liknar genomsnittet av alla testade enheter (19.8 ms). | ||
| ↔ Svarstid 50 % grått till 80 % grått | ||
| 29.2 ms ... stiga ↗ och falla ↘ kombinerat | ↗ 14 ms stiga | 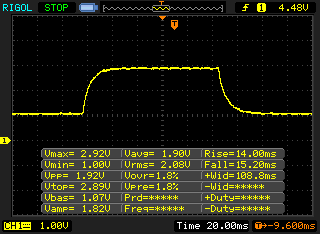 |
| ↘ 15.2 ms hösten | ||
| Skärmen visar relativt långsamma svarsfrekvenser i våra tester och kan vara för långsam för spelare. I jämförelse sträcker sig alla testade enheter från 0.165 (minst) till 636 (maximalt) ms. » 40 % av alla enheter är bättre. Det betyder att den uppmätta svarstiden liknar genomsnittet av alla testade enheter (31 ms). | ||
Skärmflimmer / PWM (Puls-Width Modulation)
| Skärmflimmer / PWM upptäckt | 1000 Hz | ≤ 99 % ljusstyrka inställning | 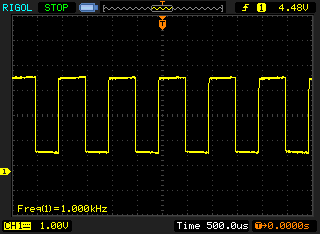 |
Displayens bakgrundsbelysning flimrar vid 1000 Hz (i värsta fall, t.ex. med PWM) Flimrande upptäckt vid en ljusstyrkeinställning på 99 % och lägre. Det ska inte finnas något flimmer eller PWM över denna ljusstyrkeinställning. Frekvensen för 1000 Hz är ganska hög, så de flesta användare som är känsliga för PWM bör inte märka något flimmer. Som jämförelse: 52 % av alla testade enheter använder inte PWM för att dämpa skärmen. Om PWM upptäcktes mättes ett medelvärde av 7751 (minst: 5 - maximum: 343500) Hz. | |||
| PCMark 8 Home Score Accelerated v2 | 4166 poäng | |
| PCMark 8 Creative Score Accelerated v2 | 5338 poäng | |
| PCMark 8 Work Score Accelerated v2 | 5189 poäng | |
| PCMark 10 Score | 4009 poäng | |
Hjälp | ||

| 3DMark 11 Performance | 2166 poäng | |
| 3DMark Cloud Gate Standard Score | 9758 poäng | |
| 3DMark Fire Strike Score | 1272 poäng | |
Hjälp | ||
| låg | med. | hög | ultra | |
|---|---|---|---|---|
| Tomb Raider (2013) | 98.9 | 46.1 | 30.7 | 14.4 |
| BioShock Infinite (2013) | 59.8 | 35.8 | 28.9 | 9.4 |
| The Witcher 3 (2015) | 11.8 | |||
| Dota 2 Reborn (2015) | 68 | 44.8 | 20.6 | 18.3 |
| X-Plane 11.11 (2018) | 25 | 15.8 | 14.6 |
Ljudnivå
| Låg belastning |
| 29.2 / 29.2 / 30.4 dB(A) |
| Hög belastning |
| 31 / 32.1 dB(A) |
 | ||
30 dB tyst 40 dB(A) hörbar 50 dB(A) högt ljud |
||
min: | ||
| HP Spectre x360 13-ap0312ng UHD Graphics 620, i7-8565U, Toshiba XG5 KXG50ZNV512G | Dell XPS 13 7390 2-in-1 Core i3 UHD Graphics G1 (Ice Lake 32 EU), i3-1005G1, Toshiba BG4 KBG40ZPZ256G | Lenovo ThinkPad X390 Yoga-20NQS05R00 UHD Graphics 620, i7-8565U, Intel SSD Pro 7600p SSDPEKKF512G8L | Lenovo Yoga C930-13IKB UHD Graphics 620, i5-8250U, SK hynix PC401 HFS256GD9TNG | HP Spectre x360 13-ae048ng UHD Graphics 620, i5-8550U, Toshiba NVMe THNSN51T02DUK | |
|---|---|---|---|---|---|
| Noise | -3% | -3% | -1% | -3% | |
| av / miljö * (dB) | 29.2 | 28 4% | 29.2 -0% | 29.3 -0% | 30.13 -3% |
| Idle Minimum * (dB) | 29.2 | 28 4% | 29.2 -0% | 29.3 -0% | 30.13 -3% |
| Idle Average * (dB) | 29.2 | 28 4% | 29.2 -0% | 29.3 -0% | 30 -3% |
| Idle Maximum * (dB) | 30.4 | 28 8% | 29.2 4% | 29.7 2% | 30.13 1% |
| Load Average * (dB) | 31 | 31.7 -2% | 35 -13% | 31.8 -3% | 33.4 -8% |
| Load Maximum * (dB) | 32.1 | 43.5 -36% | 35 -9% | 32.7 -2% | 33 -3% |
* ... mindre är bättre
(±) Den maximala temperaturen på ovansidan är 41.5 °C / 107 F, jämfört med genomsnittet av 35.4 °C / 96 F , allt från 19.6 till 60 °C för klassen Convertible.
(±) Botten värms upp till maximalt 43.6 °C / 110 F, jämfört med genomsnittet av 36.9 °C / 98 F
(+) Vid tomgångsbruk är medeltemperaturen för ovansidan 22.2 °C / 72 F, jämfört med enhetsgenomsnittet på 30.3 °C / ### class_avg_f### F.
(+) Handledsstöden och pekplattan är kallare än hudtemperaturen med maximalt 27.2 °C / 81 F och är därför svala att ta på.
(±) Medeltemperaturen för handledsstödsområdet på liknande enheter var 28 °C / 82.4 F (+0.8 °C / 1.4 F).
HP Spectre x360 13-ap0312ng ljudanalys
(±) | högtalarljudstyrkan är genomsnittlig men bra (79.8 dB)
Bas 100 - 315 Hz
(-) | nästan ingen bas - i genomsnitt 19.6% lägre än medianen
(±) | linjäriteten för basen är genomsnittlig (10.6% delta till föregående frekvens)
Mellan 400 - 2000 Hz
(+) | balanserad mellan - endast 3.6% från medianen
(+) | mids är linjära (6.7% delta till föregående frekvens)
Högsta 2 - 16 kHz
(+) | balanserade toppar - endast 3.6% från medianen
(+) | toppar är linjära (6.2% delta till föregående frekvens)
Totalt 100 - 16 000 Hz
(±) | linjäriteten för det totala ljudet är genomsnittlig (18% skillnad mot median)
Jämfört med samma klass
» 39% av alla testade enheter i den här klassen var bättre, 7% liknande, 54% sämre
» Den bästa hade ett delta på 6%, genomsnittet var 20%, sämst var 57%
Jämfört med alla testade enheter
» 38% av alla testade enheter var bättre, 8% liknande, 54% sämre
» Den bästa hade ett delta på 4%, genomsnittet var 23%, sämst var 134%
Lenovo ThinkPad X390 Yoga-20NQS05R00 ljudanalys
(±) | högtalarljudstyrkan är genomsnittlig men bra (74.1 dB)
Bas 100 - 315 Hz
(-) | nästan ingen bas - i genomsnitt 15.8% lägre än medianen
(±) | linjäriteten för basen är genomsnittlig (10.6% delta till föregående frekvens)
Mellan 400 - 2000 Hz
(±) | högre mellan - i genomsnitt 6.5% högre än median
(±) | linjäriteten för mids är genomsnittlig (10.3% delta till föregående frekvens)
Högsta 2 - 16 kHz
(+) | balanserade toppar - endast 2.8% från medianen
(±) | linjäriteten för toppar är genomsnittlig (11% delta till föregående frekvens)
Totalt 100 - 16 000 Hz
(±) | linjäriteten för det totala ljudet är genomsnittlig (24% skillnad mot median)
Jämfört med samma klass
» 73% av alla testade enheter i den här klassen var bättre, 5% liknande, 22% sämre
» Den bästa hade ett delta på 6%, genomsnittet var 20%, sämst var 57%
Jämfört med alla testade enheter
» 72% av alla testade enheter var bättre, 6% liknande, 22% sämre
» Den bästa hade ett delta på 4%, genomsnittet var 23%, sämst var 134%
| Av/Standby | |
| Låg belastning | |
| Hög belastning |
|
Förklaring:
min: | |
| HP Spectre x360 13-ap0312ng i7-8565U, UHD Graphics 620, Toshiba XG5 KXG50ZNV512G, IPS, 1920x1080, 13.3" | Dell XPS 13 7390 2-in-1 Core i3 i3-1005G1, UHD Graphics G1 (Ice Lake 32 EU), Toshiba BG4 KBG40ZPZ256G, IPS, 1920x1200, 13.4" | Lenovo ThinkPad X390 Yoga-20NQS05R00 i7-8565U, UHD Graphics 620, Intel SSD Pro 7600p SSDPEKKF512G8L, IPS LED, 1920x1080, 13.3" | Lenovo Yoga C930-13IKB i5-8250U, UHD Graphics 620, SK hynix PC401 HFS256GD9TNG, IPS, 1920x1080, 13.9" | HP Spectre x360 13-ae048ng i5-8550U, UHD Graphics 620, Toshiba NVMe THNSN51T02DUK, IPS, 1920x1080, 13.3" | Genomsnitt Intel UHD Graphics 620 | Genomsnitt av klass Convertible | |
|---|---|---|---|---|---|---|---|
| Power Consumption | 14% | -8% | -4% | 14% | 2% | -14% | |
| Idle Minimum * (Watt) | 4.32 | 3 31% | 3.46 20% | 3.3 24% | 3.2 26% | 3.81 ? 12% | 4.28 ? 1% |
| Idle Average * (Watt) | 6.84 | 5.4 21% | 5.88 14% | 6.8 1% | 6 12% | 6.94 ? -1% | 6.96 ? -2% |
| Idle Maximum * (Watt) | 8.64 | 7.3 16% | 9.12 -6% | 9.5 -10% | 9.2 -6% | 8.75 ? -1% | 8.67 ? -0% |
| Load Average * (Watt) | 31.8 | 33.4 -5% | 45.6 -43% | 40.8 -28% | 29.5 7% | 35 ? -10% | 45.1 ? -42% |
| Load Maximum * (Watt) | 53 | 48.3 9% | 65.9 -24% | 57 -8% | 35.6 33% | 47.5 ? 10% | 67.7 ? -28% |
* ... mindre är bättre
| HP Spectre x360 13-ap0312ng i7-8565U, UHD Graphics 620, 61 Wh, 1920x1080 | Dell XPS 13 7390 2-in-1 Core i3 i3-1005G1, UHD Graphics G1 (Ice Lake 32 EU), 51 Wh, 1920x1200 | Lenovo ThinkPad X390 Yoga-20NQS05R00 i7-8565U, UHD Graphics 620, 50 Wh, 1920x1080 | Lenovo Yoga C930-13IKB i5-8250U, UHD Graphics 620, 60 Wh, 1920x1080 | HP Spectre x360 13-ae048ng i5-8550U, UHD Graphics 620, 60 Wh, 1920x1080 | Genomsnitt av klass Convertible | |
|---|---|---|---|---|---|---|
| Batteridrifttid | -2% | -17% | -3% | 29% | 16% | |
| H.264 (h) | 10.7 | 10 -7% | 10.5 -2% | 17.8 66% | 15 ? 40% | |
| WiFi v1.3 (h) | 8.9 | 8.9 0% | 8.2 -8% | 9.2 3% | 8.8 -1% | 12 ? 35% |
| Load (h) | 2.3 | 2.2 -4% | 1.5 -35% | 2.1 -9% | 2.8 22% | 1.713 ? -26% |
För
Emot
Läs den fullständiga versionen av den här recensionen på engelska här.
Allt som allt är HP Spectre x360 13 en riktigt bra omvandlingsbar med mycket som talar för den. Den har ett välgjort och högkvalitativt hölje, ett bra tangentbord, skaplig systemprestanda och lång batteritid. Även om Spectre inte kan använda sin processors fulla potential resulterar de konservativa TDP-inställningarna i gengäld i låg temperatur och ljudnivå.
Högkvalitativt hölje, bra prestanda, lång batteritid och skapligt ljud: HP:s Spectre x360 13 bockar av alla punkter för en bra omvandlingsbar. Tyvärr förstör skärmen ett i övrigt gott intryck då vi hade förväntat oss mycket mer vid den här prisnivån. Dessutom försämrar den andra generationen av HP:s SureView-teknik avsevärt bildens kvalitet, vilket gör att enheten inte är lämplig att använda under längre perioder.
Den största bristen är onekligen skärmen. Den reflekterande tryckkänsliga skärmen borde haft mycket högre ljusstyrka. Den är så mörk och samtidigt så blank att det till och med är svårt att undvika reflektioner inomhus. Dessutom har den ett riktigt dåligt kontrastförhållande och kraftigt oprecisa färger. Det är ingen tvekan om att konkurrenterna är mycket bättre på det här området. SureView-tekniken gör precis vad den ska göra; men den försämrar bildkvaliteten ytterligare. Om du är intresserad av Spectre x360 13, se till att du skaffar en utan SureView.
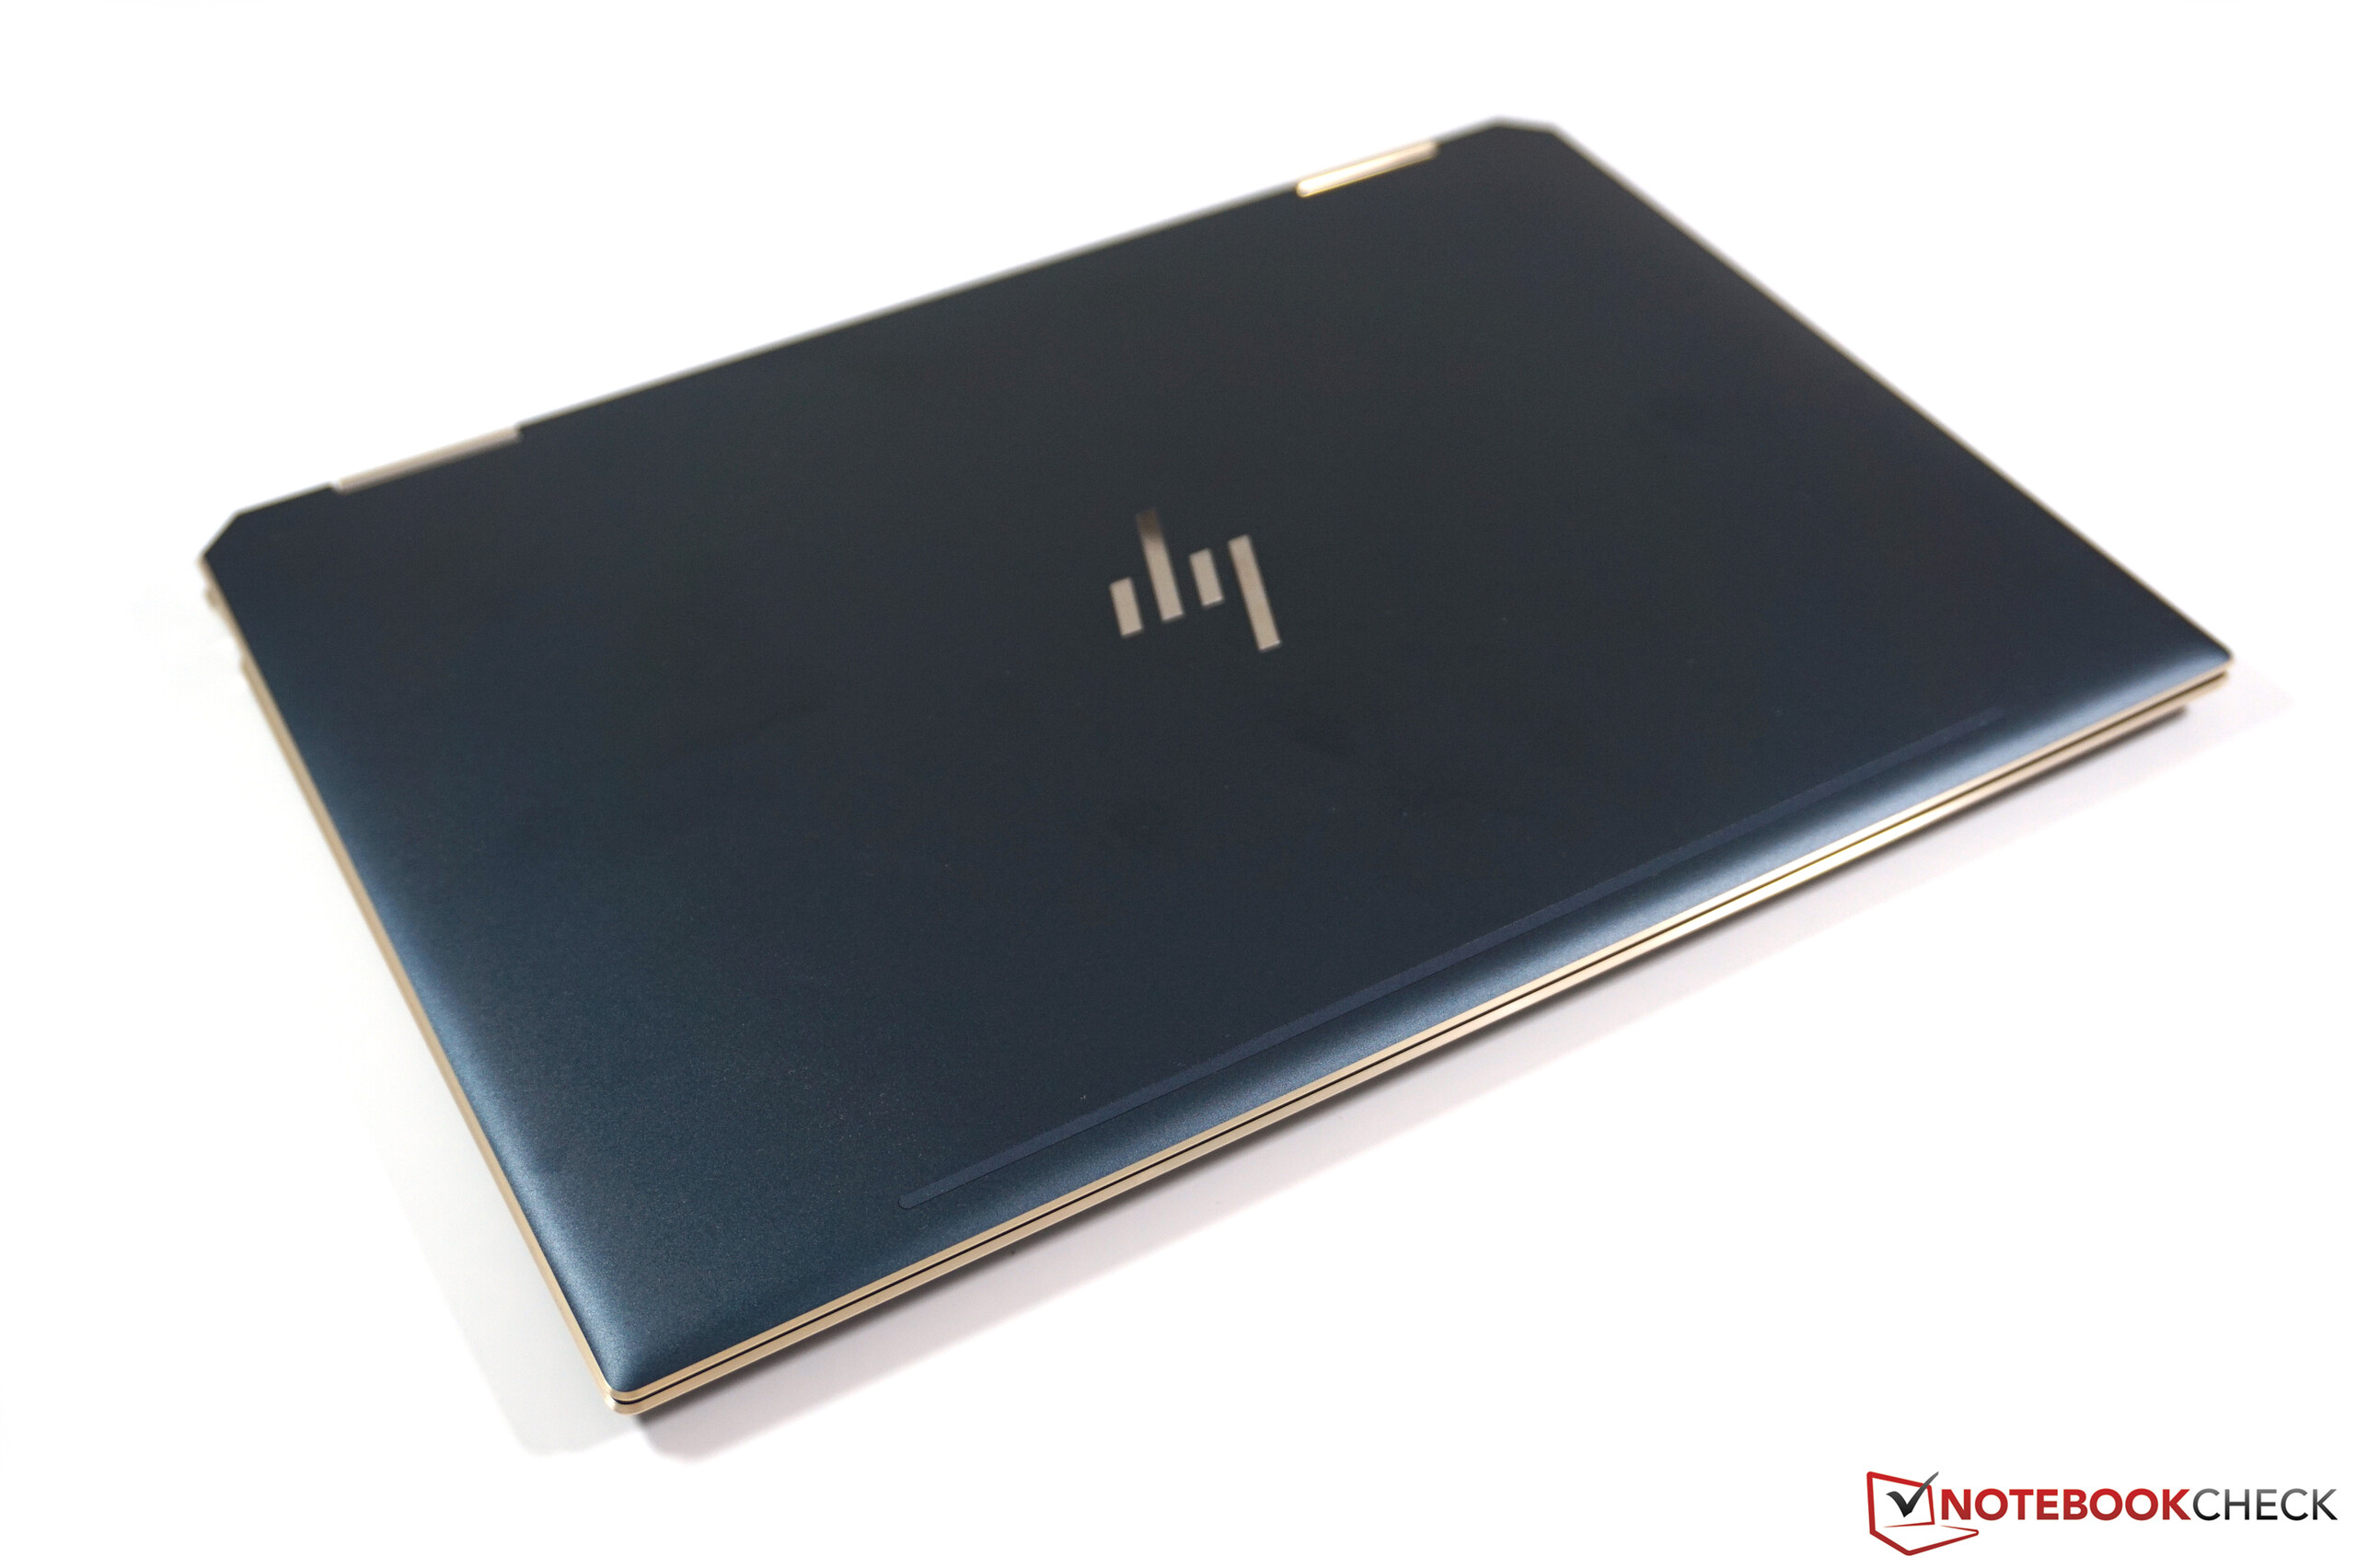
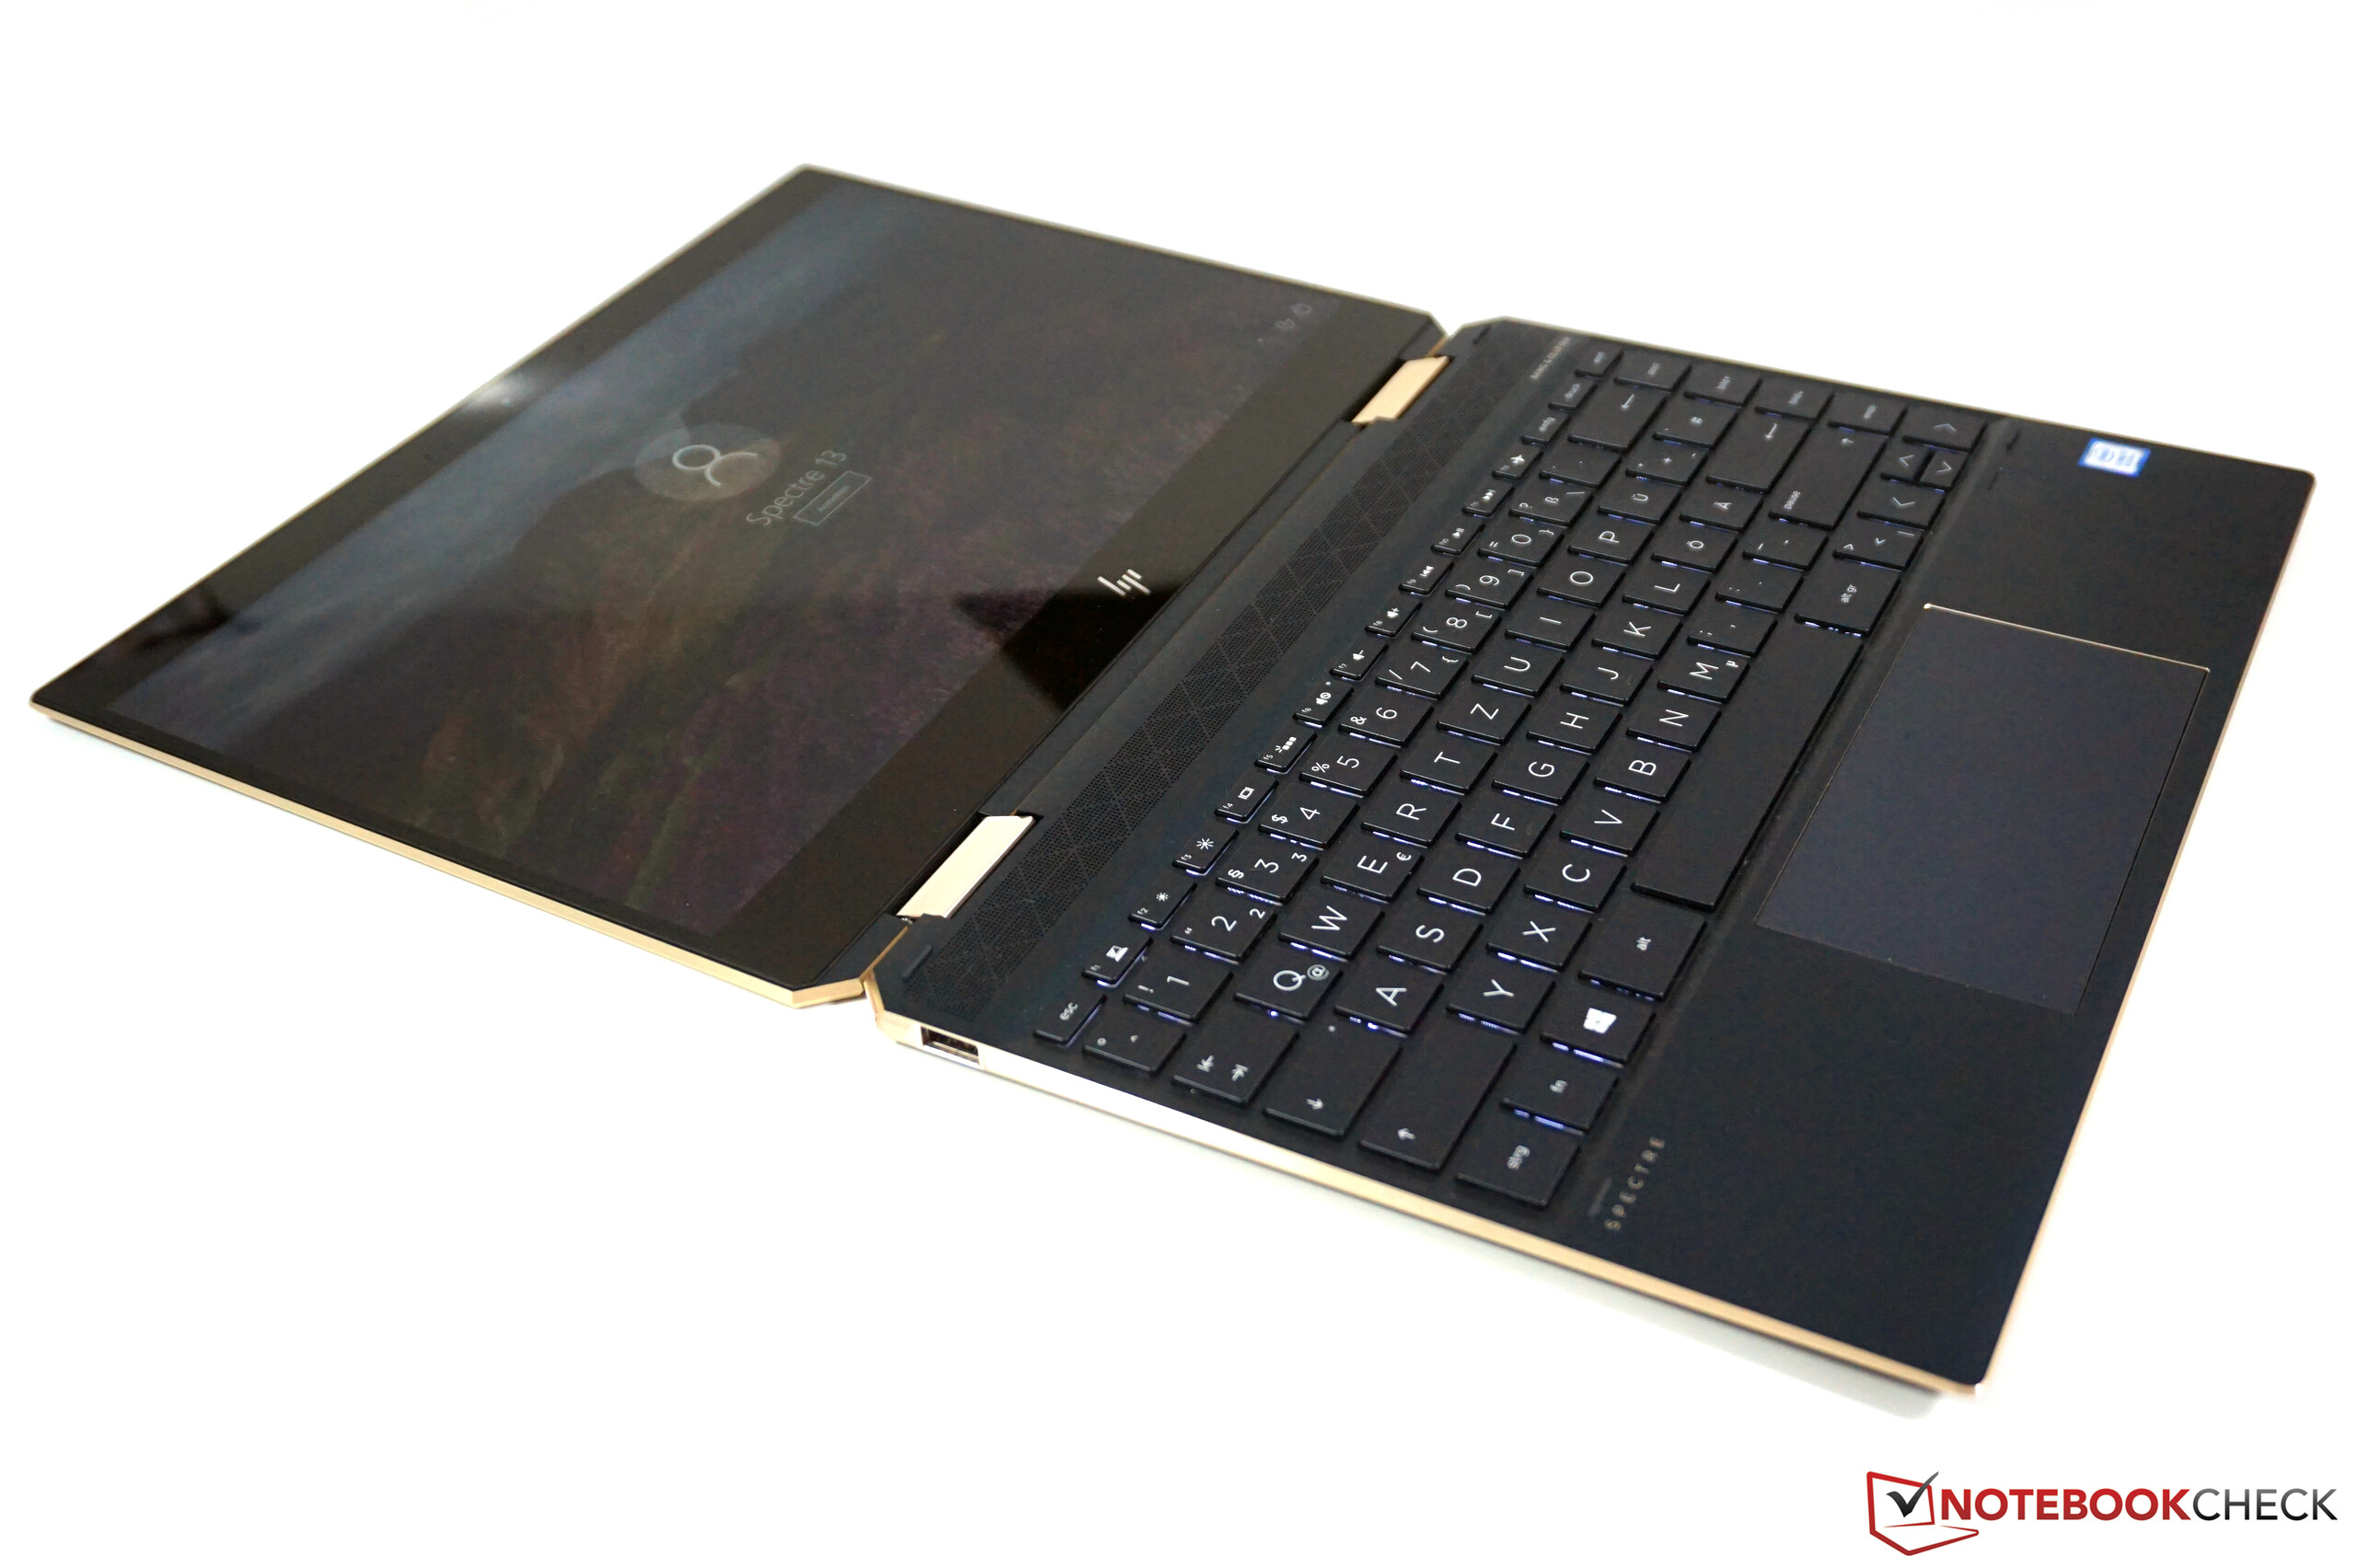
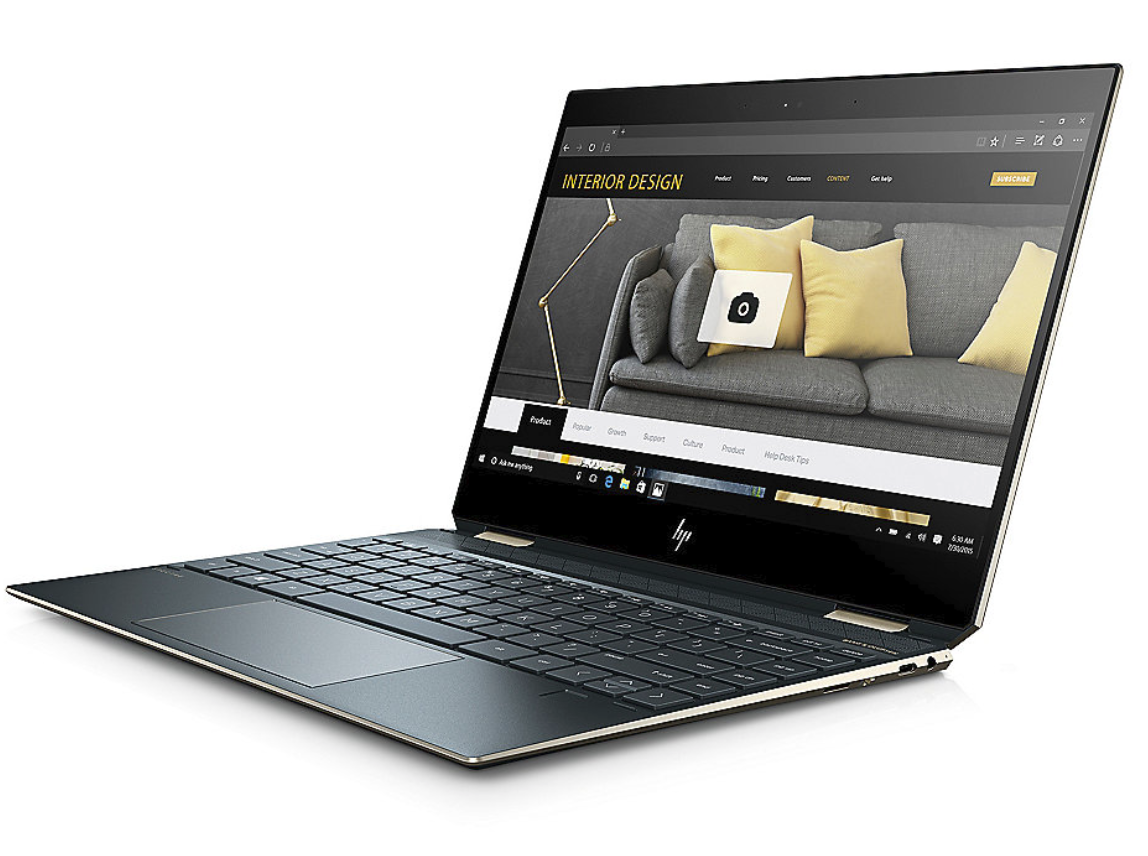
HP Spectre x360 13-ap0312ng
- 09/19/2019 v7 (old)
Andreas Osthoff
Price comparison
